the effect of ifrs on foreign direct investments: … effect of ifrs on foreign direct investments:...
TRANSCRIPT
The effect of IFRS on foreign direct investments: Evidence from
cross-border acquisitions
HENOCK LOUIS, Penn State University*
OKTAY URCAN, London Business School
Abstract
We examine the effect of IFRS on foreign direct investments (FDIs) by analyzing whether the
2005 mandatory adoption of IFRS leads to an increase in cross-border acquisitions in the
adopting countries. Our analysis has at least two very important distinctive features. First, it is
among the few, if not the first, to analyze the effects of IFRS on FDIs. Second, it uses the
exogeneity of a firm’s listing status to identify the effect of IFRS. It therefore relies on a much
stronger identification instrument than prior studies, which allows us to more reliably establish a
causal relation between IFRS and foreign investments. The overall evidence strongly suggests
that the adoption of IFRS led to a significant increase in FDIs, which is consistent with the
primary objective of IFRS. The increase in the flow of investments into the IFRS adopting
countries comes from both non-IFRS adopting countries and other IFRS adopting countries.
Consistent with the notion that the economic effects of IFRS are likely to depend on the strength
of the local institutions and regulatory implementation, the increase in foreign investment flow is
also limited to target countries where government ability to implement sound regulations is high.
JEL classification: F21, G34; M41
Keywords: IFRS; Foreign direct investments; M&A; Cross-border acquisitions
*Email address: [email protected]
1
The effect of IFRS on foreign direct investments: Evidence from
cross-border acquisitions
Abstract
We examine the effect of IFRS on foreign direct investments (FDIs) by analyzing whether the
2005 mandatory adoption of IFRS leads to an increase in cross-border acquisitions in the
adopting countries. Our analysis has at least two very important distinctive features. First, it is
among the few, if not the first, to analyze the effects of IFRS on FDIs. Second, it uses the
exogeneity of a firm’s listing status to identify the effect of IFRS. It therefore relies on a much
stronger identification instrument than prior studies, which allows us to more reliably establish a
causal relation between IFRS and foreign investments. The overall evidence strongly suggests
that the adoption of IFRS led to a significant increase in FDIs, which is consistent with the
primary objective of IFRS. The increase in the flow of investments into the IFRS adopting
countries comes from both non-IFRS adopting countries and other IFRS adopting countries.
Consistent with the notion that the economic effects of IFRS are likely to depend on the strength
of the local institutions and regulatory implementation, the increase in foreign investment flow is
also limited to target countries where government ability to implement sound regulations is high.

2
1. Introduction
Adoption of the International Financial Reporting Standards (IFRS) became compulsory
for listed companies in the European Union (EU) and in several other countries on January 1,
2005. The main purpose of IFRS is to improve the comparability and the overall quality of
financial statements, with the ultimate objective of increasing cross-border transactions (EC
Regulation No. 1606/2002).1 The notion that IFRS would increase cross-border investments is
supported by professionals (Morgan Stanley 1998; KPMG 2007) as well as academics
(Bradshaw, Bushee, and Miller 2004; Covrig et al. 2007; DeFond et al. 2011). DeFond et al.
(2011), in particular, find that the adoption of IFRS is associated with greater investments by
foreign mutual funds. IFRS is also found to be associated with increases in foreign institutional
investments (Florou and Pope 2012; Yu 2009) as well as foreign individual investments
(Bruggemann et al. 2009). However, Beneish et al. (2012) concludes that “the increase in foreign
equity investment around IFRS adoption documented in prior work is not robust to alternative
deflators or to the exclusion of the U.S. as an investor.” One shortcoming of Beneish et al.
(2012) is that it relies on few macroeconomic data points, which restrains the ability to conduct
cross-sectional analyses and identification tests.
In this study, we examine the effect of IFRS adoption on foreign direct investments
(FDI).2 Our study is motivated by several factors. First, while prior studies have examined
changes in foreign investments around the IFRS adoption, it is generally difficult to identify the
1European Commissioner McCreevy (2005) argues, for instance, that IFRS “should lead to more efficient capital
2According to the Organisation for Economic Cooperation and Development (OECD) (2008), FDI “is a category of
cross-border investment made by a resident in one economy (the direct investor) with the objective of establishing a
lasting interest in an enterprise (the direct investment enterprise) that is resident in an economy other than that of the
direct investor. The motivation of the direct investor is a strategic long-term relationship with the direct investment
enterprise to ensure a significant degree of influence by the direct investor in the management of the direct
investment enterprise.” (p. 17).

3
causes of the potential changes. The difficulty arises from the various confounding events that
took place at the beginning of the century and the lack of natural experimental settings.
Second, Beneish et al. (2012) suggest that the effect of IFRS on stock investments by
foreigners is ambiguous. Their conclusion that the increase in foreign equity investments around
the IFRS adoption is not robust to the exclusion of the U.S. as an investor casts doubt on DeFond
et al.’s (2011) inference that the IFRS adoption led to an increase on foreign mutual fund
investments because of improved comparability. While some studies suggest that IFRS is of high
quality and reduces earnings management (Leuz et al. 2003; Bartov et al. 2005; Barth,
Landsman, and Lang 2008; Armstrong et al. 2010), more recent studies suggest that it does not
necessarily lead to higher quality accounting (Christensen et al. 2012) and that, because it is
principle-based, it could actually provide more opportunities for misreporting (Ahmed et al.
2012; Capkun et al. 2012). Consistent with this view, Robert H. Herz, then chairman of the
Financial Accounting Standards Board, opines that, under IFRS, “you can do almost anything
you want” (Henry 2008). Therefore, it is not implausible that IFRS could erode the credibility of
the financial statements and impede cross-border investments.
Third, as DeFond et al. (2011, p. 241) note, research on the effect of IFRS on foreign
investments “is particularly important because it investigates a potential ‘real effect’ of
accounting, which is somewhat rare in the literature.” However, thus far, the literature has
focused primarily on the effects of IFRS on passive foreign portfolio investments (FPIs) by
institutional and individual investors. There is little research on the effects IFRS on FDIs and
managerial investment decisions. While FPIs are made by securities traders and can be reversed
with relative ease, FDIs involve long-term operating investments by managers that are much
more difficult to reverse, more vulnerable to political risk, and more likely to contribute to long-
term economic growth. As the Organization for Economic Cooperation and Development
4
(OECD) (2008) argues, “FDI provides a means for creating direct, stable and long-lasting links
between economies” (p. 14). Borensztein, De Gregorio, and Lee (1998) also find that FDI is an
important vehicle for technology transfer and contributes more to economic growth than
domestic investments. Moreover, as Goldstein and Razin (2006) argue, FDI is generally more
information intensive than FPI; and, therefore, if the adoption of IFRS is the driver of the
increase in investment flow into the IFRS adopting countries after 2005, the effect should also be
evident in the FDI flow. Hence, although the literature on the effects of IFRS on investments by
institutions and individuals has made significant contributions to our understanding of the
economic impacts of IFRS, it remains important to determine the extent to which IFRS also
affects direct investments by managers.
To determine the effect of IFRS adoption on FDIs, we analyze whether the adoption of
IFRS leads to an increase in cross-border acquisitions of listed companies. FDIs include
primarily mergers and acquisitions (M&As) and greenfield investments. We focus on M&As
because they involve the valuations of existing reporting entities and are therefore the type of
FDIs that are most likely to be affected by reporting standards. We structure our tests to capture
the incremental FDIs that firms listed in the IFRS countries have attracted after the IFRS
adoption. We proxy for FDIs by the number of cross-border acquisitions scaled by the number of
domestic acquisitions of listed firms (i.e., the proportion of cross-border acquisitions),
conditional on the values of the transactions. By using the proportion of cross-border
acquisitions, we control for potential endogenous and unobserved factors that could induce
changes in the overall number of acquisitions.
The use of the proportion of cross-border acquisitions offers at least two other major
advantages over extant alternative procedures. First, it allows us to avoid the scaling issue raised
by Beneish et al. (2012). Second, and more importantly, as mentioned earlier, it is generally

5
difficult to identify the cause of the changes in foreign investments around the IFRS adoption.
However, IFRS is mandatory for listed and not for unlisted firms. There are also very few
unlisted firms that voluntarily adopt IFRS. André, Walton, and Yang (2012) report that only 287
out of 8,417 large and medium-sized UK unlisted firms adopted IFRS by the end of 2009, which
is for all practical purposes a negligible number. The proportion is likely much lower for the
smaller firms, for the smaller adopting countries, and for the earliest years after the adoption
given that unlisted UK firms that voluntarily adopt IFRS cannot go back to UK GAAP.
Therefore, a firm’s listing status can serve as a simple but powerful instrument to determine
whether IFRS leads to an increase in FDIs. Observing an increase in cross-border acquisitions of
listed firms, but not in cross-border acquisitions of unlisted firms, would be strong evidence that
the increase is due to IFRS. If IFRS leads to more FDIs, all else equal, we should at least observe
a stronger increase in cross-border acquisitions of listed firms than in cross-border acquisitions
of unlisted firms after 2005. Comparing cross-border acquisitions of listed and unlisted firms
from the IFRS adopting countries enables us to conduct our analysis within the set of adopting
countries, avoiding thereby the inherent endogeneity problems associated with comparing
investments in adopting countries with investments in non-adopting countries. Our identification
test was not applicable in prior studies because they focus on FPIs, which are limited to trading
activities in listed firms. Therefore, these studies could not use unlisted firms as controls.
Consistent with the notion that IFRS induces more cross-border equity investments, we
find a significant increase in the proportion of cross-border acquisitions of listed firms from the
adopting countries following the IFRS adoption. In contrast, we find no evidence of an increase
in the proportion of cross-border acquisitions of unlisted firms from the adopting countries. More
generally, we find no evidence of an increase in the proportion of cross-border acquisitions not
involving listed targets from the adopting countries. Therefore, there is no evidence that the

6
increase in cross-border acquisitions of firms listed in the IFRS adopting countries is due to some
general trend in cross-border acquisitions. The evidence instead suggests that the increase is due
to IFRS per se.
The EU experienced a large expansion between 2004 and 2009, with 12 countries joining
the union during this period. Since IFRS is adopted across the EU, it is plausible that the increase
in cross-border investments in the IFRS adopting countries could be the result of the EU
expansion as opposed to the adoption of IFRS. However, we find no evidence that the increase in
cross-border investments is due to transactions between the EU countries.
DeFond et al. (2011) explains the impact of IFRS adoption on foreign mutual fund
investments by its effect on reporting comparability. However, Beneish et al. (2012) find no
evidence that the increase in the flow of FPIs comes from IFRS adopting countries. They
actually suggest that the increase in FPIs around the IFRS adoption documented in prior work is
not robust to the exclusion of the U.S. as an investor, which they argue is inconsistent with the
improved comparability explanation. However, we still find a strong increase in cross-border
acquisitions even after removing acquisitions by U.S. firms. More specifically, we find that the
increase in investment flow into the adopting countries comes from both adopting and non-
adopting countries. The incremental investment flow from the non-adopting countries to the
adopting countries actually tends to be larger than the incremental flow from the adopting
countries; however, the difference is also observed for the unlisted targets and therefore does not
seem to be related to IFRS per se.
Beneish et al. (2012) argues that, if improved comparability is the driver of the IFRS
effect, one should observe more investment flow into the IFRS adopting countries from other
IFRS adopting countries than from the non-IFRS adopting countries. However, this conjecture

7
may not account for the relative disadvantage of acquirers from the non-adopting countries prior
to the IFRS adoption. Comparability can have at least two dimensions: (1) comparability
between the acquirers’ own financial reporting systems and the potential targets’ reporting
systems; and (2) comparability within the potential targets’ reporting systems. The first
dimension is likely to favor acquirers (and investors) from the adopting countries more.
However, the second dimension could favor acquirers from the non-adopting countries more.
The adopting countries generally have strong commercial, educational, cultural, social, and labor
ties, as evidenced by the high level of cross-border activities within Europe even before the IFRS
adoption. It is thus plausible that the average manager from the adopting countries generally has
a better understanding of financial reports, and better ability to screen potential targets, from
other adopting countries than managers from the non-adopting countries. By standardizing the
reporting process and, hence, allowing everyone to use only one set of rules to screen potential
targets instead of multiple sets of country-specific rules, IFRS could benefit the managers from
the non-adopting countries more than the managers from the adopting countries.
Finally, extant studies suggest that IFRS is of very high quality (Leuz et al. 2003; Bartov,
et al. 2005; Armstrong, et al. 2010). However, countries that have weak institutions can misapply
otherwise high-quality accounting standards (e.g., Ball et al. 2000, 2003; Hung 2001; Hung and
Subramanyam 2007; Daske et al. 2008; Holthausen 2009). Because IFRS is principle-based, it
could arguably provide more opportunities for misreporting (Henry 2008; Ahmed et al. 2012;
and Capkun et al. 2012). Therefore, the potential benefit of the IFRS adoption could be limited.
Accordingly, using the World Bank’s Worldwide Governance Indicators, we find that the
increase in foreign investments after the adoption of IFRS is limited to those countries that have
strong ability to implement sound regulations. This result is consistent with DeFond et al.’s
8
(2011) finding that the increase in foreign mutual fund investments after the IFRS adoption is
driven by countries with strong implementation credibility.
The remainder of this paper is organized as follows. The next section explains our
research design. Section 3 describes the sample selection process and provides descriptive
statistics. The results are reported in Section 4. Section 5 concludes.
2. Research design
We use the mandatory change in financial reporting in the EU and several other countries
around 2005 to test the effect of IFRS on FDIs. Our objective is to compare the amount of
investments that firms listed in the IFRS countries attract from overseas after the IFRS adoption
to the amount that they attract before the adoption. To ensure that we do not simply capture an
overall trend in acquisition activities, we standardize the number of acquisitions from overseas
by the number of local acquisitions to obtain a measure of the probability of a cross-border
acquisition. Because all acquisitions are not of equal size, for the differential probability of a
cross-border acquisition to capture the effect of IFRS on cross-border acquisitions, we need to
control for the values of the acquisitions. We therefore compare the probability that a listed
target from an IFRS country is acquired by a foreign firm before and after the IFRS adoption,
conditional on the values of the transactions. A higher average probability after the IFRS
adoption would mean that, holding the values of the transactions constant, the IFRS adopting
countries attract relatively more investments from overseas after the IFRS adoption than before
the adoption.
Because we standardize the amount of acquisitions from overseas by the amount of local
acquisitions, our design controls for the effects of forces that could cause the overall acquisition

9
level in a given country to increase. To further ensure that our results are not due to omitted
correlated economic factors, we control for the relative size of the local economy, the growth in
the gross domestic products (GDP), the population growth, the currency exchange rate
fluctuations, the inflation rates, the interest rates, and the corporate tax rates of the targets’
countries. We also control for the method of payment, the industry relatedness of the merging
partners, acquisitions of regulated companies, and acquisitions of high-technology firms. More
specifically, we use the following logistic regression model:
CROSS_BORDERi = 0 + 1POST_ADOPTIONi + 2LTVALUEi + 3STOCKi
+ 4SAME_INDi + 5REGULATEDi + 6HIGH_TECHi + 7ECON_SIZEi
+ 8GDP_GROWTHi + 9POP_GROWTHi + 10FX_FLUXi
+ 11INFLATIONi + 12INTERESTi + 13TAXi + Country fixed effects + i, (1)
where
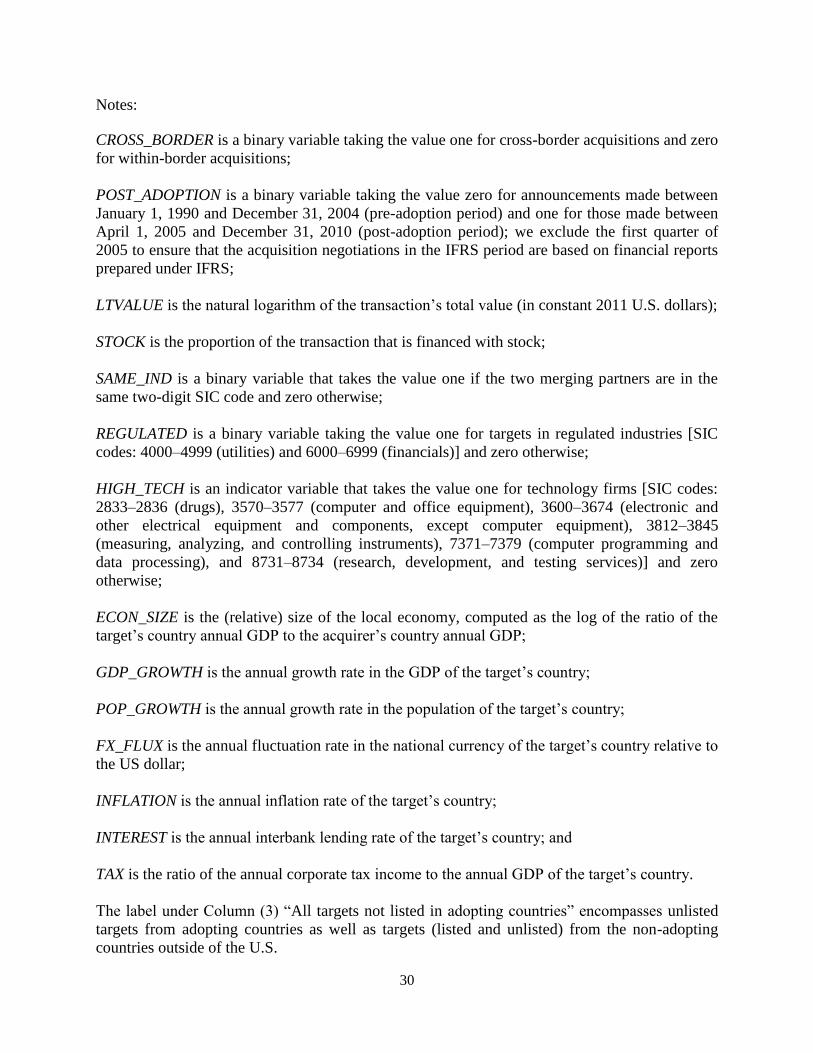
CROSS_BORDER is a binary variable taking the value one for cross-border acquisitions and zero
for within-border acquisitions;
POST_ADOPTION is an indicator variable taking the value zero for announcements made
between January 1, 1990 and December 31, 2004 (pre-adoption period) and one for those made
between April 1, 2005 and December 31, 2010 (post-adoption period); we exclude the first
quarter of 2005 to ensure that the acquisition negotiations in the IFRS period are based on
financial reports prepared under IFRS;
LTVALUE is the natural logarithm of the transaction’s total value;
STOCK is the proportion of the transaction that is financed with stock;
SAME_IND is a binary variable that takes the value one if the two merging partners are in the
same two-digit SIC code and zero otherwise;
REGULATED is a binary variable taking the value one for targets in regulated industries [SIC
codes: 4000–4999 (utilities) and 6000–6999 (financials)] and zero otherwise;
HIGH_TECH is an indicator variable that takes the value one for technology firms [SIC codes:
2833–2836 (drugs), 3570–3577 (computer and office equipment), 3600–3674 (electronic and
other electrical equipment and components, except computer equipment), 3812–3845
(measuring, analyzing, and controlling instruments), 7371–7379 (computer programming and
10
data processing), and 8731–8734 (research, development, and testing services)] and zero
otherwise;
ECON_SIZE is the (relative) size of the local economy, computed as the log of the ratio of the
target’s country annual GDP to the acquirer’s country annual GDP;
GDP_GROWTH is the annual growth rate in the GDP of the target’s country;
POP_GROWTH is the annual growth rate in the population of the target’s country;
FX_FLUX is the annual fluctuation rate in the national currency of the target’s country relative to
the US dollar;
INFLATION is the annual inflation rate of the target’s country;
INTEREST is the annual interbank lending rate of the target’s country; and
TAX is the ratio of the annual corporate tax income to the annual GDP of the target’s country.
We obtain information on GDP, population, and currency exchange rates from Penn
World Tables from the Center for International Comparisons of Production, Income and Prices
at the University of Pennsylvania; information on inflation and interbank interest rates from
World Bank publications; and information on corporate tax income as a percentage of GDP from
the OECD online statistics. We fill missing information from these specific sources with data
from a variety of online sources from the World Bank, the International Monetary Fund (IMF),
Datastream, CIA World Factbooks, and various governments’ statistics bureaus and departments.
3. Sample selection and description
The study covers acquisition announcements made between January 1990 and December
2010. The primary sample includes listed targets from countries that mandated IFRS as of
January 1, 2005. The sample is obtained from the Security Data Company (SDC)’s database of
mergers and acquisitions. An announcement is included in the sample if SDC codes it as either
11
completed or pending and the value of the transaction is available on SDC. We delete four listed
targets from the adopting countries because they are cross-listed. The main sample includes
2,044 acquisitions of listed companies from the adopting countries. We benchmark these
transactions against 5,007 acquisitions of unlisted companies from the adopting countries. We
also use a broader benchmark of 10,165 acquisitions of non-U.S. firms that are not listed in the
adopting countries. Prior studies suggest that, because of the size of the U.S. market and other
structural factors, the U.S. tends to have a disproportionate effect on the results of IFRS studies
(Capkun et al. 2012). Limiting the comparison to investments in non-U.S. countries addresses
this issue.
Early adoption of IFRS provides no comparability benefits. The potential benefit of
comparability does not arise from changes from one set of rules to another set of rules, but from
the fact that every firm in the adopting countries uses one common set of rules. Therefore, the
driving force in our study is the fact that all the potential listed targets in the adopting countries
use one set of rules as opposed to the fact that individual firms switched to IFRS. However, as a
precautionary step, we conduct a robustness analysis that excludes cases of early adoption. Firms
with “DI” for data item “acctstd” in Compustat Global prior to 2005 are considered early
adopters. We obtain qualitatively similar results after we delete these observations.
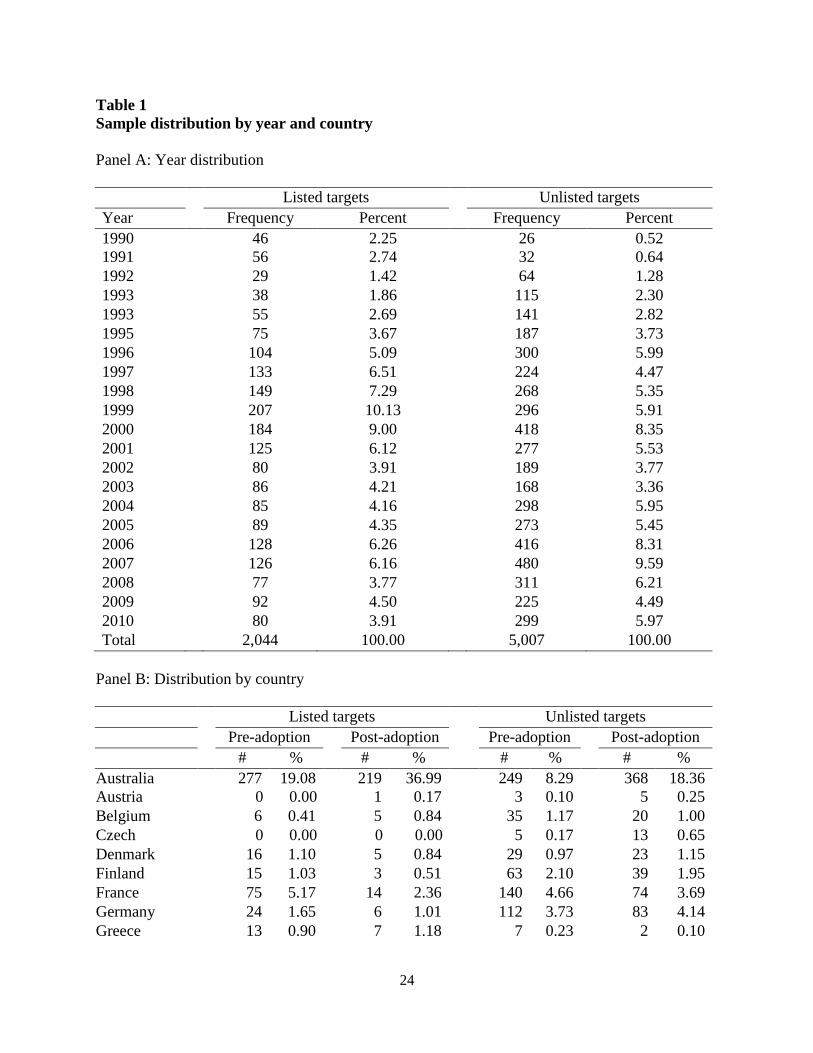
Panel A of Table 1 presents the time-series distribution of the sample. We are particularly
interested in acquisitions of listed firms from the adopting countries because IFRS is mandated
only for listed firms and there are very few unlisted firms that voluntarily adopt IFRS (André,
Walton, and Yang 2012). Not surprisingly, the strongest concentration of observations is during
the merger wave of 1997-2001. There has also been a resurgence of M&A activities in the IFRS
adopting countries in 2006 and 2007. However, there is no evidence of any strong time

12
clustering in the data. Panel B of Table 1 presents the sample distribution by country. There is a
strong concentration of targets from the UK and Australia. We control for country-specific
effects by including country-fixed effects in our model.
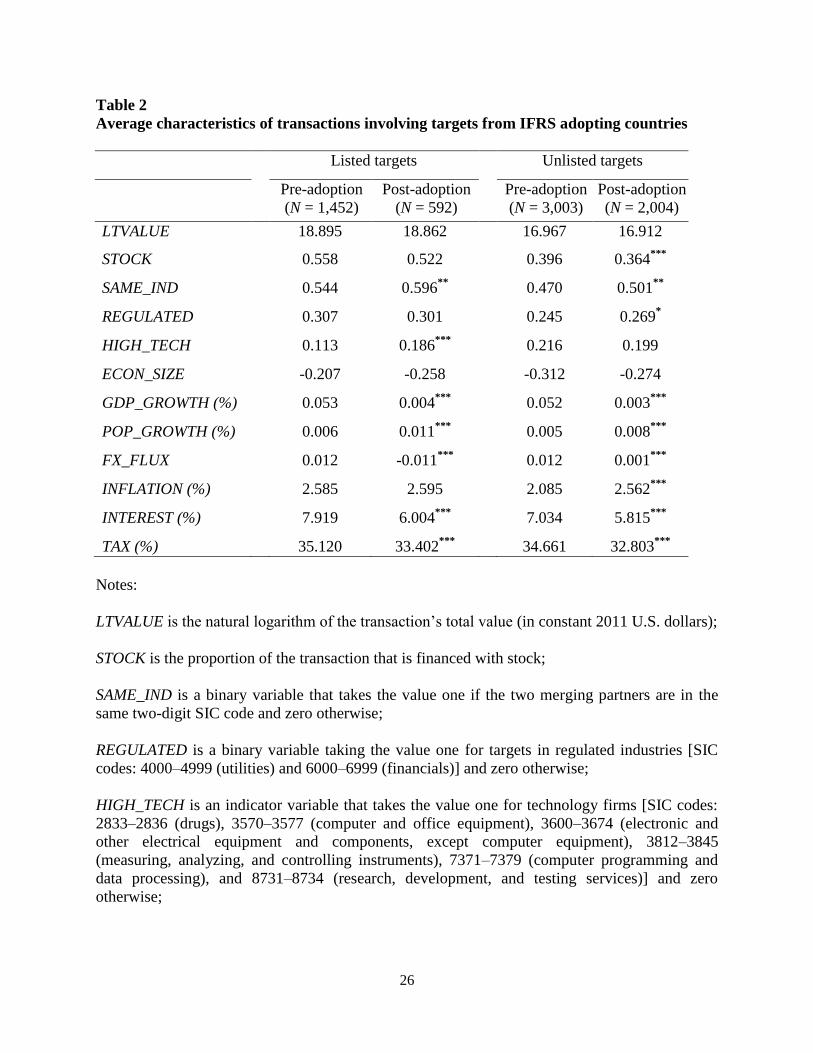
We report the characteristics of the transactions in Table 2. Not surprisingly, transactions
involving listed targets are generally larger and more likely to be financed with stock than
transactions involving unlisted targets. The merging partners are more likely to be from the same
industry; GDP growth, interest rates, corporate tax rates, local currency values are generally
lower; and population growth is generally higher in the adopting countries in the post-adoption
period than in the pre-adoption period. The listed targets are also more likely to be from high-
technology industries in the post-adoption period than in the pre-adoption period. The proportion
of the acquisition of the average unlisted target that is financed with stock is generally lower and
the proportion of regulated unlisted targets and inflation rates in the unlisted targets’ countries
are also generally higher in the post-adoption period. We control for these factors in our
regression analysis.
4. Results
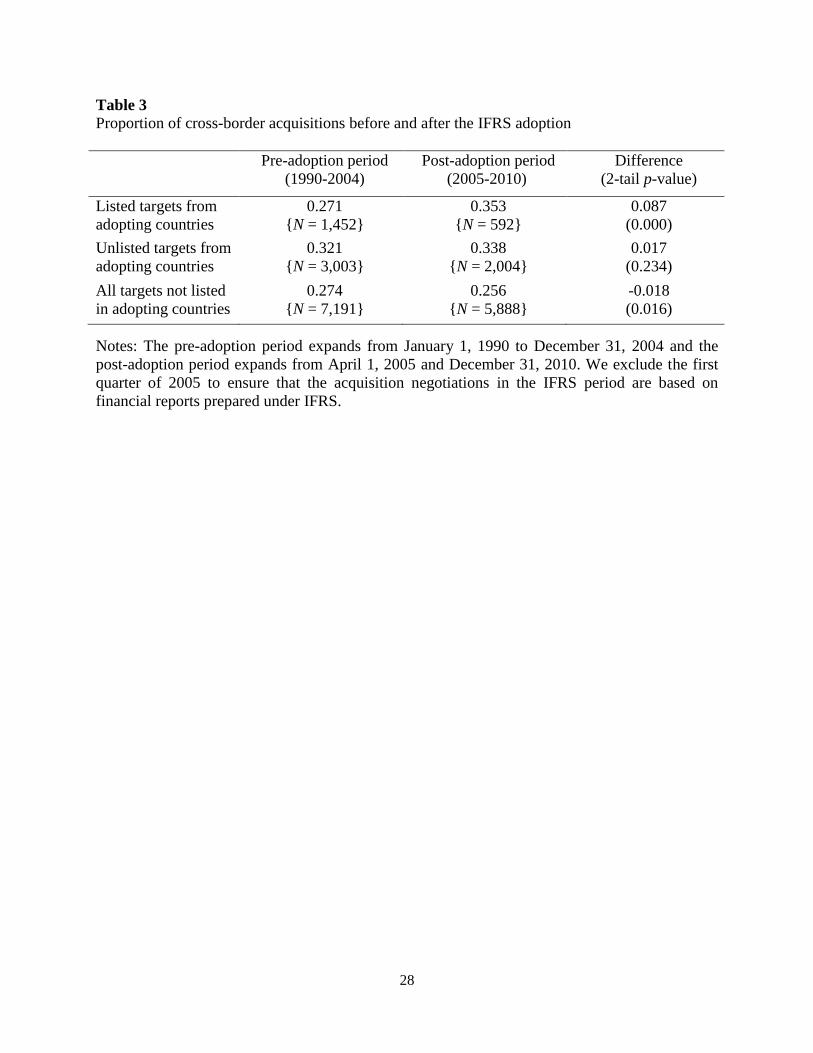
4.1 Univariate comparisons
We report univariate comparisons of the proportion of cross-border acquisitions before
and after the IFRS adoption in Table 3. Consistent with the notion that IFRS leads to an increase
in FDIs, the results show that the average proportion of cross-border acquisitions of listed
companies in the adopting countries is significantly larger after the adoption of IFRS than before
the adoption (0.353 versus 0.271). In contrast, we find no evidence of an increase in the average
proportion of cross-border acquisitions of unlisted companies (0.338 versus 0.321), suggesting
13
that the change in cross-border acquisitions around the adoption of IFRS is due to IFRS. We also
find no evidence of an increase in the average proportion of cross-border acquisitions not
involving listed companies from the adopting countries in general (0.256 versus 0.274).
4.2 Association between cross-border acquisitions and IFRS adoption
Table 4 reports the association between IFRS and the proportion of cross-border
acquisitions in a multivariate setting. We present results for the transactions involving listed
targets from the adopting countries under column (1). The results provide strong support for the
notion that IFRS leads to an increase in FDIs. The coefficient on POST_ADOPTION, the
indicator variable for the IFRS period, which represents the within-country difference in the log
odds of a cross-border acquisition between before and after the IFRS adoption, is 0.425 (or a
differential odd ratio of 1.536), with a p-value of 0.006.
We also analyze the association between IFRS and the proportion of cross-border
acquisitions of unlisted firms from the adopting countries. Cross-border acquisitions offer a
natural experimental setting for testing whether the mandatory adoption of IFRS leads to more
FDIs. Since IFRS is mandatory for listed and not for unlisted firms and very few unlisted firms
adopt IFRS, there is no reason to observe a significant increase in the proportion of cross-border
acquisitions of unlisted targets after the IFRS adoption if IFRS is the only driver of the shift in
cross-border acquisitions. The results of the analysis are reported in Table 4 under column (2). In
contrast to the results in column (1), where we analyze acquisitions of listed companies, the
results reported in column (2) provide no evidence of a significant increase in the proportion of
cross-border acquisitions after the IFRS adoption. Not only is the coefficient on
POST_ADOPTION statistically insignificant (p-value = 0.272), but it is actually negative
(−0.101). Note that both the listed and the unlisted targets are from IFRS adopting countries and
that we control for country-fixed effects and country macroeconomic factors. Therefore, it is
14
unlikely that the effect that we document is due to variations in the characteristics of the adopting
and the non-adopting countries.
We also use all acquisitions not involving listed targets from adopting countries as
benchmarks. The results are also reported in Table 4, under column (3). Again, in contrast to the
results in column (1), the results reported in column (3) provide no evidence of a significant
increase in the proportion of cross-border acquisitions after the IFRS adoption. The coefficient
on POST_ADOPTION in column (3) is close to zero (-0.002), with a p-value of 0.978. Overall,
the results strongly suggest that the increase in the proportion of cross-border acquisitions of
isted firms is due to IFRS as opposed to some general trend in cross-border acquisitions.
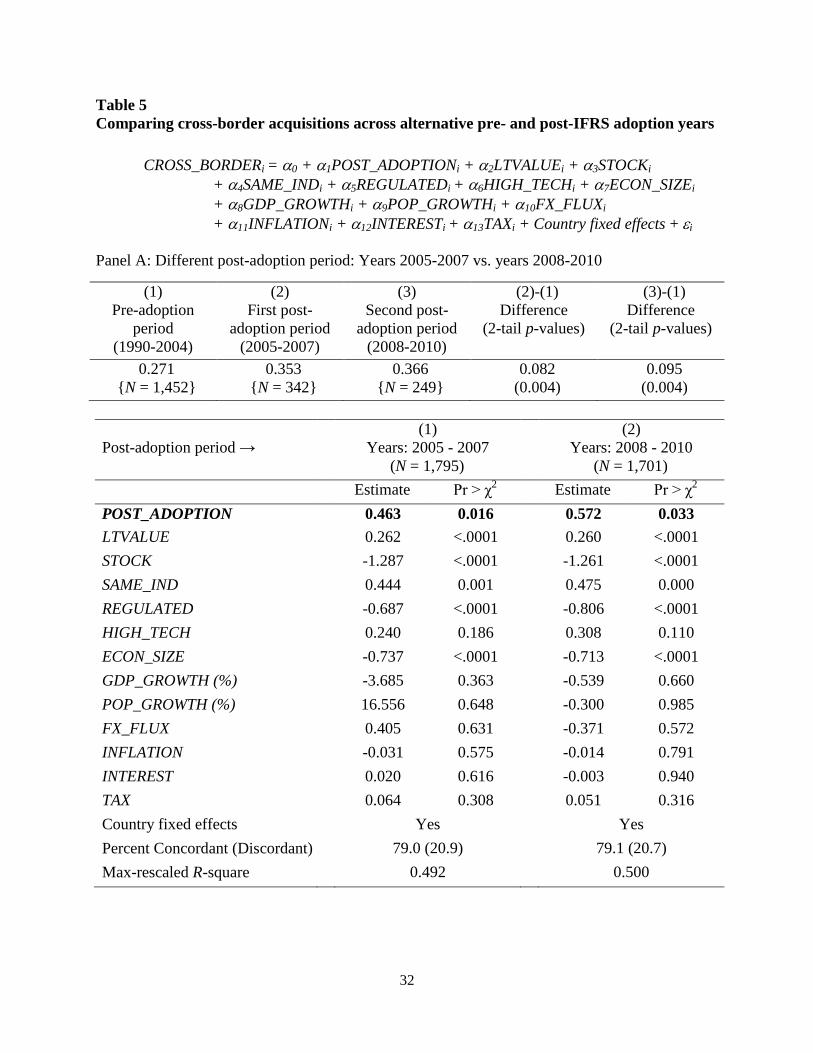
4.3 Cross-border acquisitions across alternative pre- and post-IFRS adoption years
We assess the persistence of the shift in investment flows to the IFRS countries by
sorting the post-IFRS years into two sub-periods: 2005-2007 and 2008-2010. The univariate
results in the first part of Panel A of Table 5 show a significant difference in the average
proportion of cross-border acquisitions of listed companies in the adopting countries across the
pre-adoption and the post-adoption years for both sub-periods. The multivariate analysis in the
second part of Panel A yields similar results.
We start the pre-adoption period in 1990 to increase the power of our tests. However, it is
possible that the shift in the proportion of cross-border acquisitions occurred prior to 2005 (say
in 2004) as opposed to after 2004. In this the case, we could still get a significant difference in
the proportion of cross-border acquisitions across the pre-adoption and the post-adoption
periods; however, it would be difficult to assign the difference to IFRS. To ensure that the shift
in the proportion of cross-border acquisitions did not occur prior to 2005, we replicate our
analysis using two different base periods: 2002-2004 and 2004. The univariate results in the first

15
part of Panel B of Table 5 show a significant difference in the average proportion of cross-border
acquisitions of listed companies in the adopting countries across the pre-adoption and the post-
adoption periods, whether we benchmark the IFRS years against 2002-2004 or just against 2004.
The multivariate analysis in the second part of Panel B yields similar results. The p-value for the
coefficient on POST_ADOPTION is large when we benchmark the IFRS years against 2004
because the number of pre-adoption transaction falls from 1,452 to just 85; however, the
coefficient estimate is actually larger than the estimate that we obtained for the full 1990-2004
pre-adoption period in column (1) of Table 4 (0.679 versus 0.425). Overall, the results indicate
that 2005 was the pivotal year in the shift in the cross-border acquisition pattern and that the shift
seems quite persistent.
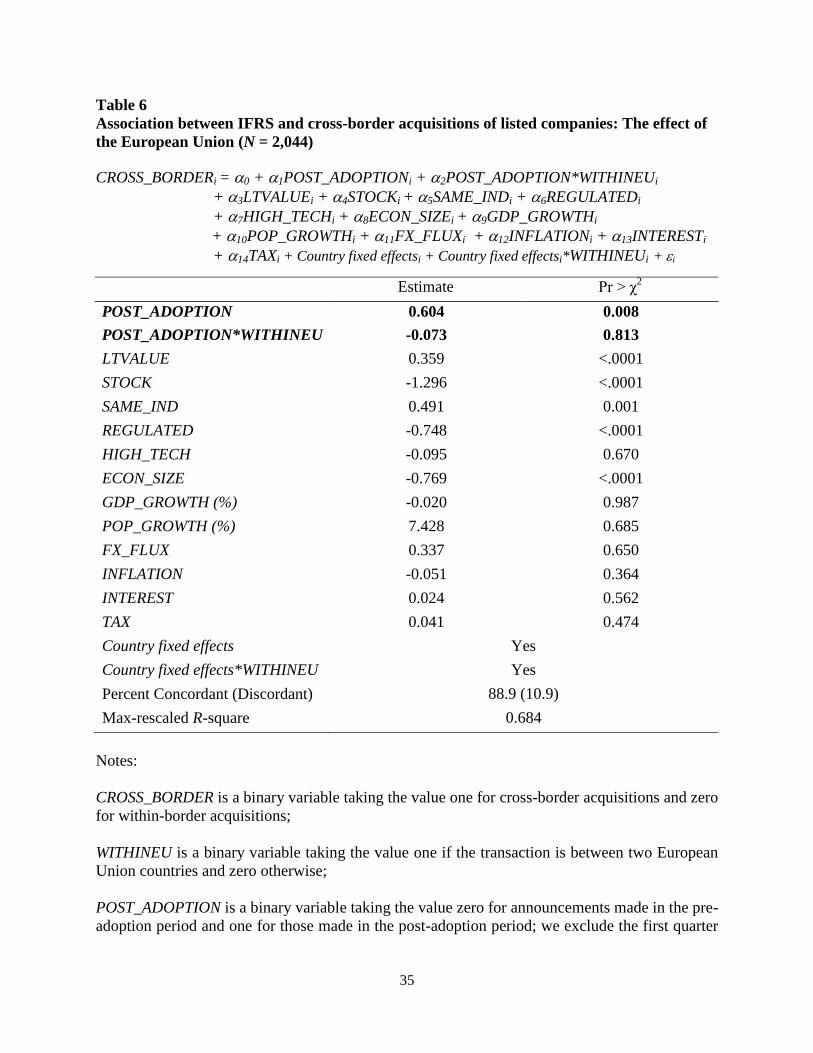
4.4 The effect of the European Union
The EU experienced its largest expansion between 2004 and 2009, with Cyprus, the
Czech Republic, Estonia, Hungary, Latvia, Lithuania, Malta, Poland, Slovakia, and Slovenia
joining the Union in 2004 and Romania and Bulgaria joining in 2007. Because IFRS is adopted
throughout the EU, the increase in cross-border investments in the IFRS adopting countries could
be the result of increased economic activities within the EU as opposed to the adoption of IFRS
per se. To test for this possibility, we use the following regression model:
CROSS_BORDERi = 0 + 1POST_ADOPTIONi + 2POST_ADOPTION*WITHINEUi
+ 3LTVALUEi + 4STOCKi + 5SAME_INDi + 6REGULATEDi
+ 7HIGH_TECHi + 8ECON_SIZEi + 9GDP_GROWTHi
+ 10POP_GROWTHi + 11FX_FLUXi + 12INFLATIONi + 13INTERESTi
+ 14TAXi + Country fixed effectsi + Country fixed effectsi*WITHINEUi + i, (2)
where WITHINEU is a binary variable taking the value one if the transaction is between two EU
countries and zero otherwise. WITHINEU is not included separately in the model because the
model already includes country-specific intercepts that vary with WITHINEU.
16
A significantly positive coefficient on the interaction between POST_ADOPTION and
WITHINEU would indicate that EU-generated activities have an incremental effect on the
observed increase in cross-border acquisitions of listed firms from the IFRS adopting countries.
An insignificant coefficient on POST_ADOPTION would indicate that the increase in cross-
border acquisitions of listed firms from the IFRS adopting countries is driven by cross-border
activities within the EU. However, the results reported in Table 6 show that the coefficient on
POST_ADOPTION is positive (0.604) and highly significant (p-value=0.008). The coefficient on
the interaction between WITHINEU and POST_ADOPTION is actually negative (-0.073),
although statistically insignificant (p-value = 0.813). Therefore, there is no evidence that the
increase in cross-border investments into the IFRS adopting countries is due to transactions
between the EU countries as opposed to the IFRS adoption per se.
4.5 The effect of acquiring firms’ adopting status
We also examine whether the incremental investment flow comes more from IFRS
adopting countries than from non-adopting countries. DeFond et al. (2011) explains the impact
of IFRS adoption on foreign mutual fund investments by its effects on reporting comparability.
However, Beneish et al. (2012) find no evidence that the increase in the flow of FPIs comes from
IFRS adopting countries and conclude that the increase in FPIs associated with the adoption of
IFRS is more likely to be due to improved financial reporting quality than to improved
comparability.
The results reported in Table 7 show that the coefficient on POST_ADOPTION is
significantly positive whether the acquirers are from adopting or non-adopting countries. The
coefficient (p-value) is 0.452 (0.014) when the acquirers are from adopting countries and 0.791
(0.004) when the acquirers are from non-adopting countries. Therefore, the increase in the

17
investment flow to the adopting countries’ targets comes from both adopting and non-adopting
countries. The increase tends to be more pronounced when the acquirers are from non-adopting
countries. Note, however, that the incremental proportion of cross-border acquisitions of unlisted
targets is also higher for acquirers from non-IFRS adopting countries than for acquirers from
IFRS adopting countries. Consequently, there is not a significant difference-in-difference across
the two groups of acquirers when the listed targets are compared to the unlisted targets. Because
IFRS does not generally apply to unlisted firms, the difference across the acquirers from non-
IFRS adopting countries and the acquirers from IFRS adopting countries is unlikely to be related
to IFRS. It is more likely due to a relative decrease (increase) in cross-border activities by
acquirers from IFRS (non-IFRS) adopting countries
Beneish et al. (2012) argues that, if improved comparability is the driver of the IFRS
effect, one should observe more investment flow into the IFRS adopting countries from other
IFRS adopting countries than from the non-IFRS adopting countries. However, as we explained
earlier, the adopting countries generally have strong commercial, educational, cultural, social,
and labor ties between themselves. Therefore, the average manager from these countries could
generally have a better understanding of financial reports, and better ability to screen potential
targets, from the other adopting countries than managers from the non-adopting countries. By
standardizing the reporting process and, hence, allowing everyone to use only one set of rules to
screen the potential targets instead of multiple sets of country-specific rules, IFRS could actually
benefit managers from the non-adopting countries more than managers from the adopting
countries.
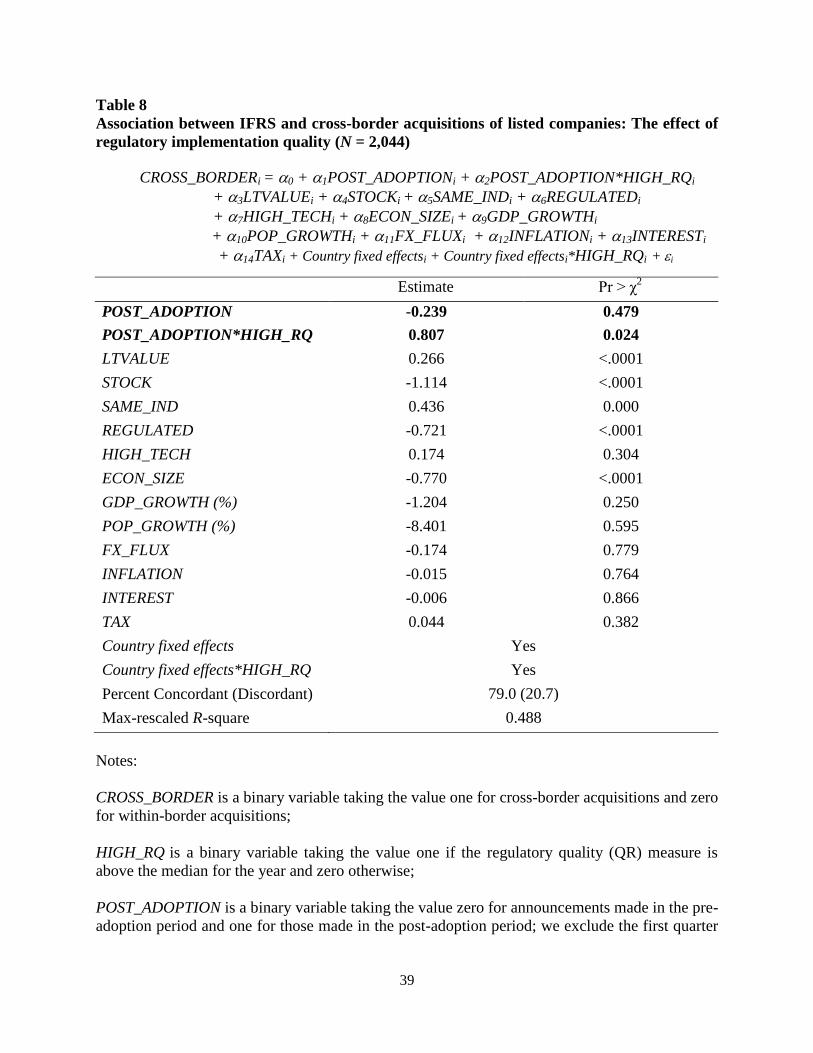
4.6 The effect of regulatory implementation quality
Prior studies suggest that the economic effects of IFRS are likely to depend on the
strength of the local institutions and regulatory implementation (Daske et al. 2008; Holthausen
18
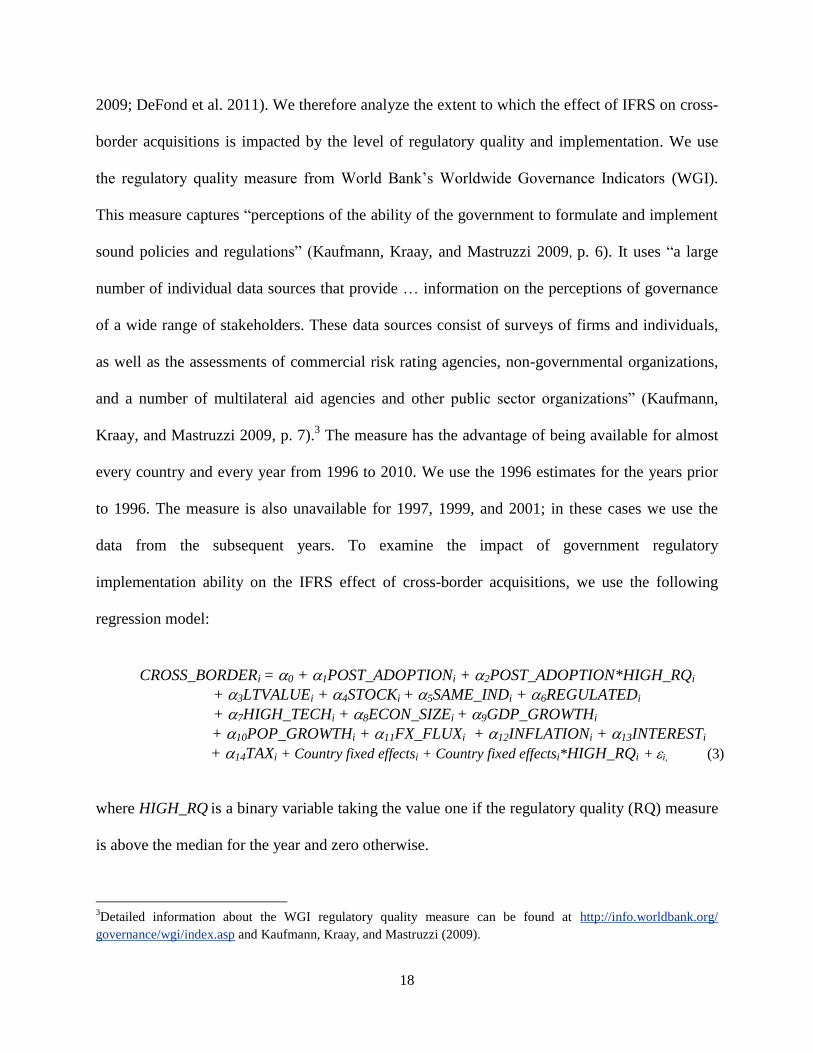
2009; DeFond et al. 2011). We therefore analyze the extent to which the effect of IFRS on cross-
border acquisitions is impacted by the level of regulatory quality and implementation. We use
the regulatory quality measure from World Bank’s Worldwide Governance Indicators (WGI).
This measure captures “perceptions of the ability of the government to formulate and implement
sound policies and regulations” (Kaufmann, Kraay, and Mastruzzi 2009, p. 6). It uses “a large
number of individual data sources that provide … information on the perceptions of governance
of a wide range of stakeholders. These data sources consist of surveys of firms and individuals,
as well as the assessments of commercial risk rating agencies, non-governmental organizations,
and a number of multilateral aid agencies and other public sector organizations” (Kaufmann,
Kraay, and Mastruzzi 2009, p. 7).3 The measure has the advantage of being available for almost
every country and every year from 1996 to 2010. We use the 1996 estimates for the years prior
to 1996. The measure is also unavailable for 1997, 1999, and 2001; in these cases we use the
data from the subsequent years. To examine the impact of government regulatory
implementation ability on the IFRS effect of cross-border acquisitions, we use the following
regression model:
CROSS_BORDERi = 0 + 1POST_ADOPTIONi + 2POST_ADOPTION*HIGH_RQi
+ 3LTVALUEi + 4STOCKi + 5SAME_INDi + 6REGULATEDi
+ 7HIGH_TECHi + 8ECON_SIZEi + 9GDP_GROWTHi
+ 10POP_GROWTHi + 11FX_FLUXi + 12INFLATIONi + 13INTERESTi
+ 14TAXi + Country fixed effectsi + Country fixed effectsi*HIGH_RQi + i, (3)
where HIGH_RQ is a binary variable taking the value one if the regulatory quality (RQ) measure
is above the median for the year and zero otherwise.
3Detailed information about the WGI regulatory quality measure can be found at http://info.worldbank.org/
governance/wgi/index.asp and Kaufmann, Kraay, and Mastruzzi (2009).
19
The results are reported in Table 8. Consistent with DeFond et al. (2011), we find that the
increase in foreign investments after the adoption of IFRS is limited to those countries where
government regulatory implementation ability is high. The coefficient (p-value) on
POST_ADOPTION is -0.239 (0.479), which indicates that, on average, there is no increase in the
flow of investments to IFRS countries with weak regulatory implementation ability. The
coefficient (p-value) on the interaction between HIGH_RQ and POST_ADOPTION is 0.807
(0.024). The sum of the coefficient on POST_ADOPTION and the coefficient on the interaction
between HIGH_RQ and POST_ADOPTION is significant at the 5 percent level in a two-tail test.
Interpretation of interaction effects in logistic regressions can be difficult because of potential
changes in the signs of the marginal effects. To facilitate the interpretation of our results, we
transform the coefficients into marginal effects. Following Greene’s (2011) recommendation, we
estimate the marginal effect for each observation and then use the sample mean of the individual
effects as an estimate of the overall marginal effect.4 Untabulated results show that the marginal
probabilities of a cross-border merger associated with the interaction between HIGH_RQ and
POST_ADOPTION are all positive with a mean of 0.121. Overall, the results are consistent with
the notion that the economic effects of IFRS increases with a country’s regulatory
implementation ability.
5. Conclusion
We examine the effects of IFRS on FDIs by analyzing whether the adoption of IFRS
leads to an increase in cross-border acquisitions of listed targets from the adopting countries. Our
4Greene (2011, p. 690) argues that, to compute “marginal effects, one can evaluate the expressions at the sample
means of the data or evaluate the marginal effects at every observation and use the sample average of the individual
marginal effects—this produces the average partial effects. In large samples these generally give roughly the same
answer … Current practice favors averaging the individual marginal effects when it is possible to do so.”

20
analysis has at least two very important distinctive features. First, it is among the few, if not the
first, to analyze the effects of IFRS on FDIs.5 Second, it uses the exogeneity in the targets’ listing
status to identify the effect of IFRS. It therefore relies on a much stronger identification
instrument than prior studies, which enables us to more reliably establish a causal relation
between IFRS and the shift in foreign investments around the mandatory IFRS adoption.
We find a significant increase in cross-border acquisitions of listed firms in the adopting
countries following the IFRS adoption. We also find that the change in cross-border acquisitions
of unlisted firms is insignificantly different from zero and significantly lower than the change in
cross-border acquisitions of listed firms, which suggests that the increase in FDIs around the
adoption of IFRS is due to IFRS. We find no evidence that the increase in cross-border
acquisitions of listed targets from the IFRS adopting countries is due to an increase in cross-
border acquisition activities within the EU. We also find that the increase in the flow of
investments into the IFRS adopting countries comes from both non-IFRS adopting countries and
other IFRS adopting countries. Moreover, consistent with the notion that the economic effects of
IFRS are likely to depend on the strength of the local institutions and regulatory implementation,
we also find that the increase in foreign investments after the adoption of IFRS is limited to those
countries where government ability to implement sound regulations is high. Overall, the
evidence strongly suggests that the adoption of IFRS leads to a significant increase in FDIs in
publicly traded companies in the adopting countries.
5We search all the major accounting journals and did not find any article on the effect of IFRS on FDIs.
21
References
Ahmed, S., M. Neel, and D. Wang, 2012. Does mandatory adoption of IFRS improve accounting
quality? Preliminary evidence. Available at SSRN: http://ssrn.com/abstract=1502909.
André, P., P. Walton, and D. Yang, 2012. Voluntary adoption of IFRS: A study of determinants
for UK unlisted firms. Available at SSRN: http://ssrn.com/abstract=1978986.
Armstrong, C., M. Barth, A. Jagolinzer, and E. Riedl, 2010. Market reaction to the adoption of
IFRS in Europe. The Accounting Review 85, 31-61.
Ball, R., S.P. Kothari, and A. Robin, 2000. The effect of international institutional factors on
properties of accounting earnings. Journal of Accounting and Economics 29, 1-51.
Ball, R., A. Robin, and J. Wu, 2003. Incentives versus standards: Properties of accounting
income in four East Asian countries. Journal of Accounting and Economics 36, 235-70.
Barth, M., W. Landsman, and M. Lang, 2008. International accounting standards and accounting
quality. Journal of Accounting Research 46, 467–498.
Bartov, E., S. Goldberg, and M. Kim, 2005. Comparative value relevance among German, U.S.,
and International Accounting Standards: A German stock market perspective. Journal of
Accounting, Auditing and Finance 20, 95-119.
Beneish, D, B. Miller, and T. Yohn, 2012. IFRS adoption and cross-border investment in equity
and debt markets. Available at SSRN: http://ssrn.com/abstract=1403451.
Borensztein E., J. De Gregorio, and J. Lee, 1998. How does foreign direct investment affect
economic growth? Journal of International Economics 45, 115-135.
Bradshaw, M., B. Bushee, and G. Miller, 2004. Accounting choice, home bias, and US
investment in non-US firms. Journal of Accounting Research 42, 795–841.
Brüggemann, U., K. Daske, C. Homburg; and P. Pope, 2009. How do individual investors react
to global IFRS adoption? Available at SSRN: http://ssrn.com/abstract=1458944.
Capkun, V., D. Collins and T. Jeanjean, 2012. Does adoption of IAS/IFRS deter earnings
management. Available at SSRN: http://ssrn.com/abstract=1850228.
Christensen, H., E. Lee, and M. Walker, 2012. Incentives or standards: What determines
accounting quality changes around IFRS adoption? Available at SSRN:
http://ssrn.com/abstract=1013054.
Covrig, V., M. DeFond, and M. Hung, 2007. Home bias, foreign mutual fund holdings, and the
voluntary adoption of international accounting standards. Journal of Accounting
Research 45, 41-70.

22
Daske, H., L. Hail, C. Leuz, and R. Verdi, 2008. Mandatory IFRS reporting around the world:
Early evidence on the economic consequences. Journal of Accounting Research 46,
1058-1142.
DeFond, M., X. Hu, M. Hung, and S. Li, 2011. The impact of mandatory IFRS adoption on
foreign mutual fund ownership: The role of comparability. Journal of Accounting &
Economics 51, 240-258.
Florou, A. and P. Pope, 2012. Mandatory IFRS adoption and institutional investment decisions.
Forthcoming, The Accounting Review.
Goldstein, I. and A. Razin, 2006. An information-based trade off between foreign direct
investment and foreign portfolio investment. Journal of International Economics 70, 271-
295.
Greene, W. 2011. Econometric Analysis. New Jersey: Prentice Hall, 7th
edition.
Henry, D. 2008. Global accounting rules: Simpler, yes. But better? BusinessWeek. September 4,
2008.
Holthausen, R., 2009. Accounting standards, financial reporting outcomes, and enforcement.
Journal of Accounting Research 47, 447-458.
Hung, M., 2001. Accounting standards and value relevance of earnings: An international
analysis. Journal of Accounting and Economics 30, 401-420.
Hung, M. and K. Subramanyam 2007. Financial statement effects of adopting international
accounting standards: The case of Germany. Review of Accounting Studies 12, 21-48.
Kaufmann, D., K. Aart, and M., Massimo, 2009. Governance matters VIII: Aggregate and
individual governance indicators, 1996-2008. World Bank Policy Research Working
Paper No. 4978. Available at SSRN: http://ssrn.com/abstract=1424591.
KPMG, 2007. How the IFRS movement will affect financial reporting in the U.S? Defining
Issues, November, No. 07-34.
Leuz, C., D. Nanda, and P. Wysocki, 2003. Earnings management and investor protection: An
international comparison. Journal of Financial Economics 6, 505-527.
McCreevy, C., 2005. IFRS – No pain, no gain? European Commissioner for Internal Market and
Services Speech 05-621, Brussels (October).
Morgan Stanley Dean Witter, 1998. Apples-to-apples: Accounting for value in world market.
Morgan Stanley Dean Witter Equity Research, New York, New York. 1998.
23
Organisation for Economic Cooperation and Development, 2008. OECD benchmark definition of
foreign direct investment, 4th
ed. http://www.oecd.org/dataoecd/26/50/40193734.pdf
Securities and Exchange Commission, 2008. Roadmap for the potential use of financial
statements prepared in accordance with international financial reporting standards by
U.S. issuers. Release Nos. 33-8982; 34-58960; File No. S7-27-08.
Tweedie, D., 2008. Prepared statement of Sir David Tweedie, Chairman of the IASB to officials
of the Singaporean government. Available at http://www.asc.gov.sg/attachments/
IFRS17Jul08_IASB_Worldwide_Adoption_of_IFRS.pdf.
White, J. 2008. Speech by SEC Staff: IFRS and U.S. companies: A look ahead. Financial
Executives International Global Financial Reporting Convergence Conference. June 5,
2008.
Yu, G. 2009. Accounting standards and international portfolio holdings analysis of cross-border
holding following mandatory adoption of IFRS. Working paper, University of Michigan.
24
Table 1
Sample distribution by year and country
Panel A: Year distribution
Listed targets Unlisted targets
Year Frequency Percent Frequency Percent
1990 46 2.25 26 0.52
1991 56 2.74 32 0.64
1992 29 1.42 64 1.28
1993 38 1.86 115 2.30
1993 55 2.69 141 2.82
1995 75 3.67 187 3.73
1996 104 5.09 300 5.99
1997 133 6.51 224 4.47
1998 149 7.29 268 5.35
1999 207 10.13 296 5.91
2000 184 9.00 418 8.35
2001 125 6.12 277 5.53
2002 80 3.91 189 3.77
2003 86 4.21 168 3.36
2004 85 4.16 298 5.95
2005 89 4.35 273 5.45
2006 128 6.26 416 8.31
2007 126 6.16 480 9.59
2008 77 3.77 311 6.21
2009 92 4.50 225 4.49
2010 80 3.91 299 5.97
Total 2,044 100.00 5,007 100.00
Panel B: Distribution by country
Listed targets Unlisted targets
Pre-adoption Post-adoption Pre-adoption Post-adoption
# % # % # % # %
Australia 277 19.08 219 36.99 249 8.29 368 18.36
Austria 0 0.00 1 0.17 3 0.10 5 0.25
Belgium 6 0.41 5 0.84 35 1.17 20 1.00
Czech
Republic
0 0.00 0 0.00 5 0.17 13 0.65
Denmark 16 1.10 5 0.84 29 0.97 23 1.15
Finland 15 1.03 3 0.51 63 2.10 39 1.95
France 75 5.17 14 2.36 140 4.66 74 3.69
Germany 24 1.65 6 1.01 112 3.73 83 4.14
Greece 13 0.90 7 1.18 7 0.23 2 0.10

25
Hong Kong 17 1.17 16 2.70 182 6.06 254 12.67
Ireland 19 1.31 2 0.34 63 2.10 25 1.25
Italy 19 1.31 14 2.36 57 1.90 52 2.59
Netherlands 48 3.31 14 2.36 79 2.63 42 2.10
Norway 39 2.69 22 3.72 58 1.93 38 1.90
Philippines 6 0.41 3 0.51 18 0.60 18 0.90
Poland 6 0.41 5 0.84 7 0.23 38 1.90
Portugal 1 0.07 0 0.00 2 0.07 2 0.10
Romania 1 0.07 0 0.00 0 0.00 4 0.20
South Africa 75 5.17 20 3.38 87 2.90 56 2.79
Spain 17 1.17 6 1.01 43 1.43 35 1.75
Sweden 84 5.79 28 4.73 88 2.93 64 3.19
Switzerland 13 0.90 16 2.70 31 1.03 31 1.55
UK 681 46.90 186 31.42 1,641 54.65 714 35.63
Venezuela 0 0.00 0 0.00 4 0.13 4 0.20
Total 1,452 100.00 592 100.00 3,003 100.00 2,004 100.00
Notes: The pre-adoption period covers fiscal quarters ending between January 1, 1990 and
December 31, 2004 and the post-adoption period covers fiscal quarters ending between April 1,
2005 and December 31, 2010 (post-adoption period); we exclude the first quarter of 2005 to
ensure that the acquisition negotiations in the IFRS period are based on financial reports
prepared under IFRS.
26
Table 2
Average characteristics of transactions involving targets from IFRS adopting countries
Listed targets Unlisted targets
Pre-adoption
(N = 1,452)
Post-adoption
(N = 592)
Pre-adoption
(N = 3,003)
Post-adoption
(N = 2,004)
LTVALUE 18.895 18.862 16.967 16.912
STOCK 0.558 0.522 0.396 0.364***
SAME_IND 0.544 0.596**
0.470 0.501**
REGULATED 0.307 0.301 0.245 0.269*
HIGH_TECH 0.113 0.186***
0.216 0.199
ECON_SIZE -0.207 -0.258 -0.312 -0.274
GDP_GROWTH (%) 0.053 0.004***
0.052 0.003***
POP_GROWTH (%) 0.006 0.011***
0.005 0.008***
FX_FLUX 0.012 -0.011***
0.012 0.001***
INFLATION (%) 2.585 2.595 2.085 2.562***
INTEREST (%) 7.919 6.004***
7.034 5.815***
TAX (%) 35.120 33.402***
34.661 32.803***
Notes:
LTVALUE is the natural logarithm of the transaction’s total value (in constant 2011 U.S. dollars);
STOCK is the proportion of the transaction that is financed with stock;
SAME_IND is a binary variable that takes the value one if the two merging partners are in the
same two-digit SIC code and zero otherwise;
REGULATED is a binary variable taking the value one for targets in regulated industries [SIC
codes: 4000–4999 (utilities) and 6000–6999 (financials)] and zero otherwise;
HIGH_TECH is an indicator variable that takes the value one for technology firms [SIC codes:
2833–2836 (drugs), 3570–3577 (computer and office equipment), 3600–3674 (electronic and
other electrical equipment and components, except computer equipment), 3812–3845
(measuring, analyzing, and controlling instruments), 7371–7379 (computer programming and
data processing), and 8731–8734 (research, development, and testing services)] and zero
otherwise;

27
ECON_SIZE is the (relative) size of the local economy, computed as the log of the ratio of the
target’s country annual GDP to the acquirer’s country annual GDP;
GDP_GROWTH is the annual growth rate in the GDP of the target’s country;
POP_GROWTH is the annual growth rate in the population of the target’s country;
FX_FLUX is the annual fluctuation rate in the national currency of the target’s country relative to
the US dollar;
INFLATION is the annual inflation rate of the target’s country;
INTEREST is the annual interbank lending rate of the target’s country; and
TAX is the ratio of the annual corporate tax income to the annual GDP of the target’s country.
The pre-adoption period expands from January 1, 1990 to December 31, 2004 and the post-
adoption period expands from April 1, 2005 and December 31, 2010. We exclude the first
quarter of 2005 to ensure that the acquisition negotiations in the IFRS period are based on
financial reports prepared under IFRS. ***
, **
, and *
indicate that the average difference across the
pre-adoption and the post-adoption periods is statistically significant at the 1, 5, and 10 percent
levels in a two-tail test, respectively.
28
Table 3
Proportion of cross-border acquisitions before and after the IFRS adoption
Pre-adoption period
(1990-2004)
Post-adoption period
(2005-2010)
Difference
(2-tail p-value)
Listed targets from
adopting countries
0.271
{N = 1,452}
0.353
{N = 592}
0.087
(0.000)
Unlisted targets from
adopting countries
0.321
{N = 3,003}
0.338
{N = 2,004}
0.017
(0.234)
All targets not listed
in adopting countries
0.274
{N = 7,191}
0.256
{N = 5,888}
-0.018
(0.016)
Notes: The pre-adoption period expands from January 1, 1990 to December 31, 2004 and the
post-adoption period expands from April 1, 2005 and December 31, 2010. We exclude the first
quarter of 2005 to ensure that the acquisition negotiations in the IFRS period are based on
financial reports prepared under IFRS.

29
Table 4
Association between IFRS and cross-border acquisitions of listed companies
CROSS_BORDERi = 0 + 1POST_ADOPTIONi + 2LTVALUEi + 3STOCKi
+ 4SAME_INDi + 5REGULATEDi + 6HIGH_TECHi + 7ECON_SIZEi
+ 8GDP_GROWTHi + 9POP_GROWTHi + 10FX_FLUXi
+ 11INFLATIONi + 12INTERESTi + 13TAXi + Country fixed effects + i
(1)
Listed targets from
adopting countries
(N = 2,044)
(2)
Unlisted targets from
adopting countries
(N = 5,007)
(3)
All targets not listed
in adopting countries
(N = 10,165)
POST_ADOPTION
0.429
(0.006)
-0.101+++
(0.272)
-0.002+++
(0.978)
LTVALUE 0.267
(0.000)
0.147***
(0.000)
0.134***
(0.000)
STOCK -1.242
(0.000)
-0.470***
(0.000)
-0.620***
(0.000)
SAME_IND 0.460
(0.000)
0.109**
(0.151)
0.034***
(0.582)
REGULATED -0.727
(0.000)
-0.522
(0.000)
-0.472
(0.000)
HIGH_TECH 0.188
(0.262)
0.264
(0.006)
0.405
(0.000)
ECON_SIZE -0.686
(0.000)
-0.771
(0.000)
-1.113***
(0.000)
GDP_GROWTH (%) -0.010
(0.334)
-0.006
(0.236)
-0.574
(0.027)
POP_GROWTH (%) -0.033
(0.828)
-0.126
(0.092)
-0.668
(0.000)
FX_FLUX -0.085
(0.890)
0.050
(0.901)
-0.225***
(0.506)
INFLATION -0.009
(0.850)
0.077
(0.009)
0.005
(0.751)
INTEREST -0.002
(0.948)
-0.043
(0.070)
0.011***
(0.405)
TAX 0.020
(0.680)
0.057
(0.033)
0.063***
(0.004)
Country fixed effects Yes Yes Yes
Percent Concordant (Discordant) 70.8 (20.9) 81.8 (18.1) 84.4 (14.4)
Max-rescaled R-square 0.480 0.496 0.635
30
Notes:
CROSS_BORDER is a binary variable taking the value one for cross-border acquisitions and zero
for within-border acquisitions;
POST_ADOPTION is a binary variable taking the value zero for announcements made between
January 1, 1990 and December 31, 2004 (pre-adoption period) and one for those made between
April 1, 2005 and December 31, 2010 (post-adoption period); we exclude the first quarter of
2005 to ensure that the acquisition negotiations in the IFRS period are based on financial reports
prepared under IFRS;
LTVALUE is the natural logarithm of the transaction’s total value (in constant 2011 U.S. dollars);
STOCK is the proportion of the transaction that is financed with stock;
SAME_IND is a binary variable that takes the value one if the two merging partners are in the
same two-digit SIC code and zero otherwise;
REGULATED is a binary variable taking the value one for targets in regulated industries [SIC
codes: 4000–4999 (utilities) and 6000–6999 (financials)] and zero otherwise;
HIGH_TECH is an indicator variable that takes the value one for technology firms [SIC codes:
2833–2836 (drugs), 3570–3577 (computer and office equipment), 3600–3674 (electronic and
other electrical equipment and components, except computer equipment), 3812–3845
(measuring, analyzing, and controlling instruments), 7371–7379 (computer programming and
data processing), and 8731–8734 (research, development, and testing services)] and zero
otherwise;
ECON_SIZE is the (relative) size of the local economy, computed as the log of the ratio of the
target’s country annual GDP to the acquirer’s country annual GDP;
GDP_GROWTH is the annual growth rate in the GDP of the target’s country;
POP_GROWTH is the annual growth rate in the population of the target’s country;
FX_FLUX is the annual fluctuation rate in the national currency of the target’s country relative to
the US dollar;
INFLATION is the annual inflation rate of the target’s country;
INTEREST is the annual interbank lending rate of the target’s country; and
TAX is the ratio of the annual corporate tax income to the annual GDP of the target’s country.
The label under Column (3) “All targets not listed in adopting countries” encompasses unlisted
targets from adopting countries as well as targets (listed and unlisted) from the non-adopting
countries outside of the U.S.

31
Two-tail p-values are reported in parentheses. +++
indicates that the coefficients in columns (2)
and (3) are statistically different from the coefficients in column (1) at the 1 percent level in a
one-tail test. ***
, **
, and *
indicate that the coefficients in columns (2) and (3) are statistically
different from the coefficients in column (1) at the 1, 5, and 10 percent levels in a two-tail test,
respectively.
32
Table 5
Comparing cross-border acquisitions across alternative pre- and post-IFRS adoption years
CROSS_BORDERi = 0 + 1POST_ADOPTIONi + 2LTVALUEi + 3STOCKi
+ 4SAME_INDi + 5REGULATEDi + 6HIGH_TECHi + 7ECON_SIZEi
+ 8GDP_GROWTHi + 9POP_GROWTHi + 10FX_FLUXi
+ 11INFLATIONi + 12INTERESTi + 13TAXi + Country fixed effects + i
Panel A: Different post-adoption period: Years 2005-2007 vs. years 2008-2010
(1)
Pre-adoption
period
(1990-2004)
(2)
First post-
adoption period
(2005-2007)
(3)
Second post-
adoption period
(2008-2010)
(2)-(1)
Difference
(2-tail p-values)
(3)-(1)
Difference
(2-tail p-values)
0.271
{N = 1,452}
0.353
{N = 342}
0.366
{N = 249}
0.082
(0.004)
0.095
(0.004)
Post-adoption period →
(1)
Years: 2005 - 2007
(N = 1,795)
(2)
Years: 2008 - 2010
(N = 1,701)
Estimate Pr > χ
2 Estimate Pr > χ
2
POST_ADOPTION
0.463 0.016 0.572 0.033
LTVALUE 0.262 <.0001 0.260 <.0001
STOCK -1.287 <.0001 -1.261 <.0001
SAME_IND 0.444 0.001 0.475 0.000
REGULATED -0.687 <.0001 -0.806 <.0001
HIGH_TECH 0.240 0.186 0.308 0.110
ECON_SIZE -0.737 <.0001 -0.713 <.0001
GDP_GROWTH (%) -3.685 0.363 -0.539 0.660
POP_GROWTH (%) 16.556 0.648 -0.300 0.985
FX_FLUX 0.405 0.631 -0.371 0.572
INFLATION -0.031 0.575 -0.014 0.791
INTEREST 0.020 0.616 -0.003 0.940
TAX 0.064 0.308 0.051 0.316
Country fixed effects Yes Yes
Percent Concordant (Discordant) 79.0 (20.9) 79.1 (20.7)
Max-rescaled R-square 0.492 0.500

33
Panel B: Using the most recent pre-IFRS years as baselines
(1)
Last three
pre-adoption years
(2002-2004)
(2)
Last
pre-adoption year
(2004)
(3)
Post-adoption
period
(2005-2010)
(3)-(1)
Difference
(2-tail p-values)
(3)-(2)
Difference
(2-tail p-values)
0.255
{N = 251}
0.200
{N = 85}
0.358
{N = 592}
0.103
(0.017)
0.158
(0.001)
Baseline →
(1)
Last three pre-adoption years
(N = 843)
(2)
The last pre-adoption year
(N = 677)
Estimate Pr > χ
2 Estimate Pr > χ
2
POST_ADOPTION
0.581 0.012 0.679 0.054
LTVALUE 0.270 <.0001 0.295 <.0001
STOCK -1.136 <.0001 -1.224 <.0001
SAME_IND 0.407 0.030 0.372 0.068
REGULATED -0.628 0.005 -0.558 0.021
HIGH_TECH 0.047 0.847 -0.107 0.695
ECON_SIZE -0.728 <.0001 -0.559 <.0001
GDP_GROWTH (%) -0.065 0.966 -0.043 0.978
POP_GROWTH (%) 8.393 0.688 9.878 0.640
FX_FLUX -1.062 0.291 -1.114 0.314
INFLATION 0.180 0.164 0.133 0.373
INTEREST -0.037 0.726 -0.019 0.862
TAX -0.122 0.175 -0.135 0.154
Country fixed effects Yes Yes
Percent Concordant (Discordant) 81.1 (18.7) 80.4 (19.5)
Max-rescaled R-square 0.477 0.448
Notes:
CROSS_BORDER is a binary variable taking the value one for cross-border acquisitions and zero
for within-border acquisitions;
POST_ADOPTION is a binary variable taking the value zero for announcements made in the pre-
adoption period and one for those made in the post-adoption period; we exclude the first quarter
of 2005 to ensure that the acquisition negotiations in the IFRS period are based on financial
reports prepared under IFRS;
LTVALUE is the natural logarithm of the transaction’s total value (in constant 2011 U.S. dollars);

34
LTVALUE is the natural logarithm of the transaction’s total value (in constant 2011 U.S. dollars);
STOCK is the proportion of the transaction that is financed with stock;
SAME_IND is a binary variable that takes the value one if the two merging partners are in the
same two-digit SIC code and zero otherwise;
REGULATED is a binary variable taking the value one for targets in regulated industries [SIC
codes: 4000–4999 (utilities) and 6000–6999 (financials)] and zero otherwise;
HIGH_TECH is an indicator variable that takes the value one for technology firms [SIC codes:
2833–2836 (drugs), 3570–3577 (computer and office equipment), 3600–3674 (electronic and
other electrical equipment and components, except computer equipment), 3812–3845
(measuring, analyzing, and controlling instruments), 7371–7379 (computer programming and
data processing), and 8731–8734 (research, development, and testing services)] and zero
otherwise;
ECON_SIZE is the (relative) size of the local economy, computed as the log of the ratio of the
target’s country annual GDP to the acquirer’s country annual GDP;
GDP_GROWTH is the annual growth rate in the GDP of the target’s country;
POP_GROWTH is the annual growth rate in the population of the target’s country;
FX_FLUX is the annual fluctuation rate in the national currency of the target’s country relative to
the US dollar;
INFLATION is the annual inflation rate of the target’s country;
INTEREST is the annual interbank lending rate of the target’s country; and
TAX is the ratio of the annual corporate tax income to the annual GDP of the target’s country.
35
Table 6
Association between IFRS and cross-border acquisitions of listed companies: The effect of
the European Union (N = 2,044)
CROSS_BORDERi = 0 + 1POST_ADOPTIONi + 2POST_ADOPTION*WITHINEUi
+ 3LTVALUEi + 4STOCKi + 5SAME_INDi + 6REGULATEDi
+ 7HIGH_TECHi + 8ECON_SIZEi + 9GDP_GROWTHi
+ 10POP_GROWTHi + 11FX_FLUXi + 12INFLATIONi + 13INTERESTi
+ 14TAXi + Country fixed effectsi + Country fixed effectsi*WITHINEUi + i
Estimate Pr > χ2
POST_ADOPTION
0.604 0.008
POST_ADOPTION*WITHINEU
-0.073 0.813
LTVALUE 0.359 <.0001
STOCK -1.296 <.0001
SAME_IND 0.491 0.001
REGULATED -0.748 <.0001
HIGH_TECH -0.095 0.670
ECON_SIZE -0.769 <.0001
GDP_GROWTH (%) -0.020 0.987
POP_GROWTH (%) 7.428 0.685
FX_FLUX 0.337 0.650
INFLATION -0.051 0.364
INTEREST 0.024 0.562
TAX 0.041 0.474
Country fixed effects Yes
Country fixed effects*WITHINEU Yes
Percent Concordant (Discordant) 88.9 (10.9)
Max-rescaled R-square 0.684
Notes:
CROSS_BORDER is a binary variable taking the value one for cross-border acquisitions and zero
for within-border acquisitions;
WITHINEU is a binary variable taking the value one if the transaction is between two European
Union countries and zero otherwise;
POST_ADOPTION is a binary variable taking the value zero for announcements made in the pre-
adoption period and one for those made in the post-adoption period; we exclude the first quarter

36
of 2005 to ensure that the acquisition negotiations in the IFRS period are based on financial
reports prepared under IFRS;
LTVALUE is the natural logarithm of the transaction’s total value (in constant 2011 U.S. dollars);
STOCK is the proportion of the transaction that is financed with stock;
SAME_IND is a binary variable that takes the value one if the two merging partners are in the
same two-digit SIC code and zero otherwise;
REGULATED is a binary variable taking the value one for targets in regulated industries [SIC
codes: 4000–4999 (utilities) and 6000–6999 (financials)] and zero otherwise;
HIGH_TECH is an indicator variable that takes the value one for technology firms [SIC codes:
2833–2836 (drugs), 3570–3577 (computer and office equipment), 3600–3674 (electronic and
other electrical equipment and components, except computer equipment), 3812–3845
(measuring, analyzing, and controlling instruments), 7371–7379 (computer programming and
data processing), and 8731–8734 (research, development, and testing services)] and zero
otherwise;
ECON_SIZE is the (relative) size of the local economy, computed as the log of the ratio of the
target’s country annual GDP to the acquirer’s country annual GDP;
GDP_GROWTH is the annual growth rate in the GDP of the target’s country;
POP_GROWTH is the annual growth rate in the population of the target’s country;
FX_FLUX is the annual fluctuation rate in the national currency of the target’s country relative to
the US dollar;
INFLATION is the annual inflation rate of the target’s country;
INTEREST is the annual interbank lending rate of the target’s country; and
TAX is the ratio of the annual corporate tax income to the annual GDP of the target’s country.
The model includes country-specific intercepts, which are interacted with WITHINEU; therefore,
WITHINEU is not included separately in the model.

37
Table 7
Association between IFRS and cross-border acquisitions: Adopting versus non-adopting
cross-border acquirers
CROSS_BORDERi = 0 + 1POST_ADOPTIONi + 2LTVALUEi + 3STOCKi
+ 4SAME_INDi + 5REGULATEDi + 6HIGH_TECHi + 7ECON_SIZEi
+ 8GDP_GROWTHi + 9POP_GROWTHi + 10FX_FLUXi
+ 11INFLATIONi + 12INTERESTi + 13TAXi + Country fixed effects + i
Cross-border acquirers are from→
(1)
IFRS adopting countries
(2)
Non-IFRS adopting countries
Listed targets
(N = 1,781)
Unlisted targets
(N = 4,300)
Listed targets
(N = 1,712)
Unlisted targets
(N = 4,127)
POST_ADOPTION
0.452+++
(0.014)
-0.203
(0.061)
0.791++
(0.004) 0.128
(0.414)
LTVALUE 0.350***
(0.000)
0.112
(0.000)
0.141
(0.013)
0.065
(0.116)
STOCK -1.509***
(0.000)
-1.083
(0.000)
-0.684***
(0.002)
0.060
(0.689)
SAME_IND 0.561**
(0.000)
0.179
(0.051)
0.314
(0.134)
0.147
(0.249)
REGULATED -0.710
(0.000)
-0.635
(0.000)
-0.647
(0.013)
-0.266
(0.099)
HIGH_TECH -0.016
(0.940)
0.092
(0.439)
-0.018
(0.951)
0.319
(0.043)
ECON_SIZE 0.472***
(0.000)
0.126
(0.031)
-2.295
(0.000)
-2.075
(0.000)
GDP_GROWTH (%) -0.484
(0.691)
0.000
(0.971)
0.006
(0.746)
-0.009
(0.242)
POP_GROWTH (%) 0.029
(0.870)
-0.182
(0.036)
0.025
(0.894)
0.090
(0.475)
FX_FLUX 0.673
(0.366)
0.838
(0.083)
-0.791
(0.460)
-1.066
(0.131)
INFLATION 0.004
(0.939)
0.079
(0.019)
0.097
(0.294)
0.099
(0.047)
INTEREST 0.020*
(0.617)
-0.066
(0.017)
-0.088
(0.218)
-0.053
(0.201)
TAX 0.021
(0.698)
0.082
(0.005)
-0.045
(0.642)
-0.059
(0.250)
Country fixed effects Yes Yes Yes Yes
Percent Concordant (Discordant) 82.1 (17.6) 82.7 (17.0) 89.4 (10.2) 87.9 (11.9)
Max-rescaled R-square 0.614 0.611 0.820 0.795

38
Notes:
CROSS_BORDER is a binary variable taking the value one for cross-border acquisitions and zero
for within-border acquisitions;
POST_ADOPTION is a binary variable taking the value zero for announcements made between
January 1, 1990 and December 31, 2004 (pre-adoption period) and one for those made between
April 1, 2005 and December 31, 2010 (post-adoption period); we exclude the first quarter of
2005 to ensure that the acquisition negotiations in the IFRS period are based on financial reports
prepared under IFRS;
LTVALUE is the natural logarithm of the transaction’s total value (in constant 2011 U.S. dollars);
STOCK is the proportion of the transaction that is financed with stock;
SAME_IND is a binary variable that takes the value one if the two merging partners are in the
same two-digit SIC code and zero otherwise;
REGULATED is a binary variable taking the value one for targets in regulated industries [SIC
codes: 4000–4999 (utilities) and 6000–6999 (financials)] and zero otherwise;
HIGH_TECH is an indicator variable that takes the value one for technology firms [SIC codes:
2833–2836 (drugs), 3570–3577 (computer and office equipment), 3600–3674 (electronic and
other electrical equipment and components, except computer equipment), 3812–3845
(measuring, analyzing, and controlling instruments), 7371–7379 (computer programming and
data processing), and 8731–8734 (research, development, and testing services)] and zero
otherwise;
ECON_SIZE is the (relative) size of the local economy, computed as the log of the ratio of the
target’s country annual GDP to the acquirer’s country annual GDP;
GDP_GROWTH is the annual growth rate in the GDP of the target’s country;
POP_GROWTH is the annual growth rate in the population of the target’s country;
FX_FLUX is the annual fluctuation rate in the national currency of the target’s country relative to
the US dollar;
INFLATION is the annual inflation rate of the target’s country;
INTEREST is the annual interbank lending rate of the target’s country; and
TAX is the ratio of the annual corporate tax income to the annual GDP of the target’s country.
Two-tail p-values are reported in parentheses. +++
and ++
indicate that the difference between the
coefficient for the unlisted targets and the coefficient for the listed targets is significant at the 1
and 5 percent levels in a one-tail test, respectively. ***
, **
, and *
indicate that the differences
between the coefficients for the unlisted targets and the coefficients for the listed targets are
significant at the 1, 5, and 10 percent levels in a two-tail test, respectively.
39
Table 8
Association between IFRS and cross-border acquisitions of listed companies: The effect of
regulatory implementation quality (N = 2,044)
CROSS_BORDERi = 0 + 1POST_ADOPTIONi + 2POST_ADOPTION*HIGH_RQi
+ 3LTVALUEi + 4STOCKi + 5SAME_INDi + 6REGULATEDi
+ 7HIGH_TECHi + 8ECON_SIZEi + 9GDP_GROWTHi
+ 10POP_GROWTHi + 11FX_FLUXi + 12INFLATIONi + 13INTERESTi
+ 14TAXi + Country fixed effectsi + Country fixed effectsi*HIGH_RQi + i
Estimate Pr > χ2
POST_ADOPTION
-0.239 0.479
POST_ADOPTION*HIGH_RQ 0.807 0.024
LTVALUE 0.266 <.0001
STOCK -1.114 <.0001
SAME_IND 0.436 0.000
REGULATED -0.721 <.0001
HIGH_TECH 0.174 0.304
ECON_SIZE -0.770 <.0001
GDP_GROWTH (%) -1.204 0.250
POP_GROWTH (%) -8.401 0.595
FX_FLUX -0.174 0.779
INFLATION -0.015 0.764
INTEREST -0.006 0.866
TAX 0.044 0.382
Country fixed effects Yes
Country fixed effects*HIGH_RQ Yes
Percent Concordant (Discordant) 79.0 (20.7)
Max-rescaled R-square 0.488
Notes:
CROSS_BORDER is a binary variable taking the value one for cross-border acquisitions and zero
for within-border acquisitions;
HIGH_RQ is a binary variable taking the value one if the regulatory quality (QR) measure is
above the median for the year and zero otherwise;
POST_ADOPTION is a binary variable taking the value zero for announcements made in the pre-
adoption period and one for those made in the post-adoption period; we exclude the first quarter
40
of 2005 to ensure that the acquisition negotiations in the IFRS period are based on financial
reports prepared under IFRS;
LTVALUE is the natural logarithm of the transaction’s total value (in constant 2011 U.S. dollars);
STOCK is the proportion of the transaction that is financed with stock;
SAME_IND is a binary variable that takes the value one if the two merging partners are in the
same two-digit SIC code and zero otherwise;
REGULATED is a binary variable taking the value one for targets in regulated industries [SIC
codes: 4000–4999 (utilities) and 6000–6999 (financials)] and zero otherwise;
HIGH_TECH is an indicator variable that takes the value one for technology firms [SIC codes:
2833–2836 (drugs), 3570–3577 (computer and office equipment), 3600–3674 (electronic and
other electrical equipment and components, except computer equipment), 3812–3845
(measuring, analyzing, and controlling instruments), 7371–7379 (computer programming and
data processing), and 8731–8734 (research, development, and testing services)] and zero
otherwise;
ECON_SIZE is the (relative) size of the local economy, computed as the log of the ratio of the
target’s country annual GDP to the acquirer’s country annual GDP;
GDP_GROWTH is the annual growth rate in the GDP of the target’s country;
POP_GROWTH is the annual growth rate in the population of the target’s country;
FX_FLUX is the annual fluctuation rate in the national currency of the target’s country relative to
the US dollar;
INFLATION is the annual inflation rate of the target’s country;
INTEREST is the annual interbank lending rate of the target’s country; and
TAX is the ratio of the annual corporate tax income to the annual GDP of the target’s country.
The model includes country-specific intercepts, which are interacted with HIGH_RQ; therefore,
HIGH_RQ is not included separately in the model.