the effect of esg investing on stock returns and risk
TRANSCRIPT
The Effect of ESG Investing on Stock
Returns and Risk
University of Amsterdam, Amsterdam Business School
MSc Business Economics – Finance
Master Thesis
Supervised by Prof. Jeroen Ligterink
Cagri Yürür, 10846352
August, 2017

Statement of Originality This document is written by Cagri Yürür who declares full responsibility for the contents of this document. I declare that the text and the work presented in this document is original and that no sources other than those mentioned in the text and its references have been used in creating it. The Faculty of Economics and Business is responsible solely for the supervision of completion of the work, not for the contents.

Acknowledgement I would like to express my gratitude to my supervisor Professor Jeroen Ligterink for his useful comments, remarks and efforts throughout the process of this research. Without his dedication and constant feedback this thesis would not have been accomplished in the way presented and I am more than thankful for his supervision during my student life.

Abstract Does ESG investing have a significant effect on the stock market? This thesis investigates the financial market’s reaction to the implementation of environmental, social, and governance relat-ed investment rules in accordance to the Principles of Responsible Investing. By grouping com-panies according to their ESG performances I compare their stock returns. Although both the high ESG-performance portfolios, as well as the low ESG-performance portfolios display nega-tive alphas, high-ESG-performance lead to a less negative return. Since this difference is not sig-nificant, no arbitrage opportunity arises. I interpret these findings as supportive of the Efficient Markets Hypothesis.
Table of Contents
Statement of Originality .................................................................................................. 2
Acknowledgement ........................................................................................................... 3
Abstract ............................................................................................................................ 4
Table of Contents ............................................................................................................ 5
1 Introduction .......................................................................................................... 6
2 Literature Review ................................................................................................. 9
3 Hypotheses ......................................................................................................... 18
3.1 Hypothesis 1: Shunned stocks hypothesis ............................................................. 18
3.2 Hypothesis 2: Errors in expectations hypothesis ................................................... 18
4 Methodological Approach and Data ................................................................ 19
4.1 Approach .............................................................................................................. 19
4.2 Methodology ........................................................................................................ 19
4.3 Data Preparation ................................................................................................... 214.3.1 Index .................................................................................................................... 21
4.4 Computation of Performance ............................................................................... 234.4.1 Further Selection .................................................................................................. 25
5 Results ................................................................................................................. 27
6 Robustness Check .............................................................................................. 31
6.1 Percentiles ............................................................................................................ 31
7 Conclusion .......................................................................................................... 39
References ...................................................................................................................... 40
Appendix ........................................................................................................................ 44
1 Introduction In recent decades the concept of Socially Responsible Investing (SRI) – also called Responsible
Investment (RI) – has become highly relevant for a large number of investors and enjoys increas-
ing attention in academic literature (Derwall et al., 2011; Sievänen et al., 2013). Driven by climate
change in general, and environmental catastrophes such as oils spills1 and nuclear disasters2 in
particular, environmental issues have become a prominent topic in contemporary societies chal-
lenging global politics to confront environmental concerns (Bauer and Hann, 2010). In addition
to legislation as a driving force, it has been the effort of international institutions and their initia-
tives to raise consumers’ and investors’ awareness of responsibility as market participants in gen-
eral (Renneboog et al., 2008). International conventions such as the United Nations Global
Compact (UNGC) and the United Nations Principles for Responsible Investment (PRI) for ex-
ample provide investors with guidelines for their SRI practices and encourage commitment to
them (Della Croce et al., 2011). Apart from these drivers, Porter and Kramer (2006) highlight
reputational concerns that, in the 1990s, forced many companies to integrate particular environ-
mental, social, and governance (ESG) issues that had not previously been part of their business
responsibility.
Despite being a popular trend, there remains no consensus on a specific definition of SRI. Ac-
cording to the European Social Investment Forum (Eurosif, 2016), SRI can be understood as a
long-term oriented approach to investing that aims to incorporate environmental, social and gov-
ernance (ESG) factors into investment decisions.3 ESG factors are also commonly referred to as
corporate social responsibility (CSR4) criteria in economics literature5.
As outlined by the PRI (2015), ESG investing is an investment approach that aims for better risk
management and higher sustainability in long-term returns.
1 For example, the Exxon Valdez (1989) and Deepwater Horizon oil spills (2010). 2 For example, the Chernobyl (1986) and Fukushima nuclear disasters (2011). 3More fully, Eurosif understands SRI to be ‘a long-term oriented investment approach, which integrates ESG factors
in the research, analysis and selection process of securities within an investment portfolio. It combines funda-mental analysis and engagement with an evaluation of ESG factors in order to better capture long term returns for investors, and to benefit society by influencing the behaviour of companies’ (2016). European SRI Study, p.9.
4 Renneboog et al. (2008) define CSR as corporate decisions that foster social and corporate governance as well as ethical and environmental issues.
5 ‘SRI relates to CSR because socially responsible investors essentially evaluate companies’ CSR characteristics to determine the social responsibility level of their investment portfolios.’ (Derwall et al., 2011).
The European SRI Study (Eurosif, 2016) highlights the rising tendency to SRI engagement. The
report underlines the fact that increasing numbers of investors take on both direct and indirect
costs in order to achieve a certain level of ESG compliance. While SRI was initially undertaken by
retail investors, institutional investors have become its main drivers since the 1980s (Sievänen et
al, 2013). From 1995 to 2010, the volume of assets under management (AuM) that follow SRI
strategies grew by 380% while the broader universe of professionally managed assets grew by
only 260% (Nofsinger and Varma, 2014). During the last two years, SRI investing in the United
States alone has grown by more than 33%. Last year, nearly 22% of the total AuM in the US were
involved in SRI (USSIF, 2016). In 2015, nearly 50% of AuM globally were managed by institu-
tional investors who were signatories to the PRI (PRI 2015) and committed themselves to inte-
grate ESG criteria in their investment process. In 2016, the number of these signatories reached
more than 1440 (Henke 2016) with total AuM of about $60 trillion (Amel-Zadeh and Serafeim,
2017). As of today, the principles have about 1780 signatories6.
Since 1970, more than 2000 studies have been published on this matter, yet, to this date, empiri-
cal analyses have not led to a shared conclusion, and the debate on the effect of ESG criteria on
corporate financial performance has continued (CFP) (Friede et al 2015)7.
This master’s thesis aims to contribute to the existing literature by analysing the effect of ESG
compliance on stock returns. In this paper, ESG compliance on ESG performance scores are
proxied and expected returns are calculated with the help of the capital asset pricing model
(CAPM). While other studies have focused solely on one particular ESG component8, this paper
investigates not only social, but environmental and governance related aspects as well. A compa-
ny might have a commendable governance structure but lack eco-friendliness or social perfor-
mance. It is of great interest to examine a company’s performance on all SRI aspects. This work
employs ESG performance scores determined by the ESG research provider MSCI ESG KLD
STATS. Based on each company’s individual ESG performance, hypothetical portfolios are con-
structed in order to compare financial performance both in a single factor framework (CAPM) as
well as in a multifactor framework based on Carhart (1997). To prove robustness of this work,
the data is partitioned into different percentiles and investigated on each ESG pillar separately.
Moreover, the sample is analysed regarding its distribution of industries. As some sectors might
show a higher sensitivity to certain ESG issues, this information will contribute to a robustness
6 United Nations Principles for Responsible Investing, https://www.unpri.org/directory/ . 7 Also see Table 1 for diverse results. 8 E.g. Gompers et al. (2003) focus on governance; Derwall et al. (2005) focus on environmental issues; Derwall et al.
(2011) focus on (the social component of) employee satisfaction. See Table 1 for other examples.
analysis. Derwall et al. (2005) define six environmentally sensitive sectors9 which are included in
my robustness check.
It is concluded that ESG investing displays negative alphas in both the simple CAPM framework
and the multifactor framework based on Carhart (1997). This effect is significant at the 0.1%
level. Surprisingly, not only the portfolio with high ESG ratings, but also that with low ESG rat-
ings, negative alphas. Nevertheless, the difference in returns is not significant, dementing the idea
of a riskless trading strategy. The results support both positive and negative views on ESG in-
vesting, that is, both the low-ranked and the high-ranked ESG portfolios performs badly. My
suggestion is that merely a balanced portfolio is the right strategy to follow, supporting the Effi-
cient Market Hypothesis. The results hold true even after applying the before-mentioned robust-
ness checks.
This thesis is organised as indicated in what follows. The most relevant literature is reviewed in
the second chapter of this thesis. A brief overview of SRI practices, from their early stages to
their current state, contributes to a greater understanding of the subject, and is followed by the
display of market efficiency as a focal point of the SRI debate. Starting from the macro-level and
leading on towards a more detailed perspective, different theories on the positive and negative
channels of SRI are presented.
The third chapter concerns the two contrary hypotheses of 1) shunned stocks, and 2) errors in
expectations.
In chapter 4, the methodological approach of the research is illustrated, followed by an elabora-
tion of the underlying data and its preparation.
In the fifth chapter, the results of this study are presented. Additional robustness checks are pro-
vided in the sixth chapter. Finally, in the seventh chapter the approach of this thesis in general as
well as its results, are components of the discussion and are tied to a conclusion.
The appendix provides detailed information regarding the performance indicators being used in
the ESG index.
9 Electric utilities, chemistry, metal, mining, aerospace & defence and petroleum.
2 Literature Review The intention of this thesis is to contribute to the existing research in several ways. At a broad
level, it is based in the field of SRI. This was historically a niche sector, being purely ethically
based (Richardson and Cragg, 2010; Renneboog et al., 2008). A simple approach was taken with a
straightforward negative screening, excluding shareholdings in companies that were considered
unethical (Sparkes and Cowton, 2004). As SRI investors differ in their ethical norms (De Colle
and York, 2009), negative screening in its contemporary state displays different levels of strictness
and is applied to a variety of businesses. Referred to as the second-generation of screens, portfo-
lios are also based on positive screens where shares with superior ESG performance are selected.
The basis of this analysis is formed by the so-called third-generation screening. It entails the con-
sideration of both negative and positive ESG criteria into the investment decisions. (Renneboog
et al., 2008).
At a micro level, this thesis intends to contribute towards filling the gap in research on the effect
of SRI on stock returns, which up to the present has not yet led to consistent results. This is illus-
trated by Aktas et al. (2011), who covered the ongoing debate between institutional investors on
whether ESG investing results in financial benefits.
According to Modern Portfolio Theory, SRI practices are claimed to be oppositional and to
shrink investment opportunities. In his 1970 Efficient Market Theory, Eugene Fama asserted that
in an efficient market all available information is “fully reflected” in stock prices (Fama 1970)10.
Since Fama’s assertion is linked to a theoretical equilibrium where (I) transaction costs are non-
existent, (II) all market players have equal access to all information available and (III) have ho-
mogenous expectations of future stock prices. It remains an unachievable ideal, however, it func-
tions as a theoretical benchmark in academic research.
From an ESG investor perspective and in subsequent general opinion, the first assumption (i) can be disregarded as ESG investors do not face different transaction costs compared to conven-tional investors as both rely on the same restricted investment universe. Renneboog et al. (2008) mention the possibility of different management fees being charged by mutual funds. Gil-Bazo et al. (2010) empirically investigated whether SRI funds charge higher fees than mutual funds as a result of potential extra costs for SRI screenings. The authors found no conclusive evidence. Re-garding the second assumption (ii), it is argued that ESG information is not ‘costless’ and simul-taneously available to all market participants. ESG data available free of charge is generally wholly
10 Later Fama (1995) changed this assertion to a ‘good estimate of a stock’s intrinsic value’.
qualitative and is considered to be incomplete and inconsistent due to its dependence on volun-tary reporting (Park and Lavenel (2013). The integration of ESG data into investment decisions relies on the services of third-party ESG data providers (e.g. MSCI ESG Research, EIRIS Ltd., Sustainalytics) that collect and quantify this ESG information which they charge certain fees for. On this account ESG information comes with certain price and is not simultaneously available to all investors. Therefore, the third assumption (iii) regarding homogenous expectations is also challenged. Proponents of SRI refer to described information advantage as an argument for mar-ket inefficiency which allows opportunities for exploitation by ESG investors (e.g. Sparkes 2002).
This discussion is fuelled by contrary results concerning the direct effects of ESG investing. One
of the earliest studies on SRI by Alexander and Bucholz (1978) defends the efficiency of stock
markets as described by Fama (1970). The authors used social responsibility rankings and applied
Jensen’s (1968) capital asset-pricing model to measure stock performance on a risk-adjusted basis.
In order to investigate the potential effect of social responsibility on security risk, rank-order cor-
relations between social responsibility and risk were calculated. Their results indicated a low in-
significant correlation. Based on their measurements, the authors state that new information rele-
vant to earnings outlook is immediately reflected by current stock prices and declare that any
effects of SRI are non-existent.
Another common argument against research supportive of ESG investing is the potential for
endogeneity through reverse causality. It is often disputable whether SRI increases financial per-
formance or if successful companies are more willing to engage in SRI because they possess the
resources to do so (Fisher-Vanden and Thorburn, 2011). El Ghoul et al (2011) name two differ-
ent hypotheses regarding causal direction. The good management hypothesis holds that enhanced
CSR improves a firm’s relationship with its key stakeholders and leads to better financial perfor-
mance. Their slack resource hypothesis, on the other hand, claims that improved financial per-
formance leads to resource slack which allows firms to invest in and improve CSR. To ensure the
robustness of their results, El Ghoul et al. employed instrumental variables-estimation method
and use lagged values as an independent variable in their regression model.
Moreover, Langbein and Posner (1980) provide conventional arguments in opposition to ESG
compliance which focus on indirect ESG costs as lacking diversification opportunities and in-
creasing risk due to the exclusionary approach of ESG compliance.
Further contrary results were found in another study about exclusionary practices by Hong and
Kacperczyk (2009). The authors attest that negative screening involves certain costs due to a lack
of diversification. Yet, these costs are considered rather small as there are few excluded stocks in
the stocks universe. The authors analyse the investing environment of publicly traded stocks in-
volved in tobacco alcohol and gambling – also known as sin stocks11. Investigating the ownership
structure of these stocks, they found that sin stocks’ cost of capital is affected by their neglect by
institutional investors. The paper argues that fewer sin stocks are held by institutions that are
exposed to ‘social norm pressure due to the public nature’ of their businesses and their diverse
constituencies. The authors list institutions such as pension funds, universities, religious organisa-
tions, banks and insurance companies as among these institutions. Their results indicate that sin
stocks are relatively cheap when benchmarked against comparable stocks as their market-to-
book, price-to-earnings and price-to-EBITDA ratios are significantly smaller than their compara-
bles'(see Table 1). Surprisingly, the application of the Carhart (1997) model results in US stocks
outperforming comparable stocks by 26 basis points per month, or 3.1% per year relative to
comparable stocks(21basis points per month or 2.5% per year for European stocks). Hong and
Kacperczyk (2009) imply that higher stock returns can be seen as compensation for future litiga-
tion costs since sin stocks face substantial litigation risk.
On the other hand, Moskowitz (1972) considers companies with solid corporate social perfor-
mance (CSP) more likely to show high financial performance. Following his argument, socially
aware management will also possess the requisite skills to run a successful business resulting in
equivalent financial performance. Increased environmental and social performance in particular
are identified as an indication of management quality (Fombrun and Shanley ,1990).
Employing a more comprehensive view/wider focus on ESG issues, Galema et al. (2008) take
into account the overall CSR performance of stocks. They use ESG scores from KLD Research
and Analytics, Inc12 that are partitioned into six different themes13 and find SRI firms’ valuation
ratios to be 15-20% lower than those of comparable stocks (see Table 1). Their research indicates
that only diversity, environment and product performance to have a significant impact. A long-
short investment strategy with community-strength and -concern portfolios yields an alpha of
3.4% per year.
According to Porter and Kramer (2006), another potentially positive effect of CSR on risk is
linked to reputation. Since potential reputational damage constitutes a factual threat to firm value,
the authors recognise CSR practices as generating reputational benefits and consider them as an
important factor in risk management. McGuire et al. (1988) acknowledge a potential reputational
11 Note: Hong and Kacperczyk focused on tobacco, alcohol and gambling, but did not include companies involved
in adult entertainment since there were very few publicly traded companies that were relevant. The authors also omitted the defence industry since it was not clear for them whether it is considered ‘sinful’. Instead they added companies from the Fama and French (1997) industry grouping ‘guns’ to their robustness analyses.
12 Today known as MSCI ESG KLD STATS 13 Community involvement, corporate governance, diversity, employee relations, environment and product.
upswing from social and environmental efforts that can better a firm’s access to finance. Another
study by Cahan et al. (2005) also highlights the reputational channel but refutes an absolute ef-
fect. Their findings point out the importance of media favourability due to the significant interac-
tion between this and CSR performance. The research concludes that only in cases of favourable
media coverage can high CSR performance can to higher firm value or lower cost of capital.
This view is also supported by studies focusing on the social dimension of ESG compliance,
more precisely on employee related issues. Edmans (2011) conducted a study based on an em-
ployee survey by Levering and Moskowitz (1993) and investigated the financial effects of em-
ployee satisfaction. His findings demonstrate a positive relationship with stock returns. Edmans’
multifactor regressions lead to significant alphas (see Table 1) for high employee-satisfaction
portfolios and therefore highlight the benefit of employee relations as a component of social
ESG screens. Nevertheless, the authors note that the implications of their findings are unclear for
future stock returns. Since intangibles are difficult to incorporate into stocks prices, it remains an
open question whether the market will learn about the positive correlation resulting in it to dis-
appearing in the long run. A study by Derwall et al. (2011) that fills this research gap shares the
argument of underestimated ESG issues. Edmans’ research focus is summarised and referred to
as the errors-in-expectations hypothesis. The authors investigated and compared it with the
shunned-stock hypothesis based on the work of Heinkel (2001) and Hong and Kacperczyk
(2009). Derwall et al. (2011) studied the outperformance of socially-strong stock portfolios with
high employee-ratings as well as the outperformance of controversial sin stocks. Their findings
confirm the temporary nature of errors-in-expectations, as both portfolios demonstrate superior
returns but strong-employee stocks outperform only in the short-run and yield no significant
alphas in an expanded examination period. A crucial part of the study is the breakdown of SRI
investors into values-oriented versus profit-oriented ones which provides a theoretical foundation
for both hypotheses.
While the academic literature used to have a homogenous understanding of an SRI investor –
one who grounds his investment decisions solely in social and personal values – Derwall et at.
demand attention on another type of market player, the profit-seeking SRI investor. This inves-
tor’s approach integrates ESG issues but still conforms to traditional wealth-maximising goals.
Furthermore, the consideration of environmental criteria into investment decisions can have pos-
itive effects as the findings of Derwall et al. (2005) indicate. The authors use the eco-efficiency
ratings of US companies in order to construct equity portfolios. They found that best-in-class14
stocks outperform worst-in-class stocks by 6 percentage points per year during 1997-2003. Aktas
et al. (2011) found evidence for the value creation of SRI within a mergers and acquisitions
framework. They identify the environmental and social performance of a target firm as having a
positive influence on the acquiring firm’s cumulative abnormal return (CAR). The authors reject
the idea of SRI as a value-destroying action that makes socially responsible firms more common
targets for disciplinary take-overs. According to Aktas et al., value creation for acquirer share-
holders does not originate in over-investment in SRI by the target company. Rather, the acquirer
learns from and adapts to the target’s SRI practices and experience.
Shifting back to the stock market, Nofsinger and Varma (2014) computed return alphas for SRI
mutual funds in non-crisis and crisis periods. They document the outperformance of socially re-
sponsible mutual funds during periods of market crises – at the cost of underperformance during
non-crisis periods. The authors consider SRI funds as an attractive investment option for down-
side-risk protection due to the asymmetry of these returns. Henke (2016) investigated the finan-
cial impact of ESG screening on corporate bond funds and claims to provide further evidence
for market inefficiency and mispriced ESG risks. His results confirm the beneficial effects of
CSR activities that lead to a reduction of corporate risks for investors. SRI funds are observed to
be especially successful during market declines and therefore constitute an attractive investment
for long-term investors. Overall, Henke supports the mitigation of ESG risks in bond portfolios
and found no evidence of a trade-off between SRI and financial objectives. He identifies worst-
in-class exclusion as a better implementation of ESG information rather than a best-in-class
screening.
Given this ongoing dispute on the effectiveness of ESG investing, this thesis fills a research gap
in that it provides a more comprehensive investigation through analysing recent ESG compliance
data from 2013-2015. While the abovementioned studies focus solely on one particular ESG
component15, this paper investigates the combination of social, environmental and governance-
related aspects together.
My findings are supportive on both views of ESG investing. On the one hand, I find that both
high and low ESG-performance portfolios display negative alphas, but that high ESG-
performance lead to a less negative return. This is an interesting result and could indicate that
14 When using the terms “best-in-class” and “worst-in-class” the literature refers to investment portfolios that are
based on the ESG performance of companies that exhibit the best and respectively worst ESG ratings within a sample (Nagy et al (2013)
15 E.g. Gompers et al. (2003) focus on governance; Derwall et al. (2005) focus on environmental issues; Derwall et al. (2011) focus on employee satisfaction (social component). See Table 1 for other examples.

neither of these ‘extremes’, but rather a well-balanced portfolio leads to positive alphas. Whether
this is the case, is subject to future research.
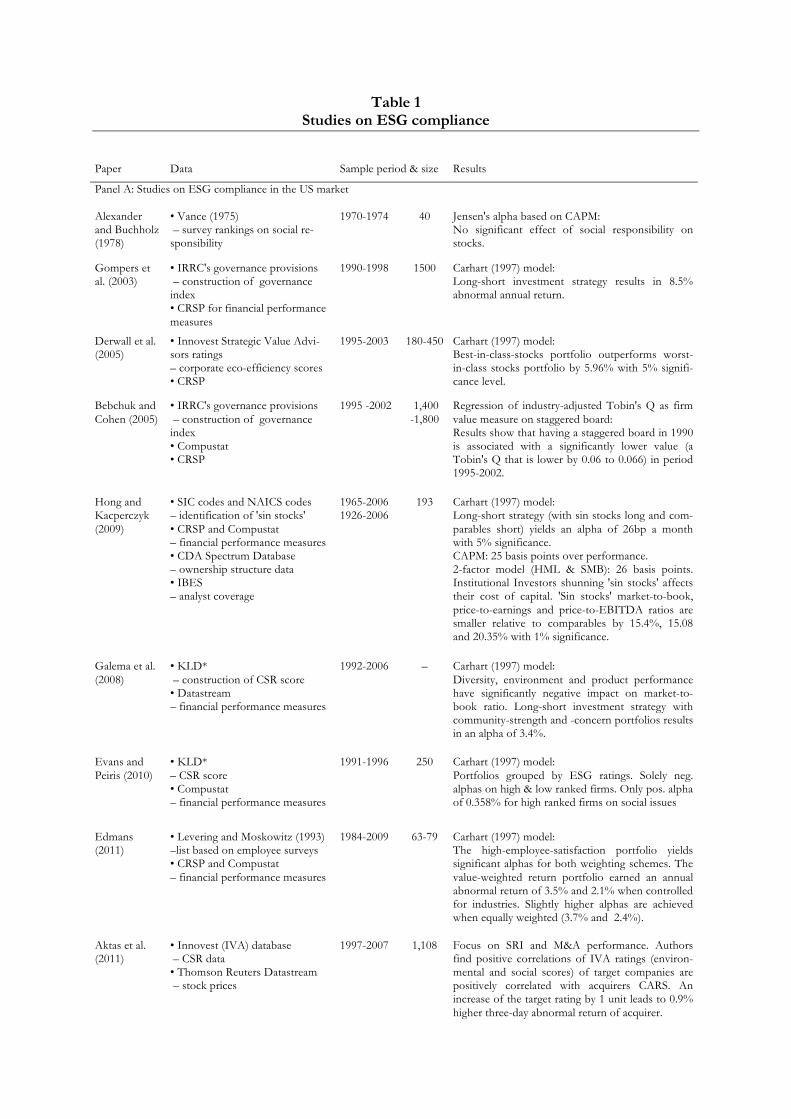
Table 1 Studies on ESG compliance
Paper Data Sample period & size Results
Panel A: Studies on ESG compliance in the US market Alexander and Buchholz (1978)
• Vance (1975) – survey rankings on social re-sponsibility
1970-1974 40 Jensen's alpha based on CAPM: No significant effect of social responsibility on stocks.
Gompers et al. (2003)
• IRRC's governance provisions – construction of governance index • CRSP for financial performance measures
1990-1998 1500 Carhart (1997) model: Long-short investment strategy results in 8.5% abnormal annual return.
Derwall et al. (2005)
• Innovest Strategic Value Advi-sors ratings – corporate eco-efficiency scores • CRSP
1995-2003 180-450 Carhart (1997) model: Best-in-class-stocks portfolio outperforms worst-in-class stocks portfolio by 5.96% with 5% signifi-cance level.
Bebchuk and Cohen (2005)
• IRRC's governance provisions – construction of governance index • Compustat • CRSP
1995 -2002 1,400 -1,800
Regression of industry-adjusted Tobin's Q as firm value measure on staggered board: Results show that having a staggered board in 1990 is associated with a significantly lower value (a Tobin's Q that is lower by 0.06 to 0.066) in period 1995-2002.
Hong and Kacperczyk (2009)
• SIC codes and NAICS codes – identification of 'sin stocks' • CRSP and Compustat – financial performance measures • CDA Spectrum Database – ownership structure data • IBES – analyst coverage
1965-2006 1926-2006
193 Carhart (1997) model: Long-short strategy (with sin stocks long and com-parables short) yields an alpha of 26bp a month with 5% significance. CAPM: 25 basis points over performance. 2-factor model (HML & SMB): 26 basis points. Institutional Investors shunning 'sin stocks' affects their cost of capital. 'Sin stocks' market-to-book, price-to-earnings and price-to-EBITDA ratios are smaller relative to comparables by 15.4%, 15.08 and 20.35% with 1% significance.
Galema et al. (2008)
• KLD* – construction of CSR score • Datastream – financial performance measures
1992-2006 – Carhart (1997) model: Diversity, environment and product performance have significantly negative impact on market-to-book ratio. Long-short investment strategy with community-strength and -concern portfolios results in an alpha of 3.4%.
Evans and Peiris (2010)
• KLD* – CSR score • Compustat – financial performance measures
1991-1996 250 Carhart (1997) model: Portfolios grouped by ESG ratings. Solely neg. alphas on high & low ranked firms. Only pos. alpha of 0.358% for high ranked firms on social issues
Edmans (2011)
• Levering and Moskowitz (1993) –list based on employee surveys • CRSP and Compustat – financial performance measures
1984-2009 63-79 Carhart (1997) model: The high-employee-satisfaction portfolio yields significant alphas for both weighting schemes. The value-weighted return portfolio earned an annual abnormal return of 3.5% and 2.1% when controlled for industries. Slightly higher alphas are achieved when equally weighted (3.7% and 2.4%).
Aktas et al. (2011)
• Innovest (IVA) database – CSR data • Thomson Reuters Datastream – stock prices
1997-2007 1,108 Focus on SRI and M&A performance. Authors find positive correlations of IVA ratings (environ-mental and social scores) of target companies are positively correlated with acquirers CARS. An increase of the target rating by 1 unit leads to 0.9% higher three-day abnormal return of acquirer.
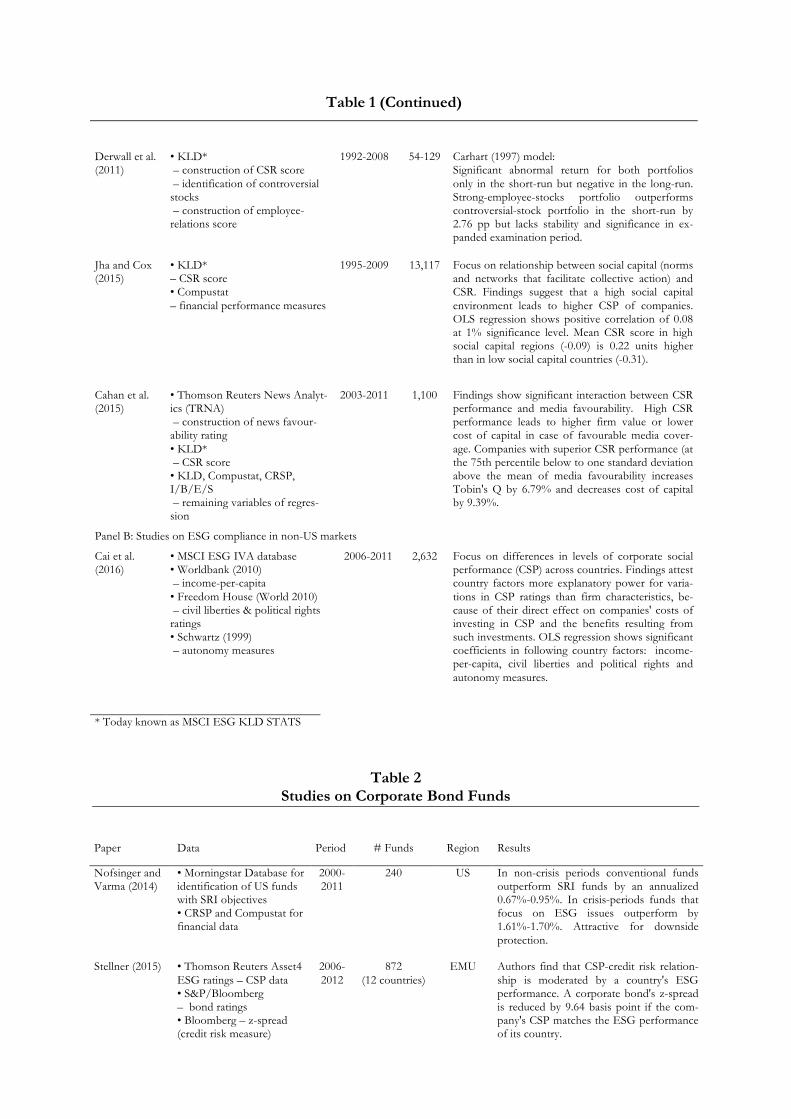
Table 1 (Continued)
Derwall et al. (2011)
• KLD* – construction of CSR score – identification of controversial stocks – construction of employee-relations score
1992-2008 54-129 Carhart (1997) model: Significant abnormal return for both portfolios only in the short-run but negative in the long-run. Strong-employee-stocks portfolio outperforms controversial-stock portfolio in the short-run by 2.76 pp but lacks stability and significance in ex-panded examination period.
Jha and Cox (2015)
• KLD* – CSR score • Compustat – financial performance measures
1995-2009 13,117 Focus on relationship between social capital (norms and networks that facilitate collective action) and CSR. Findings suggest that a high social capital environment leads to higher CSP of companies. OLS regression shows positive correlation of 0.08 at 1% significance level. Mean CSR score in high social capital regions (-0.09) is 0.22 units higher than in low social capital countries (-0.31).
Cahan et al. (2015)
• Thomson Reuters News Analyt-ics (TRNA) – construction of news favour-ability rating • KLD* – CSR score • KLD, Compustat, CRSP, I/B/E/S – remaining variables of regres-sion
2003-2011 1,100 Findings show significant interaction between CSR performance and media favourability. High CSR performance leads to higher firm value or lower cost of capital in case of favourable media cover-age. Companies with superior CSR performance (at the 75th percentile below to one standard deviation above the mean of media favourability increases Tobin's Q by 6.79% and decreases cost of capital by 9.39%.
Panel B: Studies on ESG compliance in non-US markets
Cai et al. (2016)
• MSCI ESG IVA database • Worldbank (2010) – income-per-capita • Freedom House (World 2010) – civil liberties & political rights ratings • Schwartz (1999) – autonomy measures
2006-2011 2,632 Focus on differences in levels of corporate social performance (CSP) across countries. Findings attest country factors more explanatory power for varia-tions in CSP ratings than firm characteristics, be-cause of their direct effect on companies' costs of investing in CSP and the benefits resulting from such investments. OLS regression shows significant coefficients in following country factors: income-per-capita, civil liberties and political rights and autonomy measures.
* Today known as MSCI ESG KLD STATS
Table 2 Studies on Corporate Bond Funds
Paper Data Period # Funds Region Results
Nofsinger and Varma (2014)
• Morningstar Database for identification of US funds with SRI objectives • CRSP and Compustat for financial data
2000-2011
240 US In non-crisis periods conventional funds outperform SRI funds by an annualized 0.67%-0.95%. In crisis-periods funds that focus on ESG issues outperform by 1.61%-1.70%. Attractive for downside protection.
Stellner (2015) • Thomson Reuters Asset4 ESG ratings – CSP data • S&P/Bloomberg – bond ratings • Bloomberg – z-spread (credit risk measure)
2006-2012
872 (12 countries)
EMU Authors find that CSP-credit risk relation-ship is moderated by a country's ESG performance. A corporate bond's z-spread is reduced by 9.64 basis point if the com-pany's CSP matches the ESG performance of its country.

Table 2 (Continued) Henke (2016) • Sustainalytics
– ESG ratings • CRSP – financial performance measures (US sample) • Bloomberg – financial performance measures (Eurozone)
2001-2014
412 total (103 SRI)
US & Eurozone
Focus: Impact analysis of ESG screening on corporate bond funds via application of five-factor model: Annual alphas of SRI funds outperform conventional funds in US by 0.33%, in Eurozone by 0.49%. Findings support hypotheses of misprized ESG risks and corporate risk reduction through CSR activities. SRI funds' especially successful during market declines, thus attractive for long-term investors. Mitigation of ESG risk in bond portfolios leads to no trade-off between SRI and financial objectives. Conclusion: worst-in-class exclusion as a better strategy rather than best-in-class screening.
3 Hypotheses This thesis examines stock performance of firms based on their CSR level. My intention is to
compare two conflicting hypotheses in this field, the “shunned stocks hypothesis” and the “er-
rors in expectations hypothesis” which will be further explained in the following.
Hypothesis 1: Shunned stocks hypothesis
Hypothesis 1 suggests that socially controversial stocks show superior returns. This is due to the
fact that values-driven investors avoid these stocks and therefor push their prices, ceteris paribus,
below responsible stocks’. This hypothesis is based on Hong and Kacperczyk (2009) who state
that “sin stocks” are neglected by institutional investors, making these stocks relatively cheap. I
extend their scope of work by not only investigating stocks that are active in the fields of alcohol,
tobacco and gambling, but all stocks and their corresponding CSR rating. To evidence superior
returns in controversial stocks, I am looking at differences in alphas in the CAPM model (simple
and extended). I expect positive alphas for socially controversial stocks for this hypothesis to
hold true.
Hypothesis 2: Errors in expectations hypothesis
On the other hand, hypothesis 2 suggests that socially responsible stocks show higher risk-
adjusted returns due to a certain market inefficiency regarding the recognition of CSR practices.
Stocks of companies with higher ESG performance show lower risk and those of low ESG per-
formance show higher risk. This hypothesis is more in line with the works of Edmans (2011) and
Pantzalis and Park (2009). Similar to hypothesis 1, a difference in alphas in the CAPM model will
show whether socially responsible stocks show higher risk-adjusted returns. This would be ob-
servable in positive alphas for this type of stocks.
4 Methodological Approach and Data
Approach
This research conducts an analysis based on data provided by Morgan Stanley Capital Interna-
tional (MSCI) ESG Research. MSCI ESG Research is a widely accepted provider of in-depth
ESG research, ratings and indices. Its services are profit based, hence its index with the distinc-
tion from AAA to CCC ratings is not fully available for the research purpose of this study. In-
stead, it is aimed to use company specific ESG ratings from MSCI ESG KLD STATS provided
through WHARTON data base. This dataset consists of companies’ individual ESG scores which
amount to 36,000 observations and will be used to scale ESG compliance. The MSCI ESG KLD
STATS offers various variables indicating environmental, social and governance performance. In
order to proxy ESG performance, 34 performance indicators (see appendix) are picked based on
37 ESG key issues, originating from the three pillars Environment, Social and Governance. Re-
spective performance indicators are selected in accordance to the methodology of MSCI ESG
Research (ESG Ratings Methodology Executive Summary, Feb 2017). Each key issue is a binary
score and represents either a positive or negative performance indicator. In line with MSCI
methodology, positive and negative attributes will be summed to arrive at an overall ESG score,
where a positive indicator adds a point and negative one subtracts a point (Statman 2005). Fur-
ther it is aimed to construct portfolios consisting of the highest and lowest ESG performance
deciles and mimic an investment strategy that buys the high-ESG portfolio and sells the one with
low ESG scores in order to investigate whether this strategy generates abnormal stock returns.
Financial variables of respective companies are based on CSRP-Data, also available through
WHARTON data base. The list of respective companies from MSCI ESG KLD STATS is
merged with CRSP stock information. All ESG data is based on the time period 2013-2015.
Methodology
In the first step, the portfolio performance is measured through the Capital Asset Pricing Model
(CAPM) in order to account for differentials in the portfolios’ market risks. An ordinary least-
squares regression is used for estimation of the model:
𝑅"# − 𝑅%# = 𝛼" + 𝛽"(𝑅+# − 𝑅%#) + 𝜀"#

where 𝑅"# = return on portfolio 𝑖 in month 𝑡 𝑅%# = one month U.S. T-bill rate at 𝑡 𝑅+# = return on a value weighted market proxy in month 𝑡 𝜀"# = an error term
The market proxy and risk-free rate are available at the Kenneth French Data Library16. The
model beta, 𝛽" , is interpreted a measure of a portfolio’s market-risk exposure, and Jensen’s alpha,
𝛼" , constitutes the average abnormal return in excess of the return of the market proxy. The un-
derlying assumption of this framework is that the alpha is an accurate estimate of risk-adjusted
performance.
In the second step, the portfolios are analysed within Carhart’s (1997) multifactor framework that
controls not only for market but also size, book-to-market and momentum effects. It is con-
structed using Fama and French’s (1993) three-factor model adding Jagadeesh and Titman’s
(1993) one-year momentum anomaly
𝑅"# = 𝛼" + 𝛽0"𝑅𝑀𝑅𝐹#34 + 𝛽4"𝑆𝑀𝐵"#–4 + 𝛽8"𝐻𝑀𝐿"#–4 + 𝛽;"𝑀𝑜𝑚𝑒𝑛𝑡𝑢𝑚"#–# + 𝜀"#
where Rit is the monthly return on a portfolio in excess to a monthly risk free rate; RMRFt-1 is the
excess return on a value-weighted aggregate market proxy; and SMB (small-minus-big), HML
(high-minus-low) and Momentum are returns on zero investment factor-mimicking portfolios for
size, book-to-market-equity, and one-year momentum in stock returns (Gompers et al. 2003)17. α
is the most important variable and is used to measure over performance. This model will be used
to compare portfolios with different levels of ESG compliance. The differences in alpha esti-
mates between entities or rather portfolios with high and low ESG scores indicate whether rat-
ings contribute to excess returns.
Financial Data is obtained via WRDS from CRSP Monthly Stock. The monthly returns for each
stock are calculated according to following equation
𝑟"# = 𝑙𝑛(𝑃𝑟𝑖𝑐𝑒"4)−𝑙𝑛(𝑃𝑟𝑖𝑐𝑒"#34)
By using log returns the calculations achieve more numerical stability and statistical significance 16 Available at mba.tuck.dartmouth.edu/pages/faculty/ken.french/data_library.html, or through WRDS. 17 For details of the construction of SMB and HML, see Fama and French (1993). Momentum is constructed accord-ing to Carhart (1997) as the equal-weight average of firms with the highest 30 percent eleven-month returns lagged one month minus the equal-weight average of firms with the lowest 30 percent eleven-month returns lagged one month.
than with arithmetic returns.
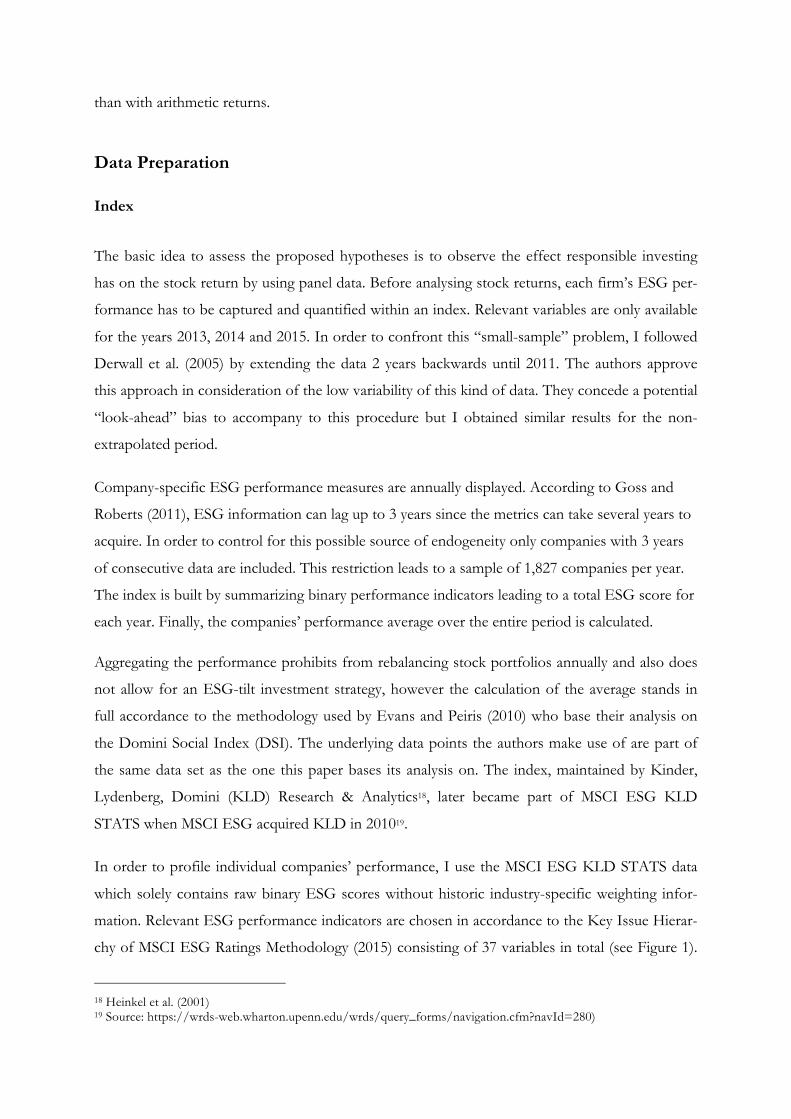
Data Preparation
Index
The basic idea to assess the proposed hypotheses is to observe the effect responsible investing
has on the stock return by using panel data. Before analysing stock returns, each firm’s ESG per-
formance has to be captured and quantified within an index. Relevant variables are only available
for the years 2013, 2014 and 2015. In order to confront this “small-sample” problem, I followed
Derwall et al. (2005) by extending the data 2 years backwards until 2011. The authors approve
this approach in consideration of the low variability of this kind of data. They concede a potential
“look-ahead” bias to accompany to this procedure but I obtained similar results for the non-
extrapolated period.
Company-specific ESG performance measures are annually displayed. According to Goss and
Roberts (2011), ESG information can lag up to 3 years since the metrics can take several years to
acquire. In order to control for this possible source of endogeneity only companies with 3 years
of consecutive data are included. This restriction leads to a sample of 1,827 companies per year.
The index is built by summarizing binary performance indicators leading to a total ESG score for
each year. Finally, the companies’ performance average over the entire period is calculated.
Aggregating the performance prohibits from rebalancing stock portfolios annually and also does
not allow for an ESG-tilt investment strategy, however the calculation of the average stands in
full accordance to the methodology used by Evans and Peiris (2010) who base their analysis on
the Domini Social Index (DSI). The underlying data points the authors make use of are part of
the same data set as the one this paper bases its analysis on. The index, maintained by Kinder,
Lydenberg, Domini (KLD) Research & Analytics18, later became part of MSCI ESG KLD
STATS when MSCI ESG acquired KLD in 201019.
In order to profile individual companies’ performance, I use the MSCI ESG KLD STATS data
which solely contains raw binary ESG scores without historic industry-specific weighting infor-
mation. Relevant ESG performance indicators are chosen in accordance to the Key Issue Hierar-
chy of MSCI ESG Ratings Methodology (2015) consisting of 37 variables in total (see Figure 1).
18 Heinkel et al. (2001) 19 Source: https://wrds-web.wharton.upenn.edu/wrds/query_forms/navigation.cfm?navId=280)
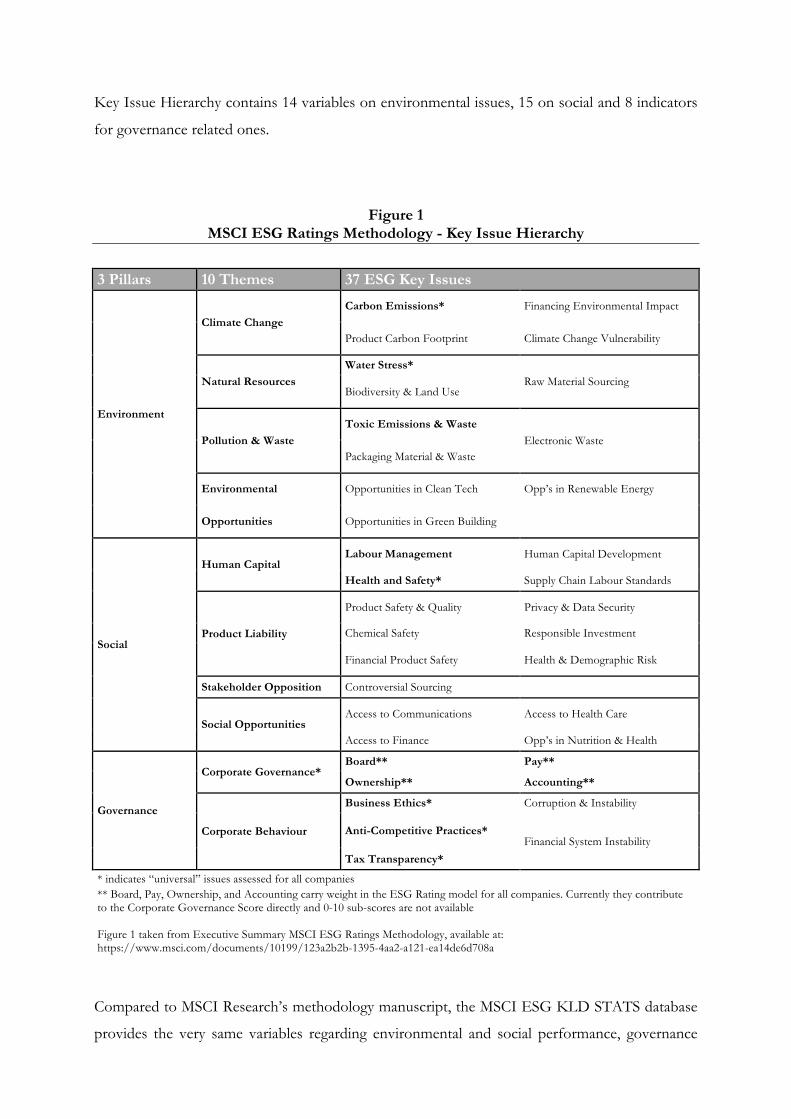
Key Issue Hierarchy contains 14 variables on environmental issues, 15 on social and 8 indicators
for governance related ones.
Figure 1 MSCI ESG Ratings Methodology - Key Issue Hierarchy
3 Pillars 10 Themes 37 ESG Key Issues
Environment
Climate Change Carbon Emissions* Financing Environmental Impact
Product Carbon Footprint Climate Change Vulnerability
Natural Resources Water Stress*
Raw Material Sourcing Biodiversity & Land Use
Pollution & Waste Toxic Emissions & Waste
Electronic Waste Packaging Material & Waste
Environmental Opportunities in Clean Tech Opp’s in Renewable Energy
Opportunities Opportunities in Green Building
Social
Human Capital Labour Management Human Capital Development
Health and Safety* Supply Chain Labour Standards
Product Liability
Product Safety & Quality Privacy & Data Security
Chemical Safety Responsible Investment
Financial Product Safety Health & Demographic Risk
Stakeholder Opposition Controversial Sourcing
Social Opportunities Access to Communications Access to Health Care
Access to Finance Opp’s in Nutrition & Health
Governance
Corporate Governance* Board** Pay**
Ownership** Accounting**
Corporate Behaviour
Business Ethics* Corruption & Instability
Anti-Competitive Practices* Financial System Instability
Tax Transparency*
* indicates “universal” issues assessed for all companies ** Board, Pay, Ownership, and Accounting carry weight in the ESG Rating model for all companies. Currently they contribute to the Corporate Governance Score directly and 0-10 sub-scores are not available Figure 1 taken from Executive Summary MSCI ESG Ratings Methodology, available at: https://www.msci.com/documents/10199/123a2b2b-1395-4aa2-a121-ea14de6d708a
Compared to MSCI Research’s methodology manuscript, the MSCI ESG KLD STATS database
provides the very same variables regarding environmental and social performance, governance
related variables, however differ from the Ratings Methodology with the exception of 2 indica-
tors. Since MSCI uses a separate in-house index for governance related issues, there is no full
disclosure in the database (see Figure 1). In order to circumvent this lack of information, 4 gov-
ernance variables were picked from the dataset featuring similarities with the Key Issue Hierar-
chy. After dropping variables with unusable data my index results in 34 variables in total - 14
environmental, 15 social and 6 governance-related variables with 4 governance variables as well
as 1 social variable being negatively defined.
Computation of Performance
Every company is described by 34 binary variables that are 0 or 1. Usually a 1 represents extraor-
dinary efforts regarding an ESG issue. For example, the variable Recycling is defined as an indica-
tion for extraordinary efforts related to recycling and therefore minimizing one’s environmental
footprint. If a company is attested with a 0 regarding this indicator, that does not conclude pollu-
tion or negligence in recycling but neutrality. Missing values are therefore treated as neutral and
respectively 0. For negatively defined variables the underlying data is also binary but have to de-
ducted when summarised. Labour Standards for example is defined as an indication of controver-
sies related to the safety of a firm’s employees and therefore has to be deducted from a compa-
ny’s overall performance if the underlying data is equal to 1. Since the number of governance
variables is underrepresented and mostly negatively defined, their inclusion could skew the index
results. Yet, representative results are not endangered since computation is performed for envi-
ronmental, social and governance indicators separately. Summary statistics are provided for all 3
years as well as for the average of the total period.

Table 3 Summary Statistics ESG Performance 34 Variables
Performance Aspect Obs Mean Std. Dev. Min Max
2013 Environmental 1827 0,27 0,63 0,00 4,00
Social 1827 0,21 0,53 -1,00 5,00
Governance 1827 -0,07 0,31 -4,00 0,00
Environmental Social Governance 1827 0,40 0,92 -2,00 8,00
2014 Environmental 1827 0,30 0,72 0,00 5,00
Social 1827 0,23 0,55 -1,00 5,00
Governance 1827 -0,07 0,31 -4,00 0,00
Environmental Social Governance 1827 0,45 0,98 -2,00 8,00
2015 Environmental 1827 0,35 0,80 0,00 5,00
Social 1827 0,28 0,60 -1,00 5,00
Governance 1827 -0,08 0,31 -3,00 0,00
Environmental Social Governance 1827 0,55 1,08 -2,00 7,00
2013-2015 (average) Environmental 1827 0,30 0,67 0,00 4,67
Social 1827 0,24 0,50 -1,00 5,00
Governance 1827 -0,08 0,28 -3,67 0,00
Environmental Social Governance 1827 0,47 0,92 -2,00 7,67
2011-2015 (average) Environmental 1827 0,30 0,66 0,00 4,60
Social 1827 0,23 0,50 -1,00 5,00
Governance 1827 -0,08 0,28 -3,80 0,00
Environmental Social Governance 1827 0,45 0,91 -2,00 7,80
Further Selection
With the objective of increased quality of computed results, variables were eliminated with re-
spect to their explanatory power. A flaw in the data set is that a lot of variables have missing val-
ues which can lead to diluted results. In order to make the analysis justifiable, I picked 18 out of
the 34 variables which have a reliable amount of values (dropped variables have more than 90%
of missing values). Reviewing these hand-picked variables showed that there are 6 environmental,
6 social (1 negatively defined) and 4 governance related (1 negatively defined) variables left. Hav-
ing all three ESG pillars covered, as well as all ten ESG themes, I conclude that the picked varia-
bles are representative, given that all “universal” issues are included in the analysis The distribu-
tion of this new sample does not change significantly. The remaining variables are Carbon Emis-
sions (env_str_d), Energy Efficiency (env_str_o), Water Stress (env_str_h), Raw Material Sourc-
ing (env_str_j), Toxic Emissions & and Waste (env_str_b), Beneficial Products & Services
(env_str_a), Health & Safety Strength (emp_str_g), Health & Safety Concern (emp_con_b), Hu-
man Capital Management (emp_str_l), Quality (pro_str_a), Chemical Product Safety (pro_str_g),
Privacy & Data Security (pro_str_i), Access to Capital (pro_str_d), Executive Compensation
(cgov_con_k), Controversial Investments (cgov_con_l), Business Ethics (cgov_con_m), Antitrust
(pro_con_e) and Other Concerns (cgov_con_x), disregarded variables are Product Carbon Foot-
print (env_str_p), Financing Environmental Impact (env_str_k), Climate Change Vulnerability
(env_str_q), Biodiversity & Land Use (env_str_i), Recycling (env_str_c), Electronic Waste
(env_str_n) Green Buildings (env_str_l), Renewable Energy (env_str_m), Financial Product Safe-
ty (pro_str_h), Responsible Investment (pro_str_j), Health & Demographic Risk (pro_str_k),
Controversial Sourcing (emp_str_n), Access to Communications (pro_str_e), Benefits to Eco-
nomically Disadvantaged (pro_str_c) and Opportunities in Nutrition & Health(pro_str_f).
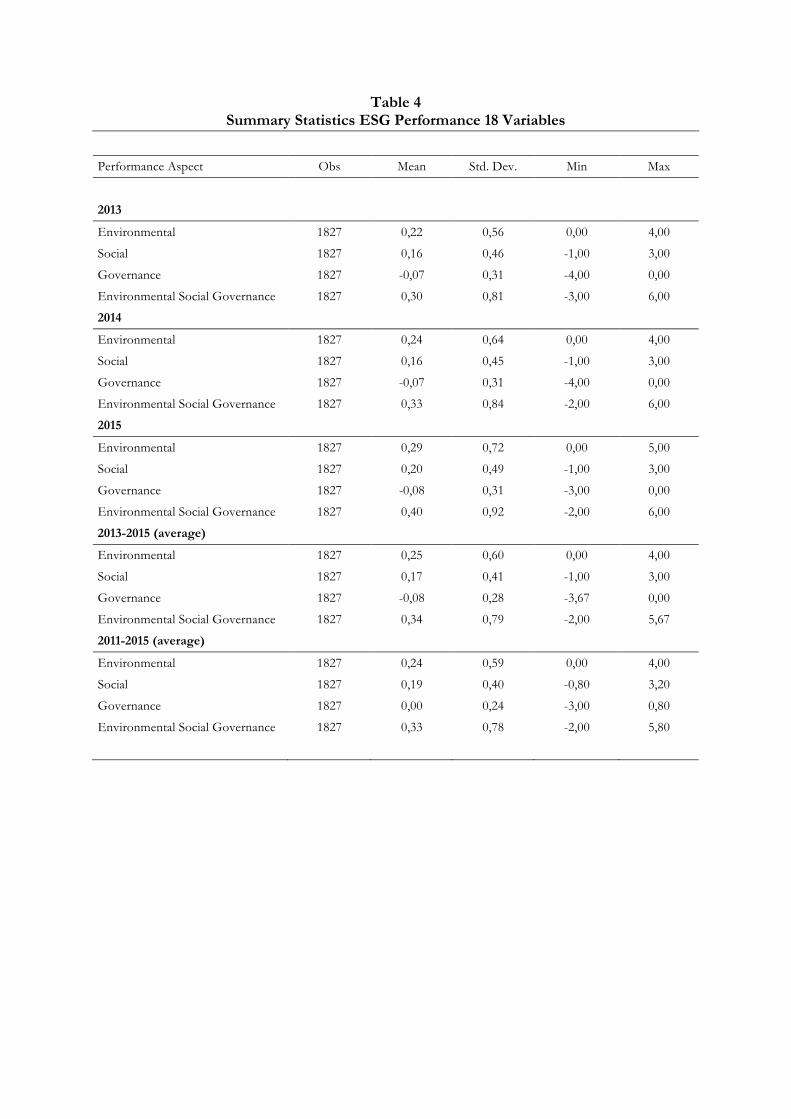
Table 4 Summary Statistics ESG Performance 18 Variables
Performance Aspect Obs Mean Std. Dev. Min Max
2013 Environmental 1827 0,22 0,56 0,00 4,00
Social 1827 0,16 0,46 -1,00 3,00
Governance 1827 -0,07 0,31 -4,00 0,00
Environmental Social Governance 1827 0,30 0,81 -3,00 6,00
2014 Environmental 1827 0,24 0,64 0,00 4,00
Social 1827 0,16 0,45 -1,00 3,00
Governance 1827 -0,07 0,31 -4,00 0,00
Environmental Social Governance 1827 0,33 0,84 -2,00 6,00
2015 Environmental 1827 0,29 0,72 0,00 5,00
Social 1827 0,20 0,49 -1,00 3,00
Governance 1827 -0,08 0,31 -3,00 0,00
Environmental Social Governance 1827 0,40 0,92 -2,00 6,00
2013-2015 (average) Environmental 1827 0,25 0,60 0,00 4,00
Social 1827 0,17 0,41 -1,00 3,00
Governance 1827 -0,08 0,28 -3,67 0,00
Environmental Social Governance 1827 0,34 0,79 -2,00 5,67
2011-2015 (average) Environmental 1827 0,24 0,59 0,00 4,00
Social 1827 0,19 0,40 -0,80 3,20
Governance 1827 0,00 0,24 -3,00 0,80
Environmental Social Governance 1827 0,33 0,78 -2,00 5,80
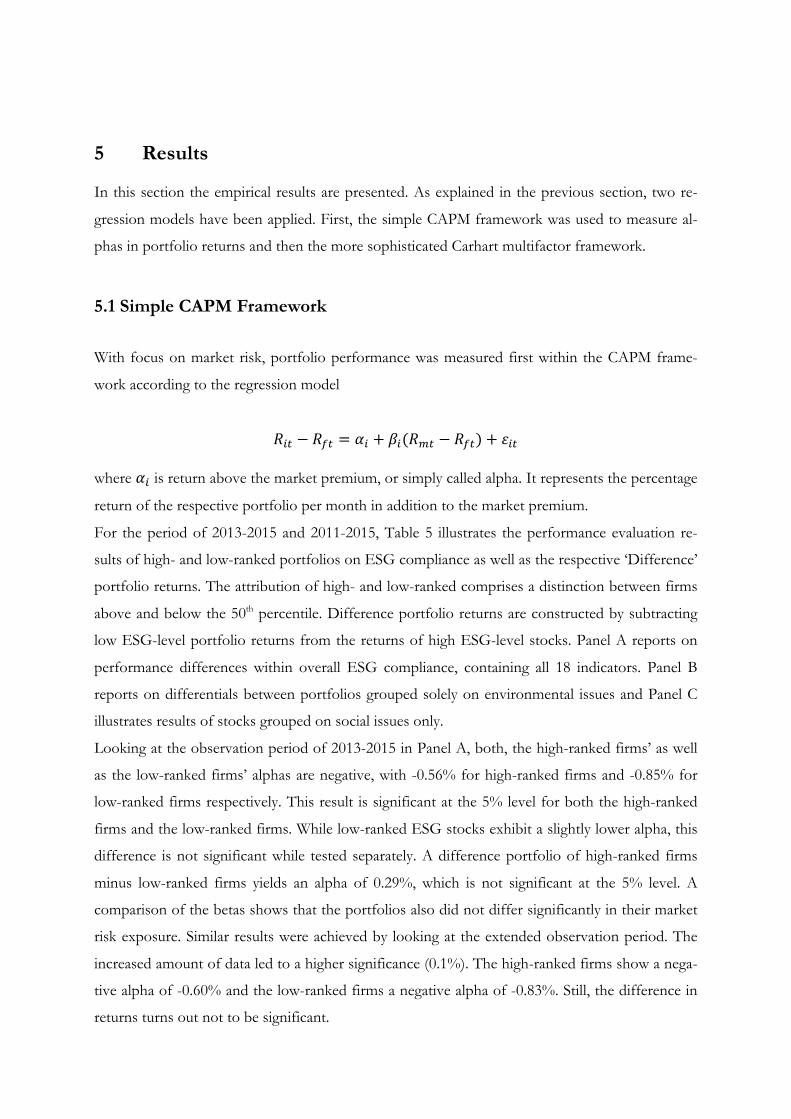
5 Results In this section the empirical results are presented. As explained in the previous section, two re-
gression models have been applied. First, the simple CAPM framework was used to measure al-
phas in portfolio returns and then the more sophisticated Carhart multifactor framework.
5.1 Simple CAPM Framework
With focus on market risk, portfolio performance was measured first within the CAPM frame-
work according to the regression model
𝑅"# − 𝑅%# = 𝛼" + 𝛽"(𝑅+# − 𝑅%#) + 𝜀"# where 𝛼" is return above the market premium, or simply called alpha. It represents the percentage
return of the respective portfolio per month in addition to the market premium.
For the period of 2013-2015 and 2011-2015, Table 5 illustrates the performance evaluation re-
sults of high- and low-ranked portfolios on ESG compliance as well as the respective ‘Difference’
portfolio returns. The attribution of high- and low-ranked comprises a distinction between firms
above and below the 50th percentile. Difference portfolio returns are constructed by subtracting
low ESG-level portfolio returns from the returns of high ESG-level stocks. Panel A reports on
performance differences within overall ESG compliance, containing all 18 indicators. Panel B
reports on differentials between portfolios grouped solely on environmental issues and Panel C
illustrates results of stocks grouped on social issues only.
Looking at the observation period of 2013-2015 in Panel A, both, the high-ranked firms’ as well
as the low-ranked firms’ alphas are negative, with -0.56% for high-ranked firms and -0.85% for
low-ranked firms respectively. This result is significant at the 5% level for both the high-ranked
firms and the low-ranked firms. While low-ranked ESG stocks exhibit a slightly lower alpha, this
difference is not significant while tested separately. A difference portfolio of high-ranked firms
minus low-ranked firms yields an alpha of 0.29%, which is not significant at the 5% level. A
comparison of the betas shows that the portfolios also did not differ significantly in their market
risk exposure. Similar results were achieved by looking at the extended observation period. The
increased amount of data led to a higher significance (0.1%). The high-ranked firms show a nega-
tive alpha of -0.60% and the low-ranked firms a negative alpha of -0.83%. Still, the difference in
returns turns out not to be significant.
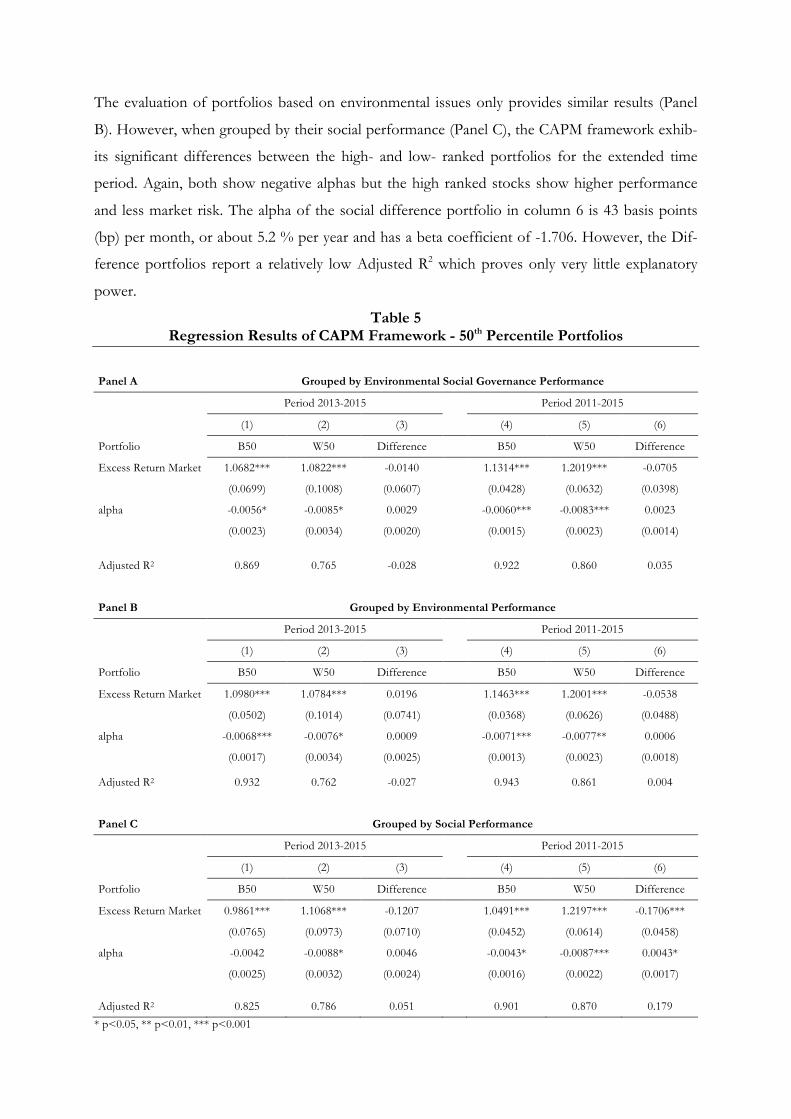
The evaluation of portfolios based on environmental issues only provides similar results (Panel
B). However, when grouped by their social performance (Panel C), the CAPM framework exhib-
its significant differences between the high- and low- ranked portfolios for the extended time
period. Again, both show negative alphas but the high ranked stocks show higher performance
and less market risk. The alpha of the social difference portfolio in column 6 is 43 basis points
(bp) per month, or about 5.2 % per year and has a beta coefficient of -1.706. However, the Dif-
ference portfolios report a relatively low Adjusted R2 which proves only very little explanatory
power.
Table 5 Regression Results of CAPM Framework - 50th Percentile Portfolios
Panel A Grouped by Environmental Social Governance Performance
Period 2013-2015 Period 2011-2015
(1) (2) (3) (4) (5) (6)
Portfolio B50 W50 Difference B50 W50 Difference
Excess Return Market 1.0682*** 1.0822*** -0.0140 1.1314*** 1.2019*** -0.0705
(0.0699) (0.1008) (0.0607) (0.0428) (0.0632) (0.0398)
alpha -0.0056* -0.0085* 0.0029 -0.0060*** -0.0083*** 0.0023
(0.0023) (0.0034) (0.0020) (0.0015) (0.0023) (0.0014) Adjusted R2 0.869 0.765 -0.028 0.922 0.860 0.035
Panel B Grouped by Environmental Performance
Period 2013-2015 Period 2011-2015
(1) (2) (3) (4) (5) (6)
Portfolio B50 W50 Difference B50 W50 Difference
Excess Return Market 1.0980*** 1.0784*** 0.0196 1.1463*** 1.2001*** -0.0538
(0.0502) (0.1014) (0.0741) (0.0368) (0.0626) (0.0488)
alpha -0.0068*** -0.0076* 0.0009 -0.0071*** -0.0077** 0.0006
(0.0017) (0.0034) (0.0025) (0.0013) (0.0023) (0.0018)
Adjusted R2 0.932 0.762 -0.027 0.943 0.861 0.004
Panel C Grouped by Social Performance
Period 2013-2015 Period 2011-2015
(1) (2) (3) (4) (5) (6)
Portfolio B50 W50 Difference B50 W50 Difference
Excess Return Market 0.9861*** 1.1068*** -0.1207 1.0491*** 1.2197*** -0.1706***
(0.0765) (0.0973) (0.0710) (0.0452) (0.0614) (0.0458)
alpha -0.0042 -0.0088* 0.0046 -0.0043* -0.0087*** 0.0043*
(0.0025) (0.0032) (0.0024) (0.0016) (0.0022) (0.0017)
Adjusted R2 0.825 0.786 0.051 0.901 0.870 0.179
* p<0.05, ** p<0.01, *** p<0.001
5.2 Multifactor regression
Next to the simple CAPM framework, the Carhart model was applied to measure portfolio per-
formance according to the regression model
𝑅"# = 𝛼" + 𝛽0"𝑅𝑀𝑅𝐹#34 + 𝛽4"𝑆𝑀𝐵"#–4 + 𝛽8"𝐻𝑀𝐿"#–4 + 𝛽;"𝑀𝑜𝑚𝑒𝑛𝑡𝑢𝑚"#–# + 𝜀"#
where 𝛼" is still the return above the market premium and shows the percentage return of the
respective portfolio per month in addition to the market premium.
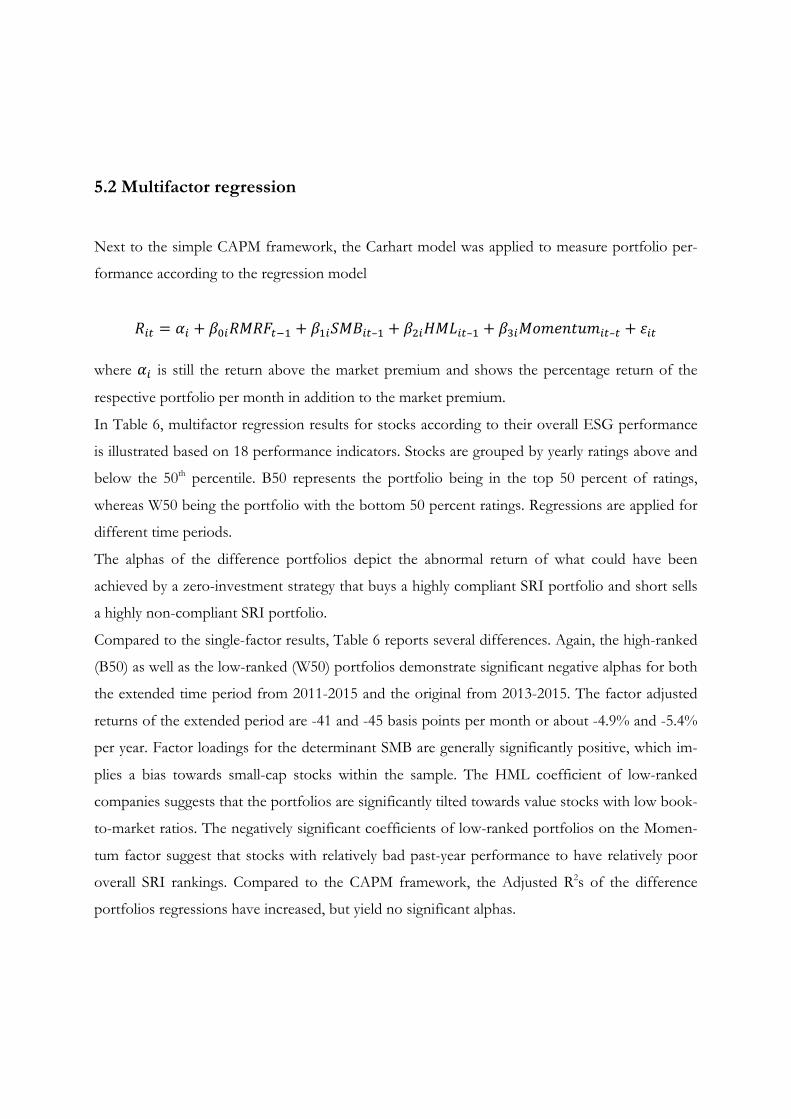
In Table 6, multifactor regression results for stocks according to their overall ESG performance
is illustrated based on 18 performance indicators. Stocks are grouped by yearly ratings above and
below the 50th percentile. B50 represents the portfolio being in the top 50 percent of ratings,
whereas W50 being the portfolio with the bottom 50 percent ratings. Regressions are applied for
different time periods.
The alphas of the difference portfolios depict the abnormal return of what could have been
achieved by a zero-investment strategy that buys a highly compliant SRI portfolio and short sells
a highly non-compliant SRI portfolio.
Compared to the single-factor results, Table 6 reports several differences. Again, the high-ranked
(B50) as well as the low-ranked (W50) portfolios demonstrate significant negative alphas for both
the extended time period from 2011-2015 and the original from 2013-2015. The factor adjusted
returns of the extended period are -41 and -45 basis points per month or about -4.9% and -5.4%
per year. Factor loadings for the determinant SMB are generally significantly positive, which im-
plies a bias towards small-cap stocks within the sample. The HML coefficient of low-ranked
companies suggests that the portfolios are significantly tilted towards value stocks with low book-
to-market ratios. The negatively significant coefficients of low-ranked portfolios on the Momen-
tum factor suggest that stocks with relatively bad past-year performance to have relatively poor
overall SRI rankings. Compared to the CAPM framework, the Adjusted R2s of the difference
portfolios regressions have increased, but yield no significant alphas.
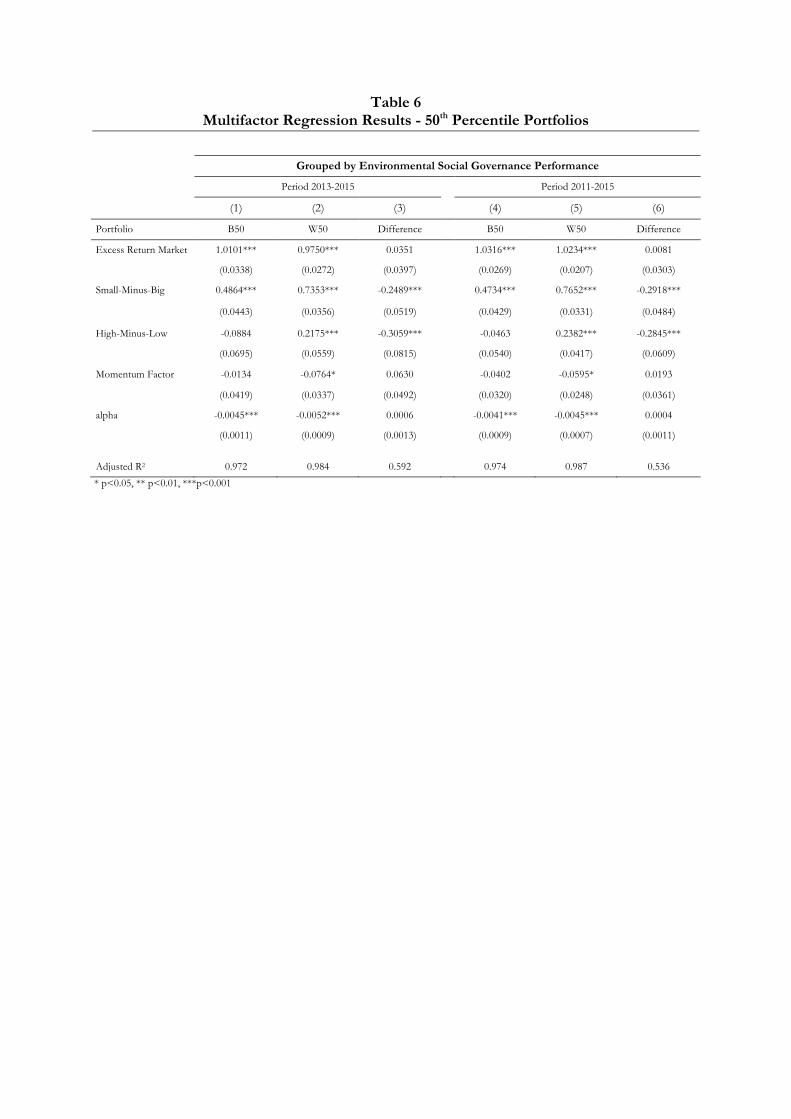
Table 6 Multifactor Regression Results - 50th Percentile Portfolios
Grouped by Environmental Social Governance Performance
Period 2013-2015 Period 2011-2015
(1) (2) (3) (4) (5) (6)
Portfolio B50 W50 Difference B50 W50 Difference
Excess Return Market 1.0101*** 0.9750*** 0.0351 1.0316*** 1.0234*** 0.0081
(0.0338) (0.0272) (0.0397) (0.0269) (0.0207) (0.0303)
Small-Minus-Big 0.4864*** 0.7353*** -0.2489*** 0.4734*** 0.7652*** -0.2918***
(0.0443) (0.0356) (0.0519) (0.0429) (0.0331) (0.0484)
High-Minus-Low -0.0884 0.2175*** -0.3059*** -0.0463 0.2382*** -0.2845***
(0.0695) (0.0559) (0.0815) (0.0540) (0.0417) (0.0609)
Momentum Factor -0.0134 -0.0764* 0.0630 -0.0402 -0.0595* 0.0193
(0.0419) (0.0337) (0.0492) (0.0320) (0.0248) (0.0361)
alpha -0.0045*** -0.0052*** 0.0006 -0.0041*** -0.0045*** 0.0004
(0.0011) (0.0009) (0.0013) (0.0009) (0.0007) (0.0011)
Adjusted R2 0.972 0.984 0.592 0.974 0.987 0.536 * p<0.05, ** p<0.01, ***p<0.001
6 Robustness Check
6.1 Percentiles
Chapter 5 illustrated the performance evaluation results of high- and low-ranked portfolios on
ESG compliance as well as the respective "Difference” portfolio returns through distinction be-
tween firms above and below 50th percentile. As this is a merely rough split, I furthermore inves-
tigate into the more “extreme” companies, namely the stocks in the 1st percentile and stocks in
the 5th percentile.
In Table 7, multifactor regression results for stocks according to their overall ESG performance
is illustrated based on 18 performance indicators. Stocks are grouped by yearly ratings above and
below the 1st percentile. B1 represents the portfolio being in the top 1 percent of ratings, whereas
W1 being the portfolio with the bottom 1 percent ratings. Regressions are applied for different
time periods.
The alphas of the difference portfolios depict the abnormal return of what could have been
achieved by a zero-investment strategy that buys a highly compliant SRI portfolio and short sells
a highly non-compliant SRI portfolio.
The high-ranked (B1) portfolio shows positive, insignificant alphas, the low-ranked (W1) portfo-
lios demonstrate significant negative alphas for the time period of 2013-2015. For the extended
time period from 2011-2015 the factor adjusted returns are -10 and -71 basis points per month or
about -1.2% and -8.5% per year. Except for the determinant Momentum, factor loadings are
generally insignificant. The Difference portfolios do not achieve significant returns, supporting
the findings of chapter 5.
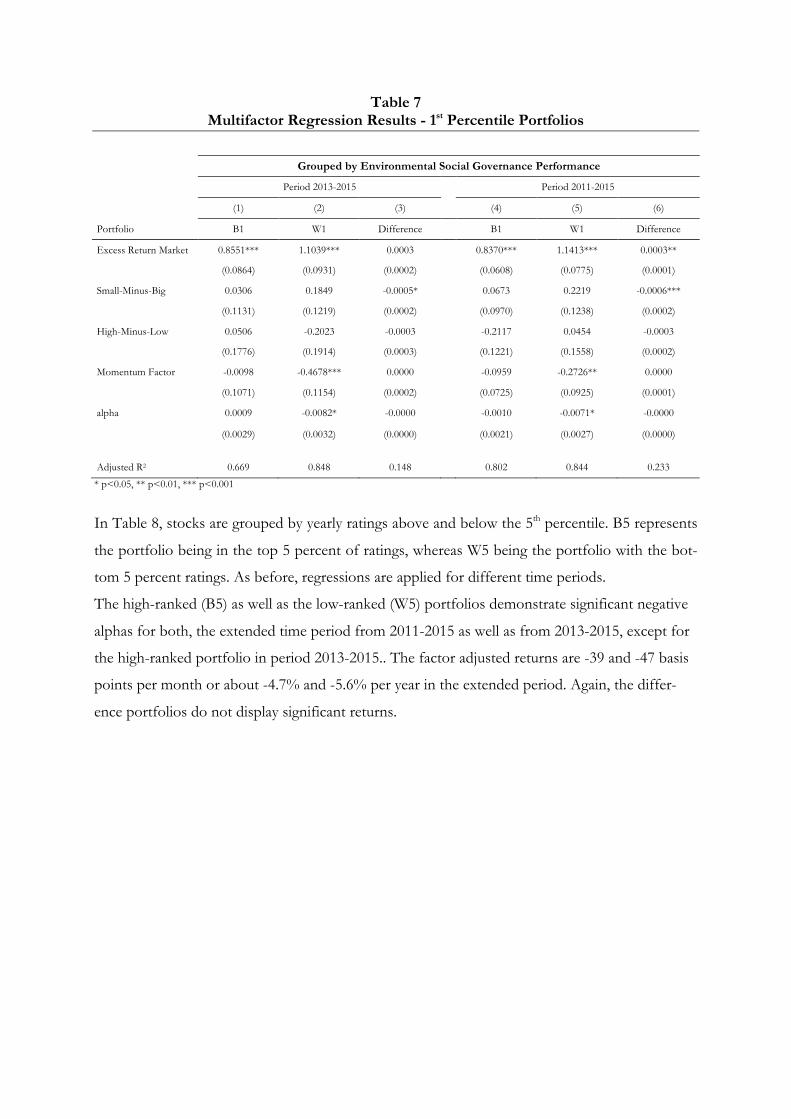
Table 7 Multifactor Regression Results - 1st Percentile Portfolios
Grouped by Environmental Social Governance Performance
Period 2013-2015 Period 2011-2015
(1) (2) (3) (4) (5) (6)
Portfolio B1 W1 Difference B1 W1 Difference
Excess Return Market 0.8551*** 1.1039*** 0.0003 0.8370*** 1.1413*** 0.0003**
(0.0864) (0.0931) (0.0002) (0.0608) (0.0775) (0.0001)
Small-Minus-Big 0.0306 0.1849 -0.0005* 0.0673 0.2219 -0.0006***
(0.1131) (0.1219) (0.0002) (0.0970) (0.1238) (0.0002)
High-Minus-Low 0.0506 -0.2023 -0.0003 -0.2117 0.0454 -0.0003
(0.1776) (0.1914) (0.0003) (0.1221) (0.1558) (0.0002)
Momentum Factor -0.0098 -0.4678*** 0.0000 -0.0959 -0.2726** 0.0000
(0.1071) (0.1154) (0.0002) (0.0725) (0.0925) (0.0001)
alpha 0.0009 -0.0082* -0.0000 -0.0010 -0.0071* -0.0000
(0.0029) (0.0032) (0.0000) (0.0021) (0.0027) (0.0000)
Adjusted R2 0.669 0.848 0.148 0.802 0.844 0.233
* p<0.05, ** p<0.01, *** p<0.001
In Table 8, stocks are grouped by yearly ratings above and below the 5th percentile. B5 represents
the portfolio being in the top 5 percent of ratings, whereas W5 being the portfolio with the bot-
tom 5 percent ratings. As before, regressions are applied for different time periods.
The high-ranked (B5) as well as the low-ranked (W5) portfolios demonstrate significant negative
alphas for both, the extended time period from 2011-2015 as well as from 2013-2015, except for
the high-ranked portfolio in period 2013-2015.. The factor adjusted returns are -39 and -47 basis
points per month or about -4.7% and -5.6% per year in the extended period. Again, the differ-
ence portfolios do not display significant returns.
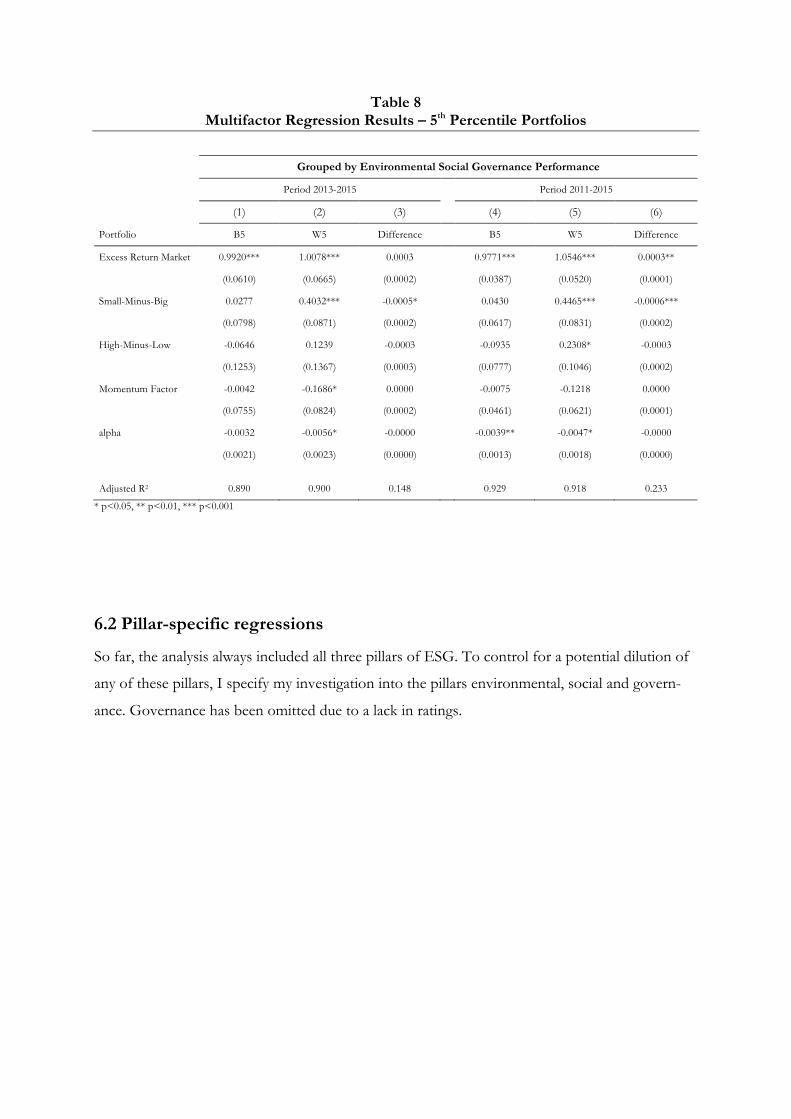
Table 8 Multifactor Regression Results – 5th Percentile Portfolios
Grouped by Environmental Social Governance Performance
Period 2013-2015 Period 2011-2015
(1) (2) (3) (4) (5) (6)
Portfolio B5 W5 Difference B5 W5 Difference
Excess Return Market 0.9920*** 1.0078*** 0.0003 0.9771*** 1.0546*** 0.0003**
(0.0610) (0.0665) (0.0002) (0.0387) (0.0520) (0.0001)
Small-Minus-Big 0.0277 0.4032*** -0.0005* 0.0430 0.4465*** -0.0006***
(0.0798) (0.0871) (0.0002) (0.0617) (0.0831) (0.0002)
High-Minus-Low -0.0646 0.1239 -0.0003 -0.0935 0.2308* -0.0003
(0.1253) (0.1367) (0.0003) (0.0777) (0.1046) (0.0002)
Momentum Factor -0.0042 -0.1686* 0.0000 -0.0075 -0.1218 0.0000
(0.0755) (0.0824) (0.0002) (0.0461) (0.0621) (0.0001)
alpha -0.0032 -0.0056* -0.0000 -0.0039** -0.0047* -0.0000
(0.0021) (0.0023) (0.0000) (0.0013) (0.0018) (0.0000)
Adjusted R2 0.890 0.900 0.148 0.929 0.918 0.233
* p<0.05, ** p<0.01, *** p<0.001
6.2 Pillar-specific regressions
So far, the analysis always included all three pillars of ESG. To control for a potential dilution of
any of these pillars, I specify my investigation into the pillars environmental, social and govern-
ance. Governance has been omitted due to a lack in ratings.
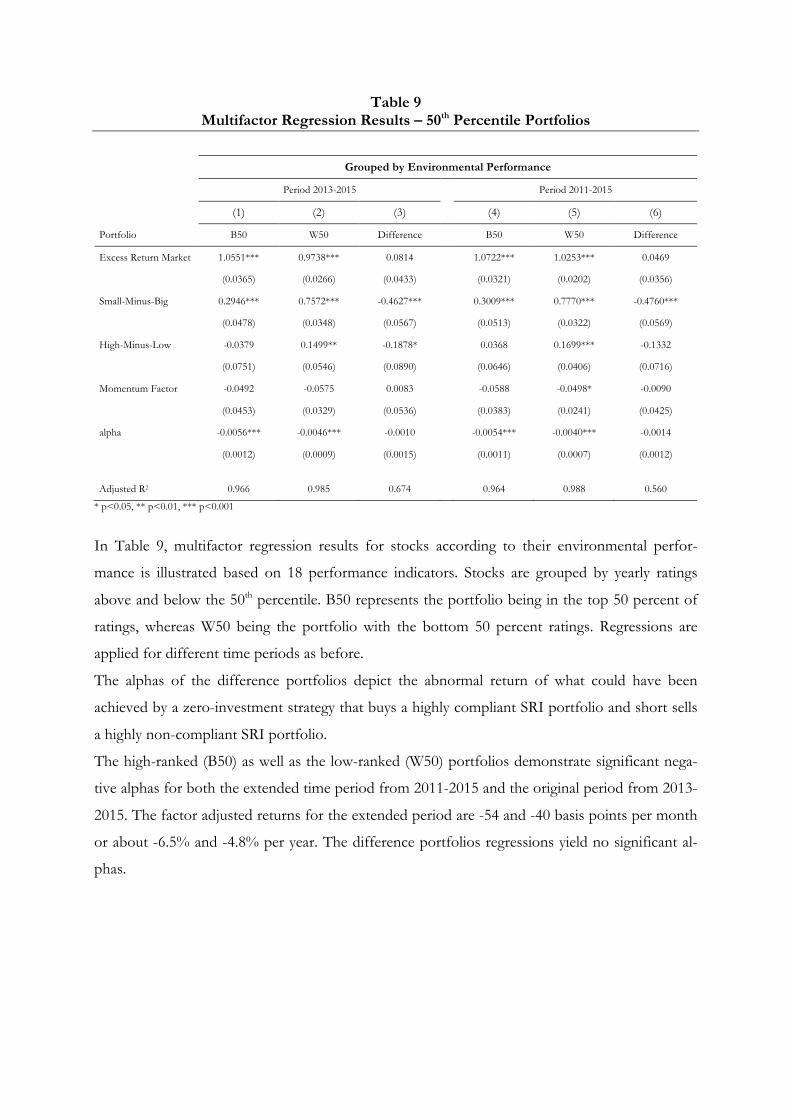
Table 9 Multifactor Regression Results – 50th Percentile Portfolios
Grouped by Environmental Performance
Period 2013-2015 Period 2011-2015
(1) (2) (3) (4) (5) (6)
Portfolio B50 W50 Difference B50 W50 Difference
Excess Return Market 1.0551*** 0.9738*** 0.0814 1.0722*** 1.0253*** 0.0469
(0.0365) (0.0266) (0.0433) (0.0321) (0.0202) (0.0356)
Small-Minus-Big 0.2946*** 0.7572*** -0.4627*** 0.3009*** 0.7770*** -0.4760***
(0.0478) (0.0348) (0.0567) (0.0513) (0.0322) (0.0569)
High-Minus-Low -0.0379 0.1499** -0.1878* 0.0368 0.1699*** -0.1332
(0.0751) (0.0546) (0.0890) (0.0646) (0.0406) (0.0716)
Momentum Factor -0.0492 -0.0575 0.0083 -0.0588 -0.0498* -0.0090
(0.0453) (0.0329) (0.0536) (0.0383) (0.0241) (0.0425)
alpha -0.0056*** -0.0046*** -0.0010 -0.0054*** -0.0040*** -0.0014
(0.0012) (0.0009) (0.0015) (0.0011) (0.0007) (0.0012)
Adjusted R2 0.966 0.985 0.674 0.964 0.988 0.560
* p<0.05, ** p<0.01, *** p<0.001
In Table 9, multifactor regression results for stocks according to their environmental perfor-
mance is illustrated based on 18 performance indicators. Stocks are grouped by yearly ratings
above and below the 50th percentile. B50 represents the portfolio being in the top 50 percent of
ratings, whereas W50 being the portfolio with the bottom 50 percent ratings. Regressions are
applied for different time periods as before.
The alphas of the difference portfolios depict the abnormal return of what could have been
achieved by a zero-investment strategy that buys a highly compliant SRI portfolio and short sells
a highly non-compliant SRI portfolio.
The high-ranked (B50) as well as the low-ranked (W50) portfolios demonstrate significant nega-
tive alphas for both the extended time period from 2011-2015 and the original period from 2013-
2015. The factor adjusted returns for the extended period are -54 and -40 basis points per month
or about -6.5% and -4.8% per year. The difference portfolios regressions yield no significant al-
phas.
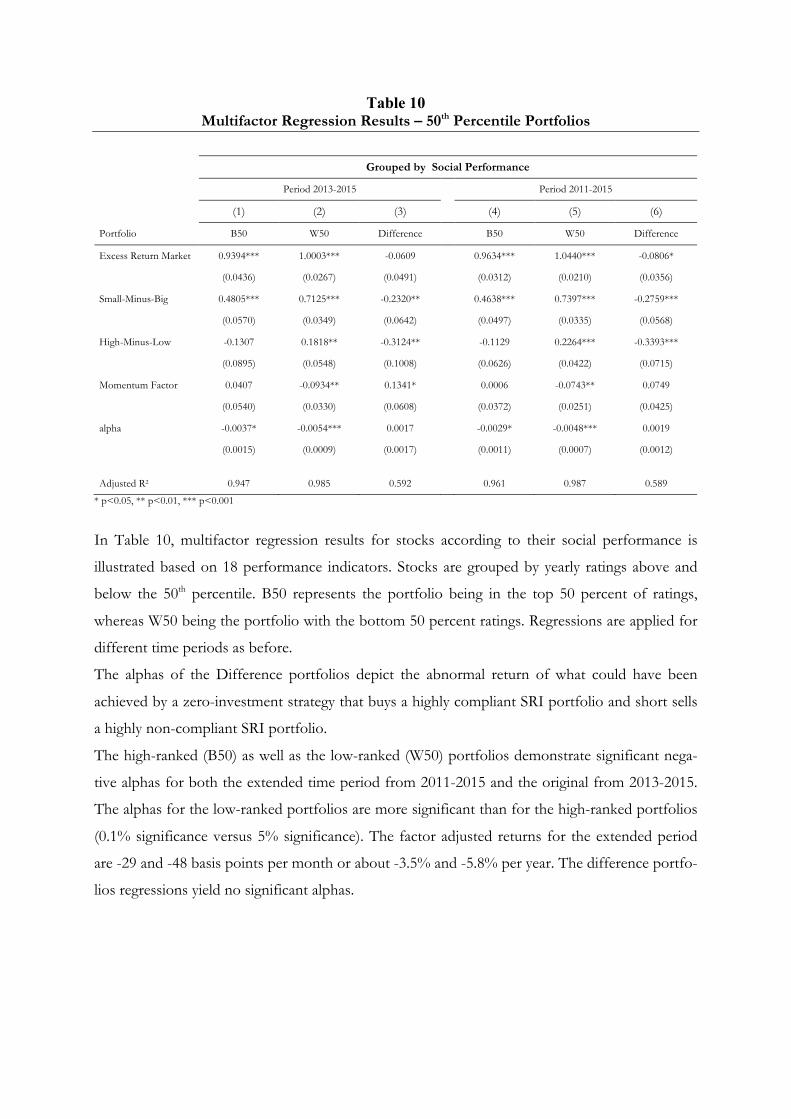
Table 10 Multifactor Regression Results – 50th Percentile Portfolios
Grouped by Social Performance
Period 2013-2015 Period 2011-2015
(1) (2) (3) (4) (5) (6)
Portfolio B50 W50 Difference B50 W50 Difference
Excess Return Market 0.9394*** 1.0003*** -0.0609 0.9634*** 1.0440*** -0.0806*
(0.0436) (0.0267) (0.0491) (0.0312) (0.0210) (0.0356)
Small-Minus-Big 0.4805*** 0.7125*** -0.2320** 0.4638*** 0.7397*** -0.2759***
(0.0570) (0.0349) (0.0642) (0.0497) (0.0335) (0.0568)
High-Minus-Low -0.1307 0.1818** -0.3124** -0.1129 0.2264*** -0.3393***
(0.0895) (0.0548) (0.1008) (0.0626) (0.0422) (0.0715)
Momentum Factor 0.0407 -0.0934** 0.1341* 0.0006 -0.0743** 0.0749
(0.0540) (0.0330) (0.0608) (0.0372) (0.0251) (0.0425)
alpha -0.0037* -0.0054*** 0.0017 -0.0029* -0.0048*** 0.0019
(0.0015) (0.0009) (0.0017) (0.0011) (0.0007) (0.0012)
Adjusted R2 0.947 0.985 0.592 0.961 0.987 0.589
* p<0.05, ** p<0.01, *** p<0.001
In Table 10, multifactor regression results for stocks according to their social performance is
illustrated based on 18 performance indicators. Stocks are grouped by yearly ratings above and
below the 50th percentile. B50 represents the portfolio being in the top 50 percent of ratings,
whereas W50 being the portfolio with the bottom 50 percent ratings. Regressions are applied for
different time periods as before.
The alphas of the Difference portfolios depict the abnormal return of what could have been
achieved by a zero-investment strategy that buys a highly compliant SRI portfolio and short sells
a highly non-compliant SRI portfolio.
The high-ranked (B50) as well as the low-ranked (W50) portfolios demonstrate significant nega-
tive alphas for both the extended time period from 2011-2015 and the original from 2013-2015.
The alphas for the low-ranked portfolios are more significant than for the high-ranked portfolios
(0.1% significance versus 5% significance). The factor adjusted returns for the extended period
are -29 and -48 basis points per month or about -3.5% and -5.8% per year. The difference portfo-
lios regressions yield no significant alphas.
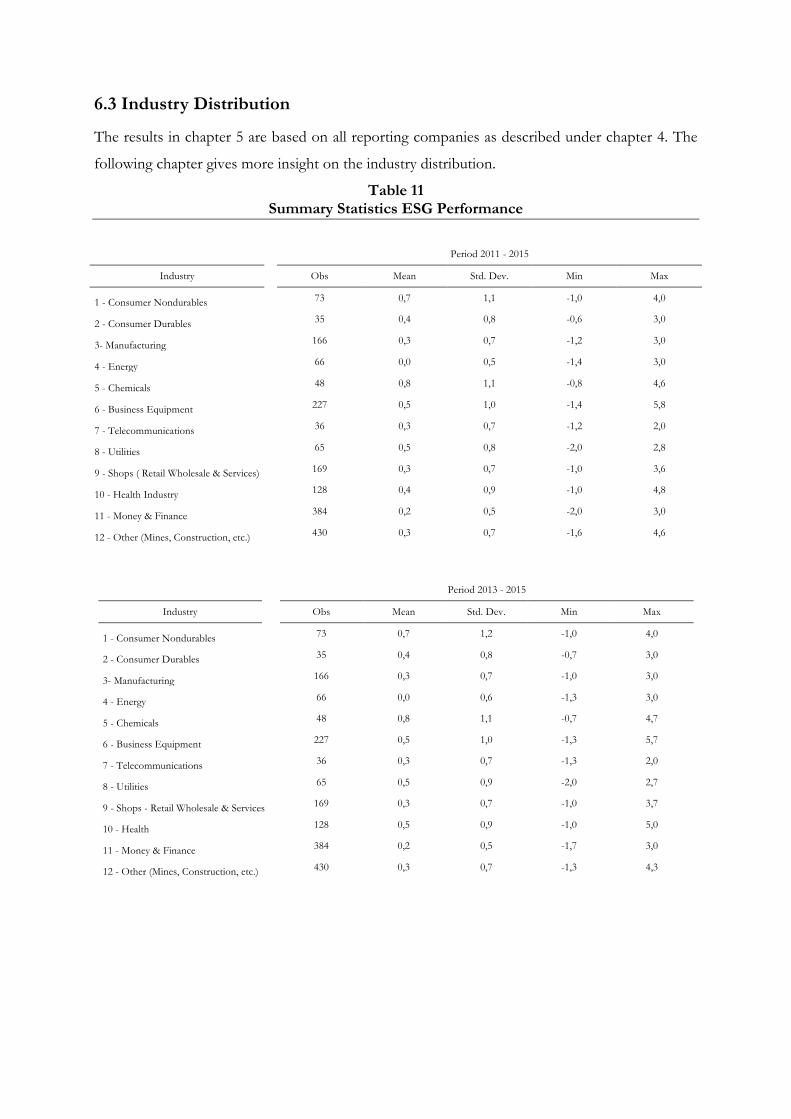
6.3 Industry Distribution
The results in chapter 5 are based on all reporting companies as described under chapter 4. The
following chapter gives more insight on the industry distribution.
Table 11 Summary Statistics ESG Performance
Period 2011 - 2015
Industry
Obs Mean Std. Dev. Min Max
1 - Consumer Nondurables
73 0,7 1,1 -1,0 4,0
2 - Consumer Durables
35 0,4 0,8 -0,6 3,0
3- Manufacturing
166 0,3 0,7 -1,2 3,0
4 - Energy
66 0,0 0,5 -1,4 3,0
5 - Chemicals
48 0,8 1,1 -0,8 4,6
6 - Business Equipment
227 0,5 1,0 -1,4 5,8
7 - Telecommunications
36 0,3 0,7 -1,2 2,0
8 - Utilities
65 0,5 0,8 -2,0 2,8
9 - Shops ( Retail Wholesale & Services) 169 0,3 0,7 -1,0 3,6
10 - Health Industry
128 0,4 0,9 -1,0 4,8
11 - Money & Finance
384 0,2 0,5 -2,0 3,0
12 - Other (Mines, Construction, etc.) 430 0,3 0,7 -1,6 4,6
Period 2013 - 2015
Industry
Obs Mean Std. Dev. Min Max
1 - Consumer Nondurables
73 0,7 1,2 -1,0 4,0
2 - Consumer Durables
35 0,4 0,8 -0,7 3,0
3- Manufacturing
166 0,3 0,7 -1,0 3,0
4 - Energy
66 0,0 0,6 -1,3 3,0
5 - Chemicals
48 0,8 1,1 -0,7 4,7
6 - Business Equipment
227 0,5 1,0 -1,3 5,7
7 - Telecommunications
36 0,3 0,7 -1,3 2,0
8 - Utilities
65 0,5 0,9 -2,0 2,7
9 - Shops - Retail Wholesale & Services 169 0,3 0,7 -1,0 3,7
10 - Health
128 0,5 0,9 -1,0 5,0
11 - Money & Finance
384 0,2 0,5 -1,7 3,0
12 - Other (Mines, Construction, etc.) 430 0,3 0,7 -1,3 4,3
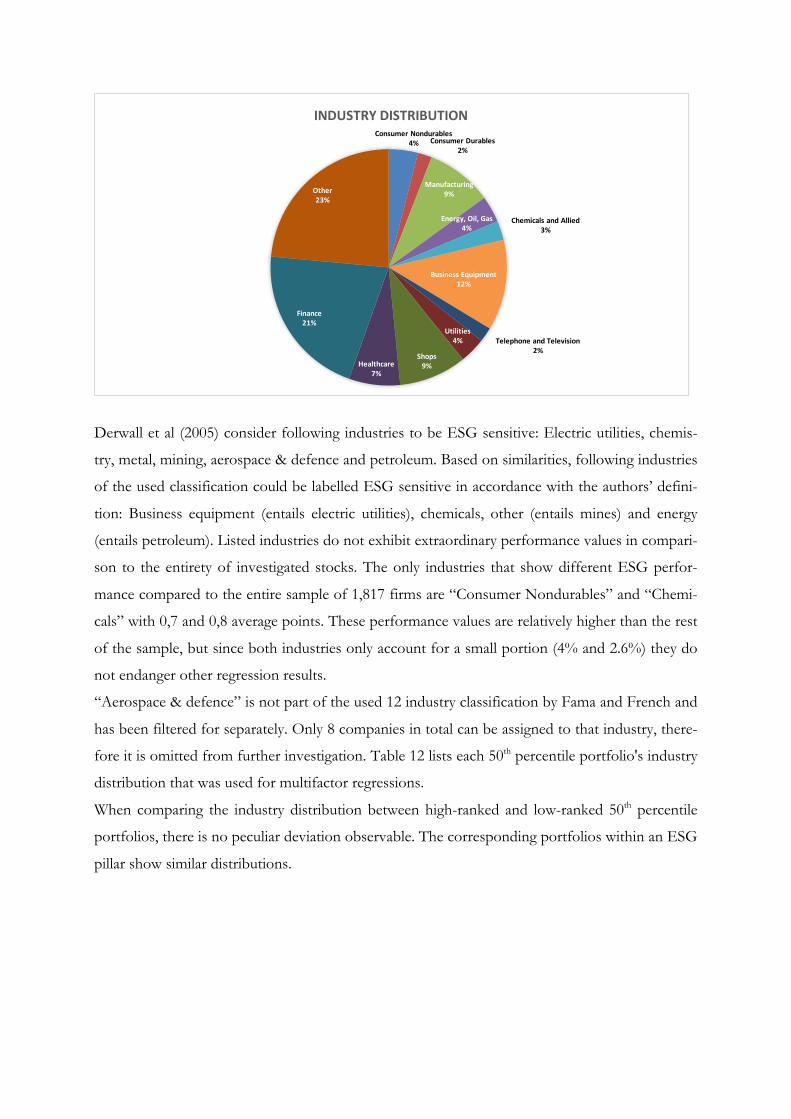
Derwall et al (2005) consider following industries to be ESG sensitive: Electric utilities, chemis-
try, metal, mining, aerospace & defence and petroleum. Based on similarities, following industries
of the used classification could be labelled ESG sensitive in accordance with the authors’ defini-
tion: Business equipment (entails electric utilities), chemicals, other (entails mines) and energy
(entails petroleum). Listed industries do not exhibit extraordinary performance values in compari-
son to the entirety of investigated stocks. The only industries that show different ESG perfor-
mance compared to the entire sample of 1,817 firms are “Consumer Nondurables” and “Chemi-
cals” with 0,7 and 0,8 average points. These performance values are relatively higher than the rest
of the sample, but since both industries only account for a small portion (4% and 2.6%) they do
not endanger other regression results.
“Aerospace & defence” is not part of the used 12 industry classification by Fama and French and
has been filtered for separately. Only 8 companies in total can be assigned to that industry, there-
fore it is omitted from further investigation. Table 12 lists each 50th percentile portfolio's industry
distribution that was used for multifactor regressions.
When comparing the industry distribution between high-ranked and low-ranked 50th percentile
portfolios, there is no peculiar deviation observable. The corresponding portfolios within an ESG
pillar show similar distributions.
ConsumerNondurables4% ConsumerDurables
2%
Manufacturing9%
Energy,Oil,Gas4%
ChemicalsandAllied3%
BusinessEquipment12%
TelephoneandTelevision2%
Utilities4%
Shops9%Healthcare
7%
Finance21%
Other23%
INDUSTRYDISTRIBUTION
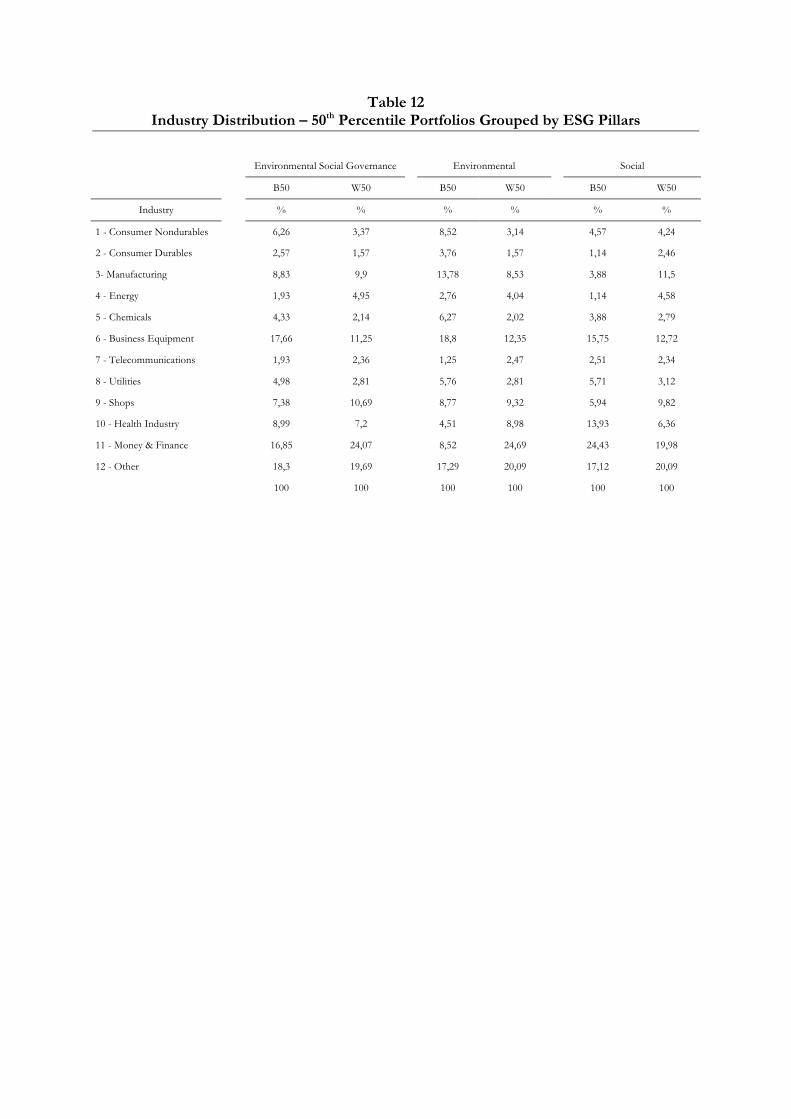
Table 12 Industry Distribution – 50th Percentile Portfolios Grouped by ESG Pillars
Environmental Social Governance Environmental Social
B50 W50 B50 W50 B50 W50
Industry
% % % % % %
1 - Consumer Nondurables 6,26 3,37 8,52 3,14 4,57 4,24
2 - Consumer Durables
2,57 1,57 3,76 1,57 1,14 2,46
3- Manufacturing
8,83 9,9 13,78 8,53 3,88 11,5
4 - Energy
1,93 4,95 2,76 4,04 1,14 4,58
5 - Chemicals
4,33 2,14 6,27 2,02 3,88 2,79
6 - Business Equipment
17,66 11,25 18,8 12,35 15,75 12,72
7 - Telecommunications
1,93 2,36 1,25 2,47 2,51 2,34
8 - Utilities
4,98 2,81 5,76 2,81 5,71 3,12
9 - Shops 7,38 10,69 8,77 9,32 5,94 9,82
10 - Health Industry
8,99 7,2 4,51 8,98 13,93 6,36
11 - Money & Finance
16,85 24,07 8,52 24,69 24,43 19,98
12 - Other 18,3 19,69 17,29 20,09 17,12 20,09
100 100 100 100 100 100
7 Conclusion In the beginning, I positioned this thesis among related literature and pointed out the ongoing
discussion around the effectiveness of ESG investing. The two conflicting hypotheses of 1)
Shunned Stocks, namely socially controversial stocks showing positive returns due to negligence
and 2) Errors in Expectations, namely socially responsible stocks showing positive returns due to
a market inefficiency in recognizing CSR practices, were investigated by analysis of portfolio re-
turns of stocks with high ESG ratings and stocks with low ESG ratings.
Neither hypothesis 1, nor hypothesis 2 could be evidenced in the empirical analysis. With respect
to the first hypothesis, I found that socially controversial stocks show negative alphas. This
would indicate an argument in favor of ESG investing, whereas the empirical analysis also
showed negative alphas for socially responsible stocks and hereby declining hypothesis 2 as well.
Refining these results by smaller percentiles and separating environmental and social characteris-
tics leads to similar results.
These results add to the line of ambiguous research results on ESG investing, but can be inter-
preted as an indication of efficient markets. In fact, neither the controversial, nor the responsible
stocks can generate extra returns. I suggest that only a well-balanced market portfolio delivers the
best risk adjusted returns.
Finally, this thesis also leaves room for further investigation. A continued difficulty throughout
the analysis was the poor availability of data on ESG compliance. Since MSCI ESG Research
updated their key issue hierarchy in recent years, it resembles a rather new innovation and there-
fore misses a longer trace of historical data. As the future will probably bring an increased availa-
bility of data and more refined indicators, this research could be redone on an increased data set.
References Aktas, N., De Bodt, E. and Cousin, J. G. (2011). Do financial markets care about SRI? Evidence from mergers and acquisitions. Journal of Banking & Finance, 35(7), 1753-1761. Amel-Zadeh, A. and Serafeim, G. (2017). Why and How Investors Use ESG Information: Evi-dence from a Global Survey. Working Paper. Harvard Business School Accounting & Manage-ment Unit. Available at SSRN: https://ssrn.com/abstract=2925310 Alexander, G.J. and Buchholz, R.A. (1978). Corporate Social Responsibility and Stock Market Performance. Academy of Management Journal 21(3), 479-486. Banerjee, S. (2010). Governing the Global Corporation: A Critical Perspective. Business Ethics Quarterly 20(1), 265-274 Bauer, R., Koedijk, K., Otten, R., 2005. International evidence on ethical mutual fund perfor-mance and investment style. Journal of Banking and Finance 29, 1751– 1767.
Bauer, R., & Hann, D. (2010). ‘Corporate environmental Management and Credit Risk”. Working Paper. Available at SSRN: https://papers.ssrn.com/sol3/papers.cfm?abstract_id=1660470 Bebchuk, L.A. and Cohen, A. (2005). The Costs of Entrenched Boards. Journal of Financial Economics 78(2), 409-433 Cahan, S. F., Chen, C., Chen,L. and Nguyen, N. H. (2015). Corporate social responsibility and media coverage. Journal of Banking & Finance, 59, 409-422 Cai, Y., Pan, C. H., and Statman, M. (2016). Why do countries matter so much in corporate social performance? Journal of Corporate Finance, 41, 591-609. Carhart, M. (1997) On Persistence in Mutual Fund Performance. Journal of Finance 52(1), 57-82. Core, J. E., Guay, W. R. and Rusticus, T. O. (2006). Does weak governance cause weak stock returns? An examination of firm operating performance and investors' expectations. The Journal of Finance, 61(2), 655-687 De Colle, S., and York, J. G. (2009). Why wine is not glue? The unresolved problem of negative screening in socially responsible investing. Journal of Business Ethics 85, 83-95 Della Croce, R., Stewart, F. and Yermo, J. (2011). Promoting Longer-Term Investment by Insti-tutional Investors. OECD Journal: Financial Market Trends, 2011(1), 145-164.
Derwall, J., Guenster, N., Bauer, R. and Koedijk, K. (2005). The Eco-Efficiency Premium Puzzle. Financial Analysts Journal 61(2), 51-63 Derwall, J., Koedijk, K. and Ter Horst, J. (2011). A tale of values-driven and profit-seeking social investors. Journal of Banking and Finance 35 (8), 2137–2147 Eurosif (2014). European SRI Study. Available at: http://issuu.com/eurosif/docs/eurosif-sri-study-20141/1?e=2092860/11474152 Eurosif (2016). European SRI Study. Available at: http://www.eurosif.org/wp-content/uploads/2016/11/SRI-study-2016-LR-.pdf Edmans, A. (2011). Does the stock market fully value intangibles? Employee satisfaction and equity prices. Journal of Financial Economics 101(3), 621-640
El Ghoul, S., Guedhami, O., Kwok, C. C. and Mishra, D. R. (2011). Does corporate social re-sponsibility affect the cost of capital? Journal of Banking & Finance, 35(9), 2388-2406. Evans, J. and Peiris, D. (2010). The Relationship between Environmental Social Governance Factors and Stock Returns. UNSW Australian School of Business Research Paper No. 2010ACTL02 Available at SSRN: https://papers.ssrn.com/sol3/papers.cfm?abstract_id=1586146 Fama, E.F. (1970). Efficient Capital Markets: A Review of Theory and Empirical Work. Journal of Finance 25(2). 383-417 Fama, E.F. and French, K.R. (1993). Common Risk Factors in the Returns on Stocks and Bonds. Journal of Financial Economics 33 (1), 3-56 Fisher-Vanden, K. and Thorburn, K. S. (2011). Voluntary corporate environmental initiatives and shareholder wealth. Journal of Environmental Economics and management, 62(3), 430-445 Fombrun, C. and Shanley, M. (1990). What’s in a name? Reputation building and corporate strat-egy. Academy of Management Journal 33, 233–258.
Friede, G., Busch, T. and Bassen, A. (2015). ESG and Financial Performance: Aggregated Evi-dence from more than 2000 Empirical Studies. Journal of Sustainable Finance & Invest-ment, 5(4), 210-233. Fulton, M., Kahn, B. M. and Sharples, C. (2012). Sustainable investing: establishing long-term value and performance. Available at: https://ssrn.com/abstract=2222740 Galema, R., Plantinga, A. and Scholtens, B. (2008). The stocks at stake: Return and risk in socially responsible investment. Journal of Banking & Finance, 32(12), 2646-2654.
Gil-Bazo, J., Ruiz-Verdú, P. and Santos, A. A. (2010). The Performance of Socially Responsible Mutual Funds: The Role of Fees and Management Companies. Journal of Business Ethics, 94(2), 243-263 Gompers, P. A., Ishii, J.L. and Metrick, A. (2003). Corporate Governance and Equity Prices. Quarterly Journal of Economics 118(1), 107-155 Goss, A. and Roberts, G. S. (2011). The impact of corporate social responsibility on the cost of bank loans. Journal of Banking & Finance, 35(7), 1794-1810 Heinkel, R., Kraus, A. and Zeichner, J. (2001). The Effect of Green Investment on Corporate Behaviour. The Journal of Financial and Quantitative Analysis 36(4), 431-449 Henke, H. M. (2016). The Effect of Social Screening on Bond Mutual Fund Perfor-mance. Journal of Banking & Finance, 67, 69-84. Hong, H. and Kacperczyk, M. (2009). The Price of Sin: The Effects of Social Norms on Markets. Journal of Financial Economics 93(1), 15-36 Jha, A., & Cox, J. (2015). ‘Corporate social responsibility and social capital’. Journal of Banking & Finance, 60, 252-270 Koh, P.-S, Qian, C. and Wang, H. (2014). Firm litigation risk and the insurance value of corpo-rate social performance. Strategic Management Journal 35(10), 1464-1482 Langbein, J.H. and Posner, R.A. (1980). Social Investing and The Law of Trusts. Michigan Law Review 79, 72-112 McGuire, J.B., Sundgren, A. and Schneeweis T. (1988). Corporate social responsibility and firm financial performance. Academy of Management Journal 31, 854–872. Moskowitz, M. (1972). Choosing Socially Responsible Stocks. Business and Society Review (1), 71-75 MSCI ESG Research (June 2015). MSCI ESG KLD STATS: 1991-2014 Datasets Methodology. Available at: https://wrds-web.wharton.upenn.edu/wrds/support/Data/_001Manuals%20and%20Overviews/_070KLD/ MSCI ESG Research (February 2017) ‘ESG Ratings Methodology – Executive Summary’. Available at: https://www.msci.com/documents/10199/123a2b2b-1395-4aa2-a121-ea14de6d708a Nagy, Z., Cogan, D. and Sinnreich, D. (2013). Optimizing Environmental, Social and Govern-ance Factors in Portfolio Construction: Analysis of three ESG-tilted strategies. MSCI ESG Re-search. Available at SSRN: https://ssrn.com/abstract=2221524
Nofsinger, J. and Varma, A. (2014). Socially Responsible Funds and Market Crises. Journal of Banking & Finance, 48, 180-193 Pantzalis, C. and Park, J.C. (2009). Equity Market Valuation of Human Capital and Stock Re-turns. Journal of Banking and Finance 33, 1610–1623. Park, A., and Ravenel, C. (2013). Integrating Sustainability into Capital Markets: Bloomberg LP and ESG's Quantitative Legitimacy. Journal of Applied Corporate Finance, 25(3), 62-67 Porter, M.E. and Kramer, M.R. (2006). Strategy and Society: The Link between Competitive Ad-vantage and Corporate Social Responsibility. Harvard Business Review 84(12), 78-92 Renneboog, L., Ter Horst, J. and Zhang, C. (2008). Socially responsible investments: Institutional Aspects, Performance, and Investor Behavior. Journal of Banking & Finance 32(9), 1723-1742 Richardson, B. J. and Cragg, W. (2010). Being virtuous and prosperous: SRI’s conflicting goals. Journal of Business Ethics, 92, 21-39. Sievänen R., Rita H. and Scholtens B. (2013) ‘The Drivers of Responsible Investment: The Case of European Pension Funds’. Journal of Business Ethics 117(1), 137-151 Sparkes R. (2002) ‘Socially Responsible Investment – A Global Revolution’. John Wiley and Sons Sparkes, R. and Cowton, C. J. (2004). ‘The maturing of socially responsible investment: A review of the developing link with corporate social responsibility’. Journal of Business Ethics, 52(1), 45-57. Statman M. (2000) ‚Socially responsible mutual funds’. Financial Analysts Journal 56 (3), 30–39
Statman M. (2005) ‘Socially Responsible Indexes – Composition and Performance’. Working Paper, Santa Clara University
Stellner, C., Klein, C., and Zwergel, B. (2015). ‘Corporate social responsibility and Eurozone cor-porate bonds: The moderating role of country sustainability’. Journal of Banking & Finance, 59, 538-549. United Nations Global Compact Available at: https://www.unglobalcompact.org/what-is-gc/mission/principles United Nations Principles for Responsible Investment Available at: https://www.unpri.org/about/the-six-principles USSIF Trend Report (2016) Accessed on 19 July, 2017. Available at: http://www.ussif.org/content.asp?contentid=82
Appendix Extended Literature Review
In addition to the discussed literature, there is a number of other regression models that entail
different options for robustness checks. Papers who apply a multifactor regression based on
Fama and French (1993) also control for specific risks that are not covered by the model’s sys-
temic risk factors. In addition to the risk-free rate, excess returns are calculated over other
benchmarks. By subtracting portfolio returns with an industry-matched portfolio return Gom-
pers et al. (2003) for instance make sure the observed outperformance of the Carhart (1997) re-
gression is not simply due to high industry returns respective portfolios might originate from.
Therefor the authors make use of the industry classification of Fama and French (1997). Edmans
(2011) sticks to the same approach but additionally computes an excess return over a characteris-
tics-adjusted benchmark used by Wermers (2004). This additional benchmark is ought to control
for size, value and momentum anomalies.
Moreover, the analysis of regional differences can be of interest, as done in a recent paper by Stellner (2015).
This view is supported by the work of Cai et al. (2016). The authors focus on differences in levels
of corporate social performance (CSP) across countries. The paper attests country factors more
explanatory power for variations in CSP ratings than firm characteristics, because of their direct
effect on companies' costs of investing in CSP and the benefits resulting from such investments.
Cai et al. point out the importance of parameters beyond just economic development. Country
factors such as autonomy measures as well as civil liberties and political rights show to have a
significant positive effect on CSP.
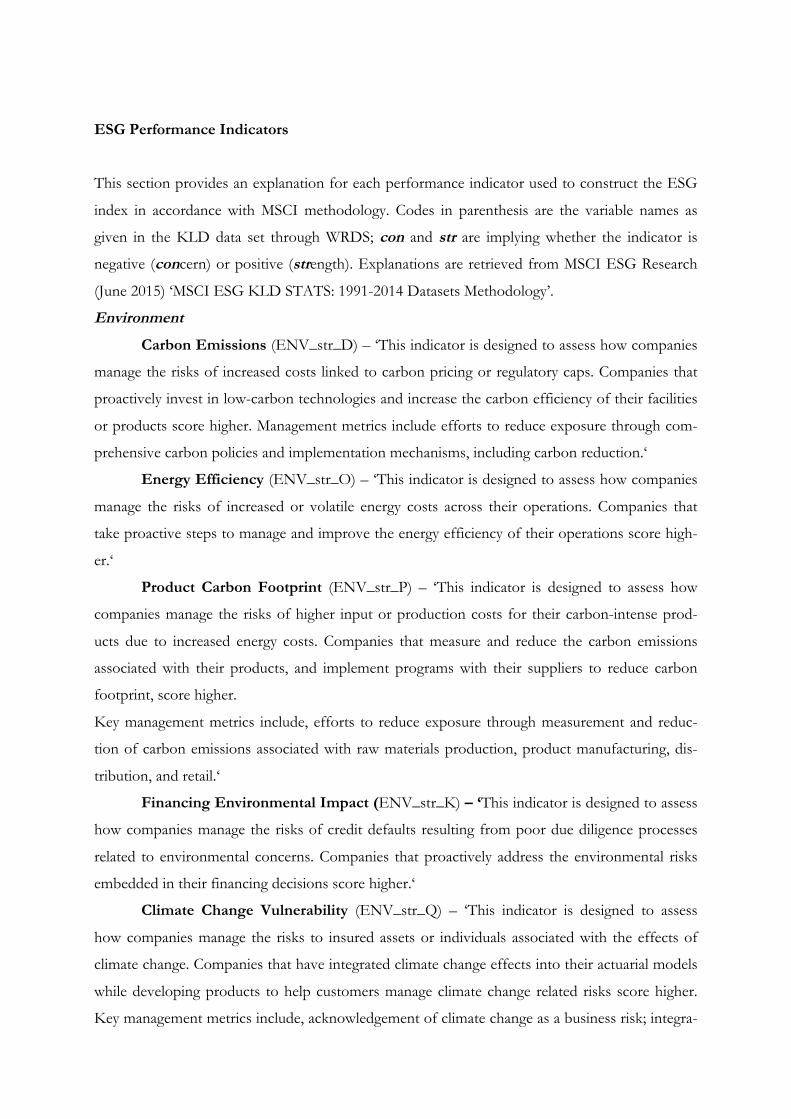
ESG Performance Indicators
This section provides an explanation for each performance indicator used to construct the ESG
index in accordance with MSCI methodology. Codes in parenthesis are the variable names as
given in the KLD data set through WRDS; con and str are implying whether the indicator is
negative (concern) or positive (strength). Explanations are retrieved from MSCI ESG Research
(June 2015) ‘MSCI ESG KLD STATS: 1991-2014 Datasets Methodology’.
Environment
Carbon Emissions (ENV_str_D) – ‘This indicator is designed to assess how companies
manage the risks of increased costs linked to carbon pricing or regulatory caps. Companies that
proactively invest in low-carbon technologies and increase the carbon efficiency of their facilities
or products score higher. Management metrics include efforts to reduce exposure through com-
prehensive carbon policies and implementation mechanisms, including carbon reduction.‘
Energy Efficiency (ENV_str_O) – ‘This indicator is designed to assess how companies
manage the risks of increased or volatile energy costs across their operations. Companies that
take proactive steps to manage and improve the energy efficiency of their operations score high-
er.‘
Product Carbon Footprint (ENV_str_P) – ‘This indicator is designed to assess how
companies manage the risks of higher input or production costs for their carbon-intense prod-
ucts due to increased energy costs. Companies that measure and reduce the carbon emissions
associated with their products, and implement programs with their suppliers to reduce carbon
footprint, score higher.
Key management metrics include, efforts to reduce exposure through measurement and reduc-
tion of carbon emissions associated with raw materials production, product manufacturing, dis-
tribution, and retail.‘
Financing Environmental Impact (ENV_str_K) – ‘This indicator is designed to assess
how companies manage the risks of credit defaults resulting from poor due diligence processes
related to environmental concerns. Companies that proactively address the environmental risks
embedded in their financing decisions score higher.‘
Climate Change Vulnerability (ENV_str_Q) – ‘This indicator is designed to assess
how companies manage the risks to insured assets or individuals associated with the effects of
climate change. Companies that have integrated climate change effects into their actuarial models
while developing products to help customers manage climate change related risks score higher.
Key management metrics include, acknowledgement of climate change as a business risk; integra-
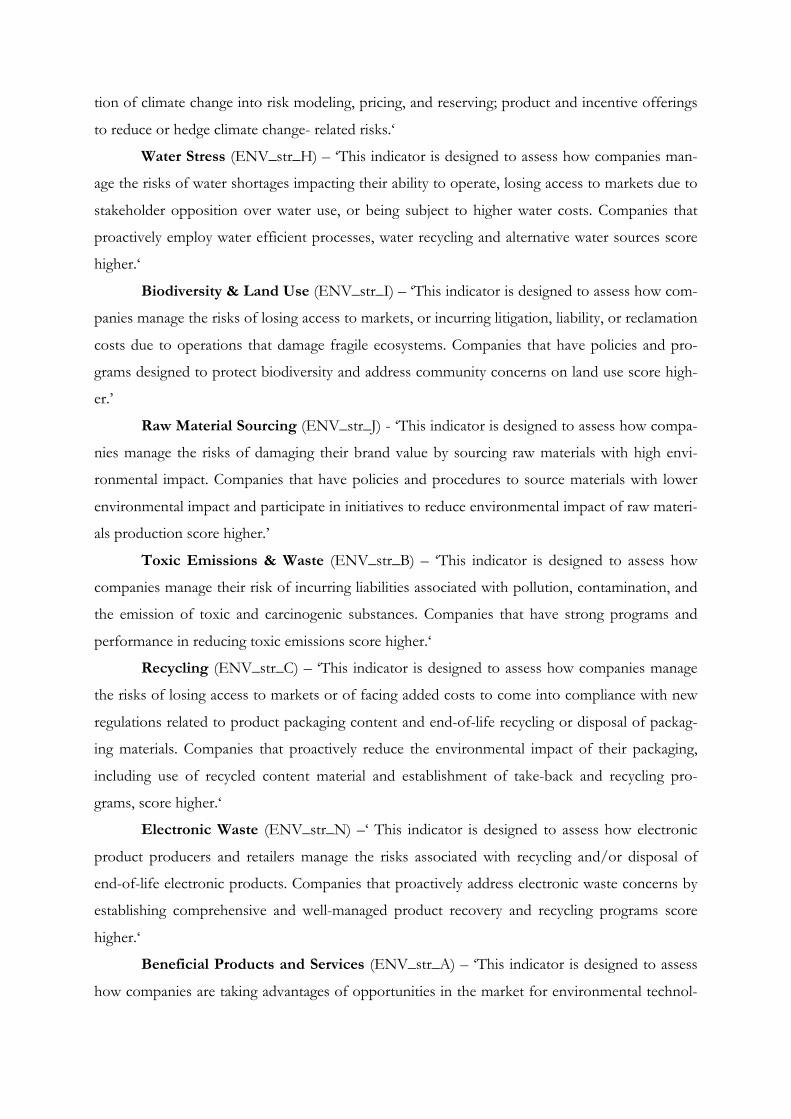
tion of climate change into risk modeling, pricing, and reserving; product and incentive offerings
to reduce or hedge climate change- related risks.‘
Water Stress (ENV_str_H) – ‘This indicator is designed to assess how companies man-
age the risks of water shortages impacting their ability to operate, losing access to markets due to
stakeholder opposition over water use, or being subject to higher water costs. Companies that
proactively employ water efficient processes, water recycling and alternative water sources score
higher.‘
Biodiversity & Land Use (ENV_str_I) – ‘This indicator is designed to assess how com-
panies manage the risks of losing access to markets, or incurring litigation, liability, or reclamation
costs due to operations that damage fragile ecosystems. Companies that have policies and pro-
grams designed to protect biodiversity and address community concerns on land use score high-
er.’
Raw Material Sourcing (ENV_str_J) - ‘This indicator is designed to assess how compa-
nies manage the risks of damaging their brand value by sourcing raw materials with high envi-
ronmental impact. Companies that have policies and procedures to source materials with lower
environmental impact and participate in initiatives to reduce environmental impact of raw materi-
als production score higher.’
Toxic Emissions & Waste (ENV_str_B) – ‘This indicator is designed to assess how
companies manage their risk of incurring liabilities associated with pollution, contamination, and
the emission of toxic and carcinogenic substances. Companies that have strong programs and
performance in reducing toxic emissions score higher.‘
Recycling (ENV_str_C) – ‘This indicator is designed to assess how companies manage
the risks of losing access to markets or of facing added costs to come into compliance with new
regulations related to product packaging content and end-of-life recycling or disposal of packag-
ing materials. Companies that proactively reduce the environmental impact of their packaging,
including use of recycled content material and establishment of take-back and recycling pro-
grams, score higher.‘
Electronic Waste (ENV_str_N) –‘ This indicator is designed to assess how electronic
product producers and retailers manage the risks associated with recycling and/or disposal of
end-of-life electronic products. Companies that proactively address electronic waste concerns by
establishing comprehensive and well-managed product recovery and recycling programs score
higher.‘
Beneficial Products and Services (ENV_str_A) – ‘This indicator is designed to assess
how companies are taking advantages of opportunities in the market for environmental technol-
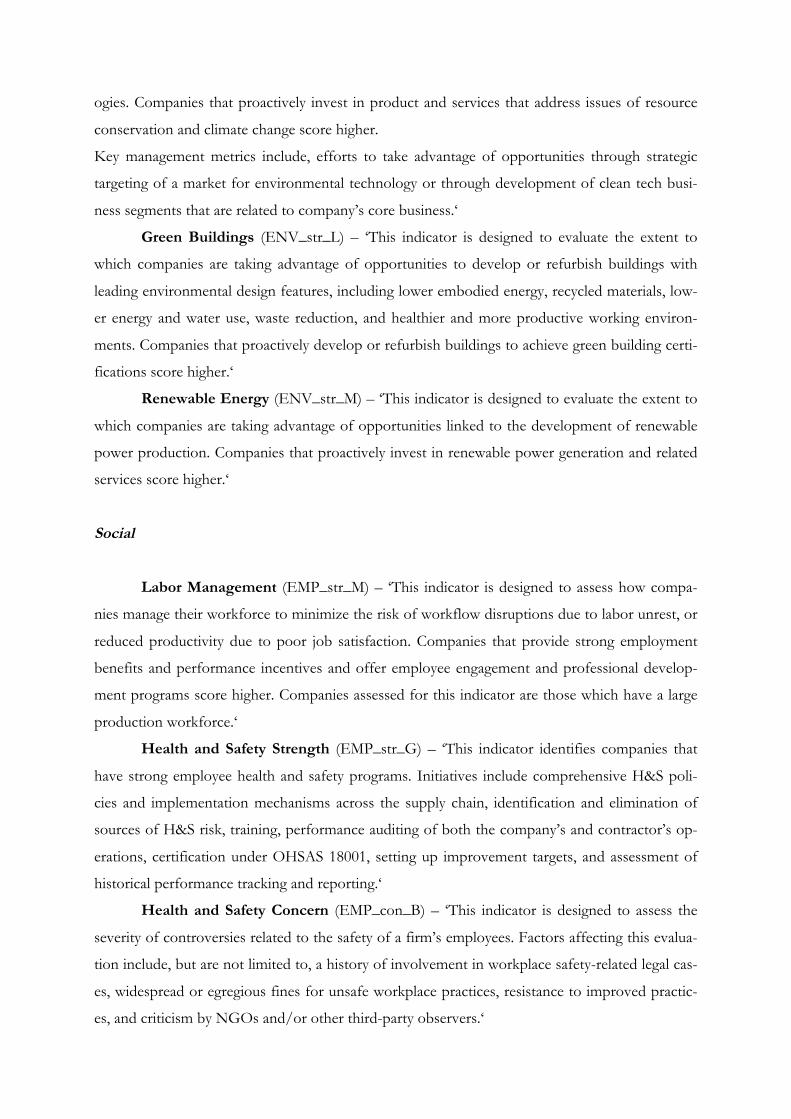
ogies. Companies that proactively invest in product and services that address issues of resource
conservation and climate change score higher.
Key management metrics include, efforts to take advantage of opportunities through strategic
targeting of a market for environmental technology or through development of clean tech busi-
ness segments that are related to company’s core business.‘
Green Buildings (ENV_str_L) – ‘This indicator is designed to evaluate the extent to
which companies are taking advantage of opportunities to develop or refurbish buildings with
leading environmental design features, including lower embodied energy, recycled materials, low-
er energy and water use, waste reduction, and healthier and more productive working environ-
ments. Companies that proactively develop or refurbish buildings to achieve green building certi-
fications score higher.‘
Renewable Energy (ENV_str_M) – ‘This indicator is designed to evaluate the extent to
which companies are taking advantage of opportunities linked to the development of renewable
power production. Companies that proactively invest in renewable power generation and related
services score higher.‘
Social
Labor Management (EMP_str_M) – ‘This indicator is designed to assess how compa-
nies manage their workforce to minimize the risk of workflow disruptions due to labor unrest, or
reduced productivity due to poor job satisfaction. Companies that provide strong employment
benefits and performance incentives and offer employee engagement and professional develop-
ment programs score higher. Companies assessed for this indicator are those which have a large
production workforce.‘
Health and Safety Strength (EMP_str_G) – ‘This indicator identifies companies that
have strong employee health and safety programs. Initiatives include comprehensive H&S poli-
cies and implementation mechanisms across the supply chain, identification and elimination of
sources of H&S risk, training, performance auditing of both the company’s and contractor’s op-
erations, certification under OHSAS 18001, setting up improvement targets, and assessment of
historical performance tracking and reporting.‘
Health and Safety Concern (EMP_con_B) – ‘This indicator is designed to assess the
severity of controversies related to the safety of a firm’s employees. Factors affecting this evalua-
tion include, but are not limited to, a history of involvement in workplace safety-related legal cas-
es, widespread or egregious fines for unsafe workplace practices, resistance to improved practic-
es, and criticism by NGOs and/or other third-party observers.‘
Human Capital Management (EMP_str_L) – ‘This indicator is designed to assess
companies’ ability to attract, retain, and develop human capital based on their provision of bene-
fits, training and development programs, and employee engagement; and avoid labor unrest or
reduced productivity due to poor job satisfaction. Companies that proactively manage human
capital development by offering competitive benefit packages and performance incentives, im-
plementing formalized training programs, offering employee engagement and professional devel-
opment programs, and actively measuring employee satisfaction score highest. Companies as-
sessed for this indicator are those that rely on a highly-skilled or highly-trained workforce based
on its principal lines of business. This indicator only covers companies that rely on a highly-
skilled or highly-trained workforce.‘
Supply Chain Management (ENV_con_J) – ‘This indicator is designed to assess how
well companies manage risks of production disruptions and brand value damage due to sub-
standard treatment of workers in the company’s supply chain. Companies that establish labor
management policies meeting stringent international norms, implement programs to verify com-
pliance with the policies, and introduce incentives for compliance among suppliers score higher.‘
Quality (PRO_str_A) – ‘This indicator is designed to assess how companies manage
their risk of facing major product recalls or losing customer trust through major product quality
concerns. Companies that proactively manage product quality by achieving certification to widely
acceptable standards, undertaking extensive product testing and building processes to track raw
materials or components score higher.‘
Chemical Product Safety (PRO_str_G) – ‘This indicator is designed to assess how
companies manage the risk of losing access to markets or the costs related to reformulating their
products due to the presence of chemicals of concern. Companies that proactively eliminate
chemicals of concern from their products ahead of regulatory changes score higher.‘
Financial Product Safety (PRO_str_H) – ‘This indicator is designed to assess how
companies manage the risk of incurring costs associated with unanticipated credit losses, litiga-
tion, and regulatory changes brought by offering financial products that lack transparency or are
highly likely to be financially unsustainable to the end-user. Companies that offer transparent
financial products based on a borrower’s ability to repay score higher.‘
Privacy & Data Security (PRO_str_I) – ‘This indicator is designed to assess how com-
panies manage the risk of incurring reputational damage, or legal liability, from a data security
breach or controversial use of personal data, or having their business model undermined by
evolving regulatory requirements on privacy and data protection. Companies with comprehensive
privacy policies and data security management systems and companies whose business models
are not reliant on trafficking in personal data score higher.‘
Responsible Investment (PRO_str_J) – ‘This indicator is designed to assess how com-
panies avoid ESG-related risks in their investment portfolios. Companies that mitigate ESG risks
in their investments by integrating ESG risk analysis into their due diligence process across all
investment portfolios and asset classes score higher.‘
Health & Demographic Risk (PRO_str_K) – ‘For the STATS-2013 Data Set, this is a
new, separate indicator. This issue was covered in Quality (PRO-str-A) in STATS-2012.‘
Controversial Sourcing (EMP_str_N) – ‘This indicator is designed to assess how com-
panies manage their risks of incurring regulatory compliance costs, reputational damage, or sup-
ply chain disruptions resulting from reliance on raw materials that originate in areas associated
with severe human rights and labor rights abuses. The range of scoring depends on the material,
with different materials relevant for different industries. In general, companies able to trace the
origin of their raw materials and certify that they were obtained in a way that minimizes social
harm (e.g. slave labor or funding for groups engaged in human rights violations) score higher.‘
Access to Communications (PRO_str_E) – ‘This indicator is designed to assess the ex-
tent to which companies are taking advantage of opportunities for growth in historically under-
served markets, including developing countries and underserved populations in developed coun-
tries (such as rural areas and the elderly). Companies with considerable operations in developing
countries score well, as do those with substantial activities focused on expanding access through
relevant initiatives and philanthropic efforts.‘
Access to Capital (PRO_str_D) – ‘This indicator is designed to assess the extent to
which a company is providing lending, financing, or products to underrepresented or under-
banked communities. Top performing companies will offer products and services to communi-
ties with limited or no access to financial products.‘
Benefits to Economically Disadvantaged (PRO_str_C) – ‘This indicator is designed
to assess the extent to which companies are taking advantage of opportunities for longer term
growth and protecting their license to operate through efforts to improve access to healthcare in
developing countries and for under-served populations in developed markets. In developing
countries, companies that adapt their business models to reflect the specific needs of individuals
in these markets through areas such as R&D, pricing, and licensing strategies score higher. In
developed markets, companies that take advantage of opportunities driven by regulatory changes
to capture the uninsured market score higher.‘
Opportunities in Nutrition & Health (PRO_str_F) – ‘This indicator is designed to as-
sess the extent to which companies are taking advantage of the growth opportunities in the mar-
ket for healthier products. Companies that offer products with improved nutritional profile, and
have sought credible verification, score higher.‘
Governance
Executive Compensation (CGOV_con_K) - ‘This indicator is designed to assess the
severity of controversies related to a firm’s executive compensation and governance practices.
Factors affecting this evaluation include, but are not limited to, a history of involvement in com-
pensation-related legal cases, widespread or egregious instances of shareholder or board-level
objections to pay practices and governance structures, resistance to improved practices, and criti-
cism by NGOs and/or other third-party observers.‘
Controversial Investments (CGOV_con_L) – ‘This indicator is designed to assess the
severity of controversies related to the social and environmental impact of a firm’s lending, un-
derwriting, and financing activities. Topics covered include, for example, financing projects that
are controversial because of their actual or anticipated environmental or social impact, as well as
criticism of mining companies, REITs, and similar companies that receive royalties or own shares
in a particular project that they neither own or operate.‘
Other Concerns (CGOV_con_X) – ‘This indicator measures the severity of controver-
sies related to a firm’s governance practices not covered by any other MSCI ESG Research rat-
ing.’
Business Ethics (CGOV_con_M) – ‘This indicator is designed to assess the severity of
controversies related to a firm’s business ethics practices. Factors affecting this evaluation in-
clude, but are not limited to, a history of involvement in widespread or egregious instances of
bribery, tax evasion, insider trading, accounting irregularities, resistance to improved practices,
and criticism by NGOs and/or other third-party observers.‘
Antitrust (PRO_con_E) – ‘This indicator is designed to assess the severity of controver-
sies related to a firm’s anti-competitive business practices. Factors affecting this evaluation in-
clude, but are not limited to, a history of involvement in anti-trust legal cases, widespread or
egregious instances of price-fixing, collusion, or bid-rigging, resistance to improved practices, and
evidence-based criticism by NGOs and/or other third-party observers.‘
Corruption & Political Instability (CGOV_str_G) – ‘This indicator is designed to as-
sess how companies manage the risk of suffering operational disruptions or loss of market access
due to violence, property destruction or sabotage, political instability, demands for bribes, and
costly litigation related to corrupt practices. Companies that have programs, guidelines, and clear
policies to avoid corrupt business dealings, have strong partnerships with local communities, and
have a high level of disclosure and transparency score higher.‘

Financial System Instability (CGOV_str_H) – ‘This indicator is designed to assess
how a company manages its systemic risk in financial markets. Companies that institute strong
governance structures and demonstrate a high level of transparency score well.‘
Table 13 Performance Computation
Notes: The table shows how environmental and social performance is computed with the exam-ple of 4 different companies (Abbott Laboratories, Apple, IBM and Nike) for the period 2013-2014. The visualisation of exemplary data provides a picture of the available ESG data. Straight-forward computation of respective companies’ performance is applied annually and average over whole period.
Environmental Performance Indicators Social Performance Indicators
env_str_d env_str_o env_str_h env_str_b env_str_a emp_str_g emp_str_l emp_con_b
Company Year Clean Energy
Energy Efficiency
Water Stress
Pollution Prevention
Beneficial Products
& Services ∑
Health &
Safety Strength
Human Capital Mgmt.
Health & Safety
Concern ∑
Abbott
2013 1 0 1 1 0 3
1 0 0 1,0
2014 1 1 1 1 0 4
1 0 0 1,0
2015 0 1 0 1 0 2
1 0 0 1,0
avg
3
1,0
Apple Inc. 2013 0 0 0 0 0 0
0 0 0 0,0
2014 0 0 1 0 0 1
0 0 0 1,0
2015 1 0 1 1 0 3
0 0 0 3,0
avg
1,3
1,3
IBM 2014 1 1 0 1 1 4
0 1 0 1,0
2015 1 1 0 1 1 4
0 1 0 1,0
2013 1 1 1 0 1 4
0 1 0 1,0
avg
4
1,0
Nike Inc. 2013 1 0 0 0 0 1
0 0 0 0
2014 1 0 0 1 0 2
0 0 0 0
2015 1 0 0 1 0 2
0 0 0 0
avg
1,7
0