the effect of electronic commerce on the financial
TRANSCRIPT
THE EFFECT OF ELECTRONIC COMMERCE ON THE FINANCIAL
PERFORMANCE OF AIRLINES IN KENYA. A CASE STUDY OF KENYA AIRWAYS.
BY
WANGUKU IRENE WANGARI
D63/76204/2012
A RESEARCH PROJECT SUBMITTED IN PARTIAL FULFILMENT OF THE
REQUIREMENTS FOR THE DEGREE OF MASTER OF SCIENCE (FINANCE),
UNIVERSITY OF NAIROBI
OCTOBER 2013
ii
DECLARATION
This research project is my original work and has not been submitted in any other institution of
learning for any academic award.
Wanguku Irene Wangari Signature ……………………Date………………………….
D63/76204/2012
Approved By Supervisor
Dr.Aduda J.O Signature ……………………Date……………………………

iii
DEDICATION
This project is dedicated to my lovely daughter Stephanie, my parents and siblings whose
selfless love has enabled me to be what I am today.
My parent‘s devotion and dedication towards my education will remain stamped in my heart all
the days of my life.
My sincere gratitude also goes out to my colleagues and friends for their constant encouragement
and support throughout this journey.

iv
ACKNOWLEDGEMENT
I am gratefully indebted to all those who have contributed to the success of this project. First and
foremost I want to thank the Almighty Lord whose power has made me come this far. May His
name be praised and adored.
My sincere gratitude goes to my supervisor, Dr. Josiah Aduda for tirelessly and willingly sharing
his scholarly experience and for making this project a successful undertaking. He has been
available for consultation, his professional guidance and supervision added value to this work.
Many thanks go to the Kenya Airways staff for the support they gave me during data collection.
v
ABSTRACT
Electronic commerce has been widely used with the emergence of internet. The growth of
internet over the years has changed business models on how they conduct their businesses.
Advantages and disadvantages of e-commerce have been widely discussed, together with its
impact in organizations performance. The study looked at the impact of e-commerce in financial
performance.
The overall objective of the study was to investigate the impact of e-commerce on the financial
performance of airlines in Kenya, and in this case Kenya Airways. The study analyzed the
impact of e-commerce using Return on assets and Net income as the dependant variables while
the web passenger numbers and agency commission were the independent variables.
Secondary data was collected from the company‘s published financial statements and other
relevant financial reports. Data analysis was done by use of descriptive statistics, regression
analysis and correlation tests with results being presented in tables. This analysis included
descriptive information and the relationship between the return on assets and net income as the
dependent variables and the number of passengers booked via web and the agency fees as the
independent variables. Tests were carried out without and with fuel cost as the control variable.
The output from data analysis showed that there was a weak positive impact of the independent
variables on the dependent variables and this may be because currently the percentage of online
bookings in relation to the total number of passengers is low for it to have a great impact.
The study recommended that other measures of e-commerce can be analyzed in further studies.
These may be non-financial benefits that also affect performance of the airline and other
yardsticks that can be used to measure performance. Also, further studies may be done in global
markets like Europe, Far East and Middle East where internet use is wide so that the impact of e-
commerce can be analyzed since the markets have a high percentage of online bookings.
vi
TABLE OF CONTENT
DECLARATION ............................................................................................................................................... ii
DEDICATION ................................................................................................................................................. iii
ACKNOWLEDGEMENT .................................................................................................................................. iv
ABSTRACT ...................................................................................................................................................... v
TABLE OF CONTENT ..................................................................................................................................... vi
LIST OF TABLES ........................................................................................................................................... viii
LIST OF ABBREVIATIONS .............................................................................................................................. ix
CHAPTER 1: INTRODUCTION ......................................................................................................................... 1
1.1 Background of the Study ............................................................................................................... 1
1.1.1 E- Commerce ................................................................................................................................ 2
1.1.2 Concept of Financial Performance ............................................................................................... 6
1.1.3 E-commerce and Financial Performance ..................................................................................... 8
1.1.4 Airline Industry ........................................................................................................................... 10
1.2 Research Problem ............................................................................................................................. 12
1.3 Research Objective ........................................................................................................................... 13
1.4 Value of the Study ............................................................................................................................. 13
CHAPTER 2: LITERATURE REVIEW ............................................................................................................... 15
2.1 Introduction ...................................................................................................................................... 15
2.2 Theoretical Review ............................................................................................................................ 15
2.2.1 Technological, Organizational and Environmental Model ......................................................... 15
2.2.2 Resource-based view (RBV) Theory ........................................................................................... 17
2.3 Review of Empirical Studies .............................................................................................................. 18
2.5 Conclusion from Literature Review................................................................................................... 22
CHAPTER 3: RESEARCH METHODOLOGY .................................................................................................... 23

vii
3.1 Introduction ...................................................................................................................................... 23
3.2 Research Design ................................................................................................................................ 23
3.3 Data Collection Method .................................................................................................................... 23
3.4 Data Analysis and Presentation ........................................................................................................ 24
CHAPTER 4: DATA ANALYSIS AND PRESENTATION OF FINDINGS ............................................................... 26
4.1 Introduction ...................................................................................................................................... 26
4.2 Data presentation ............................................................................................................................. 26
4.2.1 Descriptive Statistics .................................................................................................................. 26
4.2.2 Return on Assets analysis ........................................................................................................... 27
4.2.3 Net Income Analysis ................................................................................................................... 30
4.2.4 Correlation matrix ...................................................................................................................... 33
4.3 Summary and interpretation of the findings .................................................................................... 34
CHAPTER 5: SUMMARY, CONCLUSION AND RECOMMENDATION ............................................................. 37
5.1 Summary ........................................................................................................................................... 37
5.2 Conclusion ......................................................................................................................................... 38
5.3 Policy Recommendations .................................................................................................................. 39
5.4 Limitations of the study .................................................................................................................... 39
5.5 Suggestions for Further Research ..................................................................................................... 40
APPENDIX I: REFERENCES ............................................................................................................................ 41
APPENDIX II: ANALYZED DATA .................................................................................................................... 51
viii
LIST OF TABLES
Table 1: Descriptive Statistics .................................................................................................................... 26
Table 2: Commission on Sales and Web Passengers on Return on Asset Regression ................................ 27
Table 3: Commission on Sales and Web Passengers regression on Return on Assets with Fuel control. .. 28
Table 4: Commission on Sales and Web Passengers regression on Net Income with no control ............... 30
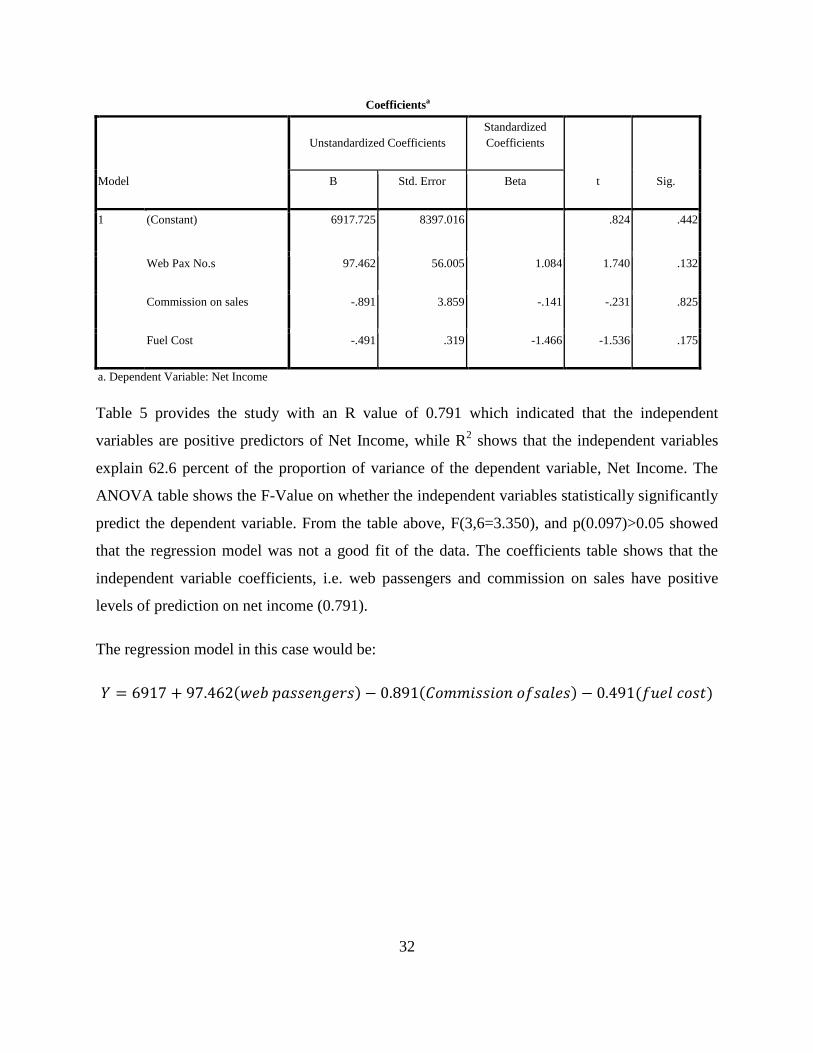
Table 5: Commission on Sales and Web Passengers regression on Net Income with Fuel control ........... 31
Table 6: Correlation matrix ......................................................................................................................... 33

ix
LIST OF ABBREVIATIONS
AFRAA-Africa Airline Association
ANOVA-Analysis of Variance
BPM-Business Process Management
B2B-Business to Business
B2C-Business to Consumer
B2G-Business to Government
C2B-Consumer to Business
C2C-Consumer to Consumer
CRM-Customer Relationship Management
E-Commerce- Electronic Commerce
E-CRM-Electronic Customer Relationship Management
E-Business-Electronic Business
EDI-Electronic Data Interchange
EFT-Electronic Funds Transfer
FY-Financial year
IATA-International Air Transport Association
ICT-Information Communication Technology
IT-Information Technology
x
KAA-Kenya Airports Authority
KAAO-Kenya Association of Air Operators
KQ-Kenya Airways Limited
KSHS-Kenya Shillings
PAX No.s- Passenger Numbers
RM-Revenue management
ROA-Return on Assets
ROE-Return on Equity
SPPS-Statistical package of social science
1
CHAPTER 1: INTRODUCTION
1.1 Background of the Study
The Internet is creating a shared, real time commercial space and the degree to which
corporations are leveraging the unique internet market space is an interesting research issue
(Barnes & Hunt, 2001). In business terms, one of the most important developments to arise from
the current swathe of technological advances is electronic commerce. E-commerce is simply
trading electronically: transactions involved with buying and selling products, services and
information over a network (Turban et al., 2000).
The number of Internet users around the world has been steadily growing and this growth has
provided the impetus and the opportunities for global and regional e-commerce. However with
Internet, different characteristics of the local environment, both infrastructural and
socioeconomic, have created a significant level of variation in the acceptance and growth of
ecommerce in different regions of the world. Over time, various studies have been conducted and
models have been developed to identify diffusion of e-commerce in different environments.
(Wolcott, et. al. 2001; Travica, 2002) These models have looked at ―infrastructure‖ (e.g.
connectivity hardware and software, telecommunications, product delivery and transportations
systems) and ―services‖ (e.g. e-payment systems, secure messaging, electronic markets, etc.) as
the primary diffusion factors.
In addition to infrastructural issues, trust has been identified as one of the critical issues that
confront businesses that are new or utilize new business models like e-commerce. Numerous
studies have tried to find correlations between trust and experience with a new system, concept,
or relationships, including a correlation to frequency of e-commerce activity and other
researchers have noted that trust may be significantly influenced by culture of a given society.
(McKnight and Chervany, 2001; Lee and Turban, 2001) Grabner -Kraeuter observes and states
that trust is ―the most significant long-term barrier for realizing the potential of e-commerce to
consumers‖, (Grabner-Kraeuter, 2002) and others state that trust will be a ―key differentiator that
will determine the success of failure of many Web companies‖, (Urban et. al, 2000).

2
Managing the business processes that facilitate order fulfillment and delivery of goods and
services supplied to customers is the prime concern of operations management. Consequently,
the study of the processes of order fulfillment and delivery in the Internet era necessitates an
understanding of the interaction between operations management and information systems
(Lyons, 1998). Despite the growing importance of ecommerce to organizations of all types, e-
operations is a neglected area of study. Yet many of the problems associated with ecommerce
have centered on an inability to ‗deliver the goods‘, often literally. Effective and efficient
operations management is as important in e-commerce as it is in traditional business (John et al.,
2002).
The adoption of e-commerce is tending to automate rather than re-design existing business
processes. High levels of internal information systems integration appear to be associated with
low levels of business process integration. Business process management is a systematic
approach to improving an organization's business processes. BPM activities seek to make
business processes more effective, more efficient, and more capable of adapting to an ever-
changing environment (David et al., 2002).
There can be little doubt about the growing importance of e-commerce. Recent advances in
technology have created a surge in ―technology-based self-service‖ (Dabholkar 1996). Such
developments are changing the way service firms and consumers interact, and are raising a host
of research and practice issues relating to the delivery of e-service. Technology and e-commerce
is one leading ‗driving force‘ nowadays, in different businesses (Tavares, 2000).
1.1.1 E- Commerce
E-commerce is defined as the purchase or exchange of goods and services over the Internet,
between individual consumers, businesses or other organizations. It started out in the 1970‘s as
an industry standard called EDI (Electronic Data Interchange) which was a structured way of
exchanging data between companies, mainly to simplify purchasing and supply procedures.
However, EDI required the usage of expensive and complicated private networks which nullified
its impact on consumers and small enterprises. The advent of the World Wide Web, which used
the Internet and its low cost and ease of entry, radically changed this landscape to allow access

3
by individual customers as well, thus revolutionizing trade forever (Rincon et al, 2001). The
convenience of being able to purchase goods and services without time and geographical
constraints has led to the rapid uptake of e-commerce, and one of the sectors at the forefront of
the e-commerce revolution has been the air-travel industry.
Laudon and Traver, (2009) define electronic commerce as the use of the internet and the web to
transact business or the use of digitally enabled commercial transactions between and amongst
organizations. E-Business is the term used to describe the information systems and applications
that support and drive business processes, most often using web technologies, e-Business allows
companies to link their internal and external processes more efficiently and effectively, and work
more closely with suppliers and partners to better satisfy the needs and expectations of their
customers, leading to improvements in overall business performance, (National B2B Centre,
p.16). This concludes that when e-commerce is combined with information systems of the firm it
results to the firm doing e-business. The common element is the effective implementation of
business activities using Internet technologies.
The technologies behind e-commerce are the internet and the worldwide web. According to
Laudon and Traver, (2009) the internet is a worldwide network of computer networks built on
common standards. Created in the late 1960‘s to connect a small number of mainframe
computers and their users, the internet has since grown into worlds‘ largest network connecting
over 1.2 billion computers worldwide. The internet links businesses, educational institutions,
government agencies, and individuals together, and provides users with services such as e-mail,
document transfers, newsgroups, shopping, research, instant messaging, music, videos and news.
The Internet is changing the way customers, suppliers and companies interact, creating huge
opportunities as well as unforeseen competitive threats. In much the same way as it is redefining
external relationships with suppliers, customers and alliance partners, the Internet is also
changing the way companies work internally, collapsing boundaries and redefining relationships
among different functions, departments and divisions. In just a few years, the Internet has
profoundly affected the basis of competition in many industries. Instead of the traditional focus
on product features and costs, the Internet is shifting the basis of competition to a more strategic
level changing the business models that companies use to organize themselves, engage in
4
relationships and conduct their most basic transactions with customers and suppliers (Callahan
and Pasternack, 1999).
Business to Business (B2B) is that model of e-commerce whereby a company conducts its
trading and other commercial activity through the net and the customer is another business itself
(Joseph, 2004). Business to Consumer (B2C) applies to any business that sells its products or
services to customers over the internet for their own use. This includes information sharing.
Business to Government (B2G) applies between companies and the public sector. Use of internet
in public procurement, licensing procedures and other government related operations. Consumer
to Consumer (C2C) applies between private individuals or consumers. Consumers to Business
(C2B) transactions involve reverse auctions which empower consumer to drive transactions. For
example, when competing airlines give a traveller best travel and ticket offers in response to the
traveller‘s post that she want to fly from point to another. Mobile commerce is the buying and
selling of goods and services through wireless technology (Hitesh et al., 2011).
E-commerce applications adopted by airlines in B2B include maintenance planning and control
on revenue Management, revenue accounting systems, supply chain management and
procurement and supplier relationship. B2C include implementing effective distribution channels
like online selling, use of joint airline portals or online travel agents, effective customer
relationship management systems, simplifying passenger travel through emphasis on self service,
e-ticketing, automatic check-in, including baggage, common use of self-service check in kiosks,
ticket changing, single Passenger Name Record, self-service check in, automated customer
transfer (Rigas, 2006)
The concept of E-commerce is to support trade with the computing system with high dynamic
and open information technology. E-commerce, also known as doing business without paper,
which includes a messaging system, check, pay and product delivery. In this system, electronic
data exchange, process communication (computer to computer applications) in the information
business is a branch of this system. Trading partners (sellers, buyers or middlemen) global
electronic market system meets the Internet. Electronic market is a system that connects
computers to each other. All commercial activities from finding customers or suppliers,
5
negotiations, contracts, agreements and settle payments electronically place safely and efficiently
(Turbans, 2006).
Technological advancement has become the strength point of a dynamic economy (resources).
The recent increase in development of information communication technology (ICT) has
provided suitable ground for the improvement of the organizations‘ performance. With the
development of these technologies in business and trade, the organizational performance is
gaining an unprecedented improvement. This improvement can obviously be investigated in
operational, financial and market sectors. Organizations are increasingly seeing the benefits
arising from e-commerce as they expand geographical coverage giving them a larger potential
market into which they can sell their products and services (Rastogi, 2002). Some of the sectors
that have high potential for early adoption of e-commerce are: Financial (stock exchanges and
banks), automobiles industry, retail, tourism industry and manufacturing.
Some researchers argue that information technology has value but it is not a source of
competitive advantage because infrastructure, technology and technical skills are easily copied
and obtained (Hayes & Wheelwright, 1984; Barney, 1986).
Bharadwaj, (2000) argued that infrastructure information technology alone cannot be viewed as
independent components. Developing integration infrastructure will take time, effort, learning
experience and financial risk (Weil & Broadbent, 1998). Competitors will not receive the same
results as a result of the investment in information technology and the same because not enough
time, ambiguity and social complexity (Dierickx & Cool, 1989). For example, Dell and Nike
have a complex arrangement of information technology and expand gradually in several years.
Both have infrastructure information technology that has links with business activities that
support coordination between business partners and customers worldwide. Routine and complex
business relationships are difficult to be copied and copied, and the unique characteristics of
information technology or ecommerce are also fixed. In all these situations where technological
resources for information technology and ecommerce value, if it is not easily imitated, and if it is
distributed throughout the various organizations, and is complex, it may be a source of
competitive advantage.

6
E-commerce technology has the potential because it is able to integrate, develop and combine
with other resources such as management skills, business networking, synergy information and
customer networks. Research is seen together with the ability to rapidly changing environment
(especially when technologies and markets still grow) may help to explain why e-commerce
capabilities with excellent performance in the influence of an organization. Zhang and Lado's
(2001), the involvement of information technology into a competitive advantage depends on the
"How do and how it is used". In other words, whether e-commerce technology can be a source of
organizational capability depends on how it is used to produce results. E-Commerce Technology
does not have such features are rarely found, not moving and cannot be copied, but it is a source
of complement to enhance the strength of other resources and capabilities and at the same time
can reduce the weaknesses of other sources (Fay, 2000; Teng & Cummings, 2002). Without
combination with other resources, use of information technology cannot achieve gains beyond
normal levels. Thus the use of E-commerce can be considered as able to merge and integrate
with other resources to create competitive advantage (Amit&Schoemaker, 1993; Bharadwaj,
2000).
1.1.2 Concept of Financial Performance
Performance is a contextual concept associated with the phenomenon being studied (Hofer,
1983). In the context of organizational financial performance, performance is a measure of the
change of the financial state of an organization, or the financial outcomes that results from
management decisions and the execution of those decisions by members of the organization.
Since the perception of these outcomes is contextual, the measures used to represent performance
are selected based upon the circumstances of the organization(s) being observed. The measures
selected represent the outcomes achieved, either good or bad.
Most management research focuses on the determinants of performance. For instance, Kunkel
(1991) proposed that new venture performance was a function of new venture strategy and
industry structure. Kunkel tested the relationship between two independent variables and the
dependent construct of new venture performance. The focus of Kunkel‘s research was on the
hypothesized relationship between certain independent variables and certain dependent variables.
The independent variables are proposed as determinants of the changes in the dependent
7
variable. The changes in the dependent measure are considered to represent ―performance‖
caused by the variations in the independent measures. The critical point here is that performance
as a concept involves measurement of the effects of organizational actions.
Performance is the outcome of all organization operations and strategies (Wheelen and Hunger,
2002). Measuring financial performance accurately is critical for accounting purposes and
remains a central concern for most organizations. Performance measurement systems provide the
foundation to develop strategic plans, assess an organization completion of objectives and
remunerate managers (Ittner and Larcker, 1998).
Financial performance is essential to the survival of firms in the competitive and uncertain
environment. Management is eager to learn how the effort of service quality improvement is
related to an organization performance (Sousa and Voss, 2002). Financial performance
ultimately reflects whether or not service quality is realized in a firm. Financial performance is
conceptualized as the extent to which a firm increases sales, profits and return on assets. These
are the indicators of financial performance and manifest the wellbeing of a firm collectively.
In this study, the performance of the airline is measured by its return on assets (ROA). Illo,
(2012) defined ROA as the net income divided by total assets. ROA will reflect how well an
airline‘s management is in using the airline‘s real investment resources to generate profits and
the ROA is widely used to compare the efficiency and operational performance of airlines as it
looks at returns generated from the assets financed by the airline. For this reason, ROA has been
chosen as the dependent variable.
Another measure of profitability is the return on equity (ROE) which indicates how effectively
the management of the enterprise is able to turn the shareholders‘ funds (i.e. equity) into net
profit. It is the rate of return flowing to the shareholders (Samad, 1999). Though not widely used
as ROA, it is also a standard indicator to compare financial performance in organizations. The
higher the ROA and ROE reflect higher managerial efficiency of the organization and vice-versa
Illo (2011).
Hassan and Bashir, (2003) state that reasons for using ROA as one of the measurements of an
organization‘s profitability is that it shows the profit earned per unit of asset and reflects the
8
management ability to utilize real investment resources to generate profit. Furthermore, Rivard
and Thomas (1997) argue that profitability is best measured by ROA because it is not distorted
by higher equity multipliers.
1.1.3 E-commerce and Financial Performance
E-commerce allows firms to sell products, advertise, purchase supplies, bypass intermediaries,
track inventory, eliminate paperwork, and share information. In total, electronic commerce is
minimizing the expense and cumbersomeness of time, distance and space in doing business,
which yields better customer service, greater efficiency, improved products and higher
profitability (Asiabugwa and Munyoki, 2012)
To survive in the modern marketplace, air-travel businesses need to give consumers what they
want, which is low prices and a wide choice. E-commerce affords them a way to do that, but to
utilize it without diluting revenue, the airlines need to implement yield-management systems that
can optimize revenue. These systems look at historical bookings and probable trends to forecast
passenger‘s willingness to pay the asked fares. According to Yang (2001), the revenue
management system should instantly determine the flights, itineraries, prices and number of seats
to put on the web, as well as constantly monitor the markets for relevant indicators. Only under
these circumstances would the airline be able to dynamically, optimally and proactively price all
seats at varying price structures in a real-time response to customer requests. Reid and Bojanic
(2006) define revenue management (RM) as ―the combining of people and systems in an attempt
to maximize revenue by coordinating the processes of pricing and inventory management.‖
According to de Alarcon (2005, Telefonica CSR), the actual cost per transaction goes down
considerably with e-commerce based transactions as opposed to traditional ones. Online
promotions are not only much cheaper than traditional promotions, such as travel catalogues and
media advertising, but their interactivity and possibility of personalization also makes them more
effective A paper ticket costs on average five euros more than an e-ticket when everything is
taken into consideration. Additionally, with Global Distribution Systems (GDS) and Customer
Relationship Management (CRM) based reservation tools, the middleman i.e. the travel agent,

9
can be cut out, and thus the 5-25% commission that these charged can now be either passed on to
the customer in savings or retained by the company as profit.
Rigas (2006) states that CRM is a quantum step in marketing where customer profiles are created
on the airline database, customer‘s travel patterns, product and service priorities and much more.
These are customized to the passengers‘ needs and airlines may charge a premium for this. CRM
targets high yield passengers or those willing to travel off-peak thereby enhancing load factors.
CRM comprises the acquisition and deployment of knowledge about customers to enable an
airline to sell more of their product and service more efficiently (Flanagan and Sadie 1998).
According to Jiang, (2003) electronic Customer relationship management (e-CRM) involves far
more than automating processes in sales, marketing, and service and then increasing the
efficiency of these processes. It involves conducting interactions with customers on a more
informed basis and individually tailoring them to customers' needs. There are only three ways to
increase the profitability of a customer base; acquire more customers, optimize the value of
existing customers, or retain the right customers longer. All of these benefits must be achieved
with lower costs. Airlines realize that an integrated e-CRM strategy will allow them to manage
customer and supplier relationships more effectively than ever before, allowing them to build
long-term customer relationships, brand loyalty and repeat sales that result in increased,
sustained profitability.
The challenge is how to overcome hurdles, minimize the risk and guarantee results. Rather than
seeking all the answers before making an effective start in e-Business, companies should first
define a clear roadmap of their objectives, implement and measure the success of a pilot project,
and build from there. The greatest danger is allowing the pace at which the market and
technologies are changing to delay the opportunity that is e-Business. The end result is a better
bottom line-successful e-CRM can mean millions of dollars in incremental revenue from
increased customer retention, greater revenue per customer, the ability to cross-sell and up-sell
customers, better customer loyalty and greater customer satisfaction. That is the true potential of
an IT infrastructure built around enterprise storage-something every company needs to consider
as a means to gain competitive advantage in both the old and the new economy.

10
The GDS system has revolutionized air-travel behind the scenes, by ―improving product
distribution and customer service through dynamic ticket pricing and frequent flyer
programmes‖ (Smith et al, 2001, Interfaces). The systems have consolidated information from
airlines across the globe and in the process brought airlines, agents and consumers together in
one big online marketplace. These have expanded to include ancillary services such as hotel
reservations and car rentals, thus providing customers with more convenience and value-for-
money while at the same time helping airlines to improve efficiency and generate extra income.
Emmer et al. (2003) explain ―travel agents‘ computer systems, which were referred to as
computer reservation systems (CRSs) for years, are now called global distribution systems
(GDSs) because of their global marketing reach‖. The four GDSs – Amadeus, Galileo, Sabre and
World-span – have been referred to as ―the backbone of the modern travel distribution system‖
1.1.4 Airline Industry
Airline profits continue to be throttled down by the global economic downturn, high fuel costs
and the prospect of ever more stringent environmental regulations. In order to survive and
prosper in these conditions, airlines must rationalize their processes and increase asset utilization
to a greater degree than ever before. This will require business-driven IT transformation—that is,
the fundamental redesign and integration of business systems and processes within and across
airline functions. Airlines will have to carefully manage the internal demand for IT services,
implement project delivery methodologies that focus on business process design and change
management, and adopt a sourcing strategy that enables them to match suppliers to project goals
on the basis of the capabilities and degree of collaboration required. Those that do will be able to
significantly raise their business performance and earn improved returns on their IT investments.
E-commerce has a significant impact on business costs and productivity and has a chance to be
widely adopted due to its simple applications. Thus it has a large economic impact. It gives the
opportunity for ―boundary crossing‖ as new entrants, business models, and changes in
technology erode the barriers that used to separate one industry from another. This increases
competition and innovation, which are likely to boost overall economic efficiency. The potential
value of ecommerce has received extensive coverage in research and trade publications with
several successful e-commerce stories. E –commerce will open fresh sources of revenues and
11
opportunities for firms, it will bring more dialogue between business and consumer on a number
of levels within the supply chain that will result in greater revenue generation. Airlines rely
heavily on e-commerce for many purposes. One primary benefit is it reduces the number of
employees needed, save money through lower costs of reservations, sales offices, advertising and
agent fees and commissions (Hoq et al., 2005)
Through the e-commerce platform, Airlines enhance their relationship with their passengers who
will book directly with the airline rather than through travel agents. In addition, airlines increase
their revenues through sales of optional services such as baggage, seat assignments and also
ancillary services such as car-hire, hotels and insurance. E-commerce enables airlines to offer
more services to customers, more channels to deliver their business, more intelligence to
understand their business, greater efficiency and lower cost.
In the Financial year 2012/2013, direct costs on commission on sales for Kenya airways (KQ)
were KES.4.2Billion. This has considerably increased overtime due to the proportionate increase
in sales over rally. However, as web sales continue to increase, the agency commissions payable
with respect to web sales have been zeroed since the passengers do not have to book via the
agent but use the web. For KQ, web sales performance has continued to register improvements in
response to various e-commerce initiatives that have been put in place to drive sales through this
channel. The initiatives include new website look and a new web booking portal. During the
FY12-13, a total of USD 34.8Million sales were driven through the web compared to USD
28.8Million in the FY11-12 representing a growth of 21%. At KQ, online sales are significant in
Kenya, Europe and middle -East due to high internet penetration in these markets (Kenya
Airways Limited Published Financial statements, March 2013). Online sites continue to
strengthen the profitability by refining their business models and leveraging the capabilities of
the internet.
Specifically, this study establishes whether there‘s an effect between the dependent variable i.e.,
financial performance measured by return on assets and the independent variables: Number of
passenger transactions via the web and agency fee that should considerably decrease due to the
direct use of the web platform as travel agents are by-passed.
12
1.2 Research Problem
The cutting edge for business today is electronic commerce. The main vehicle of electronic
commerce unequivocally is the Internet and the World Wide Web. With the rapid advancement
in the Internet software and hardware and the infrastructure, the electronic commerce is
becoming more and more popular. Use of ICT in business has been able to make valuable strides
towards achieving the goals of organizations that indeed has increased customer satisfaction and
profitability. E-commerce integration covers a wide range of application such as electronic
Marketing (Mazandarani, 2010) customer support services (Molla and Licker, 2001), electronic
ordering and delivery (Senn, 2000) and electronic payment systems (Hua and Guan, 2000).
Today e-commerce is perceived as a new business approach toward customer satisfaction and
profitability since it is related to activities that improve efficiency and effectiveness of business
activities leading to high organizational performance.
E-commerce is changing all business functional areas and their important tasks, ranging from
advertising to paying bills. E-commerce has attracted significant attention in the last few years.
This high profile attention has resulted in significant progress towards strategies, requirements
and development of e-commerce applications (Upkar, 2002; Afshar et al., 2010). E-Commerce
offers lower costs per business transaction, especially with respect to mailing and paper costs
(Lawal, 2010). Fewer mistakes occur in paperwork because fewer people handle the data.
Customer satisfaction is heightened due to better access to order and promotional data. The old
rules are breaking down. Companies now share information with competitors, producing
―competition‖. Suppliers and buyers share information: Economic and cultural boundaries are
disappearing – in some market segments businesses must be global (Johnson, 2003).
While various studies have been done in reference to e-commerce, none has been done in regards
to the effect of e-commerce on the financial performance of airlines in Kenya depicting the
existence of a knowledge gap. The various studies that have previously been done surrounding
the aspects of E-commerce include a survey of potential for adoption of ecommerce by tour
operators in Nairobi (Mbuvi, 2000), An investigation of the business value of e commerce
(Muganda, 2001), A survey of the impact and challenges of Business ecommerce in Kenya

13
(Kiyeng, 2003), An evaluation of e-commerce application by microfinance institutions in Kenya
(Kipkech, 2009). Wanyoike et al., 2012 did a study on ICT attributes as determinants of E-
commerce adoption by formal small enterprises in urban Kenya, and they found that small
formal enterprises in urban Kenya are influenced to adopt e-commerce by being able to observe
visible results emanating from its use such as simplification of work routines, efficient
coordination among various value chain partners and improved customers services that leads to
customer satisfaction. These studies show the effectiveness of e-commerce applications on the
improvement of operational performance of business. Eid (2011) studied the use of e-commerce
in business management and concluded that the use of electronic commerce mechanisms is
effective on market share and customer satisfaction of the companies.
Allen and Fjermestad (2001) showed that electronic commerce applications had a high impact on
new products development and product quality improvement which itself increases the
market share and customer satisfaction. Stroehle (2008) was of the opinion that the application
of electronic commerce in the industry is influential on the improvement of the effectiveness of
marketing activities. The financial effect of e-commerce in airlines has not been an area of
emphasis in these studies and as such the reason for this study.
1.3 Research Objective
This research project will establish the effect of e-commerce on the financial performance of
airlines in Kenya with specific reference to KQ which is the national carrier of Kenya.
1.4 Value of the Study
This study is of great importance considering that e-commerce has become a necessity in the
airline industry to remain competitive.
The government of Kenya will be enlightened in a bid to make policies relating to e-commerce
and IT in Kenyan corporations. The government shall be keen to harness the IT infrastructure in
the country as the world continues to increasingly rely on the internet as the e-commerce
platform. E-commerce has introduced new business models and competitive strategies requiring
the government involvement to maintain a free, open, and competitive market place. Legislative
14
government branches will also have to set rules regarding unique economic aspects of e-
commerce for example taxing online purchases for tax regimes where there is sales tax. In
addition, e-commerce may require government rules to protect travellers from privacy and
security issues.
The study is useful to airline management as airlines continue to invest heavily in IT as a
necessity in order to show the potential benefits from a financial angle. Airline governing bodies
like KCAA, AFRAA, KAAO and IATA can know the kind of support the airlines need and offer
relevant training to enhance appropriate strategy development. Existing, current and potential
investors in the aviation industry will get information trends in the airline industry as a result of
strategy implementation. Travel agents are also made aware of the technology and other IT
innovations in the low cost framework adopted by some airlines.
Customers will be able know the developments in the airline industry and they can be part of the
future developments in the industry by actively giving their feedback and making use of the
dynamic products being offered by the e-commerce platform through the airline websites.
As new challenges and opportunities emerge in the business environment, change is inevitable.
This calls for continuous research to ascertain the actual situations rather than living on
assumptions. The findings of this study therefore will prove useful to scholars and academicians
who may wish to use them as a basis for further research on this subject.
15
CHAPTER 2: LITERATURE REVIEW
2.1 Introduction
This chapter provides the theoretical review of the study. In the theoretical review two main
theories have been covered, the technological organizational and environmental (TOE) model
and the resource based view theory. The chapter will also focus on the various studies done with
respect to ecommerce and IT and show how financial performance has been measured.
2.2 Theoretical Review
E-commerce is an unfolding phenomenon in view of technological advancement. From the
research perspective, technological innovations have led to the development of various theories
related to the diffusion of information technology (IT) and information systems (IS). A review of
literature indicates that there is a rich stream of research focusing on technology diffusion on
individuals and organizations (Cooper and Zmud, 1990). Some of the popular areas studied were
on adoption and/or usage of different types of technologies such as electronic fund transfer
(EFT), electronic data interchange (EDI), enterprise resource planning, adoption drivers,
adoption barriers or hindrance, and many others. In the late 1990s, however, the focus seems to
shift to e-commerce adoption. In line with the objectives of this research, the following sub-
sections discuss one of the more popular models, i.e. the TOE model and the corresponding RBV
theory in brief.
2.2.1 Technological, Organizational and Environmental Model
Realizing the importance of technology adoption, Tornatzky and Fleischer (1990) developed the
TOE model to evaluate technology adoption. The TOE model is consistent with the theory of
innovation diffusion in organizations by Rogers (1983). The model identifies three aspects of
firm's characteristics that influence the process of adopting, implementing and using
technological innovations (Robertson, 2005) which is explained below:
1. Technological context. Technological context describes both existing and new
technologies relevant to the firm such as prior technology usage, and number of

16
computers in the firm which determines the ability of the firm to move to e-commerce
and other technology initiatives.
2. Organizational context. Organizational context refers to descriptive measures related to
organizations such as firm scope, firm size and managerial beliefs.
3. Environmental context. Environmental context focuses on areas which the firm conducts
its business operations, with the priority given to external factors influencing the industry
that have significant impacts on the firm such as government incentives and regulations.
According to De Pietro et al. (1990), the three suggested elements interact with each other in
influencing technology adoption decisions.
One can safely conclude by drawing upon prior theoretical and empirical evidences that the TOE
model has been a popular foundational model used for studying the drivers contributing to
successful e-commerce initiatives from the interactions of the three characteristics, particularly in
examining issues such as adoption, implementation and usage.
Dedrick and West (2003), however, believe that the TOE framework is just taxonomy for
categorizing variables and does not represent an integrated conceptual framework or a well
developed theory. However, they agree that the model is a useful analytical tool to distinguish
between inherent qualities of an innovation itself and the motivations, capabilities, and broader
environmental context of adopting organizations. As e-commerce has been viewed as a global
technological innovation (Kraemeret al., 2006), more meaningful insights on the whole process
of e-commerce diffusion can be generated if the TOE model is used to study e-commerce
adoption and value creation in conjunction with other theories or model. To achieve this, Zhu
and Kraemer (2005) combined the TOE model with the RBV theory to study the post-adoption
variations in usage and value of e-business. As the drivers of e-commerce are categorized into
three characteristics; technology, organization, and environment, the value creation of e-
commerce is analyzed from a resource-based perspective that stems from the unique
characteristics of the internet, i.e. the front-end functionalities and back-end integration (Zhu,
2004). The next sub-section discusses the RBV theory and relates it to the current research.

17
2.2.2 Resource-based view (RBV) Theory
The RBV theory has been developed to facilitate the understanding of how organizations achieve
sustainable competitive advantages (Caldeira and Ward, 2003). Rooted in the strategic
management literature, the RBV theory focuses on the idea of costly-to-copy attributes of the
firm as sources of business returns and as a means to achieve superior performance and
competitive advantage (Conner, 1991). The theory argues that sustained competitive advantage
is generated by the unique bundle of resources at the core of the firm where business owners
build their businesses from the resources and capabilities that they currently possess or acquired.
In general, the RBV theory addresses the central issue of how superior performance can be
attained relative to other firms in the same market and posits that superior performance results
from acquiring and exploiting unique resources of the firm (Saffu, 2004).
Prior Information System (IS) literature indicates that the RBV theory has been used to analyze
IT capabilities (Mata et al., 1995) and to explain how the business value of IT resides more in the
organization's skills to leverage on IT as compared to the technology itself (Soh and Markus,
1995). It shows that the business value of IT depends on the extent to which IT is used in the key
activities in the firm's value chain (Zhu and Kraemer, 2005). In relation to e-commerce
innovation, the RBV theory is used to demonstrate how firms leverage their investments in e-
commerce to create unique internet-enabled capabilities that determines a firm's overall e-
commerce effectiveness (Zhu, 2004).
Although some people might argue that e-commerce technologies are already available in the
software and hardware market (e.g. EDI and EFT) for which the investment in e-commerce will
not create value, there is a counterargument that regardless of how commodity-like the
technology is, the architecture that removes the barriers of system incompatibility and makes it
possible to build a corporate platform for launching e-business applications is never a
commodity (Keen, 1991). The costly-to-copy attributes of e-commerce capabilities are tightly
connected to the resource base and embedded in the business process of the firms but the degree
varies as the firms themselves are unique with respect to their resource endowments (Smith et
al., 2001). As such, the value creation through information sharing and the availability of online
communities will lead to performance advantages in e-commerce (Lederer et al., 2001).
18
Looking at the application of the RBV theory in discussing e-commerce usage and value
creation, Zhu and Kraemer (2005) attempt to integrate the TOE model and the RBV theory as
their conceptual model to assess the use and value of e-business in organizations. By
investigating the e-business functionalities that make use of the unique characteristics of the
internet, which consequently enable value creation, they posit that e-business leverages the
unique characteristics of the internet to improve business performance. In this case, e-business
capabilities are classified as front-end functionalities and back-end integration. The front-end
functionalities refer to the medium in which customers interact with the marketspace. It refers to
the seller's portal, electronic catalogues, a shopping cart, a search engine and a payment gateway.
On the other hand, activities related to order aggregation and fulfillment, inventory management,
purchases from supplier, payment processing, packaging, and delivery are known as back-end
integration of the business (Turbanet al., 2006). By applying the RBV theory in looking at the
post-adoption variations in usage and value of e-business, Zhu and Kraemer (2005) found that
both front-end functionalities and back-end integration contribute to value creation of e-business,
but back-end integration has a much stronger impact.
2.3 Review of Empirical Studies
Empirical evidences and results from various studies show similar trends on the positive impact
of e-commerce and technological innovation.
Hoq et al., 2005 studied the economic impact of e-commerce. The objectives of the study was to
show the impact of e-commerce on business cost and productivity, to evaluate status of e-
commerce, to identify how e-commerce reduces cost of customer services and after sales
services. The study used secondary information from published books, journals and official
statistical documents. Findings of the study were e-commerce reduces the cost of executing a
sale, costs associated with the procurement of production cost and costs associated with making
and delivering the product.
Dimitrios (2004) discusses that Information Communication Technologies (ICT‘s) have
revolutionalized the entire business world. The airline industry in particular has fostered a
dependency on technology for their operational and strategic management. Airlines were early
19
adopters of ICTs and have a long history of technological innovation, in comparison to many
other travel and tourism businesses. This paper discusses comprehensive research, including
exploratory research with airline executives, using qualitative methods to examine the use of
ICTs in the contemporary airline industry and to discuss recent developments in the industry.
The work demonstrated that the airline industry was using the Internet to improve its distribution
strategy and reduce costs. It also used Intranets and internal systems to develop tactical and
strategic management. In addition, Extranets were being gradually used for communicating with
partners and to support business-to-business (B2B) relationships. The effort demonstrated that
ICTs will be critical for the strategic and operational management of airlines and will directly
affect the future competitiveness of airlines.
Jawabreh et al., 2012 explored the impact of Information Technology on Profitability of Airlines
Industry on Royal Jordanian Airlines. The data was collected from the financial statements of
Royal Jordanian Airlines and analyzed by using financial and statistical tools. The main
objective of the study was to examine the relationship between IT and financial performance by
estimating the contribution of IT investment to airlines performance by financial ratios, in the
same year of investment, the second year (one-year lag effect), or the third year of the
investment (two-year lag effect). From this study, it showed that some ratios showed good
results and the airline still had the opportunity to improve effectively its financial performance
and long term and short term solvency in future.
Hammer (1990) stresses that organizations should ―obliterate rather than automate‖ believing
that technology are often introduced for technology sake without contributing to the overall
effectiveness of the operation. However, traditional banks lack of resources usually result in a
compromise situation (Vossen, 1999). It is important to link technology to innovation in
sustaining competitiveness. Organizations that can combine customer value innovation (Kim and
Mauborgne, 1999) with technology innovation have increased chance of enjoying sustainable
growth and profit.
Wilson (1993), Freund , Konig and Roth (1997), Radeck, Wenninger and Orlow (1997),
O‘Sullivan (2000) and others have been engaged in unending discourse on the positive payoffs
emanating from the utilization of IT in banks and other financial institutions. Such academic

20
debates have resulted in the origin of the term ‗information technology productivity paradox‘
which is concerned with appraising the impact of IT on operational efficiency and the
productivity of organizations.
A cursory look at the industry level studies of the nineties such as the works of Wilson (1993),
Jordan, John and Kartz (1999), Furst, Lang and Nolle (1998) portray that in many instances a
positive correlation is posited between increased investment in IT and productivity.
On the contrary, other works such as Strassman (1990), Morrison and Berndt (1990), Dos-Santos
and others (1993) show that an additional investment in IT does not necessarily contribute
positively to productivity. Such works argue that the estimated marginal benefits are less that the
estimated marginal costs; that for each additional dollar spent in IT equipment, the marginal
increase in measured output was only eighty cents. Brynjolfsson and Hitt (1996) noted that most
of such results from researches account for what he referred to as the ‗economic theory of
equilibrium‘. This means increased profitability is not necessarily a by-product of increased
spending in information technology.
Ojung‘a (2005) investigated e-commerce services in commercial banks in Kenya. His study gave
various outputs and some of them included bank to bank e-commerce service utilization, bank to
customer electronic payments methods and extent of usage of electronic payment methods. The
e-commerce services by commercial banks in Kenya has been influenced by the need to increase
customer base, expand geographical reach, meet customer demands and keep pace with
technological changes. The impact of the use of technology has led to improved customer
service, increased revenue, reduction of operation and cost and increased market share. Magutu
et al., (2009) modelled the effects of e-commerce adoption on Business Process Management:
Case Study of Commercial Banks in Kenya.
Dinda (2010) Surveyed e-commerce Strategies and Models in Kenya. The study established the
strategies and models that the Kenyan online companies have employed, the challenges they
encounter and how to solve them so as to enjoy the e-commerce benefits and use them as a tool
for strategic management of the organizations, by use of both qualitative and quantitative
research approach. Web analysis and interviews were done to get data of all online companies.

21
Nyaanga (2007) did the effects of e-commerce adoption on business process management in
commercial banks in Kenya and found out that most banks have embraced use of e-commerce
and focused their businesses in collaborating with business partners and this has improved the
image of the banks besides profit making. The results also showed that the major barriers
encountered by banks in the increased use of e-commerce in business process management are
conservative organizational cultures and lack of industry standards.
Korir (2005) studied the impact of e-commerce as a facilitating tool for business on tour
operators in Nairobi and found out that many tour operators have embraced e-commerce and are
applying it as business tool for business. Findings were that many tour operators enjoy the
benefits of e-commerce as a tool of business. However, there are factors that are influencing the
operations such as lack of privacy, insecurity in payments and information abuse.
A study on the effects of technological innovations on the financial performance of commercial
banks in Kenya depicts that most Kenyans trust the use of the ATM as compared to other
technological innovations. It also depicts that online account opening has not been widely used
in Kenya (Kimingi, 2010). A study on the relationship between IT conceptualization and bank
performance depicted that organizations conceptualize IT as a means to create impact on its
performance. Organizations make decisions to adopt IT due to industrial pressure. It concludes
that firms invest in IT depending on its financial capabilities as well as its technical features.
Organizational culture or value also influences firm‘s decision making on IT investment
(Muasya and Nixon 2009).
Kariuki (2011) determined the relationship between the level of technological innovation and
financial performance of the commercial banks in Kenya. The descriptive study found that
commercial banks have continuously employed various technological innovations which have
led to increased financial performance of commercial banks in Kenya through increased sales,
return on equity and profits increment.
Asiabugwa and Munyoki (2012) study aimed at establishing the relationship between e-
commerce strategy and performance of commercial banks in Kenya, and the factors influencing
the adoption of ecommerce strategy. The study adopted a cross sectional design, and targeted
22
commercial banks in Kenya under the umbrella of Kenya Institute of Bankers Association (KIB).
Data analysis was through measures of central tendency, dispersion and correlation analysis.
The results indicated that there was a strong relationship between the e-commerce strategy and
performance of commercial banks in Kenya. The findings also indicated that the main factors
which influenced the adoption of e-commerce strategy in banks to a larger extent are customer
support service and the payment systems.
2.5 Conclusion from Literature Review
The literature review clearly reveals that e-commerce does create an impact on the performance
of organizations. No research has been done to show the relationship between e-commerce and
financial performance of airlines in Kenya.
This study therefore has brought out the ecommerce effects to airlines and tried to measure the
value of e-commerce by focusing on the financial performance of the airline using the
profitability ratio of Return on assets and net income over a period of ten years.

23
CHAPTER 3: RESEARCH METHODOLOGY
3.1 Introduction
This chapter sets out various stages and phases that will be followed in completing the study.
The chapter describes the methodology that was used to reach the objectives of the study. In this
chapter, the research methodology is presented under the following sections; research design,
data collection procedures and finally data analysis.
3.2 Research Design
This study employed descriptive case study research design. A descriptive study is concerned
with determining the frequency with which something occurs or the relationship between
variables. According to Cooper and Schindler (2003), a descriptive study finds out the who,
what, where, and how of a phenomenon which is the aim of this study.The approach is
appropriate for this study since the researcher collects detailed information through descriptions
and is useful for identifying variables and hypothetical constructs.
According to Polit and Beck (2003), in a descriptive study, researchers observe, count, delineate,
and classify. They further describe descriptive research studies as studies that have, as their main
objective, the accurate portrayal of the characteristics of persons, situations, or groups, and/or the
frequency with which certain phenomena occur.
3.3 Data Collection Method
The study was conducted using secondary data from the financial reports of Kenya Airways for a
period of ten years from financial year March 2004 to March 2013. These reports included
audited financial statements obtained either in soft or hardcopies, any publicly available
information from the company websites and other websites and any useful financial reports that
can give more detailed information.
24
Cooper and Schindler (2003) explain that secondary data is a useful quantitative technique for
evaluating historical or contemporary confidential or public records, reports, government
documents and opinions.
3.4 Data Analysis and Presentation
The quantitative data collected was analyzed by the use of descriptive statistics using Statistical
Package for Social Sciences (SPSS) and presented through percentages, means, standard
deviations and frequencies. This was done by tallying, computing percentages as well as
describing and interpreting the data in line with the study objectives and assumptions through use
of SPSS. The information was displayed by use of tables and in prose-form. Table presentations
were used to present the data collected for ease of understanding and analysis.
The study used inferential statistics in the analysis. This included correlation and linear multiple
regression. Parsons‘ correlation was used to test the relationship of the dependent and
independent variables of the study, while linear multiple regression was used to test the impact of
the independent variables on the dependent variable. Quantitative data was presented in form of
tables while explanation of the same was presented in prose.
Regression model
The study adopted the following multiple regression model
Where:
Y1 is the value of the Dependent variable (Y), what is being predicted or explained which is
Return on Assets.
Y2 is the value of the Dependent variable (Y), what is being predicted or explained which is Net
Income.
Y3 the values of return on assets and net income respectively with control variable X3 .
a is the Constant or intercept.
25
b1 is the Slope (Beta coefficient) for independent variable X1.
b2 is the Slope (Beta coefficient) for independent variable X2.
X1 is the First independent variable that is explaining the variance in Y, that is, Number of
passenger transactions via the web.
X2 is the second independent variable that is explains variable Y, that is, Agency fee on
commission.
X3 is the fuel control variable.
e- Error term
The study had to incorporate a control variable, fuel cost, in the study. This is to be able to get
better insight of the analysis while controlling fuel, which is a major cost for the airline.

26
CHAPTER 4: DATA ANALYSIS AND PRESENTATION OF FINDINGS
4.1 Introduction
The main purpose of the study was to investigate the impact of e-commerce on the return on
assets and profitability in Kenya Airways. This chapter contains the findings and the
interpretation that will be used to ascertain the research objective of the impact of e-commerce
on return on assets in Kenya Airways. Since the study uses regression analysis, it begins by
analyzing the descriptive nature of the data, then the relationship between return on assets and
number of web users and commissions on sales.
4.2 Data presentation
4.2.1 Descriptive Statistics
Table 1: Descriptive Statistics
Net Income Return on Assets Web Pax No.s
Commission on
sales Fuel Cost
N Valid 10 10 10 10 10
Missing 0 0 0 0 0
Mean 1326.600 .106187192 75.70 3070.100 20862.200
Std. Deviation 4111.9894 .2133845539 45.721 650.2435 12288.9981
From Table 1 above, the descriptive information provided is the mean and standard deviation for
return on assets, net income, number of web passengers, commission on sales and fuel cost. This
information is for the past 10 years, making our N to be 10. Of concern from the data provided
above is the standard deviation for all the variables that were used in the study. The high
variability means that predictability of information for analysts, and even for the investors would
be a problem. This can be seen from the standard deviation of net income, which was due to
some losses made as at March 2009 and March 2013.

27
4.2.2 Return on Assets analysis
a) Without control variable
Table 2: Commission on Sales and Web Passengers on Return on Asset Regression
Model R R Square Adjusted R Square Std. Error of the Estimate
1 .479a .229 .009 .2124228815
a. Predictors: (Constant), Commission on sales, Web Pax No.s
ANOVAb
Model Sum of Squares df Mean Square F Sig.
1 Regression .094 2 .047 1.041 .402a
Residual .316 7 .045
Total .410 9
a. Predictors: (Constant), Commission on sales, Web Pax No.s
b. Dependent Variable: Return on Assets
Coefficientsa
Model
Unstandardized Coefficients
Standardized
Coefficients
t Sig. B Std. Error Beta
1 (Constant) .162 .390 .414 .691
Web Pax No.s -.003 .002 -.576 -1.178 .277
Commission on sales 4.826E-5 .000 .147 .300 .773
a. Dependent Variable: Return on Assets
The regression model provides three tables in the output for analysis. R usually represents the
multiple correlation coefficients showing the quality of prediction, while the R2 represents the
proportion of variance in the dependent variable that can be explained by the independent
variables. As shown in Table 2, R shows a value of 0.479 which indicates that the independent
variables are low predictors of Return on Assets, while R2 shows that the independent variables
explain 22.9 percent of the proportion of variance of the dependent variable, return on Assets.
28
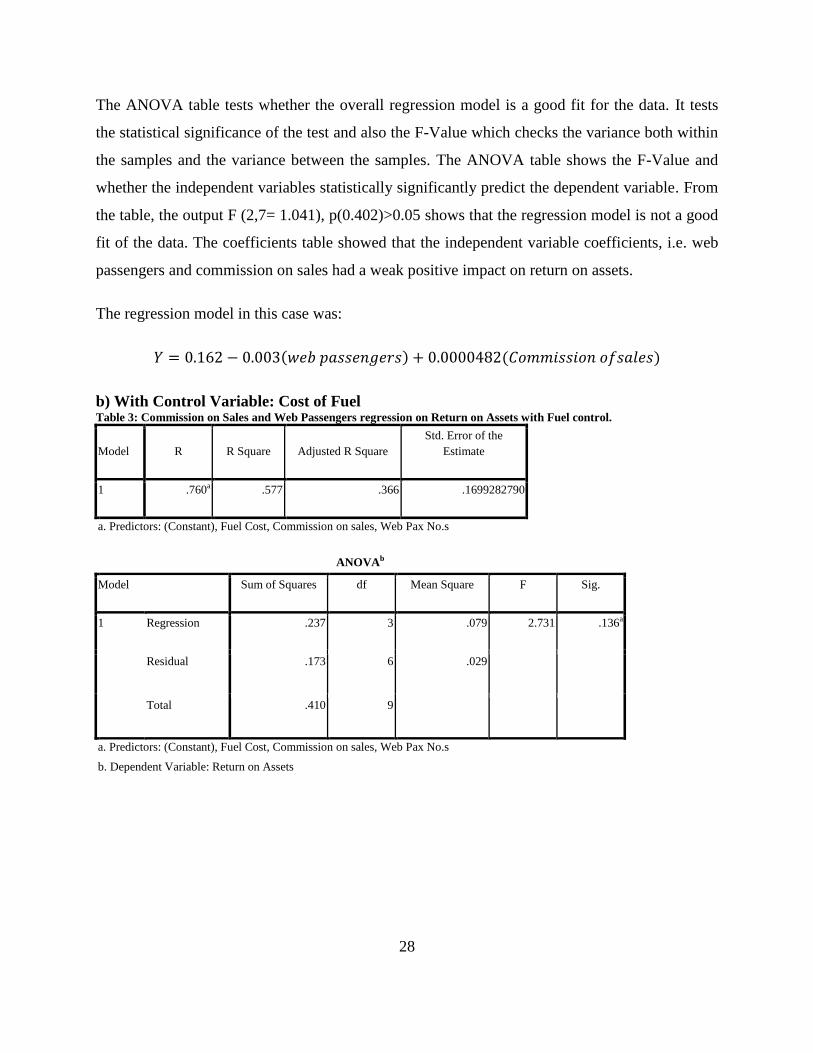
The ANOVA table tests whether the overall regression model is a good fit for the data. It tests
the statistical significance of the test and also the F-Value which checks the variance both within
the samples and the variance between the samples. The ANOVA table shows the F-Value and
whether the independent variables statistically significantly predict the dependent variable. From
the table, the output F (2,7= 1.041), p(0.402)>0.05 shows that the regression model is not a good
fit of the data. The coefficients table showed that the independent variable coefficients, i.e. web
passengers and commission on sales had a weak positive impact on return on assets.
The regression model in this case was:
b) With Control Variable: Cost of Fuel Table 3: Commission on Sales and Web Passengers regression on Return on Assets with Fuel control.
Model R R Square Adjusted R Square
Std. Error of the
Estimate
1 .760a .577 .366 .1699282790
a. Predictors: (Constant), Fuel Cost, Commission on sales, Web Pax No.s
ANOVAb
Model Sum of Squares df Mean Square F Sig.
1 Regression .237 3 .079 2.731 .136a
Residual .173 6 .029
Total .410 9
a. Predictors: (Constant), Fuel Cost, Commission on sales, Web Pax No.s
b. Dependent Variable: Return on Assets
29
Coefficientsa
Model
Unstandardized Coefficients
Standardized
Coefficients
t Sig. B Std. Error Beta
1 (Constant) -.600 .463 -1.294 .243
Web Pax No.s .003 .003 .611 .922 .392
Commission on sales .000 .000 1.297 1.999 .093
Fuel Cost -3.916E-5 .000 -2.256 -2.222 .068
a. Dependent Variable: Return on Assets
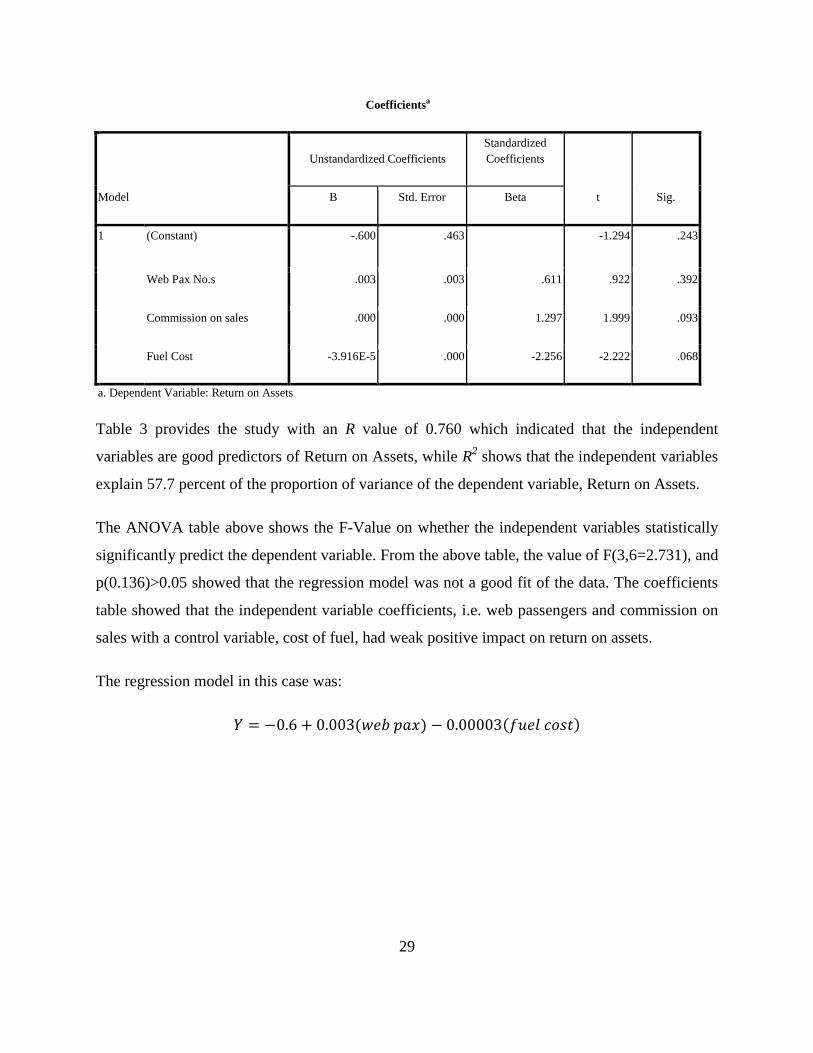
Table 3 provides the study with an R value of 0.760 which indicated that the independent
variables are good predictors of Return on Assets, while R2 shows that the independent variables
explain 57.7 percent of the proportion of variance of the dependent variable, Return on Assets.
The ANOVA table above shows the F-Value on whether the independent variables statistically
significantly predict the dependent variable. From the above table, the value of F(3,6=2.731), and
p(0.136)>0.05 showed that the regression model was not a good fit of the data. The coefficients
table showed that the independent variable coefficients, i.e. web passengers and commission on
sales with a control variable, cost of fuel, had weak positive impact on return on assets.
The regression model in this case was:
30
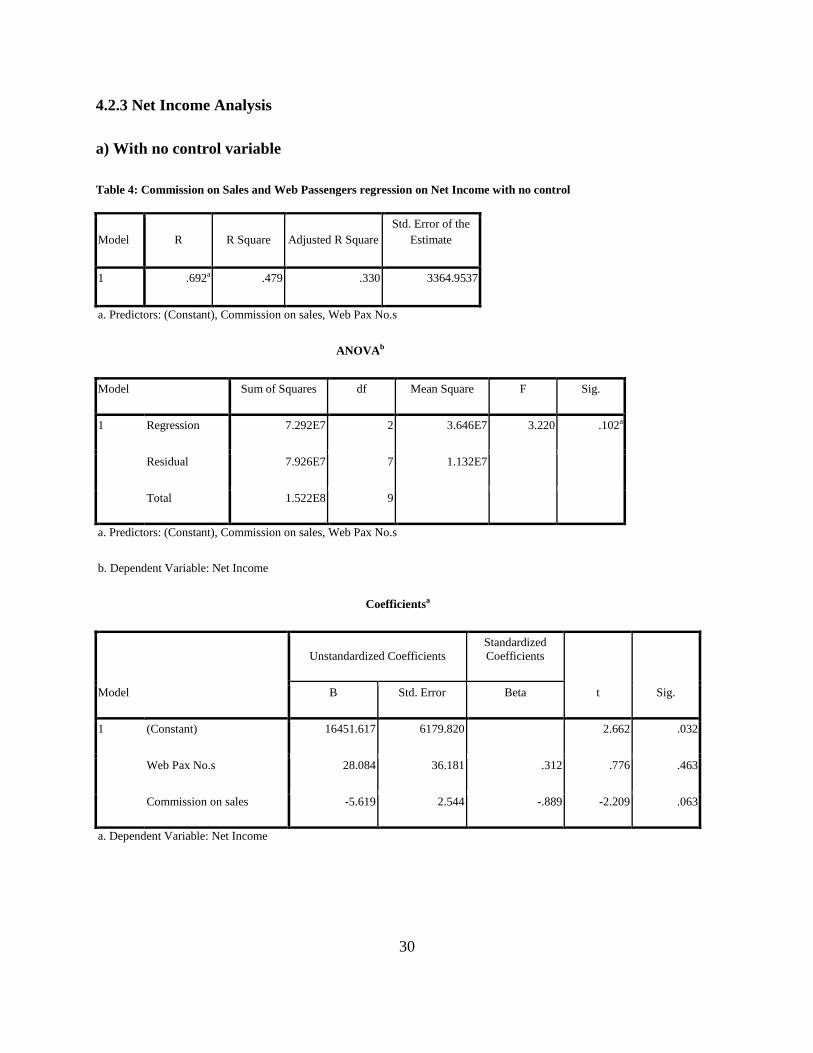
4.2.3 Net Income Analysis
a) With no control variable
Table 4: Commission on Sales and Web Passengers regression on Net Income with no control
Model R R Square Adjusted R Square
Std. Error of the
Estimate
1 .692a .479 .330 3364.9537
a. Predictors: (Constant), Commission on sales, Web Pax No.s
ANOVAb
Model Sum of Squares df Mean Square F Sig.
1 Regression 7.292E7 2 3.646E7 3.220 .102a
Residual 7.926E7 7 1.132E7
Total 1.522E8 9
a. Predictors: (Constant), Commission on sales, Web Pax No.s
b. Dependent Variable: Net Income
Coefficientsa
Model
Unstandardized Coefficients
Standardized
Coefficients
t Sig. B Std. Error Beta
1 (Constant) 16451.617 6179.820 2.662 .032
Web Pax No.s 28.084 36.181 .312 .776 .463
Commission on sales -5.619 2.544 -.889 -2.209 .063
a. Dependent Variable: Net Income
31
Table 4 provides the study with an R value of 0.692 which indicated that the independent
variables are statistically good predictors of Net Income, while R2 shows that the independent
variables explain 47.9 percent of the proportion of variance of the dependent variable, Net
Income. The ANOVA table shows the F-Value on whether the independent variables statistically
significantly predict the dependent variable. From the table above, the values F(2,7= 3.22), and p
(0.102)>0.05 showed that the regression model was not good a fit of the data. The coefficients
table showed that the independent variable coefficients, i.e. web passengers and commission on
sales had positive levels of prediction on net income.
The regression model in this case was:
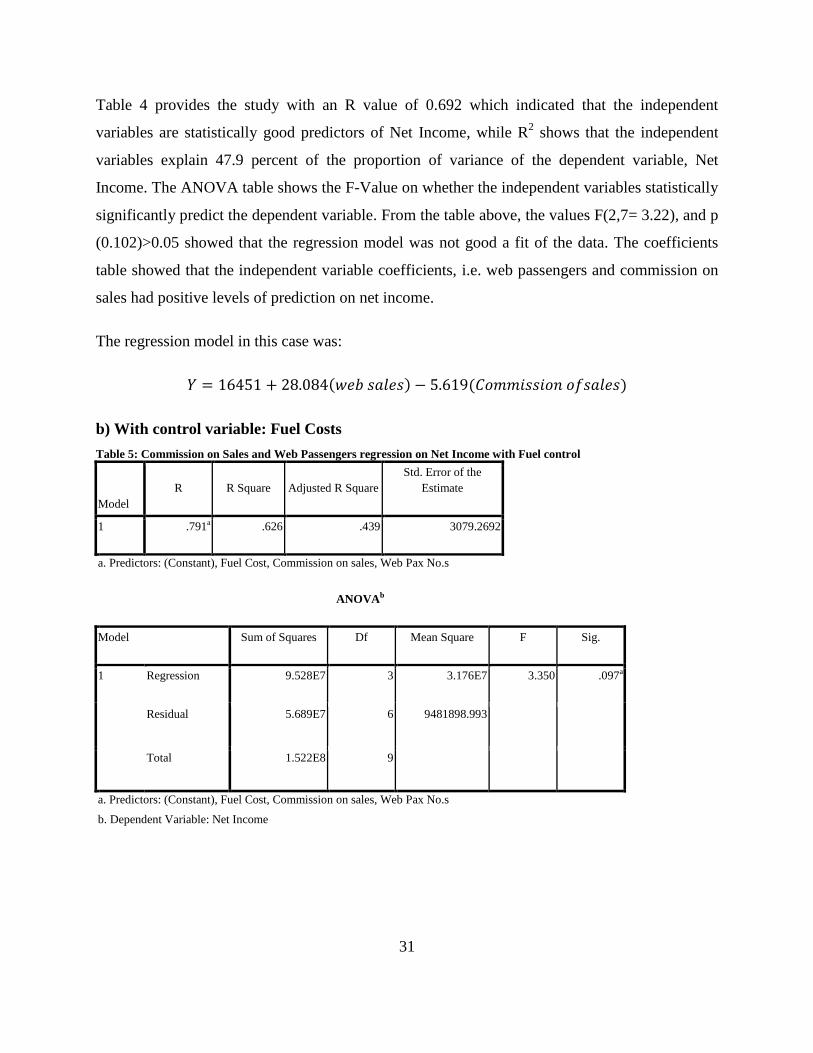
b) With control variable: Fuel Costs
Table 5: Commission on Sales and Web Passengers regression on Net Income with Fuel control
Model
R R Square Adjusted R Square
Std. Error of the
Estimate
1 .791a .626 .439 3079.2692
a. Predictors: (Constant), Fuel Cost, Commission on sales, Web Pax No.s
ANOVAb
Model Sum of Squares Df Mean Square F Sig.
1 Regression 9.528E7 3 3.176E7 3.350 .097a
Residual 5.689E7 6 9481898.993
Total 1.522E8 9
a. Predictors: (Constant), Fuel Cost, Commission on sales, Web Pax No.s
b. Dependent Variable: Net Income
32
Coefficientsa
Model
Unstandardized Coefficients
Standardized
Coefficients
t Sig. B Std. Error Beta
1 (Constant) 6917.725 8397.016 .824 .442
Web Pax No.s 97.462 56.005 1.084 1.740 .132
Commission on sales -.891 3.859 -.141 -.231 .825
Fuel Cost -.491 .319 -1.466 -1.536 .175
a. Dependent Variable: Net Income
Table 5 provides the study with an R value of 0.791 which indicated that the independent
variables are positive predictors of Net Income, while R2 shows that the independent variables
explain 62.6 percent of the proportion of variance of the dependent variable, Net Income. The
ANOVA table shows the F-Value on whether the independent variables statistically significantly
predict the dependent variable. From the table above, F(3,6=3.350), and p(0.097)>0.05 showed
that the regression model was not a good fit of the data. The coefficients table shows that the
independent variable coefficients, i.e. web passengers and commission on sales have positive
levels of prediction on net income (0.791).
The regression model in this case would be:
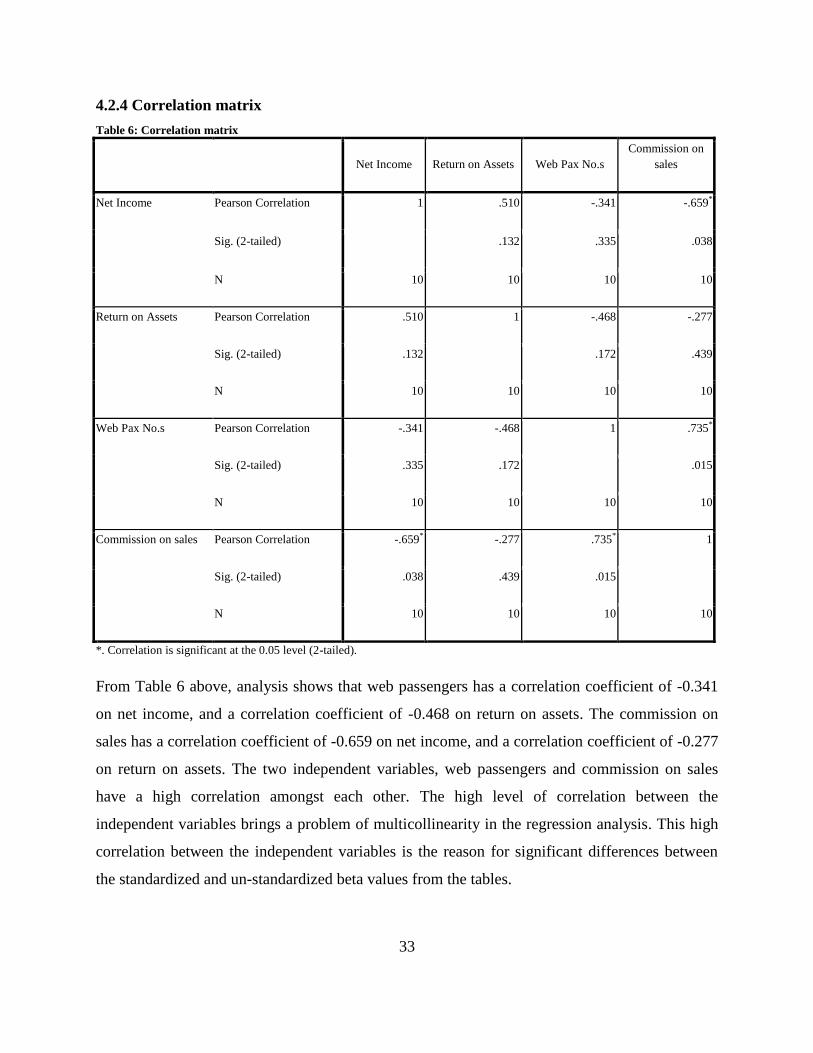
33
4.2.4 Correlation matrix
Table 6: Correlation matrix
Net Income Return on Assets Web Pax No.s
Commission on
sales
Net Income Pearson Correlation 1 .510 -.341 -.659*
Sig. (2-tailed) .132 .335 .038
N 10 10 10 10
Return on Assets Pearson Correlation .510 1 -.468 -.277
Sig. (2-tailed) .132 .172 .439
N 10 10 10 10
Web Pax No.s Pearson Correlation -.341 -.468 1 .735*
Sig. (2-tailed) .335 .172 .015
N 10 10 10 10
Commission on sales Pearson Correlation -.659* -.277 .735* 1
Sig. (2-tailed) .038 .439 .015
N 10 10 10 10
*. Correlation is significant at the 0.05 level (2-tailed).
From Table 6 above, analysis shows that web passengers has a correlation coefficient of -0.341
on net income, and a correlation coefficient of -0.468 on return on assets. The commission on
sales has a correlation coefficient of -0.659 on net income, and a correlation coefficient of -0.277
on return on assets. The two independent variables, web passengers and commission on sales
have a high correlation amongst each other. The high level of correlation between the
independent variables brings a problem of multicollinearity in the regression analysis. This high
correlation between the independent variables is the reason for significant differences between
the standardized and un-standardized beta values from the tables.
34
4.3 Summary and interpretation of the findings
Data analysis was done from the provided data and regression was the main analysis done, with
Pearson‘s correlation test done as a confirmatory test, as well as a test for multicollinearity
through the independent variables correlation. For the regression analysis, four tests were done to
ascertain whether the independent variables had an impact on the dependent variable. These tests
were (i) web passengers and agency commission on sales (independent) on return on assets
(dependent), (ii) web passengers and agency commission on sales (independent) on return on
assets (dependent) with fuel cost as control variable, (iii) web passengers and agency
commission on sales (independent) on net income (dependent) with no control variable, and (iv)
web passengers and agency commission on sales (independent) on net income (dependent) with
fuel as control variable.
From the regression analysis tests (i), the regression of web passengers and agency commission
on sales on return on assets showed that the two independent variables were not good indicators
of return on assets, with an R value of 0.479 and an R2 value of 0.229. This value showed that
the independent variables accounted for 22.9% of the variance of return on assets. The ANOVA
value which tests whether the regression model is a good fit for the data had a value of 0.402,
which was way above the significant value of acceptance of 0.05 and therefore indicated that the
independent variable cannot significantly predict the dependent variable, return on assets.
From the regression analysis tests (ii), the regression of web passengers and agency commission
on sales on return on assets with fuel cost as a control variable showed that the two independent
variables were good indicators of return on assets, with an R value of 0.76 and an R2 value of
0.577. This value showed that the independent variables accounted for 57.7% of the variance of
return on assets. The ANOVA value of 0.136 was above the significant value of acceptance of
0.05 which indicated that the independent variables cannot significantly predict the dependent
variable, return on assets.
From the regression analysis tests (iii), the regression of web passengers and agency commission
on sales on net income with no control variable showed that the two independent variables were
not good predictors of return on assets, with an R value of 0.692 and an R2 value of 0.479. This
35
value showed that the independent variables accounted for 47.9% of the variance of return on
assets. The ANOVA value of 0.102 was above the significant value of acceptance of 0.05 which
indicated that the independent variable cannot significantly predict the dependent variable, return
on assets.
From the regression analysis tests (iv), the regression of web passengers and agency commission
on sales on net income with fuel cost as control variable showed that the two independent
variables were not good indicators of return on assets, with an R value of 0.791 and an R2 value
of 0.626. This value showed that the independent variables accounted for 62.6% of the variance
of return on assets. The ANOVA value of 0.097 was above the significant value of acceptance of
0.05 with indicated that the independent variable cannot adequately predict the dependent
variable, return on assets.
Correlation study was also done to check the relationship of the dependent variables, return on
assets and net income with the independent variables, web passengers and commission on sales.
The study showed negative correlation between the dependent variables (return on assets and net
income) and independent variables (web passengers and agency commission). However, there
existed a relationship between the independent variables, number of online sales and agency
commission on sales, a situation leading to multicollinearity which affects the output of the
analysis.
The results above are contrary to the expectation that online ticketing would improve efficiency
and reduce agency costs; hence increase profitability of a company. Other studies had indicated
an improvement in profitability and return on assets as a result of web sales.
A closely related study was conducted on the impact of Information Technology on Profitability
of Airlines Industry on Royal Jordanian Airlines. The data was collected from the financial
statements of Royal Jordanian Airlines and analyzed by using financial and statistical tools.
Hypothesis analysis was adopted to show whether IT investments had any impact on Financial
performance or not. The findings were of negative relationships and further contributed to the
debate of whether IT investment adds value in any way to quantifiable performance outcomes.
The unexpected negative relations found emphasized the need to incorporate the contextual
36
features of qualitative studies so that it could be discovered what organizational factors are
important in facilitating positive relationship between IT and profitability. Jawabreh et al., 2012.
Hoq et al., 2005 studied the impact of e-commerce on business cost and productivity, to evaluate
status of e-commerce, to identify how e-commerce reduces cost of customer services and after
sales services. The study used secondary information from published books, journals and official
statistical documents. Findings of the study were e-commerce reduces the cost of executing a
sale, costs associated with the procurement of production cost and costs associated with making
and delivering the product hence improving profitability.

37
CHAPTER 5: SUMMARY, CONCLUSION AND RECOMMENDATION
5.1 Summary
The emergence of internet over the years has changed business models on how they conduct
their businesses, with businesses conducting their businesses online. The study looked at the
impact of e-commerce on financial performance. The overall objective of the study was to
investigate the impact of e-commerce on the financial performance of airlines in Kenya, and in
this case Kenya Airways. The dependent variables that were considered to analyze the study
were return on assets and net income, while independent variables that were brought out that
may measure the impact of e-commerce were number of web passengers and agency fees.
Secondary data was collected from the company‘s financial results for a ten year period and data
analysis was done by use of descriptive statistics and regression analysis, together with Pearson‘s
correlation test. The results were presented in tables. The analysis included descriptive
information and the relationship between the return on assets and net income as the dependent
variables, and the number of web passengers and the agency fees as the independent variables.
Fuel cost was introduced as a control variables to have proper analysis of the data. Tests were
carried out without and with the control variable.
The output from data analysis showed that there was weak positive impact of the independent
variables, number of web passengers and agency fees on the dependent variables, return on
assets and net income. This can be attributed to the small percentage of online bookings in
relation to the total number of passengers for it to have a significant impact.
The study recommended that other measures of e-commerce can be analyzed in further studies.
These may be non-financial benefits that also affect performance of the airline and other
yardsticks can be used to measure performance. Also, studies may be done in other large airlines
in global markets so that the impact of e-commerce can be analyzed since internet penetration is
wider and there‘s likely to be higher percentage of online bookings.
38
5.2 Conclusion
The objective of the study was to ascertain the impact of e-commerce on financial performance
of Kenya Airways. The results of the study showed that independent variables, number of web
passengers and agent commission on sales, have a weak positive impact on return on assets and
net income. This has made the study to conclude that the independent variables do not provide
good prediction on the dependent variables. For return on assets, it was expected that web
passenger bookings would greatly impact positively on return on assets, but it showed that it had
no significant impact on the return on assets. This is because of the increase in total assets
through purchase of aircraft by the airline that made the return on assets to reduce. This enabled
the study to perform tests using net income as the dependent variable. This helped the study to
hold the total assets constant. Agency commission costs had a weak positive impact on the return
on assets. This could also be attributed to the fluctuation of return on assets as a result of total
assets. The tests were done with fuel costs as a control variable and showed no major change in
the output.
For net income analysis, it can be seen that there was positive impact of the web passengers on
the net income of the company, though insignificant. This is because of the small percentage of
online bookings as compared to the total number of passengers. The agency commission on sales
variable had no impact on net income as expected, even though the impact was insignificant.
There was some difference even with the introduction of control variables fuel costs.
Previous studies from the literature review showed that online bookings contributed positively to
the financial performance of companies. This is because the percentage of e-commerce uptake is
high as compared to Kenyan businesses. Online bookings reduce the total costs of passenger
bookings and therefore improve profitability. With the growth in use of internet, e-commerce is
expected to grow as the consumer demography is becoming internet literate. Future studies on
the topic might indicate a different result from the one in this study as the economy continues to
embrace e-commerce.
39
5.3 Policy Recommendations
With the growth of internet in the country as a result of fiber cable, e-commerce has not grown
as it has been expected. This may be due to fear of online transaction due to online security fears.
In Kenya Airways, despite online tickets being cheaper than normal ticketing, the uptake is still
small. From the findings it has been shown that e-commerce has contributed little to the
performance of the company. It is therefore important for the airline and other e-commerce
stakeholders to come up with proper models of measuring e-commerce outcomes.
In this respect, the study therefore recommends companies to keep track of their online
transactions. This will enable the company to adequately measure relevant output.
Measures of e-commerce to be clearly defined by companies as they vary from industry to
industry, and therefore each company should be able to uniquely and effectively outline the true
measure of e-commerce.
Companies should Sensitize and create awareness of e-commerce to their customers, at the same
time providing adequate online security for them. Online security for internet users is important
as people have been known to incur losses stemming from internet fraud.
5.4 Limitations of the study
The concept of e-commerce varies from one company to another since they adopt different
business models with it. One of the limitations of the study was the derivation of exact variables
to measure as an indicator of e-commerce impact. The use of return on assets and net income are
some of the ways of measuring e-commerce impact but may not be adequate.
Also, the impact of e-commerce cannot be measured only in financial terms, but also in non-
financial terms which are non-quantifiable. This was not taken into consideration when carrying
out the study. Qualitative aspects also have an impact on performance of an organization.
The collection of secondary of data of the earlier years for web passengers was a bit of challenge
due to numerous changes of information systems in the company. Therefore it took a bit of time.
40
5.5 Suggestions for Further Research
The study suggests that more insight research should be done on e-commerce in Kenya and other
factors that may affect it, including other variables which may have further impact than currently
analyzed. In particular, the impact of e-commerce may be done in international airline companies
which have greatly embraced online bookings.
More empirical findings may be sought to determine a true linear relation of the independent
variables and dependent variables. Indicators of e-commerce need to be expounded further and
also the measurement of e-commerce outcome needs to be further explored.
41
APPENDIX I: REFERENCES
Afshar, J.A., & Nawaser, K.H., (2010). Mobile Commerce: The Force of electronic commerce
future. Int. seminar on innovations in strategic management for organizational excellence.
Sinhgad institute of management Pune India.
Allen, E., & Fjermestad, J., (2001). E-commerce Marketing Strategies: An Integrated Framework
and Case Analysis. Logistics Information Management, 14(1/2), 14-23.
Amit,R. & P. J. Schoemaker. (1993). Strategic Assets and Organizational Rent. Strategic
Management Journal, 14(1), 33-46
Asiabugwa, M.A., & Munyoki, J.M., (2012). Ecommerce strategy and performance of
Commercial Banks in Kenya. AIBUMA conference paper, University of Nairobi
Barnes, D., Hinton, M. & Mieczkowska, S. (2002). Developing a Framework to Investigate the
Impact of E-commerce on the Management of Internal Business Processes. Knowledge
and Process Management, 9(3), 133-142.
Barnes, S., and Hunt, B. (2001). E-commerce & V-business: Business Models for Global
Success. Butterworth-Heinemann, Oxford, Great Britain.
Barney, J.B., (1986). Strategic Factor Markets: Expectations, Luck and Business strategy.
Management Science, 32(10), 1231-1241.
Barrow, S., (2006). The Barclaycard Business Travel Survey 2005/2006. Barclaycard Business.
Bharadwaj, A.S. (2000). A Resource-Based Perspective on Information Technology Capability
and Firm Performance: An Empirical Investigation, MIS Quarterly.
Caldeira, M.M., Ward, J.M. (2003). Using resource-based theory to interpret the successful
adoption and use of information systems and technology in manufacturing small and
medium-sized enterprises. European Journal of Information Systems, Paper 11.
42
Callahan, C.V. & Pasternack, B.A. (1999). Strategy & Leadership Corporate Strategy in a Digital
Age. Second Quarter, 15.
Retrieved from http://www.strategy-business.com/article
Conner, K.R. (1991). A Historical Comparison of Resource-based Theory and a New Theory of
the Firm. Journal of Management, 17(1), 121-154.
Cooper, D.R., & Schindler, P.S., (2003). Business Research Methods, 8th Ed., New Delhi, Tata
McGraw-Hill
Cooper, R.B. & Zmud, R.W. (1990). Information Technology Implementation Research: A
Technological Diffusion approach. Management Science, 36(2).
Dabholkar, P (1996). Consumer evaluations of new technology-based self service options: an
investigation of alternate models of service quality. International Journal of Research in
Marketing, 3, 29-51
Dedrick, J., West, J. (2003). Why Firms adopt Open Source Platforms: a grounded theory of
innovation and standards adoption. Paper presented at MISQ Special Issue Workshop:
Standard Making. A Critical Research Frontier for Information Systems, Seattle, WA.
De Alarcon, R.F; Molina, M. & Feliz, M. (2005). Electronic Commerce Applied to Tourism,
Telefonica CSR.
Dierickx, I. and Cool, K. (1989). Asset Stock Accumulation and Sustainability of Competitive
Advantage. Management Science, 35(12), 1514-1514.
Dimitrios B. (2003). eAirlines: Strategic and Tactical use of ICTs in the Airline Industry.
Information and management .http://dx.doi.org/10.1016/j.im.2003.08.015
Dinda A.W (2010). A survey of e-commerce Strategies and Models in Kenya. Unpublished
MBA project, University of Nairobi.

43
Eid, M. I. (2011). Determinants of E-Commerce Customer Satisfaction, Trust, and Loyalty in
Saudi Arabia. Journal of Electronic Commerce Research, 12(1), 78-93.
Elias, E. (1999). Internet Commerce: Transforming The Travel Industry, SRI Consulting.
http://www.commerce.net/research/ebusiness-strategies/1999/99
Emmer, R., Tauck, C., Wilkinson S. & Moor, R. (2003). Global Distribution Systems, Cornell
Hotel and Restaurant Administration Quarterly.
Fahy, J. (2000). The Resource-based View of the Firm: Some Stumbling-blocks on the Road to
Understanding Sustainable Competitive Advantage. Journal of European Industrial
Training, 24(2), 94-104.
Fisher, M. 2000. Using E-Commerce to Deliver High Productivity. MCB University Press
Flanagan, T., & Sadie, E. (1998). Buliding a successful CRM Environment. Applied
Technologies Group.
Grabner-Kraeuter, S. (2002). The Role of Consumers‘ trust in online shopping. Journal of
Business Ethics, 39(1/2), 43-50.
Hammer, M. (1990). Reengineering Work: Don't Automate, Obliterate. Harvard Business
Review.
Hassan, M. K., & Bashir, A. H. M. (2003). Determinants of Islamic banking profitability. In the
ERF Annual Conference.
Hayes R.H. and Wheelwright S.C (1984). Restoring our competitive edge.
Hitesh,K., Manoj, K.G., Hardeep,S. & Leena, B. (2011). Role of E-commerce in Today‘s
Business. VRSD International Journal of Business & Management Research, 1(7), 454-
461.
44
Hofer, C. W. (1983). ROVA: A New measure for Assessing Organizational Performance. In R.
Lamb (Ed.), Advances in Strategic Management.
Hoq, Z., Kamal, S., & Chowdhury, E.H. (2005). The economic impact of e-commerce. BRAC
University Journal, 2(2), 49-56.
Hua, F. & Guan, S. U. (2000). Agents and Payment Systems in E-commerce. In Rahman, S.M.
and Bignall, R.J.(Eds.), Internet Commerce and Software Agents: Cases, Technologies
and Opportunities, IDEA Group Publishing.
Illo A. D. (2012). The effect of Macroeconomic Factors on Financial Performance of
Commercial Banks in Kenya. Unpublished MSC project, University of Nairobi, 2012.
Ittner, C. D. & Larcker, D. (1998). Innovations in performance measurement: Trends and
Research Implications. Journal of Management Accounting Research, 205-238.
Jawabreh, O.A.A., Allahham, M., Alrjoub, A., & Ahmad, M. (2012). Impact of Information
Technology on Profitability of Airlines Industry: A case Study of Royal Jordanian
Airlines. International Journal of Business and Management, 7(18), 149-162.
Jiang, H. (2003). Application of e-CRM to the Airline Industry, School of Aerospace,
Mechanical, and Manufacture Engineering RMIT University, Australia
Johnson C (2003). U. S E-commerce: the year in review, Cambridge, MA: Forrester Research
Kariuki J.N (2009). The Relationship between The Level of Technological Innovation And
Financial Performance of Commercial Banks in Kenya. Unpublished MBA project,
University of Nairobi.
Keen, P.G.W. (1991). Shaping the Future: Business Design through Information Technology,
Harvard Business School, Boston, MA.
Kim, W.C and Mauborgne, (1999). Strategy, Value Innovation, and the Knowledge Economy.
Sloan Management Review, Spring, 40(3), 41-54.

45
Kimingi C.N. (2010). The effects of Technological Innovations on the Financial Performance of
the Commercial Banks in Kenya. Unpublished MBA project, University of Nairobi.
Kipkech P.K, (2009). An evaluation of e-commerce application by microfinance institutions in
Kenya. Unpublished MBA project, University of Nairobi.
Kiyeng P C (2003). A survey of the Impact and Challenges of Business E-commerce in Kenya: A
Case study of Sokoni.
Korir (2005). Impact of e-commerce as a facilitating tool for business on Tour operators in
Nairobi. Unpublished MBA project, University of Nairobi.
Kraemer, K.L., Dedrick, J., Melville, N., Zhu, K. (2006). Global E-commerce: Impacts of
National Environments and Policy, Cambridge University Press, Cambridge.
Kunkel, S. W. (1991). The impact of Strategy and Industry Structure on New Venture
Performance. Unpublished Doctoral Dissertation, University of Georgia, Athens, GA.
Laudon, K.C., and Traver, C.G., (2009). E-commerce: Business, Technology, Society. Fifth
Edition.
Lawal, A.S. (2010). Electronic commerce in Nigeria banking industry,a case study of guaranty
trust bank Nigeria plc. Department of business administration, faculty of business and
social science, university of Ilorin.
Lederer, A.L., Mirchandani, D.A. & Sims, K. (2001). The search for strategic advantage from
the world wide web. International Journal of Electronic Commerce, 5(4), 117-133.
Lee, M. K. & E. Turban, (2001). A trust model for consumers Internet shopping. International
Journal of Electronic Commerce, 6(1), 75-91.
Lyons G. (1998). The role of information technology in enterprise re-engineering. Knowledge
and Process Management, 4(4), 268-277.

46
Magutu, P.O., Ongeri R. N. & Mwangi H. (2009). Modelling the effects of e-commerce adoption
on business process management: Case study of Commercial banks in Kenya.
Communications of the IBIMA.
Mata, F.J., Fuerst, W.L. & Barney, J.B. (1995). "Information technology and sustained
competitive advantage: a resource-based analysis", MIS Quarterly.
Mazandarani, M. (2010). Comparison of the Type of the Web Base Advertising on Ecommerce
Improvement. Journal of American Science, 6(3), 150-154.
Mbuvi, M.M. (2000). A survey of potential for Adoption of E-commerce by tour operators in
Nairobi: The case of Kenya Association of Tour Operators (KATO) Members.
Unpublished MBA project, University of Nairobi.
McKnight, D. and N. Chervany. (2001). What trust means in e-commerce customer
relationships: An interdisciplinary conceptual typology. International Journal of
Electronic Commerce, 6(2), 35-59.
Molla, A., & Licker, P. S. (2001). E-Commerce Systems Success: An Attempt To Extend And
Respecify The Delone And Maclean Model Of Is Success. Journal of Electronic
Commerce Research, 2(4), 131-141.
Muasya, B. & Nixon, M. (2009). An investigation On the Relationship Between Information
Technology (IT) Conceptualization And Bank Performance. Unpublished MBA project,
University of Nairobi.
Muganda, N., (2001). An investigation of the business value of e-commerce: The case of
selected firms in Kenya. Unpublished MBA project, University of Nairobi.
Mwangi B.M, (2011). The impact of Information communication technology development on
financial performance of commercial banks in Kenya. Unpublished MSC project,
University of Nairobi.
47
Nyaanga, O.R., (2007). The effects of e-commerce adoption on business process management in
commercial banks in Kenya. Unpublished MBA Project, University of Nairobi
Ojunga, S.A. (2005). A survey of E-commerce services in commercial banks in Kenya.
Unpublished MBA project, University of Nairobi.
Polit, D., & Beck, C. (2003). Nursing Research: Principles & Methods, 7th Edition, Lippincott,
Williams & Wilkins, United States of America.
Rastogi R (2002). Country report on e- commerce initiatives.
Reid, R., & Bojanic, D. (2006). Hospitality Marketing Management, 4th edition. Wiley and
Sons.
Rigas, D. (2006). The Airline Business, Second Edition. Published by Routledge 2 Parksquare,
Milton Park, Abingdon,Oxon OX 14 4RN
Rincon, A., Robinson, C. & Vecchi, M. (2001). The Productivity Impact of E-Commerce in the
UK, 2001: Evidence From Microdata, The National Institute of Economic and Social
Research
Riverd, R.J. & Thomas C.R. (1997). The Effect of Interstate Banking on Large Bank Holding
Company Profitability and Risk. Journal of Economics and Business, 49 (1997): 61-76
Robertson, R.A. (2005). A framework of critical drivers in successful business-to-business e-
commerce. Proceedings of the IEEE Southeast Conference.
Rogers, E.M. (1983). Diffusion of Innovations, 3rd ed., The Free Press, New York, NY.
Roth, P. (1997). Internet and Electronic Commerce, EDI, EFT and Beyond Spiral books.
Samad, A. (1999). Comparative Efficiency of the Islamic Bank Malaysia vis-à-vis Conventional
Banks. IIUM Journal of Economics and Management, 7(1), 1-27.
48
Senn, J. A. (2000). Business-to-business e-commerce. Information Systems Management, 17(2),
23-32.
Smith, C.B., Günter, D.P., Rao, B.V. & Ratliff, R.M., (2001). E-Commerce and Operations
Research in Airline Planning, Marketing and Distribution, Interfaces.
Smith, M.D., Bailey, J. & Brynjolfsson, E. (2001). Understanding digital markets: Review and
assessment. Data, Tool and Research, MIT Press, Cambridge, MA.
Soh, C. & Markus, M.L., (1995). How IT creates business value: A process theory
synthesis. Proceedings of the 16th International Conference on Information Systems,
Amsterdam.
Stroehle, F., (2008). Effective E-Commerce in China Lessons from cross-cultural research.
Otago Management Graduate Review.
Sousa, R. & Voss, C. A., (2002). Quality management re-visited: a reflective review and agenda
for future research. Journal of Operations Management, 20(1), 91-109.
The National B2B Centre Limited, International Digital Laboratory, The University of
Warwick, Coventry, CV4 7AL. Extracted from
http://www.nb2bc.co.uk/what_is_ebusiness 16th February 2011
Tornatzky, L.G. & Fleischer, M. (1990). Process of Technology Innovation, Lexington Books,
Lexington, MA.
Travica, B. (2002). Diffusion of electronic commerce in developing countries: The case of Costa
Rica. Journal of Global Information Technology Management, 5(1), 4-24.
Turban, E., Lee, J., King, D. & Chung, H.M., (2000). Electronic commerce: A managerial
perspective, Prentice Hall.
Turban, E., King, D., Lee, J.K. & Viehland, D. (2006). Electronic Commerce: A Managerial
Perspective, Prentice-Hall, Englewood Cliffs.
49
Upkar, V. (2002). M- commerce: Framework, applications and networking support, Kluwer
Academic Publishers Hingham, MA, USA.
Urban, G., F. Sultan, & Qualls, W. (2000). Placing trust at the center of your Internet strategy.
Sloan Management Review.
Vossen, R. (1999). Relative Strengths and Weaknesses of Small Firms in Innovation.
International Small Business Journal, 16(3), 88-94.
Wanyoike D. M., Mukulu, E. & Waititu, A., (2012). ICT Attributes as Determinants of E-
commerce Adoption by Formal Small Enterprises in Urban Kenya: International Journal
of Business and Social Science, 3(23), 65-65.
Weill, P and Broadbent M. (1998). Leveraging the new Infrastructure, Harvard Business School
Press, Boston.
Wheelen, L., Thomas & Hunger, David, J. (2002). Strategy Formulation In Strategic
Management and Business Policy (8thEd.). New Jersey: Prentice Hall.
Wilson D. (1993). Assessing the impact of information technology on organizational
performance. Hansbury: Strategic information technology management idea group.
Wolcott, P., Press, L., McHenry, W., Goodman, S. E. & Foster, W. (2001). A framework for
assessing the global diffusion of the Internet. Journal of the Association for Information
Systems, 2(6), 1-52.
Yang, S (2001). E-Commerce in the Airline Business, PROS Revenue Management
Zhang, M.J., Lado, A.A., 2001. Information systems and competitive advantage: A competency
based view Technovation
Zhu, K. (2004). Information transparency of business-to-business Electronic Markets: A game-
Theoretic Analysis. Management Science, 50(5), 670-685.
50
Zhu, K. & Kraemer, K.L. (2005). Post-adoption variations in usage and value of e-business by
Organizations: Cross-country Evidence from the Retail Industry. Information Systems
Research, 16(1), 61-84.
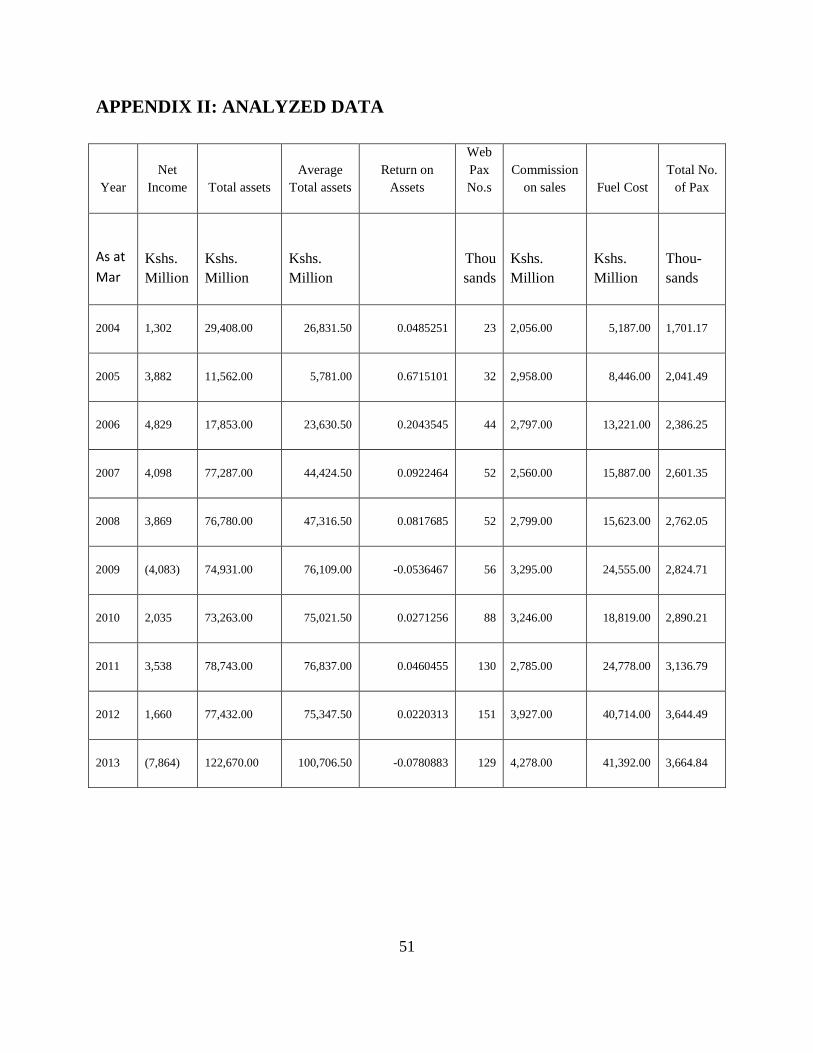
51
APPENDIX II: ANALYZED DATA
Year
Net
Income Total assets
Average
Total assets
Return on
Assets
Web
Pax
No.s
Commission
on sales Fuel Cost
Total No.
of Pax
As at
Mar
Kshs.
Million
Kshs.
Million
Kshs.
Million
Thou
sands
Kshs.
Million
Kshs.
Million
Thou-
sands
2004 1,302
29,408.00
26,831.50 0.0485251 23
2,056.00 5,187.00
1,701.17
2005
3,882
11,562.00
5,781.00 0.6715101 32
2,958.00 8,446.00
2,041.49
2006
4,829
17,853.00
23,630.50 0.2043545 44
2,797.00 13,221.00
2,386.25
2007
4,098
77,287.00
44,424.50 0.0922464 52
2,560.00 15,887.00
2,601.35
2008
3,869
76,780.00
47,316.50 0.0817685 52
2,799.00 15,623.00
2,762.05
2009
(4,083)
74,931.00
76,109.00 -0.0536467 56
3,295.00 24,555.00
2,824.71
2010
2,035
73,263.00
75,021.50 0.0271256 88
3,246.00 18,819.00
2,890.21
2011
3,538
78,743.00
76,837.00 0.0460455 130
2,785.00 24,778.00
3,136.79
2012
1,660
77,432.00
75,347.50 0.0220313 151
3,927.00 40,714.00
3,644.49
2013
(7,864)
122,670.00
100,706.50 -0.0780883 129
4,278.00 41,392.00
3,664.84