the effect of economic freedom on national competitiveness - joebm
TRANSCRIPT
Abstract—The paper deals with economic freedom and its
effect on national competitiveness. There are two goals
examined within the paper. At first, I examine if economic
freedom causes national competitiveness by means of the
Granger causality test. Secondly, the effect of economic
freedom on national competitiveness is tested using panel data
for the period 2004-2011. Three groups of countries were
selected: economic free, Visegrad four and repressed countries.
Economic freedom and national competitiveness are quantified
by comprehensive indicators: Index of economic freedom and
Global competitiveness index. The results suggest that economic
freedom causes national competitiveness in countries with
higher degree of economic freedom. Positive effect on national
competitiveness was found out.
Index Terms—Economic freedom, economic growth,
economic recession, Granger causality, national
competitiveness, panel data model.
I. INTRODUCTION
Competitiveness is a concept that has become one of the
most used and vogue word in today’s globalized world. It is
very often discussed topic and lots of policy makers express
serious interest about competitiveness at macroeconomic
level, but such interest is not new, new is its intensity and
spread [1]. Competitiveness is not only a mystic word; there
are lots of experts and institutions which focus on
competitiveness at macroeconomic level (or national
competitiveness) and attempt to specify determinants and
processes that affect national competitiveness.
Cultural norms and institutions are often believed to
explain why certain countries grow and other remain poor [2].
Since the time of Adam Smith, economists have pointed out
that the freedom to choose and supply resources, competition
in business, trade with others and secure property rights are
fundamental factors for economic progress [3].
There are lots of factors that affect economic performance
and national competitiveness. The relationship between used
inputs and output describes production function. We know
the so-called Cobb-Douglas production function. Inputs
include capital (physical or human) and labor, but what about
other factors, e.g. freedom or economic freedom? [4]
The main aim of this paper is to find out whether economic
freedom promotes national competitiveness. Two hypotheses
Manuscript received September 1, 2013; revised November 8, 2013.This
work was supported by the students’ grant project “Seeking Factors and
Barriers of the Competitiveness by using of selected Quantitative Methods”.
Project registration number is SGS/1/2012.
Tomas Verner is with the Department of Economics, Silesian University
in Opava, School of Business Administration in Karvina, Univerzitni nam.
1934/3, 73340, Karvina, Czech Republic (e-mail: [email protected]).
are established: I: economic freedom causes national
competitiveness; II: economic freedom positively affects
national competitiveness.
The paper after this part is structured as follows. Section
II briefly presents national competitiveness and economic
freedom; Section III deals with quantifying of these
phenomena; Section IV shows examined data and
methodology; Section V present results and section
6 concludes.
II. NATIONAL COMPETITIVENESS AND ECONOMIC FREEDOM
In this section I focus at competitiveness, more precisely
macroeconomic or national competitiveness and
phenomenon of economic freedom.
A. National Competitiveness
Applying the microeconomic approach, competitiveness
can be defined as capability of a country to sell more abroad
than it purchases from abroad, i.e. export performance.
Reference [5] confirms trade balance and market share are
insufficient indicators. Previous approach does not take into
account, e.g. products quality or safety, labor conditions,
standard of living or environment. Interesting attitude has [6]
who likened it to a dangerous obsession. Reference [7]
national competitiveness means country’s ability to create,
produce, distribute, and service products in international
trade while earnings rising returns on its resources. However,
[8] argues that the only meaningful concept of national
competitiveness is national productivity. Reference [9]
explains it as the long-run aim of rising standard of living and
[10] extends this approach; it is an ability of an economy to
secure a higher standard of living than comparable
economies for the present and the future. Reference [11]
summarizes that defining the competitiveness of nations is a
controversial issue.
Besides, national competitiveness the increasing
significance of regions in concept of European Union
deserves more attention especially because of the economic
efficiency of regions representing the basis of
competitiveness of the country [12]. European Union defines
national competitiveness like an ability to provide its citizens
high and still rising standard of living and employment to all
who wants to work [13]. As we can see modern approaches
emphasize the standard of living and human well-being.
B. Economic Freedom
A number of researchers have dealt with the relationship
between freedom and economic growth in recent years. They
have explored the links between political freedom and
Tomas Verner
The Effect of Economic Freedom on National
Competitiveness: Causality from a Panel of Countries
150DOI: 10.7763/JOEBM.2015.V3.172
Journal of Economics, Business and Management, Vol. 3, No. 1, January 2015

economic growth [14], [15]. Economic theory indicates that
economic freedom affects incentives, productive effort, and
the effectiveness of resource use. Economic freedom should
positively affect economic growth and national
competitiveness as well [16].
Some researchers [17], [18] suggest that economic
freedom may be important in explaining cross-country
differences in economic performance. Other studies confirm
the positive link [19], [20]. Reference [21] found that positive
changes in economic freedom lead to economic growth,
notwithstanding the level of economic freedom in the
beginning of the growth period does not significantly
contribute to explain growth. Reference [16] has constructed
own indicator based on below mentioned indices. They found
out greater economic freedom fosters economic growth;
however the level of economic freedom is not related to
growth. The similar conclusion is by [22] economic freedom
(or some aspects) causes economic growth. Reference [23]
argues that economic freedom, knowledge economy and
global competitiveness are three of the many and very
different dimensions which characterize the level of a
country’s performance. They found out the strong and direct
link between economic freedom and national
competitiveness.
III. QUANTIFICATION OF ECONOMIC FREEDOM AND
NATIONAL COMPETITIVENESS
There are lots of possibilities to measure economic
freedom and national competitiveness. I focus on some
provided by international institutions.
A. Measuring of Economic Freedom
The Fraser Institute and The Heritage Foundation deal
with economic freedom. The Fraser Institute by means of [24]
defines economic freedom for individuals when property
they acquire without the use of force, fraud, or theft is
protected from physical invasions by others and they are free
to use, exchange, or give their property to another as long as
their actions do not violate the identical rights of others.
Hence, an index of economic freedom should measure the
extent to which rightly acquired property is protected and
individuals are free to engage in voluntary transactions.
Furthermore [25] emphasize the crucial factors of economic
freedom:
personal choice,
voluntary exchange coordinated by markets,
freedom to enter and compete in markets,
protection of persons and their property from aggression
by others.
The degree of economic freedom is measured in five areas
[25]:
size of government,
legal system and property rights,
sound money,
freedom to trade international,
regulation.
The Fraser Institute has published its annual report since
1996 every year.
The Heritage Foundation defines the economic freedom
similarly to previous one. According to [26] is the
fundamental right of every human to control his or her own
labor and property. In an economically free society,
individuals are free to work, produce, consume, and invest in
any way they please with that freedom both protected by the
state and unconstrained by the state. In economically free
societies, government allows labor, capital and goods to
move freely, and refrain from coercion or constraint of liberty
beyond the extent necessary to protect and maintain liberty
itself. The Heritage Foundation has calculated index of
economic freedom and published its annual report with
studies about economic freedom since 1995. Index consists
of ten components:
property rights,
freedom from corruption,
fiscal freedom,
government spending,
business freedom,
labor freedom,
monetary freedom,
trade freedom,
investment freedom,
financial freedom,
which are grouped into four categories: (i) rule of law, (ii)
limited government, (iii) regulatory efficiency and (iv) open
markets (for more details see [26]). The range of the index is
from 0 to 100, where 100 represent the maximum degree of
economic freedom.
Countries with an index of economic freedom between:
0 – 49.9 are repressed,
50 – 59.9 are mostly unfree,
60 – 69.9 are moderately free,
70 – 79.9 are mostly free,
80 – 100 are free.
Lots of economists will agree with minimal incentives to
economy and principles of economic. However, the key
question is, what should economists suggest and policy
makers do in time of economic stagnation or recession. The
recent recession should be appropriate example.
B. Measuring of National Competitiveness
The International Institute for Management Development
(IMD) and the World Economic Forum (WEF) are
well-known international organizations dealing with national
competitiveness. Both institutions provide comprehensive
evaluation of national competitiveness. IMD has published
World Competitiveness Yearbook since 1989. IMD ranks
and analyzes the capability of economies to create and
maintain an environment in which enterprises can compete
[27]. National environment is divided into four main factors
[27]:
economic performance,
government efficiency,
business efficiency,
infrastructure.
WEF has published Global Competitiveness Report since
1979. WEF [28] defines national competitiveness as the set
of institutions, policies and factors that determine the level of
151
Journal of Economics, Business and Management, Vol. 3, No. 1, January 2015

productivity of a country. The Global Competitiveness Index
ranks more than 120 countries and consists of twelve pillars
[28]:
institutions,
infrastructure,
macroeconomic environment,
health and primary education,
higher education and training,
goods market efficiency,
labor market efficiency,
financial market development,
technological readiness,
market size,
business sophistication,
innovation.
It is clear that countries are in different stages of their
development, therefore the will affect them in different ways.
WEF [28] distinguish three stages of development:
factor driven (pillars 1-4),
efficiency driven (pillars 5-10),
innovation driven (pillars 11-12).
The range of the index is from 0 to 7, where 7 indicates the
highest level of national competitiveness.
IV. DATA AND METHODOLOGY
Used data and techniques are presented in this section.
A. Data
This section describes the data as well as the econometric
methodology used in the empirical analysis. Degree of
economic freedom (EF) is measured by the Heritage
Foundation’s Index of economic freedom; economic growth
is measured by annual growth rate of real gross domestic
product per capita (GDPPC). The Global Competitiveness
index (GCI) was employed as a proxy variable of national
competitiveness. Annual data were collected for the most
economic free, Visegrad four and the less economic freedom
countries 2004-2011. The less economic freedom countries
are not the same as the least developed countries (LDC).
LDC are situated geographically in the poverty belt and are
characterized by a low economic development, a high
instability, high degree of interdependence, low levels of
human capital and a low level of its own resources to
development [29].
GCI was standardized according to formula (1) to range 0
– 10:
jj
jj
xx
xxx
minmax
min'
(1)
where x’ denotes the new value of GCI, x initial value, minx
the minimum value, i.e. 1 and maxx the maximum value, i.e. 7.
The first group consists of Hong Kong, Singapore,
Australia, New Zealand and Switzerland due to the highest
average degree of economic freedom during the selected
period. The countries exhibit the average high level of
national competitiveness as well (see Table I).
The Visegrad four countries include Czech Republic,
Hungary, Poland and Slovakia. The values of degree of
economic freedom and national competitiveness are
presented in Table II.
TABLE I: THE ECONOMIC FREE COUNTRIES
Countries Economic freedom National competitiveness
Hong Kong 89.6 71.4
Singapore 87.4 75.9
New Zealand 81.7 66.8
Australia 81.6 69.5
Switzerland 79.9 77.5
TABLE II: THE VISEGRAD GROUP
Countries Economic freedom National competitiveness
Slovakia 69.0 55.4
Czech
Republic 68.3 59.6
Hungary 65.9 55.6
Poland 61.1 55.5
The lowest economic freedom countries are showed in
Table III.
TABLE III: THE REPRESSED COUNTRIES
Countries Economic freedom National competitiveness
Syria 49.5 47.7
Chad 48.1 29.4
Venezuela 41.9 41.7
Libya 37.5 46.7
Zimbabwe 27.8 33.2
As we can see in presented tables, group of countries with
lower degree of economic freedom exhibits lower level of
national competitiveness, i.e. are less competitive and vice
versa.
B. Methodology
To examine the above mentioned causality and
relationship I perform panel data analysis and Granger
causality test. Panel data (or longitudinal data) cover both a
time series and a cross-sectional dimension compared to pure
time series or cross-sectional data [30]. Panel data models
have become more and more popular among researchers
because of their capacity for capturing the complexity of
human behavior as contrasted to cross-sectional or time
series data models [31].
References [31]-[33] list a number of panel data’s benefits,
e.g. (i) controlling for individual heterogeneity, (ii) give more
informative data, more variability, less collinearity among
the variables, more degrees of freedom and more efficiency,
(iii) are better able to study dynamics of adjustment, (iv) are
better capable to identify and measure effects that are simply
not detectable in pure cross-section or pure time series data,
(v) allow to construct and test more complicated behavioral
models than purely cross-section or time series data and thus
allow a researcher to analyze
a number of important economic questions that cannot be
addressed using one dimensional data, and limitations, e.g. (i)
design and data collection problem, (ii) distortions of
measurement errors or (iii) selectivity problem.
A panel data set is formulated by a sample that contains N
cross-sectional units (individuals, firms, households,
152
Journal of Economics, Business and Management, Vol. 3, No. 1, January 2015
countries etc.) that are observed at different time periods T
[34]. Simple linear panel data model can be written as (2):
ititit uXy ´ (2)
where y represents the dependent variable, X vector of
explanatory variables and subscript i denotes cross-section
dimension (groups of countries) whereas t time series
dimension (2004-2011), are coefficients and u is a
random disturbance term.
In general, three different methods can be carried out to
estimate linear panel data models by means of ordinary least
squares: (i) common constant refer to (2), (ii) fixed effects
and (iii) random effects. The common constant method
implies that there are no differences among variables of the
cross-sectional dimension, so-called homogenous panel.
Fixed or random effects allow us to capture the differences
among units; hence the random disturbance term u is given
by (3):
itiitu (3)
where i denotes unobservable individual-specific effect
which is time-invariant and is responsible for any
individual-specific effect that is not contained in the
regression (one-way error component). The random
disturbance term u from (2) is sometimes expressed as
so-called two-way error component (4):
ittiitu (4)
where t represents individual-invariant and it accounts for
any time-specific effect not included in the regression. In
case of fixed effect it is assumed to be fixed parameters to be
estimated whereas in case of random effect it is assumed to be
random and it denotes remainder disturbance which varies
over individuals and time [33], [31]. But the question, which
model is more appropriate still remains. For common
constant and fixed effect model we can apply standard F-test
under the null hypothesis (H0) that all the constants are the
same [34]. In random effect model we assume zero
correlation between explanatory variables and the
unobserved effect. Hausman test [35] is employed to find out
if this assumption is fulfilled under H0: random effects are
consistent and efficient. Moreover, it should fulfill the
assumptions for standard ordinary least squares error terms,
i.e. the remained disturbance is homoskedastic, serially and
spatial uncorrelated.
The Granger causality test is carried out to verify the
causality between economic freedom and national
competitiveness [36]. Reference [22] was followed. The key
point of the Granger causality is that the future cannot cause
the present or the past. However, the past may cause the
present or the future. We can say that X is causing Y, if we
are better able to predict Y using all available information
than if the information apart from X has been used [36], [37].
If this is the case or reserved, it is causality. When X is
causing Y and also Y is causing X, the feedback is occurring;
and when X is not causing Y and vice versa, than no causality
is occurring. The Granger causality assumes stationary series
only [36]. Equation (5) represents causality for variable y:
under H0: x does not Granger cause y.
tiqtij
q
j
qtij
q
jtiit
X
yy
,,1
,1
(5)
Moreover, it should fulfill the assumptions for standard
ordinary least squares error terms, i.e. the remained
disturbance is homoskedastic, serially and spatial
uncorrelated. In particular, to avoid spurious regression,
misleading conclusions and due to Granger causality test we
need to find out, if the panel data are stationary or
non-stationary. There are a few methods to find out the data
stationary or non-stationary. For homogenous panel data we
can employ [38] under the H0: each individual time series
contains unit root (non-stationary) against alternative
hypothesis that each time series is stationary. Reference [39]
proposes alternative approach for panel data. This method
tests H0: each individual time series contains unit root against
the alternative hypothesis for at least one time series is
stationary. All necessary tests are performed at the 5 per cent
significance level.
V. EMPIRICAL RESULTS
In this section there the results of three above mentioned
groups are presented.
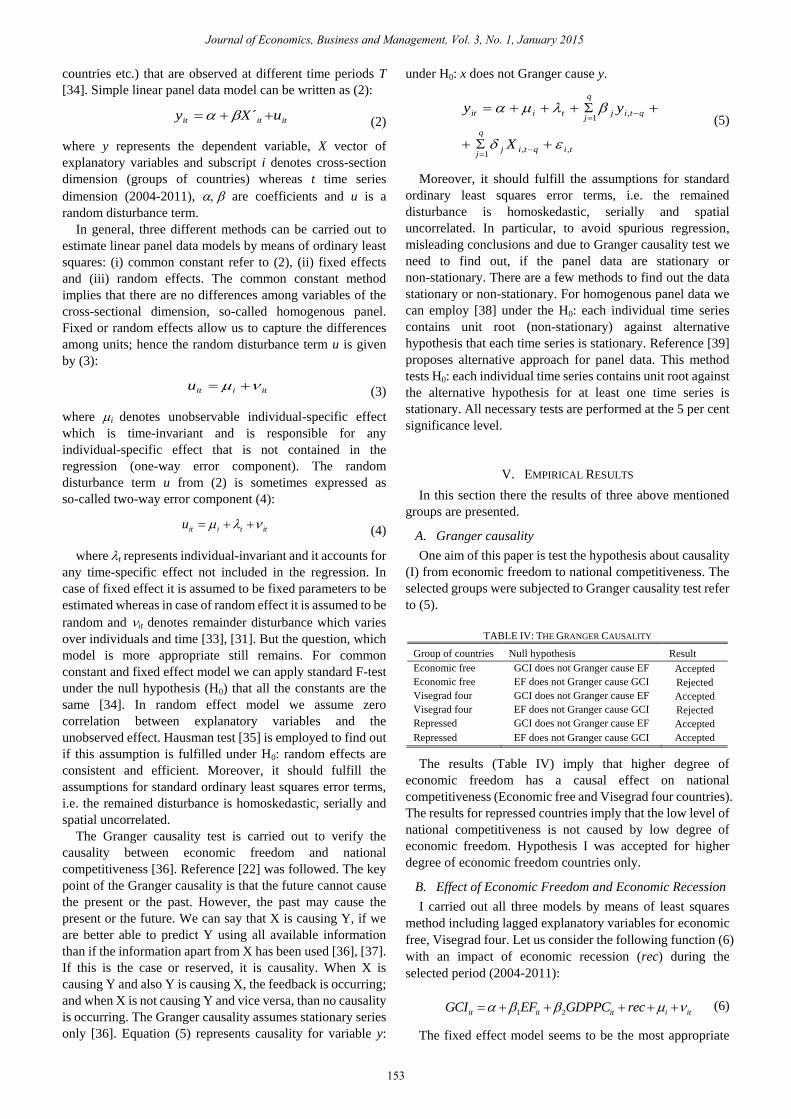
A. Granger causality
One aim of this paper is test the hypothesis about causality
(I) from economic freedom to national competitiveness. The
selected groups were subjected to Granger causality test refer
to (5).
TABLE IV: THE GRANGER CAUSALITY
Group of countries Null hypothesis Result
Economic free GCI does not Granger cause EF Accepted
Economic free EF does not Granger cause GCI Rejected
Visegrad four GCI does not Granger cause EF Accepted
Visegrad four EF does not Granger cause GCI Rejected
Repressed GCI does not Granger cause EF Accepted
Repressed EF does not Granger cause GCI Accepted
The results (Table IV) imply that higher degree of
economic freedom has a causal effect on national
competitiveness (Economic free and Visegrad four countries).
The results for repressed countries imply that the low level of
national competitiveness is not caused by low degree of
economic freedom. Hypothesis I was accepted for higher
degree of economic freedom countries only.
B. Effect of Economic Freedom and Economic Recession
I carried out all three models by means of least squares
method including lagged explanatory variables for economic
free, Visegrad four. Let us consider the following function (6)
with an impact of economic recession (rec) during the
selected period (2004-2011):
1 2it it it i itGCI EF GDPPC rec (6)
The fixed effect model seems to be the most appropriate
153
Journal of Economics, Business and Management, Vol. 3, No. 1, January 2015

one to identify the impact of economic freedom degree (EF)
and annual growth rate of GDP per capita (GDPPC) on
national competitiveness (GCI). The results of the first two
groups are shown in Table V (common coefficients) and
Table VI (individual-specific effect).
TABLE V: THE IMPACT ON NATIONAL COMPETITIVENESS
Variable/Country’s group Economic free Visegrad four
Intercept 70.54285 53.74256
EF (-1) 0.02236 0.04895
GDPPC (-1) 0.04437 0.02861
REC -0.48568 -0.88781
Numbers in parenthesis indicate the number of lags.
Intercepts indicate the average level of GCI in pre-recession
period: 70.54 for economic free countries and 53.74 for
Visegrad four countries; rec is telling us how much the
average level of GCI changed in post-recession period. The
values imply that the recession effect was stronger in
Visegrad countries which are less economic free and less
competitive as well.
As we can see economic freedom and economic growth
positively affect national competitiveness; hence the
hypothesis II is accepted for economic free and Visegrad four
countries.
TABLE VI: THE INDIVIDUAL EFFECT WITHIN GROUPS
Economic free Fixed effect Visegrad countries Fixed effect
Hong Kong 0.02550 Slovakia -1.61537
Singapore 3.38767 Czech Republic 3.13373
New Zealand -5.81089 Hungary -1.18839
Australia -3.18047 Poland -0.32997
Switzerland 5.57820 - -
Models and coefficients are statistically significant at five
(from one-way error component) fulfills the assumptions for
used methods. The Maddala & Wu test for unit root [39] was
carried out and at least one of time series is stationary, thus all
of panel data are stationary.
VI. CONCLUSION
The paper dealt with economic freedom and its effect on
national competitiveness. It examined two goals – causality
between economic freedom and national competitiveness and
effect of economic freedom on national competitiveness.
Thus two hypotheses were established: I: economic freedom
causes national competitiveness; II: economic freedom
positively affects national competitiveness.
The degree of economic freedom was measured by the
Heritage Foundation’s Index of economic freedom, national
competitiveness by the World Economic Forum’s Global
Competitiveness Index. Annual data were collected for the
most economic free, Visegrad four and the less economic free
countries (repressed) during the period 2004-2011.
I performed panel data analysis and Granger causality test.
Empirical results imply that higher degree of economic
freedom has a causal effect on national competitiveness.
Thus hypothesis I was accepted for economic free and
Visegrad countries only. Economic freedom positively
affected national competitiveness, hence the hypothesis II
was accepted (for economic free and Visegrad countries).
The degree of economic freedom promotes the national
competitiveness.
REFERENCES
[1] S. Lall, “Competitiveness indices and developing countries: An
economic evaluation of the Global competitiveness report,” World
Development, vol. 29, no. 9, pp. 1501-1525, 2001.
[2] D. S. Landes, The Wealth and Poverty of Nations: Why are Some So
Rich and Others Poor, 1st ed. New York: Norton, 1998.
[3] D. C. North and R. P. Thomas, The Rise of the Western World: A New
Economy History, 2nd ed. Cambridge: Cambridge University Press,
1976.
[4] J. Biddle, “The introduction of the Cobb-Douglas regression,” The
Journal of Economic Perspectives, vol. 26, no. 2, pp. 223-236, 2012.
[5] F. Ulengin, B. Ulengin, and S. Onsel, “A power-based measurement
approach to specify macroeconomic competitiveness of countries,”
Socio-Economic Planning Sciences, vol. 36, pp. 203-223, 2002.
[6] P. R. Krugman, “Competitiveness: a dangerous obsession,” Foreign
Affairs, vol. 73, no. 2, pp. 28-44, 1994.
[7] B. R. Scott and G. C. Lodge, U.S. Competitiveness in the world
economy, 1st ed. Harvard Business School Press, 1985.
[8] M. E. Porter, The Competitive Advantage of Nations: with a New
Introduction, 2nd ed. New York: Free Press, 1998.
[9] A. Boltho, “The assessment: International competitiveness,” Oxford
Review of Economic Policy, vol. 12, no. 3, pp. 1-16, 1996.
[10] J. Fagerberg, “Technology and competitiveness,” Oxford Review of
Economic Policy, vol. 12, no. 3, pp. 39-51, 1996.
[11] K. Aiginger, “A framework for evaluating the dynamics
competitiveness of countries,” Structural Change and Economic
Dynamics, no. 9, pp. 159-188, 1998.
[12] J. Nevima and J. Ramík, “Application of multicriteria decision making
for evaluation of regional competitiveness,” in Proc. 27th International
Conference on Mathematical Methods in Economics, Prague, 2009, pp.
239-244.
[13] E. Klvačová and J. Malý, Domnělé a Skutečné Bariéry
Konkurenceschopnosti EU a ČR, 1st ed. Praha. 2008.
[14] L. Sirowy and A. Inkeles, “The effects of democracy on economic
growth and inequality: a review,” Studies in Comparative International
Development, vol. 25, pp. 126-157, 1990.
[15] A. Przeworski and F. Limongi, “Political regimes and economic
growth,” Journal of Economic Perspectives, vol. 7, pp. 51-69, 1993.
[16] J. de Haan and J.-E. Sturm, “On the relationship between economic
freedom and economic growth,” European Journal of Political
Economy, vol. 16, pp. 215-241, 2000.
[17] X. de Vansay and Z. A. Spindler, “Freedom and growth: do
constitutions matter?” Public Choice, vol. 78, pp. 359-372, 1994.
[18] M. A. Nelson and R. D. Singh, “Democracy, economic freedom, fiscal
policy and growth in LDCs: a fresh look,” Development and Cultural
Change, vol. 46, pp. 677-696, 1998.
[19] R. J. Barro, “Democracy and growth,” NBER, Working paper no. 4909,
1994.
[20] J. Gwartney, R. Lawson, and R. G. Holcombe, “Economic freedom and
the environment for economic growth,” Journal of Institutional and
Theoretical Economics, vol. 155, no. 4, pp. 1-21, 1999.
[21] L. C. Adkins, R. L. Moomaw, and A. Savvides, “Institutions, freedom
and technical efficiency,” Southern Economic Journal, vol. 69, pp.
92-108, 2002.
[22] M. K. Justesen, “The effect of economic freedom on growth revisited:
New evidence on causality from a panel of countries 1970-1999,”
European Journal of Political Economy, vol. 24, pp. 642-660, 2008.
[23] M. Herciu and C. Ogrean, “Interrelations between economic freedom,
knowledge economy and global competitiveness – comparative
analysis Romania and EU average,” Studies in Business Economics,
vol. 6, pp. 46-59, 2011.
[24] J. Gwartney, R. Lawson, and W. Block. (1996). Economic freedom of
the world: 1975-1995. [Online]. Available:
http://oldfraser.lexi.net/publications/books/econ_free95/.
[25] J. Gwartney, R. Lawson, J. Hall, J.-P. Chauffour, and M. D. Stroup.
(2011). Economic freedom of the world: 2011 annual report. [Online].
Available:
http://www.freetheworld.com/2011/reports/world/EFW2011_complet
e.pdf.
154
Journal of Economics, Business and Management, Vol. 3, No. 1, January 2015

[26] T. Miller et al. (2012). 2012 Index of economic freedom, [Online].
Available:
http://www.heritage.org/index/pdf/2012/book/index_2012.pdf.
[27] IMD, World Competitiveness Yearbook 2012, 1st ed. Lausanne: IMD
Press, 2011.
[28] K. Schwab et al. (2012). The global competitiveness report 2012-2013.
The World Economic Forum. [Online]. Available:
http://reports.weforum.org/global-competitiveness-report-2012-2013/.
[29] I. Majerová, “Global financial crisis and its impact on the least
developed countries,” in Proc. 13th International Conference on
Finance and Banking, Karviná, 2012, pp. 216-228.
[30] J. M. Wooldridge, Econometric Analysis of Cross Section and Panel
Data, 2nd ed. Massachusetts: MIT Press, 2010.
[31] C. Hsiao, Analysis of Panel Data, 2nd ed. Cambridge: Cambridge
University Press, 2003.
[32] N. A. Klevmarken, “Panel studies: what can we learn from them?”
European Economic Review, vol. 33, no. 2-3, pp. 523-529, 1989.
[33] B. H. Baltagi, Econometric Analysis of Panel Data, 3rd ed. Chichester:
John Wiley & Sons, 2005
[34] D. Asteriou and S. G. Hall, Applied Econometrics: A modern Approach
using EViews and Microfit, 2nd ed. New York: Palgrave Macmillan,
2007.
[35] J. A. Hausman, “Specification tests in econometrics,” Econometrica,
vol. 46, no. 6, pp. 1251-1271, 1978.
[36] C. W. J. Granger, “Investigating causal relations by econometric
models and cross-spectral methods,” Econometrica, vol. 37, no. 3, pp.
424-438, 1969.
[37] G. S. Maddala and K. Lahiri, Introduction to Econometrics, 4th ed.
Chichester: John Wiley & Sons, 2009.
[38] A. Levin, C. Lin, and C. J. Chu, “Unit root tests in panel data:
asymptotic and finite-sample properties,” Journal of Econometric, no.
108, pp. 1-24, 2002.
[39] G. S. Maddala, and S. A. Wu, “Comparative study of unit root tests
with panel data and a new simple test,” Oxford Bulletin of Economics
and Statistics, vol. 61, pp. 631-652, 1999.
Tomas Verner was born in Sumperk in the Czech
Republic on 18 December 1981. He received his MS
degree in Economics at the VSB-Technical University
of Ostrava, Faculty of Economics, in Ostrava, Czech
Republic, in 2006. He is co-author of the book:
Economic policy of the Czech Republic after its
accession to the European Union (Karvina, Czech
Republic, Silesian University in Opava, School of
Business Administration in Karvina, 2011) and
co-author of few papers, e.g. Relationship between human capital and
economic growth: The case of Austria (Karvina, Czech Republic, Silesian
University in Opava, School of Business Administration in Karvina, 2012),
Economic performance and the labour market in the context of the economic
crisis: experience from the Visegrad four countries (Liberec, Czech Republic,
Technical University of Liberec, Faculty of Economics, 2012). Currently he
works as a full-time Assistant Professor at the Silesian University in Opava,
School of Business Administration in Karvina, Czech Republic. His research
interests are related to economic policy, national competitiveness and
national accounts.
Author’s formal
photo
155
Journal of Economics, Business and Management, Vol. 3, No. 1, January 2015