the effect of earthquake frequency content and soil
TRANSCRIPT

1
Numerical Methods in Civil Engineering
The effect of earthquake frequency content and soil structure interaction
on the seismic behavior of concrete gravity dam-foundation-reservoir
system
Hamid Mohammadnezhad * Narges Saeednezhad ** Payam Sotoudeh ***
ARTICLE INFO
Article history:
Received:
March 2020.
Revised:
April 2020.
Accepted:
May 2020.
Keywords:
dam-foundation-reservoir
frequency content
soil-structure interaction
seismic analysis
earthquake characteristics
Abstract:
The effect of frequency content on the dynamic response of concrete gravity dams is investigated
in this paper. Dams are one of the most complex structures to handle when there is dynamic
analysis involved. One of the influential parameters on these structures' seismic response is the
frequency content of the earthquakes. An index to represent frequency content, which represents
frequency content by PGA/PGV ratio(FCI) and sets three ranges including high(FCI>1.2),
intermediate(0.8<FCI<1.2) and low-frequency content (FCI<0.8) is used in this paper. To
simply study the effect of different frequency contents, a comparative analysis with different
earthquake records with different frequency contents is performed on the finite element model of
the Pine Flat concrete gravity dam. Results indicate a great influence of frequency content on the
dynamic response of the structure. On a side note, to study the effect of soil-structure interaction,
the same model has been analyzed under different modular ratios (modular ratio is the ratio of
modulus of elasticity of the foundation of the structure(𝐸𝑓 𝐸𝑠⁄ ). This is one of the simplest ways
to introduce interaction effects in the analysis. The outcome states that different modular ratios
(hence different soil-structure interaction participation) have an immense effect on the dam's
dynamic response.
1. Introduction
One of the most glamorous structures of the present time is
a dam that might get lost during analyzing procedures.
When there is such a complex system like procedure to get
the most accurate results with less computational cost, a
simplification procedure is where unintended ignorance
may occur.
*Corresponding Author: Assistant Professor, Faculty of Civil, Water &
Environmental Engineering, Shahid Beheshti University, Tehran, Iran.
Email: [email protected] ** MSc Student, Faculty of Civil, Water & Environmental Engineering,
Shahid Beheshti University, Tehran, Iran. *** Ph.D. Candidate, Department of Civil Engineering, Sharif University
of Technology, Tehran, Iran.
Most simplifications are made where there is high
complexity or high uncertainty. A good example of both
these issues is the dynamic analysis of structures, mainly
concrete gravity dams, under earthquake excitation. There
have been numerous studies on the dynamic analysis of
concrete dams in recent years, each covering a unique
aspect that might interfere with the analysis results. Studies
on the seismic behavior of structural buildings have long
been the subject of interest in civil engineering. The
particular effect of vibration frequency on the system's
response has been studied by many researchers separately.
Some real outcomes are presented by Jennings and Kuroiwa
[1], Foutch et al. [2], Mcverry [3], and Chopra [4]. One of
their significant findings on this subject was that the
resonance phenomenon must be dealt with special care
since its peak response is expected to happen. Resonance
occurs when vibration frequency is very close to the
[ D
OI:
10.
5254
7/nm
ce.4
.4.1
]
[ D
ownl
oade
d fr
om n
mce
.knt
u.ac
.ir o
n 20
22-0
3-16
]
1 / 10

Numerical Methods in Civil Engineering, Vol. 4, No. 4, June. 2020
corresponding natural frequency of the system. In 1988
Leger and Boughoufalah. [5] studied the effect of different
earthquake input mechanisms for concrete gravity dams.
They proposed different mechanisms and performed a
comparative study to present the advantages and
disadvantages of every proposed model. Although not very
accurate, they concluded that assuming a massless
foundation and applying earthquake at its boundaries yields
fairly acceptable results within the computational cost
budget available when dealing with an engineering problem
and not a purely academic problem. Later on, Mirzabozorg
et al. [6] studied the effect of non-uniform excitation on
linear and non-linear responses of arch dams in a dam-
reservoir-massed foundation system. They were able to find
out that in the case of non-uniform excitation versus
uniform excitation, responses obtained from the non-
uniform case has completely different frequency content
than the uniform case. In 2012, Ghaemian and Sohrabi-
Gilani [7,8] investigated the effect of non-uniform ground
motion on the seismic response of concrete arch dams.
They concluded that multiple support excitation can
significantly influence the seismic response of concrete
arch dams and even increase the responses in specific cases.
The argument around earthquakes is somewhat extensive,
but this paper is dedicated to studying the effect of only one
particular property of earthquakes on the seismic behavior
of concrete gravity dams, which is their frequency content.
The frequency content of earthquakes can have enormous
effects on the outcome of concrete gravity dams analysis.
One index that can be used as a representative of frequency
content is the ratio of PGV (Peak Ground Velocity) to PGA
(Peak Ground Acceleration) [9,10]. According to Kramer
[11], although this ratio can be interpreted as a meaningful
index for frequency content, parameters like predominant
period, bandwidth, central frequency, power spectrum
intensity, response spectrum intensity, velocity spectrum
intensity and acceleration spectrum intensity are also of
interest in this category. He states that there are numerous
ways to consider frequency content in a problem. Tso et al.
[12] and Kermani et al. [13] have shown that although PGV
and PGA are useful intensity measures, they can't solely
describe frequency content. On the other hand, their ratio is
a fine measure to represent frequency content. Livaoglu
[14] and Panchal and Jangid [15] investigated the seismic
response of elevated steel water storage tanks with the view
of considering different characteristics of the earthquakes.
Their study analyzed the tank under various earthquake
records (and thus different frequency contents) and
concluded that frequency content affects the structure
responses. Shakib and Omidinasab [16] studied the
response of an elevated water storage tank under ground
motions with different frequency contents. They found out
that earthquakes with low-frequency contents affect the first
convective mode more severely and result in large vertical
displacements on the free surface of the water. In contrast,
earthquakes with high-frequency contents affect the first
impulsive mode more and result in high response
parameters. Gazetas et al. [17] investigated the effect of
different frequency content on the non-linear response of
earth dams. They found out that the response of the system
is highly sensitive to the predominant period of excitation.
Popsecu [18] took the liberty of focusing his research on the
seismic behavior of systems when a complex environment
like soil is involved. He concluded that earthquake
excitation's frequency content and dynamic properties of
soil are equally important in the dynamic analysis of any
system and can profoundly affect the response of the
structure or system. Kianoush and Ghaemmaghami [19]
studied the frequency content effects on a particular
rectangular liquid tank subject. With some simplifications,
they also took soil-structure interaction into account in their
study. They concluded that frequency content could have a
major influence on the seismic response of the rectangular
liquid tanks. The same analysis for a different problem was
performed by Cakir [20]. He investigated the effect of
earthquake frequency content on the seismic response of
cantilever retaining wall with soil-structure interaction. He
also found out that frequency content can have profound
effects on the dynamic response of the wall.
In this study, frequency content is represented by
PGA/PGV ratio. For abbreviation purposes, let's call this
ratio (PGA/PGV) the frequency content index or indicator
(FCI). This way, an earthquake has high-frequency content
if FCI>1.2, intermediate frequency content if 1.2>FCI>0.8,
and low-frequency content when FCI<0.8 [19]. The sole
purpose of this paper is to investigate the effect of different
frequency contents on the seismic behavior of concrete
gravity dams. Due to this purpose, a finite element model of
the Pine Flat concrete gravity dam is analyzed under
different earthquake input motions with varying contents of
frequency. As will be seen, results indicate a high
dependency on dam response to the frequency content ratio
of the earthquake.
Other influential parameters in the analysis, which are up to
date and still a dilemma for scientists are fluid-structure and
soil-structure interaction. There has been no accurate model
that can effectively yet simply take soil-structure interaction
into account. Since this paper's aim is mainly focused on
frequency content effects in the analysis, no such accurate
[ D
OI:
10.
5254
7/nm
ce.4
.4.1
]
[ D
ownl
oade
d fr
om n
mce
.knt
u.ac
.ir o
n 20
22-0
3-16
]
2 / 10

3
modeling of interaction is the case here. In order not to
completely ignore the existence of this property, one can
use a technique like running the analysis for different
modular ratios (modular ratio is the ratio of modulus of
elasticity of the foundation to the structuref
s
E
E) and
comparing the results. This is mathematically simple,
computationally cheaper than other complicated methods,
and yet acceptably accurate. Plus, this leads to the effortless
implementation of the soil-structure interaction into the
model. The analysis was performed for modular ratios
equal to 0.25, 0.5, 1, 2, 4, infinite, which by infinite means
a rigid foundation. Results indicate a high dependency of
the response to modular ratio as well.
2. Mathematical Basics of the model
As it is clear, the distribution of hydrodynamic pressure in
the reservoir is governed by the pressure wave equation. If
the fluid (in our case reservoir's water) is assumed
incompressible and inviscid, then the wave propagation
equation simplifies into the following form known as
Laplace equation:
2 ( , , ) 0p x y t (1)
In which P(x,y,t) is the hydrodynamic pressure only. Note
that the above formulation is only valid for small amplitude
motions in which convective terms can be neglected.
Since the above equation is a boundary value problem, it
needs proper boundary conditions to be solved. There must
be no flow across the interface at the fluid-structure
interface, which means that there is no relative velocity.
This can be represented mathematically in the following
form:
sn nv v (2)
In which n is the unit normal vector to the boundary at the
dam-reservoir interface and snv and nv are the velocity of
the structure (dam) and fluid along with the n, respectively.
With further manipulations, this leads to the following
boundary condition at the dam-reservoir interface:
sn
pa
n
(3)
In which sna is the normal acceleration of the dam.
With some minor differences, a look-alike equation can be
used for the reservoir-foundation boundary condition,
which has the following form:
fn
p pq a
n t
(4)
Where fna is the normal acceleration of the foundation and
q is the admittance or damping coefficient. For a rigid
foundation, q becomes zero, and the above equation is
virtually the same as the one derived for the dam-reservoir
boundary condition.
At the reservoir's surface, the most effective parameter to
take into account is the small-amplitude gravity waves.
Since it is customary to neglect gravity wave effects at the
reservoir's surface, when the system being analyzed is dam-
reservoir-foundation, the free-surface boundary condition is
appropriately applicable to the problem at hand. This can be
interpreted mathematically by the following relationship:
( , , , ) 0P x y H t (5)
In which H is the height of the reservoir.
There remains only one boundary condition, and that is the
reservoir's far-end truncated boundary condition. Numerous
boundary conditions have been proposed, but for the
problem at hand, an appropriate non-reflective boundary
condition was applied to prevent any waves reaching the
far-end from reflecting back into the system. This is based
on the very fact that any wave propagating toward infinity
can be accounted as a planar wave and thus, theoretically,
can be fully absorbed by appropriate boundary conditions.
3. Properties and modeling
The model at hand is the finite element model of the Pine
Flat concrete gravity dam. The properties of the materials
used in the modeling are presented in table 1.
The dam is on the Kings River of central California. It is
130 meters high with a total capacity of the reservoir equal
to 1.2 cubic kilometers. The whole system is modeled in the
analysis, which means a dam-foundation-reservoir system
is going to be analyzed. The finite element model of the
dam is developed using the existing schematics of the dam.
The properties of the dam, reservoir, and foundation were
selected according to Table1. Other modeling techniques
and assumptions will be illustrated in their respective
sections.
[ D
OI:
10.
5254
7/nm
ce.4
.4.1
]
[ D
ownl
oade
d fr
om n
mce
.knt
u.ac
.ir o
n 20
22-0
3-16
]
3 / 10
Numerical Methods in Civil Engineering, Vol. 4, No. 4, June. 2020
Table. 1: Material Properties
* Since one of the subjects of this study is investigating the effect of
modular ratio on the response of the structure, foundation modulus will be
chosen concerning the intended modular ratio in the analysis.
It should be noted that the values in Table 1 are selected
from the official reports on the subject.
In this paper, the concrete of the dam body is assumed to be
elastic. As can be seen in the above table, the density of the
foundation is equal to zero. This is purely for modeling
purposes. To illustrate this matter a little more, when we
have a dam-foundation-reservoir system, modeling all the
details in a way that there are consistent with one another is
a complex effort. One of the facts that has been a subject of
argument for many years now is the foundation's mass. As
it is clear, the most realistic model should include a massed
foundation along with proper models of reservoir and
structure. The Effects of massed foundation on the dynamic
results of concrete gravity dams have been studied by many
people such as Aghajanzadeh, et al [21], mohammadnezhad
et al. [22] and sotoudeh et al. [23]. However the finite
element modeling of this very important detail in the
analysis is extremely complex, so, an alternative approach
should be used. One of the most frequently used approaches
is the massless foundation model. Although this model is
not a realistic model, it is a suitable approach for modeling
foundation for this particular problem. Bear in mind that it
is a comparative study meaning where the results will be
compared correspondingly; thus, a fairly appropriate
approach for all models can be accomplished.
The dam-foundation-reservoir system has been modeled in
ABAQUS software [24] and the dam and foundation were
modeled using eight-node isoparametric solid elements with
the properties given in Table 1. It is worth mentioning that
for each analysis, proper value for the foundation modulus
of elasticity was chosen with respect to the intended
modular ratio. The reservoir was modeled using 8-node
acoustic elements. Acoustic elements have only one degree
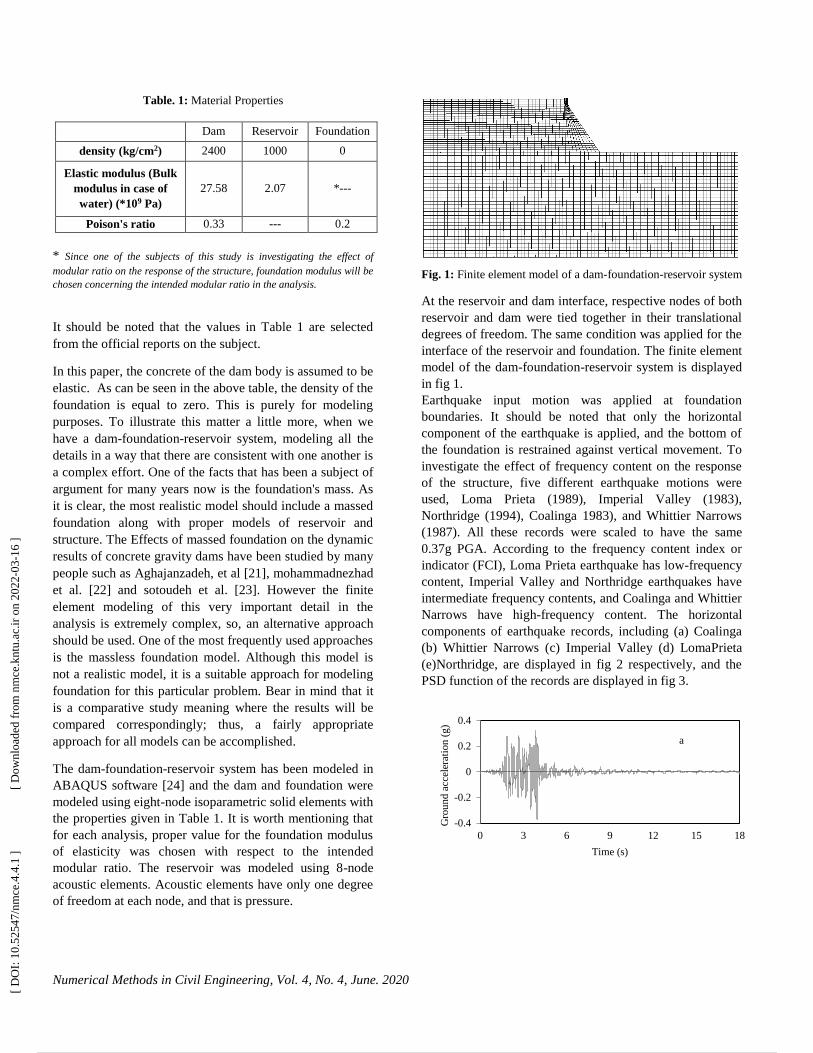
of freedom at each node, and that is pressure.
Fig. 1: Finite element model of a dam-foundation-reservoir system
At the reservoir and dam interface, respective nodes of both
reservoir and dam were tied together in their translational
degrees of freedom. The same condition was applied for the
interface of the reservoir and foundation. The finite element
model of the dam-foundation-reservoir system is displayed
in fig 1.
Earthquake input motion was applied at foundation
boundaries. It should be noted that only the horizontal
component of the earthquake is applied, and the bottom of
the foundation is restrained against vertical movement. To
investigate the effect of frequency content on the response
of the structure, five different earthquake motions were
used, Loma Prieta (1989), Imperial Valley (1983),
Northridge (1994), Coalinga 1983), and Whittier Narrows
(1987). All these records were scaled to have the same
0.37g PGA. According to the frequency content index or
indicator (FCI), Loma Prieta earthquake has low-frequency
content, Imperial Valley and Northridge earthquakes have
intermediate frequency contents, and Coalinga and Whittier
Narrows have high-frequency content. The horizontal
components of earthquake records, including (a) Coalinga
(b) Whittier Narrows (c) Imperial Valley (d) LomaPrieta
(e)Northridge, are displayed in fig 2 respectively, and the
PSD function of the records are displayed in fig 3.
-0.4
-0.2
0
0.2
0.4
0 3 6 9 12 15 18
Gro
un
d a
ccel
erat
ion
(g)
Time (s)
a
Dam Reservoir Foundation
density (kg/cm2) 2400 1000 0
Elastic modulus (Bulk
modulus in case of
water) (*109 Pa)
27.58 2.07 *---
Poison's ratio 0.33 --- 0.2
[ D
OI:
10.
5254
7/nm
ce.4
.4.1
]
[ D
ownl
oade
d fr
om n
mce
.knt
u.ac
.ir o
n 20
22-0
3-16
]
4 / 10

5
Fig. 2: Horizontal components of earthquake records:
(a) Coalinga (b) Whittier Narrows (c) Imperial Valley
(d) Loma Prieta (e) Northridge
-0.4
-0.2
0
0.2
0.4
0 3 6 9 12 15 18
Gro
un
d a
ccel
erat
ion
(g)
Time (s)
b
-0.4
-0.2
0
0.2
0.4
0 3 6 9 12 15 18
Gro
un
d a
ccel
erat
ion
(g)
Time (s)
c
-0.4
-0.2
0
0.2
0.4
0 3 6 9 12 15 18
Gro
un
d a
ccel
erat
ion
(g)
Time (s)
d
-0.4
-0.2
0
0.2
0.4
0 3 6 9 12 15 18
Gro
un
d a
ccel
erat
ion
(g)
Time (s)
e
0
0.02
0.04
0.06
0.08
0 5 10 15 20
Pow
er a
mp
litu
de
Frequency (Hz)
a
0
0.02
0.04
0.06
0.08
0 5 10 15 20
Pow
er a
mp
litu
de
Frequency (Hz)
b
0
0.05
0.1
0.15
0.2
0.25
0.3
0 5 10 15 20
Pow
er a
mp
litu
de
Frequency (Hz)
c
0
0.02
0.04
0.06
0.08
0.1
0.12
0 5 10 15 20
Pow
er a
mp
litu
de
Frequency (Hz)
d
[ D
OI:
10.
5254
7/nm
ce.4
.4.1
]
[ D
ownl
oade
d fr
om n
mce
.knt
u.ac
.ir o
n 20
22-0
3-16
]
5 / 10

Numerical Methods in Civil Engineering, Vol. 4, No. 4, June. 2020
Fig. 3: PSD function of: (a) Coalinga (b) Imperial Valley (c)
Loma Prieta (d) Northridge (e) Whittier Narrows
4. Analysis
4.1 Modal analysis
To apply proper damping to the system, a method is
needed. Rayleigh's method, by far, is one of the simplest yet
fairly accurate methods proposed. Subsequently, Hall [25]
proposed a modification that would improve Rayleigh's
method in estimating the system's damping. In order to do
so, modal analysis was performed for models (a system of
dam-reservoir-foundation) with different modular ratios to
obtain natural frequencies of the system. According to the
following formulation, using Hall's proposed modification,
the damping coefficients for different models are presented
in Table 2. α and β.
[C] = α[M] + β[K] (6)
Table. 2: Damping coefficients for different models
modular
ratio α β
0.25f
s
E
S 1.36 0.00085
0.5f
s
E
S 1.67 0.00077
1f
s
E
S 1.94 0.00072
2f
s
E
S 2.14 0.00068
4f
s
E
S 2.27 0.00066
f
s
E
S 2.45 0.00060
It should be mentioned that the infinite modular ratio in
Table 2 means a rigid foundation.
4.2 Dynamic analysis
For the given and calculated properties, a finite element
model of the Pine Flat dam was developed for dynamic
analysis. Altogether, there are 6 different modular ratios
and 5 different earthquakes (which are representatives are
different frequency contents). Thus 30 dynamic analyses
were performed in this area. The outputs of interest are
relative displacement of the crest with respect to the heel of
the dam and root mean square of nodal displacements
(RMSD). RMSD is the root mean square of nodal
displacement for each given time history and is calculated
by the following relation proposed by Leger and
Boughoufalah [5]:
0.5
2
1
( )n
j ii
RMSD u t
(7)
ti is the cumulative time after ith time step, and n is the total
number of steps. Uj(ti) is the jth node's nodal displacement
at time step ti of the time history.
4.3 Results
Modal and dynamic analysis of the dam-foundation-
reservoir system was carried out based on the parameters
given in table 1.
The maximum relative displacement of the crest to the heel,
obtained from the dynamic analysis under the effect of
every 5 earthquake records and for different modular ratios
is given in table3. RMSD value calculated with formula7
under the effect of 5 earthquake records is exhibited in
table4.
Results show maximum relative displacement and RMSD
values decrease when modular ratio increases for all records
(except Coalinga Earthquake). But this case shows that a
clear trend cannot be seen with respect to modular ratio
since Coalinga earthquake yields greater displacements
when the foundation moves from a highly flexible state to a
rigid state.
Table. 3: Max relative displacement of the crest with respect to
the heel (cm)
0
0.02
0.04
0.06
0.08
0.1
0.12
0 5 10 15 20
Pow
er a
mp
litu
de
Frequency (Hz)
e
modular ratio
Earthquakes 0.25 0.5 1 2 4 rigid
Loma Prieta 18.57 18.96 9.4 7.4 5.8 6.1
Imperial
Valley 8.79 8.37 5.8 5.6 3.73 3.8
Northridge 14.5 11 12.6 7.47 6.6 6.9
Coalinga 2.8 3.7 3.9 3.9 5.2 4.8
Whittier
Narrows 4.8 3.1 3.5 3.3 3.7 3.4
[ D
OI:
10.
5254
7/nm
ce.4
.4.1
]
[ D
ownl
oade
d fr
om n
mce
.knt
u.ac
.ir o
n 20
22-0
3-16
]
6 / 10

7
The time histories of relative displacement of the crest to
the heel under the effect of Whittier narrow (high-frequency
content) and Northridge (intermediate-frequency content)
records in the rigid case are compared in fig4, and under the
effect of the imperial valley (intermediate-frequency
content) and Lomaprieta (low-frequency content) records
are compared in fig5.
Fig. 4: Time histories of relative displacement of the crest with
respect to the heel under the effect of Whittier Narrows and
Northridge earthquakes in the rigid case
Fig. 5: Time histories of relative displacement of the crest with
respect to the heel under the effect of Imperial Valley and Loma
Prieta earthquake in the rigid case
As a result, based on fig 4 and 5, it can be seen that by
increasing the FCI ratio (which leads to high-frequency
content), the maximum relative displacement decreases.
Table. 4: RMSD value (cm)
RMSD values and maximum relative displacements of the
crest to the heel under the effect of 5 earthquake records
and different Ef/Es ratios are compared in fig 6 and 7,
respectively.
Fig. 6: Comparisons of RMSD for different earthquake
records
Fig. 7: Comparisons of maximum relative displacement of the crest with respect to the heel for different earthquake records
Figures 6 and 7 show that by decreasing the FCI Ratio
(which means reducing of frequency content), the effect of
Ef/Es on RMSD value and relative displacement will
increase and it is also clear that, as the rigidity of the
0
50
100
150
200
250
Loma Prieta Imperial
Valley
Northridge Coalinga Whittier
Narrows
RM
SD
(cm
)
Ef/Es=0.
5
Ef/Es=2
modular ratio
Earthquaks 0.25 0.5 1 2 4 rigid
Loma Prieta 197.1 194.87 104.7 74.27 65.5 67.6
Imperial
Valley 109.7 94.9 71.28 61.8 49.17 51.6
Northridge 169.83 152.28 135.12 104.28 83.17 86.5
Coalinga 26.7 35.3 30.15 34.17 44.64 44.3
Whittier
Narrows 33.08 27.38 21.98 25.05 25.37 25.7
[ D
OI:
10.
5254
7/nm
ce.4
.4.1
]
[ D
ownl
oade
d fr
om n
mce
.knt
u.ac
.ir o
n 20
22-0
3-16
]
7 / 10

Numerical Methods in Civil Engineering, Vol. 4, No. 4, June. 2020
foundation increases, the maximum relative displacement,
and the RMSD value will decrease in low and intermediate
frequency content.
Figures 8 and 9 show the time history of relative
displacements of the crest for different Ef/Es ratio under the
effect of a constant earthquake, including Lomaprieta and
Imperial Valley earthquake, respectively. Also, the time
histories of relative displacement of the crest for constant
Ef/Es ratio under the effect of three earthquake records with
different frequency content (low, intermediate and high) are
displayed in fig 10 and 11.
Fig. 8: Time histories of relative displacement of the crest with
respect to heel under the effect of Loma Prieta earthquake
Fig. 9: Time histories of relative displacement of the crest with
respect to the heel under the effect of Imperial Valley earthquake
Fig. 10: Time histories of relative displacement of the crest with
respect to the heel in Ef/Es=1 case
Fig. 11: Time histories of relative displacement of the crest with
respect to the heel in Ef/Es=0.25 case
For comparing the tensile and compressive stresses, three
elements of the dam, including EL.A, EL.B, and EL.C,
have been chosen (shown in fig 12). In a rigid case, the
stresses under the effect of 5 earthquake records have been
calculated and shown in Figures 13 and 14. Results indicate
a dependency of the stresses to frequency content index
(FCI) and modular ratio. Nevertheless, stress output in
chosen elements has a high discrepancy, and no clear trend
is displayed.
[ D
OI:
10.
5254
7/nm
ce.4
.4.1
]
[ D
ownl
oade
d fr
om n
mce
.knt
u.ac
.ir o
n 20
22-0
3-16
]
8 / 10

9
Fig. 12: Elements that used to compare stresses
Fig. 13: Comparisons of tensile stress for different
earthquake records in the rigid case
Fig. 14: Comparisons of compressive stress for different
earthquake records in the rigid case
5. Conclusion
The effect of earthquake frequency content and soil-
structure interaction on seismic response of the Pine Flat
concrete gravity dam was investigated in this paper. As it is
clear from Tables and Figures, results indicate a high
dependency of the structure's response to frequency content
index (FCI) and modular Ratio.
Results show that although all records have the same PGA
(0.37g), maximum relative displacements and RMSD
values differ. This difference is so high that, for example, in
the modular ratio equal to 0.25, the maximum relative
displacement for Loma Prieta earthquake (which is a low-
frequency type of earthquake) is more than six times greater
than Coalinga Earthquake (which is a high-frequency type
of earthquake). Results indicate that overall, low-frequency
earthquakes yield greater response than high-frequency
ones.
The Dependency of results on the modular ratio is
somehow different. For all records (except Coalinga
Earthquake), maximum relative displacement and RMSD
values decrease when the modular ratio increases. But this
case shows that a clear trend cannot be seen with respect to
modular ratio since Coalinga earthquake yields greater
displacements when the foundation moves from a highly
flexible state to a rigid state. However, stress output in
chosen elements has a high discrepancy, and no clear trend
is present. Peak values of stress do not differ as much as
maximum relative displacement and RMSD value in
different cases.
References
[1] Jennings PC, Kuroiwa JH. Vibration and soil–structure
interaction tests of a nine-story reinforced concrete building. Bull
Seismol Soc Amer 1968;58: 891–916.
[2] Foutch DH, Housner GW, Jennings PC. Dynamic responses of
six multistory buildings during the San Fernando earthquake.
Report No. EERL 75-02, California Institute of Technology; 1975.
[3] Mcverry GH. Frequency domain identifications of structural
models from earthquake records. Report No. EERL 79-02,
California Institute of Technology; 1979.
[4] Chopra AK. Dynamics of structures. Upper Saddle River (NJ):
Prentice-Hall; 1995.
[5] Leger, P., & Boughoufalah, M. (1989). Earthquake input
mechanisms for time-domain analysis of dam—foundation
systems. Engineering Structures, 11(1), 37-46.
[6] Mirzabozorg, H., Varmazyari, M., & Ghaemian, M. (2010).
Dam-reservoir-massed foundation system and traveling wave
[ D
OI:
10.
5254
7/nm
ce.4
.4.1
]
[ D
ownl
oade
d fr
om n
mce
.knt
u.ac
.ir o
n 20
22-0
3-16
]
9 / 10

Numerical Methods in Civil Engineering, Vol. 4, No. 4, June. 2020
along reservoir bottom. Soil Dynamics and Earthquake
Engineering, 30(8), 746-756.
[7] Ghaemian, M., & Sohrabi-Gilani, M. (2012). Seismic
responses of arch dams due to non-uniform ground
motions. Scientia Iranica, 19(6), 1431-1436.
[8] Sohrabi-Gilani, M., & Ghaemian, M. (2012). Spatial variation
input effects on seismic response of arch dams. Scientia
Iranica, 19(4), 997-1004.
[9] Newmark NM. A study of vertical and horizontal earthquake
spectra .NM newmark consulting engineering services. Directorate
of licencing, US atomic energy comission:Washington,DC;1973.
[10] McGuire RK. Seismic ground motion parameter relations.
ASCE Journal of the Geotechnical Engineering Division
1978;104(GT4):481–90.
[11]KramerSL.Geotechnicalearthquakeengineering.NewJersey:Pre
ntice-Hall;1996.
[12] Tso WK, Zhu TJ, Heidebrecht AC. Engineering implications
of ground motion A/V ratio. Soil Dynamics and Earthquake
Engineering 1992;11(3):133–44.
[13] Kermani E, JafarianY, Baziar MH. New predictive emodels
for the vmax/amax ratio of strong ground motions using genetic
programming. International Journal of Civil Engineering
2009;7(4):236–47.
[14] Livaoglu R (2005) Investigation of the earthquake behavior
of elevated tanks considering fluid–structure–soil interactions,
Ph.D. Thesis, Karadeniz Technical University, Trabzon, (in
Turkish).
[15] Panchal VR, Jangid RS (2008) Variable friction pendulum
system for seismic isolation of liquid storage tanks. Nucl Eng Des
238:1304–1315.
[16] Shakib, H. and Omidinasab, F. (2011). “Effect of earthquake
characteristics on seismic performance of RC elevated water tanks
considering fluid level within the vessels”, The Arabian Journal
for Science and Engineering, vol. 36, pp. 227–243.
[17] Gazetas, G., Debchaudhury, A. & Gasparini, D. A. (1982).
Stochastic estimation of the non-linear seismic response of earth
dams. Soil Dyn. Earthq. Eng., Vol. 1, pp. 39-46.
[18] Popescu, R. (2002). Finite element assessment of the effects
of seismic loading rate on soil liquefaction. Can. Geotech. J., Vol.
39, No. 2, pp. 331–344.
[19] Kianoush, M. R., & Ghaemmaghami, A. R. (2011). The
effect of earthquake frequency content on the seismic behavior of
concrete rectangular liquid tanks using the finite element method
incorporating soil–structure interaction.Engineering
structures, 33(7), 2186-2200.
[20] Tufan Cakir (2013). Evaluation of the effect of earthquake
frequency content on seismic behavior of cantilever retaining wall
including soil-structure interaction. Soil Dyn. Earthq. Eng. pp. 96-
111.
[21] Aghajanzadeh, S. M., Mirzabozorg, H., & Ghaemian, M.
(2017). Foundation material nonlinearity in dam-reservoir-massed
foundation coupled problems. Ingegneria sismica, 34(4), 3-29.
[22] Mohammadnezhad, H., Ghaemian, M. and Noorzad, A.,
2019. Seismic analysis of dam-foundation-reservoir system
including the effects of foundation mass and radiation
damping. Earthquake Engineering and Engineering
Vibration, 18(1), pp.203-218.
[23] Sotoudeh, P., Ghaemian, M. and Mohammadnezhad, H.,
2019. Seismic analysis of reservoir-gravity dam-massed layered
foundation system due to vertically propagating earthquake. Soil
Dynamics and Earthquake Engineering, 116, pp.174-184.
[24] ABAQUS/Standard User’s Manual, Version 6.9, Michael
Smith, 2009, Dassault System Simulia Corp.
[25] Hall, J. F. (2006). Problems encountered from the use (or
misuse) of Rayleigh damping. Earthquake engineering &
structural dynamics, 35(5), 525-545.
[ D
OI:
10.
5254
7/nm
ce.4
.4.1
]
[ D
ownl
oade
d fr
om n
mce
.knt
u.ac
.ir o
n 20
22-0
3-16
]
Powered by TCPDF (www.tcpdf.org)
10 / 10