the effect of drought on small-scale livestock producers
TRANSCRIPT
The Effect of Drought on Small-Scale Livestock Producers, Mantsopa Municipality, Free State Province, South Africa
By
Mmankeka Alpheus Mothapo
2004205759
Submitted in partial fulfilment of the requirements for the degree
Master of Disaster Management
In the
Faculty of Natural and Agricultural Sciences Disaster Management Training and Education Centre for Africa (DIMTEC)
At the
UNIVERSITY OF THE FREE STATE
Main Supervisor: Dr. Moeketsi, B. Hlalele Co-supervisor: Dr. Johannes. A. Belle
2020
ii
DECLARATION
I, Mmankeka Alpheus Mothapo, hereby declare that the work contained in this
dissertation is the original product of my own efforts. All sources used or quoted and
discussions carried out have been acknowledged by means of references. This work is
submitted in partial fulfilment of the Master’s degree in Disaster Management, and I also
declare that this work has never been submitted previously in any form or anywhere else
for any degree.
Signature __________________________ Date __________________

iii
ACKNOWLEDGEMENT
I would like to forward special thanks to my study leader, Dr Bernard Moeketsi Hlalele for
his expertise in guiding me through my study period. Big thanks again for his profound
knowledge in quantitative drought analysis and being available to me in terms of providing
everything for encouragement, support, motivation and critiques during the study.
Thanks to my lovely wife, Makgokolotso Gloria Phinithi-Mothapo who gave me support
and courage during difficult times when I struggled with work. My father, Moroamautle,
and my mother, Lehodu Mothapo, who, in my early childhood years, instilled great
academic motivation in me. Special thanks to my big brother, Mogatle Mothapo, who
financially ensured I fulfil my academic dreams from my secondary education to tertiary.
To all respondents in Mantsopa Municipality, Mr Meshack Thembani Xaba (Agricultural
Advisor in Thabaphatshwa), Mr Karel Kallie Van Wyk (my friend who is a farmer in
Thabaphatshwa) and Mr Sehlabaka Lolo Daniel Sebatane (farmer in Hobhouse
Dipelaneng), who assisted me during data collection.
To all my friends, Mamakgowa Paulinah Tshabalala, Mogomotsi Choche, Melwick
Mokanne Sonnet Moswathupa and Chipientsho Koketso Mphahlele, thank you for
inspiring me to work hard and for helping me to source study materials.
I would like to thank God, who gave me the strength to believe in myself and dream
beyond my imagination.

iv
DEDICATION
To my three lovely children, Nakedi, Makgothane and Mautle Mothapo
Special lady in my life,
Gloria Makgokolotso Kgutsu Phinithi-Mothapo
My parents, My father Moroamautle Isaac and Paulina Lehodu Mmaletšema Mothapo
My brothers
Segagauwe Commando, Mogatle Sheleng and Makgothane Mothapo
and my sisters Ntji, Mmakgotlo and Nakedi Mothapo

v
ABSTRACT
Drought is regarded as the greatest and costly natural disasters in the world, causing severe
damage and affecting people more than any other natural disaster. It occurs regularly and harshly
in many regions of several nation-states, often a direct result of the extreme variability in rainfall
frequency. Another factor that prompts drought is the inability of most African soils to hold water
for a longer period. Sub-Saharan Africa (SSA) is one of the driest regions in the developing world,
and it is where drought is at the top of the list of most common natural disasters. The region has
experienced declines in rainfall which have resulted in prolonged drought. Therefore, the study
aimed to look into this matter and obtain a clear understanding of the effects of drought on small-
scale livestock producers in the Mantsopa Municipality, in the Province of the Free State of South
Africa. The main objectives of this study were to determine levels and trends regarding
agricultural-related drought in the area, to determine the major factors that contribute to the
drought in the area, and being able to provide the government and all relevant stakeholders with
the current drought levels. Mann Kendall’s test was used in this study to investigate the level of
drought, using the standardised precipitation index (SPI) as a tool by which to measure
agricultural drought, which was calculated over a three and six-month period. The BBC model of
vulnerability was used and was validated to be useful as one of the major variables of the study,
which was confirmed by the model itself correlating with the other variables. The BBC framework
was used to address variations in vulnerability to drought, based on social, economic and
environmental contexts. The trend pattern in the study area has indicated that there has been a
decrease in rainfall over the years, which implies an increase in drought intensity and severity.
The drought became more severe and intense in the study area, indicated that 2015 and 2016
were the most severe of all drought records from 1981 to 2018.
.KEY WORDS: drought, disaster, severity, precipitation, variables social, economic, environment,
BBC and SPI.

vi
TABLE OF CONTENTS PAGE
DECLARATION …………………………………………………………………………… ii
ACKNOWLEDGEMEN …………………………………………………………………… iii
DEDICATION ……………………………………………………………………………….. iv
ABSTRACT …………………………………………………………………………………. v
TABLE OF CONTENTS ……………………………………………………………………. vi
LIST OF FIGURES …………………………………………………………………………. ix
LIST OF TABLES …………………………………………………………………………… x
LIST OF ACRONYMS AND ABBREVIATIONS ………………………………………… xi
CHAPTER 1: STUDY OVERVIEW ……………………………………………………….. 1
1.1 INTRODUCTION ………………………………………………………………………. 1
1.2. SIGNIFICANCE OF THE STUDY ……………………………………………………. 2
1.3 PROBLEM STATEMENT ……………………………………………………………… 2
1.4 OBJECTIVES OF THE STUDY ………………………………………………………. 3
1.4.1 Main objectives …………………………………………………………………... 3
1.5 DESCRIPTION OF STUDY AREA …………………………………………………… 4
1.5.1. Location ………………………………………………………………………….. 6
1.5.2. Climate …………………………………………………………………………… 6
1.5.3. Topography ……………………………………………………………………… 7
1.5.4. Agro-Ecology ……………………………………………………………………. 7
1.5.5. Land, vegetation, and soil types ……………………………………………….. 8
1.6 CHAPTER OUTLINE …………………………………………………………………... 10
2. CHAPTER 2: LITERATURE REVIEW ………………………………………………… 11
2.1. INTRODUCTION ……………………………………………………………………… 11
2.2. DEFINITION OF TERMS …………………………………………………………….. 11
2.3. GLOBAL VIEW ON AGRICULTURAL DROUGHT ………………………………… 14
2.3.1. Drought in Asia ………………………………………………………………….. 15
2.3.2. Drought in Europe ………………………………………………………………. 16
2.3.3. Drought in America ……………………………………………………………… 17
2.3.4. Drought in Africa ………………………………………………………………… 18
2.4. DROUGHT CAUSES …………………………………………………………………. 19
2.5. DROUGHT EFFECTS ON AGRICULTURE ………………………………………… 21
2.5.1. Social impacts of drought ………………………………………………………. 23

vii
2.5.2 Economic impacts of drought …………………………………………………… 23
2.5.3. Environmental effects of drought ……………………………………………… 24
2.6. DROUGHT EFFECT ON AGRICULTURAL SECTOR IN SOUTH AFRICA ……... 26
2.7. DROUGHT EFFECT ON LIVESTOCK AND CROP ……………………………….. 26
2.8. SUSTAINABLE LIVELIHOOD (SL) FRAMEWORK ……………………………….. 27
2.9. The BBC CONCEPT FRAMEWORK ………………………………………………… 29
2.10. THE EFFECTS OF DROUGHT ON SMALL SCALE PRODUCERS …………… 31
2.11. MITIGATION AND COPING STRATEGY FOR DROUGHT …………………….. 31
2.11.1. Drought response in Kajialo, Kenya …………………………………………. 32
2.11.2. Drought effects in Kenya ……………………………………………………… 35
2.11.3. Coping and adaptation in Bangladesh ………………………………………. 36
2.11.4. Drought coping mechanism in Botswana …………………………………… 39
2.11.5. Drought coping strategy in Namibia …………………………………………. 39
2.11.6. Coping with drought in South Africa …………………………………………. 43
2.12. GENERAL LIVESTOCK FARMING PRACTICES ………………………………… 45
2.13. THE ROLE OF EARLY WARNING SYSTEM (EWS) IN SOUTH AFRICA …….. 45
2.14. DROUGHT PLANNING ……………………………………………………………... 45
2.15. SUMMARY …………………………………………………………………………… 53
CHAPTER 3: RESEARCH METHODOLOGY …………………………………………… 55
3.1. INTRODUCTION ……………………………………………………………………… 55
3.2. RESEARCH AND APPROACH DESIGN …………………………………………… 55
3.2.1. Survey ……………………………………………………………………………. 56
3.3. DATA COLLECTION TECHNIQUE ………………………………………………….. 57
3.3.1. The role of the questionnaire …………………………………………………… 57
3.3.2. Types of questionnaire …………………………………………………………. 57
3.3.3. Structured questionnaire ……………………………………………………….. 58
3.4. DATA ANALYSIS AND PRESENTATION …………………………………………... 58
3.5. DATA RELIABILITY AND VALIDITY ………………………………………………… 60
3.6. POPULATION …………………………………………………………………………. 60
3.7. SUMMARY …………………………………………………………………………….. 61
CHAPTER 4: DATA ANALYSIS …………………………………………………………… 62
4.1. INTRODUCTION ……………………………………………………………………… 62
4.2. PRELIMINARY DATA ANALYSIS …………………………………………………… 62
4.3. DATA ANALYSIS ……………………………………………………………………… 63

viii
4.4. SUMMARY …………………………………………………………………………… 74
CHAPTER 5: CONCLUSION AND RECOMMENDATIONS …………………………. 75
5.1. CONCLUSION ………………………………………………………………………… 75
5.2. RECOMMENDATIONS ………………………………………………………………. 75
LIST OF REFERENCES …………………………………………………………………… 77
APPENDIX A: Questionnaire, Ethical clearance letter, Editor’s letter and study ……...
leader’s letter
89

ix
LIST OF FIGURES
Figure Page
Figure 1.1: Map of South Africa ………………………………………………………… 4
Figure 1.2: Map of the Free State Province ……………………………………………... 5
Figure 1.3: Map for Mantsopa vegetation ……………………………………………….. 9
Figure 2.1: Progression of Drought ………………………………………………………. 14
Figure 2.2: Direct and indirect impact of drought ……………………………………….. 25
Figure 2.3: Sustainable livelihood framework …………………………………………… 28
Figure 2.4: The BBC Conceptual framework ……………………………………………. 30
Figure 2.5: Coping mechanisms practiced by drought victims ………………………... 37
Figure 4.1: Tweespruit precipitation plot ………………………………………………… 62
Figure 4.2: Tweespruit SPI-3 plot (elevation 1654.75 meters) ………………………... 63
Figure 4.3: Agricultural drought (SPI-3) severity graph (1981-2018) ………………… 64
Figure 4.4: Tweespruit SPI-6 plot (elevation 1654.75 meters) ………………………... 67
Figure 4.5: Agricultural drought (SPI-6) severity graph (1981-2018) ………………… 67
Figure 4.6: Confirmatory factor analysis model …………………………………………. 72
x
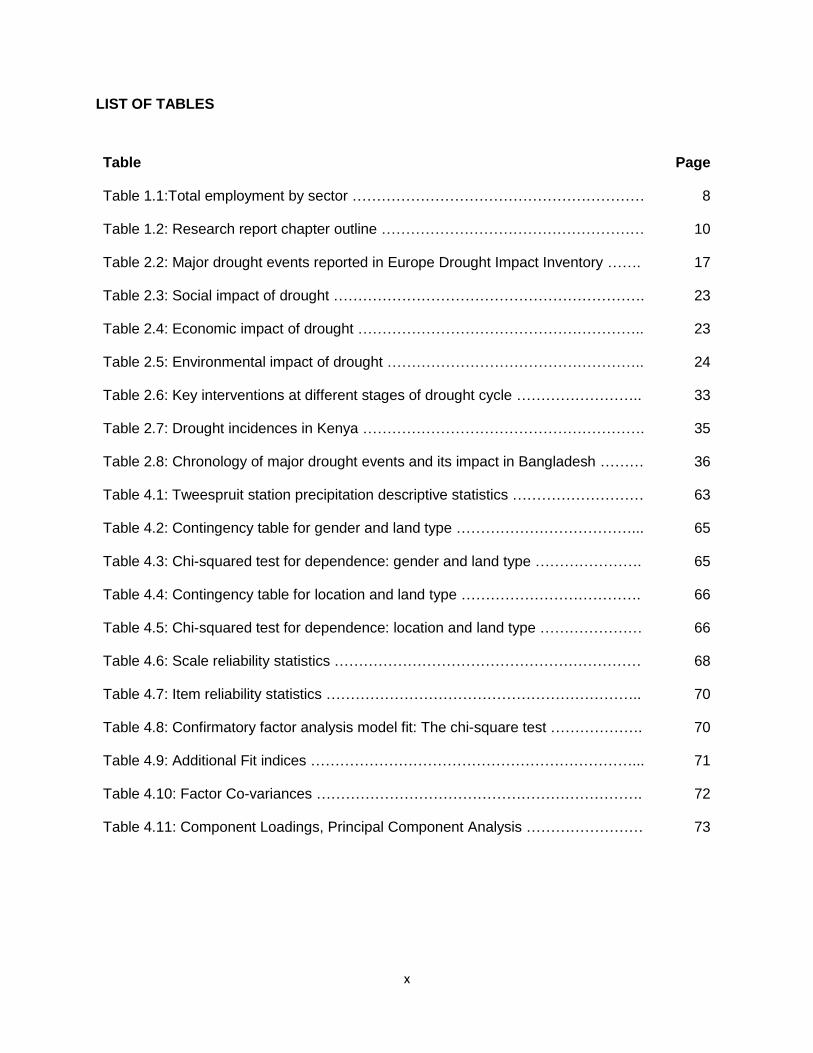
LIST OF TABLES
Table Page
Table 1.1:Total employment by sector …………………………………………………… 8
Table 1.2: Research report chapter outline ……………………………………………… 10
Table 2.2: Major drought events reported in Europe Drought Impact Inventory ……. 17
Table 2.3: Social impact of drought ………………………………………………………. 23
Table 2.4: Economic impact of drought ………………………………………………….. 23
Table 2.5: Environmental impact of drought …………………………………………….. 24
Table 2.6: Key interventions at different stages of drought cycle …………………….. 33
Table 2.7: Drought incidences in Kenya …………………………………………………. 35
Table 2.8: Chronology of major drought events and its impact in Bangladesh ……… 36
Table 4.1: Tweespruit station precipitation descriptive statistics ……………………… 63
Table 4.2: Contingency table for gender and land type ………………………………... 65
Table 4.3: Chi-squared test for dependence: gender and land type …………………. 65
Table 4.4: Contingency table for location and land type ………………………………. 66
Table 4.5: Chi-squared test for dependence: location and land type ………………… 66
Table 4.6: Scale reliability statistics ……………………………………………………… 68
Table 4.7: Item reliability statistics ……………………………………………………….. 70
Table 4.8: Confirmatory factor analysis model fit: The chi-square test ………………. 70
Table 4.9: Additional Fit indices …………………………………………………………... 71
Table 4.10: Factor Co-variances …………………………………………………………. 72
Table 4.11: Component Loadings, Principal Component Analysis …………………… 73

xi
LIST OF ACRONYMS AND ABBREVIATIONS
AFI Additional Fit Index
ANOVA Analysis of Variance
BBC Bogardi Birkman and Cardonia
CASP Comprehensive Agricultural Support Programme
CFI Comparative Fit Index
DMAP Drought Monitoring And Prediction
DMP Drought Management Plan
DRR Disaster Risk Reduction
EDII European Drought Impact-Report Inventory
EEA European Environment Agency
EWS Early Warning System
EU European Union
IDP Integrated Development Plan
IFI Incremental Fit Index
ISDR International Strategy for Disaster Reduction
JASP Jeffery’s Amazing Statistical Program
MDB Municipal Demarcation Board
MF Mixed Farming
NDMC National Drought Mitigation Centre
NDTF National Drought Task Force
NFI Normed Fit Index
NGO Non-Governmental Organisation
NNFI Non-normed Fit Index
PCC Potential Carrying Capacity
PNFI Parsimony Normed Fit Index

xii
RFI Relative Fit Index
RNI Relative Non-centrality Index
SADC Southern African Development Community
SAWS South African Weather Service
SL Sustainable Livelihoods
SPI Standardised Precipitation Index
SSA Sub-Saharan Africa
TLC Tucker Lewis Index
UNCCD United Nations Conventions to Combat Desertification
UNESC United Nations Economic and Social Council
USDA United States Department of Agriculture
WMO World Meteorological Organisation

1
CHAPTER 1: STUDY OVERVIEW
1.1. INTRODUCTION
(Keyantash, 2002) describes drought as the most costly natural disasters in the world, causing
severe damage and affecting more people than any other natural disaster. Regardless of the
definition, drought does occur regularly and harshly in many countries, and it is an outcome of the
precipitation variability in the extensive dry and semi-dry areas of African continent and, among
other factors, drought is prompted by poor water-holding capacity of most African soils. Sub-
Saharan Africa (SSA) is regarded as the driest region in the developing world, where drought tops
the charts of the most common natural disasters (Pelser, 2001). Pelser (2001) further indicated
that the region (SSA) is the first driest land in the world that has experienced a prolonged drought
with a 21% decline in annual rainfall for the past 100 years, and rainfall has become less
predictable.
(Shoroma, 2014) highlighted that the effect of drought is felt when there is a shortage of water,
due to which plants are shrinking and water sources are being depleted, which generally causes
a decrease in livestock forage, but affects mostly small-scale producers. Consequently, drought
leads to food insecurity and a decline in the livelihood of the small scale producers and their
dependants, due to loss of income.
The small-scale livestock producers in Mantsopa Municipality are farming both on commonage
land and on farms that are allocated to farmers through the land reform programme. The
Mantsopa Municipality has five towns, and each has a commonage farm with a high volume of
livestock. Poor farming practices, such as overstocking, create the shortage of grazing for
livestock (Jordaan, Sakulski & Jordaan, 2013). Shortage of infrastructure, such as fences on
commonage land, results in poor or no veld management, under which no grazing camps are
reserved for drier periods. It is a bit unclear what the migration strategies are, that have been
applied by the livestock producers in the Mantsopa Municipality, while the Drought Management
Plan (2005) document indicates that the main concern of drought mitigation is the defence of the
critical resources and structures on which communities depend. This will imply that, for farming
communities to have solid management plans, they will need support in order to lower
vulnerability and risk by receiving support services in terms of development opportunities,
information, education and empowerment (Van Zyl, 2006). Information, as one of mitigation
strategies for farming communities, includes the use of early warning system (EWS). Early
warning system is defined as the set of capacities needed to generate and disseminate timely

2
and meaningful warning information, so as to enable individuals, communities and organisations
threatened by a hazard to prepare and to act appropriately, and in sufficient time, in order to
reduce the possibility of harm or loss (ISDR, 2005).
The information should be available in such a way that users or recipients will understand it.
Scholtz et al., (2016), as well as Ngaka (2012) agree that the reduction of livestock is the key to
reducing the potential impact of drought. Scholtz et al., (2016) acknowledges that the suggestion
of reducing the livestock numbers, as a mitigation strategy, is easier for both level of farming
categories, but could be difficult for livestock owners in communal land. The decision to reduce
livestock numbers involves the consent and commitment of many owners who might not easily
agree to the idea.
1.2 . SIGNIFICANCE OF THE STUDY
This study intended to assist the agricultural extension practitioners to work and plan with farmers,
so as to manage drought by planning ahead. The study will assist farmers by motivating and
directing them to plant fodder during rainy seasons, and to preserve it, so that they might
supplement their livestock during dry periods. Another aim of this study is to help farmers to
adhere to good farming practices by conserving natural resources, such as grazing, so as to avoid
soil erosion due to poor growth of the vegetation that helps to keep the soil integrity in check. The
farming community in the study area will also gain understanding of the importance of keeping
the correct stocking rate and reducing the number of animals kept, if warning has been issued
regarding future drought periods.
1.3 PROBLEM STATEMENT
Most households in Mantsopa Municipality rely on rain-irrigated farming as their basis of food and
income, as the majority of the people living there work on the local farms. The agricultural sector
has an essential part to stabilize the communities. As outlined in the drought management plan
(DMP, 2005), when there is drought, the communities’ livelihood declines and it negatively affects
their investments in agriculture.
The majority of small-scale livestock producers in Mantsopa local municipality are presently
farming on commonage land, and good farming practices are required for good results. Small-
scale farmers play an important role in the production of food in most African states, but are

3
restricted by lack of access to land (Mothae, 2017). Small scale farmers in the study area are not
exceptional, as they share the same problems of overstocking and overgrazing. Jordan, Bahta &
Phatudi-Mphahlele (2019), describe overgrazing as the lack of natural pastures for livestock to
meet requirements for growth and production of an animal. Overgrazing is basically the result of
overstocking while grazing is not well controlled. High stocking rate is common farming practice
in most communal lands of South Africa and developing countries, originating from limited access
to land (Jordan, 2013). Communal producers are grazing in the veld as the source of feed for their
animals, which is cheap and freely available (Molefi & Mbajiorgu, 2017). The grazing veld
deteriorates if overgrazed, and communal farmers experience a shortage of grazing as drought,
with the expectation of drought relief from the government.
Reducing the number of animals kept will help farmers to manage the correct stocking rate as a
drought mitigation strategy in the study area (Scholtz et al., 2016). It is a simple proposal to apply
to both small holders and privately owned farms, but difficult to implement on communal farms,
due to the ownership of different livestock.
The willingness of farmers to purchase their own fodder or supplements helps farmers to cope
with drought (Ngaka, 2012). The farmers in the study area, with reference to communal and small
holders, rely on the government for drought relief because the South African government helps
farmers to cope with drought by way of the Comprehensive Agricultural Support Programme
(CASP) (Ntombela et al., 2017).
1.4. OBJECTIVES OF THE STUDY
The main objectives of the study is: a.) to determine how drought is affecting the famers in
Mantsopa area and b.) to determine how farmers are coping, based on their farming practices.
The study will also help to gain understanding concerning whether or not farmers are able to
reduce the impact of drought and continue with their activities. Another aim of the study is to
determine the effect of drought on small scale livestock producers who are beneficiaries of the
land reform program, and commonage farmers in Mantsopa Municipality.
1.4.1 Main Objectives
To determine levels and trends in agricultural drought in the study area.
To validate the BBC model use in the study area.

4
To determine the major factors contributing to drought in the study area.
To provide government and all relevant stakeholders with the current drought levels,
trends and major contributing factors for mitigation and/or adaptation measures.
1.5 DESCRIPTION OF STUDY AREA
Below is a map showing the position of the Free State Province on the map of South Africa:
Figure 1.1: Map of the Republic of South Africa Indicating the position of the Free State
Province
Source: https://www.sa-venues.com/maps/south-africa-provinces.htm
5
South Africa is divided into nine (9) provinces, as shown in Figure 1.1 above. The study was
conducted in one of the provinces, namely the Free State. The Free State is further discussed in
the map below.
Province of the Free State is situated in the central region of the Republic of South Africa and is
bordered by six provinces. The only two provinces that are not sharing borders with the province
are the Limpopo and Western Cape provinces, as indicated by the arrows on the map. The
province is shares boundaries with the Kingdom of Lesotho. Province of the Free State is the 3rd
largest province in South Africa in terms of land area, as it covers approximately 129 825 km2 -
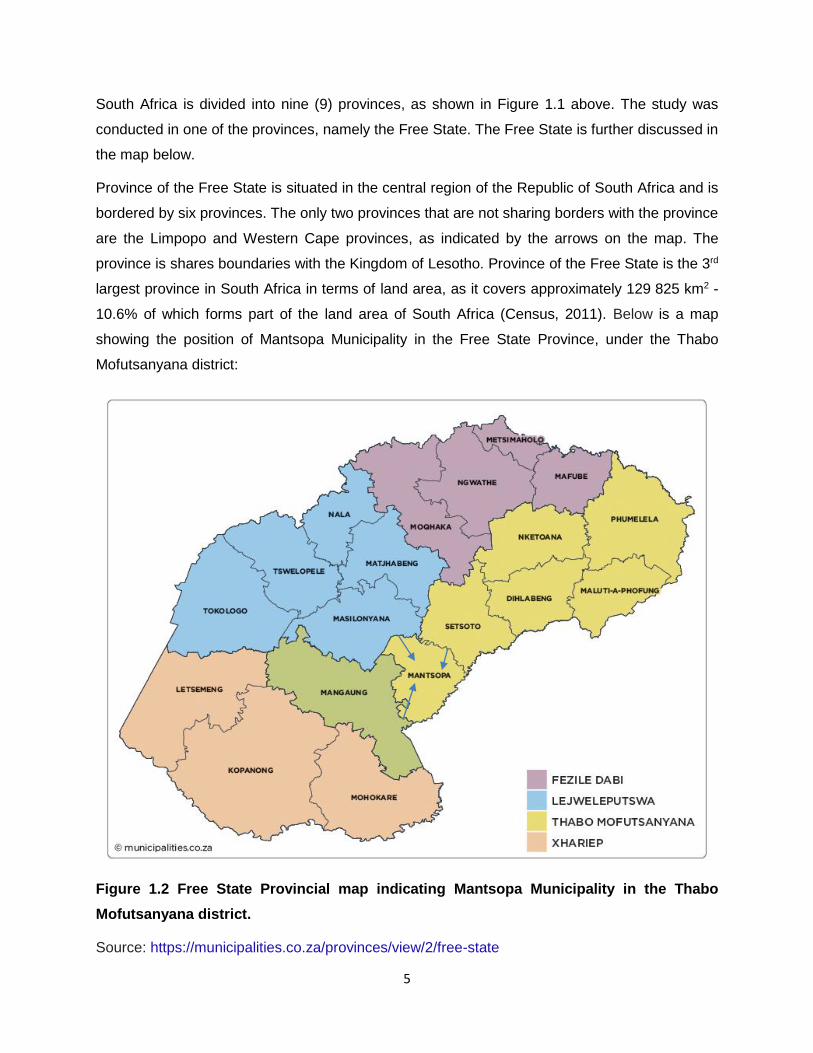
10.6% of which forms part of the land area of South Africa (Census, 2011). Below is a map
showing the position of Mantsopa Municipality in the Free State Province, under the Thabo
Mofutsanyana district:
Figure 1.2 Free State Provincial map indicating Mantsopa Municipality in the Thabo
Mofutsanyana district.
Source: https://municipalities.co.za/provinces/view/2/free-state
6
The Free State province, as indicated in Figure 1.2 above, is subdivided into four district council
municipalities and one metro municipality, which are as follows: (i) Fezile Dabi district municipality
(ii) Lejweleputswa district municipality (iii) Thabo Mofutsanyana district municipality (iv) Xhariep
district municipality and (v) Mangaung metropolitan municipality.
The study was conducted in Thabo Mofutsanayana district, which is divided into six (6) local
municipalities, namely Mantsopa, Setsoto, Nketoana, Phumelela, Dihlabeng and Maluti a
Phofung, as indicated in Figure 1.2 above. However, the study was conducted in the Mantsopa
local municipality. Mantsopa Municipality was selected as a study area, because the study itself
is geared to determine the effect of drought and current farming practices to recommend
mitigation strategies to small-scale livestock farmers in the local municipality.
1.5.1. Location
The study was conducted in Mantsopa Municipality. The municipality is located in Thabo
Mofutsanyane District in the Eastern Free State province of the Republic of South Africa. The
municipality consists of five small towns, namely Excelsior, Ladybrand, Tweespruit, Thaba
Phatshwa and Hobhouse. The Mantsopa Municipality covers 4290 square kilometres. Statistics
SA’s census of 2011 reported that the population is 51056. The Mantsopa Municipality is
characterised by farming activities, both in terms of livestock and cash crop production. It is
bordering the kingdom of Lesotho, with Masilonyana municipality in the North, and Mangaung
metropolitan municipality in the West.
1.5.2. Climate
The area receives approximately 600 to 750mm of rain annually in the summer, but only under
normal climatic conditions and, in recent years, the amount of rainfall received seems to be
dropping significantly. The average midday temperatures range from 15.3oC in June to 28.6oC in
January. The area is coldest in July, because the mercury can drop to -4oC on average especially
at night. Temperatures range from a maximum of approximately 35oC during mid-summer to
minimum of -4oC. The mean temperatures range from 15 to 30oC during the summers and drop
to between 0 and -15oC in winter. The area experiences frost, especially in the higher lying areas.
7
1.5.3. Topography
The eastern Free State has deep, mountainous slopes (Brand, Brown & Du Preez, 2011). It is
characterised by mixed farming (MF) enterprises, which stimulate biodiversity in comparison to
specialised types of farming approaches (Losada, Gilland, Franco, Bernues, 2016). More cash
crops, such as maize, sunflower, wheat and sugar beans are produced in the eastern and north-
eastern area, with cattle and/or sheep as a secondary enterprise, and also soya bean production,
which is quickly overtaking maize production (Beukes, 2016). The production of soya beans in
hectares has increased from 8% to 20% between the years 2006 and 2016. Arable soils are of
moderate (medium) potential, and the soil texture is largely loamy, which makes it more
favourable for the production of crops because it facilitates rapid water permeation (Hensley et
al). The southern area is more inclined to the raising of cattle and/or sheep with very little or no
cultivation potential for crop production, especially on commonage land (Atikson & Buscher,
2006). The southern part of the province is actually drier and, as a result, sheep production is
doing very well, compared to the cultivation of crops (Free State Provincial Spatial Development
Framework, 2013).
1.5.4. Agro - Ecology
Mantsopa Local Municipality is predominantly rural in nature (Marais, Human & Botes, 2008). As
a rural local municipality, primary production forms the bulk of the local economic activities as
follows: Agriculture, hunting and forestry makes up 30% of employment, followed by social
development at 16%, household employment at 16%, and so on, as indicated in the table by the
Municipal Demarcation Board (2019) below in Table 1.1. Agriculture in the Free State province
plays an important role, as it contributes meaningfully to the economy of the country, and it forms
approximately 30% of the national maize production (Moeletsi & Walker, 2012). The study area
produces livestock, among other agricultural products. The production of livestock is influenced
by various factors, such as the external environment, which has a direct influence on production
by way of its effect on the physiology of animals, or indirectly on the production of feed sources,
which is natural grazing (Webb, Visagie, Van der Westhuissen & Snyman, 2017).
Below is a table indicating total employment by sector in percentage:

8
Table 1.1. Percentage total employment by sector
Source: (MBD,2018)
1.5.5. Land, vegetation and soil types
The study area consists of clay soil and grassland. The species of grass that dominate the area
include Cymbopogon pospischilii, Themeda triandra and Elionurus muticus. The degradation of
rangeland, due to overgrazing, is leading to the poor cover of the soil by perennial grasses
(Paterson, Smith & Van Greunen, 2013). Paterson et al. further emphasises that vegetation in
most commonage farms in rural Free State towns are in very poor condition, due to overstocking
and poor management practices. Land in the province of the Free State is mainly utilised for
farming purposes (Hensley, Le Roux, Du Preez, Van Huyssteen, Kotze & Van Rensburg, 2006).
Below is a vegetation map for Mantsopa municipality:

9
Figure 1.3. Mantsopa vegetation map
Source: Mantsopa draft IDP: 20178-2022.

10
1.6 CHAPTER OUTLINE
The table below illustrates the research report chapter outline for the study.
Table 1.2: Research report chapter outline
CHAPTER CHAPTER TITLE CHAPTER CONTENT OVERVIEW
1 Study overview The chapter provides a background of the study, which
includes the following: introduction, the significance of the
study, problem statement, objectives of the study, description
of the study area with regards to location, climate,
topography, ecology, land, vegetation, and soil types.
2 Literature review The chapter provides the following: introduction, definition of
terms, global views on agricultural drought, drought causes,
the effects of drought globally and the response, effect of
drought on agricultural production, effect of drought on
livestock and crop, the effect of drought on small scale
producers, mitigation and coping strategies for drought.
3 Research
methodology
The chapter provides the following: introduction, research
approach and design, data collection technique, data analysis
and presentation, data reliability and validity, population,
ethical consideration and chapter summary.
4 Data analysis The chapter provides introduction, preliminary data analysis,
data analysis and chapter summary.
5 Conclusion and
recommendations
The chapter provides a conclusion and recommendations.

11
CHAPTER 2: LITERATURE REVIEW
2.1. INTRODUCTION
The study was geared to determine the effect of drought, to determine levels of and trends in
agricultural drought in the study area, to validate the BBC model and to determine the major
factors contributing to drought in the study area. This section deals with literature from various
sources. The aim is to guide the study, not to compete with the available literature, but rather to
enhance the arguments based on the content of this study. The chapter deals with different of
types of drought that are named and defined in detail, how drought is viewed globally by various
continents, and the possible causes of drought and the level at which it impacts economically,
socially and environmentally. The aforementioned impacts refer to the different levels of
agricultural production, from small-scale farmers to commercial farmers, and how they both cope
with and mitigate drought.
2.2 DEFINITION OF TERMS
Drought definition
Drought is described as a normal part of climate (ISDR, 2005). These extreme climatic events
are, time and again, described as a common hazard. The situation is a disaster which is not easy
to evade, as it creeps in silently over weeks and months, sometimes without any precursors
(Sheffield & Wood, 2011). Sheffield et al. (2011) emphasises that drought does not trigger
emergencies in the same way that other disasters, such as floods, tornadoes and hurricanes do.
It only triggers an emergency response once it has impacted on the livelihood of the people and
their level of vulnerability due to crop failure and loss of livestock. Drought occurs non-selectively,
everywhere, in all climatic zones, from one region to another, and its effects are more visible in
low rainfall regions (ISDR, 2009). Drought is one of the main natural hazards that negatively affect
the lives of the people and socio-economic amongst the communities (ISDR, 2009). Disasters
that originate from extended drought contribute on a massive scale to the starvation of millions of
people, especially in African States. Drought is a periodic phenomenon that has over the years
delayed development and continue to affects various ecosystems, natural habitats and other
several social and economic sectors such as agriculture (Richard & Heim, 2002).

12
Drought is defined based on four classifications by various disciplinary viewpoints (Wilhite &
Glantz, 1985) which are as follows: (i) meteorological drought (ii) agricultural drought (iii)
hydrological drought and (iv) socio-economic drought.
Meteorological drought
The definitions for meteorological drought are the most predominant as, in most cases, they
describe drought exclusively based on the level of dryness and its duration. Sheffield et al. define
meteorological drought as significant negative deviation from mean precipitation. (Wilhite, 2010).
Basically, entirely kinds of drought initiated as the results of rainfall shortage (Wilhite, 2005).
Wilhite (2005) further argues that the deficiency of rainfall is described as meteorological drought
when it lengthens the duration thereof. Mondol, Das & Islam (2016), also agree that drought is
largely described as meteorological when it extends its stay for a longer period of time, compared
to the average and normal situation. Drought that is characterised by extreme climatic
temperatures causes serious damage in the agricultural sector.
The precipitation difference openly guage of rainfall, and is the difference amongst the
observation and the long-term climatological mean (Keyantash, 2002). Meteorological drought
differs from region to region because of the situation in the atmosphere bring about the shortage
of rain in each particular region (Olayele, 2010).
Hydrological drought Olayele (2010) and Sheffield et al. (2005) concur that drought resulting from hydrological displays
the sound effects and influences of drought; it generally articulates a lack of surface and
subsurface water. Mutekwa (2016) defines hydrological drought as the decrease in the amount
of water resources, namely land, underground, lakes and reservoirs. Wihite (2005) expresses that
it is difficult to create a relationship between the amount of precipitation and hydrological systems,
which include: lakes, aquifers, reservoirs and streams, as they remain utilised for several as well
as competing purpose such as irrigation for farm production, recreation, tourism attraction,
generation of electricity, supply of domestic water, and so on.
Hydrological drought is linked to a shortage of rainfall on a much longer scale, and deprived supply
of water on surface and sub surface equally. Hydrological drought guides are mainly established
on stream flow (Richard et al., 2002).

13
Agricultural drought
(Sheffield et al, 2005) Define agricultural or soil drought as shortage in soil moisture which is
facilitated by hydrological and meteorological drought, lowering the supply of moisture for
vegetation. (Olayele, 2010) Agricultural drought speak of a circumstances whereby an overall
quantity of rainwater on earth fail to satisfy the requirements of a certain plant, which guage
drought as a physical phenomenon. It is realised when there is no enough humidity in the soil to
assist the growth of crops and production in the area (Shoroma, 2014). Keyantash (2002)
mentions that farming related type of drought is concerned with both cultivated crops and natural
vegetation. Characterised by short-term changes in the amount of soil moisture. There is a strong
bond that occurs amongst the production of crop and water strain and, as a result, crop production
is regarded as a dependable gauge for agricultural drought. Crop production response to water
stress is used as an indicator for the presence of drought, based on the expected production for
a given year.
Mutekwa (2016) states that agricultural drought alone cannot be associated with dry spells or low
rainfall, but can still be felt in terms of the average rainfall. The soil conditions and agricultural
farming practices, together with the topography, play a vital role in water infiltration to achieve
good harvest (Wilhite, 2005). Infiltration of precipitation into soil is not directly related to
precipitation and infiltration. The infiltration rates of water into the soil differ according to the
conditions of preceding moisture. Soils also differ in terms of their features; certain soils have a
great capacity for water retention, and others have a low capacity for water retention. The logic is
that soils with low capacities for water retention are prone to drought, as opposed to soils with
high water-retention capacities.
Socio-economic drought This form of drought comes into existence as soon as economic activities that are complementary
to other elements fail to meet the population needs or demands (Shoroma, 2014). Socio-
economic drought exists when water needs is more than the amount of available water over a
period of time (Mniki, 2009). Sheffield et al. and Wilhite (2010) agree that it is a combination of all
types of drought, namely meteorological, hydrological and agricultural droughts, as they result in
unwanted and socio-economic impact.
Figure 2.1 below indicates the progression of drought from one type to another, and the inter-
relationship between meteorological, agricultural, and hydrological drought, resulting in socio-
economic drought.

14
Figure 2.1. Progression of Drought: National Drought Mitigation Centre (NDMC)
Source: https://drought.unl.edu/Education/DroughtIn-depth/TypesofDrought.aspx
2.3. GLOBAL VIEW ON AGRICULTURAL DROUGHT
Agricultural production is negatively affected by drought, which results in the increase of food
prices and intensifies poverty in vulnerable communities (Mohammed & Dlamini, 2018).
Mohammed et al. (2018) maintain that the region of sub-Saharan Africa is experiencing more
climate change with repeated hazards, such as droughts that are facilitated by El Nino. (Makhado,
Saidi & Tshikhudo, 2014) also agree that the Southern region of Africa is used to extreme weather
conditions and, as a result, it is perpetually expected that drought will always occur somewhere
in the region. Many families in the Republic of South Africa bank on farming business as their key
basis of income, and drought and extremely hot temperatures are constraints in most agricultural
15
areas (El Chami & El Moujabber, 2016). Climate change has a negative impact on agricultural
development (Ndhlovu & Mpofu, 2016).
2.3.1. Drought in Asia
Mutekwa (2016) states that China is experiencing the occurrence of various natural hazards
annually that result in huge economic losses, and drought is reported to be the primary natural
hazard experienced in that country. China has, over the years, experienced different and
unpredictable events in terms of rainfall that resulted in continuous floods and droughts, except
for drought that had lingered for a long period in years, resulting in severe losses in the agriculture
of the country (Zhang, 2005). The prolonged drought of the years 2009 and 2010 had affected
the majority of the provinces in the northern and south western parts of China, with the northern
part playing key role in the production of grain, the south western zone playing a key role as the
main source of water that supplies most parts of the country (Barriopedro, Gouvela, Trigo & Wang,
2012). It is reported that Bangladesh is exposed to drought every year that lasts for the period of
six to seven months, which is around November to May, due to the scarcity of rain fall (Miyan,
2014).
The majority of people in most parts of South Asia, such as Pakistan and Rajasthan, are living
with drought and under severely dry conditions (Islam, Sultan & Afroz, 2014). The agricultural
arable land of India that makes up to two-thirds of the country, as reported by Islam et al., depends
on rainfall for production, and is declining in production due to climate change, and they are faced
with drought and continuous dryness. The dryness, as lack of rainfall, results in economic losses
and the decline in the livelihoods of the people. In India, almost 77% of its area is exposed to
frequent drought, and this results in land degradation (Khem & Nagaratna, 2017). In the arid and
semi-arid regions of India, there are frequent events of drought that are experienced every 3 to 4
years, which lead to reduced income, increased levels of employment, and the intensifying of
malnutrition due to low food production rates (Kumur & Hirway, 2007).
Regions vulnerable to drought constitute almost 77 percent of the whole land area in India and
accordingly, they are further liable to land degradation as well as repeated droughts.
Deforestation and poor water management in Yunnan province of China has resulted in severe
drought (Zhang & Zhou, 2015). The continuous over use of scarce resource such as water result
in aggravation and prolong of drought events (Miyan, 2014). Miyan (2014) further reported that
shortage of water could lead to reduction in the production of grain up to approximately 30% and
drought also causes the restrictions in exports resulting in price increases of the stable food.

16
2.3.2. Drought in Europe
Drought refers to short-term decreases in the availability of water, and it occurs when there is
shortage of rainfall for a long period of time. The shortage of water, on the other hand, is when
the requirement is greater than the supply (European Commission, 2010). The main droughts in
Europe were experienced in the years 2002, 2003, 2005 and 2007, which lasted to 2008
(Mutekwa, 2016).
The European Commission reported that, since 1980, Europe has experienced an increased
number of droughts, and the drought situation has worsened, with the costs estimated at €100
billion for the period of more than 30 years. The worst ever drought happened in 2003, during
which one third of the areas hit by drought rose by 20% and the annual average costs have
quadrupled (European Commission, 2010)
Drought being defined by its physical characteristics, such as meteorological drought or
hydrological drought, even by its effects, which is socio-economic drought, always has a negative
impact. The impacts are either directly through poor crop growth and production or loss of
livestock, or indirectly through the increase of food prices due to poor production rates (Blauhut,
et al., 2016). According to FAO (2018), the prolonged drought period in most states of the
European Union (EU) is negatively affecting production crops on arable land and animal fodder,
which increases the costs for which producers or farmers are liable, with minimal or no profit. The
European Union has reported over 4800 different drought impact entries that are identified
through European Drought Impact-Report Inventory (EDII), across various impact categories that
include everything from agriculture to water quality, as well as financial losses, and the estimate
is over EUR 100 billion (Blauhut, et al., 2016). Reported cases of drought from various regions of
Europe indicate that the agricultural impact of this natural disaster type tops the charts, which is
the reason for the researchers using crop failure and loss in production to determine drought
impact more than other types of drought (Stahl, et al., 2016). Continued dry spells result in
declined agricultural production, which leads to economic loss (Trnka, et al., 2016). According to
the Europe Environmental Agency (EEA, 2009), irrigation plays a vital role in increasing the
agricultural production, but it can also impact negatively, as it contributes to the shortage of water,
although some water is returned to underground deposits through the percolation process.

17
Table 2.2 below indicates major drought events that are reported in the EDII:
Year Location Approximate Duration
1959 Northern Europe 05/1959 – 02/1960
1972 Northern/ Eastern Europe 12/1971 – 07/1972
1973 Central Europe 01/1973 – 07/1973
1975-1976 Europe 11/1975 – 02/1977
1989-1990 Mediterranean 02/1989 – 10/1990
1991 – 1995 Mediterranean 02/1992 – 10/1994
1996-1997 Northern Europe 04/1995 – 07/1996
2000 East /South East Europe 01/2001 – 03/2001
2003 Europe 04/2003 – 11/2003
2004-2007 Iberian Peninsula 07/2004 – 06/2007
2007 Eastern Europe 02/2007 - 08/2007
Source: Mutekwa (2016)
2.3.3. Drought in America
The probability of prolonged periods of severe drought, which are the same as the conditions that
were experienced in previous centuries, and their effects on the 21st century, are coercing the US
congress to raise many issues (Folger, Cody & Carter, 2013). Folger (2013) further highlighted
that the issues concerned include, in particular, how to respond to the recurring occasions of
drought, how future instances of drought could be prepared for because drought, in many cases,
results in agricultural losses that lead to negative local, regional, and national effects. Most
portions of Northern America have been affected by drought throughout history (Folger, 2017). It
has been reported by the United States Department of Agriculture (USDA, 2017) that:
Drought results in poor plant growth rates, higher stress in plants and more susceptibility
to pestilence and diseases.
Prolonged drought leads to loss in plant cover, changes in plant composition and intensify
the dominance of invasive species.
Loss of forage and water for herbivores, both wild and domestic
Drought causes the decrease in the stream flows and increase stream temperatures with
the results of destroying aquatic dependent species.
Drought lowers the quality of water and quantity for agricultural and other uses by human
and
Extended drought accompanied by dry conditions yield more fire intensity

18
The northwestern region of the USA has, in the past, experienced persistent droughts which are
regarded as customary to climate change (Cook et al., 2016). Some examples of this kind of
drought event were experienced in the southwestern part of California which has emphasised the
vulnerability of the community and the ecosystem in which it was difficult to predict the availability
of water to the people in the region. Cooley et al. (2015) reported California as being one of the
most productive states with regard to agriculture in the region, being able to supply both the US
as well as global markets with over 400 dissimilar agricultural produces. The state is characterised
by having the greatest variable climate in the United States, as it is prone to extreme hydrological
events, including multiyear droughts. The harshness of drought is realised when there is a rise in
the demand for water for human use in the areas where supply is low (Folger & Cody, 2014). The
shock of drought is affecting both livestock and crop production, which lead to culling of livestock
as a result of decrease in pastures and rise in feed costs. (Leister, et al., 2015)
2.3.4. Drought in Africa
Sustainable development on the African continent is faced with major threats and serious
challenges, all resulting from drought and desertification. The challenges have negative
influences on the health of human being, economic growth activiries, food security, physical
strength, environment and natural resources. (UNESC, 2007). North African countries, namely
Mauritania, Morocco, Algeria, Tunisia and Libya, experience drought regularly and as part of daily
life, resulting from the Mediterranean climate on the coast, where the majority of the people live
(FAO, 2018). As reported by FAO (2018), these countries are experiencing rainfall along the
coast, as is the norm with Mediterranean climates, but their southern parts are faced with the
severely arid conditions of the Sahara desert. Desertification, in an agricultural context, is the
result of overstocking the dry land through overgrazing, while exceeding the potential carrying
capacity (PCC) of grazing veld (Jamala et al., 2013). It is reported by the United Nations
Conventions to Combat Desertification (UNCCD) that over-cultivation of land also results in
desertification, as it causes the degradation of land by depleting the nutrients in the soil which
have an impact on production potential and crop yields, which, in turn, leads to reduced income
(UNCCD, 2013).
Drought is a natural hazard, and is a recurring feature in the Southern African climate (Baudoin,
2017). Sub-saharan Africa is believed to be vulnerable to drought with South Africa included and
is a serious concern with regard to economic loses (Muyambo, Jordaan & Bahta, 2017). Masih et
19
al. (2014), concur that drought is leading the charts as being the most prevalent type of disaster,
as it causes serious damage to humanity, the environment and the economy. In South Africa,
livestock production is making a huge contribution to the total agricultural domestic product,
amounting to 48% of agricultural output (Barbara et al., 2018). Barbara (2018) further highlighted
that the sector alone supports 500 000 jobs, whereby milk farmers employ almost 60 000 farm
workers and indirectly create 40 000 employment within milk processing value chains. According
to the Agri SA report (2016), the agricultural sector is the main source of employment, particularly
in the rural areas, and the persisting drought leaves farmers with no choice but to cut jobs.
Masih et al. (2014) reported that there are studies that are centred on influential records indicating
that drought has turned out to be more regular, more powerful as well as wider-spread in the
previous 50 years. The extreme droughts of 1972 to 1973, 1983 to 1984 and 1991 to 1992 were
continental in nature, and remain unique in the existing records. In addition, there were many
more severe and prolonged droughts that were recorded in recently, from 1999 to 2002 in north-
western Africa, in 1970 and 1980 in western Africa (Sahel), in 2010 and 2011 in eastern Africa,
popularly known as the horn of Africa, as well as the 2001 to 2003 drought in southern and south
eastern Africa, to name but a few. According to Masih (2014), the existing but inadequate proof
preceding the 20th century reaffirms the incidence of numerous extreme and multi-year droughts
during every century, with the most extended and intense droughts being the ones that took place
in Sahel and equatorial eastern Africa.
2.4. DROUGHT CAUSES
Drought is a natural hazard that occurs on its own, but climate change has the ability to facilitate
the occurrence of hydrological processes faster and even more severely, resulting in many
catastrophic incidents, such as wildfires (Mukherjee, et al., 2018). Higher temperatures in the
summer have the ability to cause more water to evaporate and, if the affected area does not
receive rain to compensate for the water loss, then drought is imminent. Climate change is
facilitated by the burning of fossil fuels, increases in pollution and increases in temperature
(Sonawane, 2016).
Drought is caused by a low level of precipitation and an increased rate of evaporation, particularly
in the regions where climates are cold, temperatures drop to below zero degrees Celsius and
promote winter drought (Van Lanen, Undated). Rainfall failure is the major reason for drought in
many countries. The low or poor flow of rivers is the result of a lack of rainfall (Sonawane, 2016).
20
South Africa’s neighbouring countries, Zimbabwe and Mozambique, have tasted the erratic
weather that has ranged from drought in late 2018 to the cyclone in earlier months of 2019, both
of which had negative impacts on crops (Sihlobo, 2018).
The Atmosphere serves as the blanket of air that surrounds the earth, the horizontal and vertical
movement of air results in variations of weather and climate. Energy is absorbed by means of the
sun, while various chemicals and water are recycled also work in conjunction with magnetic and
electrical forces that moderate the climate. Atmosphere similarly serves to protect the earth
against high level of energy radiation (Ramamasy & Baas, 2007).
Inconsistency in climate is refering to the climatic factors of a section changing from its long-
term mean. Year after year, in a particular time period, the climate of a place does not remain the
same. In certain years, a location might receive below-average rainfall, while in other years, the
same location might receive average or above-average rainfall. The changes are the results of
atmospheric pressure and circulation in the ocean, facilitated using the degree of difference
heating of the earth by the sun. The ocean and atmosphere flow in three dimensions, whereby
they act on each other. The movement of the atmosphere is quicker than the movement of the
ocean however, the ocean serves as a storage unit for huge amounts of heat that is slowly being
released over an extended period. These processes of the atmosphere and ocean, according to
Ramamasy and Baas (2007), are the roots of the climate vary from term to term.
The enhanced greenhouse effect is considered to be caused by the activities of human being
that have resulted in rising of atmospheric concentrations of greenhouse gases. The atmospheric
concentrations of the main greenhouse gases are comprised of carbon dioxide (CO2), Methane
(CH4), Nitrous Oxide (N2O) and Ozone (O3). During the 1990s, these gases were recorded to
have reached their highest known levels, and according to Ramamasy et al. (2007), this is a result
of the combustion of fossil fuels, agricultural activities, as well as changes in land use.
Sonowane (2018) explains the causes of drought as follows:
Change in local landscape: Vegetation changes, deforestation and drainage result in changes
in landscape that lead to drought. These factors reduce water holding capacity and the process
result in drought.
Hydrological drought: Rises in temperature result in evaporation, and the process leads to
depletion of water in the reservoirs.
21
Meteorological drought: Drought is facilitated due to the shortage of rainfall and absence of
rainfall. Meteorological drought is also facilitated and caused by persistent anomalies (high
pressure) in large-scale atmospheric circulation patterns, which are frequently activated by
abnormal tropical sea surface temperatures (SST) or other remote conditions.
Agricultural drought: This is the result of insufficient precipitation, high levels of
evapotranspiration and lowered water tables which pose serious threats to agriculture and its
related industries. Human activities facilitate drought by way of destructive agricultural activities,
such as overstocking, which results in overgrazing and poorly managed irrigation.
Inadequate agriculture practices: The application of rainwater harvesting techniques are very
important and essential to prevent drought, but in many regions, they are not practiced and again,
the result is drought. To add to this, human activities fast track drought by way of poor land-use
practices, an example of which is deforestation. The African people, due to population pressure,
have abandoned farming practices like nomadic pastoralism, which was the system for coping
and controlling practices which contributed to the causation of drought.
2.5. DROUGHT EFFECTS ON AGRICULTURAL PRODUCTION
Drought evaluation is centred on its frequency of occurrence, severity, area affected, damages to
the economy, environmental and social effects, and also severe long-term impacts. It is regarded
as an important and most dangerous phenomenon, compared to other disasters (Golmohammadi,
2012). Golmohammadi (2012) further moves to say that drought is a world-wide problem and can
occur anywhere, resulting in severe harmful impacts on human beings and the natural ecosystem.
The effects of drought differ in terms of coping capabilities, for an example, people who are living
in the regions where irrigation systems are far more advanced, such as those communities in
developed countries that can mitigate the impact of drought far more effectively than farmers in
African states (Dai, undated). Dai further reports that these countries often have limited or no tools
of any sort by which to combat drought and other natural disasters.
The emergence of drought is not easy to detect when compared to other natural hazards, due to
the unique characteristic of its slow onset (Wu & Wilhite, 2003). Wu and Wilhite (2003) further
added that it is not so simple to gauge the impact of drought in different segments, simply for the
reason being that the impact might be from segment to another at different geographical
arrangement levels, and also indicated that drought could remain for a long time, which could be
the period of one year or more, or even shorter periods of several weeks. The authors further

22
highlighted that if a short term drought were to occur during the critical growth stages of crops, it
would have impact severely on agriculture.
In most African states, where the availability of water is limited and people rely on rain-irrigated
agriculture, and drought has repeatedly resulted in crop failure, shortage of food and humanitarian
crises (Winkler et al., 2017). The severe ongoing drought results in major declines in harvest, and
water restrictions are being implemented in many communities as it happened in South Africa’s
major cities, like Cape Town and Johannesburg in 2007 (Baudoin et al., 2017). Baudion, et al.,
(2017) further indicated that the Republic of South Africa normally exports tons of food to its
neighbouring countries, such as Lesotho, Zimbabwe and Botswana, but the drought that was felt
in 2016 had turned the country into a net importer of grain. The agricultural sector, with inclusion
of livestock production, forestry, as well as fisheries, is mostly vulnerable to drought with grave
effects on the supply of food as well as means of support for the respective communities,
especially small-scale farmers and poor rural societies (FAO, 2018). Reported by FAO, agriculture
is regarded as the most affected sector when drought occurs, and the most heavily impacted of
all economic sectors, as people could lose their jobs and suffer a decline in their livelihood.
Baudoin (2017) states that it results in the reduced availability of stable foods on the market, such
as cereals, and the hike in prices that lead to food insecurity in societies.
According to (Wu et al., 2009 cited in Mutekwa, 2016) “Straight effects are characterized by way
of quickness as well as refer to direct physical loss triggered by natural disasters on production
features and products. Indirect effects are derivatives of direct effects and refer to impacts of
output and supply dislocation between economic sectors caused by natural disasters. Indirect
effects of drought are always more serious than direct effects for the reason that farming is the
base of economy and is always hit first by drought.”
Coleen et al. (2006) in Olayele (2010) state that the impacts of drought are spread out over the
parts that are largely affected, long afterwards the end of the incident, and the influences of
drought are diversified like any other hazards, and can be classified as environmental, social and
economic, as summarised in Tables 2.3, 2.4 and 2.6 below:

23
2.5.1. Social impacts of drought
Table 2.3 Social impact of drought
SOCIAL IMPACTS EFFECTS
Lack or poor distribution of resources (food and water)
Migration, resettlement, conflict between water users
Increased quest for water Increased conflict among water users
Marginal lands becomes unstable Poverty and unemployment
Reduced grazing quality and crop yield Overstocking; reduced quality of living
Retrenchments Reduced or no income
Food insecurity Malnutrition and farming; civil strikes and conflict
Increased pollutant concentration Public health risks
Inequitable drought relief Social unrest and distrust
Increased forest and range fires Increased threat to human and animal Life
Urbanisation Social pressure and reduced safety
Source: Olayele (2010)
2.5.2. Economic impacts of drought
Table 2.4. Economic impact of drought
Economic impacts Effects
Lowered trade per dealers high rates aimed at agri-business produces
Lack of food and energy Severe increases of rates; high prices in imported goods and services
Severe loss in crops, no food and income High expenses in purchasing food
Poor growth and quality in livestock Low price for livesctock
Poor water supply High rates in transport
High level of retrenchments and loss of financial support and properttiesty
Extending poverty; high level of unemployment
Lack of tourism attraction and less financial boost
High level of capital deficit
High level of financial advances High level of debts; more credits for monetary organizations
Source: Olayele (2010)

24
2.5.3 Environmental impacts of drought
Table 2.5 Environmental impact of drought
Environmental impacts Effects
Destruction to natural habitats Harm of biodiversity
damaged forests, crop, and range land productivity
Reduced income and food shortages
Low levels of water Less accessibility to water
poor cloud cover Plant scorching
High temperatures during day time Improved fire hazards
high evapotranspiration Increased crop wilting
Increased dust and sand storms Improved soil erosion as well as increased air pollution
Lesser soil productivity Desertification and soil degradation (top soil erosion)
Decreased water resources Lack of irrigation and drinking water
Reduced water quality More waterborne diseases; increased salt concentration
Increased incidences of animal diseases and mortality
Loss of income and food; reduced breeding stock
Soil desiccation Increased soil ‘blow activities’
Degradation of landscape quality Permanent loss of biological productivity of the landscape
Species concentration near water Increased vulnerability to predation
Source: Olayele (2010)
Below is a diagram indicating direct and indirect impact of drought on farmers:

25
Figure 2.2. Direct and indirect impact of drought
Source: Olayele (2010)

26
The indirect impacts of drought includes the reduction in crop production, resulting in low income
for the producers; the hike in food prices, which promotes high unemployment rates and
subsequent migration; the drop in production of food; the irregular rise in food grain expenses and
the lack of job opportunities, all of which deny the rural people the opportunity to access food,
especially subsistence farmers and labourers who are without land (Olayele, 2010).
2.6. DROUGHT’S EFFECT ON THE AGRICULTURAL SECTOR IN SOUTH AFRICA
Ngaka (2012) highlighted drought as a key tragedy in South Africa, centred on overall monetary
loss and the number of affected individuals. It is reported by the Department of Environmental
Affairs (DEA) that South Africa is faced with the risk of dry climatic conditions in the West and the
South of the country, whereas the eastern part could experience wetter conditions (DEA, 2010).
Small-scale producers or farmers are faced with the risk of increasing pests and diseases on their
production which will eventually result in reduced yield and a sharp decrease in optimum land use
for agricultural purpose (Maponya, et al.).
Farmers that are operating mostly in rural parts of South Africa are most susceptible to the effects
of climate-related variations, because the country relies on climate-sensitive economic sectors
(Visser & Turpie, 2014). Visser (2014) further emphasised that poor people in particular are
exposed inadequate prospects and, are unreasonably affected by the undesirable bearings of
climate variation, directly in sectors that depend particularly on agriculture, biodiversity,
ecosystems and water supply. Maponya (2013) and FAO (2008) testified that the severity of the
climate variation would result in major radical rises in food insecurity, provoking increases in
poverty levels in most rural areas, which would cause four dimensions of food insecurity, namely
availability, accessibility, utilisation and stability of food. The production systems that are applied
by the small-scale farmers are, in actual fact, directly affected by increases in temperatures,
resulting in heat stress on plants and thus a reduction in water availability and, eventually,
lowering the entire production as highlighted by Komba and Muchapondwa (2012).
2.7. DROUGHT’S EFFECT ON LIVESTOCK AND CROPS
Heat stress is associated with drought, and it affects feed consumption by livestock and the
increase in the amount of water consumed by animals (Scholtz et al., 2016). Livestock use water
to regulate their body temperatures, especially in extreme temperatures. Heat stress has negative
impacts on the performance of animals in the tropical, arid, as well as subtropical zones (Bouraoul

27
& Ben Salem, 2009). The areas in the Mediterranean climate are characterised by hot summer
conditions. It has been revealed that, in many parts of Tunisia, there are sharp declines in the
production of milk and an overall reduction in the reproduction indices in cattle, especially in
summer, due to their exposure to heat stress (Bouraoul et al., 2009). Most of the livestock breeds
find it difficult to adapt to harsh and extreme warm weather conditions of South Africa (Kriel, 2016).
Kriel (2016) further emphasises that the animals will struggle more under warmer temperatures,
as they experience a variety of contagions, predominantly lung contagions, as a result of dusty
environment of many farms in the country. Moreover, shortage of adequate grazing results in lots
of animals lacking essential nutrition elements, which lead to low conception rates, retained
afterbirths, production of poor quality colostrum, and immune deficiencies. Animals that are
stressed try to look after themselves by way of not reproducing so that they might conserve
energy.
The majority of livestock producers in South Africa use any available type of feed during drought
periods, so as to sustain basic maintenance that will keep their livestock alive, this is facilitated
by a huge decline in natural grazing and reduced crop residue (Van Niekerk, Mare & Strydom,
2016). The severe drought that is experienced during the summer periods has negatively affected
many South African farmers (Du Pisanie, 2016). The farmers with crop residues that can be used
during winter have a head-start, though, as crop residues are a good replacement feed for winter
grazing after a harvest. According to Van Niekerk et al. (2016), calving and lambing percentage
has declined, and it was apparent in the Province of the Free State, wherein one of the producers
had reported a conception of 11% for his ewe enterprise.
2.8. SUSTAINABLE LIVELIHOOD (SL) FRAMEWORK
This framework consists of five key elements of livelihood assets, namely human, natural,
financial, social and physical capita. The vulnerability situation is regarded in terms of shocks,
trends, seasonality, and the inspiration of making over the structures for livelihood approaches
and their products. The sustainable livelihood framework includes two major terms, which are
sustainability and livelihood. Livelihood is regarded as the means of attaining a living, covering
livelihood capabilities, tangible and intangible assets. Within the livelihood framework, the term
‘sustainability’ is over and over again associated with the ability to manage by means of
recuperating from tensions, shocks and uphold the natural reserve base (Chambers & Conway,
1992; DFID, 1999 cited in Juventine, 2012). The figure below illustrates the sustainable livelihood
framework:

28
Figure 2.3. Sustainable livelihood framework
Source: (Baas, et al., 2008)
According to Baaset al. (2008), the Sustainable Livelihoods (SL) framework (Fig.2.3) is designed
to be used as an instrument that will provide a clear understanding and an analytical approach
that will assist in identifying the kind(s) of households that are more vulnerable than others. This
will be achieved by means of analysis of the inter-relationships amongst shocks, susceptibilities
and the packages of belongings of households, as well as their coping mechanisms, in the
situation of an ongoing program, organisational and development processes.
The SL context positions family units and their means of support at the centre of analysis by
means of assuming that they are constantly under the influence of prospective threats of shocks.
SL context, as indicated in Figure 2.3, susceptibilities of all forms and organisations form the main
portions of the general framework within which improvements are actually taking place. The
unalike packages of possessions that belong to various social groups, households and the public,
29
as well as the organizational frameworks, eventually regulates the abilities of these households,
social groups and communities to cope with different levels of disasters, before, during and even
after their occurrence (Baas, et al., 2008).
The advocacy of the framework also urges that, whereas a number of hazards may possibly affect
members of the same public to a related mark, households that have bigger properties still have
the ways to take on further operative coping mechanisms that can prevent a hazard from
becoming a total disaster. The framework places emphasis on in what manner an operative public
and higher-level organisations be able to lower the effects of a disaster on underprivileged families
by mobilising both members of society and external action for the advantage of the most
vulnerable (Baas, et al., 2008).
In terms of household resilience, the sustainable means of support viewpoint urges that family
unit with a large stock of assets will be more resilient to hazards than households who have
relatively fewer assets. The stock of assets could be drawn by households in the form of
investments to purchase food, to restock or to enable educated households to travel for the time
being for work in other areas (Baas, et al., 2008).
2.9. THE BBC CONCEPTUAL FRAMEWORK The term BBC is associated with the conceptual work that was done by Bogardi and Birkmann
(2004) and Cardona (2001). These authors’ names serve as the main basis of the BBC
framework. The conceptual framework is the combination of various elements from other
frameworks. It is developed based on three different deliberations on by what means to associate
human security,vulnerability and sustainable development (Bogardi & Birkmann, 2004) cited in
(Birkmann, 2013); develop holistic approaches to disaster risk assessment, and the expansive
deliberation taking place for the advancement of casual frameworks for the measurement of
environmental degradation in the context of sustainable improvement.
According to the BBC framework, various vulnerabilities are addressed based on social, economic
and environmental contexts. The framework emphasises that vulnerability analysis goes beyond
the estimation of the deficiencies and the assessment of the disasters that had occurred in the
past. It emphasises how important it is to overlook vulnerability contained in a course, by
concentrating at once on coping capacities and potential intervention tools to lessen

30
vulnerabilities. It views vulnerability in terms of the susceptibility and the degree of exposure of
elements to risk, as well as their coping mechanisms (Birkmann, 2013). The framework indicates
that vulnerability valuation has to take into consideration the exact types of hazard and the
prospective events whereby the vulnerable people, together with its environment and the
economy, are unprotected to risk, as well as the interactions of both that result in risk. The figure
below illustrates the BBC framework:
Figure 2.4. The BBC conceptual framework
Source: (Brikmann, 2013)
The BBC framework, by way of the connections amongst sustainable development as well as
vulnerability, points out the need to contribute due to concern to the environment on which human

31
circumstances depend. The concept encourages a problem-solving viewpoint by means of
scrutinising possible losses and shortages of several basics at risk, the coping mechanisms, and
the potential intervention measures. The development of vulnerability indicators and the
assessment of vulnerability should address both susceptibility and exposure of different elements
to risk, on the basis of social, economic and environmental spheres. In this context, the framework
is open to links with other various approaches, especially those of a sustainable livelihood
approach. In the social and economic sphere in the BBC context, five properties function as
essential co-ordination in selection of appropriate sub-themes also pointers, to measure the
susceptibility and coping while being vulnerable to hazards of natural origin (Birkmann, 2013).
Moreover, it ought to likewise categorize then measure coping capacities and the prospective
mediation tools (Birkmann, 2004:2 cited in Juventine, 2012).
2.10. THE EFFECT OF DROUGHT ON SMALL-SCALE PRODUCERS
Southern Africa has experienced the worst drought during the years of 2015 and 2016 (Monyela,
2017). The severity and intensity of the drought has been described to be the combination of
events, such as irregular climate dynamics accompanied by the presence of El Nino and global
warming (Scholtz et al., 2016). According to Scholtz (2016), the South African Weather Services
(SAWS) has reported that the year 2015 was the driest since the national recording of rainfall,
which started in 1904. It is reported that the average national rainfall was around 400mm,
compared to the long average of more than 600mm. Lack of support in the agricultural sector has
led to exposure to external shocks, such as drought. The small-scale producers with poor or no
resources of any kind, such as irrigation equipment, are suffering the most (Sifiso et al., 2017).
Some of the farmers in the area have rivers passing through their farms and acquired irrigation
rights, but lack the infrastructure to irrigate their farms. Though livestock has mechanisms to adapt
to harsh environmental conditions, in doing so, production becomes compromised (Rashamol et
al., 2018). The result of drought linked to severe heat waves, as well as breeding stock, leads to
the shortage of livestock products (Scholtz et al., 2016).
2.11. MITIGATION AND COPING STRATEGY FOR DROUGHT
According to Masekende and Shoko (2014), agricultural drought coping strategies generally
include multiple cropping, planting of drought-tolerant cultivars and other diversifications.
Adoption of income or economic diversification by the farmers might relief stress caused by the
drought (Makoti & Waswa, 2015). In relation to livestock production, one of the coping

32
mechanisms includes destocking to avoid losing the entire livestock, and the purchasing of
supplementary feed (Ngaka, 2012). Some farmers opt to cull their animals, particularly older ones,
before they die of drought, and this also serves to maintain the correct stocking rate, as well as
to keep the required number of males to help maintain the sex ratio (Thornton et al., 2004).
Thornton (2004) further emphasises that commercial farmers are mostly reducing their animals,
whereas only a few small-scale farmers reduce theirs.
Coping with drought is a mechanism that need to be applied by all levels of farming communities,
namely commercial, subsistence and small-scale farmers, by using different management
approaches that aim to lessen the losses that are incurred during drought periods. The availability
and visibility of the department of agriculture and their services will play a vital role, by providing
advice to the farmers about livestock grazing methods and animal health, so as to prevent the
spread of diseases (Vilane, Mnanyatsi & Shabangu, 2015).
2.11.1. Drought response in Kajialo district of Kenya
In the Kajialo district of Kenya, the most dominant tribe is that of the Maasai pastoralists. The
country has experiences changes with regard to land tenure, which has resulted in changes that
are characterised mainly by subdivisions, and the subsequent destruction of communal grazing
in forming smaller individual parcels (Mworia & Kinyamario, 2007). The changes also affected the
veld, which was previously used as grazing reserve in dry season to support arable land that was
being cultivated, as drought does not only result in the decline in grass biomass, but can also
facilitate dramatic shifts in botanical composition. Therefore, access to various vegetation species
and productivity ensures that the livestock population stability is maintained, along with their
physical conditions. The mobility of herds creates the need for a more favourable environment
with regard to land tenure and land use, so as to ensure access to resources (Mworia, et al.,
2007).
Olayele (2010) indicates that the areas that are affected by the drought globally, the manner in
which communities respond differs from place to place, which could be the result of different
religious beliefs and level of education or financial background. According to Campbell (1999) in
Olayele (2010), the Kajialo district of Kenya, during the drought experienced from 1972 to 1976
from 1994 to 1995, the following mechanisms of coping with drought were established: depending
on the power from above through prayers, arranging of payment for rainmakers, moving of
livestock to an area which has enough or just availability of water and pastures or grazing, selling
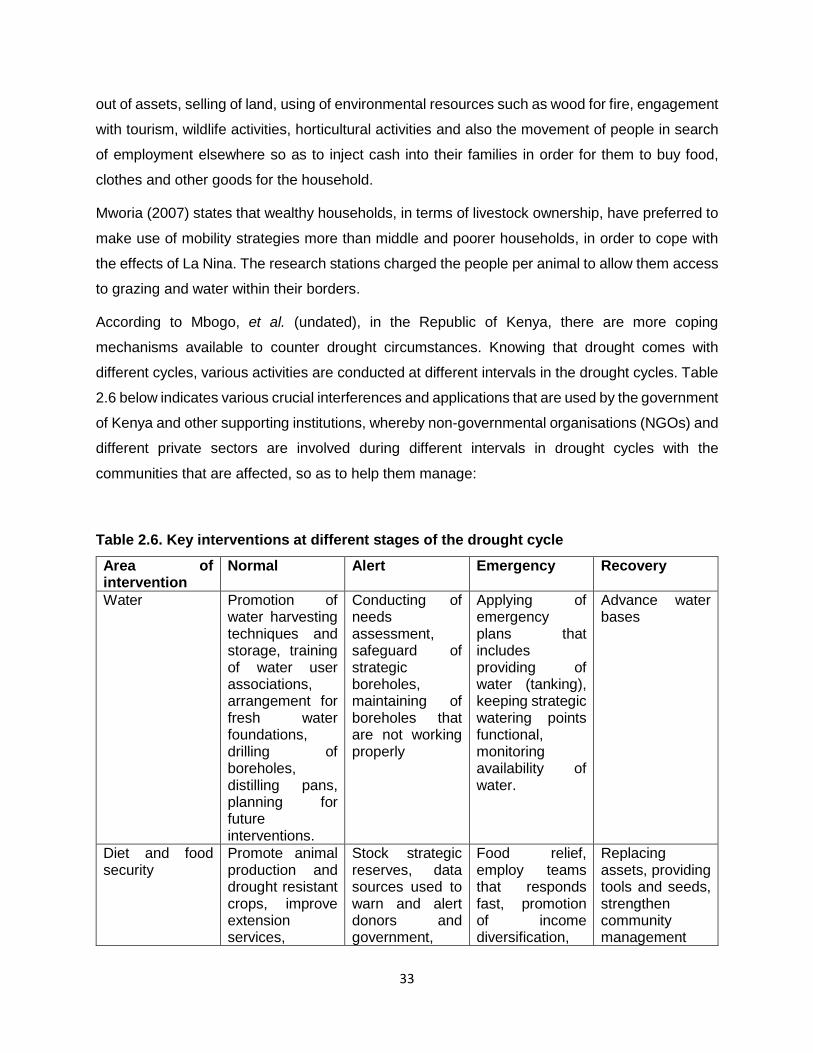
33
out of assets, selling of land, using of environmental resources such as wood for fire, engagement
with tourism, wildlife activities, horticultural activities and also the movement of people in search
of employment elsewhere so as to inject cash into their families in order for them to buy food,
clothes and other goods for the household.
Mworia (2007) states that wealthy households, in terms of livestock ownership, have preferred to
make use of mobility strategies more than middle and poorer households, in order to cope with
the effects of La Nina. The research stations charged the people per animal to allow them access
to grazing and water within their borders.
According to Mbogo, et al. (undated), in the Republic of Kenya, there are more coping
mechanisms available to counter drought circumstances. Knowing that drought comes with
different cycles, various activities are conducted at different intervals in the drought cycles. Table
2.6 below indicates various crucial interferences and applications that are used by the government
of Kenya and other supporting institutions, whereby non-governmental organisations (NGOs) and
different private sectors are involved during different intervals in drought cycles with the
communities that are affected, so as to help them manage:
Table 2.6. Key interventions at different stages of the drought cycle
Area of intervention
Normal Alert Emergency Recovery
Water Promotion of water harvesting techniques and storage, training of water user associations, arrangement for fresh water foundations, drilling of boreholes, distilling pans, planning for future interventions.
Conducting of needs assessment, safeguard of strategic boreholes, maintaining of boreholes that are not working properly
Applying of emergency plans that includes providing of water (tanking), keeping strategic watering points functional, monitoring availability of water.
Advance water bases
Diet and food security
Promote animal production and drought resistant crops, improve extension services,
Stock strategic reserves, data sources used to warn and alert donors and government,
Food relief, employ teams that responds fast, promotion of income diversification,
Replacing assets, providing tools and seeds, strengthen community management
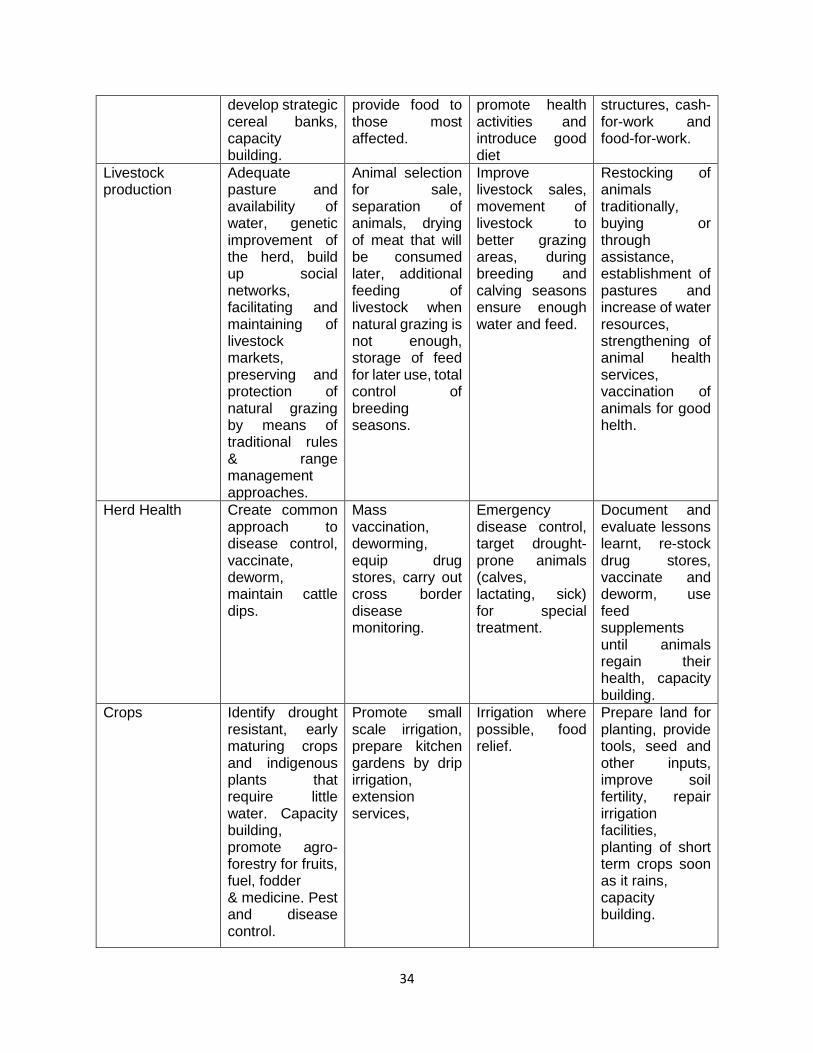
34
develop strategic cereal banks, capacity building.
provide food to those most affected.
promote health activities and introduce good diet
structures, cash-for-work and food-for-work.
Livestock production
Adequate pasture and availability of water, genetic improvement of the herd, build up social networks, facilitating and maintaining of livestock markets, preserving and protection of natural grazing by means of traditional rules & range management approaches.
Animal selection for sale, separation of animals, drying of meat that will be consumed later, additional feeding of livestock when natural grazing is not enough, storage of feed for later use, total control of breeding seasons.
Improve livestock sales, movement of livestock to better grazing areas, during breeding and calving seasons ensure enough water and feed.
Restocking of animals traditionally, buying or through assistance, establishment of pastures and increase of water resources, strengthening of animal health services, vaccination of animals for good helth.
Herd Health Create common approach to disease control, vaccinate, deworm, maintain cattle dips.
Mass vaccination, deworming, equip drug stores, carry out cross border disease monitoring.
Emergency disease control, target drought-prone animals (calves, lactating, sick) for special treatment.
Document and evaluate lessons learnt, re-stock drug stores, vaccinate and deworm, use feed supplements until animals regain their health, capacity building.
Crops Identify drought resistant, early maturing crops and indigenous plants that require little water. Capacity building, promote agro-forestry for fruits, fuel, fodder & medicine. Pest and disease control.
Promote small scale irrigation, prepare kitchen gardens by drip irrigation, extension services,
Irrigation where possible, food relief.
Prepare land for planting, provide tools, seed and other inputs, improve soil fertility, repair irrigation facilities, planting of short term crops soon as it rains, capacity building.
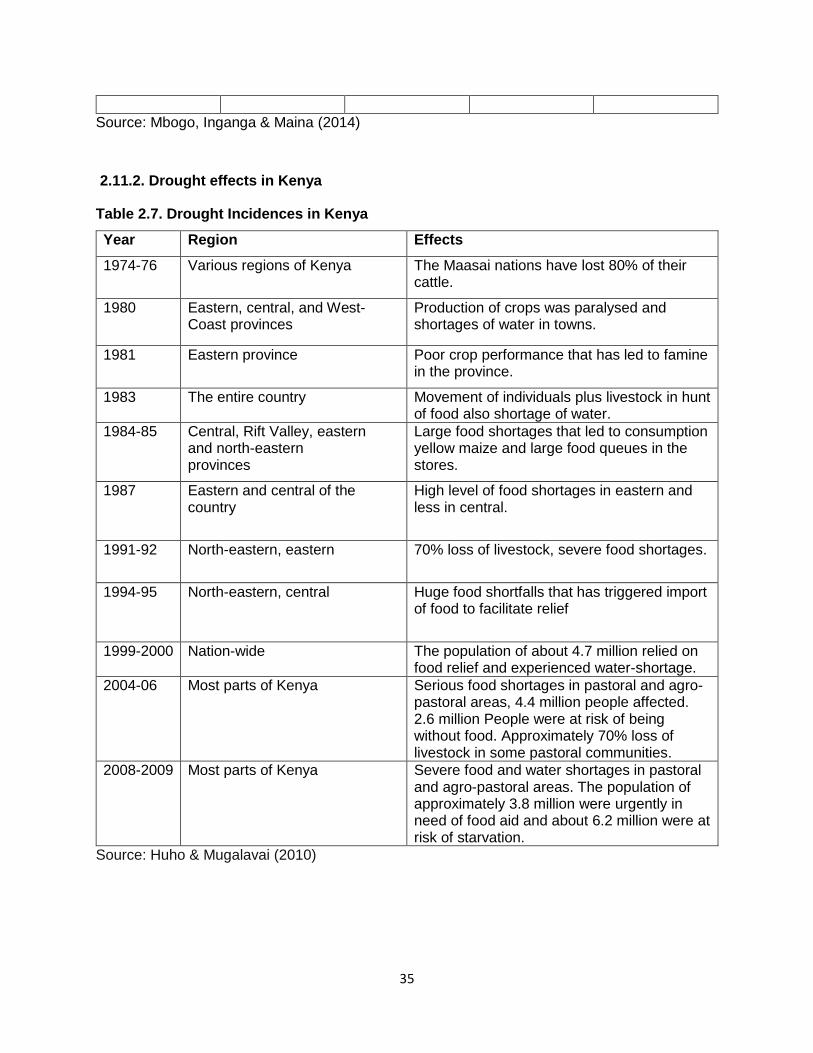
35
Source: Mbogo, Inganga & Maina (2014)
2.11.2. Drought effects in Kenya
Table 2.7. Drought Incidences in Kenya
Year Region Effects
1974-76 Various regions of Kenya The Maasai nations have lost 80% of their cattle.
1980 Eastern, central, and West-Coast provinces
Production of crops was paralysed and shortages of water in towns.
1981 Eastern province Poor crop performance that has led to famine in the province.
1983 The entire country Movement of individuals plus livestock in hunt of food also shortage of water.
1984-85 Central, Rift Valley, eastern and north-eastern provinces
Large food shortages that led to consumption yellow maize and large food queues in the stores.
1987 Eastern and central of the country
High level of food shortages in eastern and less in central.
1991-92 North-eastern, eastern
70% loss of livestock, severe food shortages.
1994-95 North-eastern, central
Huge food shortfalls that has triggered import of food to facilitate relief
1999-2000 Nation-wide The population of about 4.7 million relied on food relief and experienced water-shortage.
2004-06 Most parts of Kenya Serious food shortages in pastoral and agro-pastoral areas, 4.4 million people affected. 2.6 million People were at risk of being without food. Approximately 70% loss of livestock in some pastoral communities.
2008-2009 Most parts of Kenya Severe food and water shortages in pastoral and agro-pastoral areas. The population of approximately 3.8 million were urgently in need of food aid and about 6.2 million were at risk of starvation.
Source: Huho & Mugalavai (2010)

36
2.11.3. Coping and adaptation in Bangladesh
Table 2.8. Chronology of major drought events and subsequent impacts in Bangladesh
Year Details
1791 Jessore district affected by drought and prices increased by morethan100%.
1865 Drought headed the Dhaka famine.
1866 Severe drought in Bogra led to decrease in grain production prices tipled
1872 Drought in Sundarbans, crops have seriously suffered
1874 drought affected Bogra which has caused great crop failure.
1951 Severe drought in Northwest Bangladesh significantly reduced the production of rice
1973 Drought responsible for the 1974 famine in northern Bangladesh, one of the
most severe of the century.
1975 Drought affected 47 percent of the country and more than half of the total
population.
1978-79 One of the most severe droughts in recent times with widespread damage to
crops reducing rice production by about 2 million tonnes, directly affecting
about 42 percent of the cultivated land and 44 percent of the population.
1981 Severe drought adversely affected crop production.
1982 Drought caused a loss of rice production of about 53 000 tonnes while, in the
same year, flood damaged about 36 000 tonnes.
1989 Drought dried up most of the rivers in Northwest Bangladesh with dust storms
in several districts, including Naogaon, Nawabganj, Nilpahamari and
Thakurgaon.
1994-95, The most persistent drought in recent times; it has caused huge crop
1995-96 damage, especially to rice and jute crops, which are the main crops of
northwestern Bangladesh and to bamboo clumps a main cash crop in the region.
Source: Ramamasy et al. (2006)
Deficiencies of rainfall in the state of Bangladesh has became a recurring spectacle, bothering
the state at least as often as severe cyclones and floods. From the time when it got liberation in
1971, the state has experienced extreme droughts in the years 1973, 1978, 1981, 1982, 1989,
1992, 1994 and 1995 (Paul, 1998) cited in (Ncube & Shikwambana, 2016). Not all the parts of
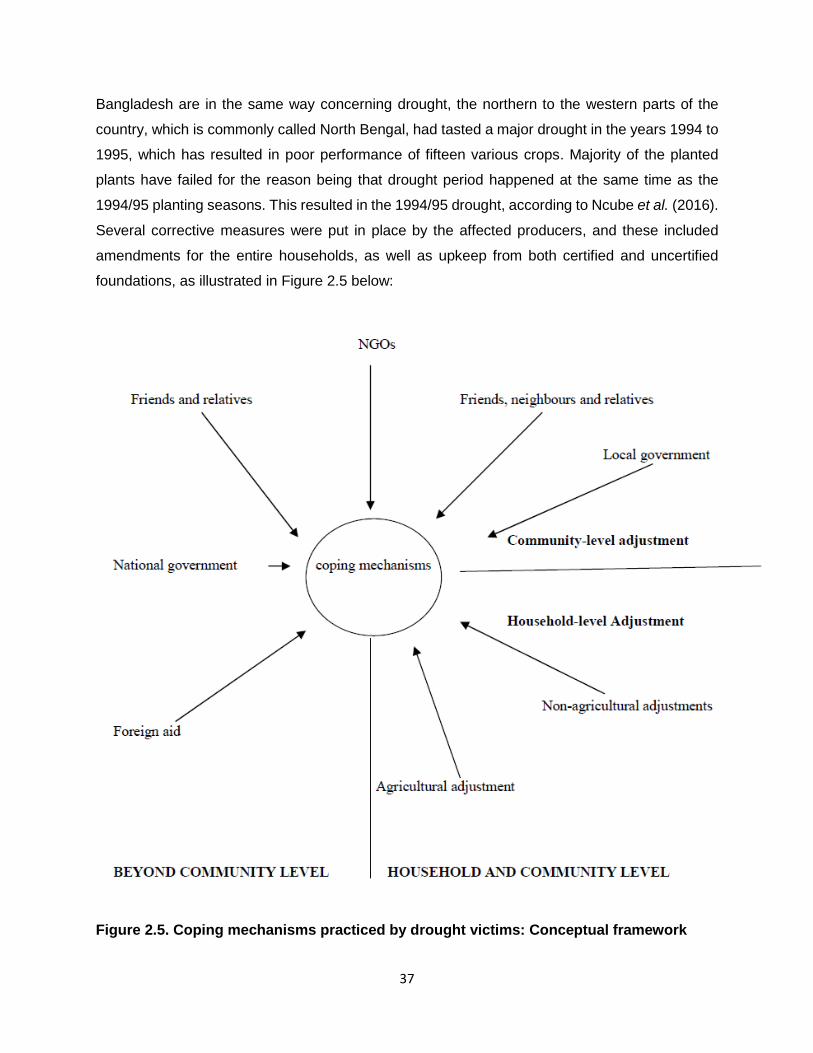
37
Bangladesh are in the same way concerning drought, the northern to the western parts of the
country, which is commonly called North Bengal, had tasted a major drought in the years 1994 to
1995, which has resulted in poor performance of fifteen various crops. Majority of the planted
plants have failed for the reason being that drought period happened at the same time as the
1994/95 planting seasons. This resulted in the 1994/95 drought, according to Ncube et al. (2016).
Several corrective measures were put in place by the affected producers, and these included
amendments for the entire households, as well as upkeep from both certified and uncertified
foundations, as illustrated in Figure 2.5 below:
Figure 2.5. Coping mechanisms practiced by drought victims: Conceptual framework

38
Source: Paul (1998) cited in Olayele (2010).
According to Paul (1998) cited in Olayele (2010), Olayele being exposed to frequent droughts,
the local communities of North Bengal have, over the years, engaged in developing a wide range
of long and short term coping mechanisms. The method included the replacement of high water
demanding crops with less water demanding ones. Other local farmers used the irrigation, gap-
filling and inter-copping farming method,
In most developing countries, it is very unusual to dispose of personal assets under normal
circumstances. In difficult times, when drought is severe, families experiencing shortage of
domestic food, or the running low of stored food, members of the family are left with no option but
to trade their belongings to increase money to acquire food. The adjustment in activities that are
not related to farming were accomplished in the Northern Bengal throughout the years of 1994
and 1995 during the duration of the drought , which included the sale of household belongings,
such as livestock, land, and housing structures, among others. The sale of household belongings
was to prioritise the availability of food for families.
Migration was not part of the change, contrary to what was expected, according to the study
conducted by Paul (1998) in both Olayele (2010) and Ncube (2016), it is usually mutual exercise
for families that are affected by drought to relocate to other places, to look for other opportunities
or income-generating employment that will assist them in surviving the duration of the drought.
Migration might not have happened because people living in the area are used to drought, as it
strikes frequently. Migration is no longer part of the solution for these people, simply because they
are certain that drought duration cannot carry on persistently. Other farming communities who
have also experinced severe drought were provided assistance and backed by neighbouring
communities. The support that drought victims need either comes late or is not enough, and in
the case in point, support came in the form of financial aid, and others were from both different
government organisation services, as well as non-governmental organisation services. The type
of assistance received by drought-affected families included cash loans, seeds and fertilisers.

39
2.11.4. Drought coping mechanism in Botswana The National Disaster Management Office (NDMO), which is under the office of the President,
takes responsibility in terms of co-ordinating and managing disaster risk events in Botswana.
However, Ministry of Local Government and Rural Development takes responsibility in
management of drought by putting into practice of the 1992 drought policy, whereby the main
concern is given to labour intensive public works to provide temporary employment, purpose
being to link relief and development (Buchanan-Smith & Tlogelang, 1994) cited in (Manthe-
Tsuaneng, 2014). Manthe-Tsuaneng (2014) emphasised that, for the duration of drought eras,
the whole ministries as well as local authorities are mobilised to support in relief programmes,
together with community works projects with the purpose of creating jobs all through challenging
periods. The main aim of providing drought package relief is to alleviate human pain and avoid
loss of life.
(Buchanan-Smith & Tlogelang,1994) cited in (Ncube & Shikwambana, 2016) maintain that styles
and methods of crisis aid that are made available by government in the course of drought consist
of additional allocation of jobs aimed at increasing workforce, buying of supplementary water
bowsers for assistance in boosting human water supply. Vulnerable groups in the community
receive free supplementary feeding, and this includes children in learning institutions or facilities
and making food available intended for all kids less than five years of age who attend child well-
being health centres, as well as others. The government further provides drought aids on
nominated livestock supplements, supplements and vaccines.
The Botswana government has managed to set strategies in practice in order to mitigate the
impacts of drought, yet it is still essential to make awareness in the midst of communities on the
recurring of drought. The years or periods of drought conditions are commonly trailed by those
years of good rainfall and, as such, individuals have to embrace managing approaches. Study
foundations have to advance drought predicting models as well as increasing dependable early
warning systems that will help to minimise the bad bearings of drought on vulnerable
communities.
2.11.5. Drought coping strategy in Namibia According to Sweet (1998), Namibia had suffered the worst drought during the years 1992 and
1993. Prior to the independence that the country gained in 1990, the country was under the
administration of the Republic of South Africa and had no policy or institutional structures for

40
dealing with serious drought or other environmental disasters in the country. The communal
people in Namibia relied on local NGOs, especially churches, for drought relief, because the
county had no institutional capacity to deal with severe drought on a large scale. The country
finalised the national drought policy and strategy in 1997 and it was approved by cabinet in 1998.
Sweet (1998) has dealt with various properties and afterwards of drought in Namibia on
producers, and the manner in which they were prevented, as follows:
Drought and its impact
The immediate impact of drought is that it causes shortage of food for the people and shortage of
grazing for livestock and wild animals. It has affected every section of the whole 14 regions of
Namibia, and about six hundred and twenty five thousands people of the country’s populace of
1.4 million. Approximately 250 000 people were categorized as those who were in a situation of
facing danger, but there was no life that was lost as a result of drought.
Impacts of drought in Namibia are documented as follows, according to Sweet (1998):
Reduction in water supply
Huge setback of drought was the decline in the accessibility of water for domestic purposes in
most cities, and stock water in lots of parts of the nation state. The shortage of water was worse,
as, at some point, main surface catchment dams recorded just 26% of volume. In rural parts, most
minor pans and dams were unsuccessful to embrace water, borehole water-levels were drastically
dropped.
Lowered plant production
The area in the northern part of the country was affected severely by agricultural drought as
compared to meteorological drought, and the region has, overall, experienced unreliable rainfall
distribution during the period in which it was most needed, which was the growing season, rather
than marked overall low levels of rainfall. More or less half of the rural producers who planted
maize had reaped nothing altogether, despite the fact that elite farmers had lost 36% of their
harvest.
Mortalities in livestock
Drought is capable of dropping the number of livestock in two different methods and that is in a
straight line over mortality and once more over distress sales. In many cases, the loss of livestock

41
through distress sales is less expected in game animals, and more expected in domestic
livestock. In the northern part of Namibia, some of the communal areas have lost on crop
production, whereas in another places in the communal areas, majority of the farmers has
experienced huge loss in livestock. The nationwide post-drought survey results indicated that
livestock mortality rates in communal areas were higher, and their suffering included:
Almost 80% of communal livestock farmers experienced loss.
An average of 22% of cattle was lost in rural parts and 2% on commercial farms.
An average of 40% of goats lost was in rural areas and 10% on commercial farms.
Mortality rates were morethan trades; cattle owners in the rural areas were not capable
or reluctant to trade their animals in major quantities in advance and they died, or they
reached the stage of pbeing unmarketable.
An average of 43% of sheep loss was in rural parts whereas 15% on commercial farms.
The mortality rate variances amongst rural farm and elite farm areas reflects that well established
or commercial farmers have better right to use to grazing land and water, with cash investments
that enable them to purchase fodder and medicines, to lease grazing and that afford them better
readiness or ability to sell their livestock.
Household income reduced
During the 1992/93 drought, households in the rural parts have encountered a loss of almost
quarter of their regular monthly income as a result of crop losses, mortality in their livestock and
reduced chances of employment. The fall was mostly experienced in the rural settlements, while
peri-urban communities suffered slightly. Commercial famers had as well undergone intense
dropping in their regular earnings.
The 1992-93 drought response by Namibians
Sweet (1998) emphasise that, earlier to the drought of 1992/1993, Namibia did not have any
established organizational capacity to deal with extreme drought or other disasters related to
environment. Combined with several hard work that are made by both rural and well established
elite farmers to manage the effect of drought as far as possible, government has constituted the
national drought task force (NDTF). There were many activities that were adopted by both rural
producers and elite farmers, as well as efforts made by the state in order to mitigate drought
effects.
42
With the decline in crop production and low income in rural households, and as an alternative
means of survival, communities can sell livestock, particularly when the animals are threatened
by drought, and thereby, the communities can buy fodder or relocate some animals. Devereaux
et al. (1993), cited in Sweet (1998), mentioned that about 1 in 4 farmers have managed to sell
some or all of their livestock during the drought periods, and most of those who were unable to
sell their animals were unable to do so because of the animals’ poor conditions. Non-animals that
were sold during drought for households to buy food includes radios, cooking pots, bicycle but
the most lucrative items were cars.
Traditionally, communal livestock owners respond to drought by moving their animals to areas
less affected by drought. The majority of livestock producers in the rural areas of the northern
parts migrate their stock through the boundary and into neighbouring country Angola, which has
lower livestock concentration. The move to the northern region, as a coping strategy, is not a
luxury or option to all regions of Namibia, and the increasing population of both humans and
animals is concentrated in other parts of the communal areas, and has restricted the movement
of livestock. The small scale farmers are more disadvantaged because they lack the workforce
capital to facilitate the migration of their animals. Buying fodder is one of the strategies employed
to cope with drought, but communal farmers and small scale producers cannot afford to buy feed,
and it is unfortunate because, during drought periods, there is no fodder closer to the affected
areas due to high demand and, if available, it is often too expensive - also due to high demand.
The majority of communal farmers generally do not sell their animals during poor rainfall periods
for a various reasons, covering:
Lack commercial orientation, and their reasons for keeping livestock are different.
They do not have huge stock, their stock is actually small.
Lack of knowledge concerning how long the drought will last.
When drought is present, the animals lose weight, physical conditions have deteriorated
and trade worth has declined.
Lack of auction facilities.
There might be high suspicion by the communal farmers that the move to sell their animals is
being pressured and facilitated by the government trying to force them to destock or reduce the
number of animals they keep. The communal livestock owners are impressed when they have
huge numbers of animals because they serve as insurance, and they share them with various
herders, while, in other cases, they share the animals with their less fortune families, who take
care of them in exchange for milk and cattle dung, with which to maintain their mud houses.

43
The Namibian commercial farming sector is characterised by livestock production and wildlife,
while maize production is more prominent in the northern parts, with irrigation schemes in the
south of the Orange River. The elite producers manage the effects of drought because due to
reserve of capital that they withdraw during difficult times of drought, which is something the
communal farmers usually do not have. Commercial farmers are able to reach markets easily.
The major worry for commercial farmers was on how to prevent the losing their animals and
wildlife, which was not the case with rural producers, as their worries are based on fulfilling daily
needs for their families such as providing food, and it was easier for them (commercial farmers)
to obtain credit and to sell their animals quickly when drought was present, which is a major
drought response, even though their readiness to trade is being diminished through tax
obligations on their trades. The early sales of livestock by commercial farmers make good prices
and leave more grazing for the remaining livestock.
The 1992 and 1993 drought affected livestock more than it affected general public, and the
government came up with measures to support livestock owners in trying to alleviate the crisis.
The major objective was to provide farmers with fodder subsidies, mineral licks and also providing
emergency grazing. The government purchased unoccupied farms for additional grazing. The
farms included the state’s experimental farms, and farms under municipalities were made
available to communal farmers.
2.11.6. Coping with drought in South Africa The rural community and households in developing countries, especially in Africa, are still farming
with livestock on communal land (Mmbengwa et al., 2015). This farming practice is known to be
prone to climatic conditions, especially drought. Drought is regarded as the highest and expensive
natural hazards, utmost essential as well as severe elements that affect the world’s food security
(Vilane et al., 2015).
There are two ways in which drought can reduce livestock farming, namely 1) straight by means
of deaths and 2) distress sales (Ncube et al., 2016). Drought is a direct result of climate change
(Kumwendo, 2012,) cited in (Vilane et al., 2015). They (Authors) further emphasised that the
farming communities lack contextualised information on adoption, in order to cope with the effects
of climate change.

44
Everybody who is participating in farming business recognises climatic excesses and the element
that they are yet to undergo forthcoming dry and raining days, but not yet known when and how
severe (Jordaan et al., 2019). There are possible methods that farmers can implement to reduce
the impact of drought, such as:
Stocking rates Nieuwoudt (2019) emphasises the importance of assessing the veld regularly, in order to ensure
that the stocking rate is optimal while maintaining as much residual forage as possible. It is
important to re-evaluate the stocking rate every season. It is also advisable to manage grazing in
such a manner that a ‘reserve’ pasture, which has been rested for an entire growing season, is
available. This will help to minimise overgrazing. It is, therefore, important to reduce the number
of livestock kept, rather than to cause permanent damage to rangeland resources Nieuwoudt
(2019). The purchasing of livestock feed is a means of coping with drought, if farmers are willing
to spend money on feed, as is the selling of livestock (Ngaka, 2012). Ngaka (2012) also
emphasises the movement of livestock to areas with better grazing as coping strategy to drought.
Pasture management Drought is inevitable, but permanent veld damage is not (Nieuwoudt, 2019). Rotational grazing
should be managed in a sustainable way, in order to increase the propagation of desirable plant
species, biomass, root development and energy reserves throughout the year. This reduces
moisture loss from the soil and increases plant biodiversity. Damage due to drought will be
minimised if the plants are in good condition. The use of irrigation on planted pastures can help
to cope with drought and, as an alternative method of mitigation, the challenge is that the source
of water is low in many areas. Therefore, farmers have no choice but to rely rainfall for the
production of the majority of grain, including planted pastures (Abraha, Shimelis, Laing & Assefa,
2017). Various strategies that are adopted by the farmers include conserving water in pastures
by the constructing of spreader banks, so as to conserve moisture in grazing lands, rotational
grazing within camps and management of livestock units, based on carrying capacity of grazing
veld (Ncube et al., 2016).
45
2.12. GENERAL LIVESTOCK FARMING PRACTICES
Livestock producers are dealing with several animals that are kept per hectare for grazing.
Successful farming operations can be achieved with correct veld management practices
(Bezuidenhout, 2015). The farmers must adhere to the correct stocking rate, and it must be as
close as possible to grazing capacity. It is important to move animals from one camp to another
for good veld management. The recommended period that livestock can remain in any one camp,
without the veld condition being affected, depends on season, animal type and veld type.
According to Jordaan (2013), small-scale stock producers on communal land lack feed reserves.
They need to start with feeding programmes at the early stage of dry periods, due to their poor
veld conditions. The lack of feed reserves and fodder banks increases their vulnerability. They
experience drought more regularly, due to overstocking and poor veld conditions.
2.13. THE ROLE OF EARLY WARNING SYSTEM (EWS) IN SOUTH AFRICA
(Monnik, 2000) cited in (Mabunda, 2012), defines an early warning system (EWS) as the system
of collecting information or data that helps to detect and monitor the disasters so that necessary
measures are arranged to curb disaster.
Monnik (2000), cited in Mabunda (2012), it is very much important to include the following
parameters in the system: facts regarding meteoreology, farming information, estimaltions
regarding manufacturing, ratings with regards to food, water availability and the vulnerability of
households. Moreover, for early warning system to be reliable, it must at least have certain
physical features such as the spatial extend of drought, the period in which drought will take place,
the period of occurance in relation to crop or planting season and its severity.
The most users of early warnig systems in South Africa includes all spheres of government and
their departments including agricultural industrial organization. The early warning systems users
have over the years lost faith and trust in weather forecasts (Monnik, 2000) cited in (Mabunda,
2012).
2.14. DROUGHT PLANNING
Wilhite (2005), emphasises that drought is different in comparison to most natural hazards
because of its slow onset - it progresses over a period of months, or even years. It is not easy to
determine its onset because of the harshness. Similar to any other hazards, the bearings of
drought span through social, economic and environmental, it could be lowered by means of
46
different mitigation strategies and preparation. Aside from the harshness of droughts, they are
usual portion of climate inconsistency for almost every states. Therefore, it is imperative to
establish drought-preparation strategies that will eventually address these prolonged days of
water scarcity in a well-timed and logical style, as they progress.
Wilhite (1991), cited in Wilhite (2005), has developed a 10-step drought process, which was
largely based on interactions with various states in the USA, to incorporate their experiences and
lessons learned. According to Wilhite et al. (2000), cited in Wilhite (2005), the process of planning
has gone through many interactions for the adaptation of specific countries and it has been
discussed all over the world in various discussions on drought management as well as
preparation.
The 10-step drought panning process, in brief, is arranged as follows: Steps 1 to 4 of this planning
process focuses on making sure that the right people are brought together, that they should have
a clear understanding of the planning process, know what the drought plan must achieve, and are
supplied with enough information to make fair and reasonable decisions when formulating and
writing the actual drought plan.
Step 5 defines the procedure of developing an organisational structure for the completion of the
tasks required to arrange the plan. The plan must be viewed as a process rather than a discrete
event that produces static documents.
Step number 6 and number 7 outlines the requisite aimed at continuing investigation as well as
coordination amongst experts and policy makers. Step number 8 and number 9 emphasise the
position of encouraging and trying the strategy earlier than the drought transpires. To end with,
step number 10 emphasises to look over the plan, to hold onto it, as well as weighing its
usefulness in the post-drought period.
Although the steps are arranged in a sequence form Wilhite (2005), the majority of the tasks are
dealt with at the same time led by drought task force and its counterparts of teams and operational
cluster. The 10 steps are summarised below by the National State Drought Mitigation Centre of
the University of Nebraska, situated in Lincoln, Nebraska, in the USA, as cited in Wilhite (2005):
Step 1 – Appointment of a drought task force.
Step 2 – Stating the purpose and objectives of the drought plan.
Step 3 – Seek stakeholder participation and resolve conflict.
47
Step 4 – Inventory resources and identify groups at risk.
Step 5 – Prepare or writing of the drought preparedness plan.
Step 6 – Identify the research needs and fill the institutional gaps.
Step 7 – Integrate science and policy.
Step 8 – Publicise the drought-preparation plan and build public awareness.
Step 9 – Develop educational programmes.
Step 10 – Evaluate and revise the drought preparation plan.
Step 1: Appoint a drought task force
The planning process is initiated by a key political leader, by appointing team working specifically
on drought. The political leader could be the head of the state, a minister in the national
government, a provincial head and/or the mayor at local government. The purpose of this is to
supervise and co-ordinate and, as soon as the strategy is in operation, the working team put in
place reduction and reaction means in well arranged programmes. The task force should include
various stakeholders in the form of a multidisciplinary team.
Step 2: Declaring the purpose and objectives of the drought plan
The initial action to be taken by the drought task force is to state the general purpose of the
drought plan. The official of the government must, therefore, consider many questions in defining
the purpose of the plan, such as the purpose and the role of government in drought mitigation
and response efforts, the plan scope, what the most drought prone areas of the state are, what
the historical impacts of the drought are, the historical responses to drought, the most vulnerable
economic and social sectors, the plan’s role in resolving conflict between various water users and
other vulnerable groups during the shortage period, current tendencies (e.g., land and water use,
as well as population growth) that could increase or decrease future vulnerability and conflicts,
resources (human and economic), social and legal insinuations of the strategy as well as major
environmental worries that are triggered by the drought.
Wilhite (2005) states that the drive of the strategy aimed at reducing the powers of the drought
through the identification of prime actions, regions, groups, that are at maximum risk, and to help
developing reduction strategies and programmes that will change this helplessness. The drought
plan’s goals will not be the same from one country to another, or from one region to another, and
have to reveal the distinctive physical, political, environmental as well as socio-economic features
48
of the region. The points that need to be well-thought-out for a country, province or region have
to take account of the following: Gathering as well as analysis of drought-related data in a suitable
and orderly method, establishment of measures for announcing drought crises and activating
several mitigation and response activities, provision of an organisational structure and a
distribution system that guarantees information movement between and within different levels of
government, defining of the duties and responsibilities of all agencies with respect to drought,
maintaining a current inventory of government programmes that are used in assessment, and
responding to drought emergencies.
Identifying of areas prone to drought within the state or province and vulnerable sectors,
individuals, environments, and additional goals take account of classifying precautionary
measures that might be in use in addressing susceptibilities and reducing the impact of drought,
providing strategies in making sure that well-timed and precise valuation of drought bearings on
farming, manufacturing, municipalities, wildlife, vacational industries and regeneration, well-being
and other areas.
To maintain that community is educated of current conditions, and taking response actions by
providing correct and well-timed facts to the mass media electronically (e.g., through television,
radio, internet and social media), a set of procedures should be established to frequently assess
and implement the plan and, occasionally, review the strategy in ensuring that it will always be
reactive and helpful to the requirements of the area.
Step 3: Strive for interested parties to participate and resolve conflict
When drought hits the area, there is a rise in rivalry for the limited resource that is water, and this
results in conflict in society, the economy and the environment. It is, therefore, important for the
task force team, or the members thereof, to identify all citizen groups that play a role in drought
planning, and to have a clear understanding of their interests. It is important to engage the groups
at an early stage then followed by way of constant engagement for reasonable demonstration of
all parties, plus for active drought super vision and planning (Wilhite, 2005). The discussion of
concerns earlier on in the process gives the participants an opportunity to develop an
understanding of one another’s points of view, and to make collective solutions. It is important to
notice the influence of the community concern crowds in making laws, and they need to be
considered. At the provincial level, it is important to have representatives from all district councils
49
who are affiliates at the provincial government, to stand for the benefits and ideals of their
communities.
Step 4: Inventory resource and classify groups at risk
To avoid delays in the planning process, the task force team is expected to make portfolio on
natural, biological and human capitals, and also the documentation of different restrictions. It is
common practice for various provincial and federal agencies to be in possession of such
considerable information with regards to natural and biological resources. The situation is
essential in determing the helplessness of the above-mentioned capitals to stages of water
shortage resulting after the drought. Water is regarded as the greatest logical and important
natural source, in terms of station, quality and ease of access.
Biological resources refers to amount and quality of wildlife, rangelands or grasslands, forest and
others. Human resources consist of labour that is necessary to improve water resources, laying
of pipe lines, hauling of water and livestock feed, processing of citizen complaints, providing
technical assistance and directing citizens to the available services.
Step 5: Establish and write drought plan
The step describes the process of establishing relevant committees that will be responsible for
the development and writing of the drought strategy. The drought strategy ought to consist of
three primary components, namely prediction, monitoring, risk and impact assessment, early
warning and prediction, as well as mitigation and reaction.
Monitoring committee
The availability of reliable water assessment and its point of view, short and extended period, is
regarded as treasured information during both arid and rainy days. Dedicated team for supervision
must consist of the legislative body from organisations that monitor the climate, as well as the
water supply.
Wilhite (2005) adds that information and data on both of the relevant pointers of drought should
be measured in the committee’s evaluation regarding water status quo and point of view,
examples are: rainfall, levels of lake, ground etc. It is advisable in place of the monitoring
committee to hold meetings on a regular basis, particularly before the greatest request season.
Following every gathering, the information have to be made available and circulated to drought
task force, to the appropriate state and national organisations and to the mass media.

50
The presiding officer of the monitoring committee be duty-bound member of the drought task
force. The community have to be given a stable clarification of varying circumstances; observing
working group have to put extra efforts carefully with community information consultants to keep
the community well informed.
According to Wilhite (2005), the chief goals of the monitoring working group stand as follows:
To embrace the feasible meaning of drought that may possibly be used to stage out ranks
of local state or provincial and national state action, in reaction to drought.
To start drought organization zones by the splitting of provincial governments into
manageable district sizes by means of political borders, common hydrological features,
weather-related features and other means, such as drought probability or risks involved.
To advance a drought monitoring method.
The register records amount and quality from the current observation networks, as the
majority of the systems are functioned by State or agencies of the provinces.
To determine the data needs primary users. The development of new data collection
systems, or the adjusting of existing data collection systems, becomes more effective -
particularly when users are consulted earlier and frequently.
To develop or amend the present information distribution system.
Drought reaction team
The moderation and reaction of drought might be the accountability of the drought working
force, or a separate committee might be assigned for the job. The task force, working in co-
operation with monitoring and risk assessment committees is more knowledgeable and vast
experience in understanding reduction methods for drought, risks analysis also decision-
making procedures in relation to drought by entire ranks of government. As has been outlined
earlier, the task force should be composed of the most senior policy-makers and decision-
makers from various spheres of government agencies, as well as main interested party
groups. The situation is therefore in good shape in recommending or implementing mitigation
measures, requesting help from the government through various federal programs.
Prevention measures and reaction by this working group have to be strong-minded for every
major impact sectors that are acknowledged by risk valuation committees. Prior the beginning
of drought, the task force team is expected to inventory all forms of assistance available, so
51
as to provide help on both a short- and long-term basis in reducing the risk of drought. Support
have to be well-defined comprehensively, to embrace all arrangements of technical,
movement and all aid agendas that are obtainable.
Writing drought plan
Wilhite (2005) mention that with the input provided by each committee and working group, the
drought commission force, along using all the support from professionals, writing experts to draft
the drought plan. The moment strategy is drafted, the recommendation is to hold public meeting
or hearings at different venues, so as to reach all the masses and give details of the purpose,
ambition and the operative features of each strategy. The team should have the public information
specialist to organise formulate and update stories, to declare the gatherings, also to convey
general idea of the plan. The plan must not be measured as a fixed document, rather as a vibrant
one and level of communication must be improved to reach all users.
Step 6: Categorise the study needs and fill the organizational gaps
Study requirements and gaps in organzational obligation turn out to be obvious for the duration
of drought planning, the drought working team is expected to bring together a list of these
shortages and come up with endorsements to the suitable person or government body on how to
remedy them. Step number 6 should be performed at the same time as step number 4 and 5.
Step 7: Integrate science and policy
An essential feature of the planning process is integrating the science and policy of drought
management. The policy makers’ understanding of scientific issues, and of technical constraints
involved in dealing with problems related with drought, is frequently limited. Similarly, scientists
usually have a poor understanding of prevailing policy constraints for responding to impacts of
drought. If the planning process is to be successful, communication and understanding between
the scientific and policy-making communities need to be improved. The drought working team
ought to think of several another course of action in bringing these clusters together and ensuring
a solid operational relationship.
Step 8: Publicise the drought plan, build public awareness
If the communication was well handled with the community during the course of the procedure of
forming a drought planner, then there will be usual alertness with regard to drought in broad-

52
spectrum and drought planning through the stage the actual writing begins. The themes that need
to be considered when writing the plan consist of:
In what way the drought strategy is projected to let go drought impacts in equally the
short and long term.
What are the alterations that general public may be requested to create in reaction to
unlike degrees of drought, examples of which include the restrictions in watering the
lawn, washing the car or prohibited irrigation at all.
Step 9: Educational programs
An education in raising awareness of short and long term water supply issues will help the
community to know how to respond to drought when it occurs, and will emphasise that drought
planning does not lose importance during non-drought periods. The information should be readily
available at different levels that will include school, businesspeople, industries, home-owners and
others.
Step 10: Evaluate and revise the drought preparation plan
The last step in the design program is to make a comprehensive set of measures to confirm
sufficient strategy evaluation. Periodic testing, evaluation and updating of the drought plan are
crucial to keep the plan responsive to different needs. To maximise the effectiveness of the
system, two modes of evaluation must be put in place, namely ongoing evaluation and post-
drought evaluation.
Ongoing evaluation
The main purpose of continuous or working assessment is to keep trail of how societal factors
like technology, new research, fresh rules and variations in political management may possibly
affect drought risk and operational aspects of drought plans. Drought risk may be assessed fairly
and frequently, despite the fact that an overall drought plan might not be assessed regularly.
Assessment under simulated drought conditions is suggested prior the drought strategy becomes
operational, and also from time to time thereafter.
Post-drought evaluation
Post-drought evaluation or audit documents involve the analysis and assessment of response
actions of government, non-governmental organisations and others, in how they assist in
53
providing mechanisms that play roles in implementing recommendations for the improvement of
the system. It is not easy to learn from previous successes and blunders if post-drought evaluation
is not in operation, because memory fades away. It would be imperative for post-drought
evaluation to incorporate an analysis of the climatic conditions and environmental features of the
drought; the social and economic consequences; the level to which pre-drought planning has
been useful in lowering the impacts of drought by enabling relief on drought troubled areas, post-
drought recoveries and other weaknesses or problems caused by, or not covered by, the plan.
In ensuring that there is no biased appraisal, governments may take the responsibility to
organizations that are not affiliated to government, like institutions of higher learning or specialised
study institutes.
2.15. SUMMARY
The study has revealed that prolonged drought in Asian countries led to the decline in production
of grain, and resulted in land degradation during the years 2009 and 2010. The arid and semi-
arid regions of India have shown a trending increase in agricultural drought every 3 to 4 years.
Literature has revealed that studies that are centred on influential records point out that drought
is becoming more regular, more strong and has becomes more extensive over the years. The
review has discovered that the severity of prolonged drought was recorded mostly in East Africa,
popularly known as the horn of Africa. The Republic of South Africa, according to literature,
exports massive tons to neighbouring countries, such as Zimbabwe, Lesotho, Botswana and
others. The drought that was most felt by the country in the year 2016 has made the country an
importer of grain, such as maize. This is an indication that there is a trend and increasing level of
drought in South Africa, but literature does not indicate such a trend in the study area. The
evaluation of drought is based on frequecy of its occurance, the area which is affected by it, the
level of damage to the economy, the environment and the social effects. The literature has
revealed how drought impacted on both the socio-economic and environmental aspects of many
parts of the world, but does not reveal these impacts in the study area.
Drought is a natural hazard and it occurs on its own, the change in climate plays a role in
facilitating the hydrological process to take place at rapid speeds, resulting in destructive
incidents, like wildfires. The literature has revealed that high temperatures in summer have the
ability to increase water evaporation and, if the affected area does not receive rainfall for
compensation of lost water, the affected area experiences drought. Literature has further
indicated that climate change is facilitated by increased temperatures and high levels of
54
atmospheric pollution amongst others. However the literature did not indicate such factors as
contribution of drought in the study area. The BBC model of vulnerability was never used in any
literature reviewed, which is why the study opted to validate it in the area.

55
CHAPTER 3: RESEARCH METHODOLOGY
3.1. INTRODUCTION
This chapter explains in detail the research methodology that is being adopted by the study.
Research is a common term, referring to the exploration intended for finding evidence based on
a specified matter (Kothari, 2004). Research is further defined as a regular investigation that helps
to gain new information, based on existing facts (Pandey, 2015). Research methodology helps to
provide direction to research concerning how it is conducted (Ingwenagu, 2016). This chapter has
dealt with research approaches, data collection methods, population and samples, data analysis,
reliability and validity, as well as ethical issues.
3.2. RESEARCH APPROACH AND DESIGN
Quantitative approach
The researcher has used a quantitative approach for the study. Muhammad (2016) defines
quantitative as being numerical in nature, which is mathematically calculated. Its measures the
use of various scales, which are classified as nominal, ordinal, interval and ratio scales,
respectively. These scale of measurement eventually command the statistical procedures (if any)
that will then be used to process data (Leedy & Ormond, 2010). They use a standardised
approach, and use methods such as the surveying and asking of questions.
The method relies on random sampling and structured data collection instruments. The research
method is intended to produce reliable data, statistically, that tells us how many people do or think
something.
Creswell (2013), cited in Mutekwa (2016), defines quantitative as an approach in which the
investigator primarily uses post-positivist claims for developing knowledge (i.e., cause and effect
thinking, reduction to specific variables, hypotheses and questions, making use of measurement
and observation, as well as the testing of theories), it employs strategies of inquiry, such as
experiments and surveys, and collects data on predetermined instruments that produce statistical
data.
The study has established that quantitative research concentrates more on measuring and
analysing variables, so that results are obtained (Apuke, 2017).

56
It consist of the use as well as examination of mathematical data, by means of exact statistical
methods in the direction of response to questions concerning what, where, who, when and how.
Furthermore, it refer to ways of clarifying a matter by means of collecting records in a
mathematical arrangement. The study in addition, conceals that numerical ways and means might
be categorised into correlational research, experimental research, survey research and causal-
comparative research.
The advantages of using quantitative research is that it is useful when there is a need to collect
quantities of data. Its results are in a numerical form and are regarded to be more objective. Data
in quantitative research is considered quantifiable, and it can be generalised to a larger
population. Quantitative research further provides clear quantitative measures that can be used
for grants and proposals. Its interviews are normally carried out face to face, which enables the
researcher to create a clear understanding with potential participants and, as a result, their co-
operation is fully gained. The good thing about quantitative research is that the interviews are
done in a more structured manner, whereby the questions asked are standard and nothing more.
3.2.1. Survey
Surveys are normally traditional methods of conducting research, and they are mainly valuable
for non-experimental descriptive designs that pursue to define certainty (Mathers, Fox & Hunn,
2009). The survey research is further defined as a method of descriptive research, which is used
for the collection of primary data that is centred on verbal or written communication with the
representative sample of individuals or respondents from the targeted population (Mathiyazhagan
& Nandan, 2010). The survey approach is regularly used to collect the information that is based
on attitudes and behavioural patterns (Mathers et al., 2009). Mathers (2009) further indicates that
surveys might take several forms, and surveying the entire population is identified as census.
However, in general, surveys are restricted to a representative sample of the potential group that
the researcher has shown interest in, which was based on practicality and cost-effectiveness.
The advantage of using survey is that it is based on random sampling techniques that produce
the samples which become the representatives of a particular population under the study and the
result is, therefore, generalised to the wider population. The survey is efficient by using random
sampling techniques to recruit participants, in which a relatively small sample is then used to
generate the findings that are used to draw conclusions about the entire population. Samples that

57
are widely spread, geographically speaking, can be covered when conducted through the usage
of various methods, comprising of mail questionnaires as well as telephonic interviews, which
means surveys can reach many participants, irrespective of their geographical locations. It is a
more flexible approach to research, and is much easier to combine by means of additional means
to come up with rich information through the use of diaries, focus groups or in-depth interviews.
It has a more ethical advantage, because most of the studies ensure not to expose
participants.The method in which data is collected is faster and saves time.
3.3. DATA COLLECTION TECHNIQUE
Online sources were used to collect data, especially concerning precipitation in the study area,
and a questionnaire for field data collection was developed and used through self-administration
with the help of research assistants. The questionnaire is frequently used as a thoughtful portion
of a tool that helps to collect individual’s information and views (Hopkins & Antes, 1990). To obtain
correct data, the questionnaire had to be well developed and carefully revised.
3.3.1. The role of questionnaire
Bryman and Bell (2007), as well as Hague (1993), as cited in Mabunda (2012), described the
questionnaire as a vehicle in which people are asked questions in a form of an interview, whereby
the participants are provided with a form used to record all the answers. Hague (1993), cited in
Mabunda (2012), provided four drives of questionnaire that are given attention during the
selection of the medium of data collection, namely;
(i) Representation of the correct evidence obtained from the respondents by means of
enquiring the precise questions to releavant individual.
(ii) It provides structure to the candidate in ensuring the smooth flow of information, in an
orderly manner.
(iii) It makes available an ordinary set-up on which comments, attitudes and truths can be
noted down.
(iv) It accelerates the processing of data.
3.3.2. Types of questionnaire To date, three types of questionnaire are acknowledged and used by most researchers, according
to Hague (1993), as cited in Olayele (2010), which are as follows: a structured questionnaire, a

58
semi-structured questionnaire and an unstructured questionnaire. The researcher has used a
structured questionnaire for the purpose of the study.
3.3.3. Structured questionnaire In organised surveys, the investigator set out exactly the phrasing of the queries in an arranged
manner in which they were to be questioned. The majority of the enquiries have pre-determined
type of response and there is less latitude for a respondent to stray from them. Planned
questionnaires are the foundation of huge numerical studies. The study used structured
questionnaire.
3.4. DATA ANALYSIS AND PRESENTATION
The Statistical Package for Social Science (SPSS) was used to work out the descriptive statistics,
including the use of excel to capture the collected data. Several software programs, such as JASP
(Jeffery’s Amazing Statistical Program) for the collected data from respondents, DMAP (Drought
Monitoring and Prediction) for drought quantification and characterisation, PAST (Paleontological
Statistics) for monotonic trend patterns present in the precipitation data set and, lastly, the Mann
Kendall test was utilised by the researcher to analyse and present the data. Raw data from
structured research questionnaires used during data collection with Mantsopa livestock producers
was manually entered into the SPSS, and a codebook will be established to enable data capturing.
The questions were presented in four units (section A-D). They were associated to the study
questions, aims and goals of the study.
The researcher has used JASP software to analyse data that was collected from the respondents.
It is also used for graphical software packages in basic arithmetical processes, for instance t tests,
ANOVAs (Analysis of Variance), linear regression models, and analyses of contingency tables
(Love et al., 2019). The software is particularly accurate in the arena of statistical analysis, mainly
for the following three advantages: Firstly, the availability of the source codes makes it easy for
the researchers to probe the adequacy of the underlying algorithms for the establishment of
whether or not program’s results can be trusted. Secondly, its openness ensures the freedom of
researchers to extend and make adjustments to an existing work and, finally, because it is open-
source, it can be freely shared from one researcher to another, at no costs.
The importance of DMAP is to quantify the severity of drought, to detect the beginning and the
end period of drought, which will be useful for early warning systems, as well as for monitoring
59
and planning water resources (online). The advantage of using DMAP is to provide drought
information that is based on numerous drought indicators (Hao, Agha, Kouchak, Nakhjiri &
Farahmand, 2014). It further make available evidence on meteorological and agricultural drought,
which is based on various satellite as well as precipitation and soil moisture data sets. It includes
the past drought harshness records from the monitoring component and seasonal probabilistic
forecasts predictions. The probabilistic forecasts play a major role in providing crucial information
for early warning that helps to arrange preventative measures and plan mitigation strategies in
advance. Once the data is presented, it is then useful as an instrumental in reducing the impact
of drought.
PAST (Paleontological Statistics) software was used during spreadsheet data integration.
According to Hammer, Harper & Ryan (2001), the advantage of using PAST is that the software
is freely available and it therefore provides users with a well-articulated and easy-to-use package
that supports a wide range of algorithms. The software is quite easy to use in quantitative research
methods, and it comes with different numbers of example data sets to make it a complete
educational package.
The Mann Kendall test is normally employed when detecting monotonic trends in series of
environmental data or hydrological data (Pohlert, 2018). Literature has made available numerous
trend assessment approaches, but the Mann-Kendall test is the most widely utilised test,
especially in studies whereby hydro-climatic trends are assessed (Rawshan, Kuriqi, Abubaker &
Kisi, 2019). Rawshan et al. (2019) and Di-Giuseppe, Pasqui, Magno & Quaresima (2019), agree
that the Mann-Kendall test is recommended by the entire World Meteorological Organisation, and
is frequently used because it has various advantages, such as data distribution consideration,
and it has the ability to cope with the outliers and requires fewer assumptions than the parametric
test.
Confirmatory Factor Analysis (CFA) was adopted by the researcher to confirm and to construct
validation of the BBC model that was adopted in the study. The purpose of CFA was to translate
the predicted factor structure of observed variables into a complete covariance matrix (Prudon,
2015). Lani (2010) describes Confirmatory Factor Analysis as a multivariate statistical technique,
used mainly to observe how well the measured variables represent the number of constructs. The
CFA is used by researcher to specify the number of factors required in the data and also to
determine which of the measured variables are related to which latent variables. It is basically the

60
tool that is used to confirm or reject the theory of measurement. It is astatistical strategy that is
used to model the sources of variability that are not measured in a set of scores (Hoyle, 2012).
The researcher has applied Principal Factor Analysis (PFA) in the study. To analyse the
correlation that exists between variables in a set of data, the principal factor analysis is applied to
reduce variables into smaller amounts of factors (Leiononen, 2019). The PFA is a dimension
reduction tool that is used to reduce a huge set of variables into a smaller set and still contains
most of the information without losing the initial meaning
3.5. DATA RELIABILITY AND VALIDITY
Reliability (SPSS) Cronbach Alpha and McDonald Omega were used in the study. It has been
publicised that Alpha was developed by Cronbach in the year 1951, with the aim of providing a
measurement of the internal consistency of a test scale; it is expressed as a number between 0
and 1 (Tavakol & Dennick, 2011). Cronbach is a system of statistics that is quoted by authors
and used to demonstrate that tests and scales that have been constructed or adopted for the
purpose of research projects are fit (Taber, 2016). The purpose of internal consistency is to
describe the extent to which all the items in a test measure the same concept, and hence it is
connected to the inter-relatedness of the items within the test. Tavakol et al. (2011), emphasise
that, to guarantee legitimacy, internal steadiness ought to be determined earlier than the test
could be employed for research purposes. The reliability estimates indicate the amount of
measurement error present in a test.
The coefficient of both Cronobach Alpha and Mcdonald Omega are believed to be the most used
measures of composite reliability (Zhang & Yuan, 2016). They both stand their own assumptions
when measuring reliability.
Validity is used to explain how well the collected data covers the area of the study to measure
what is supposed to be measured (Taherdoost, 2016). The data was collected at the same time,
using the same instruments in a similar environment, so as to obtain the homogenous.
3.6. POPULATION
The study was conducted in Mantsopa Municipality under the Thabo-Mofutsanyana District, in
Free State province of South Africa, with small-scale livestock producers. The study was
conducted using simple random sampling techniques, to ensure that all members of the targeted
population were given equal opportunity to be chosen (Alvi, 2016). The targeted sample for this
61
study was between 50 and 60 respondents out an estimated 270 livestock producers in the study
area but response was good and received 74 respondents. A structured questionnaire was
designed and administered during the study interviews.
3.7. SUMMARY The chapter clarrified study approaches, techniques in collection of data, capturing of data and
techniques in data analysis. The design of the questionnaire was explained in details. The
succeeding chapter presents study outcomes.

62
CHAPTER 4: DATA ANALYSIS AND PRESENTATION
4.1. INTRODUCTION
This chapter presents the actual results of the study with detailed discussions
The focal drive of this study was to determine the effect of drought on small-scale livestock
producers, in Mantsopa Municipality, in the Free State Province of South Africa. The specific
objectives were to determine levels and trends of agricultural drought in the study area, validate
the BBC model used in the study area, determine major factors contributing to drought in the area,
provide government and all relevant stakeholders with the current drought levels, trends and
major contributing factors for mitigation and adaptation measures. This chapter discusses these
issues in preliminary data analysis, data analysis and, finally, summarises the chapter.
4.2. PRELIMINARY DATA ANALYSIS
Figure 4.1: Tweespruit precipitation plot (elevation 1654.75 meters)
Figure 4.1 above indicates that there is a trend existence with regard to rainfall from the year 1981
to 1993 in the study area, whereby P-value = 0.04983 and ˂ 0.05. The trend shows that rainfall
decreases over the years. The decrease in rainfall implies the increase in drought intensity and
0
50
100
150
200
250
300
19
81
19
82
19
83
19
84
19
85
19
86
19
88
19
89
19
90
19
91
19
92
19
93
19
95
19
96
19
97
19
98
19
99
20
00
20
02
20
03
20
04
20
05
20
06
20
07
20
09
20
10
20
11
20
12
20
13
20
14
20
16
20
17
20
18
Pre
cip
itat
ion
(m
m)
Hydrological year
Tweespruit precipitation from (1981-2018)Mann Kendall's test: p-value=0.04983
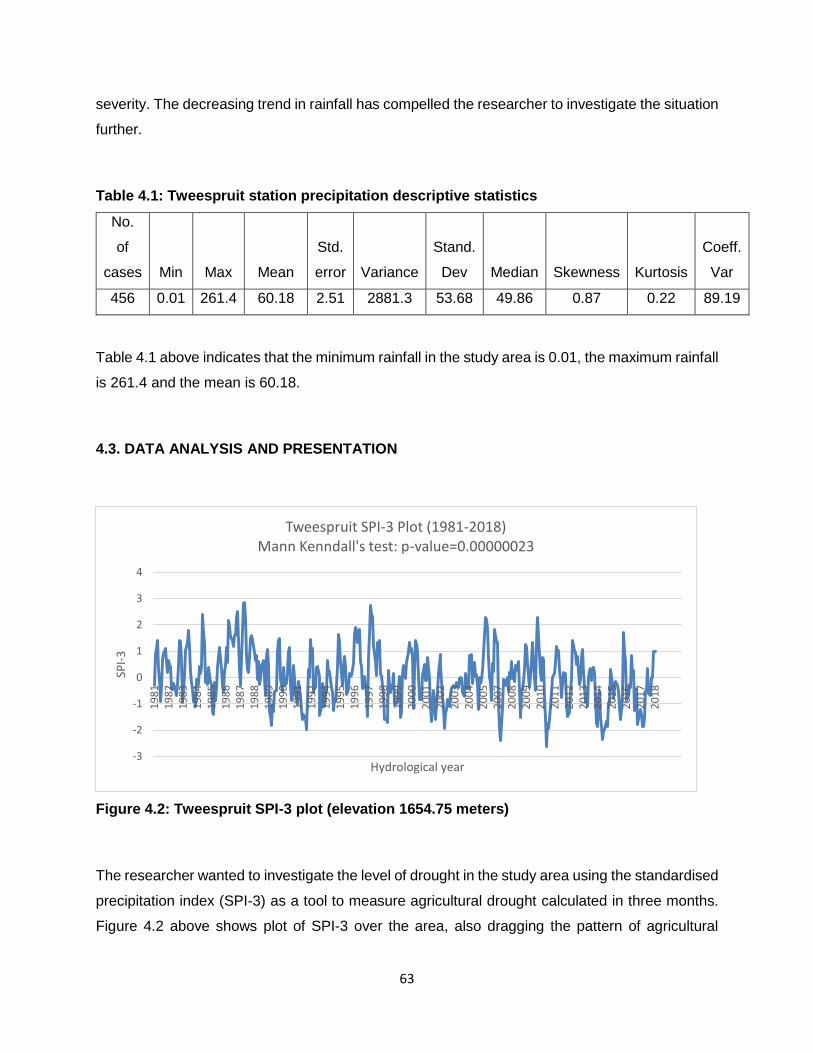
63
severity. The decreasing trend in rainfall has compelled the researcher to investigate the situation
further.
Table 4.1: Tweespruit station precipitation descriptive statistics
No.
of
cases Min Max Mean
Std.
error Variance
Stand.
Dev Median Skewness Kurtosis
Coeff.
Var
456 0.01 261.4 60.18 2.51 2881.3 53.68 49.86 0.87 0.22 89.19
Table 4.1 above indicates that the minimum rainfall in the study area is 0.01, the maximum rainfall
is 261.4 and the mean is 60.18.
4.3. DATA ANALYSIS AND PRESENTATION
Figure 4.2: Tweespruit SPI-3 plot (elevation 1654.75 meters)
The researcher wanted to investigate the level of drought in the study area using the standardised
precipitation index (SPI-3) as a tool to measure agricultural drought calculated in three months.
Figure 4.2 above shows plot of SPI-3 over the area, also dragging the pattern of agricultural
-3
-2
-1
0
1
2
3
4
19
81
19
82
19
83
19
84
19
85
19
86
19
87
19
88
19
89
19
90
19
91
19
92
19
94
19
95
19
96
19
97
19
98
19
99
20
00
20
01
20
02
20
03
20
04
20
05
20
07
20
08
20
09
20
10
20
11
20
12
20
13
20
14
20
15
20
16
20
17
20
18
SPI-
3
Hydrological year
Tweespruit SPI-3 Plot (1981-2018)Mann Kenndall's test: p-value=0.00000023
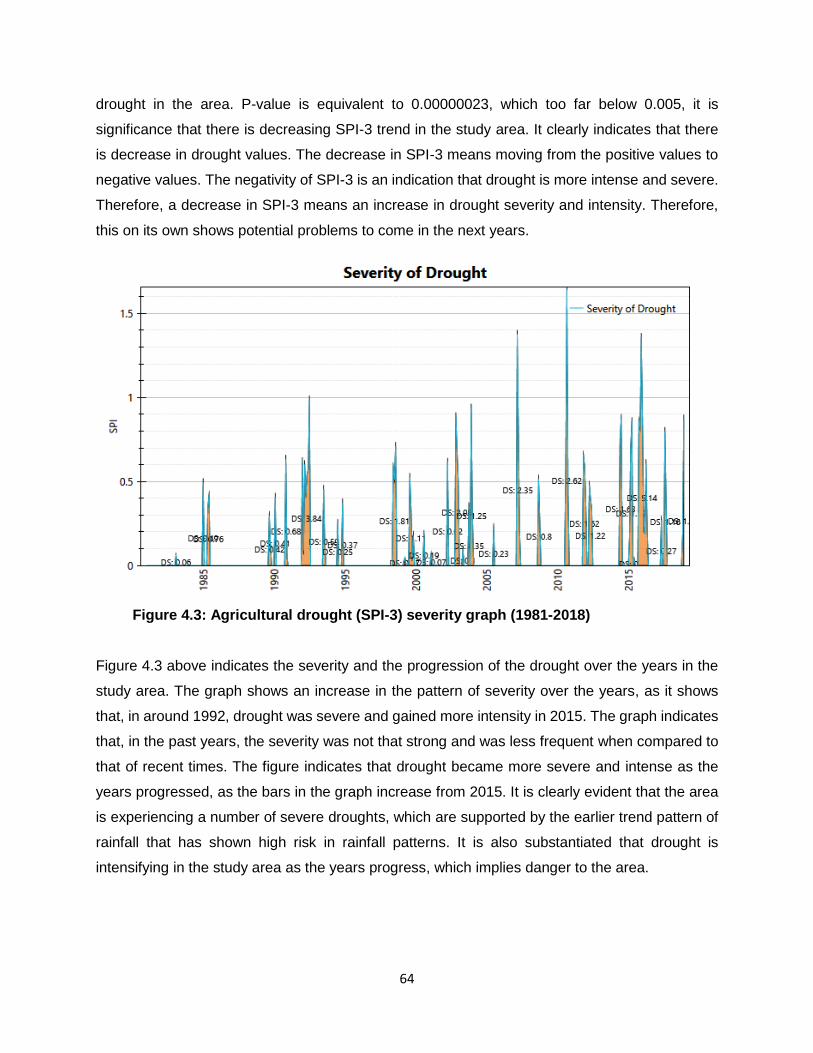
64
drought in the area. P-value is equivalent to 0.00000023, which too far below 0.005, it is
significance that there is decreasing SPI-3 trend in the study area. It clearly indicates that there
is decrease in drought values. The decrease in SPI-3 means moving from the positive values to
negative values. The negativity of SPI-3 is an indication that drought is more intense and severe.
Therefore, a decrease in SPI-3 means an increase in drought severity and intensity. Therefore,
this on its own shows potential problems to come in the next years.
Figure 4.3: Agricultural drought (SPI-3) severity graph (1981-2018)
Figure 4.3 above indicates the severity and the progression of the drought over the years in the
study area. The graph shows an increase in the pattern of severity over the years, as it shows
that, in around 1992, drought was severe and gained more intensity in 2015. The graph indicates
that, in the past years, the severity was not that strong and was less frequent when compared to
that of recent times. The figure indicates that drought became more severe and intense as the
years progressed, as the bars in the graph increase from 2015. It is clearly evident that the area
is experiencing a number of severe droughts, which are supported by the earlier trend pattern of
rainfall that has shown high risk in rainfall patterns. It is also substantiated that drought is
intensifying in the study area as the years progress, which implies danger to the area.
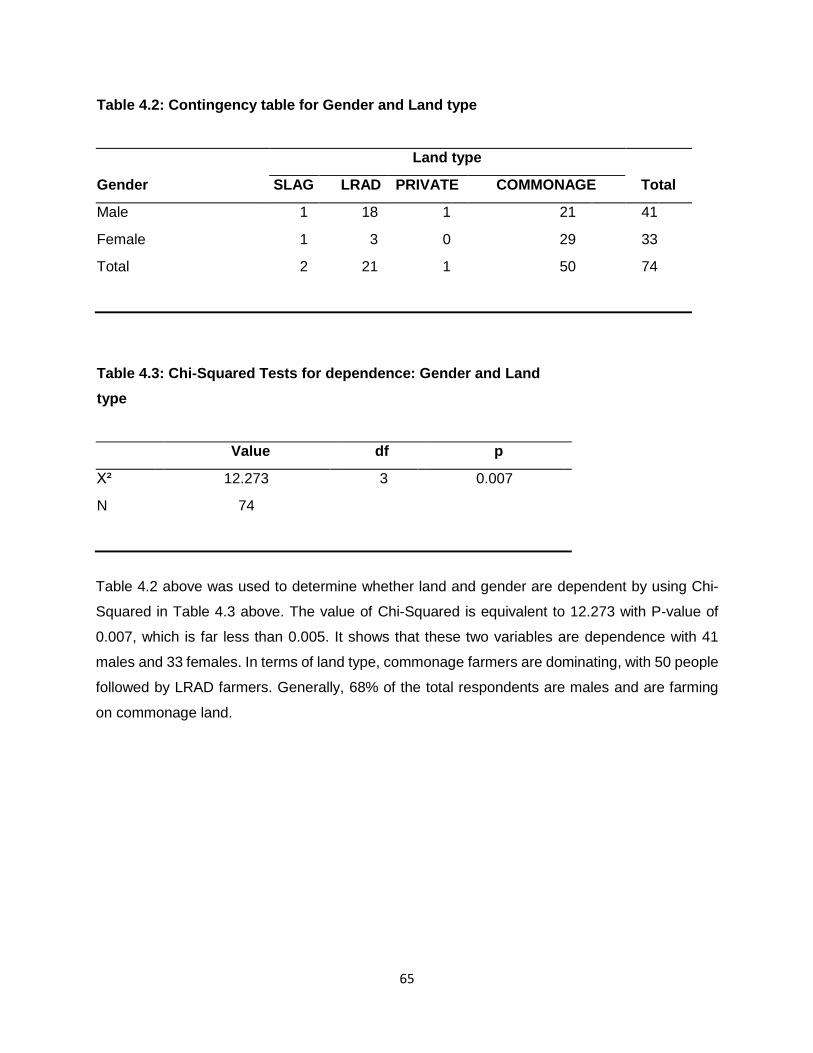
65
Table 4.2: Contingency table for Gender and Land type
Land type
Gender SLAG LRAD PRIVATE COMMONAGE Total
Male 1 18 1 21 41
Female 1 3 0 29 33
Total 2 21 1 50 74
Table 4.3: Chi-Squared Tests for dependence: Gender and Land
type
Value df p
Χ² 12.273 3 0.007
N 74
Table 4.2 above was used to determine whether land and gender are dependent by using Chi-
Squared in Table 4.3 above. The value of Chi-Squared is equivalent to 12.273 with P-value of
0.007, which is far less than 0.005. It shows that these two variables are dependence with 41
males and 33 females. In terms of land type, commonage farmers are dominating, with 50 people
followed by LRAD farmers. Generally, 68% of the total respondents are males and are farming
on commonage land.
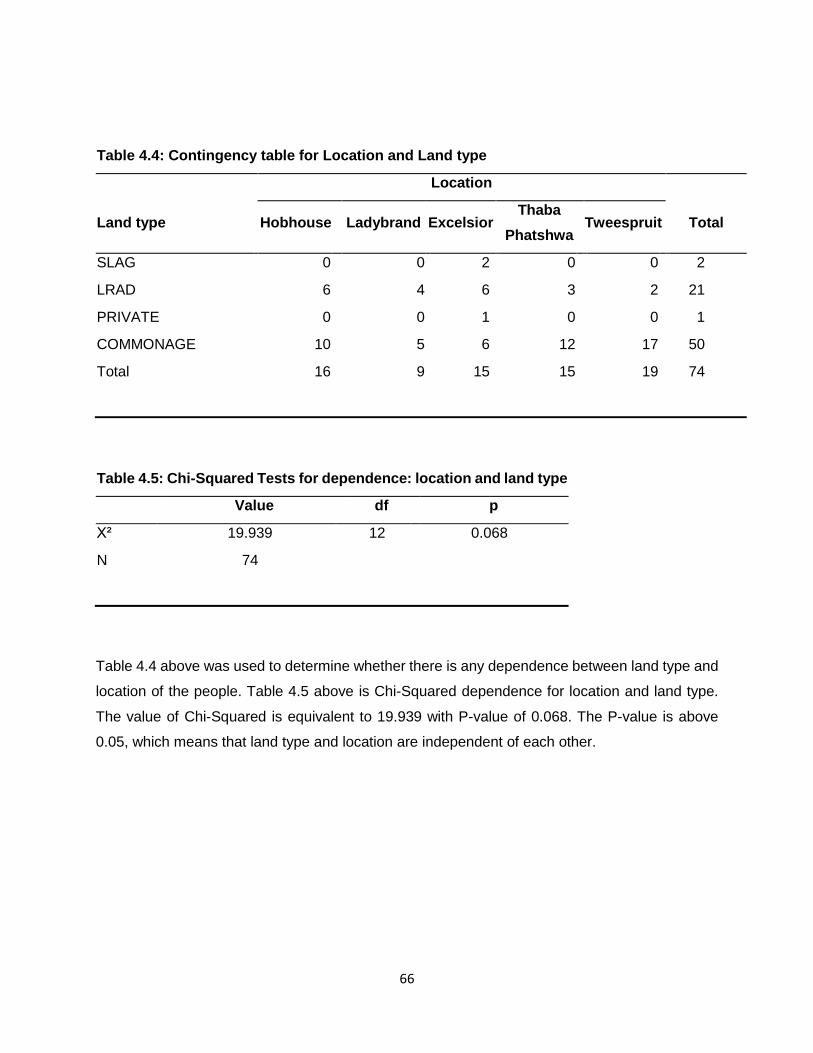
66
Table 4.4: Contingency table for Location and Land type
Location
Land type Hobhouse Ladybrand Excelsior Thaba
Phatshwa Tweespruit Total
SLAG 0 0 2 0 0 2
LRAD 6 4 6 3 2 21
PRIVATE 0 0 1 0 0 1
COMMONAGE 10 5 6 12 17 50
Total 16 9 15 15 19 74
Table 4.5: Chi-Squared Tests for dependence: location and land type
Value df p
Χ² 19.939 12 0.068
N 74
Table 4.4 above was used to determine whether there is any dependence between land type and
location of the people. Table 4.5 above is Chi-Squared dependence for location and land type.
The value of Chi-Squared is equivalent to 19.939 with P-value of 0.068. The P-value is above
0.05, which means that land type and location are independent of each other.
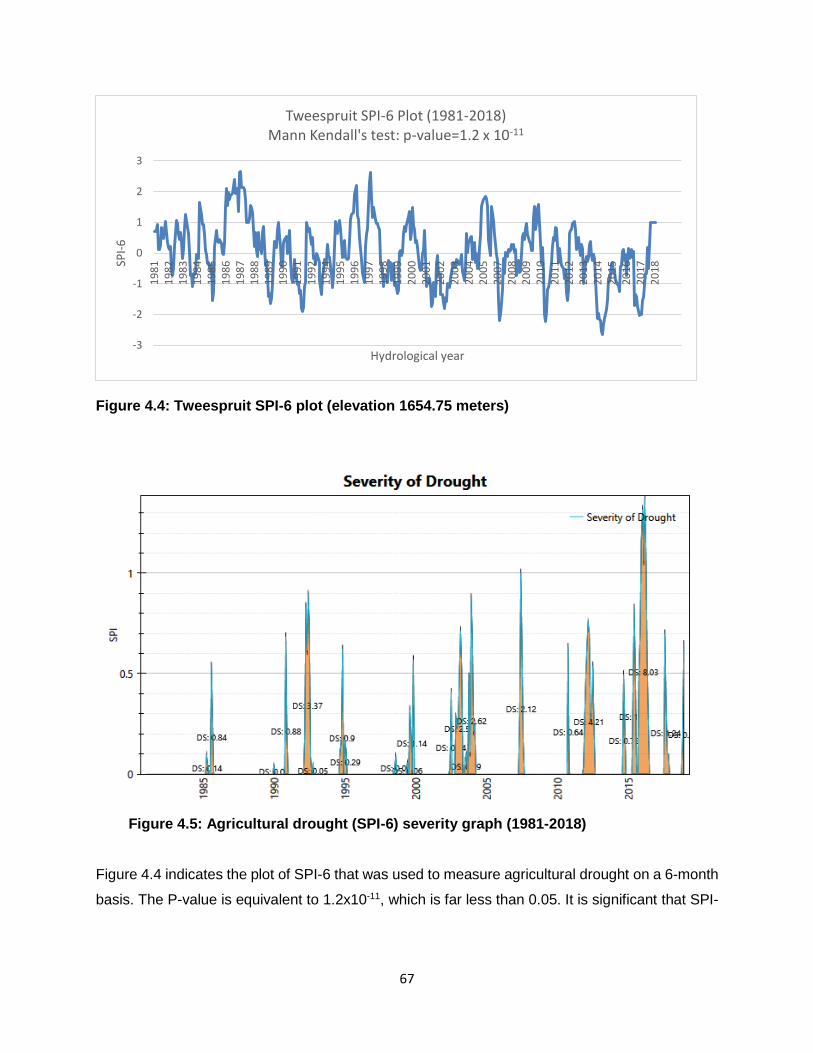
67
Figure 4.4: Tweespruit SPI-6 plot (elevation 1654.75 meters)
Figure 4.5: Agricultural drought (SPI-6) severity graph (1981-2018)
Figure 4.4 indicates the plot of SPI-6 that was used to measure agricultural drought on a 6-month
basis. The P-value is equivalent to 1.2x10⁻¹¹, which is far less than 0.05. It is significant that SPI-
-3
-2
-1
0
1
2
31
98
11
98
21
98
31
98
41
98
51
98
61
98
71
98
81
98
91
99
01
99
11
99
21
99
41
99
51
99
61
99
71
99
81
99
92
00
02
00
12
00
22
00
32
00
42
00
52
00
72
00
82
00
92
01
02
01
12
01
22
01
32
01
42
01
52
01
62
01
72
01
8SPI-
6
Hydrological year
Tweespruit SPI-6 Plot (1981-2018)Mann Kendall's test: p-value=1.2 x 10⁻¹¹

68
6 has decreased to negative values, meaning drought in the study area is a serious problem, and
the next years could be even worse
Figure 4.5 above indicates further increases in severity, with the number of years in the study
area. The graph is dragging the pattern of severity over the years, as it indicates that 2015 and
2016 were the most severe of all the years in the records of drought from 1981 to 2018. The trend
in the study area is more increasing in terms of severity, as shown in Figure 4.5, and is posing
more danger.
According to the statement made by the then-MEC for Agriculture and Rural Development, issued
by Free State Agriculture and Rural Development on the 24 November 2015, the situation has
led to the then-Premier of the Free State Province to declare the Free State as being in a state of
disaster, following the impending countrywide El Nino drought conditions. The province
responded by providing drought relief to the farmers in the form of concentrates and fodder, they
targeted smallholders and subsistence farmers, focusing on communal and commonage land.
Table 4.6: Scale Reliability Statistics
McDonald’s ω Cronbach’s α
Scale 0.873 0.856
Note. Of the observations, 74 were used, 380 were excluded list-wise, and 454 were provided.
Reliability
It remains defined as the constancy of the measurement or the level in which an instrument
measures the same way every time, when it is used under the similar conditions with the same
subject. It can further be defined as the repeatability of measurement, then the research
instrument is considered as reliable (Golafshani, 2003). It is significant to put reliability to test for
the reason that it brings up the consistency throughout parts of gauging instruments (Taherdoost,
2016). Cronbach’s Alpha is regarded as the most frequently used internal consistency, as it is
viewed as the most appropriate measure of reliability especially when the Likert scale is used.
Though Taherdost (2016) emphasises that there are no outright procedures for internal
consistence but a minimum internal consistency coefficient of 70 is recommended.

69
Table 4.6 above indicates that the researcher used two measures being Cronbach’s Alpha and
McDonald’s Omega to measure the reliability of instruments used to collect data from the
respondents. The tool was very reliable, as it has shown the statistics of McDonald raw of 0.873
and Cronbach of 0.856. The reason for using these two was to complement each other, and for
each to cover the other’s weakness.
The indication for Cronbach is that the minimum requirement or acceptable value is 0.7, which is
70%, and the researcher’s is 0.856, which explains that this data instrument is highly reliable.
The researcher had also run item reliability statistics, just to determine whether one item could be
deleted from Table 4.7 below, in order to increase the reliability on both McDonald and Cronbach
but, given that reliability was already above 80% for both tests with the acceptable value of 70%
or 0.7, it was unnecessary to delete any item. Therefore, the researcher has reached the
conclusion that the collected data was highly reliable.

70
Table 4.7: Item Reliability Statistics
If item dropped
item-rest correlation McDonald’s ω Cronbach’s α
Q1 -0.170 0.886 0.862
Q2 0.298 0.874 0.856
Q3 0.146 0.878 0.859
Q4 -0.435 0.891 0.885
Q5 -0.440 0.891 0.869
Q6 0.245 0.876 0.866
Q7 -0.318 0.891 0.874
A8 -0.067 0.884 0.865
Q9 0.223 0.876 0.858
Q10 0.751 0.855 0.838
Q11 0.749 0.855 0.837
Q12 0.841 0.850 0.833
Q13 0.859 0.849 0.832
Q14 0.864 0.849 0.831
Q15 0.882 0.847 0.831
Q16 0.852 0.849 0.832
Q17 0.843 0.849 0.832
Q18 0.783 0.853 0.835
Q19 0.688 0.858 0.839
Q20 0.742 0.856 0.837
Table 4.8: Confirmatory factor analysis model fit: Chi-Square test
Model Χ² df p
Baseline model 985.905 66
Factor model 117.152 51 < .001
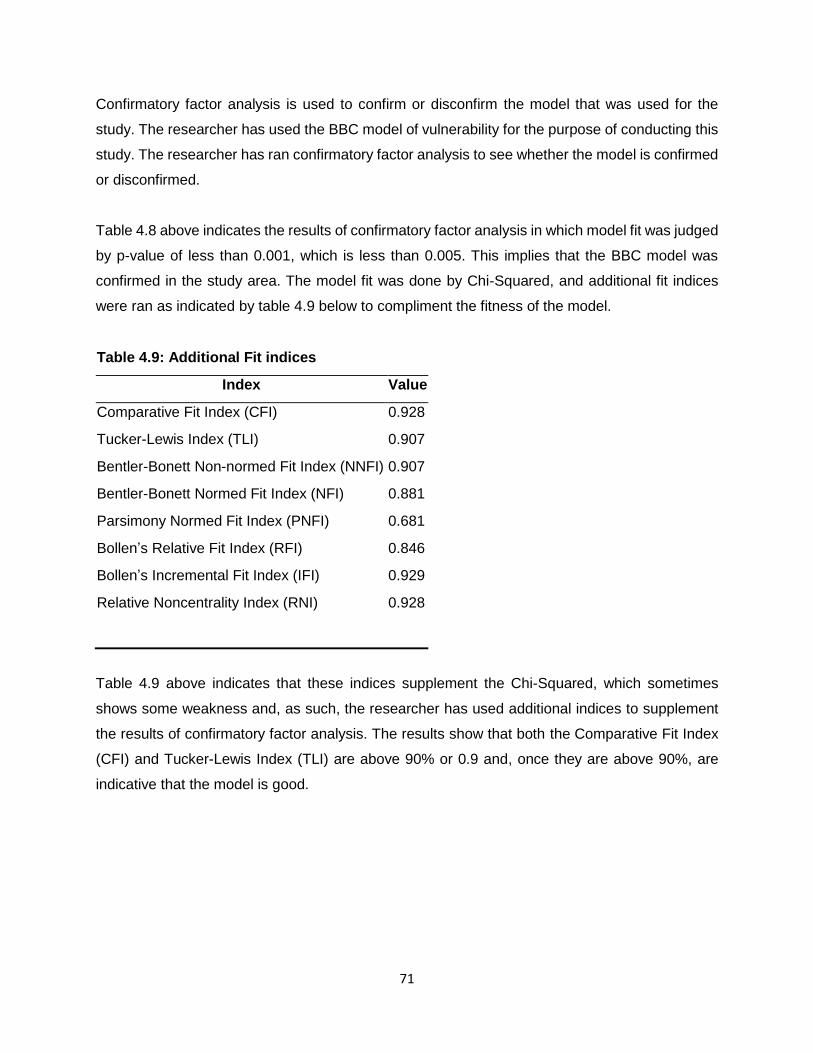
71
Confirmatory factor analysis is used to confirm or disconfirm the model that was used for the
study. The researcher has used the BBC model of vulnerability for the purpose of conducting this
study. The researcher has ran confirmatory factor analysis to see whether the model is confirmed
or disconfirmed.
Table 4.8 above indicates the results of confirmatory factor analysis in which model fit was judged
by p-value of less than 0.001, which is less than 0.005. This implies that the BBC model was
confirmed in the study area. The model fit was done by Chi-Squared, and additional fit indices
were ran as indicated by table 4.9 below to compliment the fitness of the model.
Table 4.9: Additional Fit indices
Index Value
Comparative Fit Index (CFI) 0.928
Tucker-Lewis Index (TLI) 0.907
Bentler-Bonett Non-normed Fit Index (NNFI) 0.907
Bentler-Bonett Normed Fit Index (NFI) 0.881
Parsimony Normed Fit Index (PNFI) 0.681
Bollen’s Relative Fit Index (RFI) 0.846
Bollen’s Incremental Fit Index (IFI) 0.929
Relative Noncentrality Index (RNI) 0.928
Table 4.9 above indicates that these indices supplement the Chi-Squared, which sometimes
shows some weakness and, as such, the researcher has used additional indices to supplement
the results of confirmatory factor analysis. The results show that both the Comparative Fit Index
(CFI) and Tucker-Lewis Index (TLI) are above 90% or 0.9 and, once they are above 90%, are
indicative that the model is good.

72
Table 4.10: Factor Covariances
95% Confidence Interval
Estimate Std. Error z-value p Lower Upper
SC ↔ EC 0.914 0.029 31.335 < .001 0.857 0.971
SC ↔ ENV 0.820 0.050 16.554 < .001 0.723 0.917
EC ↔ ENV 0.906 0.029 31.228 < .001 0.849 0.963
Given that the model was confirmed with major variables, namely social dimension (SC),
economic dimension (EC) and environmental dimension (ENV), the researcher in table 4.10
wanted to determine how these variables relate to each other in as far as drought is concerned.
Figure 4.6: Confirmatory factor analysis model
Figure 4.6 above indicates the confirmatory factor model for social, economic and environmental
variables, whereby 0 to 0.4 is weak, 0.5 is moderate, 0.6 and above is strong. Therefore,
correlation is very strong between economic and environment, and also between social and
economic, but the correlation between the environmental dimension and social dimension are
somewhat weaker as compared to the links between the rest of variables. This implies that using
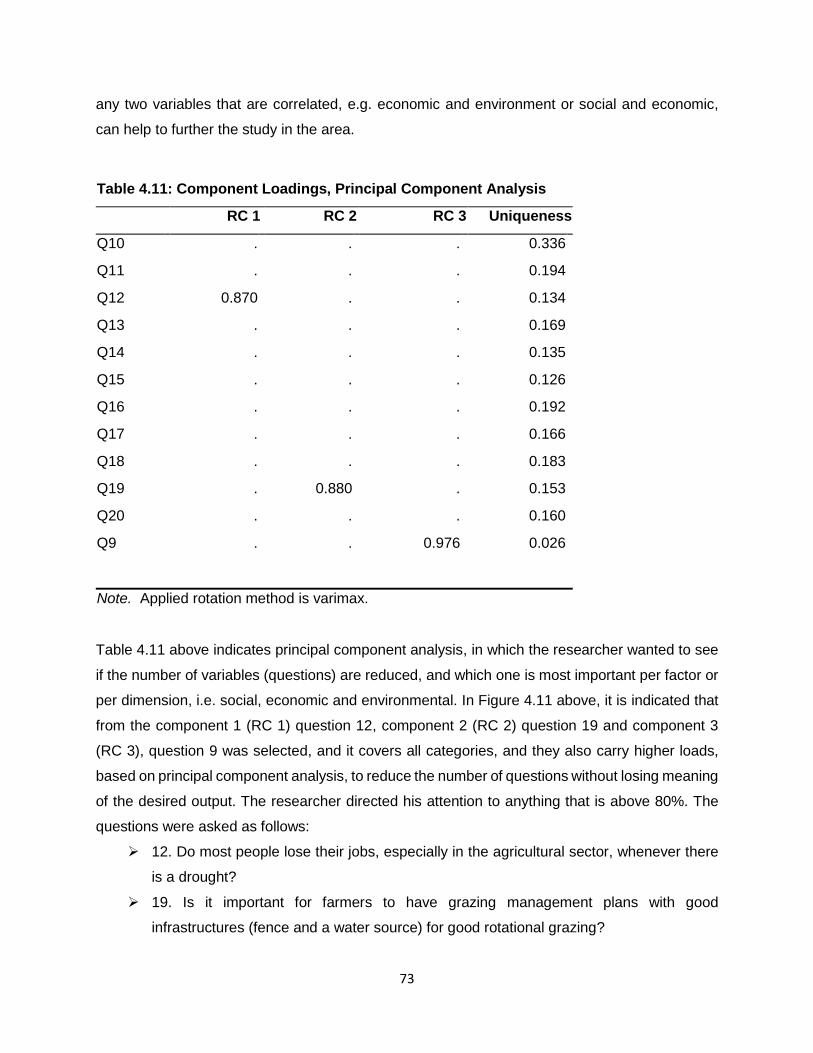
73
any two variables that are correlated, e.g. economic and environment or social and economic,
can help to further the study in the area.
Table 4.11: Component Loadings, Principal Component Analysis
RC 1 RC 2 RC 3 Uniqueness
Q10 . . . 0.336
Q11 . . . 0.194
Q12 0.870 . . 0.134
Q13 . . . 0.169
Q14 . . . 0.135
Q15 . . . 0.126
Q16 . . . 0.192
Q17 . . . 0.166
Q18 . . . 0.183
Q19 . 0.880 . 0.153
Q20 . . . 0.160
Q9 . . 0.976 0.026
Note. Applied rotation method is varimax.
Table 4.11 above indicates principal component analysis, in which the researcher wanted to see
if the number of variables (questions) are reduced, and which one is most important per factor or
per dimension, i.e. social, economic and environmental. In Figure 4.11 above, it is indicated that
from the component 1 (RC 1) question 12, component 2 (RC 2) question 19 and component 3
(RC 3), question 9 was selected, and it covers all categories, and they also carry higher loads,
based on principal component analysis, to reduce the number of questions without losing meaning
of the desired output. The researcher directed his attention to anything that is above 80%. The
questions were asked as follows:
12. Do most people lose their jobs, especially in the agricultural sector, whenever there
is a drought?
19. Is it important for farmers to have grazing management plans with good
infrastructures (fence and a water source) for good rotational grazing?

74
9. Should farmers move their livestock to less distressed farms or to alternative grazing
lands whenever they experience drought?
This implies that if there is a limited time for a study to be conducted in the area, the above three
mentioned questions alone could provide a clear and general picture in as far as drought is
concerned in the study area, without losing the meaning. The rest of the questions might be
removed, but not the aforementioned three.
4.4. SUMMARY
This chapter presented research results in the study area, which indicate that there is a trend
pattern of decreasing rainfall over the years, using Mann Kendall’s test. The decrease in rainfall
implies an increase in drought intensity and severity, both of which pose a serious danger to the
agricultural sector in the area. The trend pattern indicates that, from 2015, the severity and
intensity of drought has increased as rainfall continues to decrease.
The BBC model was used in the study, and it was confirmed to be good, as confirmatory analysis
was run for verification. The major variables of the study also confirmed the model with their
correlation to each other regarding the drought in the area of study.
75
CHAPTER 5: CONCLUSION AND RECOMMENDATIONS
5.1. CONCLUSION
The Mann Kendall trend pattern that was applied in the study area to look at behavioural patterns
in the rainfall has indicated that the decrease in rainfall, as the years progress, increases the
chances of drought. The severity of drought poses a serious threat to farmers in the study area,
as it has indicated that the year 2015 was the worst in the history of drought from the year 1991.
The severity of drought has increased drastically from 2015 and, ever since, the situation was
never better with regard to rainfall.
The BBC model of vulnerability was used in the study and confirmatory factor analysis was run,
just to verify whether the model has been confirmed or not, and it was confirmed to be good for
the study. The model was further confirmed by the additional fit indices, in order to complement
its fit, it was validated and confirmed that both CFI and TLI are above 90%, as an indication of
how good the model is. The major variables also confirmed the model and indicated their
correlation to each other with regard to drought in the area of study.
5.2. RECOMMENDATIONS
The standardised precipitation index (SPI-3) was used as a tool to measure agricultural drought
in the study area, calculated on a three-month basis, and it has shown the progression of drought
as the years progress. The continuous decrease in SPI-3 is an indication that drought is more
intense and severe. Drought severity and intensity in the study area highlights the need for proper
planning by relevant stakeholders, including government departments. Disaster risk reduction
(DRR) by mitigating the impact of drought will help the farmers in the study area. Mitigation
strategies, such as training all stakeholders involved in the agricultural sector to read and interpret
trends of agricultural drought and monitoring, would be advantageous to all involved. Monitoring
of agricultural drought is needed to provide advice to farmers for decision-making, in terms of
promoting good agricultural practices to prevent loss.
The BBC model proved to be fit in the study area. The study was conducted at the local
municipality of Mantsopa within Thabo Mofutsanyana District. The model is, therefore,
recommended to be further validated at district-level by expanding the study. The purpose of
76
expanding the study will be to promote disaster risk reduction (DRR) in the agricultural sector, in
as far as drought is concerned.
77
LIST OF REFERENCES
Abraha, M.T., Shimelis, H.A., Laing, M.D. & Assefa, K. (2017). Selection of drought-tolerant tef
(Eragrostis tef) genotypes using drought tolerance indices.
Agri SA (2016). A rain drop in the drought: Report to the Multi-Stakeholder Task Team on the
Drought, Agri SA’s status on the current drought crisis.
Alvi, M. (2016). A Manual for Selecting Sampling Techniques in Research.
Apuke, O.D. (2017). Quantitative Research methods: A Synopsis Approach.
Atikson, D. & Buscher, B. (2006). Municipal commonage and implications for land reform: A
profile of commonage users in Philippolis, Free State, South Africa: 437-466.
Baas, S., Ramasamy, S., Dey De Pryck, J. & Battista, F. (2008). Disaster Risk Management
System Analysis: A guide book, FAO. Available from: https://www.medbox.org/disaster-risk-
management-systems-analysis-a-guide-book/download.pdf [08/09/2019]
Barbara, G., Schreiner, E., Mungatana, D. & Baleta, H. (2018). Impacts of Drought Induced
Water Shortages in South Africa: Sector Policy Briefs.
Barriopedro, D., Gouvela, C.M., Trigo, R.M. & Wang L. (2012). The 2009/10 Drought in China:
Possible Causes and Impacts on Vegetation.
Baudoin, M.A., Voge, C., Nortje, K. & Naik, M. (2017). Living with drought in South Africa:
lessons learnt from the recent El Niño drought period.
Bezuidenhout, R. (2015). Veld Management Systems that are Sustainable.
Beukes, R. (2016). Soya production vs. Maize production.
Birkmann, J. (2013). Measuring vulnerability to natural hazards: Towards Disaster Resilient
societies. 2nd edition.

78
Blauhut, V., Stahl, K., Stagge, J.H., Tallaksen, L.M., De Stefano, L. & Vogt, J, (2016). Estimating
drought risk across Europe from reported drought impacts, drought indices, and vulnerability
factors.
Bouraoul, R. & Ben Salem, M. (2009). Heat Stress in Tunisia: Effects on dairy cows and
potential means of alleviating it: 256-259.
Brand, R.F., Brown, L.R. & Du Preez, P.J., (2011). The Grassland vegetation of Platberg,
Eastern Free State, South Africa, Koedoe 53(1), Art. #1027, 13 pages.
http://dx.doi.org/10.4102/koedoe. v53i1.1027
Cook, B.I., Cook, E.R., Smerdon, J.E., Seager, R., Williams, A.P., Coats, S., Stahle, D.W. &
Díaz, J.V. (2016). North American mega droughts in the Common Era: reconstructions and
simulations.
Cooley, H., Donnelly, K., Phurisamban, R. & Subramanian, M. (2015). Impacts of California’s
ongoing Drought: Agriculture
Dai, A. (undated). Drought under global warming: a review. Available from:
http://www.cgd.ucar.edu/cas/adai/papers/Dai-drought_WIRES2010.pdf [26/08/2019]
Department of Environmental Affairs (DEA). (2010). Climate Change: A Critical Emerging
Issue.
Di Giuseppe, E., Pasqui, M., Magno, R. & Quaresima, S. (2019). A Counting Process Approach
for Trend Assessment of Drought Condition.
Du Pisanie, K. (2016). Stock farm,vol. 6, no. 8, pp.26-27
El Chami, D & El Moujabber, M, (2016). Drought, climate change and sustainability of water in
agriculture: A roadmap towards the NWRS2. S Afr J Sci. 2016; 112(9/10), Art. #2015-0457, 4
pages. http://dx.doi.org/10.17159/ sajs.2016/20150457.
79
European Environment Agency. (2009). Water resources across Europe - confronting water
scarcity and drought.
European Commission. (2010). Water Scarcity and Drought in the European Union.
FAO. (2018). Drought Characteristics and Management in the North Africa and the Near East.
Folger, P., Cody, B.A. & Carter, N.T. (2013). Drought in the United States: Causes and Issues
for Congress.
Folger, P. (2017). Drought in the United States: Causes and Current Understanding.
Food and Agriculture Organization of the United Nations. (2018).
Free State Provincial Spatial Development Framework (PSDF). (2013). National Department
of Rural Development & Land reform in collaboration with Free State Department of the premier
& Free State Department of co-operative governance & traditional affairs.
Golafshani, N. (2003). Understanding reliability and validity in qualitative research. The
Qualitative Report, 8(4), 597-606. Available from: http://www.nova.edu/ssss/QR/QR8-
4/golafshani.pdf [28/11/2019].
Golmohammadi, F. (2012). Drought and its Environmental and Socio-Economic impacts in the
viewpoint of farmers in south Khorasan province-East of Iran.
Hammer, O., Harper, D.A.T. & Ryan, P.D. (2001). PAST: Paleontological Statistics Software
Package for Education and Data Analysis. Available from: https://paleo-electronica.org/2001-
1/past [23/11/2019].
Hao, Z., AghaKouchak, A., Nakhjiri, N & Farahmand, A. (2014). Global integrated drought
monitoring and prediction system.
Hensley, M., Le Roux, P., Du Preez, C., Van Huyssteen, C., Kotze, E. & Van Rensburg, C.
(2006). Soils: Free State Agricultural Base, 88(1): 11-21.
80
Hopkins, C.D. & Antes, R.L. (1990). Educational research. A structure for enquiry, 3rd Edition.
Hoyle, R.H. (2012). Confirmatory Factor Analysis.
Huho, J.M. & Mugalavai, E.M. (2010). The Effects of Droughts on Food Security in Kenya.
Ingwenagu, C. (2016). Fundamentals of Research Methodology and Data Collection.
Introduction to Principal Components and Factor Analysis. Available from:
ftp://statgen.ncsu.edu/pub/thorne/molevoclass/AtchleyOct19.pdf [18/01/2020].
ISDR. (2005). Drought Living with risk: An Integrated Approach to reducing social vulnerability
to drought, International Strategy for Disaster Reduction., p. 10. doi: 10.5194/acp-2016-166.
ISDR. (2009). Drought Risk Reduction Framework and Practices, contributing to the
implementation of the Hygo framework for action.
Islam, A.K.M.N. & Sultan, S. (2014). Climate Change and South Asia: What Makes the Region
Most Vulnerable.
Jamala, G. Y., Mada, D. A., Abraham, P. & Joel, L. (2013). Socio-Economic Impact of
Desertification on Rural Livelihood in Ganye South-eastern Adamawa State, Nigeria.
Jordaan, A., Bahta, Y.T. & Phatudi-Mphahlele, B. (2019). Ecological vulnerability indicators to
drought : Case of communal farmers in Eastern Cape. South Africa Research methodology, pp.
1–11.
Jordaan, A., Sakulski, D. & Jordaan, A. (2013). Interdisciplinary drought risk assessment for
agriculture: the case of communal farmers in the Northern Cape Province, South Africa
VL - 41
Juventine, E.J. (2012). Landslide Hazards: Household Vulnerability, Resilience and Coping in
Bududa District, Eastern Uganda.

81
Keyantash, J. (2002) ‘of Drought : An Evaluation of’, American Meteorological Society,
(August), pp. 1167–1180.
Stahl, K., Kohn, I., Blauhut, V., Urquijo, J., De Stefano, L., Acácio, V., Dias, S., Stagge, J.H.,
Tallaksen, L.M., Kampragou, E., Van Loon, A.F., Barker, L.J., Malsen, L.A., Bifulco, C.,
Musolino, D., de Carlis, A., Massaruto, A., Assimacopoulos, D. & Van Lanen, H.A.J. (2016).
Impacts of European drought events: insights from an international database of text-based
reports.
Khem, C. & Nagaratna, B. (2017). Socio-economic impacts of drought in India. In: Drought
Mitigation and Management. (eds. Suresh Kumar, Tanwar SPS and Singh Akhath), Scientific
Publishers, New Delhi: pp. 245-263
Komba, C. & Muchapondwa, E. (2012). Adaptation to climate change by smallholder farmers
in Tanzania.
Kothari, C.R. (2004). Research Methodology: Methods and Techniques. Second revised
edition.
Kumur, A.R. & Hirway, I. (2007). Multiple Impacts of Droughts and Assessment of Drought
Policy in Major Drought Prone States in India.
Kriel, G. (2016). Farmer’s Weekly, volume 2016. (issue 16047): pp. 38-40.
Lani, J. (2010). Confirmatory Factor Analysis. Available
from:http://www.statisticssolutions.com/academic-solutions/resources/directory-of-statistical-
analyses/confirmatoryfactor-analysis [18/01/2020].
Leedy, P.D & Ormond, J.E. (2010). Practical Research: Planning and Design, 9th edition.
Leinonen, T. (2009). Principal Component Analysis and Factor Analysis: Seminar in Statistics
and Methodology, 25th February, 2009

82
Leister, A.M., Paarlberg, P.L. & Lee, J.G. (2015). Dynamic Effects of Drought on U.S. Crop and
Livestock Sectors.
Losada, M., Gilliland, J., Franco, P., Moraine, M. & Bernués, A. (2016). Focus group mixed
farming system: livestock/cash crops.
Love, J., Selker, R., Marsman, M., Jamil, T., Dropman, D., Verhagen, J., Ly, A., Gronou, Q.F.,
Matzeke, D., Wild, A., Knight, P., Rouder, J.N., Morey, R.D. & Wagenmakers, E.J. (2019).
JASP: Graphical Statistical Software for Common Statistical Designs. Doi:
10.18637/jss.v088.i02.
Mabunda, S.D. (2012). The Socio-Economic Impact of Drought: A case Study of Guwela Rural
Community in Greater Giyani Municipality of The Limpopo Province.
Makhado, R.A., Saidi, A.T. & Tshikhudo, P.P. (2014). Optimising drought adaptation by small-
scale farmers in southern Africa through integration of indigenous and technologically-driven
practices.
Makoti, A. and Waswa, F. (2015). Rural Community Coping Strategies with Drought-Driven
Food Insecurity in Kwale County , Kenya. 3(3), pp. 87–93. doi: 10.12691/jfs-3-3-4.
Manthe-Tsuaneng, M. (2014). Drought Conditions and Management Strategies in Botswana.
Map of Free State indicating Mantsopa Municipality. Available from:
https://municipalities.co.za/provinces/view/2/free-state [29/01/2020].
Map of South Africa indicating provinces. Available from: https://www.sa-
venues.com/maps/south-africa-provinces.htm [29/01/2020].
Maponya, P. & Mpandeli, S. (2012). Climate Change and Agricultural Production in South
Africa: Impacts and Adaptation options. Journal of Agricultural Science, 4(10), 48-60.
Marais, L., Human, F. & Botes, L. (2008). Measuring What? The Utilisation of Development

83
Indicators in the Integrated Development Planning Process, pp. 376-400.
Masekende, S. & Shoko, K. (2014). Drought Coping Strategies and Their Effectiveness : The
Case of Ward 12 in Mberengwa District Zimbabwe, 2(1), pp. 137–152. doi:
10.11114/ijsss.v2i1.299.
Masih, I., Maskey, S., Mussá, F.E.F. & Trambauer, P. (2014). A review of droughts on the
African continent: a geospatial and long-term perspective.
Mathers, N., Fox, N. & Hunn, A. (2009). Surveys and Questionnaires.
Mathiyazhagan, T. & Nandan, D. (2010). Survey Research Method
Mbogo, E., Inganga, F. & Maina, J.M. (2014). Drought conditions and management strategies
in KENYA. Available from:
http://www.droughtmanagement.info/literature/UNWDPC_NDMP_Country_Report_Kenya_20
14.pdf [17/01/2020]
Miyan, M.A, (2014). Droughts in Asian Least Developed Countries: Vulnerability and
sustainability.
Mmbengwa, V.M., Nyhodo, B., Lindikaya, M. & Van Schalkwyk, H. (2015). Communal livestock
farming systems in South Africa: Does this farming system create jobs for poverty stricken rural
areas?
Mniki, S. (2009). Socio-Economic Impact of Drought Induced Disasters on Farm Owners of
Nkonkobe Local Municipality.
Moeletsi, M.E. & Walker, S. (2012). Rainy season characteristics of the Free State Province of
South Africa with reference to rain-fed maize production, pp.775-782.
Mohammed, M. & Dlamini, T. (2018). Predictors of food insecurity in Eswatini: Lessons from
2015/16 El Niño induced drought.
84
Molefi, S. H. & Mbajiorgu, C. A. (2017). Management practices and constraints of beef cattle
production in communal areas of Mpumalanga Province, South Africa. 51(1), pp. 187–192. doi:
10.18805/ijar.11325.
Mondol, M.A.H., Das, S.C. & Islam, M.N. (2016). Application of Standardized Precipitation
Index to assess meteorological drought in Bangladesh. Jàmbá: Journal of Disaster Risk
Studies, 8(1), a280. http://dx.doi.org/10.4102/jamba.v8i1.280
Monyela, B. (2017). A two-year long drought in summer 2014/2015 and 2015/2016 over
South Africa.
Muhammad, S. (2016). Methods of Data collection.
Municipal Demarcation Board (2019). Available from: http://www.demarcation.org.za/site/wp-
content/uploads/2019/02/Mantsopa-FS196.docx
Mukherjee, S., Mishra, A. & Trenberth, K.E. (2018). Climate Change and Drought: a
Perspective on Drought Indices.
Mutekwa, C.J. (2016). Drought Risk Effects on Livelihoods of Rural Communities in Chipinge
South, Zimbabwe.
Muyambo, F., Jordaan, A.J. & Bahta, Y.T. (2017). Assessing social vulnerability to drought in
South Africa: Policy implication for drought risk reduction. Jàmbá: Journal of Disaster Risk
Studies, 9(1), a326. https://doi. Org/10.4102/jamba.v9i1.326
Mworia, J. K. & Kinyamario, J.I. (2007). Traditional strategies used by pastoralists to cope with
La Nina induced drought in Kajiado, Kenya.
Ncube, B. & Shikwambana, S. (2016). Coping and Adaptation Strategies for Agricultural water
use during Drought Periods: Review of drought coping and adaptation strategies in dry land
cropping systems, irrigation, livestock and mixed systems.
Ndhlovu, M.P. & Mpofu, T., 2016, Communal farming, climate change adaptation and the media

85
in Zimbabwe’, Jàmbá: Journal of Disaster Risk Studies, 8(3), Art. #239, 10 pages. http://dx.doi.
Org/10.4102/jamba.v8i3.239
Nieuwoudt, T. (2019) Grazing management in drought prone regions.
Ngaka, M. J. (2012). Drought preparedness, impact and response: A case of the Eastern Cape
and Free State provinces of South Africa’, Jàmbá: Journal of Disaster Risk Studies, 4(1). doi:
10.4102/jamba.v4i1.47.
Ntombela, S., Nyhodo, B., Ngqangweni, S., Phahlane, H. & Lubinga, M. (2017). ‘Economy-wide
effects of drought on South African Agriculture: A computable general equilibrium (CGE)
analysis’, Journal of Development and Agricultural Economics, 9(3), pp. 46–56. doi:
10.5897/JDAE2016.0769.
Olayele, O.L. (2010). Drought Coping Mechanisms: A Case Study of small scale farmers In
Motheo District of the Free State Province, pp. 7-8.
Pandey, P & Pandey, M.M. (2015). Research Methodology: Tools and Techniques.
Paterson, D.G., Smith, H.J. & Van Greunen, A. (2013). Evaluation of soil conservation
measures on a highly erodible soil in the Free State province, South Africa, 30(4): 213–217.
Pelser, A. J. (2001). Socio-Cultural Strategies in Mitigating Drought Impacts and Water Scarcity
in, 30, pp. 52–74.
Pohlert, T. (2018). Non-Parametric Trend Test and Change-Point Detection. Available from:
https://cran.r-project.org/web/packages/trend/vignettes/trend [23/11/2019]
Puukka, J., Dubarle., P., McKiernan, H., Reddy, J., & Wade, P. (2012). Higher Education in
Regional and City Development: The Free State, South Africa.
Progression of Drought: National Drought Mitigation Centre (NDMC). (2019). Available from:
https://drought.unl.edu/Education/DroughtIn-depth/TypesofDrought.aspx [24/07/2019]

86
Prudon, P. (2013) Confirmatory factor analysis as a tool in research using questionnaires: a
critique Comprehensive Psychology, 4,10.
Quantitative Research Module (undated), Available from:
http://dmeforpeace.org/sites/default/files/1.3%20Quantitative%20Research.pdf [23/10/2019]
Ramamasy, S. & Baas, S. (2006). Climate Variability and Change: Adaptation to Drought in
Bangladesh, A Resource book and training guide. FAO.
Ramamasy, S. & Baas, S. (2007). Climate Variability and Change: Adaptation to Drought in
Bangladesh, A Resource book and training guide. FAO.
Rawshan, A., Kuriqi, A., Abubaker, S. & Kisi, O. (2019). Long-Term Trends and Seasonality
Detection of the Observed Flow in Yangtze River Using Mann-Kendall and Sen’s Innovative
Trend Method.
Richard, R. & Heim JR. (2002). A Review Century of Twentieth-century drought Indices used
in the United States, (August), pp. 1149–1166.
Rashamol, V.P., Sejian, V., Bagath, M., Krishnan, G., Archana, P.R. & Bhatta, R. (2018).
Physiological adaptability of livestock to heat Stress: an updated review.
Scholtz, M. M., Maiwashe, A., Magadlela, M.A., Tjelele, T.J., Nkosi, B.D. & Matabane, M.
(2016). The reality of drought, consequences and mitigation strategies for livestock production
in South Africa, Applied Animal Husbandry & Rural Developmen, 9(mm), pp. 6–10.
Sheffield, J. & Wood, E.F. (2011). Drought past problems and future scenarios.
Shoroma, L. B. (2014). Mitigating the effects of recurrent drought: The case of Setlagole
community, Ratlou Municipality (North West Province), (November).
Sihlobo, W. (2018). The voice of agribusiness: Climate Change.
87
Sonawane, S.T. (2016). Impact of Drought on Indian Agriculture & Economy.
Taber, K.S. (2016). The Use of Cronbach’s Alpha when Developing and Reporting Research
Instruments in Science Education.
Taherdoost, H. (2016). Validity and Reliability of the Research Instrument; How to Test the
Validation of a Questionnaire/Survey in a Research.
Tavakol, M. & Dennick, R. (2011). Making sense of Cronbach’s alpha.
Thornton, P.K., Fawcett, R.H., Galvin, K.A., Boone, R.B., J. W. Hudson, J.W & Vogel, C.H.
(2004). Evaluating management options that use climate forecasts: modelling livestock
production systems in the semi-arid zone of South Africa, Vol. 26: 33–42, 2004.
Trnka, M., Balek, J., Štěpánek, P., Zahradníek, P., M Možný, M., Eitzinger, J., Žalud, Z.,
Formayer, H., Turňa, M., Nejedlík, P., Semerádová, D., Hlavinka, P. & Brázdil1, R. (2016).
Drought trends over part of Central Europe between 1961 and 2014.
UNCCD, (2013). White paper I: Economic and Social Impacts of Desertification, Land
Degradation and Drought
UNESC, (2007). Africa Review on Drought and Desertification.
USDA. (2017). Drought Impacts in the Northern Region: A synopsis of presentations and work
group sessions from the Region 1 Drought Workshop (March 2017).
Van Lanen, H.A.J., Tallaksen, L.M & Rees, G. (Undated). Droughts and climate change.
Van Niekerk, W., Maré, F. & Strydom, D. (2016). Drought 2016 Impact Assessment for
livestock-producing areas in South Africa.
Van Zyl, K. (2006). ‘Reducing Disaster Risk through Vulnerability Assessment: An Agricultural
88
Perspective’, Journal of Disaster Risk Studies, 1(1), pp. 18–23.
Vilane, B.R.T., Mnanyatsi, A.M. and Shabangu, K. (2015). Drought coping strategies at
Lonhlupheko community, A semi-arid rural area in Swaziland, 10(8), pp. 783–788. doi:
10.5897/AJAR2013.7658.
Visser, M. & Turpie, J. (2014). The Impact of climate change on South Africa’s rural areas.
Webb, E.C., Visagie, P.C., Van der Westhuizen, J. & Snyman, H.A. (2017). Influence of
bioregion and environmental factors on the growth, size and reproduction of Bonsmara cows.
Wilhite, D.A. (2005). Drought and water crisis, Science, Technology and Management Issues.
White, D.A. (2010). Understanding the Drought Phenomenon: The Role of Definitions.
Wilhite, D.A. & Glantz, M. H. (1985). Understanding the Drought Phenomenon : The Role of
Definitions
Winkler, K., Gessner, U & Hochschild, V. (2017). Identifying Droughts Affecting Agriculture in
Africa Based on Remote Sensing Time Series between 2000–2016: Rainfall Anomalies and
Vegetation Condition in the Context of ENSO
Wu, H, & Wilhite, D.A. (2003). An Operational Agricultural Drought Risk Assessment Model for
Nebraska, USA.
Zhang, D, (2005). Severe Drought Events as Revealed in the Climate Records of China and
Their Temperature Situations over the Last 1000 Years.
Zhang, Z. & Yuan, K. (2016). Robust Coefficients Alpha and Omega and Confidence Intervals
With Outlying Observations and Missing Data: Methods and Software.
Zhang, L. & Zhou, T. (2015). Drought over East Asia: A Review Journal of Climate. 28.
150203142724009. 10.1175/JCLI-D-14-00259.1.
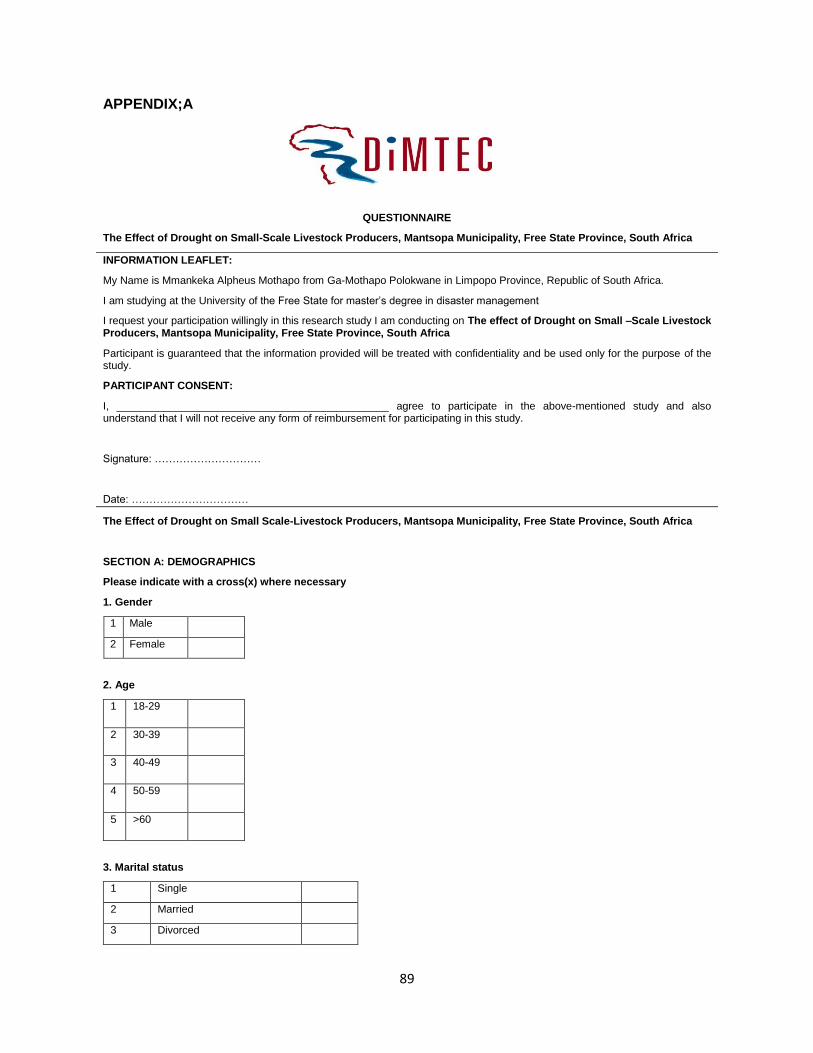
89
APPENDIX;A
QUESTIONNAIRE
The Effect of Drought on Small-Scale Livestock Producers, Mantsopa Municipality, Free State Province, South Africa
INFORMATION LEAFLET:
My Name is Mmankeka Alpheus Mothapo from Ga-Mothapo Polokwane in Limpopo Province, Republic of South Africa.
I am studying at the University of the Free State for master’s degree in disaster management
I request your participation willingly in this research study I am conducting on The effect of Drought on Small –Scale Livestock Producers, Mantsopa Municipality, Free State Province, South Africa
Participant is guaranteed that the information provided will be treated with confidentiality and be used only for the purpose of the study.
PARTICIPANT CONSENT:
I, ______________________________________________ agree to participate in the above-mentioned study and also understand that I will not receive any form of reimbursement for participating in this study.
Signature: …………………………
Date: ……………………………
The Effect of Drought on Small Scale-Livestock Producers, Mantsopa Municipality, Free State Province, South Africa
SECTION A: DEMOGRAPHICS
Please indicate with a cross(x) where necessary
1. Gender
1 Male
2 Female
2. Age
1 18-29
2 30-39
3 40-49
4 50-59
5 >60
3. Marital status
1 Single
2 Married
3 Divorced

90
4 Widowed
5 Never married
4. Location
1 Hobhouse
2 Ladybrand
3 Excelsior
4 Thabaphatshwa
5 Tweespruit
5. Educational information
Primary level
Secondary level
Post matric
Never attended school
6. Number of household members
7. Employment status
1 Unemployed
2 Formal employed
3 Self employed
8. Type of land farming on
SECTION B: SOCIAL
9. Farmers move their livestock to less distressed farms or alternative grazing land whenever they experience drought
Agree Disagree Neutral Totally agree Totally disagree
1 2 3 4 5
10 Majority of the farmers are experiencing high mortality rate in livestock whenever there is a drought
Agree Disagree Neutral Totally agree Totally disagree
1 2 3 4 5
11. Drought is capable of causing poverty in various households
Agree Disagree Neutral Totally agree Totally disagree
1 2 3 4 5
12. Most people lose their jobs especially in agricultural sector whenever there is a drought
SLAG LRAD Private Commonage Trust
1 2 3 4 5

91
Agree Disagree Neutral Totally agree Totally disagree
1 2 3 4 5
SECTION C: ECONOMIC
13. Drought has negative impact on livelihood due to an increase in expenditure
Agree Disagree Neutral Totally agree Totally disagree
1 2 3 4 5
14. It is important to provide feed supplements for livestock during drought period to avoid loss of revenue
Agree Disagree Neutral Totally agree Totally disagree
1 2 3 4 5
15. If farmers are following correct farming practices like correct stocking rate are likely to cope with drought
Agree Disagree Neutral Totally agree Totally disagree
1 2 3 4 5
16. Drought relief play an important role during drought period to keep farmers in farming business
Agree Disagree Neutral Totally agree Totally disagree
1 2 3 4 5
SECTION D: ENVIRONMENT
17. Shortage of rainfall experienced towards the end of 2018 and early 2019 resulted in degradation of grazing veld
Agree Disagree Neutral Totally agree Totally disagree
1 2 3 4 5
18. Shortage of rainfall late in 2018 had negative impact on stocking rate with more area being over grazed
Agree Disagree Neutral Totally agree Totally disagree
1 2 3 4 5
19. It is important for farmer to have grazing management plan with good infrastructure (fence & water source) for good rotational grazing
Agree Disagree Neutral Totally agree Totally disagree
1 2 3 4 5
20. Shortage of rainfall facilitate poor soil cover that promotes erosion through wind and results in poor grass vegetation
Agree Disagree Neutral Totally agree Totally disagree
1 2 3 4 5
92

93

94