the effect of diversification strategies on the
TRANSCRIPT
THE EFFECT OF DIVERSIFICATION STRATEGIES ON THE
PERFORMANCE OF COMMERCIAL BANKS IN KENYA.
BY
ANNE NYACHOMBA MWANGI
D61/77531/2012
A RESEARCH PROJECT REPORT SUBMITTED IN PARTIAL FULFILMENT OF
THE REQUIREMENTS FOR THE AWARD OF THE DEGREE OF MASTER OF
BUSINESS MANAGEMENT, SCHOOL OF BUSINESS, UNIVERSITY OF NAIROBI
NOVEMBER, 2016

i
DECLARATION
I declare that this is my original work and has not been presented in any other University
or College for Examination or Academic award.
Signature………………………………………. Date………………………………
ANNE NYACHOMBA MWANGI
D61/77531/2012
This project has been submitted for examination with my approval as the university
supervisor.
Signature ……………………………… Date ……………………
Dr. Kennedy Ogollah
Department of Business Administration,
School of Business,
University of Nairobi.

ii
ACKNOWLEDGEMENTS
It has been an exciting and instructive study period in the University of Nairobi and I feel
privileged to have had the opportunity to carry out this study as demonstration of
knowledge gained during the period studying for my master‟s degree. It would be
impossible not to remember those who in one way or another, directly or indirectly, have
played a role in the realization of this research project. Let me, therefore, thank them all
equally.
I am indebted to the all-powerful God for all the blessings he showered on me and for
being with me throughout the study. I am deeply obliged to my supervisor Dr. Kennedy
Ogollah for his exemplary guidance and support without whose help; this project would
not have been a success.
Finally, yet importantly, I take this opportunity to express my deep gratitude to the lasting
memory of my loving family, and friends who are a constant source of motivation and for
their never ending support and encouragement during this project.

iii
DEDICATION
This research project is dedicated to my parents Mr. & Mrs. Mwangi, and to my siblings;
Waweru Mwangi, Waithera Mwatha and Mumbi Njuki who inspired me to attain my
academic potential and for their encouragement throughout the period of my research
writing. For this I say thank you all and God bless.

iv
TABLE OF CONTENTS
DECLARATION................................................................................................................ i
ACKNOWLEDGEMENTS ............................................................................................. ii
DEDICATION.................................................................................................................. iii
LIST OF TABLES ......................................................................................................... viii
LIST OF FIGURES ......................................................................................................... ix
ABBREVIATIONS AND ACRONYMS ......................................................................... x
ABSTRACT ...................................................................................................................... xi
CHAPTER ONE: INTRODUCTION ............................................................................. 1
1.1 Background of the Study ......................................................................................... 1
1.1.1 Diversification Strategies ................................................................................... 3
1.1.2 Organization Performance .................................................................................. 4
1.1.3 Banking Industry in Kenya ................................................................................. 5
1.1.4 Commercial Banks in Kenya .............................................................................. 6
1.2 Problem Statement ........................................................................................................ 7
1.3 Research Objective ....................................................................................................... 9
1.4 Value of the Study ........................................................................................................ 9
CHAPTER TWO: LITERATURE REVIEW .............................................................. 11
2.1 Introduction ................................................................................................................. 11

v
2.2 Theoretical Review ..................................................................................................... 11
2.2.1 Transaction Cost Economics ............................................................................ 11
2.2.2 The Resource-Based View (RBV) ................................................................... 12
2.3 Empirical Review........................................................................................................ 13
2.3.1 Product Diversification Strategies and Bank Performance .............................. 13
2.3.2 Marketing Diversification Strategies and Bank Performance .......................... 15
2.3.3 Internal Growth Diversification Strategies and Bank Performance ................. 17
2.4 Summary of Knowledge Gaps .................................................................................... 19
2.5 Conceptual Framework ............................................................................................... 19
CHAPTER THREE: RESEARCH METHODOLOGY ............................................. 21
3.1 Introduction ................................................................................................................. 21
3.2 Research Design.......................................................................................................... 21
3.3Target Population ......................................................................................................... 22
3.4 Data Collection ........................................................................................................... 22
3.5 Data Analysis .............................................................................................................. 23
CHAPTER FOUR: DATA ANALYSIS, RESULTS AND DISCUSSION ................ 25
4.1 Introduction ................................................................................................................. 25
4.2 Effects of Diversification Strategies on the Performance of Commercial Banks ....... 25
4.3. General Information ................................................................................................... 26
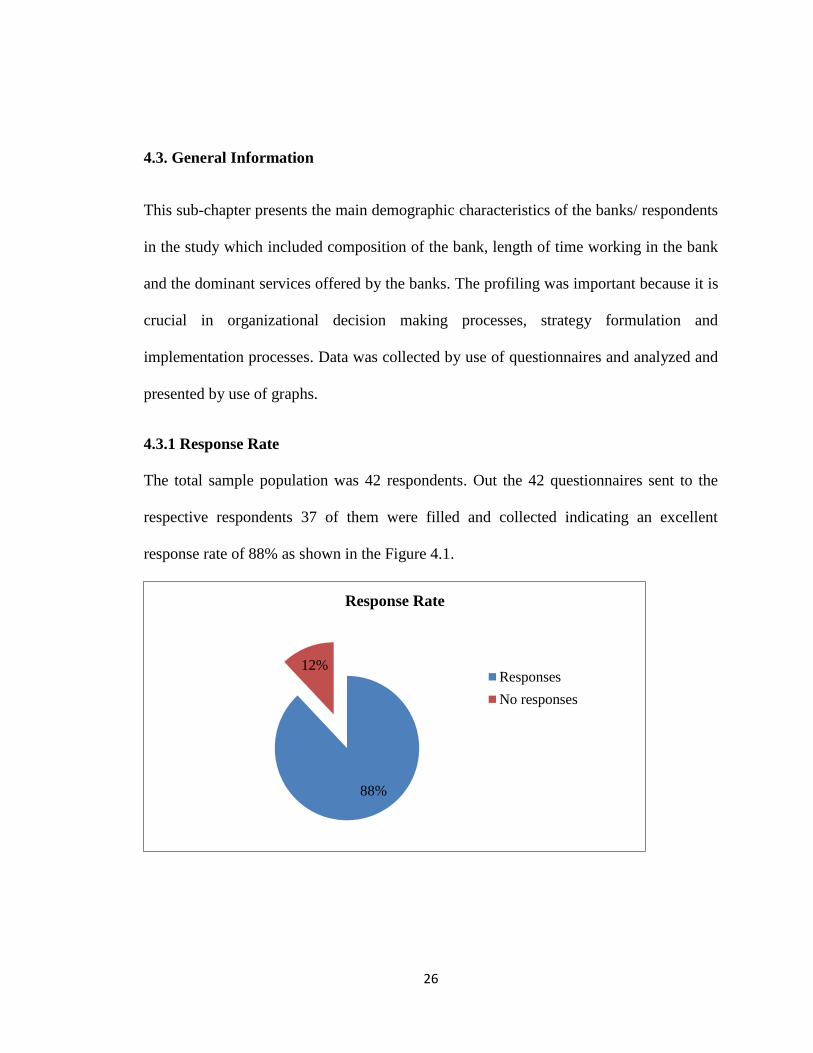
4.3.1 Response Rate................................................................................................... 26

vi
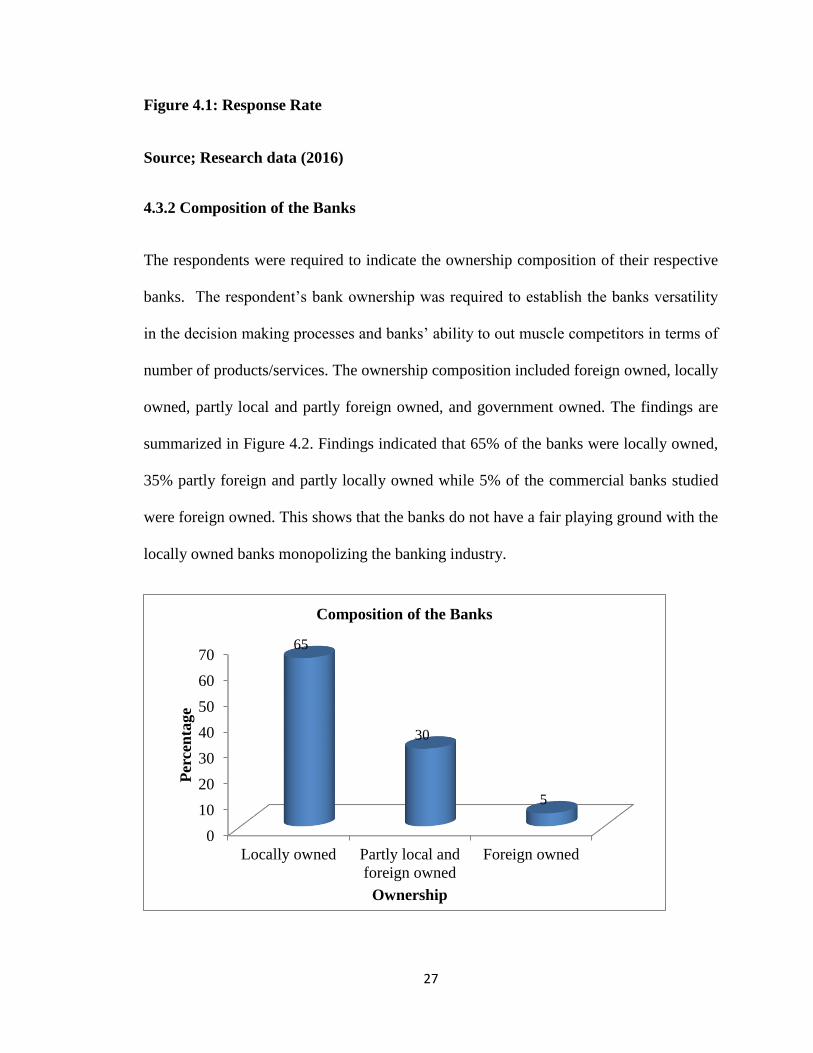
4.3.2 Composition of the Banks ................................................................................ 27
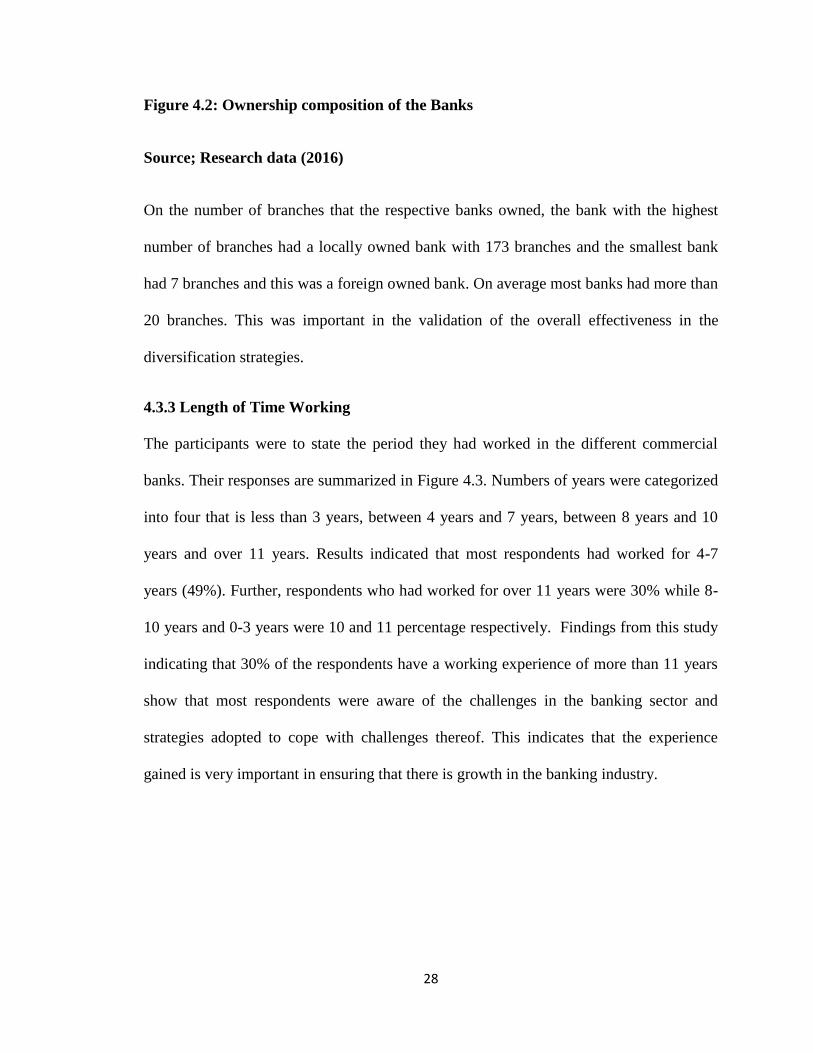
4.3.3 Length of Time Working .................................................................................. 28
4.3.4 Dominant Services Offered by the Banks ........................................................ 29
4.4 Diversification Strategies ............................................................................................ 30
4.4.1 Product Diversification Strategies .................................................................... 31
4.4.2 Marketing Diversification Strategies ................................................................ 33
4.4.3 Internal Growth Diversification Strategies ....................................................... 34
4.5 Bank Performance ....................................................................................................... 36
4.6 Inferential Statistics .................................................................................................... 37
4.6.1 Regression Analysis ......................................................................................... 37
4.6.2 Hypothesis Testing ........................................................................................... 41
4.7 Discussion of Research Findings ................................................................................ 43
CHAPTER FIVE: SUMMARY, CONCLUSION AND RECOMMENDATIONS .. 45
5.1 Introduction ................................................................................................................. 45
5.2 Summary of Findings .................................................................................................. 45
5.2.1 Product Diversification Strategies .................................................................... 45
5.2.2 Marketing Diversification Strategies ................................................................ 46
5.2.3 Internal Growth Diversification Strategies ....................................................... 46
5.3 Conclusion .................................................................................................................. 47
5.4 Recommendations ....................................................................................................... 48

vii
5.5 Areas for Further Research ......................................................................................... 48
5.6 Limitations of the Study.............................................................................................. 49
REFERENCES ................................................................................................................ 50
APPENDICES ................................................................................................................. 60
Appendix I: Letter of Introduction .................................................................................... 60
Appendix II: Questionnaire............................................................................................... 61
Appendix III: Commercial Banks ..................................................................................... 65
viii
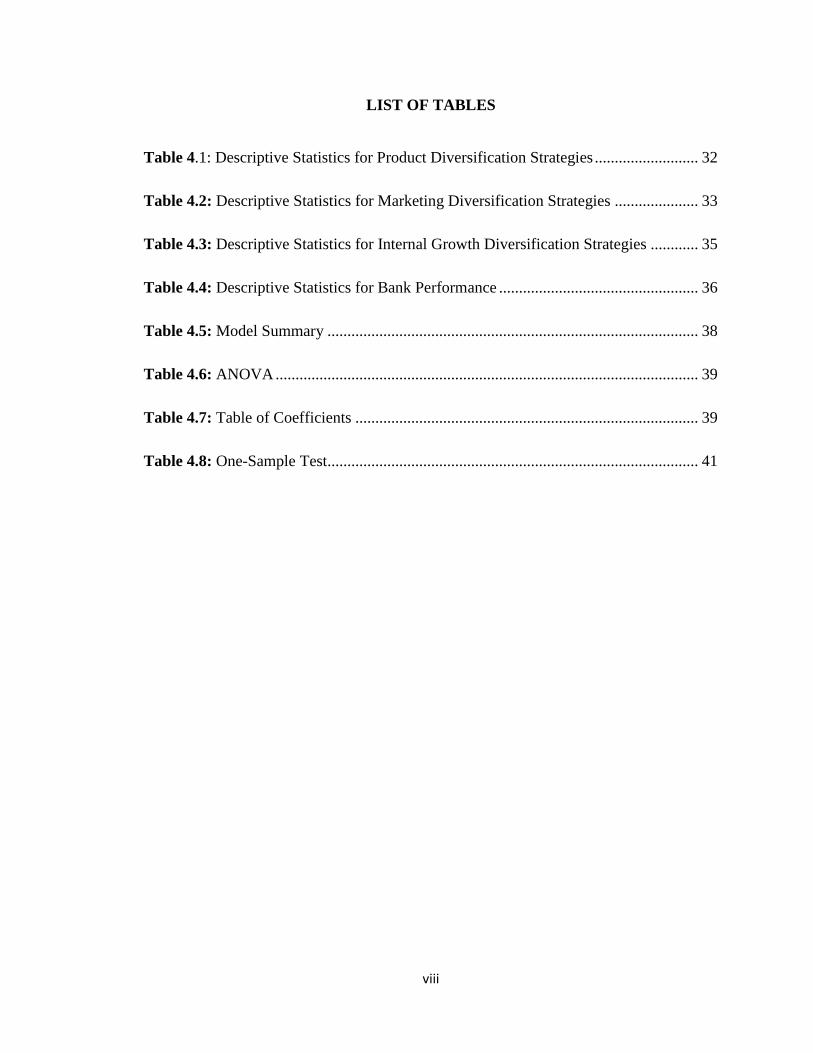
LIST OF TABLES
Table 4.1: Descriptive Statistics for Product Diversification Strategies .......................... 32
Table 4.2: Descriptive Statistics for Marketing Diversification Strategies ..................... 33
Table 4.3: Descriptive Statistics for Internal Growth Diversification Strategies ............ 35
Table 4.4: Descriptive Statistics for Bank Performance .................................................. 36
Table 4.5: Model Summary ............................................................................................. 38
Table 4.6: ANOVA .......................................................................................................... 39
Table 4.7: Table of Coefficients ...................................................................................... 39
Table 4.8: One-Sample Test............................................................................................. 41
ix
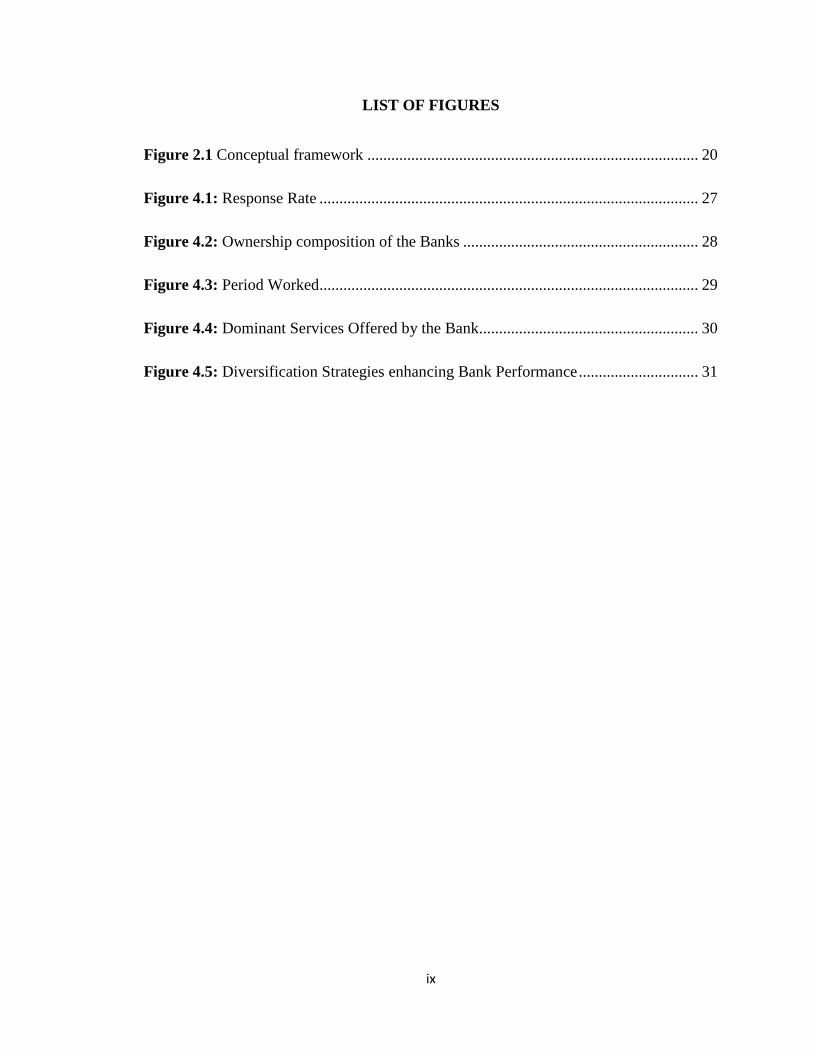
LIST OF FIGURES
Figure 2.1 Conceptual framework ................................................................................... 20
Figure 4.1: Response Rate ............................................................................................... 27
Figure 4.2: Ownership composition of the Banks ........................................................... 28
Figure 4.3: Period Worked ............................................................................................... 29
Figure 4.4: Dominant Services Offered by the Bank....................................................... 30
Figure 4.5: Diversification Strategies enhancing Bank Performance .............................. 31

x
ABBREVIATIONS AND ACRONYMS
CBK Central Bank of Kenya
EPS Earning Per Share
IT Information Technology
TCE Transaction Cost Economics
ROI Return on Equity
xi
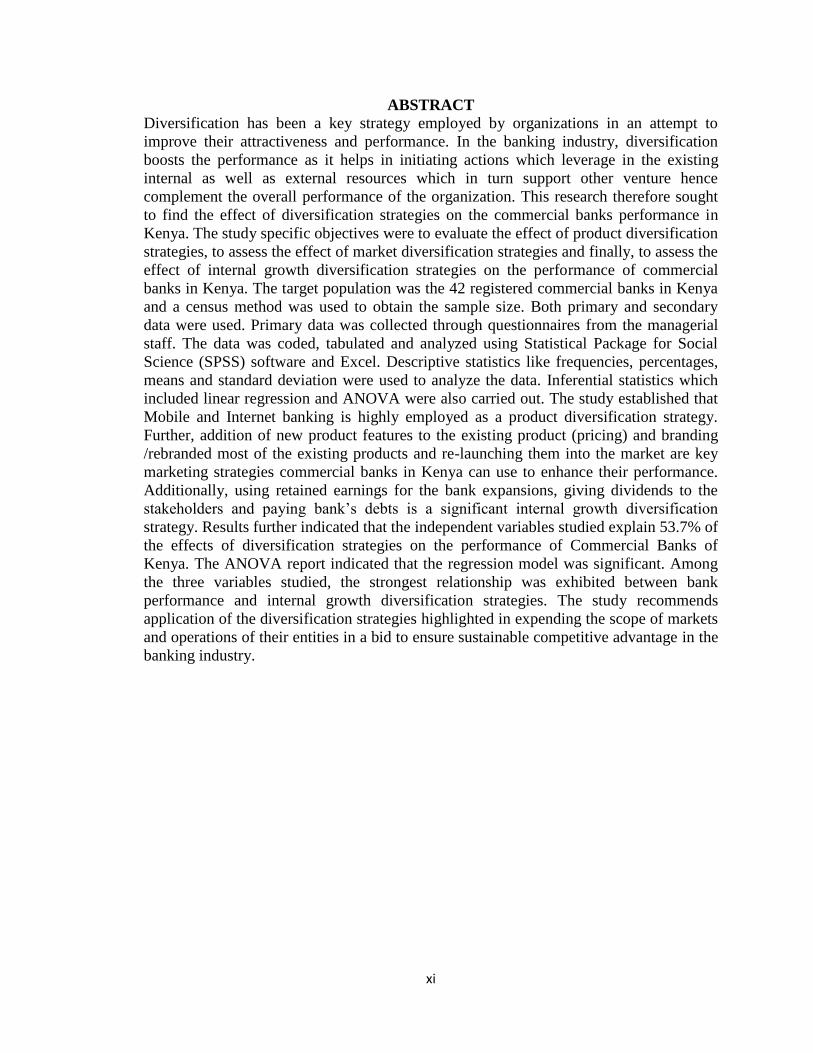
ABSTRACT
Diversification has been a key strategy employed by organizations in an attempt to
improve their attractiveness and performance. In the banking industry, diversification
boosts the performance as it helps in initiating actions which leverage in the existing
internal as well as external resources which in turn support other venture hence
complement the overall performance of the organization. This research therefore sought
to find the effect of diversification strategies on the commercial banks performance in
Kenya. The study specific objectives were to evaluate the effect of product diversification
strategies, to assess the effect of market diversification strategies and finally, to assess the
effect of internal growth diversification strategies on the performance of commercial
banks in Kenya. The target population was the 42 registered commercial banks in Kenya
and a census method was used to obtain the sample size. Both primary and secondary
data were used. Primary data was collected through questionnaires from the managerial
staff. The data was coded, tabulated and analyzed using Statistical Package for Social
Science (SPSS) software and Excel. Descriptive statistics like frequencies, percentages,
means and standard deviation were used to analyze the data. Inferential statistics which
included linear regression and ANOVA were also carried out. The study established that
Mobile and Internet banking is highly employed as a product diversification strategy.
Further, addition of new product features to the existing product (pricing) and branding
/rebranded most of the existing products and re-launching them into the market are key
marketing strategies commercial banks in Kenya can use to enhance their performance.
Additionally, using retained earnings for the bank expansions, giving dividends to the
stakeholders and paying bank‟s debts is a significant internal growth diversification
strategy. Results further indicated that the independent variables studied explain 53.7% of
the effects of diversification strategies on the performance of Commercial Banks of
Kenya. The ANOVA report indicated that the regression model was significant. Among
the three variables studied, the strongest relationship was exhibited between bank
performance and internal growth diversification strategies. The study recommends
application of the diversification strategies highlighted in expending the scope of markets
and operations of their entities in a bid to ensure sustainable competitive advantage in the
banking industry.
1
CHAPTER ONE: INTRODUCTION
1.1 Background of the Study
In the context of turbulent business setting, organizations have to learn to acclimatize
themselves to remain very competitive over time (Auster et al., 2011). Consequently,
intentional and organized learning has to be there to an ongoing systematic shift between
the business setting and the organization‟s strategies that result in efficiency and
effectiveness improvement so as to increase their performance and achieve long term
growth (Grant, 2008). He further argues that for organizations to remain successful
businesswise, understanding the challenges, opportunities and threats provided by the
external setting is needful, for the organization to take advantage of the opportunities and
avoid threats by applying appropriate response strategies as well as developing the
diversification strategies that will enhance their performance, survival and
competitiveness.
Diversification has been a key strategy employed by organizations in an attempt to
improve their attractiveness and performance. In the banking industry, diversification
boosts the performance as it helps in initiating actions which leverage in the existing
internal as well as external resources which in turn support other venture hence
complement the overall performance of the organization. According to Thomson et al.
(2012), diversification helps organization build the urgency and the need of improving
shareholders value by using existing resources. Ansoff (1965) argued that diversification
is manifested through product development, market development and market penetration
representing product market structure changes.

2
This study is anchored on the Transaction Cost Economics (TCE) and Resource Based
View (RBV) theory. Transaction Cost Economics theory suggests that diversification
allows organizations to get bigger market power through vertical integration and by
blocking out other competitors. More precisely, Miller (2009), contended that diversified
organizations reduces their prices and subsidizing their businesses thus are able to raise
barriers for entry and are able to squeeze their competitors out of the market. In the
Resource Based View, it is argued by researchers that the allotment of assets in the
various available markets with independent cash flows reduces the impact of un-universal
risk coming from external eventualities in each of the various markets (Lewellen, 2001).
The banking industry has been cited as one of the industries in which cut throat
competition thrives. According to Nyatich (2009), competition has been on the rise in the
Kenyan banking industry such that even international banks, in maintaining and enlarging
their market shares, have been forced to change their strategies from the larger corporate
strategy. Just like other financial institutions, commercial banks have in essence been
provoked to better their performance in order to remain significant in the financial
market. Diversification as espoused by Miller (2009) in the Transaction Cost Economics
theory has been widely used by firms world over to ensure there is vertical integration
and competitors are blocked thus relevancy in the market place and as well enhancing
their absolute performance.
3
1.1.1 Diversification Strategies
Constable and McCormick (2009) argued that among the managerial possibilities
presumed as the explicit contributor to the economic functioning of organizations is the
extent of diversification. According to Dibb (2007), diversification of organizations is by
the extension of the operations‟ scope into multiple markets and a diversification strategy
is trailed as explained by Chandler (2010), as when organizations have opportunities
embedded in market structures and technology as well as opportunities for growth in the
organization‟s basic business. Boyd et al., (2004) reported that in multiple markets, the
assumption is that there are some raised benefits that may be attained by diversification
through a more competent utilization of organizational resources. Benito (2003) indicated
that diversification increases profitability although only up to the limit of complexity.
According to Ross (1996), organizations have to learn to acclimatize themselves in
changing environment. For organizations to have a competitive advantage against their
competitors, it is needful for them to engage proactively in strategies that will enable
them to respond to the environmental challenges besides the organization‟s achievements
and for their continued existence in the markets. According to Ansoff and McDonnell
(1990), strategies should involve variations in the organization‟s strategic behaviors to
ensure there is success in transforming future environment.
There are several business strategies an organization can use depending on their situation.
For instance, new organizations in the market compared to more established
organizations, usually face different challenges. This therefore means that the business
strategies they execute are usually different from those of their key competitors.
4
According to Rhonda (2010), there are different types of business strategies that a firm
can employ in planning which are the growth strategy, product differentiation, entry, exit,
marketing and acquisition strategies among others. Commercial banks also apply
different strategies depending on their objectives and level of development; these
strategies play critical roles in banks‟ achievement of their mission and objectives. This
may include capital formation, new enterprises investments, trade and industry
promotion, agriculture sector development among others (Dess, 2005).
1.1.2 Organization Performance
According to Murimiri, (2009), performance is the extent to which an investment is
profitable. Basically, performance is the criteria through which an organization
determines its capability to survive in the corporate world. McCann (2004) argued that
organization performance is related to the efficiency and effectiveness of the firm while
Hofer (1983) defined performance as the background concept related with the
phenomenon being studied. Maxine, (2012) argued that banks are the intermediaries in
the transactions between money demanders and suppliers at a given consideration.
According to March and Sutton (1997), the three sources of variations in firm
performance include analytical models that are usually used, information concerning the
apparent determinants of variations in performance and finally the theoretical ideas.
Financial measures of organizational performance include profit, profit ratios (ROI, EPS,
NPR), market share and revenue growth (Pandey, 1999). There are three economic
objectives which describes an organization‟s performance as given by strategic direction
(Pearce & Robinson, 2007). These include existence in the market, progress and
prosperity.
5
An organization‟s growth is connected explicitly to its existence and prosperity.
Existence means having a long term strategy to ensure that business remains and the
inability to do so implies that the organization is unable to meet the stakeholders‟ claims,
progress in the number of markets served and the variety of products offered and finally
in the technologies used in the provision of goods and services. Progress is shown by
change, and a proactive change that is critical in a changing business setting.
Profitability is the main objective of business organization. No matter how profit is
measured or defined, it indicates an organization‟s ability to satisfy the claims of all
stakeholders (Pearce & Robinson, 2007). Decisions must therefore be based on long term
goals as short term goals more often produce misleading profit results which regulate the
rising issues of customers, suppliers, creditors, ecologists and regulatory agents.
1.1.3 Banking Industry in Kenya
For many years, there has been accreditation of the Kenya‟s banking industry because of
the size and diverseness. There are several categories of financial institutions and markets
in Kenya which include banks, insurance companies, stock and bond markets all of which
provides a collection of financial products. Nonetheless, satisfactory access to the
majority of the banking services to the vast population by the financial system has not
been happening. According to Beck (2009), the biggest amounts of savings come from
small depositors yet lending is normally slanted to the large private and public enterprises
based mostly in urban areas. In the Kenya‟s financial system, there has been high interest
rates making affordability of financial services to most people difficult and therefore
Kenya‟s financial system has continued to face challenges. There has been a lot of
competition in the sector mostly caused by the fragmentation and the many small banks.
6
In 2007, the Government of Kenya (GOK) published Kenya‟s Vision 2030. This puts the
delivery of financial services as key in the planning of the economic growth projections
through the year 2030. The main goals that are highlighted in Vision 2030 for the
financial sector relates to stability improvement, efficiency enhancement in credit
delivery together with other financial services and finally in improving access to financial
services and products to a vast number of Kenyan households. This is achievable through
implementation of policies contributing to stable macro and fiscal positions that aims at
reducing inflation and stabilizing the financial sector (Vision 2030).
According to the Banking Supervision Survey Kenya (2010), total assets in the sector
have grown tremendously over the past 10 years. From a balance sheet of 328.4 billion in
2007, the sectors total assets stood at Kshs 764.4 billion as at the end of 2006 a growth of
132%. But the story of Kenya‟s banking sector remains that of a dominant few where 10
players control more than 75% of the market share while the rest 32 share the remaining
portion. This scenario is reflected in other measurements across the board, like customer
deposits, loans and advances to customers and earnings (CBK, 2012).
1.1.4 Commercial Banks in Kenya
Diversification has been suggested as the most stable way to reducing risks, gaining
considerable competitive advantage and leveraging synergy therefore bringing a great
impact on firms‟ performance. This is because they shift from single business strategies
to varied diversification strategies (Kiyohiko & Rose, 2008). According to CBK (2012),
in East Africa, Kenya has the utmost diversified and established financial sector. There
has been a lot of progress in recent years especially in mobile and retail money and other
related services in conjunction with regional expansion.
7
As at 31st December 2011, the CBK, (2011) report indicated that the banking sector
encompassed the CBK as the regulatory authority. It also had 44 banking institutions, 4
representative offices of foreign banks, 6 Deposit-Taking Microfinance Institutions, 118
Forex Bureaus and 2 Credit Reference Bureaus. The profitability of commercial banks is
dependent highly on the activities that generate revenue (Pearce & Robinson, 2007). Stiff
competition and the problem of profitability in the banking sector as indicated by Teimet
et al., (2011) has made commercial banks change their tactics on diversification strategies
by increasingly diversifying their products in the markets, diversifying ,marketing
strategies and internal growth strategies. The establishment of diversification strategies
by commercial banks in Kenya and has an impact on the functioning of commercial
banks in Kenya.
1.2 Problem Statement
There has been increased competition in the banking sector over the last few years
coming from improved transformations among the key players and new participants into
the market (Pearce & Robinson, 2007). The sector has witnessed entrance of many banks,
micro finance and other non-banks in the provision of financial services to the unbanked
and under banked population mainly in the rural areas (Kamau, 2009). Mobile phone
companies in various countries have started new mobile phone based money transfer and
payment services such as M- pesa, Airtel money and Yu cash, an area which used to be a
traditional role of the bank. These services have spread quickly becoming the most
effective mobile phone based financial services in most developing countries.
8
There have been extensive studies conducted in the area of banking sector in the world
and Kenya has not been left out. For instance, Fang et al., (2011) in their investigation on
German banks found out that diversification tended to be coupled with reductions in bank
revenues, even when the risk was controlled. In their report, only few cases like high
risky banks and industrial diversification showed a positively statistically significant
relationship between diversification and bank revenues. Fang et al., (2011) further on
their analysis on the diversification of loan portfolios by German banks, found that most
of the banks had increased loan portfolio diversifications significantly. David and Dionne
(2005) studied how big banks in Sweden managed their loan portfolios, investigating
their loan portfolio diversification strategies. Another study by Warucu (2001) showed
that for banks to outdo each other, the key strategies they have been using is focus and
product differentiation. Mbwayo (2005) did a study on the anti-money laundering
compliance programs strategies adopted by commercial banks in Kenyan industry. In his
conclusion, he suggested that strict observance of standards need to be executed to ensure
that money legalizing is controlled.
In all the aforementioned studies, the scholars have focused on the influence of products
differentiation and market factors on the functioning of commercial banks in Kenya while
none has addressed the effect of diversification strategies on bank performance. Further,
diversification in the banking sector requires that organizations should have efficient
systems put in place to deal with unprecedented occurrences that can deter the set
objectives, operations and general functioning of the organizations (Kamau, 2009).
9
According to CBK (2012), most banks have not been achieving the targeted performance
despite their diversification strategies into the market and have continued to register low
performance in terms of profits growth. On the same note, there is limited literature on
whether these strategies are effective and whether they will be sustainable in the long run.
Thus, the effect of diversification strategies in the banking sector is still wanting and thus
the research gap. The study thus sought to establish the effects of diversification
strategies on the performance of Commercial Banks in Kenya.
1.3 Research Objective
To establish the effects of diversification strategies on the performance of Commercial
Banks in Kenya.
1.4 Value of the Study
Commercial Banks managers in Kenya will understand and appreciate the diversification
strategies relating to the banking industry. Appropriate decisions will be made by
managers in other financial institutions following the studied strategies that have been
executed by the Commercial Banks in Kenya thus successfully expanding their
operations. Challenges experienced in the adoption and implementations of
diversification strategies will also be made aware to the managers thus helping them in
the making of appropriate adjustments countering these challenges and in the
achievement of optimal performance.

10
The study will provide insights to regulators and policy makers on the diversification
strategies enhancing the sector‟s growth and functioning, which will help in regulation
and policy formulation. Development new policies and reviewing of existing policies will
be possible thus achievement of synergy in the banking sector.
The study will also be of paramount help to the banking services users in understanding
and appreciating the potential of development in the banking sector. This is crucial
because any cost inferences which will need to be catered for by customers in exchange
for better service delivery, will be accepted without bargain. Prediction and preparation to
conformity by the users about the future of the Commercial Banks will be possible.
Finally, to researchers and academicians, this study will provide future reference material
on the similar area of diversification strategies. In addition, other topics of future research
will be highlighted including relations amongst strategies taken up and industry entrants.
11
CHAPTER TWO: LITERATURE REVIEW
2.1 Introduction
This chapter starts with a theoretical framework presentation for the study. These details
the theories that attempt to explain the underlying causal relationship between the study
variables. This is followed by a review of past studies done in this area and a critique of
the same. Finally, the review presents the research gaps that need to be addressed as per
the study objectives.
2.2 Theoretical Review
There are various models that attempt to explain the effect of diversification strategies on
organization performance. In this study, Transaction Cost Economics (TCE) and
Resource-based view (RBV) attempts to synthesize those factors that influence
diversification in organizations
2.2.1 Transaction Cost Economics
Transaction Cost Economics (TCE) theory is useful in organization of new activities in
firms which are within their boundaries and also its valuable in sharing of resources
across various businesses in their own firm boundaries. This theory‟s framework submits
that obtaining greater market influence is possible by obstructing competitors and vertical
assimilation which firms get by diversification. More explicitly, Miller (2009) contended
that it is possible to reduce prices in diversified companies thus able to block new
entrants or crush competitors out of the market.
12
Vertical integration as indicated by Penrose (2009), it permits firms in avoidance of
market costs, quality control of products and prevention of spilling over its technology
from to suppliers and other intermediaries.
According to Williamson (1985), this theory is grounded upon several critical
postulations about the behaviour of human beings and characteristics of the environment.
These postulations explain why there may be some superior costs faced by organizations
for market based transactions and the reason behind some organizations being more
efficient at organizing transactions. The firm selects the governance form amongst the
various alternatives in the organizational menu which minimizes transactions and
productivity costs. Hence, increasing the market influence by firms as depicted by the
TCE, it is important to diversify and also firms can organize their extra activities in a
more efficient way as compared to the prevailing market or their contenders.
2.2.2 The Resource-Based View (RBV)
The Resource-based view (RBV) has been said to provide the earliest theoretical
arguments favouring diversification. Penrose (2009) pointed out that at any point in time
a firm has certain productive resources, useful for exploiting productive opportunities to
allow the firm to grow successfully. Researchers have identified a variety of resources
that create an exceptional advantage for a company by sharing them across businesses.
For example, Goold and Campbell (2008) gives the pros of sharing know-how and
tangible resources, coordinated strategies, vertical integration, and pooling negotiating
power. These resources permitan organization to produce economies of scale and scope
by intensifying the efficiency in the use of these resources (Contractor, Kundu & Hsu,
2009). Hence, from the Resourced-Based View a firm should try to maximize exploiting.

13
According to Foss (1998) resource-based theory does not escape the general problem of
finding the appropriate unit of analysis. Most contributions within the RBV take the
individual resource as the relevant unit of analysis to study competitive advantage.
Further, Foss (1998) points out that this choice may only be legitimated if the relevant
resources are sufficiently well-defined and free-standing. If, in contrast, there are strong
relations of complementarily among resources, it is the way resources are clustered and
how they interplay and fit into the system that is important to the understanding of
competitive advantage. Foss (1998) recognizes that the capabilities and competences aim
at grabbing this clustering and interplay. The conceptual framework takes this problem
into account by relating competitive advantage to strategy rather than to individual
resources.
2.3 Empirical Review
This section of the project presents a review of the research related to the problem
statement and objectives of the study. The part is categorized in accordance to the
specific objectives to enhance the achievement of research problem. The literature
discussed begins from product, market and finally internal growth diversification
strategies and their relationship to the bank performance.
2.3.1 Product Diversification Strategies and Bank Performance
Research findings from Amit and Livnat (2008) in European banks show that product
diversification strategies increases risk-return tradeoff. According to Stiroh (2008),
diversification strategies raise banks incomes and reduce unpredictability of the profits.
Moon (2009) suggested that diversification strategies can lead to improved cost
efficiency through lowering of risk if it occurs. Further, he argued that on un-insured debt
14
and other contingent claims like derivative contracts, diversification lowers the required
risk premiums. According to Hughes and Mester, (2008), higher average incomes can be
obtained in financial institutions if higher risk investments can be made from the gains
obtained from diversification.
Acharya et al. (2007) initiated key studies about diversification on banks‟ credit portfolio.
Their findings on the Italian banks indicated that industrial and zonal diversification
strategies reduced bank revenues while creating risky loans. An investigation was done
by Busch and Kick (2009), in the German banking sector on the income diversification
strategies. Further, Goetz (2008), studied on risk taking behavior as affected by bank‟s
diversification. Fang et al., (2011), indicated that asset diversification and loan
diversification is related positively and negatively respectively with bank functionality.
Cotugno and Stefanelli (2012) in their study on geographical diversification, they found a
positive association between the performance of banks and product diversification
strategies. Further, Morgan and Stolyk, (2009) as they did a study on the US banks, they
found that the lending capacity in the banks was increased by product diversification
although there wasn‟t any increase in the revenues of individual banks or a reduction in
the portfolios. The findings of an evaluation on the diversification strategies on the EU
and US indicated conflicting results (Stiroh, (2008); Stiroh&Rumble, 2009).
A study carried out Chiorazzo (2008), for the Italian banks indicated that income
diversification raised risks adjusted revenues and established some diversification
benefits with the enlargement of banks. Stiroh (2008a) in a study for small community
banks, to establish the connection between diversification and risk adjusted performance
15
and found out those diversification strategies paybacks within large activity classes but
not between them. Stiroh (2008b) explored the connection between the increased
dependence on non-interest revenues and the unpredictability of bank incomes and gains.
The findings from the study from aggregate and bank data showed little evidence offered
by the shift from large diversification gains in the form of stable revenues.
D‟Souza and Lai (2009), found out that banks systematically underperformed over time
when measuring the efficiency of Canada‟s Big Five chartered banks. Dullmann et al.,
(2010) did an investigation on monitoring abilities of German cooperative and savings
banks with their interest on specific industry departments. They contended that sectoral
specialization entailed better quality monitoring especially cooperative banks. Deng and
Elyasiani (2008) established that product diversification is linked with risk reduction and
bank holding company value enhancement, raising the distance between a bank holding
company and its networks is linked with firm value decrease and risk growth. Tabaket al.,
(2010), who did an assessment on the concentration or diversification of credit portfolio
in banks operating in the Brazilian banking system and how the choices affected their
functionality, found that Brazilian Banks‟ loan portfolios were more concentrated than
those in developed countries. Bebczuk and Galindo (2008), who did an analysis on
sectorial diversification in the banks of Argentina indicated that there was a greater
benefit from diversification in larger banks than in smaller ones.
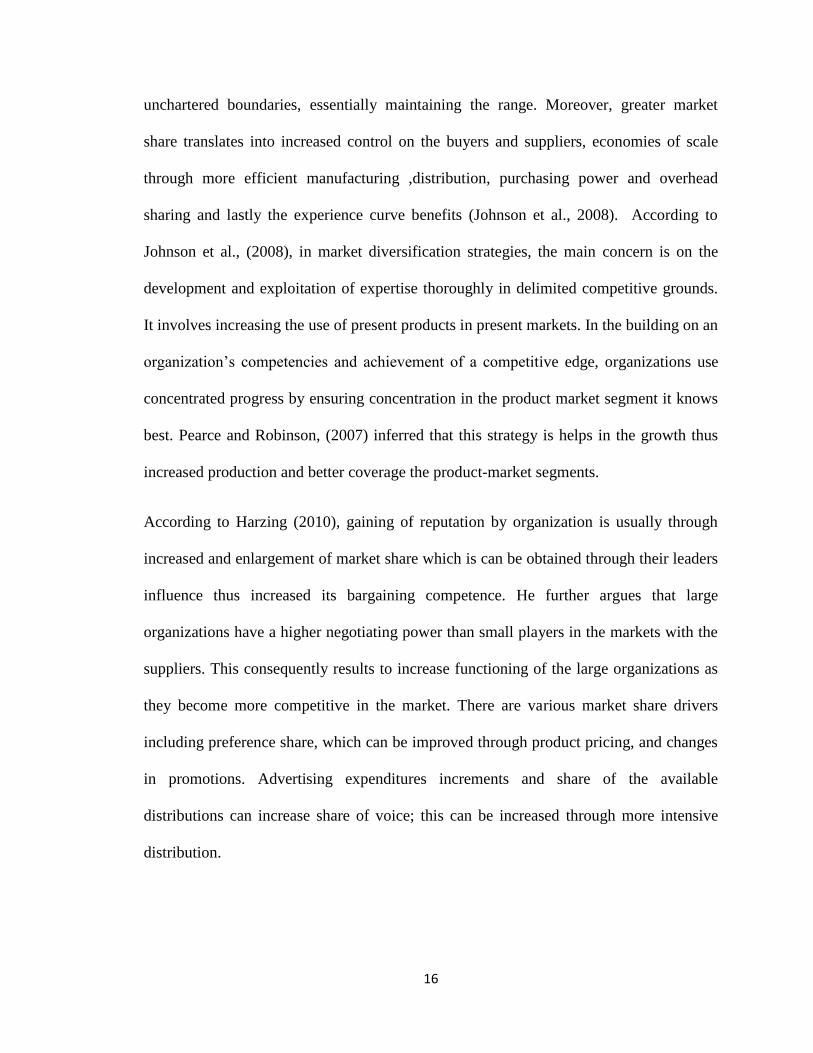
2.3.2 Marketing Diversification Strategies and Bank Performance
Marketing diversification is a strategy where organizations take a bigger share of its
prevailing markets with its current product range (Wheeller & Hunger, 2008). An
organization builds on its current strategic abilities and requires not endeavoring into
16
unchartered boundaries, essentially maintaining the range. Moreover, greater market
share translates into increased control on the buyers and suppliers, economies of scale
through more efficient manufacturing ,distribution, purchasing power and overhead
sharing and lastly the experience curve benefits (Johnson et al., 2008). According to
Johnson et al., (2008), in market diversification strategies, the main concern is on the
development and exploitation of expertise thoroughly in delimited competitive grounds.
It involves increasing the use of present products in present markets. In the building on an
organization‟s competencies and achievement of a competitive edge, organizations use
concentrated progress by ensuring concentration in the product market segment it knows
best. Pearce and Robinson, (2007) inferred that this strategy is helps in the growth thus
increased production and better coverage the product-market segments.
According to Harzing (2010), gaining of reputation by organization is usually through
increased and enlargement of market share which is can be obtained through their leaders
influence thus increased its bargaining competence. He further argues that large
organizations have a higher negotiating power than small players in the markets with the
suppliers. This consequently results to increase functioning of the large organizations as
they become more competitive in the market. There are various market share drivers
including preference share, which can be improved through product pricing, and changes
in promotions. Advertising expenditures increments and share of the available
distributions can increase share of voice; this can be increased through more intensive
distribution.
17
Jones (2004) asserts that altering or modifying the variables contained in the marketing
mix increases the market share. These are the products whose characteristics can be
altered to provide increased value to the customer by product quality improvement.
Reduction in prices translates to an increase in sales profits and this is a product of setting
the appropriate market prices (Hitt & Ireland, 2005). This only works when the players in
the market willingly meet the price cuts put in place.
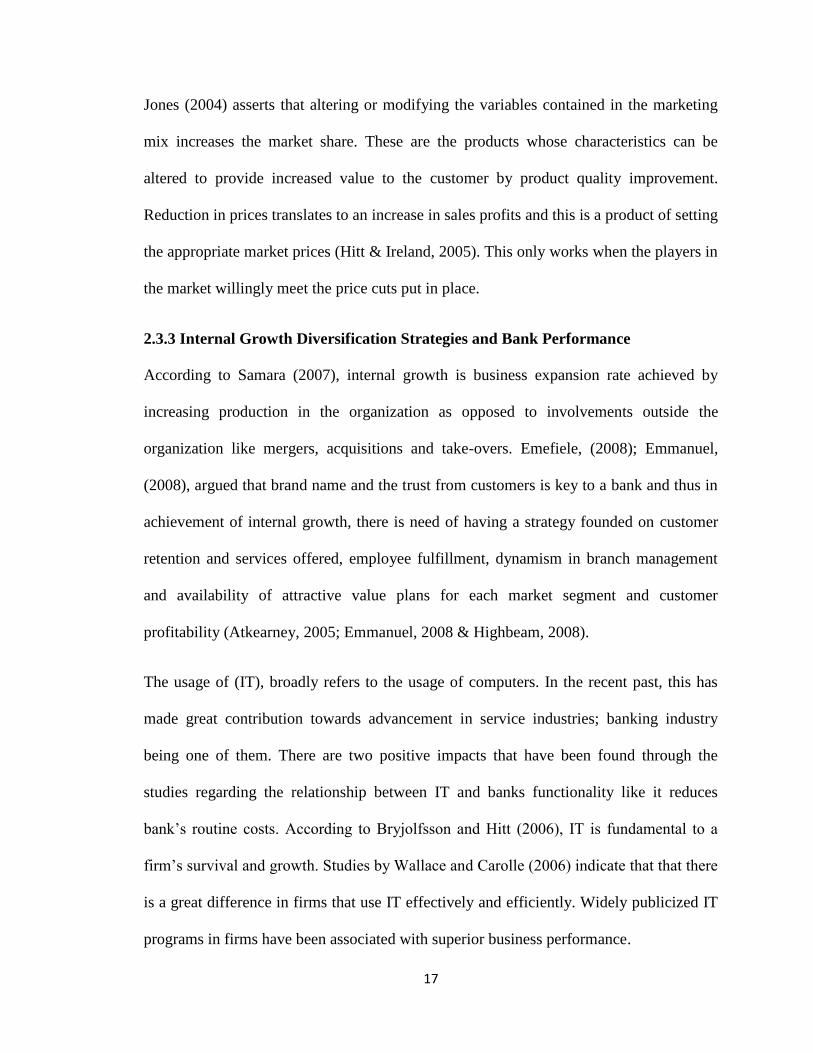
2.3.3 Internal Growth Diversification Strategies and Bank Performance
According to Samara (2007), internal growth is business expansion rate achieved by
increasing production in the organization as opposed to involvements outside the
organization like mergers, acquisitions and take-overs. Emefiele, (2008); Emmanuel,
(2008), argued that brand name and the trust from customers is key to a bank and thus in
achievement of internal growth, there is need of having a strategy founded on customer
retention and services offered, employee fulfillment, dynamism in branch management
and availability of attractive value plans for each market segment and customer
profitability (Atkearney, 2005; Emmanuel, 2008 & Highbeam, 2008).
The usage of (IT), broadly refers to the usage of computers. In the recent past, this has
made great contribution towards advancement in service industries; banking industry
being one of them. There are two positive impacts that have been found through the
studies regarding the relationship between IT and banks functionality like it reduces
bank‟s routine costs. According to Bryjolfsson and Hitt (2006), IT is fundamental to a
firm‟s survival and growth. Studies by Wallace and Carolle (2006) indicate that that there
is a great difference in firms that use IT effectively and efficiently. Widely publicized IT
programs in firms have been associated with superior business performance.
18
Customers are critical in any organization without whom there will be no market value
since firm has no revenues and no profits. Customers need to be satisfied and their
satisfaction is contingent to the degree to which the firm offers/ products is customized to
meet heterogeneous customers‟ needs as versus standardization. Satisfaction, for example
makes customers to come back and buy more thus increased sales and profits.
Performance measures in this case are Customer satisfaction, Loyalty and Profitability.
More satisfied Customers will return with their friends and buy again in the future.
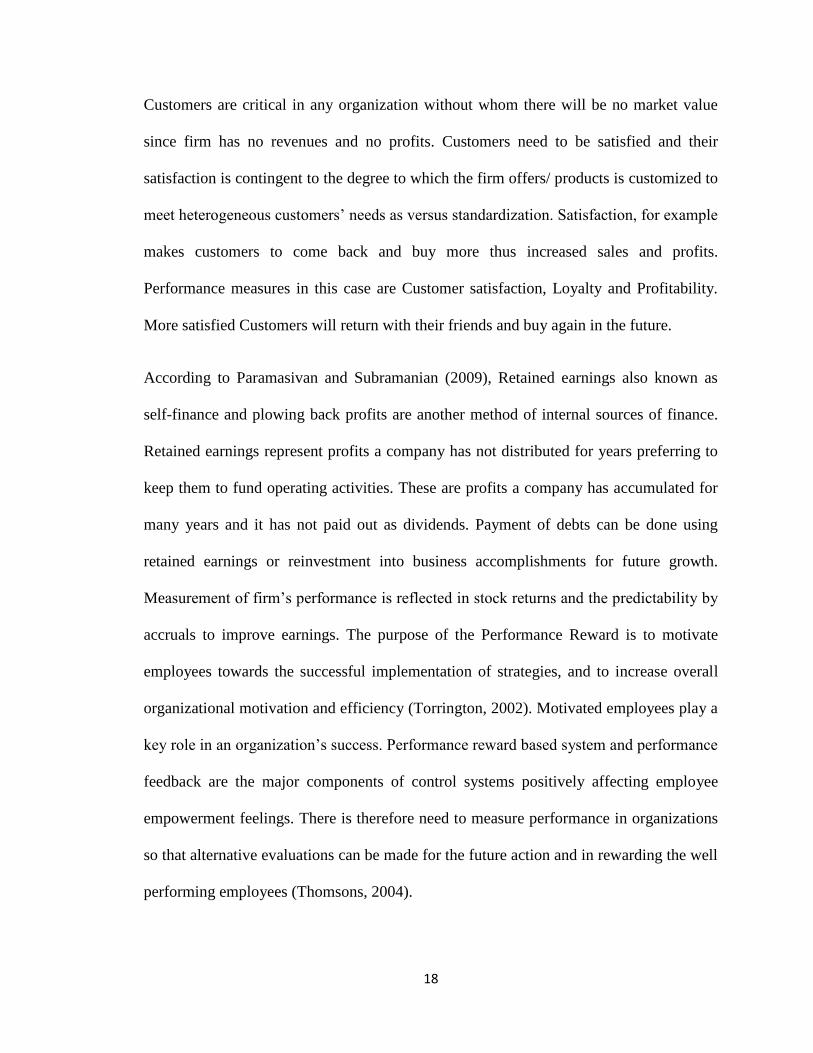
According to Paramasivan and Subramanian (2009), Retained earnings also known as
self-finance and plowing back profits are another method of internal sources of finance.
Retained earnings represent profits a company has not distributed for years preferring to
keep them to fund operating activities. These are profits a company has accumulated for
many years and it has not paid out as dividends. Payment of debts can be done using
retained earnings or reinvestment into business accomplishments for future growth.
Measurement of firm‟s performance is reflected in stock returns and the predictability by
accruals to improve earnings. The purpose of the Performance Reward is to motivate
employees towards the successful implementation of strategies, and to increase overall
organizational motivation and efficiency (Torrington, 2002). Motivated employees play a
key role in an organization‟s success. Performance reward based system and performance
feedback are the major components of control systems positively affecting employee
empowerment feelings. There is therefore need to measure performance in organizations
so that alternative evaluations can be made for the future action and in rewarding the well
performing employees (Thomsons, 2004).
19
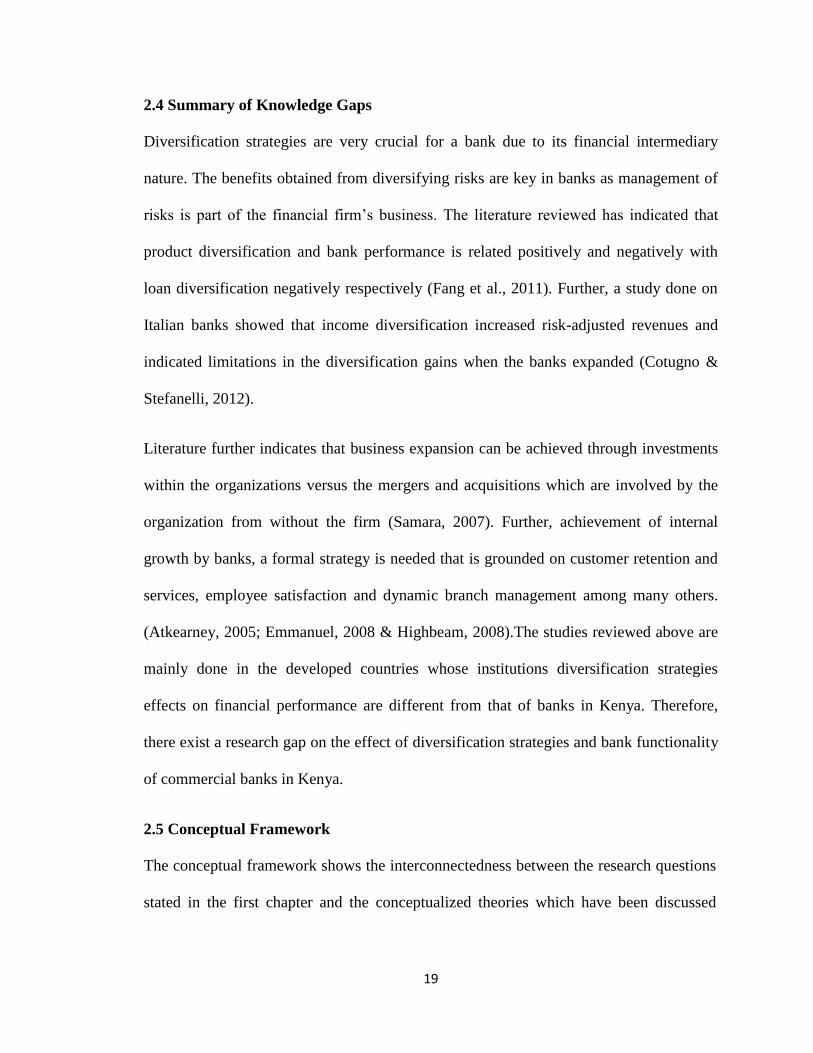
2.4 Summary of Knowledge Gaps
Diversification strategies are very crucial for a bank due to its financial intermediary
nature. The benefits obtained from diversifying risks are key in banks as management of
risks is part of the financial firm‟s business. The literature reviewed has indicated that
product diversification and bank performance is related positively and negatively with
loan diversification negatively respectively (Fang et al., 2011). Further, a study done on
Italian banks showed that income diversification increased risk-adjusted revenues and
indicated limitations in the diversification gains when the banks expanded (Cotugno &
Stefanelli, 2012).
Literature further indicates that business expansion can be achieved through investments
within the organizations versus the mergers and acquisitions which are involved by the
organization from without the firm (Samara, 2007). Further, achievement of internal
growth by banks, a formal strategy is needed that is grounded on customer retention and
services, employee satisfaction and dynamic branch management among many others.
(Atkearney, 2005; Emmanuel, 2008 & Highbeam, 2008).The studies reviewed above are
mainly done in the developed countries whose institutions diversification strategies
effects on financial performance are different from that of banks in Kenya. Therefore,
there exist a research gap on the effect of diversification strategies and bank functionality
of commercial banks in Kenya.
2.5 Conceptual Framework
The conceptual framework shows the interconnectedness between the research questions
stated in the first chapter and the conceptualized theories which have been discussed
20
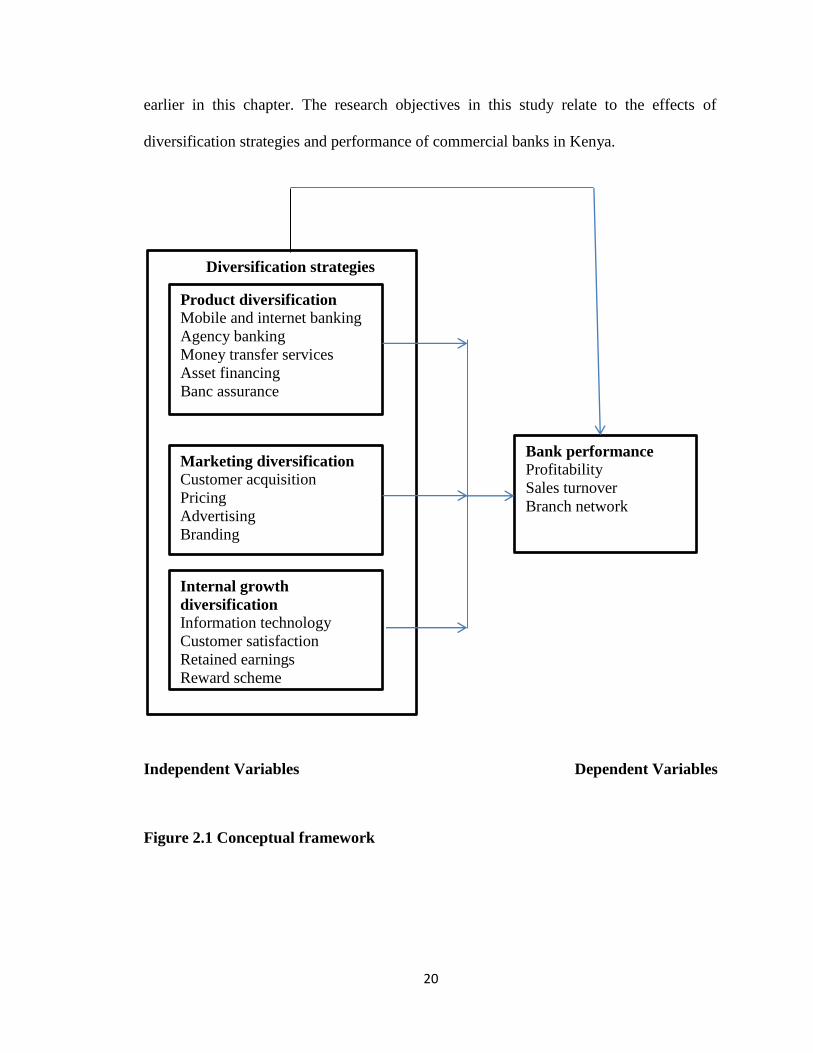
earlier in this chapter. The research objectives in this study relate to the effects of
diversification strategies and performance of commercial banks in Kenya.
Independent Variables Dependent Variables
Figure 2.1 Conceptual framework
Diversification strategies
Product diversification
Mobile and internet banking
Agency banking
Money transfer services
Asset financing
Banc assurance
Marketing diversification
Customer acquisition
Pricing
Advertising
Branding
Internal growth
diversification
Information technology
Customer satisfaction
Retained earnings
Reward scheme
Bank performance
Profitability
Sales turnover
Branch network
21
CHAPTER THREE: RESEARCH METHODOLOGY
3.1 Introduction
This section brings out the research approaches which are: the design used, the study
population, method of sampling and lastly the process of data collection and analysis.
The study adopted quantitative approach. Questionnaires were used to capture
quantitative data from banking representatives.
3.2 Research Design
According to Noum (2007), a design is the plan or sketch that is used to come up with
solutions to questions under study. Descriptive survey research design was chosen since
it is more specific, correct and describes events in a strategic way according to (Babbie,
2004). Further, Berg and Gall (1996) add that, design produces statistical information
about aspects of a study that is specific to the population.
This study employed a cross-sectional descriptive survey design, which involved use of
single questionnaire administered to each sampling unit member at a single point in time.
According to Andres (2012), surveys are used to gather systematically factual
information necessary for decision making. The survey method was elected as it is a
versatile method of collecting data.
22
3.3 Target Population
Population is the entire group under study as specified by objectives of the research; it is
the universe from which the sample is to be selected (Ghauri & Gronhaug, 2005).
According to Mugenda and Mugenda (2003), the study population should have some
evident distinctiveness upon which one can generalize the findings of the study. Thus
ensuring that population of interest is uniform.
The research was based on the Kenyan banking sector where the population under
research exclusively consisted of all the commercial banks. As per CBK (2016), the
banking system comprises of 42 commercial banks, which formed the basis of the target
population. (See appendix III).
3.4 Data Collection
The research instrument was a questionnaire for primary data and secondary data was
collected from published financial statements of the banks available from the banking
supervision department and the Central Bank of Kenya. Kothari (2008) highlights that a
questionnaire gives the respondents‟ adequate time to think through respond to questions
accordingly. The questions in the questionnaire were a forced response types and matrix
type (Likert-type scales). Kothari and Pals (1993) advocate for forced type of
questionnaires like likert-scale which ensures consistency of certain data across
respondents as opposed to the open-ended types of questions gives respondents freedom
of response hence no consistency on data collected. Likert-type questions serves to assess
the extent of persuasiveness of given campaign materials.
23
Questionnaires were self-administered on the respondents using the „drop-and-pick‟ later
method with the help of 1 graduate research assistant. This approach gave the
respondents time to compose feedback that is thoughtful and relevant to the research
problem. The research instruments were pre-tested using a sample size of 4 participants
as per recommendations by Shaughnessy, Zechmeister and Zechmeister (2006) who
observed that a fruitful pilot study employs about 10% of the actual sample size.
Participants of piloting are persons in the population with similar characteristics to, but
not those that will be used in the main study.
3.5 Data Analysis
Analysis of the data was done using a combination descriptive and inferential statistics.
The former included arithmetic mean values, standard deviations, percentages, bar and
pie charts (Kothari & Pals, 1993). The mean values enabled the researcher identify
diversification strategies most used by banks and those that have the highest impact on
bank performance. Standard deviations showed the extent to which the incidence of use
and impact on performance departs from the mean value. Multiple linear regressions
were used for modeling how independent variables relate to the dependent variables.
The final form of the model enables the researcher to predict values of the dependent
variable given values of the independent variables.

24
This model used was as follows:
Y = βo + β1Χ1+ β2Χ2+ β3Χ3+ εo
With:
Y = Bank Performance
β0 = Constant
β1 = Coefficient of product diversification strategies
β2 = Coefficient of market diversification strategies
β3 = Coefficient of internal growth diversification strategies
εo = Error term assumed to be a constant
25
CHAPTER FOUR: DATA ANALYSIS, RESULTS AND DISCUSSION
4.1 Introduction
This chapter presents data analysis and discussion of the effects of diversification
strategies on the performance of commercial banks in Kenya. Analysis of the data was
carried out using descriptive statistics with the aid of statistical package for social
sciences (SPSS).The analysis was carried out with the guidance of the research
objectives. The results are mainly presented through analysis of descriptive statistics that
indicates the relationship between the dependent variable and independent variables in
this study. The data was obtained from the senior staff involved in the strategies
formulation in various departments of the banks.
4.2 Effects of Diversification Strategies on the Performance of Commercial Banks
Diversification has been suggested as the most stable way to reducing risks, gaining
considerable competitive advantage and leveraging synergy therefore bringing a great
impact on firms‟ performance. Several strategies have been used by banks but this study
evaluated product diversification strategies, marketing diversification strategies and
internal growth diversification strategies as used by commercial banks in Kenya.
26
4.3. General Information
This sub-chapter presents the main demographic characteristics of the banks/ respondents
in the study which included composition of the bank, length of time working in the bank
and the dominant services offered by the banks. The profiling was important because it is
crucial in organizational decision making processes, strategy formulation and
implementation processes. Data was collected by use of questionnaires and analyzed and
presented by use of graphs.
4.3.1 Response Rate
The total sample population was 42 respondents. Out the 42 questionnaires sent to the
respective respondents 37 of them were filled and collected indicating an excellent
response rate of 88% as shown in the Figure 4.1.
88%
12%
Response Rate
Responses
No responses
27
Figure 4.1: Response Rate
Source; Research data (2016)
4.3.2 Composition of the Banks
The respondents were required to indicate the ownership composition of their respective
banks. The respondent‟s bank ownership was required to establish the banks versatility
in the decision making processes and banks‟ ability to out muscle competitors in terms of
number of products/services. The ownership composition included foreign owned, locally
owned, partly local and partly foreign owned, and government owned. The findings are
summarized in Figure 4.2. Findings indicated that 65% of the banks were locally owned,
35% partly foreign and partly locally owned while 5% of the commercial banks studied
were foreign owned. This shows that the banks do not have a fair playing ground with the
locally owned banks monopolizing the banking industry.
0
10
20
30
40
50
60
70
Locally owned Partly local and
foreign owned
Foreign owned
65
30
5
Per
cen
tage
Ownership
Composition of the Banks
28
Figure 4.2: Ownership composition of the Banks
Source; Research data (2016)
On the number of branches that the respective banks owned, the bank with the highest
number of branches had a locally owned bank with 173 branches and the smallest bank
had 7 branches and this was a foreign owned bank. On average most banks had more than
20 branches. This was important in the validation of the overall effectiveness in the
diversification strategies.
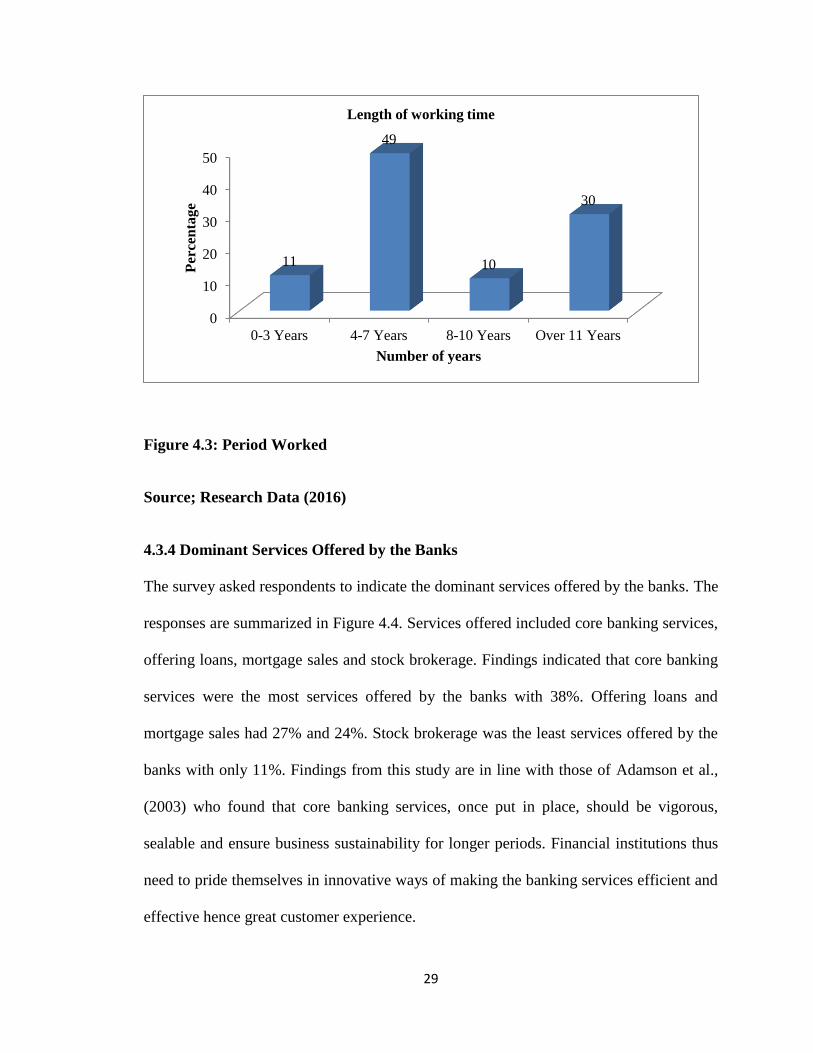
4.3.3 Length of Time Working
The participants were to state the period they had worked in the different commercial
banks. Their responses are summarized in Figure 4.3. Numbers of years were categorized
into four that is less than 3 years, between 4 years and 7 years, between 8 years and 10
years and over 11 years. Results indicated that most respondents had worked for 4-7
years (49%). Further, respondents who had worked for over 11 years were 30% while 8-
10 years and 0-3 years were 10 and 11 percentage respectively. Findings from this study
indicating that 30% of the respondents have a working experience of more than 11 years
show that most respondents were aware of the challenges in the banking sector and
strategies adopted to cope with challenges thereof. This indicates that the experience
gained is very important in ensuring that there is growth in the banking industry.
29
Figure 4.3: Period Worked
Source; Research Data (2016)
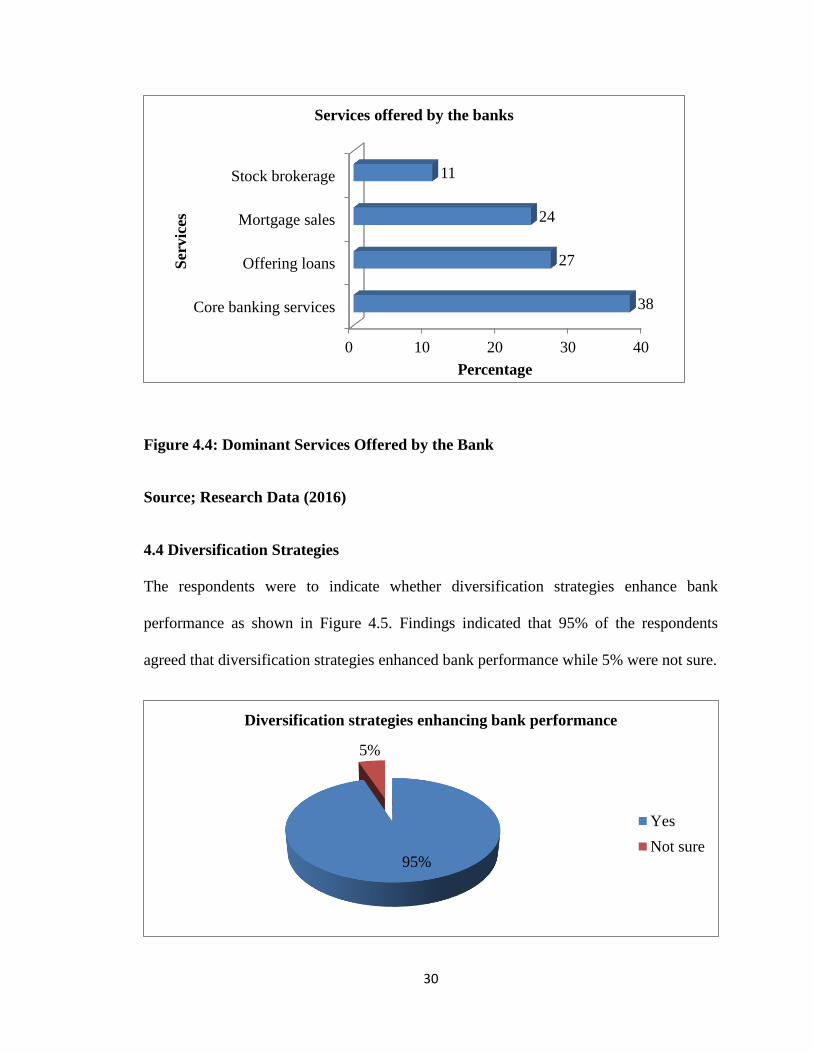
4.3.4 Dominant Services Offered by the Banks
The survey asked respondents to indicate the dominant services offered by the banks. The
responses are summarized in Figure 4.4. Services offered included core banking services,
offering loans, mortgage sales and stock brokerage. Findings indicated that core banking
services were the most services offered by the banks with 38%. Offering loans and
mortgage sales had 27% and 24%. Stock brokerage was the least services offered by the
banks with only 11%. Findings from this study are in line with those of Adamson et al.,
(2003) who found that core banking services, once put in place, should be vigorous,
sealable and ensure business sustainability for longer periods. Financial institutions thus
need to pride themselves in innovative ways of making the banking services efficient and
effective hence great customer experience.
0
10
20
30
40
50
0-3 Years 4-7 Years 8-10 Years Over 11 Years
11
49
10
30 P
erce
nta
ge
Number of years
Length of working time
30
Figure 4.4: Dominant Services Offered by the Bank
Source; Research Data (2016)
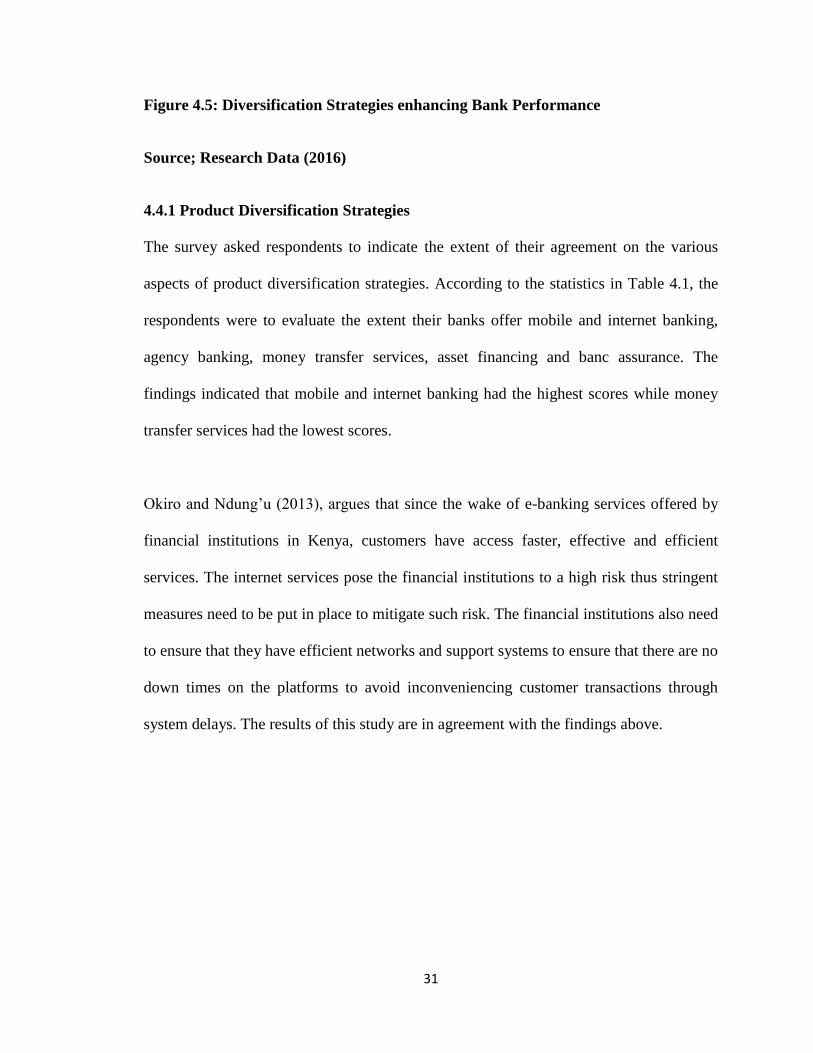
4.4 Diversification Strategies
The respondents were to indicate whether diversification strategies enhance bank
performance as shown in Figure 4.5. Findings indicated that 95% of the respondents
agreed that diversification strategies enhanced bank performance while 5% were not sure.
0 10 20 30 40
Core banking services
Offering loans
Mortgage sales
Stock brokerage
38
27
24
11
Percentage
Ser
vic
es
Services offered by the banks
95%
5%
Diversification strategies enhancing bank performance
Yes
Not sure
31
Figure 4.5: Diversification Strategies enhancing Bank Performance
Source; Research Data (2016)
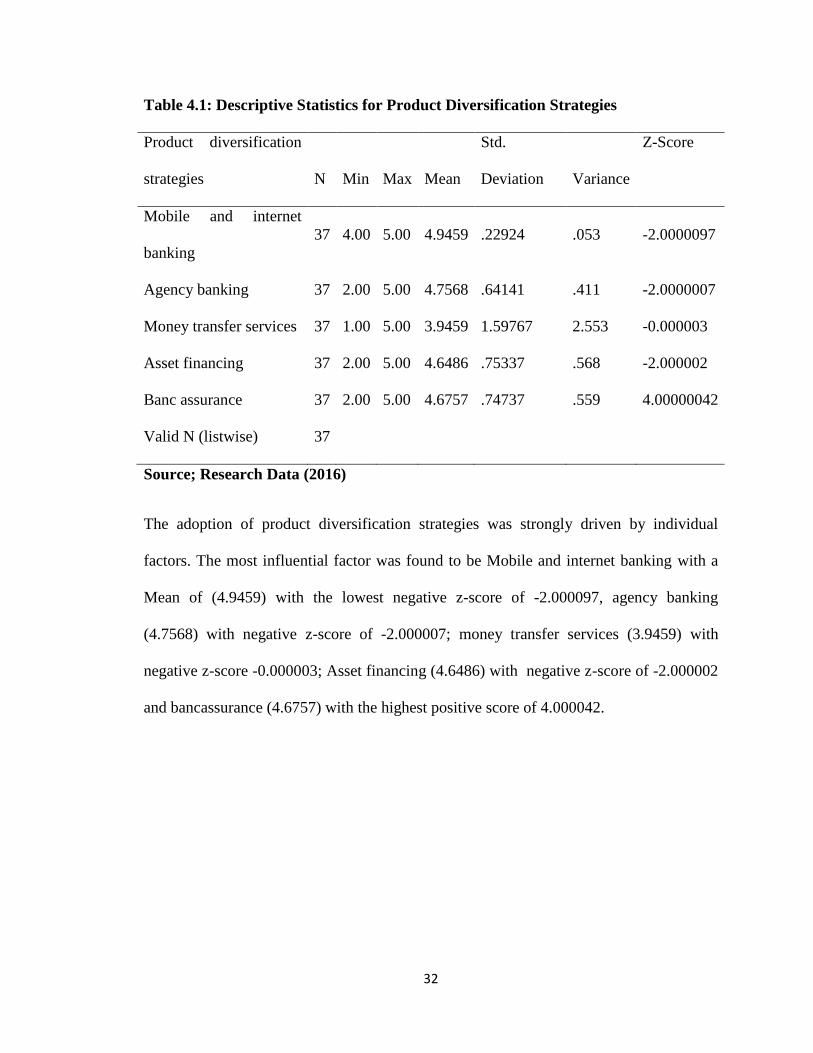
4.4.1 Product Diversification Strategies
The survey asked respondents to indicate the extent of their agreement on the various
aspects of product diversification strategies. According to the statistics in Table 4.1, the
respondents were to evaluate the extent their banks offer mobile and internet banking,
agency banking, money transfer services, asset financing and banc assurance. The
findings indicated that mobile and internet banking had the highest scores while money
transfer services had the lowest scores.
Okiro and Ndung‟u (2013), argues that since the wake of e-banking services offered by
financial institutions in Kenya, customers have access faster, effective and efficient
services. The internet services pose the financial institutions to a high risk thus stringent
measures need to be put in place to mitigate such risk. The financial institutions also need
to ensure that they have efficient networks and support systems to ensure that there are no
down times on the platforms to avoid inconveniencing customer transactions through
system delays. The results of this study are in agreement with the findings above.
32
Table 4.1: Descriptive Statistics for Product Diversification Strategies
Product diversification
strategies N Min Max Mean
Std.
Deviation Variance
Z-Score
Mobile and internet
banking
37 4.00 5.00 4.9459 .22924 .053 -2.0000097
Agency banking 37 2.00 5.00 4.7568 .64141 .411 -2.0000007
Money transfer services 37 1.00 5.00 3.9459 1.59767 2.553 -0.000003
Asset financing 37 2.00 5.00 4.6486 .75337 .568 -2.000002
Banc assurance 37 2.00 5.00 4.6757 .74737 .559 4.00000042
Valid N (listwise) 37
Source; Research Data (2016)
The adoption of product diversification strategies was strongly driven by individual
factors. The most influential factor was found to be Mobile and internet banking with a
Mean of (4.9459) with the lowest negative z-score of -2.000097, agency banking
(4.7568) with negative z-score of -2.000007; money transfer services (3.9459) with
negative z-score -0.000003; Asset financing (4.6486) with negative z-score of -2.000002
and bancassurance (4.6757) with the highest positive score of 4.000042.
33
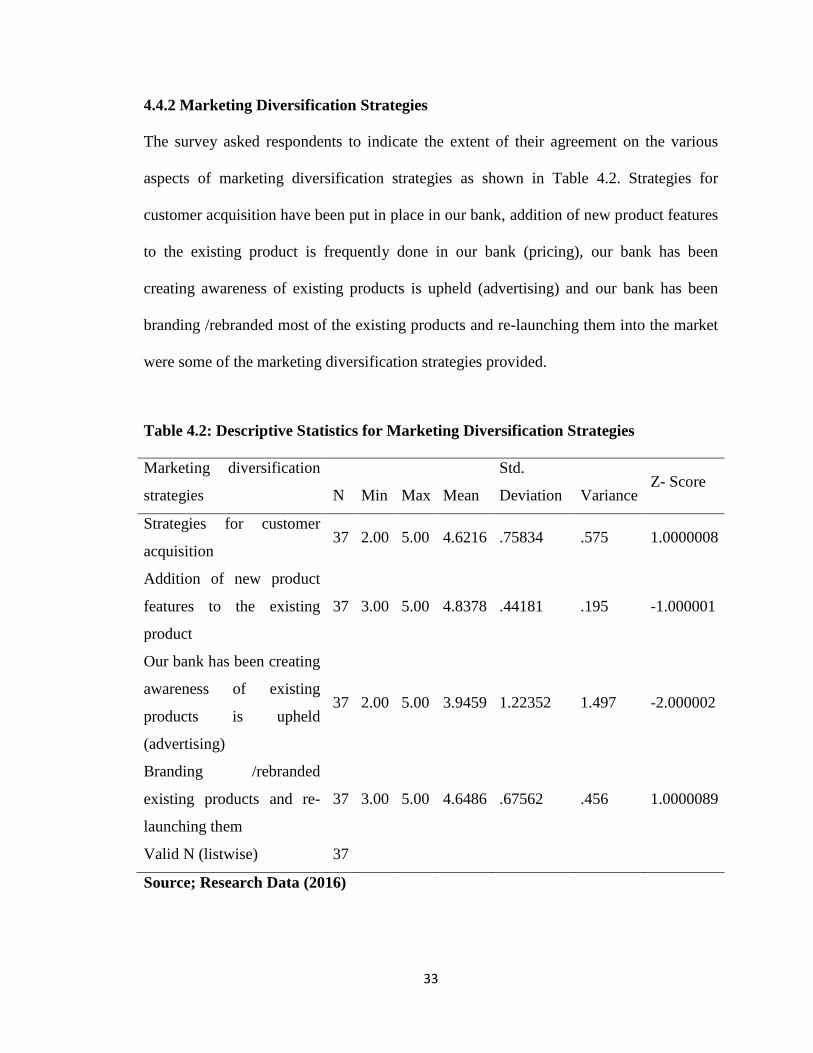
4.4.2 Marketing Diversification Strategies
The survey asked respondents to indicate the extent of their agreement on the various
aspects of marketing diversification strategies as shown in Table 4.2. Strategies for
customer acquisition have been put in place in our bank, addition of new product features
to the existing product is frequently done in our bank (pricing), our bank has been
creating awareness of existing products is upheld (advertising) and our bank has been
branding /rebranded most of the existing products and re-launching them into the market
were some of the marketing diversification strategies provided.
Table 4.2: Descriptive Statistics for Marketing Diversification Strategies
Marketing diversification
strategies N Min Max Mean
Std.
Deviation Variance Z- Score
Strategies for customer
acquisition 37 2.00 5.00 4.6216 .75834 .575 1.0000008
Addition of new product
features to the existing
product
37 3.00 5.00 4.8378 .44181 .195 -1.000001
Our bank has been creating
awareness of existing
products is upheld
(advertising)
37 2.00 5.00 3.9459 1.22352 1.497 -2.000002
Branding /rebranded
existing products and re-
launching them
37 3.00 5.00 4.6486 .67562 .456 1.0000089
Valid N (listwise) 37
Source; Research Data (2016)
34
The study further shows the extent of influence of marketing diversification strategies
through individual indicators. The most influential factor was found to be addition of new
product features to the existing product with mean (4.8378) with a negative z-score of -
1.000001. The findings of this study are in line with studies carried out by Johnson et al.,
(2008), who found out that success of a business strategy is a function of proper policies
and procedures in identifying, testing the product and efficiently rolling it out to the
market.; banking/rebranded existing products and re-launching them (4.6486) with the
positive Z-score of 1.0000089; strategies for customer acquisition (4.616) with a positive
Z-score of 1.0000008; Creating awareness of existing products (advertising) scored the
lowest mean (3.9459) with lowest negative Z-score of -2.000002.
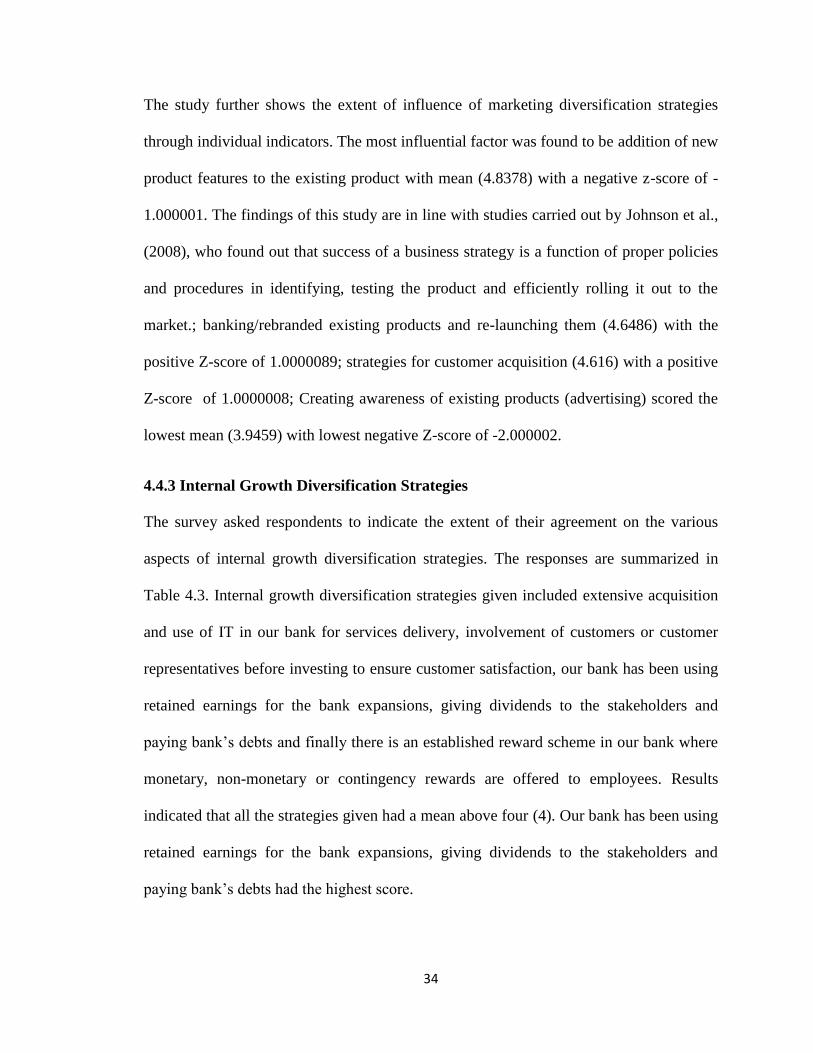
4.4.3 Internal Growth Diversification Strategies
The survey asked respondents to indicate the extent of their agreement on the various
aspects of internal growth diversification strategies. The responses are summarized in
Table 4.3. Internal growth diversification strategies given included extensive acquisition
and use of IT in our bank for services delivery, involvement of customers or customer
representatives before investing to ensure customer satisfaction, our bank has been using
retained earnings for the bank expansions, giving dividends to the stakeholders and
paying bank‟s debts and finally there is an established reward scheme in our bank where
monetary, non-monetary or contingency rewards are offered to employees. Results
indicated that all the strategies given had a mean above four (4). Our bank has been using
retained earnings for the bank expansions, giving dividends to the stakeholders and
paying bank‟s debts had the highest score.

35
On the other hand, involvement of customers or customer representatives before
investing to ensure customer satisfaction had the lowest as indicated in the Table 4.3.
Table 4.3: Descriptive Statistics for Internal Growth Diversification Strategies
Internal growth
diversification strategies N Min Max Mean
Std.
Deviation Variance
Z- Score
Acquisition and use of IT
in our bank for services
delivery
37 3.00 5.00 4.7027 .51988 .270 -0.000003
Involvement of customers
or customer representatives
for customer satisfaction
37 1.00 5.00 4.2162 1.25023 1.563 -1.000009
Retained earnings for the
bank expansions, giving
dividends to the
stakeholders and paying
bank‟s debts
37 3.00 5.00 4.8108 .46175 .213 -1.000004
Established reward scheme
where monetary, non-
monetary or contingency
rewards are offered to
employees
37 3.00 5.00 4.4054 .72493 .526 2.0000043
Valid N (listwise) 37
Source; Research Data (2016)
36
The table above shows the extent of influence of Internal Growth Diversification
Strategies through individual indicators. The most influential factor was found to be
Retained earnings for the bank expansions, giving dividends to the stakeholders and
paying bank‟s debts (4.8108) with a negative z-score of -1.000001; Acquisition and use
of IT in our bank for services delivery (4.7027) with negative Z-score of -0.000003;
Established reward scheme where monetary, non-monetary or contingency rewards are
offered to employees (4.4054) with the highest positive Z-score 2.0000043; Involvement
of customers or customer representatives for customer satisfaction (4.2162) with a
negative Z-score of -1.000009.
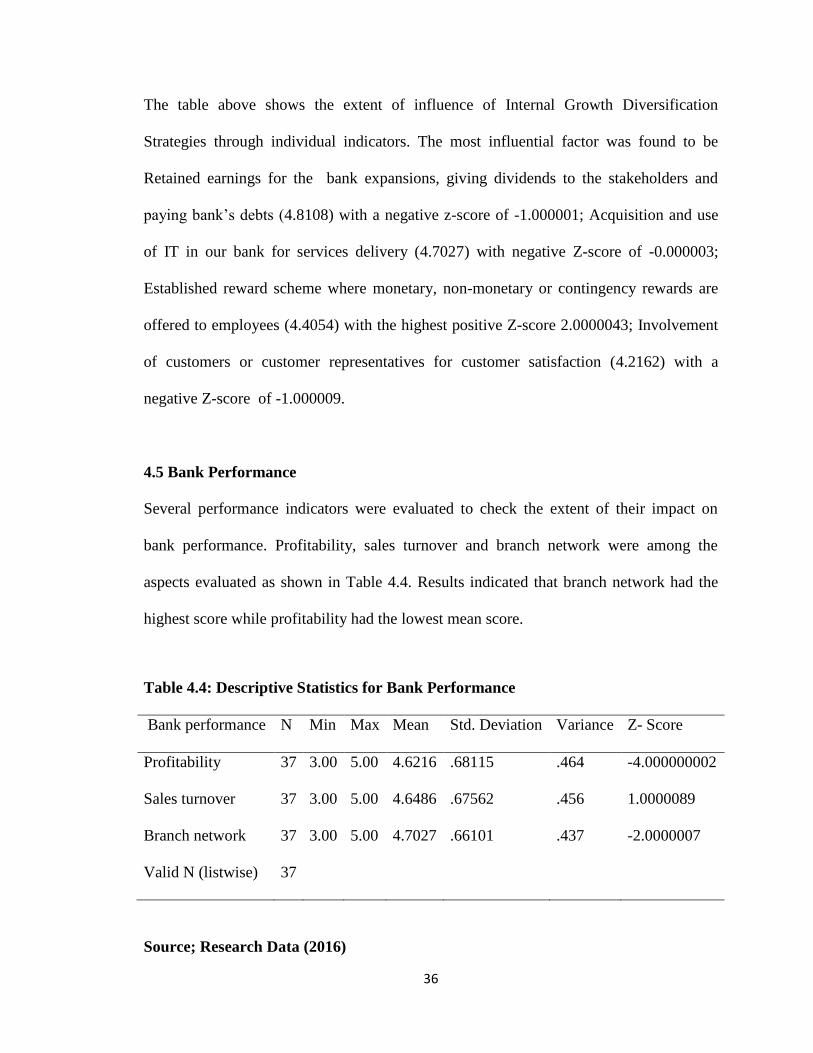
4.5 Bank Performance
Several performance indicators were evaluated to check the extent of their impact on
bank performance. Profitability, sales turnover and branch network were among the
aspects evaluated as shown in Table 4.4. Results indicated that branch network had the
highest score while profitability had the lowest mean score.
Table 4.4: Descriptive Statistics for Bank Performance
Bank performance N Min Max Mean Std. Deviation Variance Z- Score
Profitability 37 3.00 5.00 4.6216 .68115 .464 -4.000000002
Sales turnover 37 3.00 5.00 4.6486 .67562 .456 1.0000089
Branch network 37 3.00 5.00 4.7027 .66101 .437 -2.0000007
Valid N (listwise) 37
Source; Research Data (2016)
37
Table 4.4 above shows bank performance through individual indicators. The most
influential factor was found to be Branch network (4.7027) with the negative Z-score of
-2.0000007 The utility of the consumer from choosing a particular bank is positively
related to the number of its branches in an exogenously delineated market (Ishii, 2004);
Sales turnover (4.6486) with a positive Z-score of 1.0000089; the indicator with the
lowest effect was profitability (4.6216) with the lowest Z-score of -4.0000002.
4.6 Inferential Statistics
Inferential statistics creates inferences about a population from information taken from a
small sample of that population. Inferential statistics is important in social sciences
research where it allows generalization of results to a larger population. Inferential
statistics are important in social sciences research as we typically study a sample yet we
wish to reach conclusions about the larger populations from which the sample drawn.
4.6.1 Regression Analysis
The researcher did a linear regression modeling so as to indicate the relationship between
variables. The Statistical Package for Social Sciences (SPSS) was used to code, enter and
compute the measurements of the linear regression. The goodness of fit of a regression
model is measured by the coefficient of determination R2 is a statistical measure of how
well the regression line approximates the real data points. The coefficient of
determination lies between 0-1; 0 indicates an absolute lack of fit while 1represents
perfect fit. Coefficient of determination explains the relationship between the depended
variable and the independent variables.
38
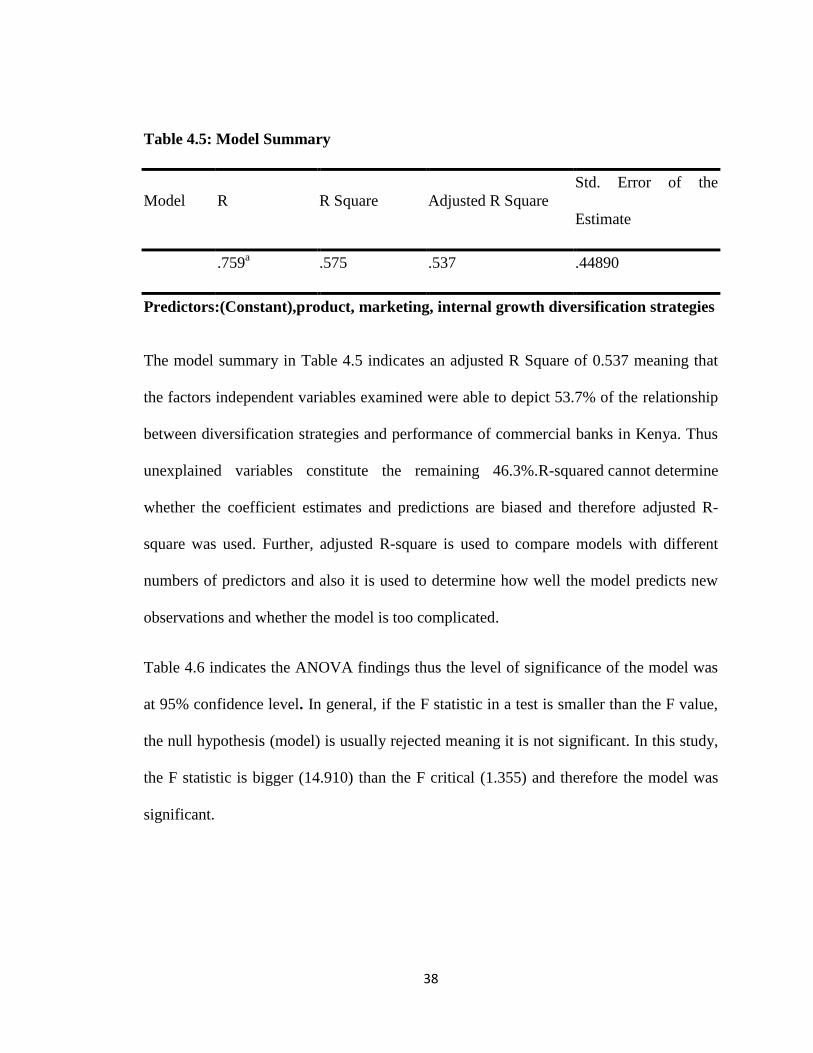
Table 4.5: Model Summary
Model R R Square Adjusted R Square
Std. Error of the
Estimate
.759a .575 .537 .44890
Predictors:(Constant),product, marketing, internal growth diversification strategies
The model summary in Table 4.5 indicates an adjusted R Square of 0.537 meaning that
the factors independent variables examined were able to depict 53.7% of the relationship
between diversification strategies and performance of commercial banks in Kenya. Thus
unexplained variables constitute the remaining 46.3%.R-squared cannot determine
whether the coefficient estimates and predictions are biased and therefore adjusted R-
square was used. Further, adjusted R-square is used to compare models with different
numbers of predictors and also it is used to determine how well the model predicts new
observations and whether the model is too complicated.
Table 4.6 indicates the ANOVA findings thus the level of significance of the model was
at 95% confidence level. In general, if the F statistic in a test is smaller than the F value,
the null hypothesis (model) is usually rejected meaning it is not significant. In this study,
the F statistic is bigger (14.910) than the F critical (1.355) and therefore the model was
significant.
39
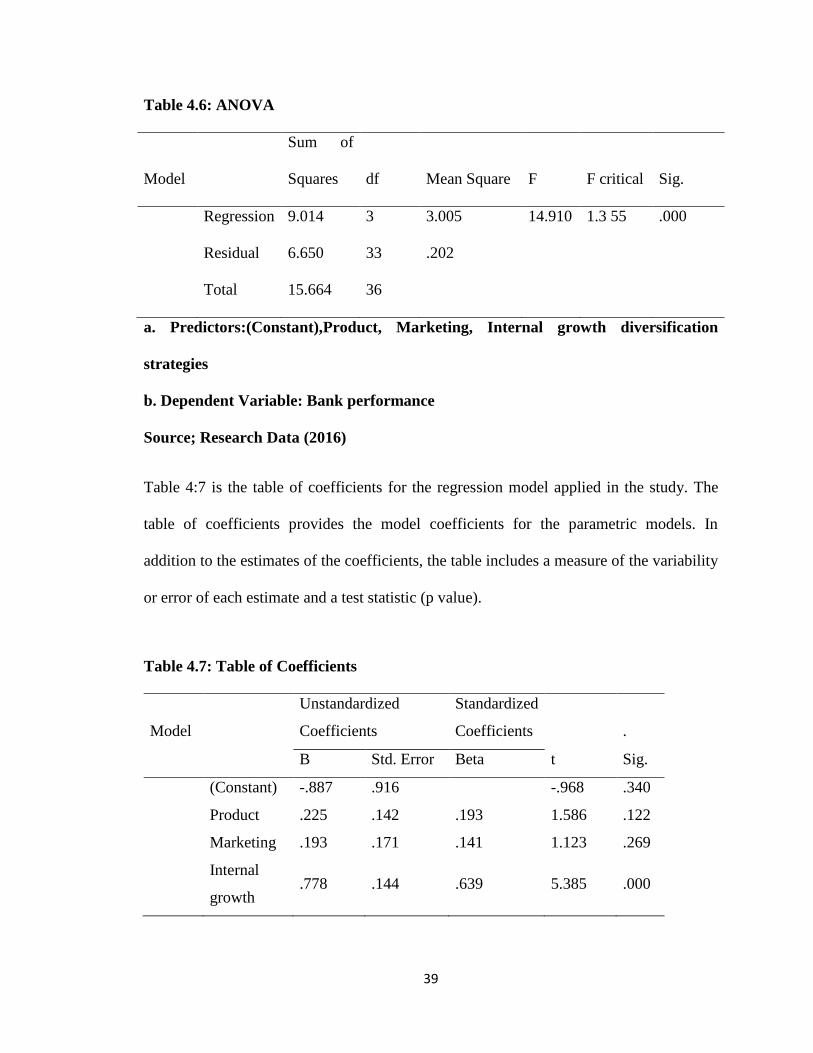
Table 4.6: ANOVA
Model
Sum of
Squares df Mean Square F F critical Sig.
Regression 9.014 3 3.005 14.910 1.3 55 .000
Residual 6.650 33 .202
Total 15.664 36
a. Predictors:(Constant),Product, Marketing, Internal growth diversification
strategies
b. Dependent Variable: Bank performance
Source; Research Data (2016)
Table 4:7 is the table of coefficients for the regression model applied in the study. The
table of coefficients provides the model coefficients for the parametric models. In
addition to the estimates of the coefficients, the table includes a measure of the variability
or error of each estimate and a test statistic (p value).
Table 4.7: Table of Coefficients
Model
Unstandardized
Coefficients
Standardized
Coefficients .
B Std. Error Beta t Sig.
(Constant) -.887 .916 -.968 .340
Product .225 .142 .193 1.586 .122
Marketing .193 .171 .141 1.123 .269
Internal
growth .778 .144 .639 5.385 .000
40
a. Dependent Variable: Bank performance
Source; Research Data (2016)
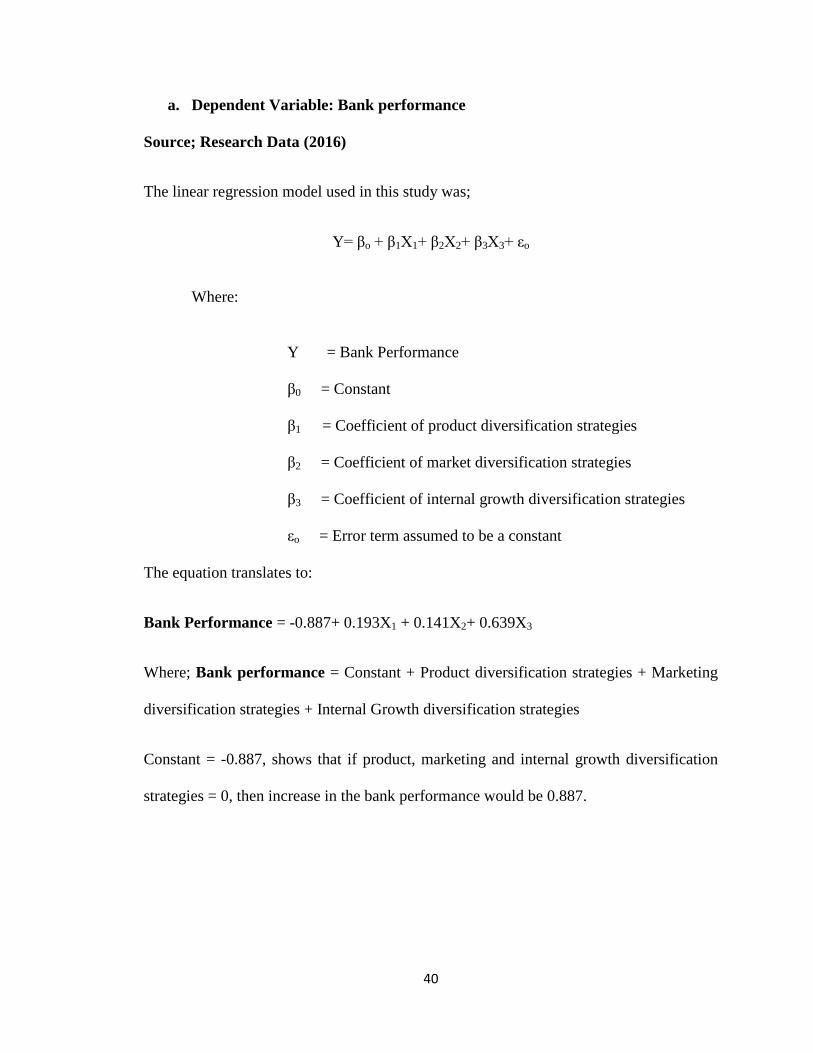
The linear regression model used in this study was;
Y= βo + β1Χ1+ β2Χ2+ β3Χ3+ εo
Where:
Y = Bank Performance
β0 = Constant
β1 = Coefficient of product diversification strategies
β2 = Coefficient of market diversification strategies
β3 = Coefficient of internal growth diversification strategies
εo = Error term assumed to be a constant
The equation translates to:
Bank Performance = -0.887+ 0.193X1 + 0.141X2+ 0.639X3
Where; Bank performance = Constant + Product diversification strategies + Marketing
diversification strategies + Internal Growth diversification strategies
Constant = -0.887, shows that if product, marketing and internal growth diversification
strategies = 0, then increase in the bank performance would be 0.887.
41
0.193X1: shows that one unit change in product diversification strategies results in 0.193
units increase in bank performance. 0.141X2: shows that one unit change in marketing
diversification strategies results 0.141units increase in bank performance. 0.639X3: shows
that one unit change in internal growth diversification strategies results 0.639units
increase in bank performance.
At 5% level of significance and 95% level of confidence, product diversification
strategies had a .122level of significance; marketing diversification strategies showed a
.269level of significance, internal growth diversification strategies showed a .000level of
significance and hence internal growth diversification strategies is the most significant
factor.
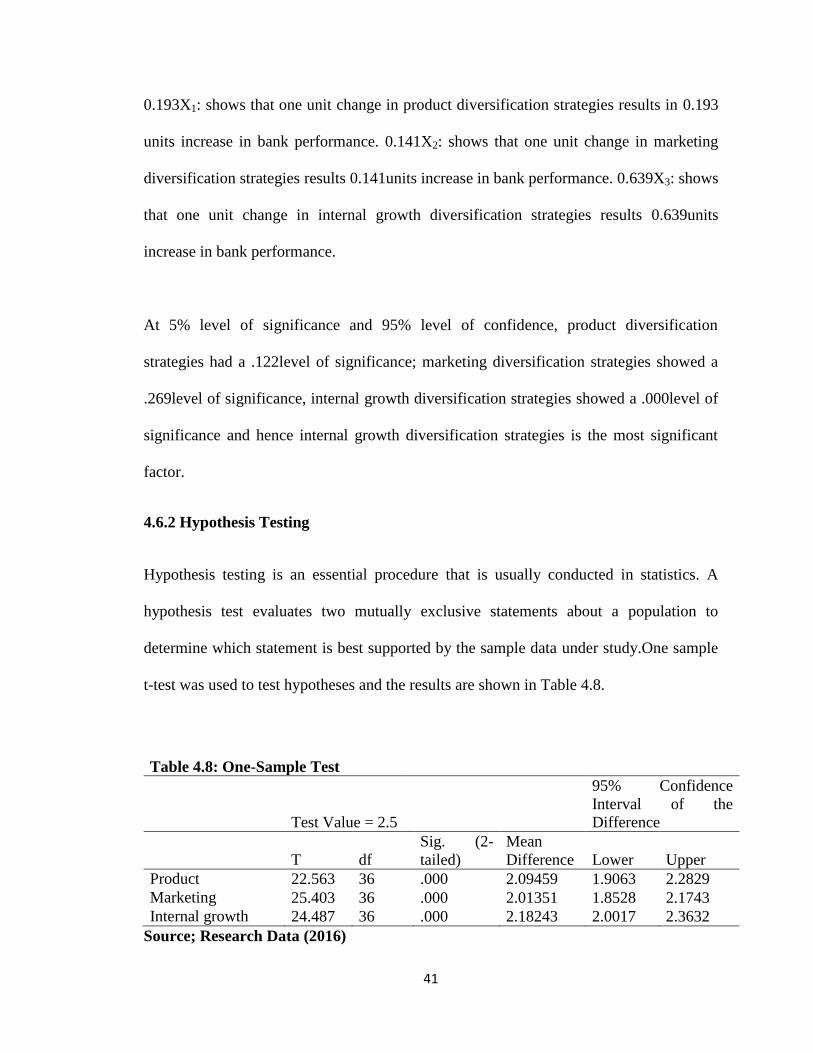
4.6.2 Hypothesis Testing
Hypothesis testing is an essential procedure that is usually conducted in statistics. A
hypothesis test evaluates two mutually exclusive statements about a population to
determine which statement is best supported by the sample data under study.One sample
t-test was used to test hypotheses and the results are shown in Table 4.8.
Table 4.8: One-Sample Test
Test Value = 2.5
95% Confidence
Interval of the
Difference
T df
Sig. (2-
tailed)
Mean
Difference Lower Upper
Product 22.563 36 .000 2.09459 1.9063 2.2829
Marketing 25.403 36 .000 2.01351 1.8528 2.1743
Internal growth 24.487 36 .000 2.18243 2.0017 2.3632
Source; Research Data (2016)
42
Hypothesis One
H01; Product diversification strategies have no significant effect on the performance of
commercial banks in Kenya.
Findings from the study indicated that the p-value is .000 which is statistically significant
at 5% level of significance. This implies that the null hypothesis is rejected therefore
product diversification strategies have significant effect on the performance of
commercial banks in Kenya.
Hypothesis Two
H02; Marketing diversification strategies have no significant effect on the performance of
commercial banks in Kenya
Findings from the study indicated that the p-value is .000 which is statistically significant
at 5% level of significance. This implies that the null hypothesis is rejected therefore
marketing diversification strategies have significant effect on the performance of
commercial banks in Kenya.
Hypothesis Three
H03; Internal growth diversification strategies have no significant effect on the
performance of commercial banks in Kenya.
Findings from the study indicated that the p-value is .000 which is statistically significant
at 5% level of significance. This implies that the null hypothesis is rejected therefore
internal growth diversification strategies have significant effect on the performance of
commercial banks in Kenya.
43
4.7 Discussion of Research Findings
Having collected and done the analysis of the data, an attempt to internalize the
information obtained from respondents of 37 commercial banks who participated in the
study has been made with the aim of identifying the various diversification strategies
adopted by commercial banks and an evaluation of the relationship of these strategies on
bank performance. Most of the respondents indicated that core banking services were the
dominating services offered by the banks. The findings were in agreement with Adamson
et al., (2003) who found out that core banking services, once put in place, should be
vigorous, sealable and ensure business sustainability for longer periods. There is
therefore need for financial institutions to pride themselves in innovative ways of making
the banking services efficient and effective hence great customer experience.
Findings from the study also showed that mobile and internet banking among agency
banking, money transfer services, asset financing and banc assurance as product
diversification strategies used by banks was the main product that most banks have
diversified into. This incorporation of related financial services is part of Kenyan banking
industry‟s solidification strategy that ensures customers have a one stop shop for all their
financial services. According to Lepetit et al., (2007), in their research in the financial
industry concluded that this eventually leads to commercial banks achieving a balanced
way to both risks reduction and leveraged synergies. There are several marketing
diversification strategies adopted by commercial banks to enhance their performance.
44
In this study, customer acquisition strategies, improving the existing products, advertising
and branding/ rebranding strategies were evaluated. Kumar (2009) contended that pricing
matters to banks because it impacts on customer satisfaction and profitability. This means
that pricing is key to customers as it determines whether the customers will acquire the
products offered in the market or not which is in line with the findings of this study.
Earnings retained by banks are key sources of financing growth that enhances business
performance. Findings from this study are in agreement with Gilchrist and Himmelberg,
(1995) who contended that the level of internal funds gives information about the growth
prospects of any firm/ organization. Growing firms will pay lower dividends, plan to
reinvest more of their earnings, and will provide a greater percentage of their total returns
as capital gains. On the other hand, firms with a few major investment opportunities
would limit paying out a larger percentage of their earnings. Consequently, higher
dividends are paid in stable, low-growth industries. On the other hand, high-growth
companies with lots of investment opportunities are likely to pay low dividends because
they have profitable uses for the capital. So, growth is likely to place a greater demand on
internally generated funds.
45
CHAPTER FIVE: SUMMARY, CONCLUSION AND RECOMMENDATIONS
5.1 Introduction
This section outlines the synopsis of major results, the wrap up obtained from the results
pointed out and the suggestions made. The findings are aimed at answering the research
question which was to ascertain the effect of diversification strategies on commercial
banks in Kenya.
5.2 Summary of Findings
5.2.1 Product Diversification Strategies
The study revealed that commercial banks have adopted several product diversification
strategies to enhance their performance. Mobile and internet banking, agency banking,
money transfer services, asset financing and banc assurance are some of the strategies
that are being employed. Mobile and Internet banking is highly employed among the
strategies evaluated.
Additionally, findings indicated that money transfer services are the least employed
product diversification strategy by the commercial banks. Findings from the study on the
z scores indicated that mobile and internet banking were significantly less than the mean.
Findings from the study also indicated that product diversification strategies had a p-
value of .000 which is statistically significant at 5% level of significance.
46
5.2.2 Marketing Diversification Strategies
There are several marketing diversification strategies that commercial banks employ.
Among the strategies evaluated in this study included strategies for customer acquisition
being put in place and addition of new product features to the existing product (pricing).
Also creating awareness of existing products (advertising) and branding /rebranded most
of the existing products and re-launching them into the market are some of the marketing
diversification strategies.
The study revealed that addition of new product features to the existing product (pricing)
and branding /rebranded most of the existing products and re-launching them into the
market are major marketing approaches employed by the population to improve
performance. The further that creating awareness of existing products through advertising
as the least employed marketing diversification strategy. Results further from the z score
indicated advertising was significantly less and below the mean among the marketing
diversification strategies evaluated.
5.2.3 Internal Growth Diversification Strategies
Internal growth diversification strategies used by commercial banks in Kenya include but
not limited to extensive acquisition and use of IT for services delivery and involvement
of customers or customer representatives before investing to ensure customer satisfaction.
Also, using retained earnings for the bank expansions, giving dividends to the
stakeholders and paying bank‟s debts and having established reward scheme where
monetary, non-monetary or contingency rewards being offered to employees. Results
from this study revealed that using retained earnings for the bank expansions, giving
dividends to the stakeholders and paying bank‟s debts is a significant internal growth
47
diversification strategy that commercial banks can adopt to enhance their performance.
On the other hand, involvement of customers or customer representatives before
investing to ensure customer satisfaction is the least internal growth diversification
strategy that can be adopted.Findings from the study indicated that internal growth
diversification had ap-value is .000 which is statistically significant at 5% level of
significance. In reference to the z scores, having an established reward scheme where
monetary, non-monetary or contingency rewards are offered to employees was
significantly less and below the mean.
5.3 Conclusion
The study concludes that commercial banks in Kenya have adopted several
diversification strategies to enhance their performance. Further, the results of the study
confirmed the existence of a significant positive relationship between diversification
strategies and bank performance. Additionally, diversification strategies have an effect on
the performance of commercial banks in Kenya.
The study concludes that banks are employing diversification strategies in attaining and
sustaining competitive advantage in the local and regional market. The study further
concludes that for banks to reach the target market more conveniently and swiftly, they
have to embrace diversification strategies as one of their focus in the overall
strategy.According to TCE and RBV theories, it is important to diversify and organize
firms‟ activities in a more efficient way as compared to the prevailing market or their
contenders. In this study, it was found that diversification strategies evaluated were
significant at 95% thus the results were in agreement with the postulations of this theory.
48
5.4 Recommendations
Several suggestions were made in the light of the findings and conclusions to assist the
management of commercial banks in Kenya to improve on their performance relative to
the use of diversification strategies. Commercial bank managers and other high level
stakeholders could apply the range of diversification strategies highlighted in expanding
the scope of markets and operations of their entities in a bid to ensure sustainable
competitive advantage. The empirical results further have implications for the regulator
(Central Bank of Kenya) who will find this study useful in advising and reviewing
applications by banks for diversification.
The results will contribute towards making necessary endorsements that will enhance a
resilient banking industry. Further, the empirical results will contribute to the steadily
growing knowledge on the effects of diversification strategies on bank performance. The
empirical results validate the current theories and paradigms. This will advance strategic
management discipline, which is still in the pre-paradigmatic stages.
5.5 Areas for Further Research
The study was carried out in a banking industry thus similar examination should be done
on other industries to ascertain the relationship between diversification approaches and
performance. Studies should be done to establish the factors driving the quality,
efficiency and effectiveness of diversification strategies in commercial banks in Kenya.
Studies should be carried out to establish if the trend being observed is sustainable in the
long run.
49
Research can also be carried out to establish the long term sustainability of diversification
strategies as a means of improving performance of commercial banks in Kenya. The
factors studied explained about 53.7% of the relationship thus still 46.5% is yet to be
studied. A researcher can conduct the study using non-financial measures of performance
indicators which are increasingly becoming important in decision making and
performance evaluation be considered in future studies.
5.6 Limitations of the Study
The major limitation of this study was accessibility of the relevant information for the
study. This was due to the sensitivity nature of the information required thus the majority
of the respondents were very reluctant to cooperate with the researcher in giving out what
they perceived as the bank‟s secrets of success. Secondly, a majority of the respondents
were holding management positions and therefore were relatively busy and not readily
available.
The findings of this study are only applicable to commercial banks in Kenya. It therefore
means that they cannot be directly applicable to other regions with different geographical
diversifications and sectors. The use of regression analysis assumes that there is an
assumption of linearity with the various models. Also, these observations are independent
of each other, homogeneity of variances exist which may not be the case.
50
REFERENCES
Acharya, V., Hasan, I., & Saunders, A. (2007).Should banks be diversified?
Evidencefrom individual bank loan portfolios. Bank for International Settlements,
BIS working Papers No 118.
Adamson 1., Chan. K., &Handford, D. (2003), “Is Core replacement a necessity”.
International Journal of Bank Marketing, 21(6), 347-58.
Amit, R., &Livnat, J. (2008).Diversification Strategies, Business Cycles andEconomic
Performance.Strategic Management Journal, 9(2), 99-106.
Ansoff, H.I., (1965). Corporate Strategy: An Analytical Approach to Business for
Growth and Expansion. New York: McGraw-Hill.
Atkearney, H. (2005). Rising to the growth challenge. A.T. Kearney Inc. Available at:
http://www.atkearney.com/shared_res/pdf/OGI_2005_S.pdf[accessed15
August2016]
Auster, E. R., Sullivan, E.,& Meredith, P. (2011). Strategic fitness: an exploratory
conceptualization. International Journal of Strategic Change Management
3(5)102-111
Babbie, E. R. (2012), The Practice of Social Research, 13th
Edition, Cen gage Learning
Boyd, H.,WestfallW.R., &Stasch, S.F. (2004).Marketing Research. Delhi: Richard D.
Irwin Inc, AITBS 7th edition.
51
Brynjolfsson, E., & Hitt, L.M. (2000). Beyond computation: information technology,
organizational transformation and business performance. Journal of Economic
Perspectives, 6(15) 43-56.
Central Bank of Kenya [CBK], (2012), Commercial Banks & Mortgage Finance
Institutions, retrieved from https://www.centralbank.go.ke
Constable, M.,& McCormick, F. (2009).Market Orientation and Company Profitability:
Further Evidence Incorporating Longitudinal Data.Australian Journal of
Management, 25(2)173-199.
Contractor, F. J., Kundu, S. K., & Hsu, C. C. (2009). A Three-Stage Theory
ofInternational Expansion: The Link between Multinationality and Performance
in the Service Sector. Journal of International Business Studies, 34(1) 5-18.
Cotugno, M., & Stefanelli, V. (2012). Geographical and product diversification duringin
stability financial period: Good or bad for banks? International Research Journal
of Finance and Economics, 85(3) 87-100.
Cresswell, J. (2003). Research Design USA: Sage Publications.
David, C.,& Dionne C. (2005).Banks‟ Loan Portfolio Diversification. Gothenburg,
Master‟s and Bachelor‟s Thesis: Handelshögskolan Vid Göteborgs Universitet.
Davis, F. D. (1989), perceived usefulness, perceived ease of use and user acceptance of
information technology, MIS Quarterly, 13(3), 319‐340
52
Dayton, C. M. (1992), Logistic Regression Analysis, Department of Measurement,
Statistics & Evaluation, Room 1230D Benjamin Building: University of Maryland
Deng S.E.,&Elyasiani, E. (2008). Geographic diversification, bank holding
company value, and risk. Journal of Money, Credit and Banking, 40(6)313‐329.
Diamond, D.(1984).Financial Intermediation as Delegated Monitoring: A Simple
Example
Dibb, S. (2007).The impact of the changing marketing environment in thePacific Rim:
four case studies. International Journal of Retail and Distribution
Management,24(7) 48-61
D‟Souza, C., & Lai, A. (2009).Does Diversification Improve Bank Efficiency?
TheEvolving Financial System and Public Policy, Proceedings of a conference
held by the Bank of Canada, Ottawa.
Eisenhardt, K.M. (1985). Control: Organizational and economic approaches.Management
Science.
Eisenhardt, K.M. (1989). Agency theory: An assessment and review. Academy of
Management Review.
53
Emefiele, G.I. (2008). Why Zenith Bank opted for organic growth instead of merger and
acquisition.
Fang, Y., Hasan, I.,&Marton, K. (2011). Institutional development and its impacton the
performance effect of bank diversification: Evidence from transitioneconomies.
Emerging Markets Finance & Trade, 47(4), 5-22.
Foss, N. (1998). The Resource-Based Perspective: An Assessment and Diagnosis of
Problems. Scandinavian Journal of Management, 14(3) 133-149.
Ghauri, P.,&Gronhaug, K. (2005).Research Methods in Business Studies, A practical
Guide.3rd ed. Pearson Education Limited, London.
Gilchrist, S.,&Himmelberg, C.(1995).Evidence on the role of cash flow for investment.
Journal of Monetary Economics, 36(3) 541–572.
Goetz, M. (2008). Quantitative Analysis Unit. Bank Diversification, Market Structureand
Bank Risk Taking: Theory and Evidence from U.S. Commercial Banks.Boston:
Working Paper No. QAU12-2, Federal Reserve Bank of Boston.
Goold, M., & Campbell, A. (2008).Desperately seeking synergy.Harvard Business
Review, 76(5) 131 143.
Grant, R.M. (2008). Contemporary Strategy Analysis: Concepts, Techniques,
Applications, 3rded., Blackwell Business, Malden: MA.
Groves, R. M., Fowler, F. J., Couper, M. P., Lepkowski, J. M., Singer, E.,&Tourangeau,
R. (2009).Survey Methodology, New Jersey: John Wiley & Sons
54
Harzing, A.W. (2010). An empirical analysis and extension of the Bartlett and
Ghoshaltypology of multinational companies, Journal of International Business
Studies, 31(1)101-20.
Hitt, M. A. & Ireland, R.D. (2005).Corporate distinctive competence, strategy, industry
and performance, Strategic Management Journal, 6(3) 12-24.
Hughes, J., &Mester, L. (2008). Bank Capitalization and Cost: Evidence of Scale
Economies in Risk Management and Signaling.Review of Economics and
Statistics 80(2), 314-325.
Ishii, J. (2004). Interconnection and Compatibility in Network Industries: ATM
Networks in the Banking Industry, Harvard University, working paper.
Jensen, M.,&Meckling, W. (1976), Theory of the firm: Managerial behaviour, agency
costs and ownership structure.
Johnson G., Sholes K., &Whittington R. (2008).Exploring Corporate strategy, 8th
Edition, Pearson Prentice Hall: Harlow
Jones, G. R., & Hill, C. W. L. (2008). Transaction cost analysis of strategy structure
choice. Strategic Management Journal, 9(2)159-172.
55
KiyohikoI., & Rose, E.L. (2008). Advances in International Management, A journal on
M&A’s in Japanese banking industry, 17(2) 139-157
Kothari, C. R. (2008). Research methodology: Methods and techniques. New Delhi: New
International Publishing.
Kothari, N.,& Pals, D. (1993).Introduction to Educational Research,Njoro: Egerton
University.
Kumar, M. V. S. (2009). The relationship between product and
internationalDiversification: the effects of short-run constraints and endogeneity.
StrategicManagement Journal, 30(1) 99-116.
Leontiades, M. (2009).The Rewards of Diversifying into Unrelated Businesses.
Journal of Business Strategy, 6(4) 81-87
Lepetit L., Nys E., Rous P., and Tarazi A. (2007), Product Diversification in the
European Banking Industry: Risk and Loan Pricing implications, Strategic
Management Journal,33(1) 11-26
Liao, H., & Chuang, A. (2004).A multilevel investigation of factors influencing
employee service performance and customer outcomes. Academy of Management
Journal, 47(1), 41-58.
56
Luthans, F., Avolio, B. J., Avey, J. B., & Norman, S. M. (2007). Positive psychological
capital: Measurement and relationship with performance and satisfaction.
Personnel psychology, 60(3) 541-572.
Maxine, C.W (2012).Employee Perception of the Relationship Between Competitive
Strategies and Performance in Barclays Bank (K) Limited. Unpublished MBA
project, University of Nairobi, Mombasa: Kenya.
Mbwayo, M. M. (2005). Strategies Applied by Commercial Banks in Kenya in Anti
Money Laundering Compliance Programs, unpublished MBA project:
KenyattaUniversity.
Miller, D. J. (2009). Technological diversity, related diversification, and firm
performance. Strategic Management Journal, 27(7) 601-619.
Montgomery, C. A., (2008). Corporate Diversification.The Journal of Economic
Perspectives, 8(3) 163-178.
Moon, G. (1996). Efficient Banking Under Interstate Branching. Journal of Money
Credit and Banking,28(4) 1043-1071.
Mugenda, O.M.,&Mugenda, A.G. (2003).Research Methods, Quantitative &
Qualitative Approaches, Acts Press: Nairobi.
57
Murimiri, S.W. (2009) Competitive Business Strateg y and Firms Performance of the
Commercial Banks in Kenya. Unpublished MBA project, University of Nairobi,
Nairobi: Kenya.
Nyatich, V. (2009), Competitive Strategies Adopted by Multinational Banks in Kenya.
Unpublished MBA project, University of Nairobi, Nairobi: Kenya.
OkiroK.,&Ndung‟u J. (2013). The impact of mobile and internet banking on performance
of financial institutions in Kenya.European Scientific Journal, 9(13) 146-161.
Pandey, I. M. (1999).Financial Management.8th Ed. New Delhi: Vikas Publishing
House
Paramasivan, C.,& Subramanian T. (2009).Financial Management.NewDelhi:New age
International Ltd
Pearce, J.A.,& Robinson, R.B. (2007).Strategic Management, Formulation,
Implementation and control, (10th Ed.). New York: McGraw Hill/Irwin.
Samaras, V. (2007).Internal versus external growth: impact on operational and market
Performance. Available at: Smits, H.N.J. and J.M. Groeneveld (2001),
Reflections on Strategic Renewal at Rabo bank
Saona, P. H. (2011). Determinants of the Profitability of the US Banking
Industry.International Journal of Business and Social Science, 2(22) 255-269.
58
Saunders, M., Lewis, P. &Thornhill, A. (2003), Research Methods for Business Students,
3rd Edition, Pitman Publishing: London
Stiroh, K.J. (2008a). Do community banks benefit from diversification? Journal of
Financial Services Research, 25(2/3) 135-160.
Stiroh, K.J. (2008b). Diversification in banking: Is noninterest income the answer?
Journal of Money, Credit, and Banking, 36(5) 853-882.
Stiroh, K.J.,& Rumble, A. (2009). The dark side of diversification: The case of U.S.
financial holding companies. Journal of Banking & Finance, 30(8) 2131–
2161.
Tabak, B.M., Fazio, D.M.,&Cajuerio, D.O. (2010).The Effects of Loan Portfolio
Concentration on Brazilian Banks’ Return and Risk.Banco Central Do Brazil:
Working Papers No 215.
Torrington, D. P. (2002).Human resource management and the personnel function, in J.
Storey, (ed) New Perspectives on Human Resource Management, London:
Routledge
Warucu G. (2001). Competitive Strategies Employed by Commercial Banks, unpublished
MBA project.

59
Wheeller, L.T.,&Hunger,J.D. (2008). Strategic Management and business policy:
concepts and cases, 11th Edition, New Jersey, Prentice Hall.
Williamson, O. (1985). The economic institutions of capitalism: Firms, markets,
relational contracting. New York: Free Press.

60
APPENDICES
Appendix I: Letter of Introduction
Anne Nyachomba Mwangi
University of Nairobi,
School of Business,
P O BOX30197 – 00100,
Kenya.
Re: Management Research
I am a master‟s student undertaking a student undertaking Masters in Business
Management from the University of Nairobi I am currently developing a management
research project whose theme is an enquiry on the Effect of diversification strategies on
Performance of Commercial Banks in Kenya. To this end, I kindly request you to provide
the requested information by filling out the attached questionnaire. The information
required is purely for academic research purposes only and in no way will your name or
that of your institution be implicated in the research findings.
Your co-operation and quick response shall be highly appreciated.
Yours respectfully,
AnneNyachombaMwangi

61
Appendix II: Questionnaire
Section A: Bank Bio-Data
1. Please indicate the name of your bank
______________________________________
2. Below, indicate the ownership composition of your bank.
i. Foreign Owned ( )
ii. Locally Owned ( )
iii. Partly local and partly foreign owned ( )
iv. Government Owned ( )
3. How many branches does your bank have?
__________________________________
4. How long have you worked in the bank?
0-3Years [ ] 4-7 years [ ] 8-10 years [ ] Over 11 years [ ]
5. What are the dominating services offered by your Bank? (Please tick appropriate)
a) Core banking services [ ]
b) Offering loans [ ]
c) Mortgage sales [ ]
d) Stock brokerage [ ]
Section B: Diversification strategies
6. Do you think diversification strategies enhance bank performance?
YES [ ] NO [ ] Not Sure [ ]
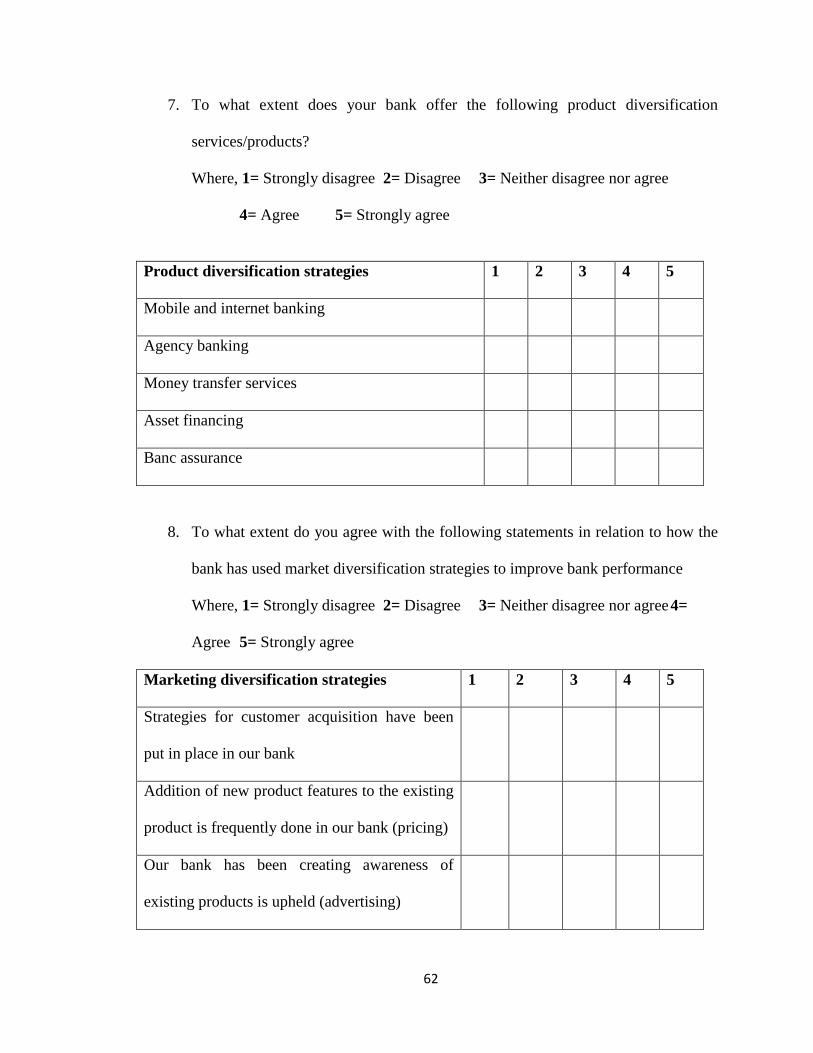
62
7. To what extent does your bank offer the following product diversification
services/products?
Where, 1= Strongly disagree 2= Disagree 3= Neither disagree nor agree
4= Agree 5= Strongly agree
Product diversification strategies 1 2 3 4 5
Mobile and internet banking
Agency banking
Money transfer services
Asset financing
Banc assurance
8. To what extent do you agree with the following statements in relation to how the
bank has used market diversification strategies to improve bank performance
Where, 1= Strongly disagree 2= Disagree 3= Neither disagree nor agree 4=
Agree 5= Strongly agree
Marketing diversification strategies 1 2 3 4 5
Strategies for customer acquisition have been
put in place in our bank
Addition of new product features to the existing
product is frequently done in our bank (pricing)
Our bank has been creating awareness of
existing products is upheld (advertising)
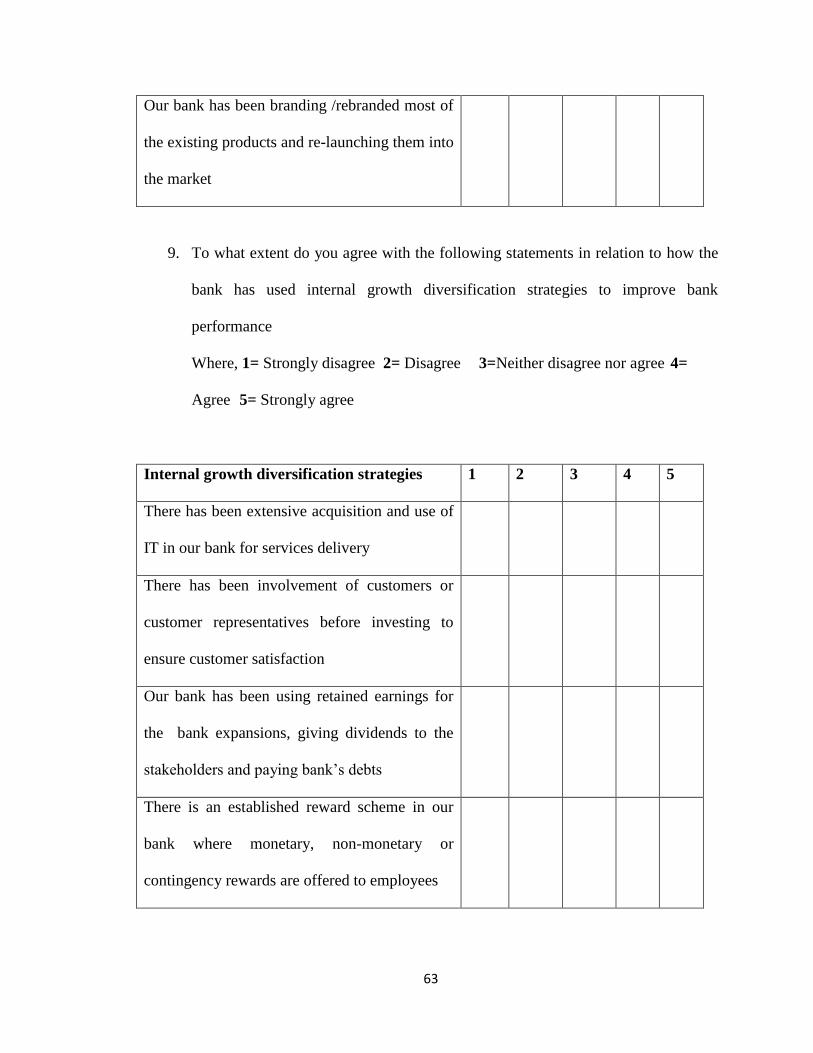
63
Our bank has been branding /rebranded most of
the existing products and re-launching them into
the market
9. To what extent do you agree with the following statements in relation to how the
bank has used internal growth diversification strategies to improve bank
performance
Where, 1= Strongly disagree 2= Disagree 3=Neither disagree nor agree 4=
Agree 5= Strongly agree
Internal growth diversification strategies 1 2 3 4 5
There has been extensive acquisition and use of
IT in our bank for services delivery
There has been involvement of customers or
customer representatives before investing to
ensure customer satisfaction
Our bank has been using retained earnings for
the bank expansions, giving dividends to the
stakeholders and paying bank‟s debts
There is an established reward scheme in our
bank where monetary, non-monetary or
contingency rewards are offered to employees

64
10. BANK PERFORMANCE
To what extent has the bank experienced improved performance in the following
areas:
Where, 1= None 2= Fairly 3= Moderate 4= High 5= Very High
Bank performance 1 2 3 4
5
Profitability
Sales turnover
Branch network
THANK YOU

65
Appendix III: Commercial Banks
1.ABC Bank (Kenya)
2.Bank of Africa
3.Bank of Baroda
4.Bank of India[3]
5.Barclays Bank of Kenya
6.CfC Stanbic Holdings
7. Chase Bank Kenya (In Receivership)
8. Citibank
9. Commercial Bank of Africa
10. Consolidated Bank of Kenya
11. Cooperative Bank of Kenya
12. Credit Bank
13. Development Bank of Kenya
14. Diamond Trust Bank
15.Ecobank Kenya
16. Equity Bank
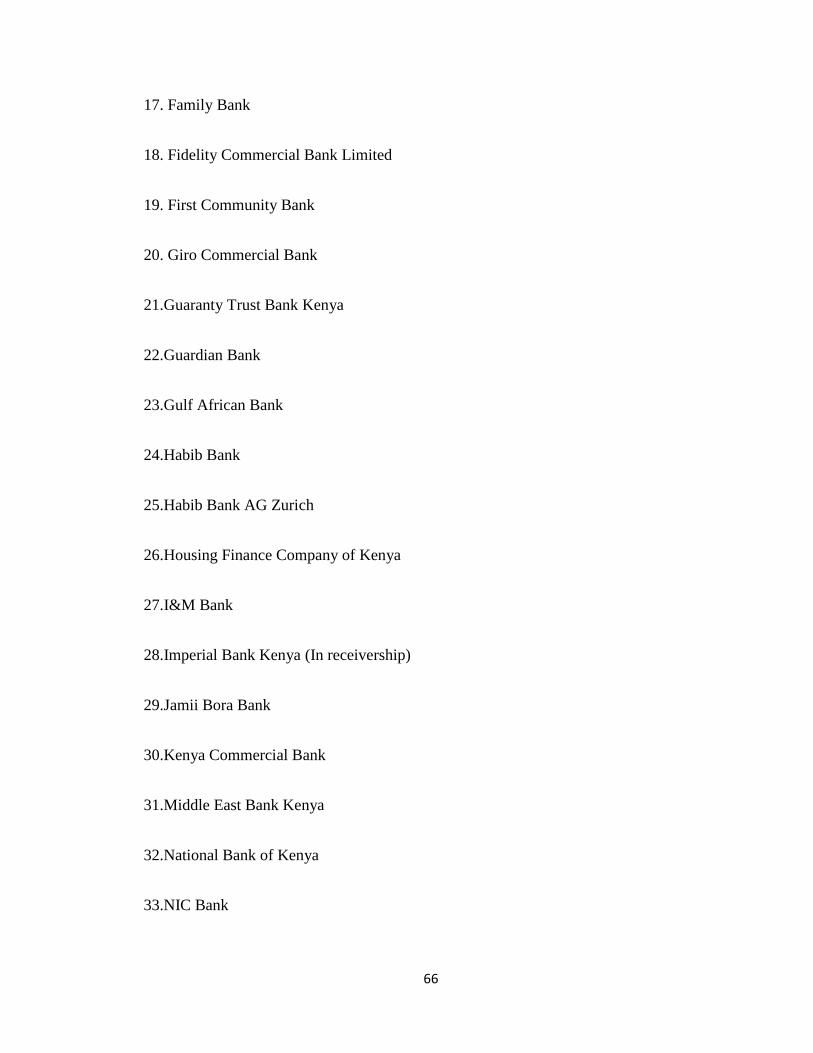
66
17. Family Bank
18. Fidelity Commercial Bank Limited
19. First Community Bank
20. Giro Commercial Bank
21.Guaranty Trust Bank Kenya
22.Guardian Bank
23.Gulf African Bank
24.Habib Bank
25.Habib Bank AG Zurich
26.Housing Finance Company of Kenya
27.I&M Bank
28.Imperial Bank Kenya (In receivership)
29.Jamii Bora Bank
30.Kenya Commercial Bank
31.Middle East Bank Kenya
32.National Bank of Kenya
33.NIC Bank

67
34.Oriental Commercial Bank
35.Paramount Universal Bank
36.Prime Bank (Kenya)
37.Sidian Bank
38.Spire Bank
39.Standard Chartered Kenya
40.Trans National Bank Kenya
41.United Bank for Africa
42.Victoria Commercial Bank
Source: CBK 2013