the effect of compensation structures on employee mobility ... · influence the mobility and...
TRANSCRIPT

The Effect of Firm Compensation Structures on the Mobility and Entrepreneurship of Extreme Performers
Seth CarnahanRajshree Agarwal
U of Maryland
Ben CampbellOhio St U

The small print…
The research in this paper was conducted while Ben Campbell and Seth Carnahan had Special Sworn Status as researchers of the U.S. Census Bureau at the Chicago Census Research Data Center. Research results and conclusions expressed are those of the authors and do not necessarily reflect the views of the Census Bureau. This research has been screened to insure that no confidential data are revealed.
Ross the Boss
He who will remain anonymous

Research QuestionHow does the firm’s compensation structure
influence the mobility and entrepreneurship decisions of employees who differ in their performance?

Compensation Structure and Individual Performance and Earnings
Compressed Pay Structure
Dispersed Compensation Structure
Individual Performance
Individual Earnings
H1
H2

Employee Perform.
Pay Dispersion
L
HighLow
H
Entrepreneurship
Bringing in Entrepreneurship
H3
H4
Context
Employer-employee linked data in the legal services industry Longitudinal Employer-Household Dynamics (LEHD) Project
available at the Census Research Data Centers. The data are longitudinal spanning over 10 years and covering 10
large states. We can see the wages and demographics of all workers who have
ever worked in the legal services industry from all firms that have ever reported operating in the legal services industry.
Empirical Strategy
1. Identify extreme performers as those in the top and bottom 10% of firm’s wage residual distribution
2. Measure compensation structure of firms using Gini coefficient
3. Estimate linear probability model on mobility and mobility to start-up. Controls: Age, Education, Tenure, Gender, Race, etc. Firm-year fixed effects and robust standard errors
clustered by firm-year
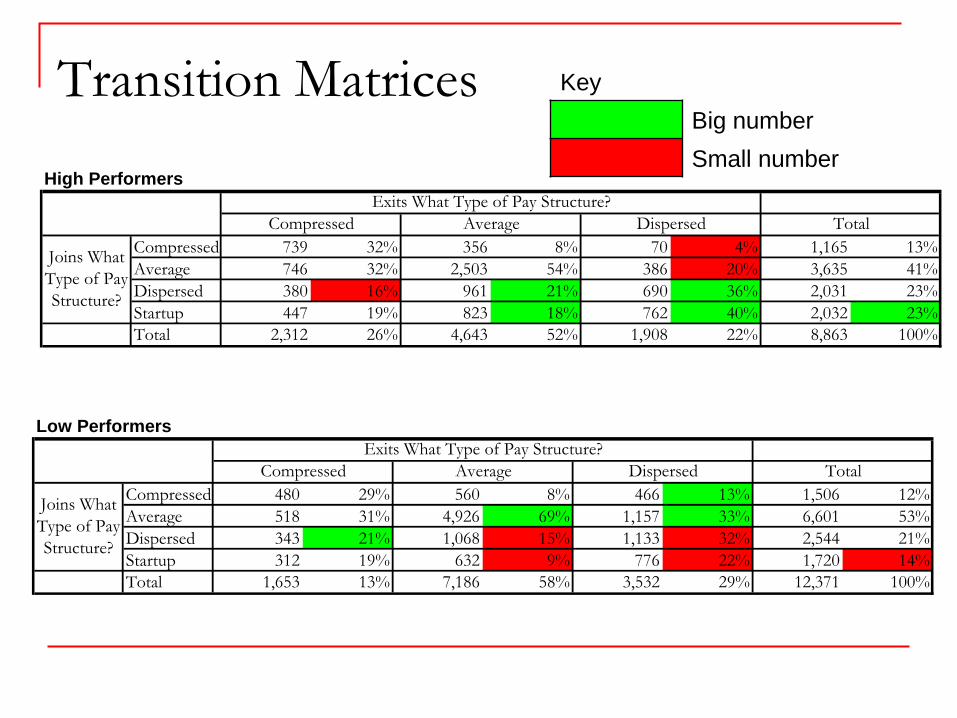
Transition Matrices KeyBig numberSmall number
High Performers
Compressed 739 32% 356 8% 70 4% 1,165 13%Average 746 32% 2,503 54% 386 20% 3,635 41%Dispersed 380 16% 961 21% 690 36% 2,031 23%Startup 447 19% 823 18% 762 40% 2,032 23%Total 2,312 26% 4,643 52% 1,908 22% 8,863 100%
Joins What Type of Pay Structure?
Exits What Type of Pay Structure?Compressed Average Dispersed Total
Low Performers
Compressed 480 29% 560 8% 466 13% 1,506 12%Average 518 31% 4,926 69% 1,157 33% 6,601 53%Dispersed 343 21% 1,068 15% 1,133 32% 2,544 21%Startup 312 19% 632 9% 776 22% 1,720 14%Total 1,653 13% 7,186 58% 3,532 29% 12,371 100%
Joins What Type of Pay Structure?
Exits What Type of Pay Structure?Compressed Average Dispersed Total

Results
High performer*Wage Dispersion H1 -0.0458 ** H3 0.1304 **
Low performer*Wage Dispersion H2 0.0349 ** H4 -0.0474
Startup|MobilityMobilityDependent Variable
Independent V
ariables
Supported Supported
Supported Mixed Support
What We Hope You Will Remember Managerial Implications Human resource and knowledge management practices are
inextricably linked Extreme rewards will retain high performers BUT these firms need to be aware of the risk of spinout creation Spinout creation is worse for parent firm performance than mobility to
established firms (Campbell, et al. 2010; Wezel, et al. 2006)
Policy Implications High performers require the best pecuniary and nonpecuniary
incentives and will create them via entrepreneurship if necessary Policy focus should be on how to encourage the most productive
people to engage in new (small) firm creation. Employee entrepreneurs are the most successful among new firms (Agarwal
et al, 2004), they are critical to economic recovery We have identified what types of people leave what types of firms to start new
firms (as opposed to join other established and bigger firms).

Thank you!

Results
N = 1,869,633 ; N groups = 87,273 ; R-sq = .0160
N = 149,392 ; N groups = 41,306 ; R-sq = .0278
Prediction Result
High Perform*Gini H1 - -0.0458 **
Low Perform*Gini H2 + 0.0349 **
Model 1, DV: Mobility
•A one standard deviation increase in Gini results in a 8% decrease in the probability that a high performer leaves the firm.
•A one standard deviation increase in Gini results in a 4% increase in the probability that a low perfomer leaves the firm.
Results
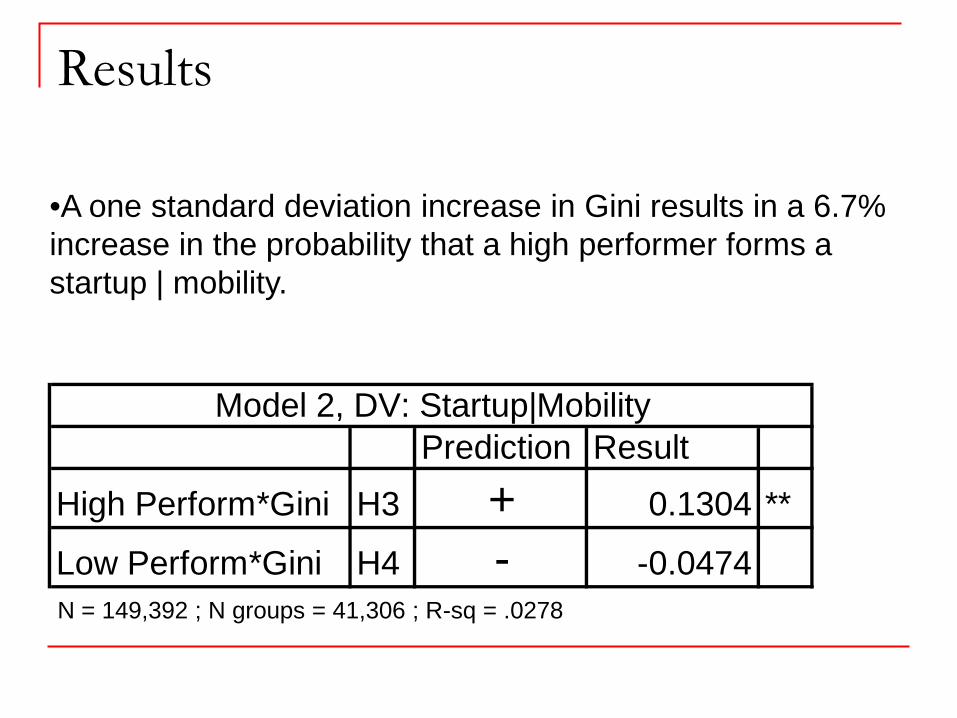
•A one standard deviation increase in Gini results in a 6.7% increase in the probability that a high performer forms a startup | mobility.
Prediction Result
High Perform*Gini H3 + 0.1304 **
Low Perform*Gini H4 - -0.0474
Model 2, DV: Startup|Mobility
N = 149,392 ; N groups = 41,306 ; R-sq = .0278
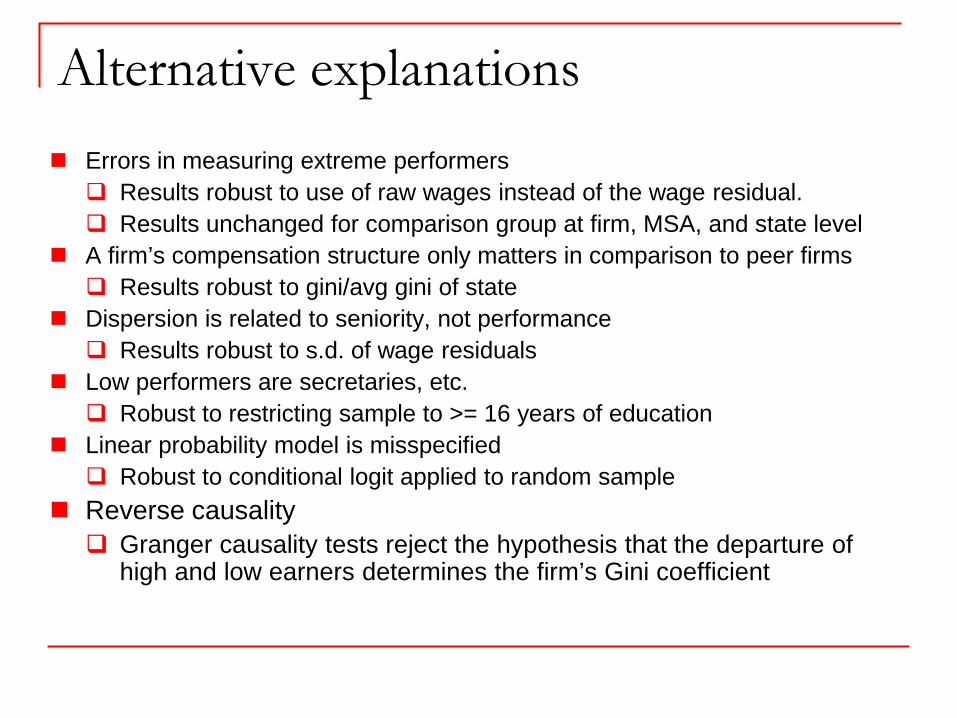
Alternative explanations Errors in measuring extreme performers Results robust to use of raw wages instead of the wage residual. Results unchanged for comparison group at firm, MSA, and state level
A firm’s compensation structure only matters in comparison to peer firms Results robust to gini/avg gini of state
Dispersion is related to seniority, not performance Results robust to s.d. of wage residuals
Low performers are secretaries, etc. Robust to restricting sample to >= 16 years of education
Linear probability model is misspecified Robust to conditional logit applied to random sample
Reverse causality Granger causality tests reject the hypothesis that the departure of
high and low earners determines the firm’s Gini coefficient
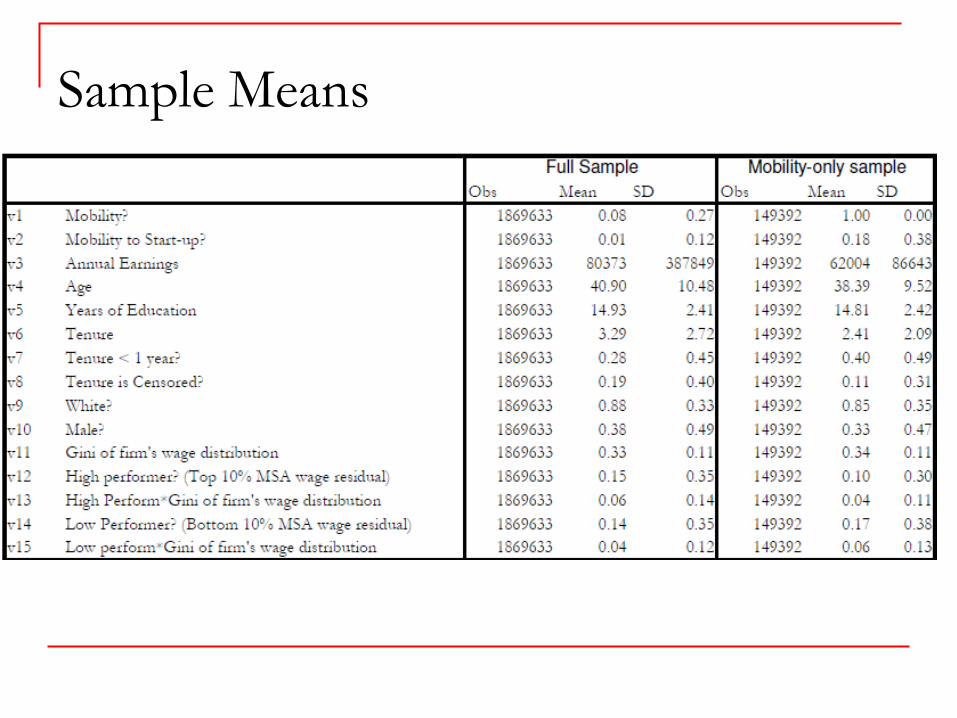
Sample Means
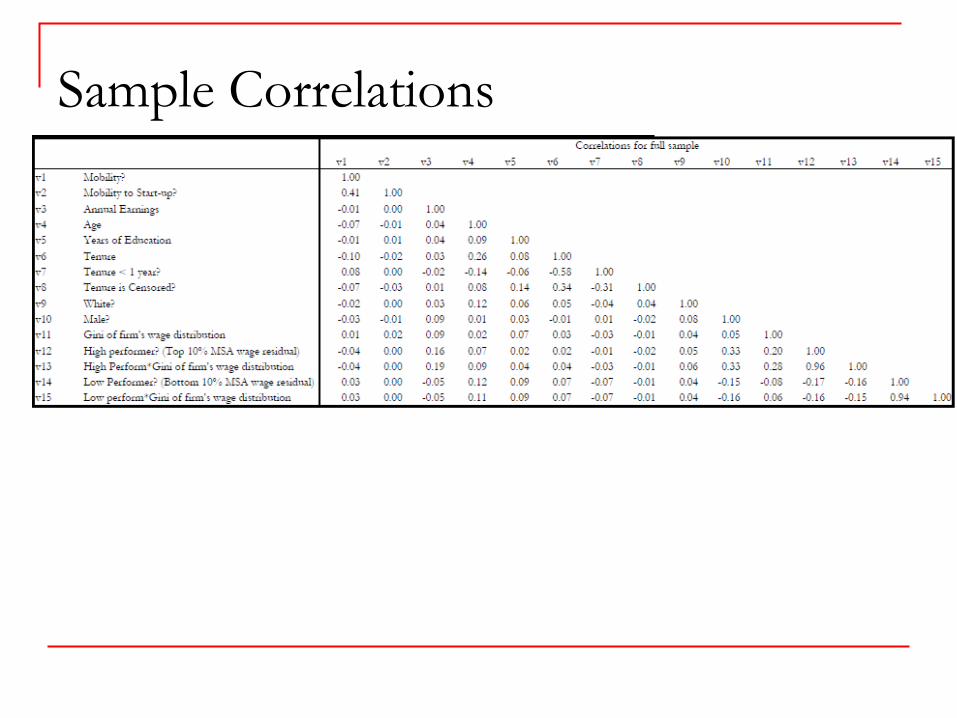
Sample Correlations
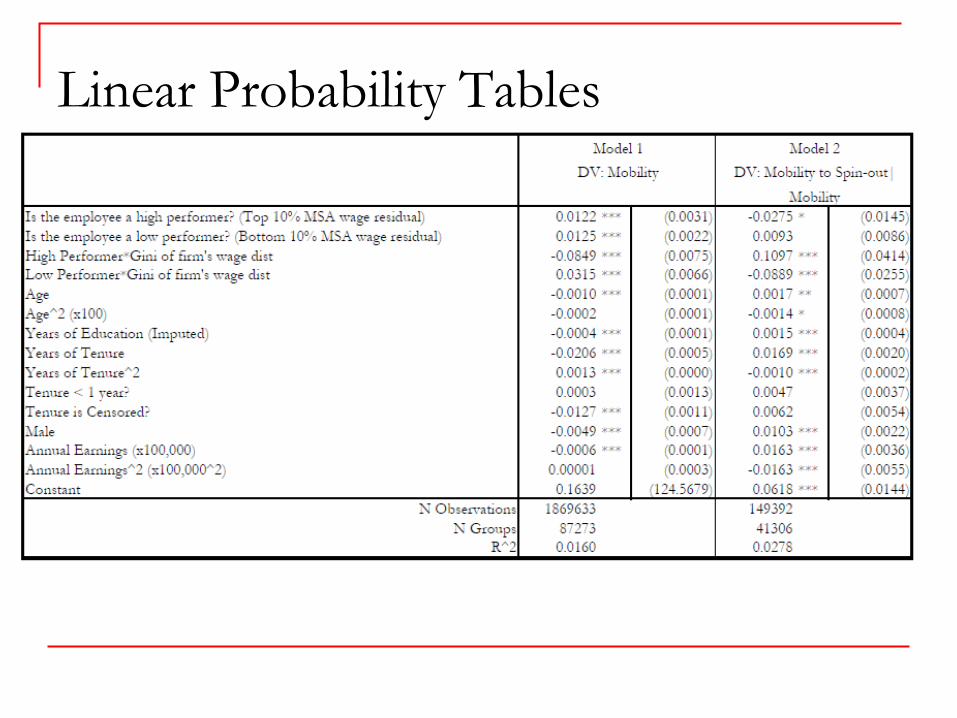
Linear Probability Tables
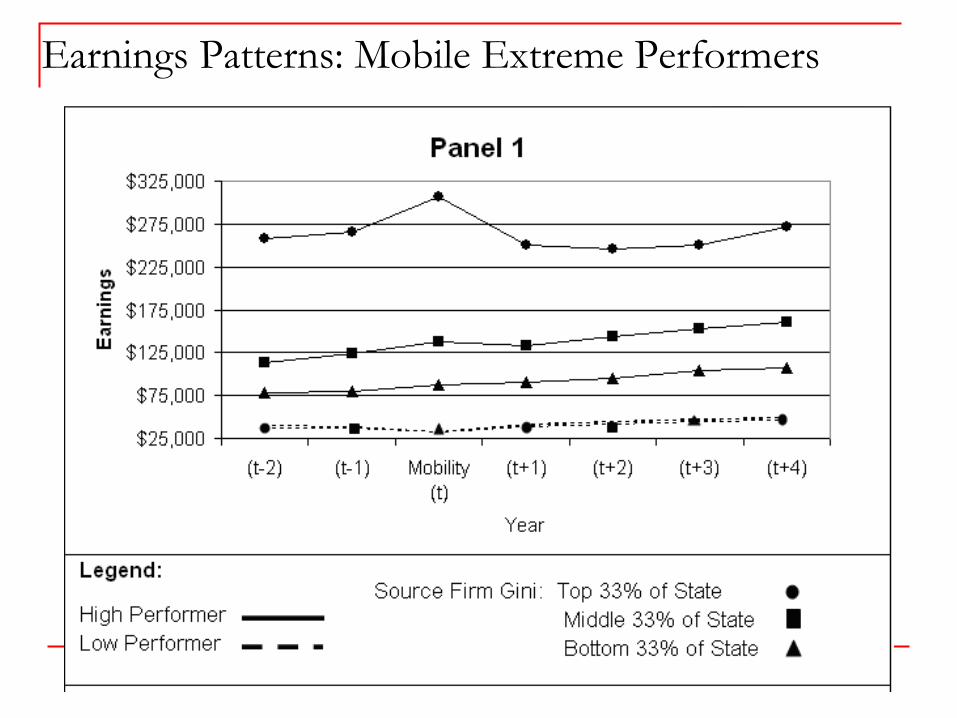
Earnings Patterns: Mobile Extreme Performers

Descriptive Evidence