the effect of banking relationships on the future of financially distressed firms claire m....
TRANSCRIPT

The Effect of Banking Relationships on the Future of Financially Distressed Firms
Claire M. RosenfeldSeptember 21, 2007
Disclaimer: The analysis presented does not necessarily reflect the official opinion of the FDIC.

Financial DistressDefinition:
The inability to make debt payments
Why distressed firms are special:
Critical need of funding
True financial position unknown

Banking Relationships
Most basic form: repeated provider of credit
Repeated lending provides “soft” information
Banking relationships with financially distressed firms:
firm in dire need of funding
heightened information asymmetries

Objective
• Determine the effect that banking relationships have on the future success of financially distressed firms
• Address Endogeneity

Prior Findings• Industry-wide distress adversely affects creditor
recoveries from defaulted firms (Acharya, Bharath, Srinivasan 2007)
• Firm falls susceptible to bank over-monitoring (Weinstein & Yafeh 1998)
• Relationship lender provides liquidity insurance (Elsas & Krahnen 1998)
• Relationship lenders make capital easier to obtain (Petersen 1999)
• Relationship lending leads to better loan terms (Petersen & Rajan 1994 and Berger & Udell 1995, Santos and Winton 2006)

Prior Findings (cont’d)• Relationship DIP lenders lead to quicker
bankruptcy resolution (Dahiya et al 2003)– Firms in bankruptcy proceedings
• Loans have less risk from DIP financing priority
– Examine time to resolution

Literature Limitations• Transaction-oriented
• Specific data– German: Elsas & Krahnen 1998, Elsas 2005
– Japanese: Weinstein & Yafeh 1998
– Belgian: Degryse & Ongena 2005
– Norwegian: Ongena & Smith 2001
– Small American: Petersen & Rajan 1994, Berger & Udell 1995, Petersen 1999
– Large DIP: Dahiya et al 2003
– Publicly traded U.S.: Houston & James 1996 & 2001, Schenone 2005 & 2006

Contribution
• Long-term perspective
• Publicly traded U.S. firms
• Address endogeneity

Null Hypothesis
Banking relationships have no effect on the future success of financially distressed firms.

Methods
• Probit regressions– Effect of banking relationships on the
probability of future success
– Control for firm, loan timing, industry, macroeconomy, and information asymmetry

Sample Universe• COMPUSTAT: Financial statements
• CRSP: Trading data
• DealScan: Loan data– First loan: 1982
– 2+ loans per firm
• Intersection of DealScan, COMPUSTAT, CRSP
• No finance sector• No start-ups• 30,641 loans to 5685 firms
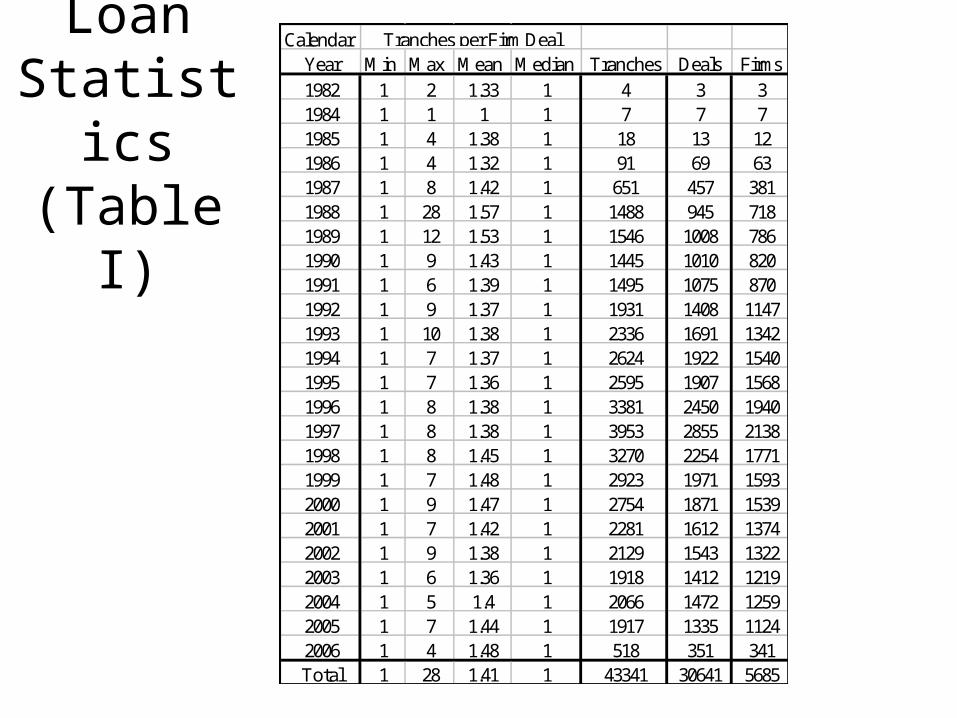
Loan Statistics(Table I)
CalendarYear Min Max Mean Median Tranches Deals Firms
1982 1 2 1.33 1 4 3 31984 1 1 1 1 7 7 71985 1 4 1.38 1 18 13 121986 1 4 1.32 1 91 69 631987 1 8 1.42 1 651 457 3811988 1 28 1.57 1 1488 945 7181989 1 12 1.53 1 1546 1008 7861990 1 9 1.43 1 1445 1010 8201991 1 6 1.39 1 1495 1075 8701992 1 9 1.37 1 1931 1408 11471993 1 10 1.38 1 2336 1691 13421994 1 7 1.37 1 2624 1922 15401995 1 7 1.36 1 2595 1907 15681996 1 8 1.38 1 3381 2450 19401997 1 8 1.38 1 3953 2855 21381998 1 8 1.45 1 3270 2254 17711999 1 7 1.48 1 2923 1971 15932000 1 9 1.47 1 2754 1871 15392001 1 7 1.42 1 2281 1612 13742002 1 9 1.38 1 2129 1543 13222003 1 6 1.36 1 1918 1412 12192004 1 5 1.4 1 2066 1472 12592005 1 7 1.44 1 1917 1335 11242006 1 4 1.48 1 518 351 341Total 1 28 1.41 1 43341 30641 5685
Tranches per Firm Deal

Sample Definition
• KMV-Merton Model from Bharath & Shumway (2004)– Equity of firm is call option on firm’s
underlying value• Strike price=Face Value of debt
– Generate expected default frequencies
– Rank to identify financially distressed firms

Sample Definition: Benefits
• Model-based mechanism for ex-ante measure of financial distress
• Used by academics and practitioners• Based on probability of default
– Not bankruptcy or extinction
• Lacks survivorship bias• Quarterly expected default frequencies
(edfs)

Sample Definition Specifics
• SAS Code provided in Bharath & Shumway (2004)1. Face value of debt = Book value; one year timeline
2. Collect risk-free rates and firm’s market equity
3. Estimate equity volatility from historical stock returns
4. Iteratively solve simultaneous equations for firm value and volatility of firm value:
5. Calculate distance to default:
6. Convert to Expected Default Frequency (edf):
edf = N(-DD)
T
TFVDD
V
V
)5.0()/ln( 2
VE dNE
V )( 1
)()( 21 dFNedVNE rT

Ranked EDFs
• Rank preserved if Normal distribution incorrect
• Under normal distribution, rank cutoffs:
Rank N Min Max Std Dev Mean Median0 14665 0.00E+00 7.84E-33 7.72E-34 1.51E-34 2.59E-501 14665 7.87E-33 2.57E-19 3.90E-20 1.29E-20 1.68E-242 14665 2.57E-19 6.05E-13 1.16E-13 5.32E-14 1.15E-153 14666 6.06E-13 6.38E-09 1.41E-09 8.03E-10 9.88E-114 14665 6.38E-09 4.69E-06 1.13E-06 7.98E-07 2.32E-075 14665 4.69E-06 5.86E-04 1.51E-04 1.33E-04 6.32E-056 14666 0.0006 0.0220 0.0059 0.0065 0.00427 14665 0.0221 0.2661 0.0696 0.1075 0.09008 14665 0.2661 0.9167 0.1984 0.5925 0.59219 14665 0.9167 1.0000 0.0201 0.9890 0.9998

Sample Definition
• Analyze firms with edfs ranked 7, 8, or 9– Create sub-samples with various degrees of
distress
• Include only first matched distressed observation for each firm

Failure Definition
• 3 years after distress identification• Denoted with indicator• Method of failure:
– Delisted from exchange• Not due to going private or merging
– Halting financial reporting• Not due to going private or merging
– No recovery to edf below distress rank
• Omit firms that merge or go private

Example
Minimum Distress
Rank
March 1999
March 2000
March2001
March 2002 Fail
7 9 9 9 7
9 9 9 9 7
Moore-Handley Inc

Example
Minimum Distress
Rank
March 1999
March 2000
March2001
March 2002 Fail
7 9 9 9 7 1
9 9 9 9 7
Moore-Handley Inc

Example
Minimum Distress
Rank
March 1999
March 2000
March2001
March 2002 Fail
7 9 9 9 7 1
9 9 9 9 7 0
Moore-Handley Inc

Relationship Loan Definition• Distressed loan
– In six months prior to distress identification– Closest loan to distress identification
• Relationship loan– Any lead lender on distressed loan was any
prior lender– Denoted with indicator– Tracked through bank mergers

Observations By Fiscal YearTable III
FiscalYear Obs Relationship Total Delist Distress1987 6 33.33% 66.67% 0.00% 66.67%1988 33 48.48% 63.64% 6.06% 57.58%1989 72 52.78% 72.22% 4.17% 69.44%1990 107 65.42% 31.78% 1.87% 30.84%1991 82 67.07% 46.34% 3.66% 45.12%1992 86 61.63% 51.16% 0.00% 51.16%1993 79 60.76% 55.70% 3.80% 51.90%1994 80 53.75% 35.00% 0.00% 35.00%1995 63 60.32% 34.92% 1.59% 33.33%1996 116 61.21% 56.90% 10.34% 50.00%1997 117 62.39% 59.83% 10.26% 53.85%1998 148 68.24% 67.57% 8.11% 60.14%1999 201 70.15% 52.24% 10.45% 47.76%2000 191 73.82% 40.31% 7.85% 34.55%2001 174 73.56% 32.76% 5.75% 28.74%2002 106 73.58% 20.75% 4.72% 16.98%Total 1661 65.98% 47.20% 6.08% 43.17%
Failure Minimum Rank: 7Fail
Sample Minimum Rank: 7
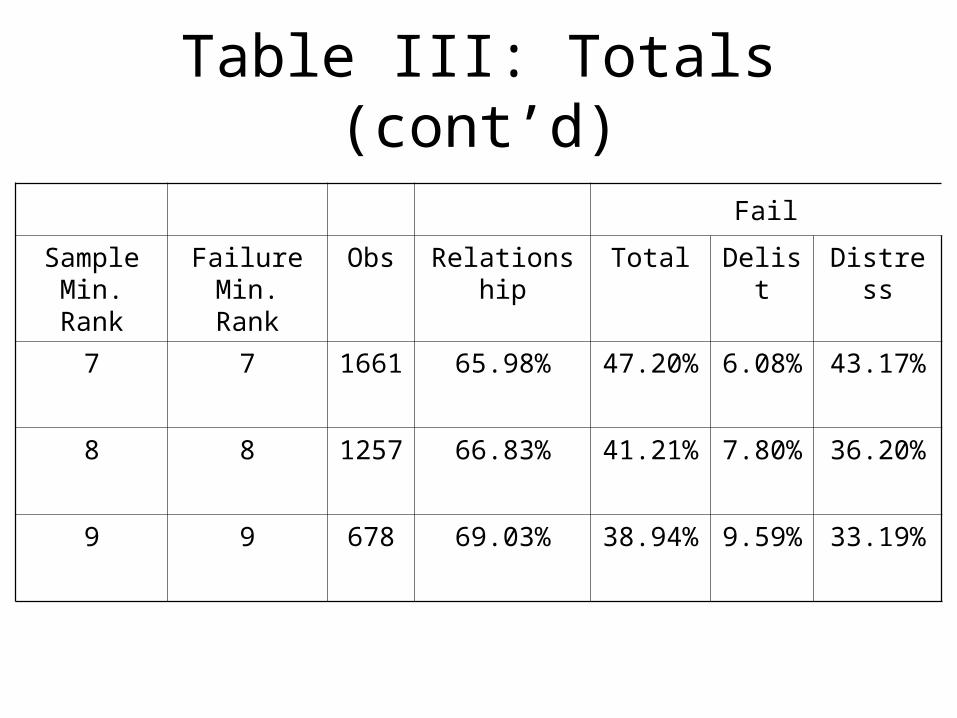
Table III: Totals (cont’d)
Fail
Sample Min. Rank
Failure Min. Rank
Obs Relationship Total Delist Distress
7 7 1661 65.98% 47.20% 6.08% 43.17%
8 8 1257 66.83% 41.21% 7.80% 36.20%
9 9 678 69.03% 38.94% 9.59% 33.19%
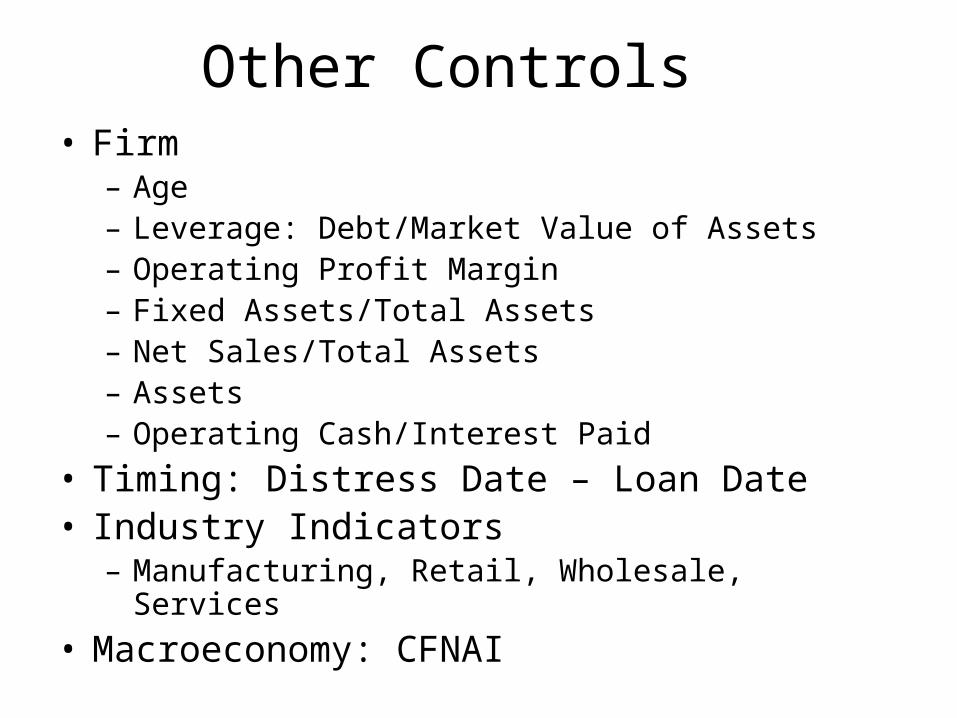
Other Controls• Firm
– Age– Leverage: Debt/Market Value of Assets– Operating Profit Margin– Fixed Assets/Total Assets– Net Sales/Total Assets– Assets– Operating Cash/Interest Paid
• Timing: Distress Date – Loan Date• Industry Indicators
– Manufacturing, Retail, Wholesale, Services
• Macroeconomy: CFNAI

Sample Statistics: Table IV8 98 9
N Sum Min Max Median Mean Std. Dev Median Median1670 0.0222 1 0.3194 0.4368 0.3700 0.7492 0.9961
Age 1670 3 76 8 15.0024 15.5296 8 8Leverage 1624 0.0232 0.9637 0.5081 0.4953 0.2216 0.5789 0.6958Operating Profit Margin 1626 -1.1643 0.5884 0.0883 0.0832 0.1988 0.0809 0.0694Fixed Assets/Total Assets 1630 0.0187 0.9047 0.3079 0.3548 0.2407 0.3157 0.3109Net Sales/Total Assets 1630 0.1287 4.4346 1.0940 1.2483 0.8217 1.0985 1.0824Employees 1612 0.0250 137 1.8795 8.4704 20.1615 1.9000 2.2200Sales 1630 6.03 27427 293.12 1523.37 3878.72 298.99 344.49Assets 1634 9.40 38396 282.96 1947.53 5430.62 280.18 309.54Operating Cash/Interest Paid 1588 -25.40 47.66 2.6769 3.3867 8.1008 2.4566 2.0583
Distess Date - Loan Date 1670 -182 0 -55.50 -61.80 47.92 -58.50 -61.00
Agriculture Indicator 1670 4 0 1 0 0.0024 0.0489 0.0024 0.0015Mining Indicator 1670 88 0 1 0 0.0527 0.2235 0.0498 0.0439Manufacturing Indicator 1670 778 0 1 0 0.4659 0.4990 0.4541 0.4553Financial Indicator 1670 0 0 0 0 0.0000 0.0000 0.0000 0.0000Wholesale Indicator 1670 111 0 1 0 0.0665 0.2492 0.0688 0.0717Retail Indicator 1670 180 0 1 0 0.1078 0.3102 0.1155 0.1186Services Indicator 1670 247 0 1 0 0.1479 0.3551 0.1432 0.1347Public Sector Indicator 1670 5 0 1 0 0.0030 0.0547 0.0040 0.0044Construction Indicator 1670 27 0 1 0 0.0162 0.1262 0.0158 0.0176Transportation Indicator 1670 230 0 1 0 0.1377 0.3447 0.1464 0.1523
Chicago Fed Nat'l Activity Indicator 1670 -2.22 1.51 -0.14 -0.2110 0.6876 -0.1800 -0.2500
Average Number Lenders 1670 0.6667 59 2 4.8494 6.7767 2 2Average Maturity (days) 1523 24 8035 1096 1302.50 948.6651 1096 1096
Variable
Sample Minimum Rank: 7
Expected Default Frequency
Industry
Failure Minimum Rank: 7
Economy
Loan Attributes
Firm
Timing
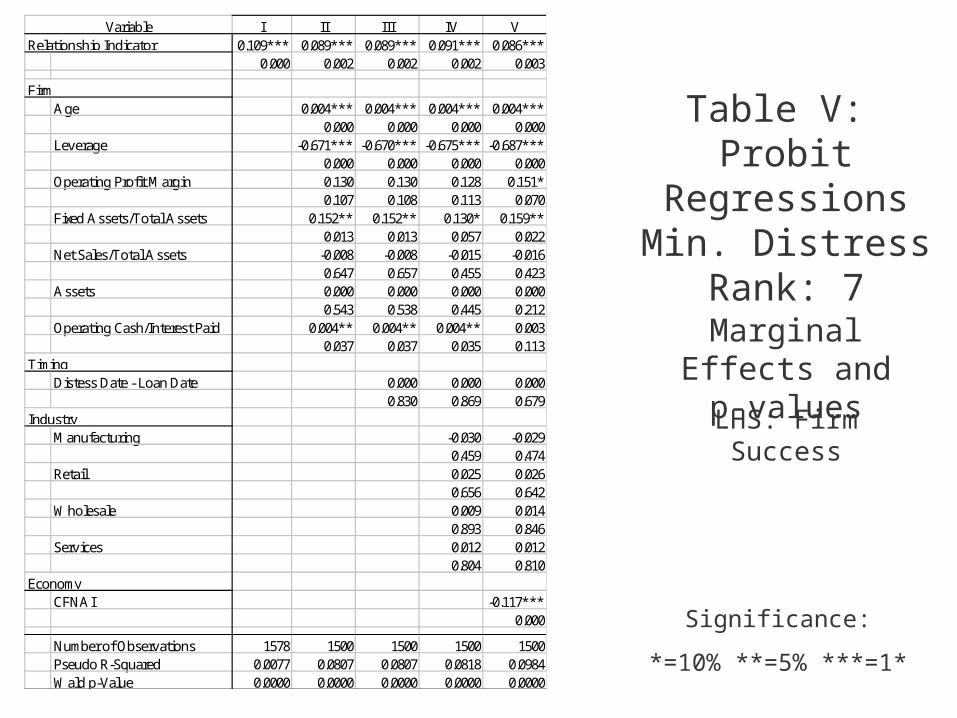
I II III IV V0.109*** 0.089*** 0.089*** 0.091*** 0.086***
0.000 0.002 0.002 0.002 0.003
Age 0.004*** 0.004*** 0.004*** 0.004***0.000 0.000 0.000 0.000
Leverage -0.671*** -0.670*** -0.675*** -0.687***0.000 0.000 0.000 0.000
Operating Profit Margin 0.130 0.130 0.128 0.151*0.107 0.108 0.113 0.070
Fixed Assets/Total Assets 0.152** 0.152** 0.130* 0.159**0.013 0.013 0.057 0.022
Net Sales/Total Assets -0.008 -0.008 -0.015 -0.0160.647 0.657 0.455 0.423
Assets 0.000 0.000 0.000 0.0000.543 0.538 0.445 0.212
Operating Cash/Interest Paid 0.004** 0.004** 0.004** 0.0030.037 0.037 0.035 0.113
Distess Date - Loan Date 0.000 0.000 0.0000.830 0.869 0.679
Manufacturing -0.030 -0.0290.459 0.474
Retail 0.025 0.0260.656 0.642
Wholesale 0.009 0.0140.893 0.846
Services 0.012 0.0120.804 0.810
CFNAI -0.117***0.000
Number of Observations 1578 1500 1500 1500 1500Pseudo R-Squared 0.0077 0.0807 0.0807 0.0818 0.0984Wald p-Value 0.0000 0.0000 0.0000 0.0000 0.0000
Variable
Economy
Relationship Indicator
Firm
Timing
Industry
Table V: Probit RegressionsMin. Distress Rank:
7
LHS: Firm Success
Significance:
*=10% **=5% ***=1*
Marginal Effects and p-values

VI VII VIII IX X0.067** 0.044 0.044 0.046 0.039
0.027 0.176 0.183 0.163 0.237
Age 0.005*** 0.005*** 0.005*** 0.005***0.000 0.000 0.000 0.000
Leverage -0.609*** -0.603*** -0.602*** -0.616***0.000 0.000 0.000 0.000
Operating Profit Margin 0.138 0.134 0.128 0.1460.139 0.148 0.168 0.121
Fixed Assets/Total Assets 0.128* 0.128* 0.111 0.1230.062 0.063 0.147 0.107
Net Sales/Total Assets -0.017 -0.015 -0.021 -0.0240.392 0.431 0.336 0.281
Assets 0.000 0.000 0.000 0.000*0.138 0.129 0.103 0.058
Operating Cash/Interest Paid 0.005* 0.005* 0.005* 0.0040.082 0.077 0.079 0.168
Distess Date - Loan Date 0.000 0.000 0.0000.358 0.355 0.287
Manufacturing -0.024 -0.0330.584 0.466
Retail 0.031 0.0320.609 0.590
Wholesale 0.006 0.0090.939 0.907
Services 0.051 0.0440.346 0.429
CFNAI -0.096***0.000
Number of Observations 1208 1145 1145 1145 1145Pseudo R-Squared 0.0030 0.0696 0.0701 0.0722 0.0844Wald p-Value 0.0272 0.0000 0.0000 0.0000 0.0000
Variable
Economy
Relationship Indicator
Firm
Timing
Industry
Table V: Probit RegressionsMin. Distress Rank:
8
LHS: Firm Success
Significance:
*=10% **=5% ***=1*
Marginal Effects and p-values

XI XII XIII XIV XV0.068 0.014 0.013 0.015 0.0110.107 0.759 0.765 0.731 0.800
Age 0.002 0.002 0.002 0.0020.175 0.185 0.207 0.222
Leverage -0.670*** -0.675*** -0.679*** -0.680***0.000 0.000 0.000 0.000
Operating Profit Margin 0.164 0.164 0.169 0.1830.288 0.290 0.275 0.246
Fixed Assets/Total Assets -0.025 -0.024 -0.055 -0.0530.785 0.788 0.587 0.610
Net Sales/Total Assets -0.030 -0.030 -0.020 -0.0190.235 0.230 0.486 0.498
Assets 0.000 0.000 0.000 0.0000.416 0.410 0.473 0.598
Operating Cash/Interest Paid 0.012* 0.012* 0.012* 0.0110.069 0.069 0.077 0.117
Distess Date - Loan Date 0.000 0.000 0.0000.775 0.795 0.826
Manufacturing -0.047 -0.0670.447 0.286
Retail -0.072 -0.0800.391 0.337
Wholesale -0.087 -0.0900.392 0.374
Services -0.066 -0.0920.394 0.248
CFNAI -0.116***0.000
Number of Observations 656 613 613 613 613Pseudo R-Squared 0.0030 0.0706 0.0707 0.0722 0.0897Wald p-Value 0.1048 0.0000 0.0000 0.0000 0.0000
Variable
Economy
Relationship Indicator
Firm
Timing
Industry
Table V: Probit RegressionsMin. Distress Rank:
9
LHS: Firm Success
Significance:
*=10% **=5% ***=1*
Marginal Effects and p-values

Findings
• Evidence that lending relationships are positively related to future of financially distressed firms– Sample must include moderately
distressed firms

Endogeneity
• Methodology: Bivariate Probit–Simultaneously predict
–Future firm success »Given actual relationship»Includes all controls
–Nature of lending relationship»Given instruments»Includes all controls

Endogeneity: Instruments
• Banking Market Concentration– Affects lending policies
• Banks’ reliance upon relationship loans
– HHI(Deposits), winsorized at 1% and 99%• Competitive: HHI < 1000• Moderately Concentrated:
1000 <= HHI <= 1800
• Concentrated: HHI>1800

Endogeneity: Instruments
• Informational Proxy– Analyst Coverage
• Indicator of analysts providing quarterly earnings estimates over 4 quarters prior to distress identification
• Also interact with leverage– Control for influence of debt funding driving
analyst coverage

Endogeneity: Instruments
• Lagged Relationship Indicator– From most recent loan prior to distressed
loan
– Captures firm’s recent reliance upon relationship funding
– Does not capture continuity of relationship through distress

Sample Statistics: Table IVN Sum Min Max Median Mean Std. Dev
Herfindahl-Hirschman Index 1598 224 2791 950 1038.253 498.6135Competitive Market Indicator 1670 992 0 1 1 0.5940 0.4912Mod. Concentrated Market Indicator 1670 558 0 1 0 0.3341 0.4718Concentrated Market Indicator 1670 120 0 1 0 0.0719 0.2583Lagged Relationship Indicator 1670 437 0 1 0 0.2617 0.4397Average Number Analyst Estimates 1670 0 33 1 2.8578 4.3203Analyst Indicator 1670 1036 0 1 1 0.6204 0.4854
N Sum Min Max Median Mean Std. DevHerfindahl-Hirschman Index 1205 224 3007 954 1041.636 501.19Competitive Market Indicator 1264 753 0 1 1 0.5957 0.4909Mod. Concentrated Market Indicator 1264 428 0 1 0 0.3386 0.4734Concentrated Market Indicator 1264 83 0 1 0 0.0657 0.2478Lagged Relationship Indicator 1264 351 0 1 0 0.2777 0.4480Average Number Analyst Estimates 1264 0 33 1 2.7488 4.3228Analyst Indicator 1264 764 0 1 1 0.6044 0.4892
N Sum Min Max Median Mean Std. DevHerfindahl-Hirschman Index 658 224 2791 961 1031.831 476.43Competitive Market Indicator 683 401 0 1 1 0.5871 0.4927Mod. Concentrated Market Indicator 683 240 0 1 0 0.3514 0.4778Concentrated Market Indicator 683 42 0 1 0 0.0615 0.2404Lagged Relationship Indicator 683 214 0 1 0 0.3133 0.4642Average Number Analyst Estimates 683 0 33 1 2.4575 3.9815Analyst Indicator 683 413 0 1 1 0.6047 0.4893
Failure Minimum Rank: 9
Variable
Variable
Sample Minimum Rank: 7
Sample Minimum Rank: 8
Sample Minimum Rank: 9
Variable
Failure Minimum Rank: 7
Failure Minimum Rank: 8

Rho
• “…[rho] measures (roughly) the correlation between the outcomes after the influence of the included factors is accounted for.”—Greene (2000) p. 854
• If [rho] is insignificant, “the model consists of independent probit equations, which can be estimated separately”—Greene (2000) p. 851

Predicting Relationships
I II III IV V VI VII VIII IX X XI XII
HHI Market Concentration 0.000 0.000* 0.0000.302 0.086 0.198
Lagged Relationship Indicator 0.793*** 0.854*** 0.879***0.000 0.000 0.000
Analyst Indicator 0.414*** 0.619*** 0.345*** 0.467** 0.331*** 0.1910.000 0.000 0.000 0.043 0.001 0.557
Analyst Indicator * Leverage -0.417 -0.220 0.2030.175 0.581 0.653
Number of Observations 1431 1497 1500 1500 1088 1143 1145 1145 590 612 613 613Number of Firms 1431 1497 1500 1500 1088 1143 1145 1145 590 612 613 613Wald Chi-Squared 362.49 473.15 461.94 496.79 212.26 328.32 265.17 277.74 376.65 161.17 322.85 322.00Wald p-Value 0.0000 0.0000 0.0000 0.0000 0.0000 0.0000 0.0000 0.0000 0.0000 0.0000 0.0000 0.0000Rho Chi-Squared 5.7725 12.4905 12.6473 13.0246 3.5643 12.9363 9.0381 7.7574 0.0260 0.0002 7.4258 6.9943Rho p-Value 0.0163 0.0004 0.0004 0.0003 0.0590 0.0003 0.0026 0.0053 0.8718 0.9876 0.0064 0.0082
Instruments
Failure Minimum Rank: 7 Failure Minimum Rank: 8 Failure Minimum Rank: 9Sample Minimum Rank: 7 Sample Minimum Rank: 8 Sample Minimum Rank: 9
From Table VII: Coefficients and p-values
Significance: *=10% **=5% ***=1*

Predicting Future SuccessFrom Table VII: Coefficients and p-values
Significance: *=10% **=5% ***=1*
I II III IV V VI VII VIII IX X XI XII-0.182 -0.035 -0.180 -0.219 0.253 0.272 0.208 0.175 1.991*** 1.529*** 2.073*** 2.073***0.482 0.867 0.411 0.317 0.384 0.244 0.412 0.506 0.000 0.001 0.000 0.000
1.068*** 0.903*** 1.122*** 1.180*** 0.808** 0.845*** 0.935*** 0.985*** -1.385*** 0.018 -1.347*** -1.347***0.000 0.000 0.000 0.000 0.011 0.000 0.000 0.000 0.000 0.967 0.000 0.000
FirmAge 0.008*** 0.009*** 0.008*** 0.008*** 0.010*** 0.010*** 0.010*** 0.009*** 0.005 0.005 0.005 0.005
0.002 0.000 0.001 0.002 0.001 0.001 0.001 0.002 0.178 0.227 0.234 0.235Leverage -1.503*** -1.603*** -1.511*** -1.483*** -1.502*** -1.486*** -1.462*** -1.447*** -1.321*** -1.790*** -1.420*** -1.420***
0.000 0.000 0.000 0.000 0.000 0.000 0.000 0.000 0.000 0.000 0.000 0.000Operating Profit Margin 0.201 0.195 0.122 0.100 0.197 0.134 0.103 0.083 0.512 0.481 0.501 0.503
0.381 0.364 0.573 0.643 0.471 0.597 0.691 0.750 0.172 0.252 0.193 0.191Fixed Assets/Total Assets 0.385** 0.377** 0.342** 0.334** 0.316 0.250 0.249 0.242 0.063 -0.143 0.055 0.055
0.026 0.026 0.040 0.044 0.114 0.193 0.195 0.208 0.801 0.604 0.828 0.829Net Sales/Total Sales -0.020 -0.034 -0.029 -0.028 -0.054 -0.064 -0.061 -0.060 -0.125* -0.050 -0.117* -0.117*
0.702 0.507 0.561 0.577 0.344 0.254 0.277 0.278 0.065 0.526 0.088 0.087Assets 0.000*** 0.000** 0.000*** 0.000*** 0.000*** 0.000*** 0.000*** 0.000*** 0.000** 0.000 0.000** 0.000**
0.009 0.022 0.009 0.007 0.006 0.005 0.004 0.003 0.029 0.617 0.048 0.048Operating Cash/Interest Paid 0.008* 0.008* 0.008* 0.008* 0.009 0.010 0.009 0.009 0.032** 0.028 0.037** 0.037**
0.094 0.078 0.080 0.078 0.211 0.161 0.169 0.169 0.038 0.130 0.024 0.025
Distess Date - Loan Date 0.000 0.000 0.000 0.000 -0.001 -0.001 -0.001 -0.001 0.001 0.000 0.001 0.0010.835 0.859 0.882 0.905 0.370 0.401 0.434 0.448 0.430 0.874 0.421 0.416
Yes Yes Yes Yes Yes Yes Yes Yes Yes Yes Yes Yes
CFNAI -0.238*** -0.254*** -0.238*** -0.231*** -0.207*** -0.206*** -0.201*** -0.197*** -0.199*** -0.308*** -0.234*** -0.234***0.000 0.000 0.000 0.000 0.001 0.000 0.000 0.001 0.005 0.000 0.002 0.002
Sample Minimum Rank: 7 Sample Minimum Rank: 8 Sample Minimum Rank: 9
VariableConstant
Failure Minimum Rank: 7 Failure Minimum Rank: 8 Failure Minimum Rank: 9
Relationship Indicator
Timing
Industry
Economy

Findings• After controlling for endogeneity, still strong
evidence of positive effect of lending relationships on future performance of financially distressed firms– Results not robust to severely distressed firms
• Decreases in information asymmetry increase likelihood of obtaining a relationship loan
• Prior firm reliance upon relationship funding predicts future firm reliance upon relationship funding

Expanded Sample
• Purpose: Evaluate impact of lending relationships on future of non-financially distressed firms
• Method: Allow all firm observations• Multiple observation per firm
– At least three years apart
• Vary minimum failure rank: 7, 8 or 9

I II III IV V0.084*** 0.042*** 0.042*** 0.043*** 0.039**
0.000 0.010 0.009 0.008 0.016
Age 0.004*** 0.004*** 0.004*** 0.004***0.000 0.000 0.000 0.000
Leverage -0.692*** -0.692*** -0.694*** -0.716***0.000 0.000 0.000 0.000
Operating Profit Margin 0.382*** 0.382*** 0.374*** 0.386***0.000 0.000 0.000 0.000
Fixed Assets/Total Assets 0.139*** 0.138*** 0.134*** 0.151***0.000 0.000 0.001 0.000
Net Sales/Total Assets 0.0070 0.0070 0.0120 0.01200.531 0.533 0.315 0.321
Assets 0.0000 0.0000 0.0000 0.00000.867 0.874 0.868 0.671
Operating Cash/Interest Paid 0.002*** 0.002*** 0.002*** 0.002***0.000 0.000 0.000 0.000
Distess Date - Loan Date 0.000 0.000 0.0000.767 0.773 0.873
Manufacturing -0.016 -0.0150.494 0.525
Retail -0.040 -0.0430.235 0.201
Wholesale -0.020 -0.0140.618 0.713
Services -0.014 -0.0150.642 0.618
CFNAI -0.075***0.000
Number of Observations 4487 4276 4276 4276 4276Number of Firms 2587 2498 2498 2498 2498Pseudo R-Squared 0.0054 0.1553 0.1553 0.1556 0.1633Wald p-Value 0.0000 0.0000 0.0000 0.0000 0.0000
Economy
Relationship Indicator
Firm
Timing
Industry
Variable
Table VI: Probit RegressionsMin. Failure Rank:
7
LHS: Firm Success
Significance:
*=10% **=5% ***=1*
Marginal Effects and p-values

VI VII VIII IX X0.076*** 0.037*** 0.037*** 0.038*** 0.035***
0.000 0.006 0.006 0.005 0.010
Age 0.003*** 0.003*** 0.003*** 0.003***0.000 0.000 0.000 0.000
Leverage -0.551*** -0.551*** -0.552*** -0.565***0.000 0.000 0.000 0.000
Operating Profit Margin 0.256*** 0.256*** 0.248*** 0.255***0.000 0.000 0.000 0.000
Fixed Assets/Total Assets 0.111*** 0.111*** 0.106*** 0.115***0.000 0.000 0.001 0.000
Net Sales/Total Assets 0.0050 0.0050 0.0070 0.00700.566 0.566 0.472 0.502
Assets 0.0000 0.0000 0.0000 0.00000.864 0.862 0.813 0.652
Operating Cash/Interest Paid 0.001*** 0.001*** 0.001*** 0.001***0.004 0.004 0.004 0.006
Distess Date - Loan Date 0.000 0.000 0.0000.939 0.938 0.846
Manufacturing -0.016 -0.0150.402 0.425
Retail -0.022 -0.0230.437 0.409
Wholesale -0.008 -0.0040.798 0.889
Services -0.001 -0.0020.950 0.922
CFNAI -0.052***0.000
Number of Observations 4487 4276 4276 4276 4276Number of Firms 2587 2498 2498 2498 2498Pseudo R-Squared 0.0063 0.1589 0.1589 0.1592 0.1654Wald p-Value 0.0000 0.0000 0.0000 0.0000 0.0000
Variable
Economy
Relationship Indicator
Firm
Timing
Industry
Table VI: Probit RegressionsMin. Failure Rank:
8
LHS: Firm Success
Significance:
*=10% **=5% ***=1*
Marginal Effects and p-values

XI XII XIII XIV XV0.052*** 0.024** 0.025*** 0.025*** 0.022**
0.000 0.012 0.010 0.009 0.017
Age 0.002*** 0.002*** 0.002*** 0.002***0.000 0.000 0.000 0.000
Leverage -0.356*** -0.356*** -0.356*** -0.362***0.000 0.000 0.000 0.000
Operating Profit Margin 0.125*** 0.124*** 0.124*** 0.128***0.001 0.001 0.001 0.000
Fixed Assets/Total Assets 0.061*** 0.061*** 0.060*** 0.065***0.003 0.003 0.008 0.004
Net Sales/Total Assets 0.0060 0.0060 0.0080 0.00700.317 0.323 0.251 0.301
Assets 0.0000 0.0000 0.0000 0.00000.937 0.993 0.996 0.850
Operating Cash/Interest Paid 0.001** 0.001** 0.001** 0.001**0.016 0.017 0.017 0.022
Distess Date - Loan Date 0.000 0.000 0.0000.107 0.110 0.142
Manufacturing -0.003 -0.0020.837 0.852
Retail -0.013 -0.0130.501 0.494
Wholesale -0.010 -0.0070.661 0.768
Services -0.006 -0.0070.701 0.669
CFNAI -0.037***0.000
Number of Observations 4487 4276 4276 4276 4276Number of Firms 2587 2498 2498 2498 2498Pseudo R-Squared 0.0060 0.1872 0.1879 0.1881 0.1966Wald p-Value 0.0000 0.0000 0.0000 0.0000 0.0000
Variable
Economy
Relationship Indicator
Firm
Timing
Industry
Table VI: Probit RegressionsMin. Failure Rank:
9
LHS: Firm Success
Significance:
*=10% **=5% ***=1*
Marginal Effects and p-values

Predicting Relationships
I II III IV V VI VII VIII IX X XI XII
HHI Market Concentration 0.000 0.000 0.0000.281 0.297 0.308
Lagged Relationship Indicator 0.804*** 0.806*** 0.808***0.000 0.000 0.000
Analyst Indicator 0.451*** 0.641*** 0.447*** 0.638*** 0.435*** 0.601***0.000 0.000 0.000 0.000 0.000 0.000
Analyst Indicator * Leverage 0.003*** -0.530*** -0.475**0.003 0.004 0.027
Number of Observations 4121 4268 4276 4276 4121 4268 4276 4276 4121 4268 4276 4276Number of Firms 2402 2496 2498 2498 2402 2496 2498 2498 2402 2496 2498 2498Wald Chi-Squared 1197.04 1367.97 1431.96 1542.16 964.80 1249.52 1197.13 1303.46 744.22 992.71 810.49 905.19Wald p-Value 0.0000 0.0000 0.0000 0.0000 0.0000 0.0000 0.0000 0.0000 0.0000 0.0000 0.0000 0.0000Rho Chi-Squared 17.8161 12.2536 38.9467 46.0161 9.8038 7.6699 25.6972 32.9451 3.7612 0.1101 1.7452 4.7085Rho p-Value 0.0000 0.0005 0.0000 0.0000 0.0017 0.0056 0.0000 0.0000 0.0525 0.7400 0.1865 0.0300
InstrumentsVariable
Sample Minimum Rank: 0 Sample Minimum Rank: 0 Sample Minimum Rank: 0Failure Minimum Rank: 7 Failure Minimum Rank: 8 Failure Minimum Rank: 9
From Table VIII: Coefficients and p-values
Significance: *=10% **=5% ***=1*

Predicting Future Success
I II III IV V VI VII VIII IX X XI XII0.083 0.338** 0.062 0.009 0.511*** 0.740*** 0.493*** 0.412*** 1.032*** 1.465*** 1.293*** 1.112***0.610 0.017 0.655 0.948 0.005 0.000 0.002 0.007 0.000 0.000 0.000 0.000
0.965*** 0.614*** 1.038*** 1.118*** 0.851*** 0.539*** 0.910*** 1.025*** 0.823*** 0.204 0.493* 0.759***0.000 0.000 0.000 0.000 0.000 0.000 0.000 0.000 0.010 0.329 0.067 0.005
FirmAge 0.010*** 0.011*** 0.010*** 0.009*** 0.011*** 0.012*** 0.011*** 0.010*** 0.011*** 0.013*** 0.012*** 0.011***
0.000 0.000 0.000 0.000 0.000 0.000 0.000 0.000 0.000 0.000 0.000 0.000Leverage -1.986*** -2.108*** -1.981*** -1.950*** -2.025*** -2.148*** -2.066*** -2.032*** -2.214*** -2.368*** -2.351*** -2.303***
0.000 0.000 0.000 0.000 0.000 0.000 0.000 0.000 0.000 0.000 0.000 0.000Operating Profit Margin 0.677*** 0.889*** 0.591*** 0.529*** 0.591** 0.765*** 0.533** 0.457** 0.482 0.810*** 0.655** 0.508*
0.002 0.000 0.004 0.008 0.013 0.001 0.014 0.033 0.101 0.002 0.018 0.067Fixed Assets/Total Assets 0.504*** 0.467*** 0.460*** 0.455*** 0.458*** 0.452*** 0.456*** 0.452*** 0.426*** 0.426*** 0.439*** 0.440***
0.000 0.000 0.000 0.000 0.000 0.000 0.000 0.000 0.004 0.004 0.003 0.002Net Sales/Total Sales 0.037 0.032 0.027 0.026 0.024 0.022 0.019 0.018 0.049 0.047 0.045 0.041
0.284 0.352 0.417 0.432 0.522 0.553 0.590 0.617 0.280 0.295 0.321 0.349Assets 0.000* 0.000 0.000* 0.000* 0.000 0.000 0.000 0.000 0.000 0.000 0.000 0.000
0.079 0.233 0.097 0.081 0.120 0.304 0.159 0.133 0.359 0.800 0.601 0.459Operating Cash/Interest Paid 0.006*** 0.006*** 0.006*** 0.006*** 0.005*** 0.005*** 0.005*** 0.005*** 0.007** 0.008** 0.007** 0.007**
0.000 0.000 0.000 0.000 0.007 0.006 0.007 0.007 0.026 0.022 0.022 0.021
Distess Date - Loan Date 0.001 0.000 0.001 0.001 0.000 0.000 0.000 0.000 0.001** 0.001 0.001* 0.001*0.303 0.527 0.329 0.293 0.576 0.917 0.642 0.576 0.048 0.135 0.089 0.059
Yes Yes Yes Yes Yes Yes Yes Yes Yes Yes Yes Yes
CFNAI -0.179*** -0.204*** -0.178*** -0.172*** -0.163*** -0.186*** -0.166*** -0.159*** -0.204*** -0.239*** -0.227*** -0.214***0.000 0.000 0.000 0.000 0.000 0.000 0.000 0.000 0.000 0.000 0.000 0.000
Sample Minimum Rank: 0 Sample Minimum Rank: 0 Sample Minimum Rank: 0
VariableConstant
Failure Minimum Rank: 7 Failure Minimum Rank: 8 Failure Minimum Rank: 9
Relationship Indicator
Timing
Industry
Economy
From Table VIII: Coefficients and p-values
Significance: *=10% **=5% ***=1*

Robustness
• Definition of Financial Distress– Low Interest Coverage Ratios– Shumway’s Model
• DealScan Coverage: Years >= 1992• Inclusion of Merging and Going Private• Loan Window
– [-6 months, +6 months]– [0, +6 months]

Summary of Findings
• Banking relationships have a significantly positive impact on the future of firms– Robust to degree of failure– Not robust to severely distressed firms– Long-term effect– Publicly traded U.S. firms
• Relationships determined by:– Analyst coverage– Lagged relationship indicator

Consistent Stories
• Banks find that there is a point beyond which costs of relationship exceed benefits
• Have found benefits to lending relationships which could stem from:– Monitoring– and/or Controlling– and/or Screening

Conclusion
Thank you for your time and comments