the effect of acid etching on remineralization of
TRANSCRIPT
THE EFFECT OF ACID ETCHING ON REMINERALIZATION
OF INCIPIENT CARIES LESIONS:
A MICRO-CT STUDY
by
Hanin E.Yeslam
Submitted to the Graduate Faculty of the School of Dentistry in partial fulfillment of the requirements for the degree of Master of Science in Dentistry, Indiana University School of Dentistry, 2009.
ii
Thesis accepted by the faculty of the Department of Restorative Dentistry, Indiana University School of Dentistry, in partial fulfillment of the requirements for the degree of Master of Science in Dentistry.
Carlos Gonzalez-Cabezas
Melvin Lund
Tien-Min Gabriel Chu
Masatoshi Ando Chair of the Research Committee
______________________________
Michael Cochran Program Director
Date

iii
ACKNOWLEDGMENTS
iv
I would like to convey my deepest appreciation and thanks to my research
committee, Drs. Michael Cochran, Masatoshi Ando, Carlos Gonzalez-Cabezas, Melvin
Lund, and Tien-Min Gabriel Chu for their professionalism and support.
I will always be deeply grateful to my mentor, Dr. Masatoshi Ando, for his
guidance, expertise, and thoughtful criticism, which allowed me to appreciate scientific
curiosity and integrity.
I would like to extend my immense gratitude to the lab technicians who helped
me throughout the course of my work. I would like to dedicate a special thanks to
Jennifer for her great help and guidance in the lab.
I would like to express my sincere and heartfelt thanks to my mother and father
for their continuous support, love, and encouragement. Without their prayers and
support, my professional growth would not have been possible.
Finally, I am deeply grateful to my husband for his support and encouragement.
Thanks to my wonderful little daughter, Joory, for the sacrifice that she innocently made
during the long hours of study and lab work. Those are the people for whom I live, and
this thesis is dedicated to them.

v
TABLE OF CONTENTS
vi
Introduction .......................................................................................1
Review of Literature..........................................................................4
Materials and Methods ....................................................................16
Results .............................................................................................23
Tables and Figures...........................................................................27
Discussion........................................................................................52
Summary and Conclusions ..............................................................61
References .......................................................................................64
Abstract............................................................................................71
Curriculum Vitae

vii
LIST OF ILLUSTRATIONS
viii
TABLE I Group assignments and their descriptions ………………………. 28 TABLE II Remineralization/demineralization pH cycling
model schedule ………………………………………………….. 29 TABLE III Summary of the mean and standard error for each outcome by group ……………………………………………………………. 30 TABLE IV The µ-CT sound statistical data for each group ………………… 31 TABLE V The µ-CT demin statistical data for each group ………………… 32 TABLE VI The µ-CT remin statistical data for each group………………… 33 TABLE VII The µ-CT percent mineral recovery statistical data …………… 34 TABLE VIII The TMR IML statistical data for each group …………………. 35 TABLE IX The TMR lesion depth statistical data for each group …………. 36 FIGURE 1 Schematic of enamel rod structure: a) sound enamel; demineralized enamel, and c) remineralized enamel …………… 37 FIGURE 2 Diagram demonstrating the flow of procedures performed in this in-vitro study ……………………………………………… 38 FIGURE 3 Enamel specimen embedded in epoxy resin ………………… 39 FIGURE 4 Specimens stored in separately marked vials with damp cotton pellets to preserve humidity …………………………………… 40
ix
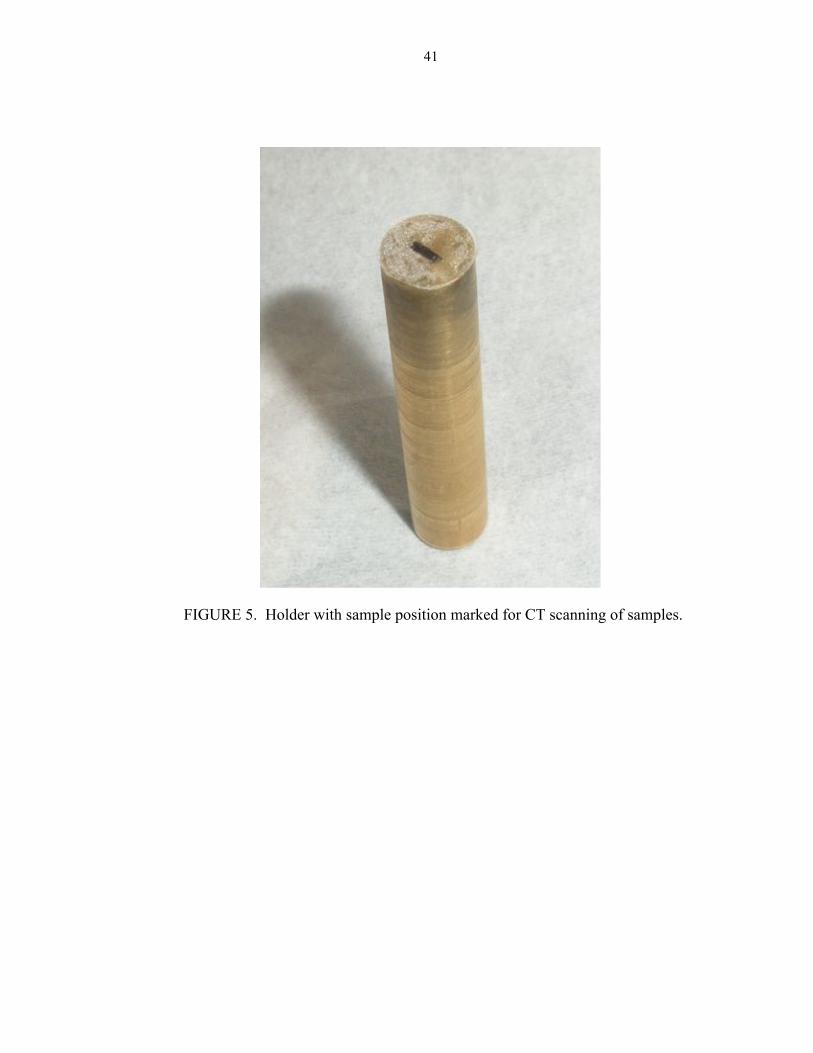
FIGURE 5 Holder with sample position marked for CT scanning of
samples……………………………………………………..
41
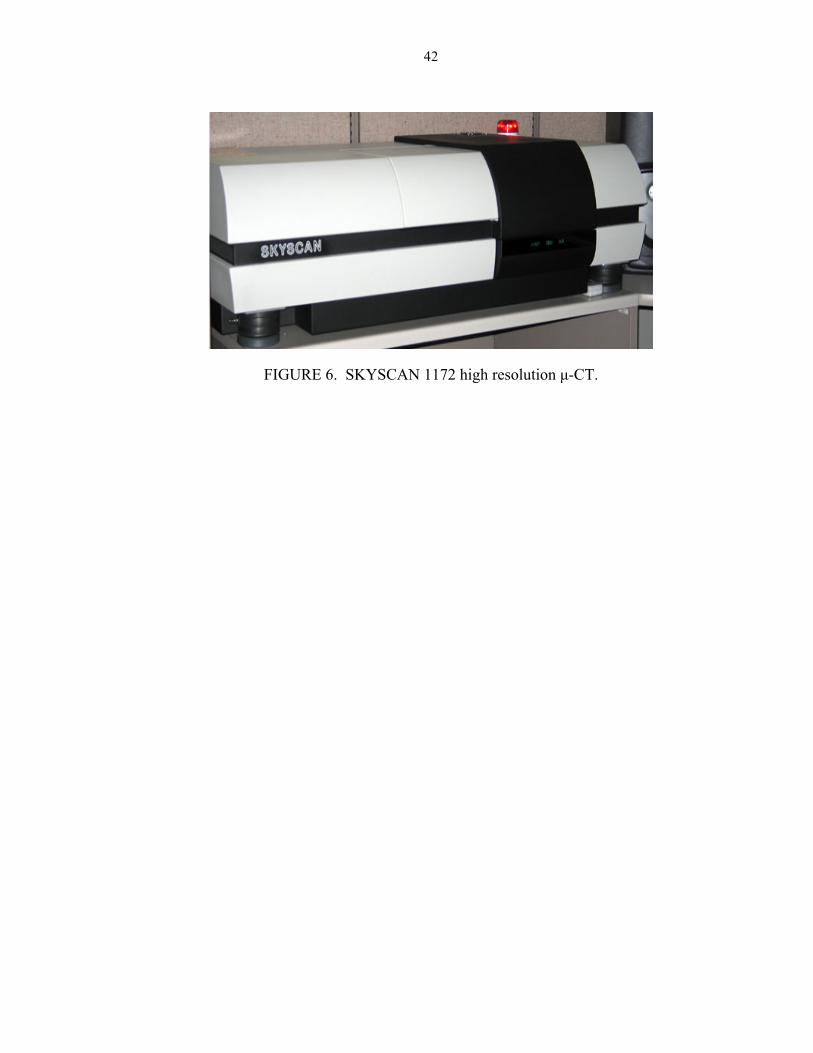
FIGURE 6 SKYSCAN 1172 high resolution µ-CT …………………… 42
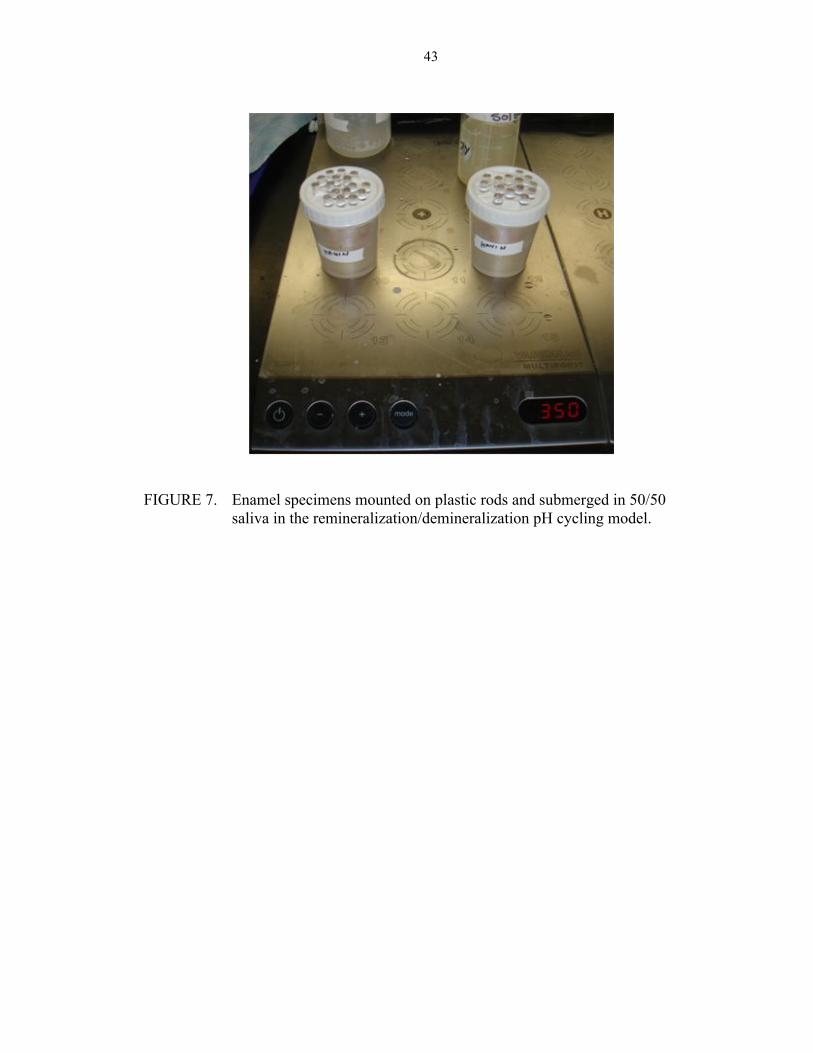
FIGURE 7 Enamel specimens mounted on plastic rods and submerged in 50/50 saliva in the remineralization/demineralization pH cycling model……………………………………………….
43
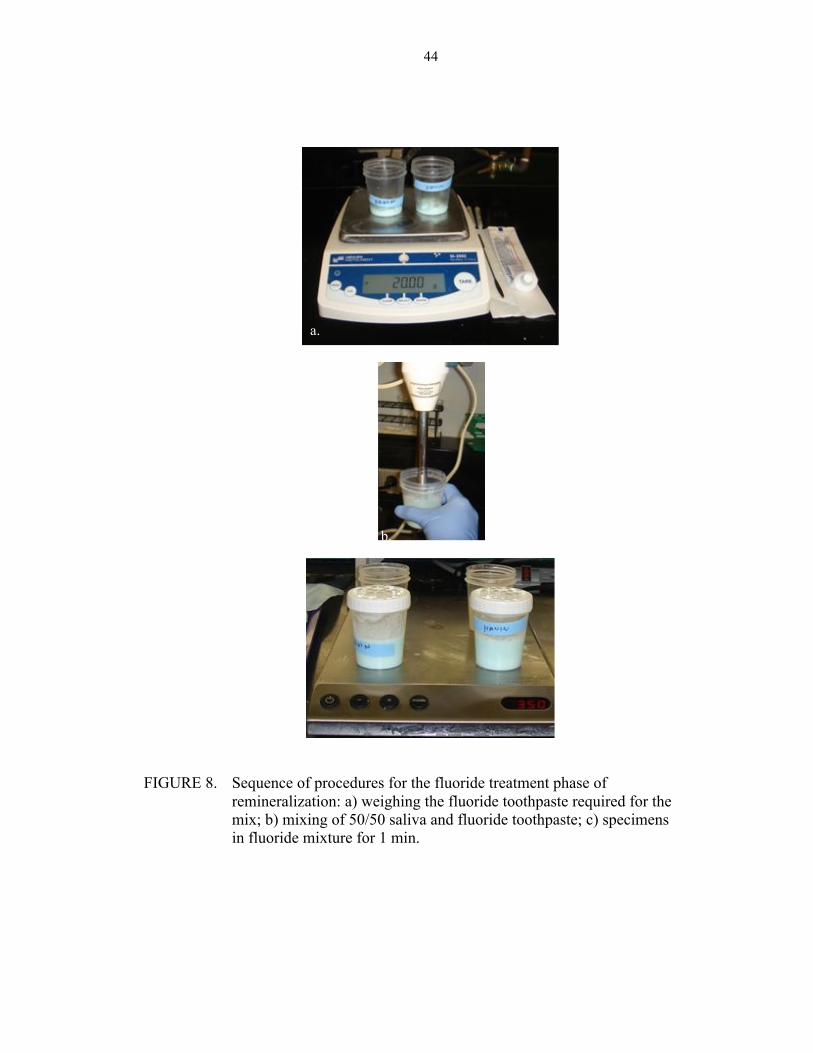
FIGURE 8 Sequence of procedures for the fluoride treatment phase of remineralization: a) weighing the fluoride toothpaste required for the mix; b) mixing of 50/50 saliva and fluoride toothpaste, and c) specimens in fluoride mixture for 1 minute………….
44
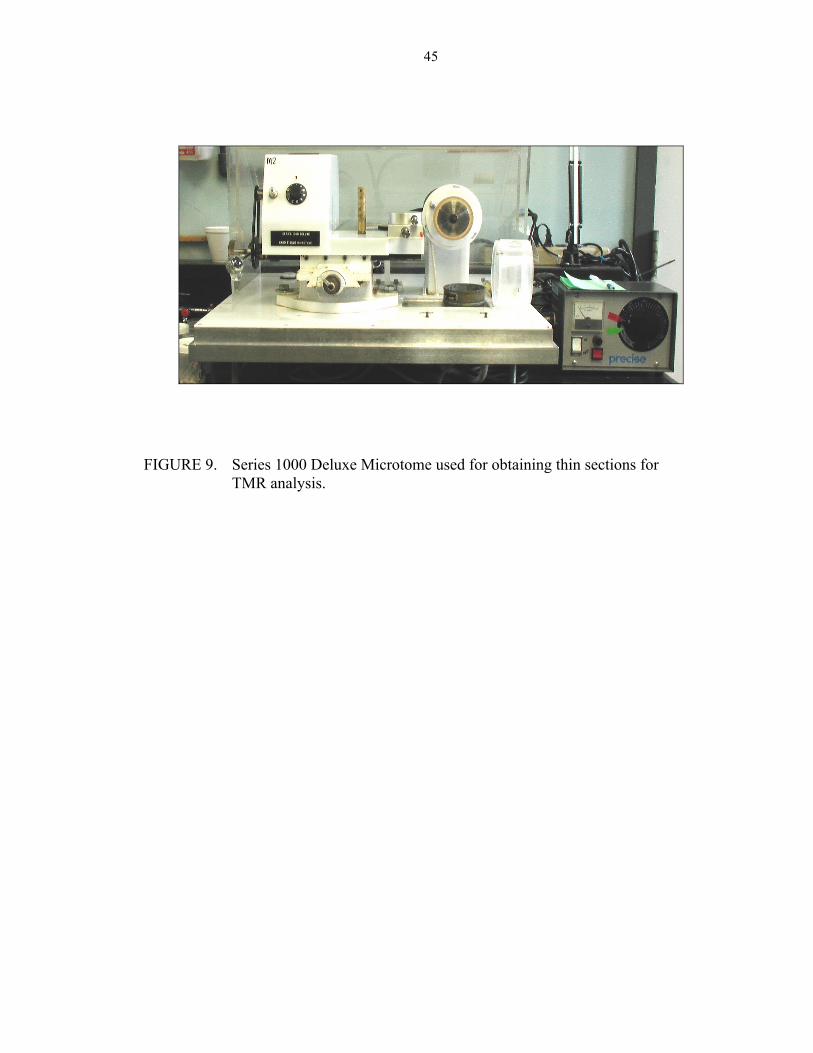
FIGURE 9 Series 1000 Deluxe Microtome used for obtaining thin sections for TMR analysis……………………………………………
45
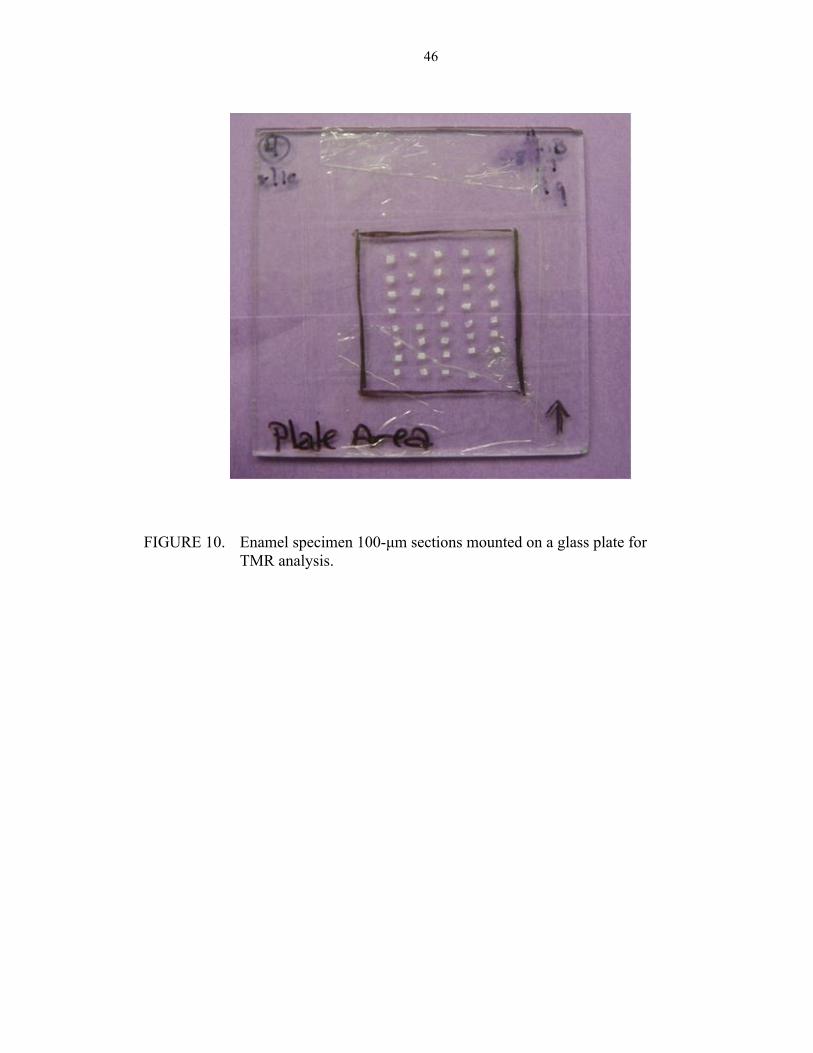
FIGURE 10 Enamel specimens in 100-µm sections mounted on a glass plate for TMR analysis………………………………………
46
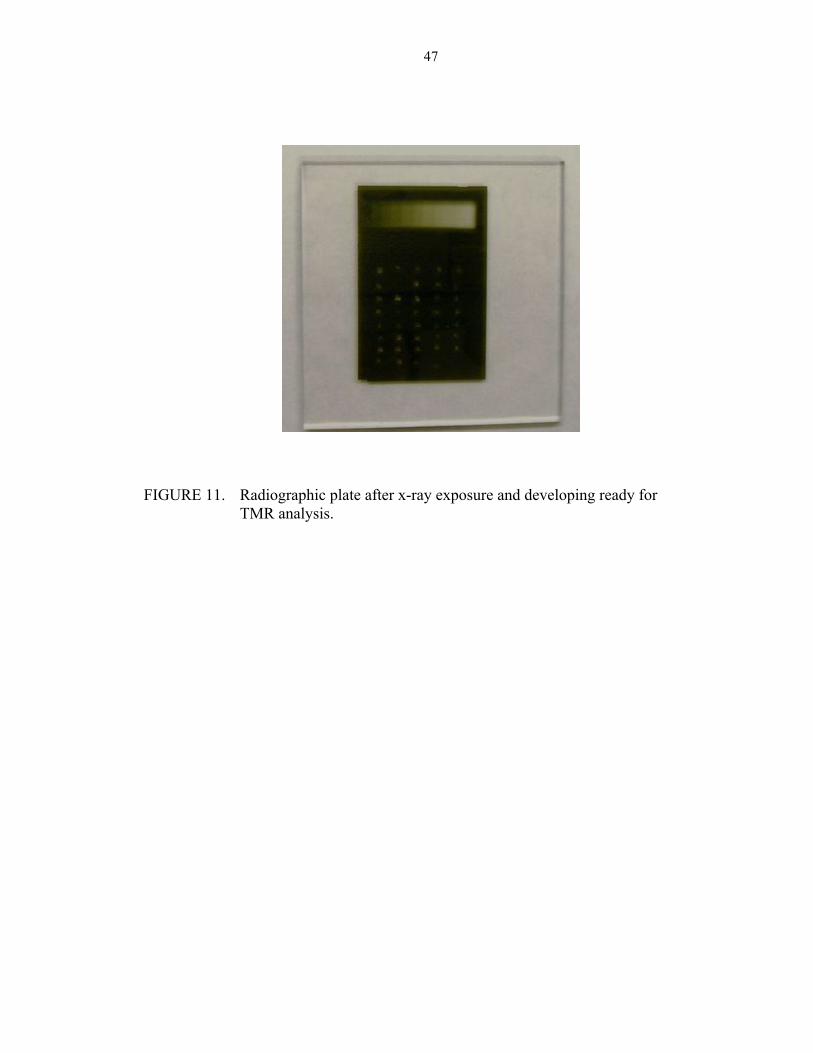
FIGURE 11 Radiographic plate after x-ray exposure and developing and ready for TMR analysis……..………………………………
47
FIGURE 12 Graph demonstrating the correlation between TMR lesion depth and TMR mineral loss………………………………..
48
FIGURE 13 Graph demonstrating the lack of correlation between µ-CT percent mineral recovery and TMR mineral loss…………..
49
FIGURE 14 Graph demonstrating the correlation between µ-CT percent mineral recovery and TMR lesion depth……………………
50
FIGURE 15 TMR images showing the lesion in the three remineralization groups: a) Group A lesion showing the continuous smooth surface layer; b) Group B lesion showing the reduction of surface where acid etching has affected it, and c) Group C lesion showing the significant reduction or loss of surface layer…………………………………………………………
51

1
INTRODUCTION
2
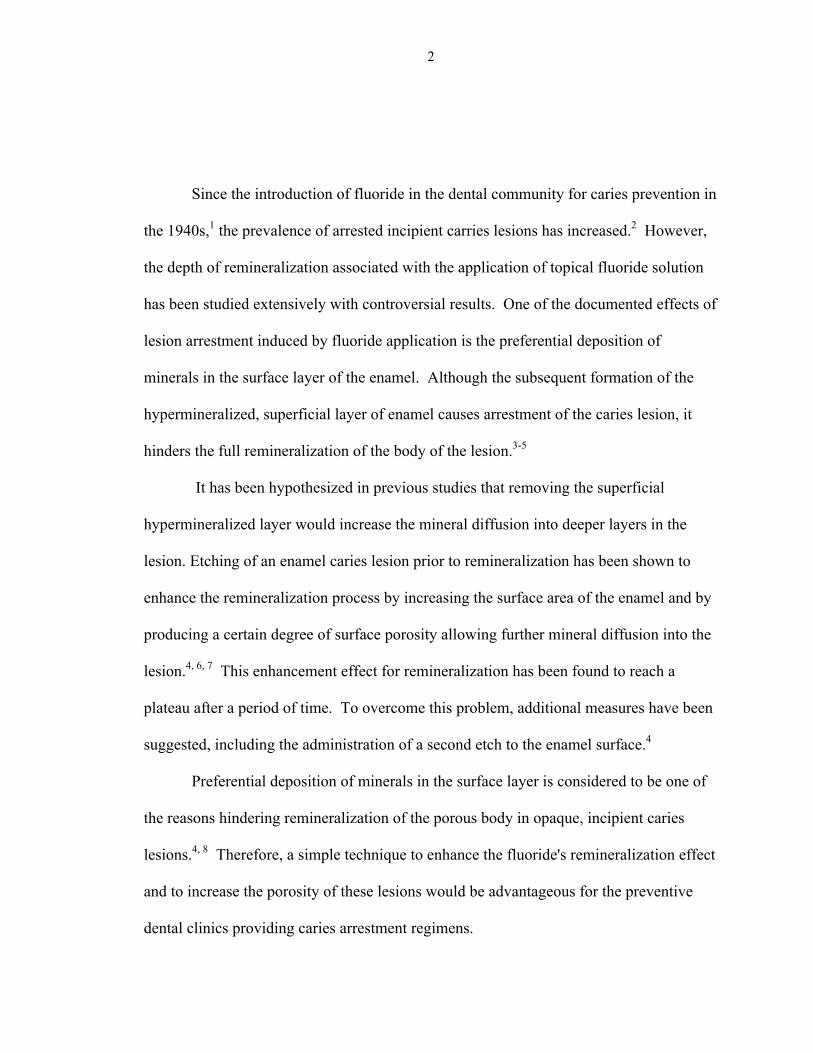
Since the introduction of fluoride in the dental community for caries prevention in
the 1940s,1 the prevalence of arrested incipient carries lesions has increased.2 However,
the depth of remineralization associated with the application of topical fluoride solution
has been studied extensively with controversial results. One of the documented effects of
lesion arrestment induced by fluoride application is the preferential deposition of
minerals in the surface layer of the enamel. Although the subsequent formation of the
hypermineralized, superficial layer of enamel causes arrestment of the caries lesion, it
hinders the full remineralization of the body of the lesion.3-5
It has been hypothesized in previous studies that removing the superficial
hypermineralized layer would increase the mineral diffusion into deeper layers in the
lesion. Etching of an enamel caries lesion prior to remineralization has been shown to
enhance the remineralization process by increasing the surface area of the enamel and by
producing a certain degree of surface porosity allowing further mineral diffusion into the
lesion.4, 6, 7 This enhancement effect for remineralization has been found to reach a
plateau after a period of time. To overcome this problem, additional measures have been
suggested, including the administration of a second etch to the enamel surface.4
Preferential deposition of minerals in the surface layer is considered to be one of
the reasons hindering remineralization of the porous body in opaque, incipient caries
lesions.4, 8 Therefore, a simple technique to enhance the fluoride's remineralization effect
and to increase the porosity of these lesions would be advantageous for the preventive
dental clinics providing caries arrestment regimens.
3
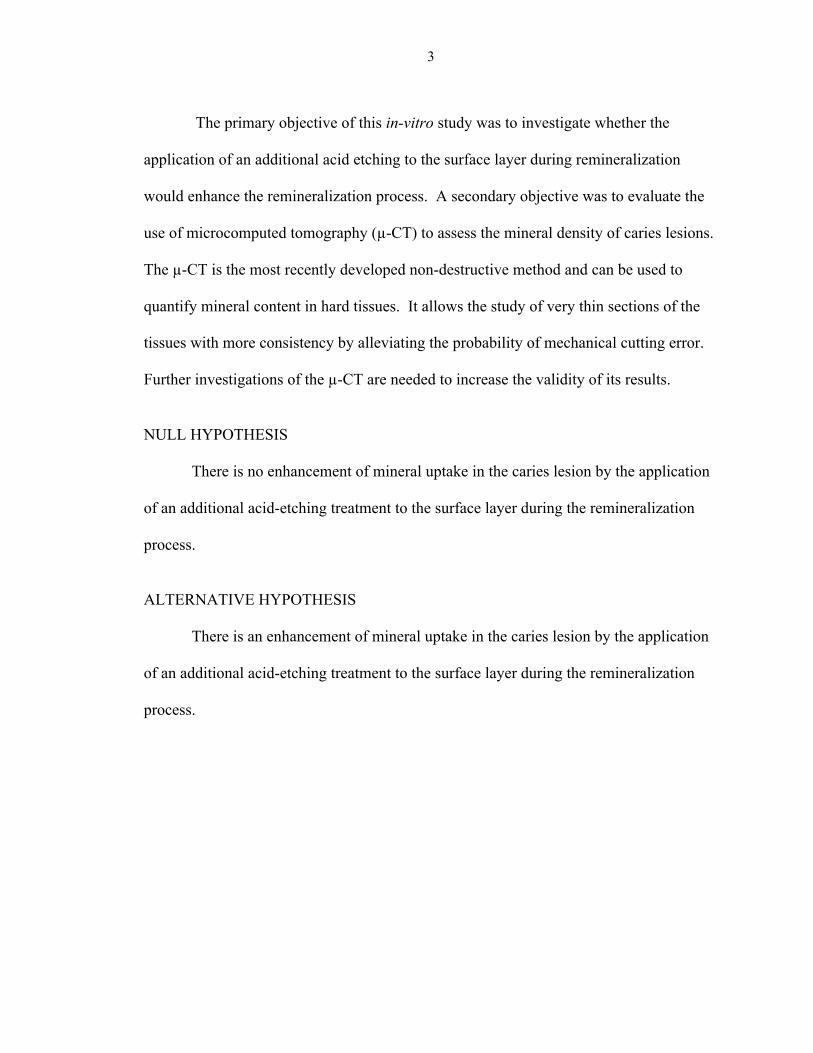
The primary objective of this in-vitro study was to investigate whether the
application of an additional acid etching to the surface layer during remineralization
would enhance the remineralization process. A secondary objective was to evaluate the
use of microcomputed tomography (µ-CT) to assess the mineral density of caries lesions.
The µ-CT is the most recently developed non-destructive method and can be used to
quantify mineral content in hard tissues. It allows the study of very thin sections of the
tissues with more consistency by alleviating the probability of mechanical cutting error.
Further investigations of the µ-CT are needed to increase the validity of its results.
NULL HYPOTHESIS
There is no enhancement of mineral uptake in the caries lesion by the application
of an additional acid-etching treatment to the surface layer during the remineralization
process.
ALTERNATIVE HYPOTHESIS
There is an enhancement of mineral uptake in the caries lesion by the application
of an additional acid-etching treatment to the surface layer during the remineralization
process.

4
REVIEW OF LITERATURE
5
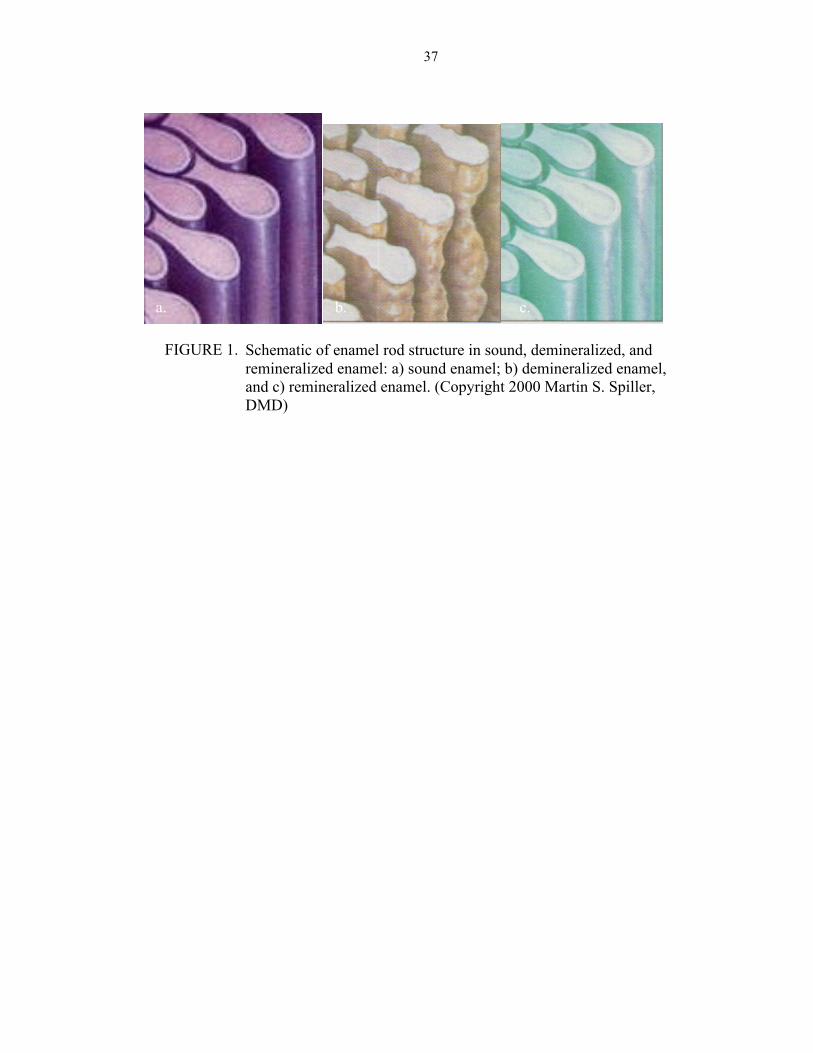
ENAMEL STRUCTURE
Enamel is the most mineralized tissue in the body. Human enamel consists of a
mineral phase that occupies about 96 percent by weight and approximately 87 percent by
volume.9 It contains millions of rods that look like keyholes running from the
dentinoenamel junction (DEJ) to the enamel surface when viewed cross-sectionally under
the microscope.9 The rods are separated by a protein matrix. The mineral phase is
essentially composed of polycrystals similar in structure to hydroxyapatite crystals
Ca₁₀(PO₄)₆(OH)₂ with many impurities, mainly carbonate, which replaces phosphate,
and which increases solubility.10, 11 The cross-sectional shape and arrangement of these
crystals differ between enamel layers. In the surface layer, the crystals show size and
shape variability while being densely packed, resembling the appearance of a “stone
wall.” On the other hand, hexagonal crystals in the middle and deep layers are somehow
smaller with gaps in between them.12
When teeth erupt, they are complete from an anatomic perspective, but not
complete in regard to their crystallographic structure.13 Following eruption, a life-long,
continuous maturation process occurs, ranging from daily replacement of ions to slow
repair of extensive, subsurface lesions caused by long-term negative caries balance.13, 14
6
DENTAL CARIES
Without comprehensive knowledge of the caries process, one is most likely to
envision the process of the carious lesion development as a continuous phenomenon
leading to the everlasting mineral loss causing the formation of a clinically detectable
cavitation. The process of dental caries is better understood nowadays, although there are
still some details yet to be determined.15
Dental caries is a transmissible bacterial disease caused mainly by two groups of
bacteria, namely the mutans streptococci and lactobacilli species that ferment the
ingested carbohydrates to produce organic acids resulting in tooth-mineral dissolution.13,
15-17 The caries process is a dynamic continuum that results from numerous cycles of
demineralization and remineralization,13, 18 where the balance between the two processes
determines the eventual outcome of dental caries and the site where the caries lesion
develops.15 In-vitro caries models have been developed as early as 1982. Their
development allowed the discovery of processes involved in caries in much shorter time
while new intervention treatments could be tested and modified.15, 18, 19
The earliest clinically detectable sign of dental caries in the mouth is the incipient
enamel lesion known as a white spot, which becomes detectable radiographically as the
lesion progresses into the enamel and dentin. At this stage, before cavitation, therapeutic
measures can be applied to reverse or arrest the lesion.20
Histologically, incipient caries lesions consist of zones that can be demonstrated
with in-vitro models as well. These zones are identified histologically in enamel lesions
arranged from the outer surface of the tooth reaching the DEJ:
• Surface zone, with a crystal diameter of 40 mm.
7
• Body of the lesion, with a crystal diameter of 10 mm.
• Dark zone, with a crystal diameter of 50 mm.
• Translucent zone, with a crystal diameter of 30 mm.
Both the surface and dark zones are remineralization zones. Both the translucent
zone and the body of the lesion are demineralization zones.20, 21
DEMINERALIZATION
Demineralization is basically the loss of mineral apatite from the enamel.22, 23
When organic acids, such as lactic and formic acids, are produced by acidogenic bacteria,
they diffuse in various directions through the enamel and dentin organic matrix into
underlying tissues.11, 13, 20, 24, 25 The organic matrix accelerates the demineralization
process by providing permeable channel networks for acid invasion.23 When the acid
reaches a susceptible site on the crystal surface, minerals dissolve into the surrounding
aqueous phase. The first ions to be released are sodium, magnesium, and carbonate,
followed by calcium and phosphate, which would act as a buffer to help to limit the
damaging effects of the acids.26 This is the first step of demineralization, which takes
place at the atomic level before any clinically visible sign is observed. Critical pH, which
is about 5.5 for enamel, is the pH level at which demineralization occurs. If the calcium
and phosphate supersaturation levels are restored and aided by fluoride, minerals will
diffuse into the tooth and deposit a new, more acid-resistant veneer on the crystal
remnants in the non-cavitated lesion.15
Since the 1940s, it has been noted that the outermost enamel layer is the most
resistant to dissolution.14 Two mechanisms have been proposed for the formation of this
hypermineralized surface layer of incipient lesions. The first is the deposition of fluoride
8
and other ions from saliva. The other is the outward diffusion of minerals and ions from
the subsurface lesion that would be deposited in the surface layer.14, 27
REMINERALIZATION
Over time, researchers have been more interested in utilizing various
remineralization techniques, and in detecting incipient lesions as early as possible to
prevent further cavitations.28
Remineralization is the body’s natural repair process of enamel rod structure
following acidogenic episodes.29 The basic mechanism of remineralization involves the
diffusion of calcium and phosphate from saliva and other topical sources aided by
fluoride to build a hypermineralized, acid-resistant, fluoroapatite-like veneer on the
existing crystal remnants, which act as remineralization nuclei.13 This is one crucial
mechanism of action of fluoride in the inhibition and reversal of the caries process.13, 29
Enamel surface is in a dynamic equilibrium with its local, oral environment with a
constant movement of ions.15, 18, 30 Except under unusual circumstances, demineralizing
conditions in the mouth are transient. The extent of demineralization relates inversely
with the duration of the exposure and frequency of acid attacks.30 An increased amount
of saliva minimizes the effects of acids produced by bacteria. This is attributed to the
saliva that washes out cariogenic residues and exhibits a buffering capacity. 13, 14, 30
Considerable clinical evidence for remineralization can be traced back to 1912
when a physician, Head, demonstrated that teeth underwent cycles of softening and
hardening. Fluoride was first noted for its mottling effect on enamel in the 1930s, when
various community drinking-water reservoirs were investigated. Fluoride’s caries-
preventive effect was introduced in the mid 1940s, when the difference in caries
9
prevalence between communities was correlated with the variation in fluoride
concentration in drinking water.1, 31 Studies by Dean and Parfitt suggested and further
investigated the possibility of the use of fluoride for mass-caries control.1, 32
Remineralization of superficial enamel lesions is demonstrated in both in-vitro and in-
vivo studies confirming the remineralization effectiveness of fluoride.33 An in-vivo study
in 2001 reported that the inner enamel and dentin are capable of remineralization. But,
the deeper the levels of demineralization, the more slowly remineralization would
occur.28
Remineralization is studied from two perspectives. The first is the process of
filling the enamel defects formed due to demineralizing, acidogenic episodes by mineral
deposition. In this case, the demineralization and remineralization magnitude determines
whether a lesion would develop or the tooth remains sound. The second is repairing an
incipient lesion that has already developed but still could be filled completely or partially
with calcium phosphates under suitable remineralizing conditions.34
REMINERALIZATION ENHANCEMENT
Since the introduction of fluoride in community water supplies, the prevalence of
arrested, incipient carries lesions increased.2 The major beneficial effect of fluoride is its
accelerating effect on the deposition of minerals during the remineralization process. This
process involves the preferential deposition of minerals that cause the formation of a
hypermineralized surface layer more resistant to acidogenic attacks, thus resulting in
arrestment of the incipient caries lesion.13, 30, 35 The amount of remineralization that is
aided by the application of topical high concentration fluoride solution has been studied
extensively with resultant controversy regarding the depth of remineralization and
10
whether complete remineralization of the body of the lesion would occur.28, 36-38 One of
the reasons proposed for incomplete remineralization of the body of the lesion is the
preferential deposition of minerals on the surface layer, which decreases porosity and
prevents further minerals from reaching deeper lesion areas.3-5, 39
A proposed mechanism to overcome this problem and to improve the appearance
of such lesions is microabrasion of the enamel surface using hydrochloric acid (HCL) and
an abrasive. Although this procedure occasionally improves the appearance of white spot
lesions, it results in the removal of considerable amounts of enamel and may cause soft
tissue damage by the HCL solution.8, 40, 41 Another proposed mechanism to enhance
incipient carries lesions' remineralization and appearance is acid etching of the enamel
surface layer. Phosphoric acid etching would remove the fluoride-rich layer and expose
more reactive enamel crystals without affecting the porosity and mineral content of the
underlying tissues in the body of the incipient enamel lesion.8, 42-45 Enamel fluoride
uptake is reported to be inversely proportional to its initial fluoride content, and therefore,
removal of the surface layer with its higher fluoride concentration would allow for better
fluoride uptake.4, 18, 46 Furthermore, this procedure would not only increase the surface
layer porosity but also provide for a larger surface area available for fluoride-mediated
remineralization processes to occur.7
A more pronounced reduction in lesion depth after remineralization in acid-
etched incipient enamel lesions was reported in several studies.4-6, 42 Flaitz and Hicks
reported an increase in the thickness of the surface layer in the remineralized acid-etched
group.6 Al-Khateeb et al. reported an increase in the amount of minerals deposited in the
enamel surface and body of the lesions as detected by TMR analysis.4 In the latter study,
11
the enhanced remineralization seemed to plateau after several weeks, which suggests the
possible need for further etching treatments during the remineralization process.4
MINERAL CONTENT MEASUREMENT
Mineral concentration distribution can be measured either directly by chemical
analysis of micro-samples or indirectly (e.g. transverse microradiography (TMR). These
can also be regarded as either being destructive or non-destructive to the tissue sample.
Chemical analysis would involve complete dissolution of the microsample that was
obtained by abrasion, acid etching, or microdrilling, providing only the mineral content in
the layer that was obtained as a whole.47 Conventional microscopy methods such as
contact microradiography and scanning electron microscopy are usually two-dimensional
and involve destruction of the sample. They allow examination of lesions, either before
or after the experimental procedures.48 For examination of sections, transverse
microradiography (TMR) is preferred to polarized light microscopy (PLM), mainly due
to its direct relation to mineral content.47 However, both require physical sectioning of
the specimens that would cause the loss of some structure between the sections. Accuracy
in determining the linear attenuation coefficient depends on the section being aligned
parallel with a well-known thickness at the point of measurement.49 Although TMR
requires the preparation of very thin sections, it’s still considered the gold standard for
determining mineral loss and lesion depth with its higher sensitivity for minute lesion
depth progression.50, 51
TRANSVERSE MICRORADIOGRAPHY (TMR)
12
Transverse microradiography is considered to be the gold standard for
determining mineral changes in experimental caries lesions against which newly
developed caries diagnosis technologies are compared and validated.50, 51 Ever since its
introduction into the dental research field in 1963,52 TMR has undergone continuing
technique advancements that allowed the most detailed quantitative mineral density
profile data to be collected. The use of TMR for mineral content analysis has been
applied not only post-experimentally, but also for single-section demineralization or
remineralization experiments.50, 51, 53, 54 The use of microradiographs for analysis of
enamel thin sections on different occasions proved to be a reproducible and very reliable
technique given the standardization of steps applied during the procedure.51, 54
TMR requires the preparation of transverse planoparallel thin sections with high
precision or lapping in order to preserve the surface structure of the calcified tissues
being tested.49-51, 55 The sections produced for TMR analysis should be thin enough to
allow only partial absorption of x-rays in a simple relation to the mineral content. The
calculation of the lesion profile is produced by using the mineral contents of sound
tissues as reference points.50, 51
Following the preparation of thin sections, x-ray absorbance images are produced
on photographic plates and their optical densities are converted to mineral content values
by calibration with an aluminum stepwedge.4, 51 Nowadays, a video camera is used for
recording the optical density of microradiographs, which allowed the examination of
sections on screen monitors.56 Computer programs have been developed to allow
adjustment of the scanned area according to the experimental needs. This has allowed the
13
use of TMR for measurement of both minute changes in the surface structure and overall
changes in the mineral content of the section as a whole.51, 57
The largest source of variation between TMR studies arise from the varying
definitions of the start lesion at depth zero, which is known as IML. IML definition in
studies ranges from a mineral content of 0.0-volume percent, to 20-volume percent, to
sometimes the volume percent at the steepest part or the top of the surface layer in the
mineral content-depth profile. A smaller source of variation arises from the varying
definitions of lesion depth and mineral content for sound tissues.51
X-RAY MICROTOMOGRAPHY (µ-CT)
Microcomputed tomography (µ-CT) is a microscopic version of computed
tomography that allows non-destructive visualization of the morphological characteristics
of teeth and the determination of the mineral content in teeth and bones.48, 49, 58-63 The
major difference between µ-CT systems and medical CT scanners is that the specimen
moves while the x-ray source and detector are stationary in the µ-CT units.49 The µ-CT
method has several advantages, including a constant slice thickness that only requires the
x-ray beam. This allows the acquisition of much thinner slices than can be acquired with
mechanical cutting.59 Elimination of the mechanical cutting step allows for a much
simpler sample preparation, because the procedure only requires the tissues to remain
hydrated during the scan period to preserve the sample's physical properties.49, 64 It also
allows accurate measurement of linear attenuation coefficients of mineralized tissues,49
and real-time monitoring of structural and compositional changes.49 Currently, µ-CT is
used for 3-D rendering and quantification of mineral content in tissues in medicine and
dentistry.49, 62, 65, 66
14
X-ray microtomography studies of biological hard tissues can be divided into
studies of cortical and cancellous bones and those of teeth. Teeth and cortical bone
studies concentrate on the measurement of the degree of mineralization, while cancellous
bone studies concentrate on trabecular, morphological measurements.49 Mineral
concentrations in cortical bones can be obtained by converting their linear attenuation
coefficients while assuming they're comprised of protein and pure hydroxyapatite, and by
using calculated, mass-attenuation coefficients.67 A volume unit in µ-CT images, the
voxel, can be regarded as the elementary volume of bone (EVB), which is the volume of
bone composed of mineral, collagen, small blood vessels, cells, water and other organic
components.49 Mean trabecular thickness and trabecular density of cancellous bones can
be digitally calculated in three dimensions that allow the generated slices to be
constructed in various orientations. Cancellous bone trabecular microstructure can be
visualized in any of the three dimensions by using µ-CT as the examination technology.51,
68, 69
X-ray microtomography has been increasingly used for studying dental structures,
including dentin;70 in-vitro enamel lesion development and caries research;71 assessing
root canal preparation and obturation;72 root resorption,73, 74and enamel.75 It has been
reportedly used for calculation of the elastic modulus of dental materials. In dental
materials research, µ-CT is used to provide both qualitative and quantitative data. In
order to obtain accurate quantitative mineral content data from dental structures, a
reliable means of calibration is needed.64 External calibration standards or phantoms
have been discussed in the literature where commercially available phantoms and custom
phantoms were used. Despite the difficulty of mimicking the complexity of dental
15
structures, phantoms should be constructed from materials that best relate to the
examined structure.64, 76, 77 Accuracy of µ-CT images also depends on the filters used to
decrease noise by removing the low-energy soft x-rays that scatter rather than penetrate
the object under study efficiently. Several filter materials have been used in the
literature, which included varying thicknesses of aluminum, copper, or both.64, 76, 78
16
MATERIALS AND METHODS

17
STUDY DESIGN
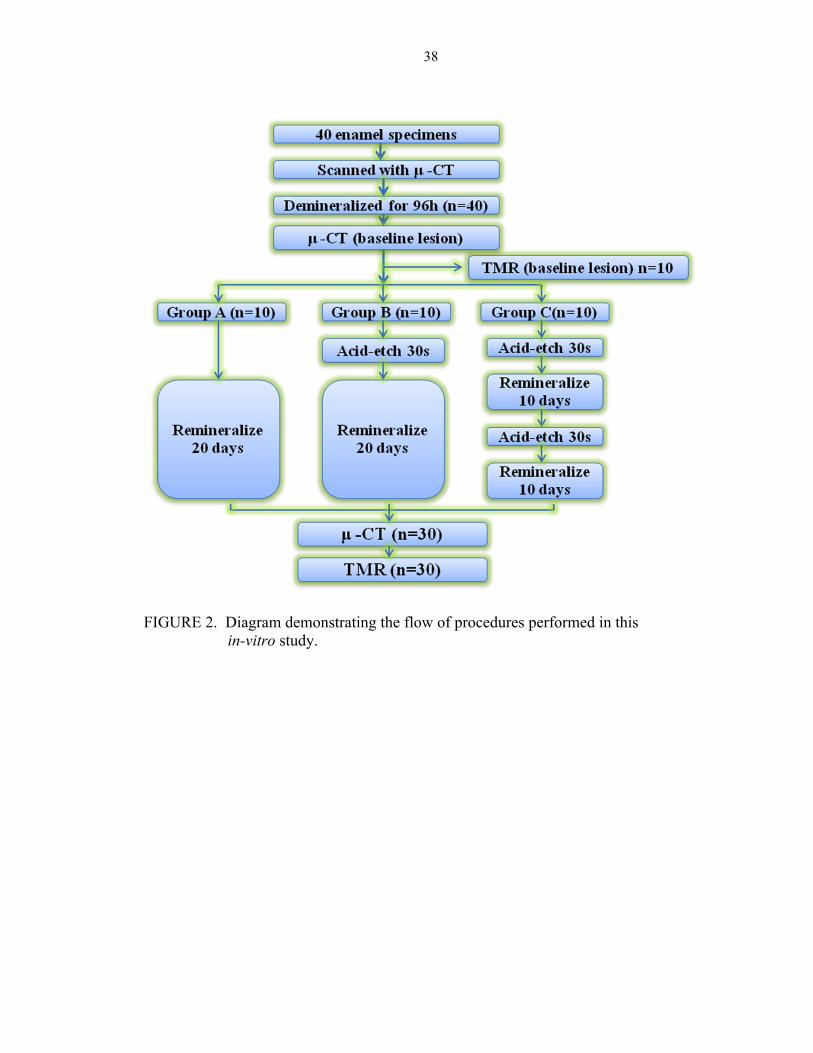
In this in-vitro study, 40 (1 mm × 2 mm) sound human enamel specimens were
used. The specimens were demineralized in order to form artificial subsurface caries-like
lesions. Ten specimens were randomly selected and sectioned for TMR analysis. The
remaining specimens were then randomly assigned to three groups each with 10
specimens. Group A was subjected to a pH-cycling remineralization regimen with 1100-
ppm sodium fluoride for 20 days. Group B specimens’ surfaces were etched with 35-
percent phosphoric acid for 30 seconds and then treated as group A. Group C was treated
like group B, but with an additional acid- etch application after 10 days of the
remineralization regimen. Additionally, mineral volume was assessed by µ-CT before
demineralization, and before and after the remineralization treatment. For comparison,
TMR was used to measure the mineral content and lesion depth before and after the
remineralization treatment for the three groups.
SPECIMEN PREPARATION
The specimens were prepared from extracted sound human teeth, excluding third
molars, and the specimens were obtained from oral surgeons and stored in a 0.1-percent
thymol solution from the time of extraction. All teeth were obtained in accordance with
current human-tissue acquisition regulations. The collection of human teeth for use in
dental laboratory research studies was approved by the Indiana University-Purdue
University Indianapolis (IUPUI) Institutional Review Board (IRB#0306-64).
18
Specimens were cut using a water -cooled Isomet low-speed saw into 2 mm × 2
mm specimens. Then, these were divided into 1 mm × 2 mm specimens using the hard
tissue microtome (Series 1000 Deluxe hard tissue microtome, Scifab, Lafayette, CO).
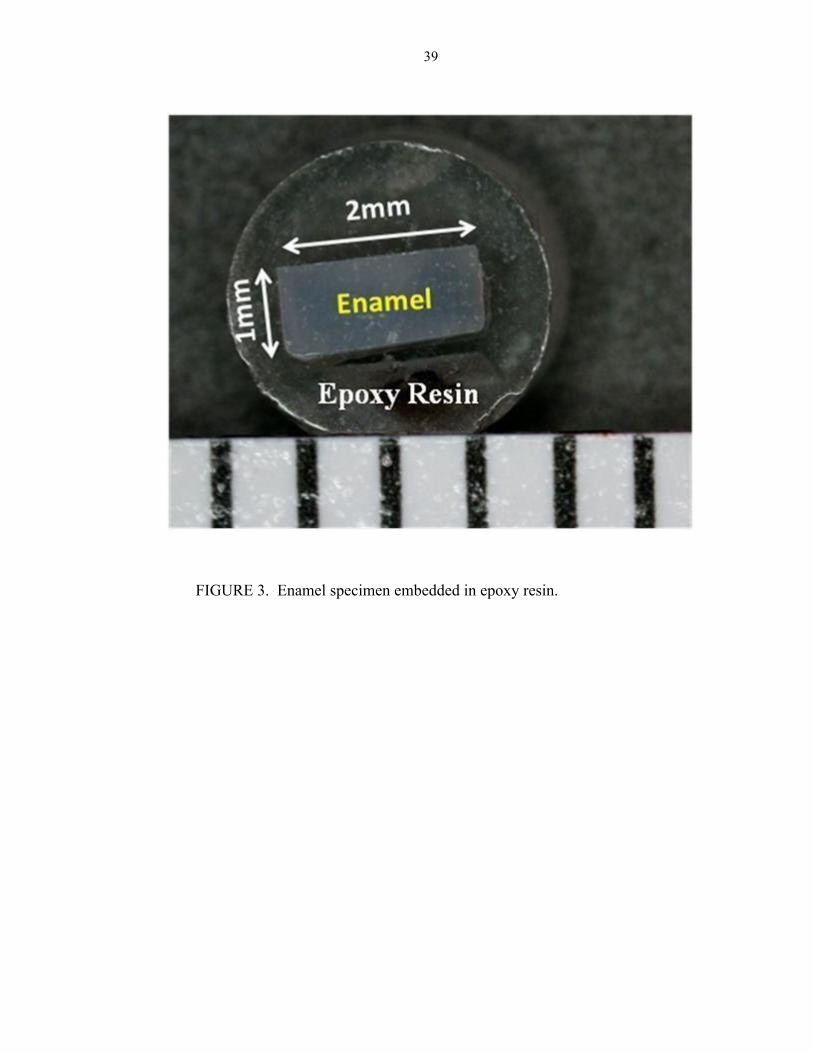
The cut-enamel blocks were imbedded into epoxy resin (EPO-TEK 301, Epoxy
Technology, Inc., Billerica, MA), leaving the top of the 1 mm × 2 mm enamel surface
exposed. The exposed enamel surfaces were ground using 1200- and 4000-grit silicon
carbide paper in the Struers polishing unit (Struers Inc., Westlake, OH) to remove
approximately 50 µm of the surface and thereby remove the hypermineralized enamel
surface layer to expose the reactive enamel structure. The specimens were then polished
to a higher luster using the polishing pad and diamond polishing liquid (dp suspension,
Struers Inc., Westlake, OH) following standard methods (SOP#L012). Then, the
polished enamel surface of each specimen was cleaned by sonication in a microliquid
solution (2% Micro-90% Liquid Soap, International Product Corp., Burlington, NJ). The
surface of each specimen was evaluated for any microcracks or residual acrylic on the
enamel surface using a stereomicroscope (X20 magnification) and a suitable light source.
Specimens were then stored under humid conditions in closed, labeled containers. The 40
sound enamel specimens were assessed prior to demineralization using µ-CT
(SKYSCAN 1172 High Resolution Micro-CT, SKYSCAN, Kontich, Belgium) as
described below.
LESION FORMATION
Subsurface lesions were produced in the enamel specimens using a 96-hour
immersion at 37˚C in a solution of 0.1-ml lactic acid and 0.2-percent carbopol that has
been 50-percent saturated with hydroxyapatite and adjusted to pH 5.0 following standard
19
methods (SOP#L603). The specimens were then removed from the solution and rinsed in
deionized water (DI water). Specimens were finally stored in individually marked vials
under humid conditions.
GROUP ASSIGNMENT
Ten specimens were randomly selected and removed for TMR baseline lesion
analysis. The remaining 30 enamel specimens were included in the remineralization stage
of the experiment. The specimens were randomly assigned to the different experimental
groups. The specimens were coded and divided into three treatment groups (10
specimens per group): A, B, and C. Group A (positive control group) was subjected to the
remineralization treatment directly after lesion formation. Groups B and C were etched
with 35-percent phosphoric acid for 30 seconds and then washed with a stream of
deionized water for 30 seconds. Next, the three groups were treated in a remineralization
regimen using a remineralization /demineralization pH cycling model. The specimens
were exposed to a 50:50 mixture of pooled human saliva and a mineral solution
containing 2.2 g/L gastric mucin, 0.381 g/L NaCl, 0.213 g/L CaCl₂-2H₂O, 0.738 g/L
KH₂PO₄, and 1.114 g/L KCL at pH 7.0 and 37˚C. The collection of human saliva for use
in dental laboratory research studies was approved by the IUPUI IRB # 0304-58. The
specimens were subjected to a four-hour-per-day acid challenge in the lesion-forming
solution described previously, and then in fresh 50:50 saliva for one hour, which was
changed each day during the acid-challenge period of the treatment regimen. All groups
were exposed to four daily fluoride treatments (25 % wt of 1100-ppm fluoride from a
NaF toothpaste solution) for 1 minute (Table II). After 10 days of the remineralization/
20
demineralization cycle, group C was subjected to a second etch with 35-percent
phosphoric acid for 30 seconds followed by washing with a stream of deionized water for
30 seconds. After the acid-etching treatment, group C was then returned to the
remineralization/demineralization pH cycle model for the remainder of the experiment.
The pH cycling remineralization/demineralization regimen was carried out for a total of
20 days.
X-RAY MICROTOMOGRAPHY (µ-CT) MEASUREMENT
Mineral density of the specimens was measured using µ-CT (SKYSCAN 1172
high resolution micro-CT; SKYSCAN, Kontich, Belgium) before lesion formation
(sound), after lesion formation, and at the end of the remineralization treatment. Both the
specimens and the phantom, which is used as an internal standard for mineral density
quantification and µ-CT calibration, were scanned with x-rays generated by a sealed
microfocus x-ray tube set at 75 keV and 134 µA current, at 2k-high camera resolution
setting. A 0.5-mm thick aluminium filter was placed in front of the detector to remove
low energy x-rays below 30 keV. The generated x-ray images were then reconstructed
using the NRECON reconstruction software (NReconServer64bit version, SKYSCAN,
Kontich, Belgium). Reconstruction of the images was done using a 20-percent ring
artifact reduction and a 40-percent beam hardening with a histogram scale from 0.005 to
0.2333096. Cross-sections of the middle portion of each specimen were then used for the
µ-CT analysis completed with the CT analysis software (CT An [v.1.9], SKYSCAN,
Kontich, Belgium). The volumetric mineral content (VM [µm³]) of the lesion was
determined between 91 and 0 wt%.
21
TRANSVERSE MICRORADIOGRAPHIC MEASUREMENT
TMR was used to determine the mineral loss (TMR IML) and lesion depth of
100- µm sections obtained from 10 randomly selected specimens at the baseline lesion
stage. In addition, at the end of the demineralization and remineralization regimen, one
100-µm section was obtained from each specimen in the three experimental groups for
TMR analysis. The enamel sections were obtained by using the hard-tissue microtome
(Series 1000 Deluxe hard tissue microtome, Scifab, Lafayette, CO) and then stored in
individually marked vials under humid conditions. The enamel sections and the
aluminum calibration stepwedge were then mounted and radiographed on a 2"×2" high
resolution photographic plate (K1A Photoplates, Microchrome Technology, Inc., San
Jose, CA) with Ni-filtered Cu-Kα radiation (Philips x-ray generator, Philips Electronic
Instruments Inc., Mahwah, NJ) at 30 mA and 20 kV for 65 minutes. The plates were
developed according to the manufacturer’s instructions. Two parameters were measured;
mineral content loss (TMR IML [% volume mineral × µm]) and lesion depth (LD [µm])
using TMR software (TMR 1.24; Inspektor Research Systems, Amsterdam, The
Netherlands).
STATISTICAL ANALYSIS
The µ-CT outcome used to assess remineralization was the percent mineral
recovery in 91-0 Wt%, calculated using the formula 100% × (remineralization mineral
volume - demineralization mineral volume) / (sound mineral volume - demineralization
mineral volume). Comparisons were made among the three groups for differences in
remineralization as measured by using the µ-CT for percent mineral recovery in 91-0
22
wt%. Additional comparisons of TMR lesion depth (µm) and IML (%volume mineral ×
µm) were performed using one-way analysis of variance (ANOVA). Pair-wise
comparisons among the groups were performed using Fisher's Protected Least Significant
differences to control the overall significance level at 5 percent. Correlation coefficients
and plots were used to assess the correlations among the µ-CT and TMR parameters.
SAMPLE SIZE JUSTIFICATION
A previous pilot study was conducted using the µ-CT and TMR. For µ-CT, after
96 hours demineralization followed by six days remineralization, the mean (SD) percent
mineral recovery in 91-0 wt % was 31 (6) and after 12 days remineralization, the mean
(SD) was 41 (6). For TMR, after 96 hours demineralization followed by 12 days
remineralization , the mean (SD) IML was 2700 (260) %volume mineral × µm, and the
mean (SD) lesion depth was 96 (7) µm. To be conservative in the calculations, the
standard deviations used in the calculations were 7.5 percent change in 91-0 Wt %, 300
%volume mineral x µm³ for TMR IML, and 8 µm for TMR lesion depth. With a sample
size of 10 per group, the study had an 80-percent power to detect a difference between
any two groups of 10 for percent mineral recovery in 91-0 Wt%, assuming a two-sided
test at a 5-percent significance level. With a sample size of 10 per group, the study had an
80-percent power to detect a difference between any two groups of 397 %volume mineral
× µm for TMR IML and 11 µm for TMR lesion depth.

23
RESULTS
24
Table III summarizes the mean and standard error for each outcome by group.
The following sections and tables will present more detailed statistical data for the groups
and the procedures that took place.
THE µ-CT DATA ANALYSIS RESULTS
The three groups did not have significantly different µ-CT percent mineral
recovery from demineralization (p = 0.82).
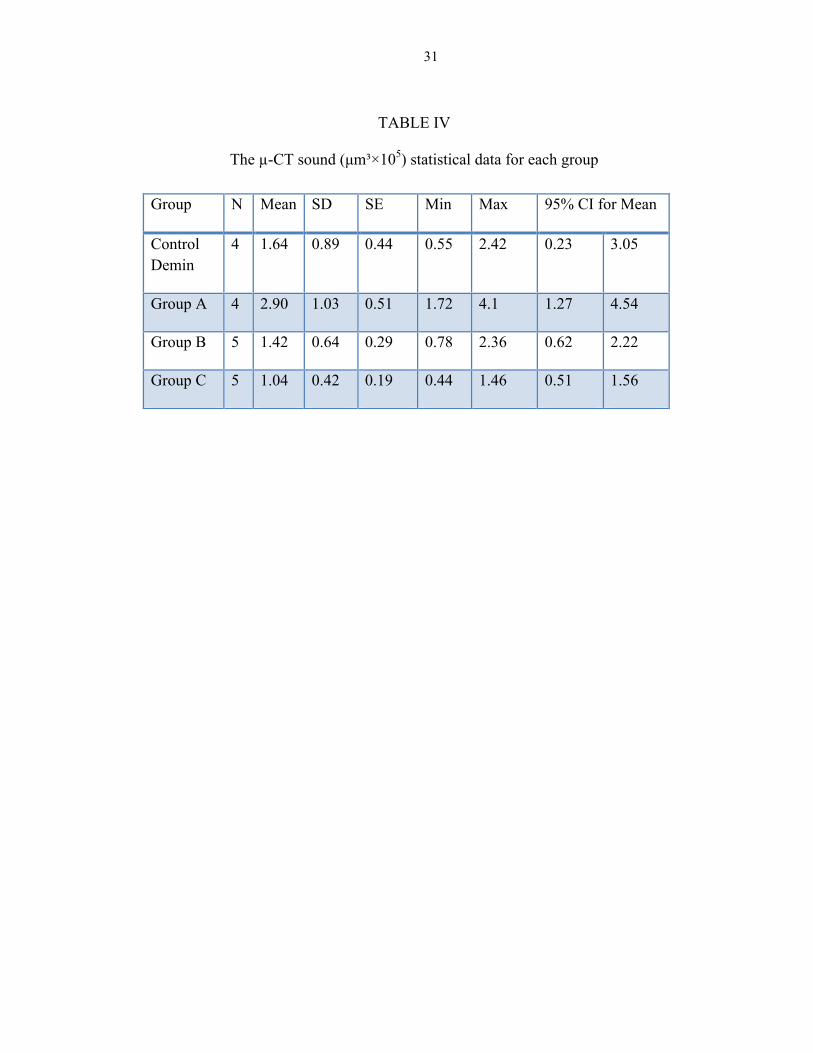
In the sound specimens, it was found that Group A had the highest mineral
volume of 91-0 wt% with a mean value of 2.90 ×105 µm³, followed by the Control Demin
group with a mean value of 1.64 ×105 µm³, Group B with a mean value of 1.42 ×105 µm³,
then Group C with a mean value of 1.04 ×105 µm³ (Table IV).
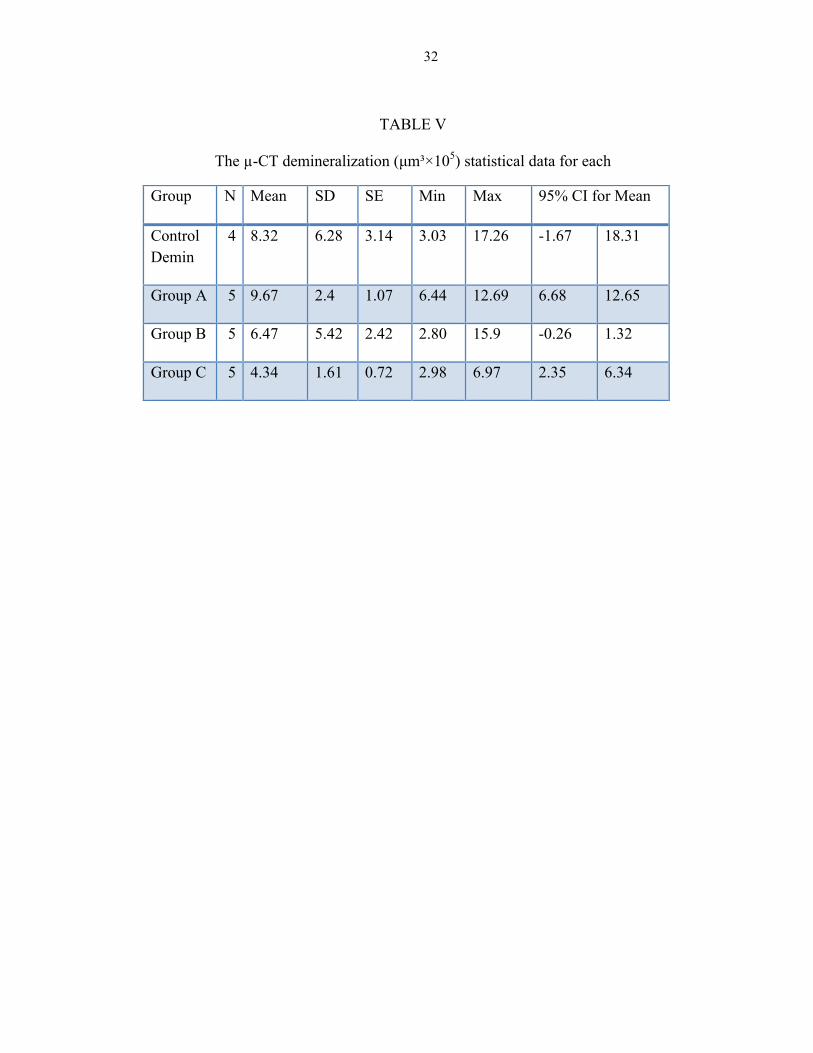
In the demineralized specimens, it was found that Group A had the highest
mineral volume of 91-0 wt% with a mean value of 9.67 ×105 µm³, followed by the
Control Demin group with a mean value of 8.32 ×105 µm³, Group B with a mean value of
6.47 ×105 µm³, then Group C with a mean value of 4.34 ×105 µm³ (Table V).
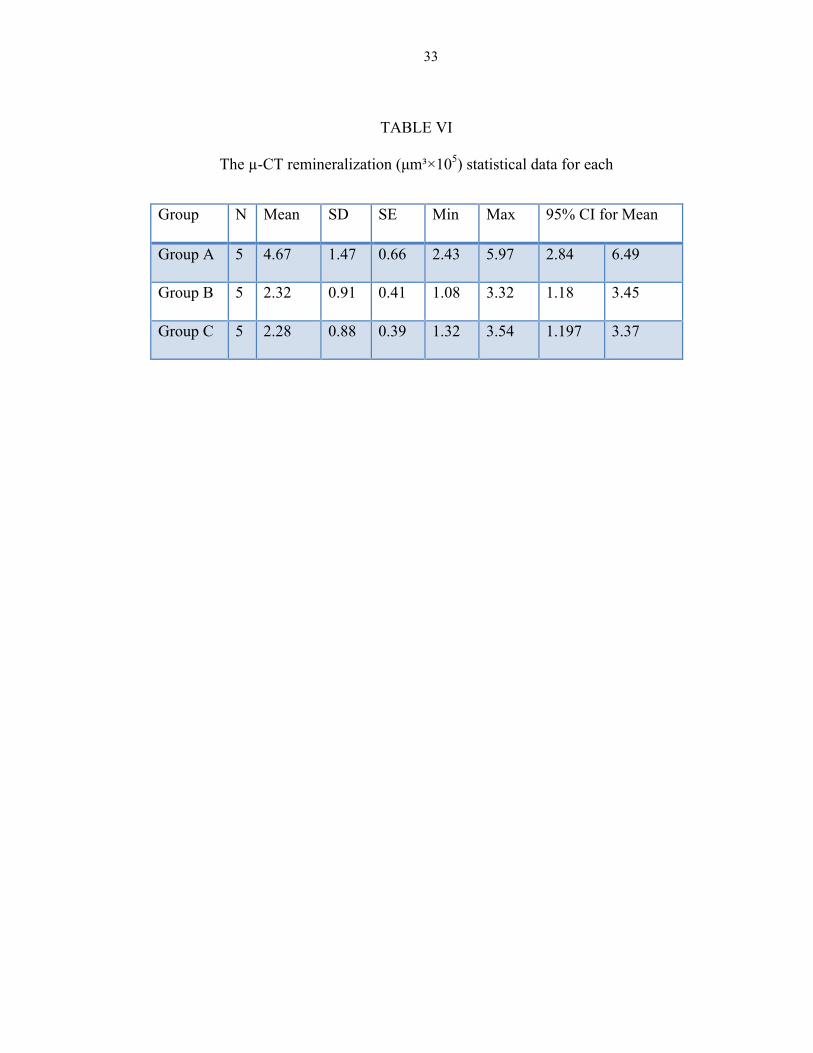
In the remineralized specimens, it was found that Group A had the highest
mineral volume of 91-0 wt% with a mean value of 4.67 ×105 µm³, followed by Group B
with a mean value of 2.32 ×105 µm³, then Group C with a mean value of 2.28 ×105 µm³
(Table VI).
25
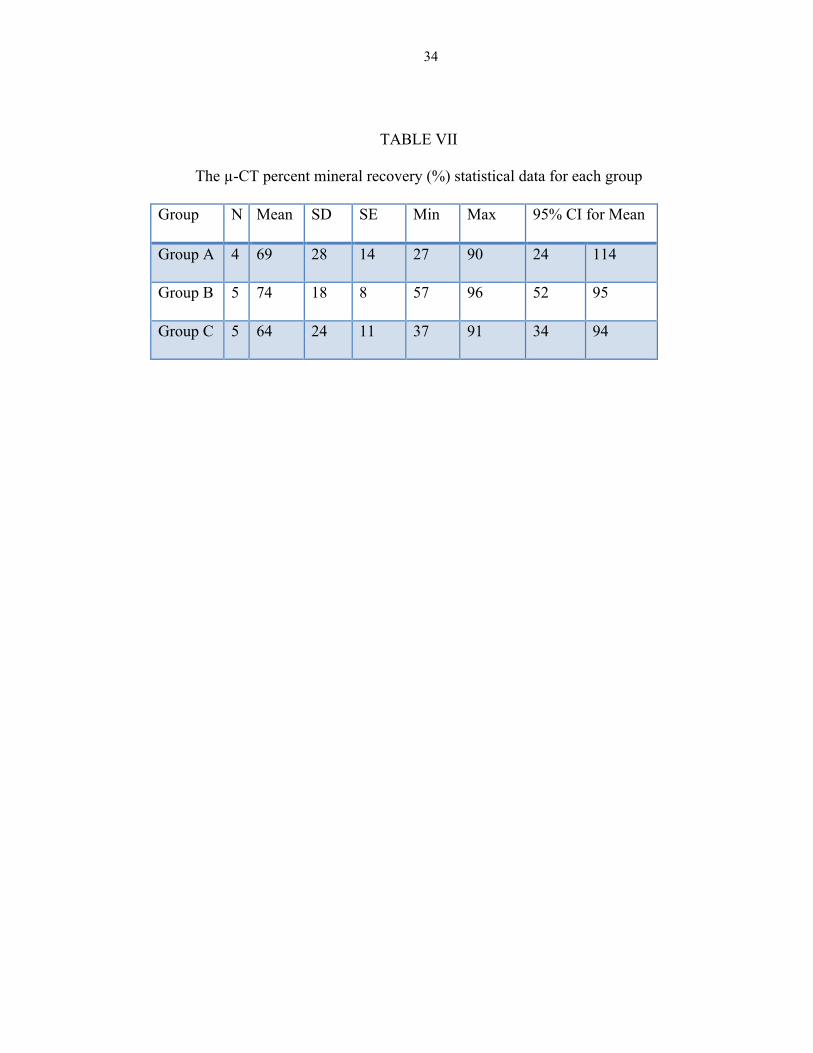
The µ-CT percent mineral recovery was found highest in Group B with a mean
value of 74 percent, followed by Group A with a mean value of 69 percent, then Group C
with a mean value of 64 percent (Table VII).
TMR DATA ANALYSIS RESULTS
TMR IML Data
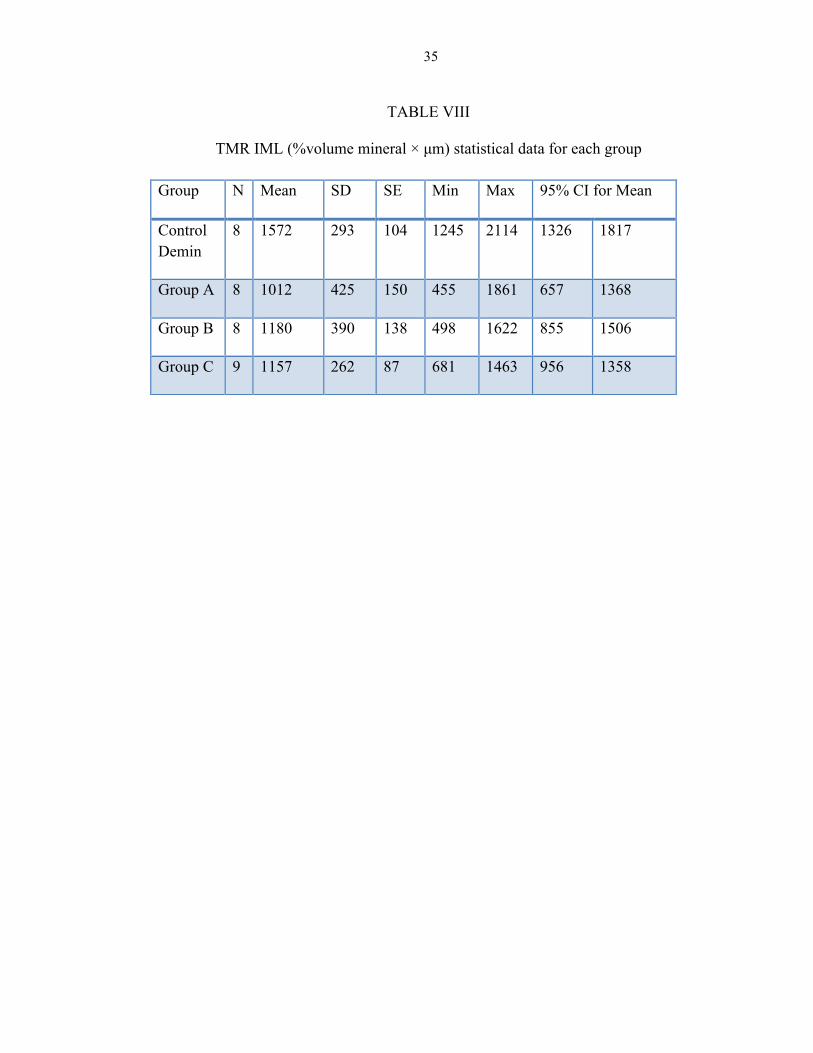
The Control Demin group had the highest IML with a mean value of 1572
%volume mineral × µm, followed by Group B with a mean value of 1180 %volume
mineral × µm, then Group C with a mean value of 1157 %volume mineral × µm, then to
lesser extent Group A with a mean value of 1012 %volume mineral × µm (Table VIII).
Only the Control Demin group had significantly different TMR IML compared
with the other groups (p < 0.05 for other groups compared with Demin; p > 0.30 for other
groups compared with each other).
TMR Lesion Depth Data
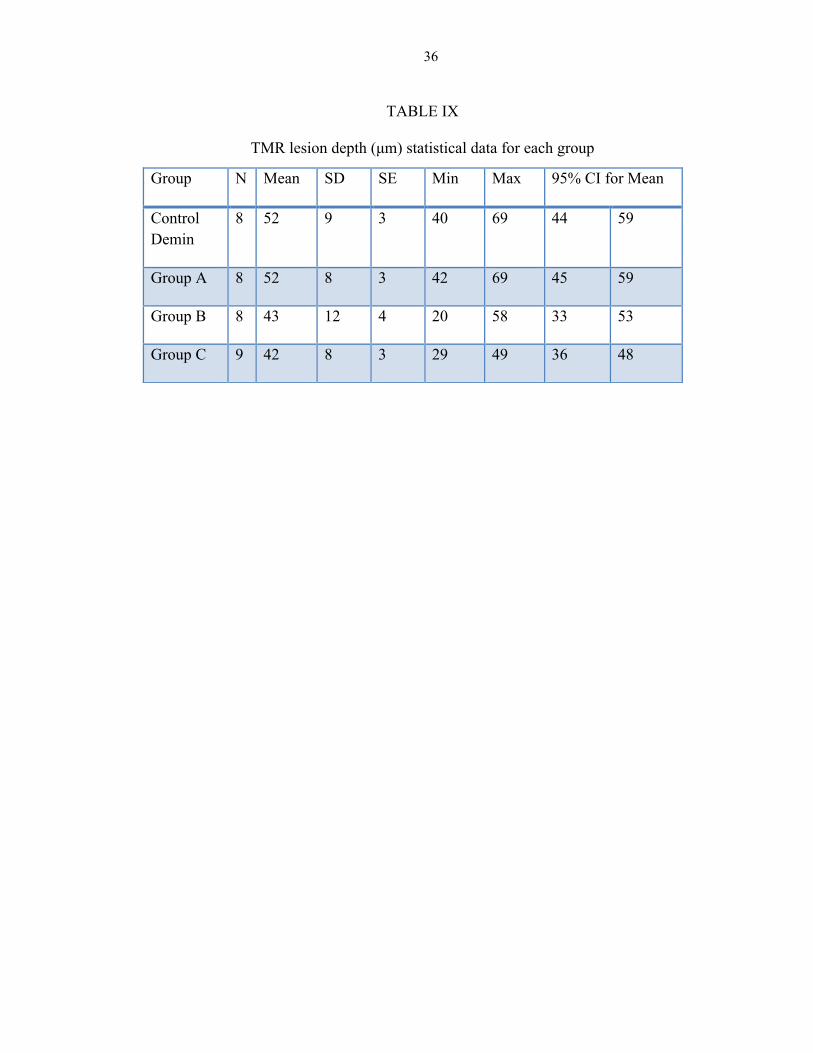
In regard to TMR lesion depth, both the Control Demin group and Group A had
the deepest lesions with a mean value of 52 µm, followed by Group B with a mean value
of 43 µm, then Group C with a mean value of 42 µm (Table IX).
The groups did not have significantly different TMR lesion depth (p = 0.07).
TMR and µ-CT Correlation
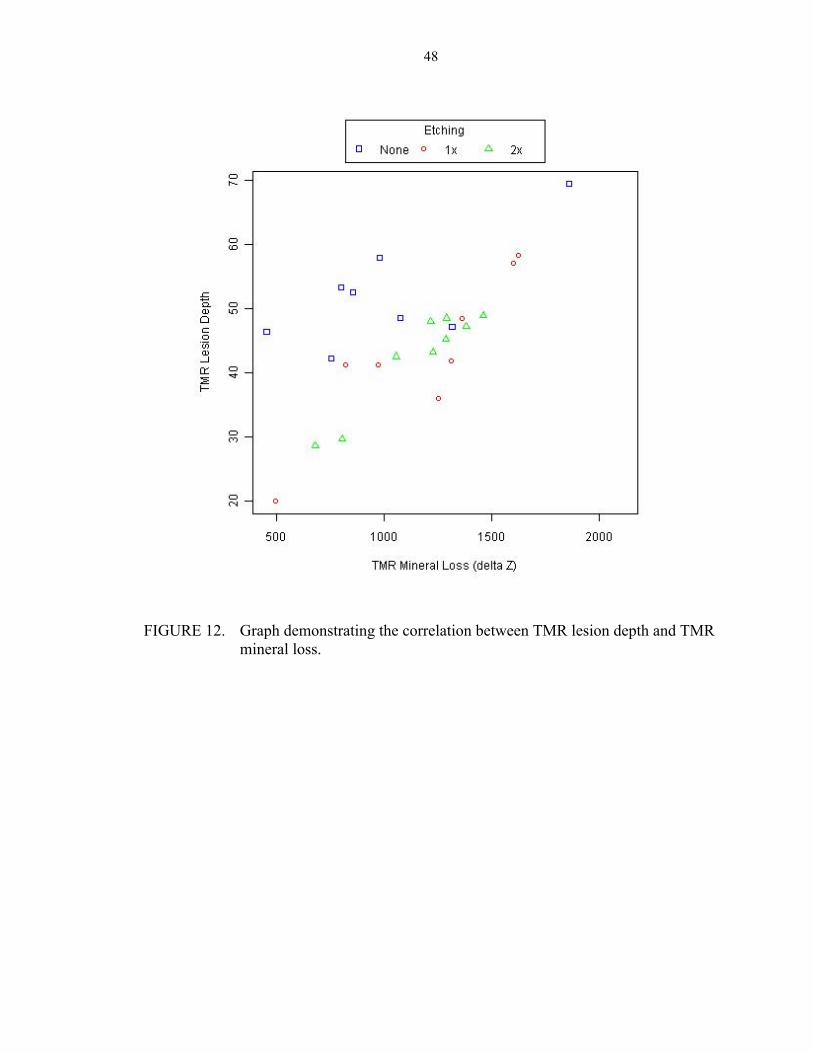
The correlation between TMR IML and TMR lesion depth was 0.66 (p < 0.0001)
(Figure 12).

26
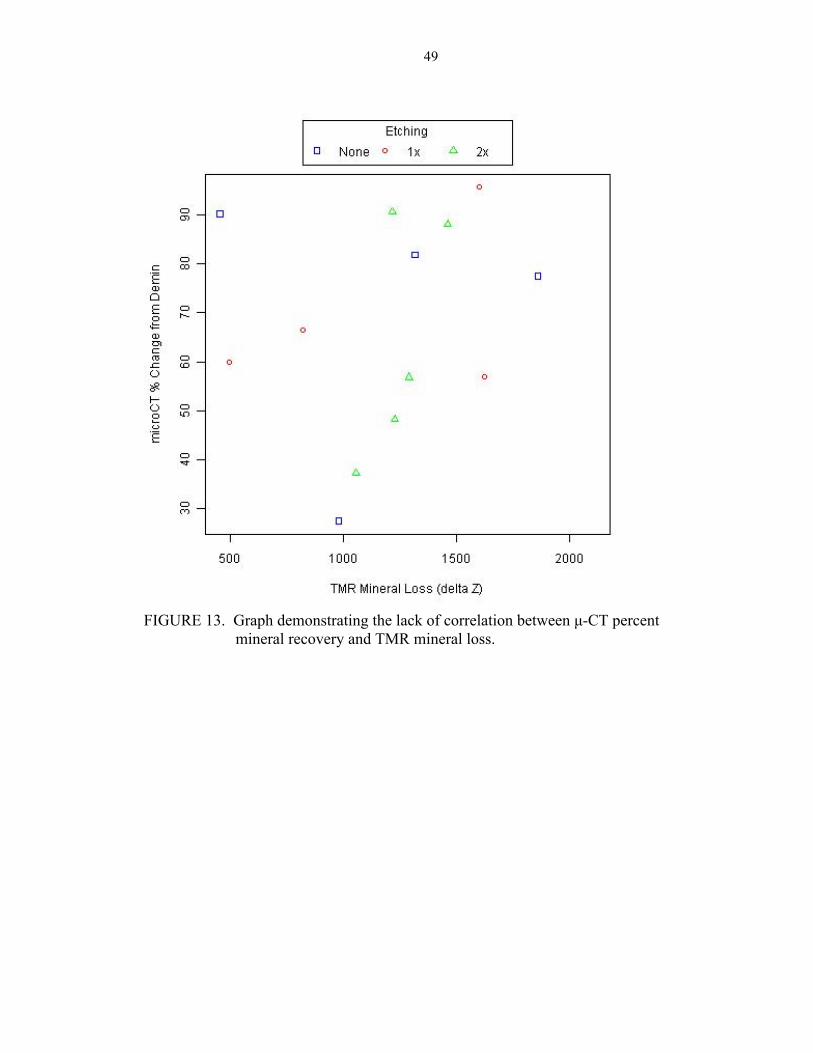
The µ-CT percent mineral recovery from demineralization was not correlated
with TMR IML (r = 0.19, p = 0.53) (Figure 13).
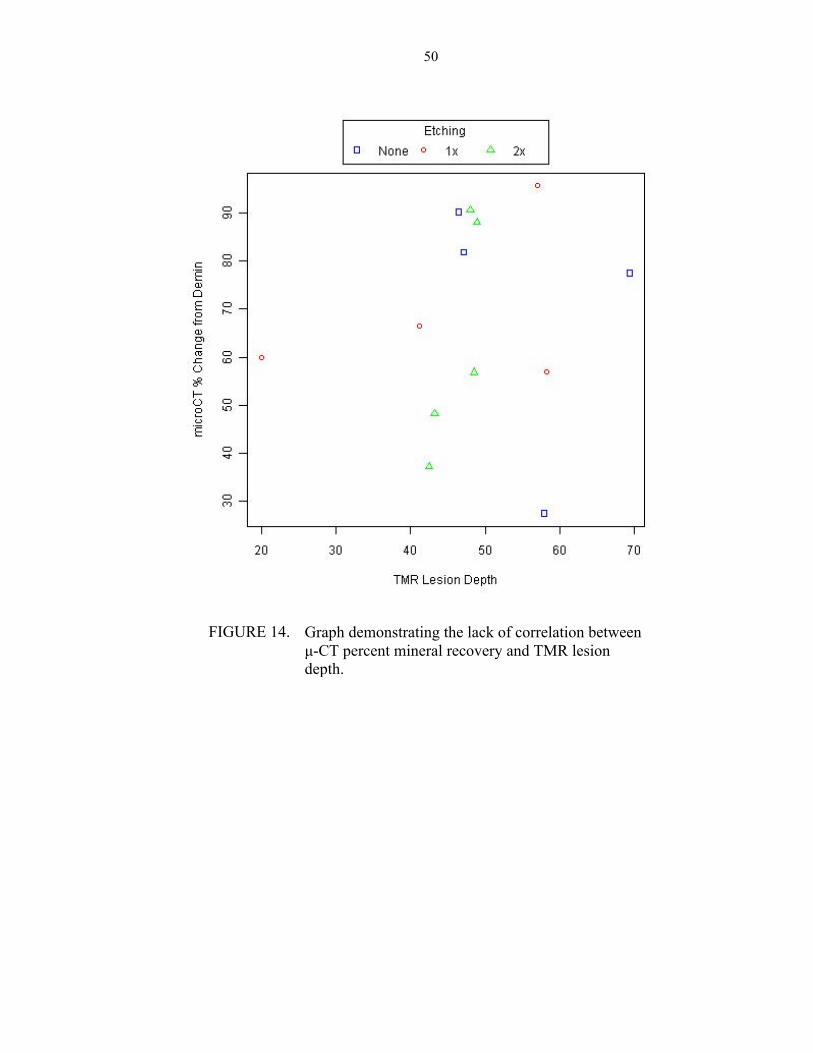
The µ-CT percent mineral recovery from demineralization was not correlated
with TMR lesion depth (r = 0.13, p = 0.67) (Figure 14).

27
TABLES AND FIGURES
28
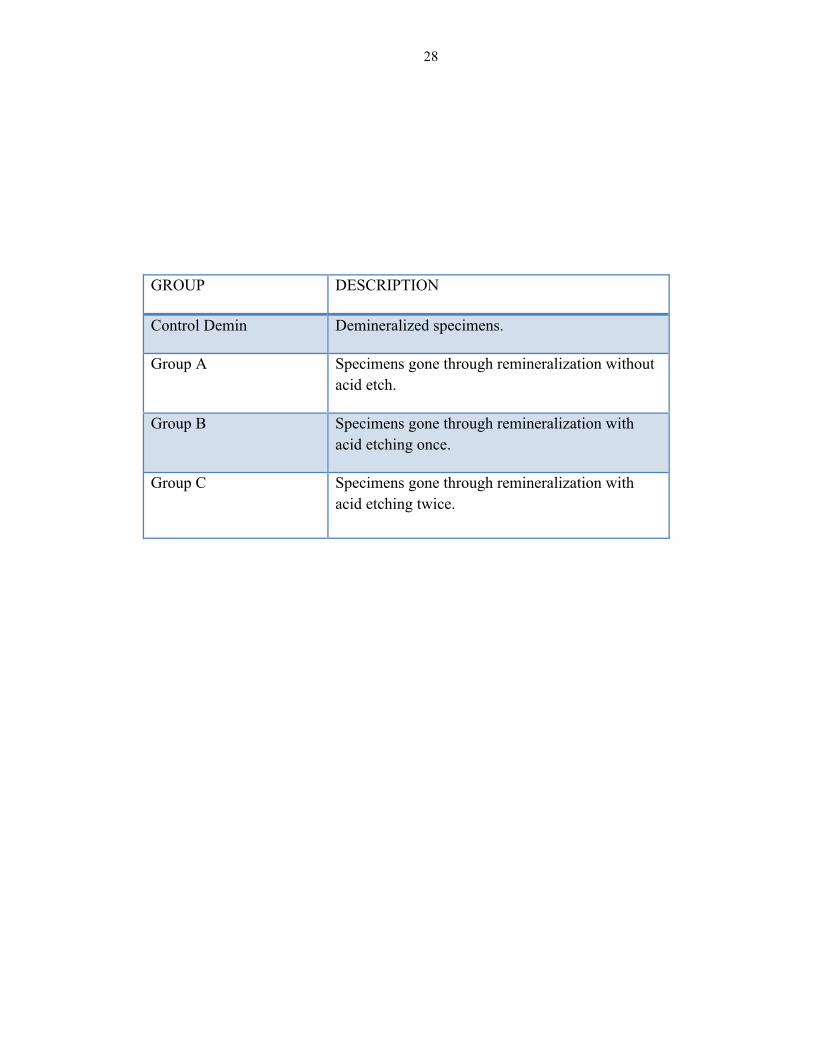
GROUP DESCRIPTION
Control Demin Demineralized specimens.
Group A Specimens gone through remineralization without acid etch.
Group B Specimens gone through remineralization with acid etching once.
Group C Specimens gone through remineralization with acid etching twice.
TABLE I
Group assignments and their descriptions
29
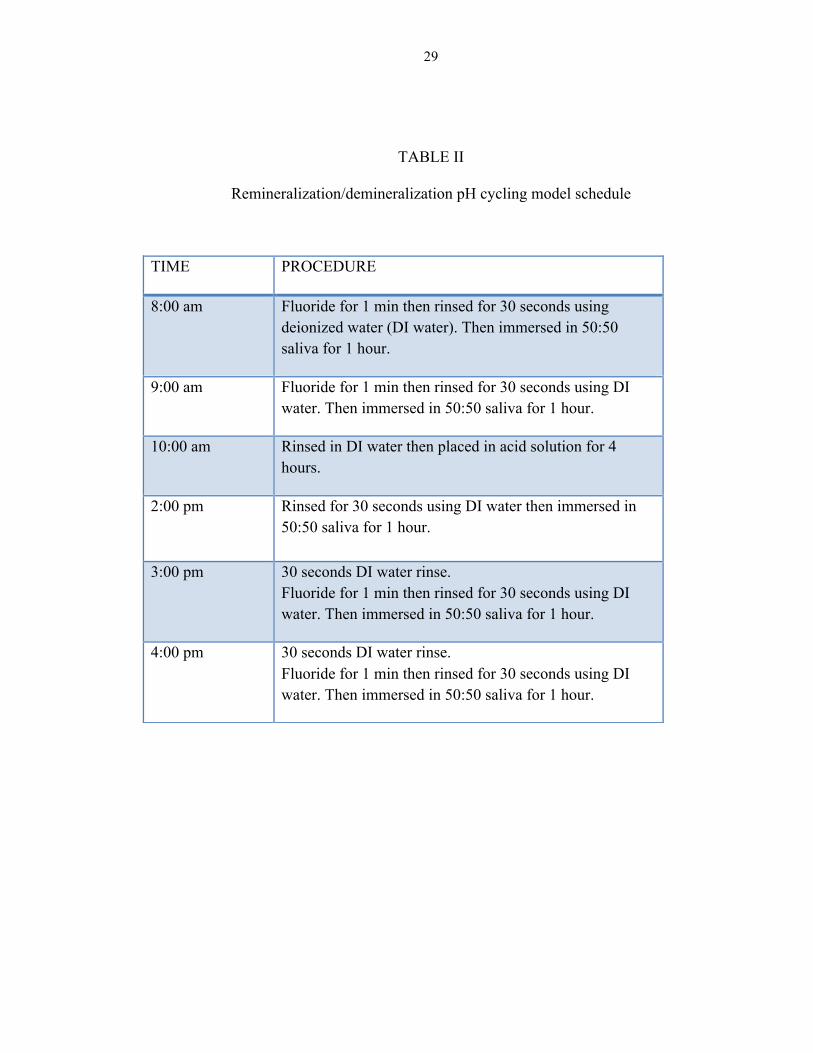
TABLE II
Remineralization/demineralization pH cycling model schedule
TIME PROCEDURE
8:00 am Fluoride for 1 min then rinsed for 30 seconds using deionized water (DI water). Then immersed in 50:50 saliva for 1 hour.
9:00 am Fluoride for 1 min then rinsed for 30 seconds using DI water. Then immersed in 50:50 saliva for 1 hour.
10:00 am Rinsed in DI water then placed in acid solution for 4 hours.
2:00 pm Rinsed for 30 seconds using DI water then immersed in 50:50 saliva for 1 hour.
3:00 pm 30 seconds DI water rinse. Fluoride for 1 min then rinsed for 30 seconds using DI water. Then immersed in 50:50 saliva for 1 hour.
4:00 pm 30 seconds DI water rinse. Fluoride for 1 min then rinsed for 30 seconds using DI water. Then immersed in 50:50 saliva for 1 hour.
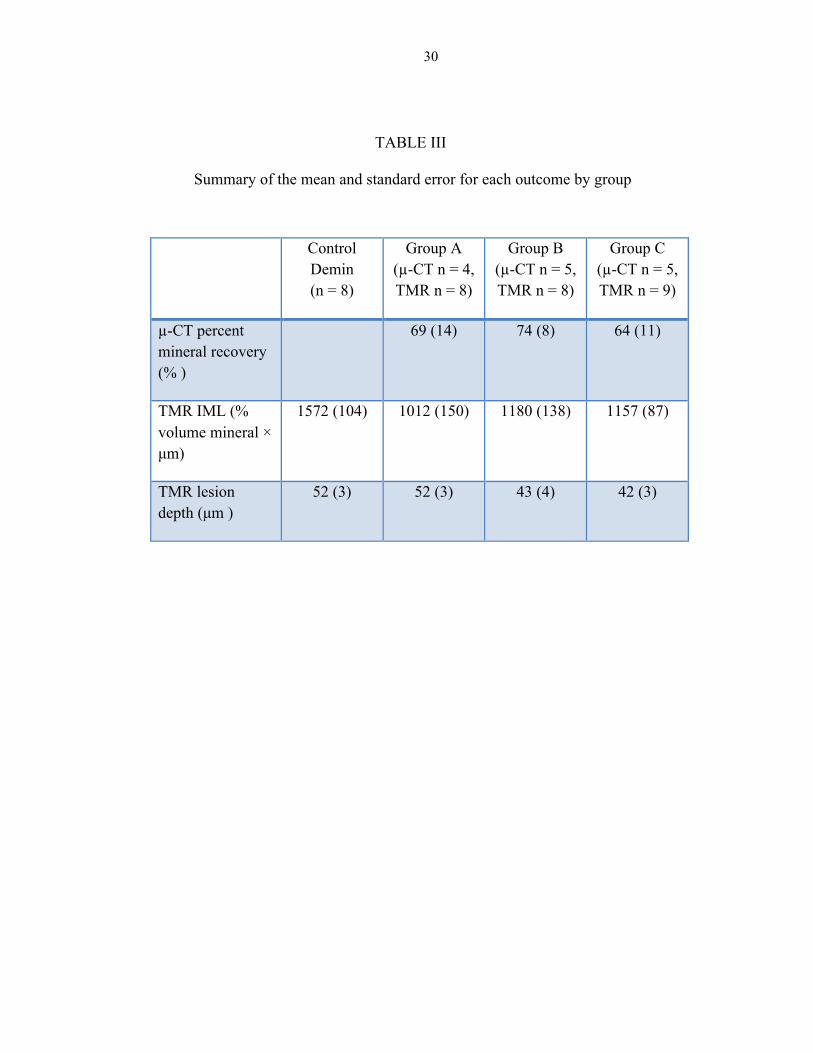
30
Control Demin (n = 8)
Group A (µ-CT n = 4, TMR n = 8)
Group B (µ-CT n = 5, TMR n = 8)
Group C (µ-CT n = 5, TMR n = 9)
µ-CT percent mineral recovery (% )
69 (14) 74 (8) 64 (11)
TMR IML (% volume mineral × µm)
1572 (104) 1012 (150) 1180 (138) 1157 (87)
TMR lesion depth (µm )
52 (3) 52 (3) 43 (4) 42 (3)
TABLE III
Summary of the mean and standard error for each outcome by group
31
Group N Mean SD SE Min Max 95% CI for Mean
Control Demin
4 1.64 0.89 0.44 0.55 2.42 0.23 3.05
Group A 4 2.90 1.03 0.51 1.72 4.1 1.27 4.54
Group B 5 1.42 0.64 0.29 0.78 2.36 0.62 2.22
Group C 5 1.04 0.42 0.19 0.44 1.46 0.51 1.56
TABLE IV
The µ-CT sound (µm³×105) statistical data for each group
32
Group N Mean SD SE Min Max 95% CI for Mean
Control Demin
4 8.32 6.28 3.14 3.03 17.26 -1.67 18.31
Group A 5 9.67 2.4 1.07 6.44 12.69 6.68 12.65
Group B 5 6.47 5.42 2.42 2.80 15.9 -0.26 1.32
Group C 5 4.34 1.61 0.72 2.98 6.97 2.35 6.34
TABLE V
The µ-CT demineralization (µm³×105) statistical data for each group
33
Group N Mean SD SE Min Max 95% CI for Mean
Group A 5 4.67 1.47 0.66 2.43 5.97 2.84 6.49
Group B 5 2.32 0.91 0.41 1.08 3.32 1.18 3.45
Group C 5 2.28 0.88 0.39 1.32 3.54 1.197 3.37
TABLE VI
The µ-CT remineralization (µm³×105) statistical data for each group
34
Group N Mean SD SE Min Max 95% CI for Mean
Group A 4 69 28 14 27 90 24 114
Group B 5 74 18 8 57 96 52 95
Group C 5 64 24 11 37 91 34 94
TABLE VII
The µ-CT percent mineral recovery (%) statistical data for each group
35
Group N Mean SD SE Min Max 95% CI for Mean
Control Demin
8 1572 293 104 1245 2114 1326 1817
Group A 8 1012 425 150 455 1861 657 1368
Group B 8 1180 390 138 498 1622 855 1506
Group C 9 1157 262 87 681 1463 956 1358
TABLE VIII
TMR IML (%volume mineral × µm) statistical data for each group
36
Group N Mean SD SE Min Max 95% CI for Mean
Control Demin
8 52 9 3 40 69 44 59
Group A 8 52 8 3 42 69 45 59
Group B 8 43 12 4 20 58 33 53
Group C 9 42 8 3 29 49 36 48
TABLE IX
TMR lesion depth (µm) statistical data for each group
37
FIGURE 1. Schematic of enamel rod structure in sound, demineralized, and remineralized enamel: a) sound enamel; b) demineralized enamel, and c) remineralized enamel. (Copyright 2000 Martin S. Spiller, DMD)
a. b. c.
38
FIGURE 2. Diagram demonstrating the flow of procedures performed in this in-vitro study.
39
FIGURE 3. Enamel specimen embedded in epoxy resin.
40
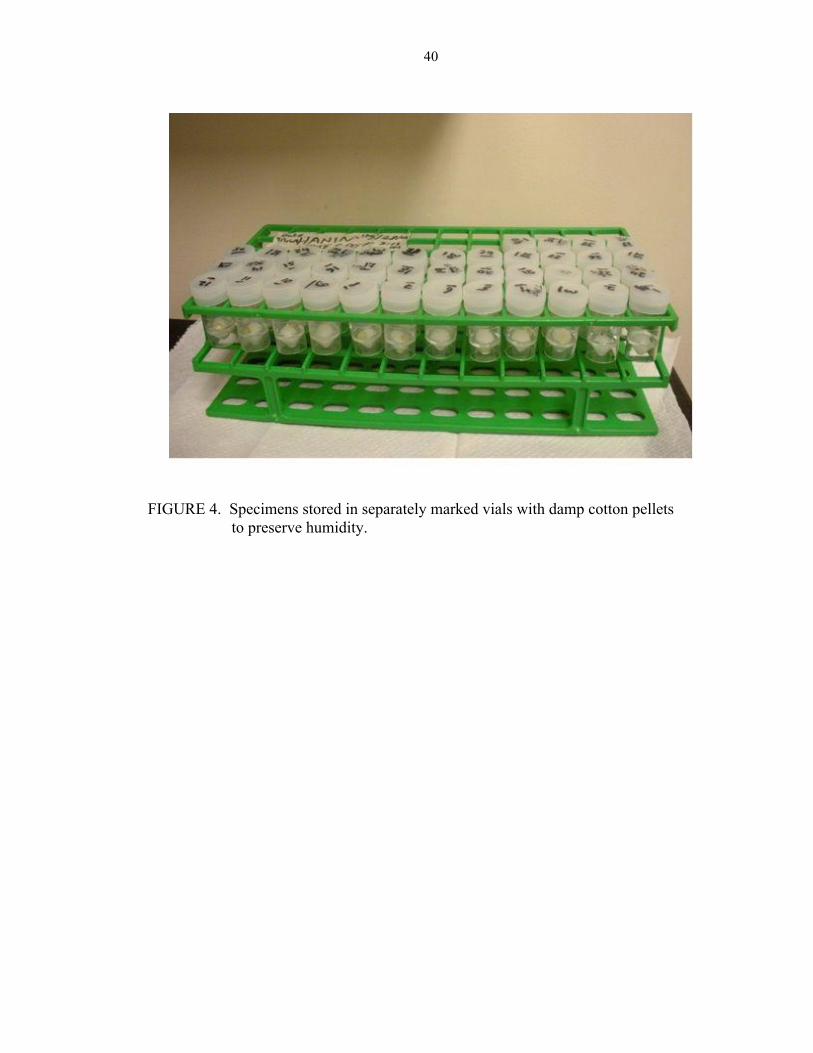
FIGURE 4. Specimens stored in separately marked vials with damp cotton pellets to preserve humidity.
41
FIGURE 5. Holder with sample position marked for CT scanning of samples.
42
FIGURE 6. SKYSCAN 1172 high resolution µ-CT.
43
FIGURE 7. Enamel specimens mounted on plastic rods and submerged in 50/50
saliva in the remineralization/demineralization pH cycling model.
44
FIGURE 8. Sequence of procedures for the fluoride treatment phase of remineralization: a) weighing the fluoride toothpaste required for the
mix; b) mixing of 50/50 saliva and fluoride toothpaste; c) specimens in fluoride mixture for 1 min.
a.
b.
45
FIGURE 9. Series 1000 Deluxe Microtome used for obtaining thin sections for TMR analysis.
46
FIGURE 10. Enamel specimen 100-µm sections mounted on a glass plate for
TMR analysis.
47
FIGURE 11. Radiographic plate after x-ray exposure and developing ready for
TMR analysis.
48
FIGURE 12. Graph demonstrating the correlation between TMR lesion depth and TMR
mineral loss.
49
FIGURE 13. Graph demonstrating the lack of correlation between µ-CT percent mineral recovery and TMR mineral loss.
50
FIGURE 14. Graph demonstrating the lack of correlation between µ-CT percent mineral recovery and TMR lesion depth.
51
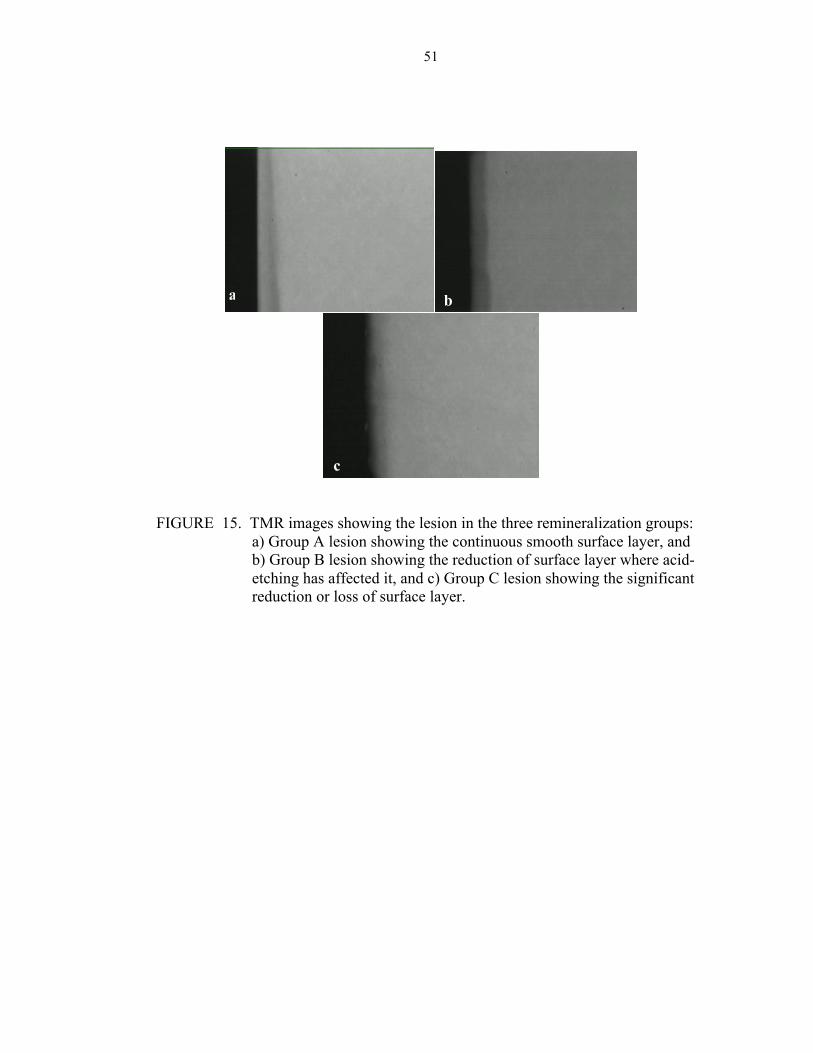
FIGURE 15. TMR images showing the lesion in the three remineralization groups: a) Group A lesion showing the continuous smooth surface layer, and b) Group B lesion showing the reduction of surface layer where acid-etching has affected it, and c) Group C lesion showing the significant reduction or loss of surface layer.
a b
c

52
DISCUSSION
53
The most mineralized layer of incipient caries lesions is the surface layer.3-5 One
of the suggested reasons for the incomplete mineralization of the body of the lesion is the
preferential deposition of minerals on the surface layer, which leads to a decrease in its
porosity and prevents more minerals from reaching the deeper areas of the incipient
enamel caries lesion. Acid etching of the surface layer was previously considered an
option to create mineral passage pores, which would increase surface porosity enhancing
the remineralization process. This enhancement was thought to be achieved by allowing
easier access for the minerals to the body of the lesion without being hindered by the
increasingly mineralized surface layer.4, 7, 8, 42-44
This study was formulated to investigate the remineralization potential of
incipient enamel lesions in non-etched lesions, once-etched lesions, and lesions that were
etched twice during the remineralization process. Both µ-CT and TMR were used to
determine the mineral content and lesion depth of the enamel specimens. Additionally,
the study aimed at investigating the ability of µ-CT to detect changes in mineral content
in incipient caries lesions by comparing its resultant data with TMR data, the gold
standard test for studies dealing with the mineralization of dental tissues.
In this study, a number of specimens were excluded from the final TMR analysis
due to fractures that occurred during the final processing steps, which involved sectioning
with the hard-tissue microtome and mounting on the radiographic plates for TMR
analysis. These specimens included two specimens from each of the demineralization-
only group (Control Demin ); the remineralized, non-etched group (Group A ); the
54
remineralized once-etched group (Group B ), and one specimen from the remineralized,
twice-etched group (Group C ). The remaining specimens were included in the final
analysis, in which each group was composed of eight specimens, except for Group C with
nine specimens (Table III).
In the non-etched group, a highly remineralized surface layer was observed under
the microscope as TMR analysis was being performed (Figure 15). This is supported by
previous findings that relate surface layer formation to the fluoride-enhanced mineral
precipitation from both the mineralization solution and the body of the lesion.18, 35, 36
Fluoride has been demonstrated to draw free mineral ions from the lesion body towards
the surface layer.24, 29 This process allowed redistribution of the minerals throughout the
lesion layers.4
Regardless of the treatment administered to the specimens, a substantial lesion
remained at the end of the study, which indicated the absence of full remineralization.
This finding was in accordance with the results of Al-Khateeb’s study (2000).4
Although the results did not show a significant difference in TMR lesion depth
among the tested groups, Groups B and C had the shallowest lesions (43 µm and 42 µm,
respectively) compared with Group A and the Control Demin group (Table IX). This
observation would lead us to question the ability of the acid-etching treatment to better
reduce the size of incipient caries lesions. This is supported by previous studies that
investigated the capacity of acidic media to facilitate remineralization of incipient caries
lesions.4, 6, 38
The absence of a TMR lesion depth significantly different among Group A,
Group B, Group C, and the Control Demin group suggests the limited, indicative capacity
55
of lesion depth to convey the extent of remineralization in incipient caries lesions. This
would support the increased importance of the actual mineral amount in incipient lesions
as opposed to the results obtained for lesion depth.
The TMR IML results show that the highest IML was in the Control Demin
group, which indicates its specimens had the highest degree of demineralization
compared with the remineralization groups, a finding that was significantly different from
the other groups (p < 0.05). This would indicate that the remineralization procedures in
the three experimental groups resulted in an increase in the mineral content of the lesions
being tested, which is supported by the literature.4-6, 21, 36, 79 The study results showed no
significant difference among the remineralized groups, which would suggest the possible
lack of an effect for acid etching on the remineralization process.
Although the remineralized groups had no TMR IML significant differences
among them, groups B and C had the lowest degrees of remineralization compared with
Group A, which received no acid-etching treatment. Group C specimens had even a low
degree of remineralization compared with Group A specimens. This would suggest a
reduction in the remineralization capacity of the acid-etched specimens, especially the
twice-etched specimens, compared with the non-acid etched remineralization specimens.
This suggestion could be in conflict with previous studies.4, 6 Reviewing the TMR
images of the specimens in each group would shed some light on the possible cause of
such phenomena. In Figure 15(a), the non-acid etch treated lesion shows a thick, smooth
and continuous surface layer followed by graduation into its deeper layers, which shows
the infiltration of the minerals within the lesion during the remineralization process. In
Figure 15(b), the acid etched-once, treated lesion shows a reduction in the surface layer,
56
which represents the acid effect on it. In Figure 15(c), the acid-etched, twice-treated
lesion showed an increase in the surface-layer reduction along with the relative loss of it.
These visual findings could reveal the reason behind the reduced remineralization in
Group C. The possible explanation for this noticed reduction could be overwhelming
damage to the surface layer of the incipient caries lesions under study. This would point
out the possible important role that the surface layer plays in remineralization.4,39 The use
of a weaker acid or a reduction in the acid-etching time could be advisable to increase
remineralization without destroying the surface layer.
During µ-CT analysis, a number of the specimens have been excluded from the
final µ-CT study due to the inability to reproduce viable data from them to be used for
lesion analysis. This can be attributed to the initially small size of the lesions that made it
somewhat difficult to detect on reconstructed µ-CT images of these specimens, which
might suggest this difficulty as a limitation of the use of µ-CT. Each group had five
specimens excluded except for the Control Demin Group, which had six specimens
excluded from its final analysis. The numbers of specimens in each group are included in
Table III.
The µ-CT analysis data were used to calculate the mineral volume of 91-0 wt% in
the selected area of the specimen. A higher resultant volume indicated a higher
demineralization degree and mineral loss in that area. This could be related to surface
microhardness test (SMH) data, in which the greater the resultant value, the greater the
demineralization. This phenomenon is attributed to the effect created when the surface
demineralizes and softens, causing the indentation implemented by the test to become
longer.
57
The µ-CT analysis data showed that, generally, the highest mineral volume of 91-
0 wt% was found in the demineralized specimens compared with both sound and
remineralized specimens (Tables IV, V, and VI). This indicates the higher degree of
demineralization and mineral volume loss in the demineralized specimens, which also
indicates a lower degree of demineralization in the remineralized specimens. The lower
degree of demineralization indicates some level of mineral recovery in the remineralized
specimens. This finding agrees with the literature, which has confirmed that subjecting
enamel specimens to fluoride-assisted remineralization solutions increases the mineral
volume within the lesions being tested.4, 6, 33, 36, 37
To compare the mineral gain in the lesions among the groups by using µ-CT, we
used percent mineral recovery (%) in 91-0 wt% as a measurement, which was calculated
using the formula 100 × (remineralization mineral volume - demineralization mineral
volume) / (sound mineral volume - demineralization mineral volume). This percentage
would indicate the relative mineral gain in each group.
Although the study results revealed the absence of a significant difference among
the three remineralized groups, the highest percent mineral recovery was found in Group
B (Table VII). This would lead us to suspect a greater mineral gain in Group B lesions,
which received an acid-etch treatment once, compared with that of Group A lesions,
which received no acid-etch treatment. These speculations would agree with previous
literature.4, 6
The results of the present study showed that the remineralization of Group C
specimens was adversely affected, producing the lowest percent mineral recovery (64 %),
in comparison with the other remineralized groups (Table III). This would lead us to
58
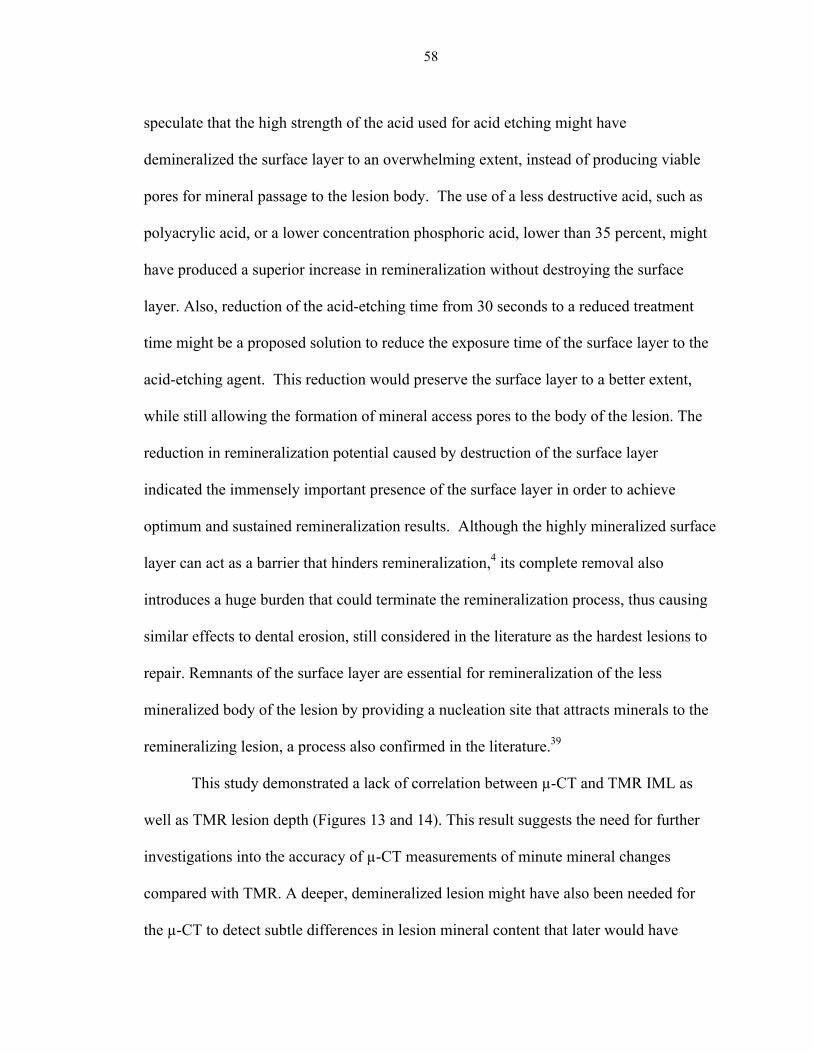
speculate that the high strength of the acid used for acid etching might have
demineralized the surface layer to an overwhelming extent, instead of producing viable
pores for mineral passage to the lesion body. The use of a less destructive acid, such as
polyacrylic acid, or a lower concentration phosphoric acid, lower than 35 percent, might
have produced a superior increase in remineralization without destroying the surface
layer. Also, reduction of the acid-etching time from 30 seconds to a reduced treatment
time might be a proposed solution to reduce the exposure time of the surface layer to the
acid-etching agent. This reduction would preserve the surface layer to a better extent,
while still allowing the formation of mineral access pores to the body of the lesion. The
reduction in remineralization potential caused by destruction of the surface layer
indicated the immensely important presence of the surface layer in order to achieve
optimum and sustained remineralization results. Although the highly mineralized surface
layer can act as a barrier that hinders remineralization,4 its complete removal also
introduces a huge burden that could terminate the remineralization process, thus causing
similar effects to dental erosion, still considered in the literature as the hardest lesions to
repair. Remnants of the surface layer are essential for remineralization of the less
mineralized body of the lesion by providing a nucleation site that attracts minerals to the
remineralizing lesion, a process also confirmed in the literature.39
This study demonstrated a lack of correlation between µ-CT and TMR IML as
well as TMR lesion depth (Figures 13 and 14). This result suggests the need for further
investigations into the accuracy of µ-CT measurements of minute mineral changes
compared with TMR. A deeper, demineralized lesion might have also been needed for
the µ-CT to detect subtle differences in lesion mineral content that later would have
59
better correlation with TMR IML and TMR lesion depth of enamel samples. This re-
establishes the previously documented fact that TMR remains the gold standard for
mineral studies of dental tissue experiments.50, 51
The correlation between TMR IML and TMR lesion depth was demonstrated by
the study results as shown in Figure 12. This correlation would agree with previous
findings establishing TMR as the gold standard with reproducible and well-correlated
results, regardless of the size of the lesion under study.50, 51 After reviewing the results,
the null hypothesis was accepted, which proposed that there is no enhancement of
mineral uptake in caries lesions by the application of an additional acid-etching treatment
to the surface layer during the remineralization process.
In this study the in-vitro chemical model was used to produce subsurface lesions
imitating incipient caries lesions formed in the oral cavity. This model was developed in
previous studies to study the caries-preventive effects of different products. On the other
hand, the microbial model was developed to better study the anti-microbial effects of
different agents on caries development as well as the preventive effects of anti-caries
treatments. Although in-vitro chemical models produce lesions in less time than other in-
vitro and in-vivo models, the chemical model s have an inherent disadvantage of
producing subsurface lesions likely to be more fragile and porous than most natural
incipient lesions.18,19 Therefore, the results of this study are related to this type of lesions.
Different models might result in a different remineralization effect of the methods under
study.
The present study’s results indicate the great importance of preserving the
integrity of the surface layer of incipient caries lesions in order to achieve optimum
60
remineralization results. Also, they suggest that additional measures might be needed to
enhance the remineralization following the initial acid etching of enamel lesions. These
might include the use of a higher-concentration fluoride treatment as well as a longer
remineralization period. Given that the remineralization process is a process over time,
the resultant remineralized specimens might have produced more variable
remineralization degrees after a longer remineralization period, which would have
demonstrated the remineralization potential of each group to a better extent.

61
SUMMARY AND CONCLUSIONS
62
This study was conducted to investigate the ability of an additional acid etch
during the remineralization process to boost the remineralization results of incipient
caries lesions. Further, we evaluated the ability of µ-CT to measure the mineral content
changes in incipient caries lesions compared with TMR before and after the specimens
were subjected to remineralization procedures.
In this study, three groups were compared with each other and with demineralized
enamel specimens. The first group was subjected to fluoride-assisted remineralization,
while the second group received an acid-etch treatment prior to the remineralization. The
third group received an additional acid-etch treatment in the middle of the
remineralization procedures.
Results from this study revealed no significant differences in µ-CT percent
mineral recovery among the three groups, while TMR IML revealed a significant
difference between the three groups collectively and the demineralized group. TMR
lesion depth revealed no significant difference among all the groups, including the
demineralized group. Additionally, no correlation was found between µ-CT percent
mineral recovery and TMR IML and TMR lesion depth, although TMR lesion depth and
TMR IML had a 0.66 correlation.
In spite of the statistically insignificantly different results, a decrease in mineral
gain of the acid-etch-twice remineralization group was noticed in both µ-CT and TMR
data analysis. This result was explained by the harsh effect of the acid-etching agent as
seen in the TMR images (Figure 15).
63
From the presented results, we concluded that although the surface layer will
hinder the process of remineralization in incipient caries lesions, the presence of the layer
is nonetheless essential to achieving remineralization. Although the less porous surface
layer interferes with the passage of minerals to the body of the lesion, the layer’s
remnants act as a protective barrier for the highly porous lesion's body, and provide
remineralization nuclei, which attract minerals toward the body of lesion. Moreover, the
mineral content of incipient caries lesions should be studied, and we recommend focusing
on the ability of µ-CT to detect minute changes in mineral content. Regarding fluoride
enhancement, additional measures could be required to improve the fluoride-induced
remineralization process, because acid-etching might not be the ideal solution for every
case, in view of the damage that could be done. Possible solutions include the use of
lower-concentration acid etchants to induce remineralization without implementing the
harsh demineralization effect. Finally, lesion depth should not be used as the sole
indicator of the remineralization potential of various techniques and agents, because
remineralization is better expressed in the amount of mineral gain within the lesion itself.

64
REFERENCES
65
1. Dean HT. Fluorine and dental caries. Ill Med J 1949;95(1):33-7.
2. Groeneveld A. Longitudinal study of prevalence of enamel lesions in a fluoridated and non-fluoridated area. Community Dent Oral Epidemiol 1985;13(3):159-63.
3. Collys K, Cleymaet R, Coomans D, Slop D. Acid-etched enamel surfaces after 24 h exposure to calcifying media in vitro and in vivo. J Dent 1991;19(4):230-5.
4. Al-Khateeb S, Exterkate R, Angmar-Mansson B, ten Cate JM. Effect of acid-etching on remineralization of enamel white spot lesions. Acta Odontol Scand 2000;58(1):31-6.
5. Yamazaki H, Litman A, Margolis HC. Effect of fluoride on artificial caries lesion progression and repair in human enamel: regulation of mineral deposition and dissolution under in vivo-like conditions. Arch Oral Biol 2007;52(2):110-20.
6. Flaitz CM, Hicks MJ. Role of the acid-etch technique in remineralization of caries-like lesions of enamel: a polarized light and scanning electron microscopic study. ASDC J Dent Child 1994;61(1):21-8.
7. Hicks MJ, Flaitz CM. Enamel caries formation and lesion progression with a fluoride dentifrice and a calcium-phosphate containing fluoride dentifrice: a polarized light microscopic study. ASDC J Dent Child 2000;67(1):21-8, 8.
8. Peariasamy K, Anderson P, Brook AH. A quantitative study of the effect of pumicing and etching on the remineralisation of enamel opacities. Int J Paediatr Dent 2001;11(3):193-200.
9. Mortimer KV. The relationship of deciduous enamel structure to dental disease. Caries Res 1970;4(3):206-23.
10. Wen SL. Human enamel structure studied by high resolution electron microscopy. Electron Microsc Rev 1989;2(1):1-16.
11. LeGeros RZ. Calcium phosphates in oral biology and medicine. Monogr Oral Sci 1991;15:1-201.
12. Ichijo T, Yamashita Y, Terashima T. Observations on the structural features and characteristics of biological apatite crystals. (Pt 1). Observation on the shape and arrangement of the cross sectioned enamel crystals. Dent Jpn (Tokyo) 1990;27(1):11-6.
13. Featherstone JD. Dental caries: a dynamic disease process. Aust Dent J 2008;53(3):286-91.
66
14. Arends J, Christoffersen J. The nature of early caries lesions in enamel. J Dent Res 1986;65(1):2-11.
15. Featherstone JD. The continuum of dental caries--evidence for a dynamic disease process. J Dent Res 2004;83 Spec No C:C39-42.
16. Marsh PD. Microbial ecology of dental plaque and its significance in health and disease. Adv Dent Res 1994;8(2):263-71.
17. Loesche WJ. Role of Streptococcus mutans in human dental decay. Microbiol Rev 1986;50(4):353-80.
18. ten Cate JM, Duijsters PP. Alternating demineralization and remineralization of artificial enamel lesions. Caries Res 1982;16(3):201-10.
19. ten Cate JM, Mundorff-Shrestha SA. Working group report 1: Laboratory models for caries (in vitro and animal models). Adv Dent Res 1995;9(3):332-4.
20. Featherstone JD. The science and practice of caries prevention. J Am Dent Assoc 2000;131(7):887-99.
21. Silverstone LM. The significance of remineralization in caries prevention. J Can Dent Assoc 1984;50(2):157-67.
22. Silverstone LM, Saxton CA, Dogon IL, Fejerskov O. Variation in the pattern of acid etching of human dental enamel examined by scanning electron microscopy. Caries Res 1975;9(5):373-87.
23. Scott DB, Simmelink JW, Nygaard V. Structural aspects of dental caries. J Dent Res 1974;53(2):165-78.
24. Featherstone JD. Diffusion phenomena during artificial carious lesion formation. J Dent Res 1977;56 Special D:D48-52.
25. Featherstone JD, Rodgers BE. Effect of acetic, lactic and other organic acids on the formation of artificial carious lesions. Caries Res 1981;15(5):377-85.
26. Driessens FC, Heijligers HJ, Borggreven JM, Woltgens JH. Posteruptive maturation of tooth enamel studied with the electron microprobe. Caries Res 1985;19(5):390-5.
27. Silverstone LM. The surface zone in caries and in caries-like lesions produced in vitro. Br Dent J 1968;125(4):145-57.
28. ten Cate JM. Remineralization of caries lesions extending into dentin. J Dent Res 2001;80(5):1407-11.
29. ten Cate JM, Featherstone JD. Mechanistic aspects of the interactions between fluoride and dental enamel. Crit Rev Oral Biol Med 1991;2(3):283-96.
67
30. Featherstone JD, Duncan JF, Cutress TW. A mechanism for dental caries based on chemical processes and diffusion phenomena during in-vitro caries simulation on human tooth enamel. Arch Oral Biol 1979;24(2):101-12.
31. Koch G. Prevalence of enamel mineralisation disturbances in an area with 1-1.2 ppm F in drinking water. Review and summary of a report published in Sweden in 1981. Eur J Paediatr Dent 2003;4(3):127-8.
32. Parfitt GJ. Fluorine in the diet as a factor in the prevention of dental caries. Postgrad Med J 1951;27(309):349-55.
33. Marinho VC, Higgins JP, Logan S, Sheiham A. Topical fluoride (toothpastes, mouthrinses, gels or varnishes) for preventing dental caries in children and adolescents. Cochrane Database Syst Rev 2003(4):CD002782.
34. ten Cate JM. Remineralization of deep enamel dentine caries lesions. Aust Dent J 2008;53(3):281-5.
35. ten Cate JM, Jongebloed WL, Arends J. Remineralization of artificial enamel lesions in vitro. (Pt 4). Influence of fluorides and diphosphonates on short- and long-term reimineralization. Caries Res 1981;15(1):60-9.
36. Schemehorn BR, Orban JC, Wood GD, Fischer GM, Winston AE. Remineralization by fluoride enhanced with calcium and phosphate ingredients. J Clin Dent 1999;10(1 Spec No):13-6.
37. Lynch RJ, Navada R, Walia R. Low-levels of fluoride in plaque and saliva and their effects on the demineralisation and remineralisation of enamel; role of fluoride toothpastes. Int Dent J 2004;54(5 Suppl 1):304-9.
38. Yamazaki H, Margolis HC. Enhanced enamel remineralization under acidic conditions in vitro. J Dent Res 2008;87(6):569-74.
39. Larsen MJ, Fejerskov O. Chemical and structural challenges in remineralization of dental enamel lesions. Scand J Dent Res 1989;97(4):285-96.
40. Dalzell DP, Howes RI, Hubler PM. Microabrasion: effect of time, number of applications, and pressure on enamel loss. Pediatr Dent 1995;17(3):207-11.
41. Croll TP, Killian CM, Miller AS. Effect of enamel microabrasion compound on human gingiva: report of a case. Quintessence Int 1990;21(12):959-63.
42. Hicks MJ, Silverstone LM, Flaitz CM. A scanning electron microscopic and polarized light microscopic study of acid-etching of caries-like lesions in human tooth enamel treated with sodium fluoride in vitro. Arch Oral Biol 1984;29(10):765-72.
43. Belser U, Sporri S, Muhlemann HR. Uptake and retention of fluoride by intact and etched enamel. Helv Odontol Acta 1975;19(2):69-71.
68
44. DePaola PF, Aasenden R, Brudevold F. The use of topically applied acidulated phosphate-fluoride preceded by mild etching of the enamel: a one-year clinical trial. Arch Oral Biol 1971;16(10):1155-63.
45. van Dorp CS, Exterkate RA, ten Cate JM. Mineral loss during etching of enamel lesions. Caries Res 1990;24(1):6-10.
46. Kato K, Nakagaki H, Sakakibara Y, Kameyama Y, Weatherell JA, Robinson C. Distribution of fluoride in the enamel of rat incisors examined by an abrasive microsampling technique. Arch Oral Biol 1988;33(9):653-6.
47. Ten Bosch JJ, Angmar-Mansson B. A review of quantitative methods for studies of mineral content of intra-oral caries lesions. J Dent Res 1991;70(1):2-14.
48. Willmott NS, Wong FS, Davis GR. An X-ray microtomography study on the mineral concentration of carious dentine removed during cavity preparation in deciduous molars. Caries Res 2007;41(2):129-34.
49. Davis GR, Wong FS. X-ray microtomography of bones and teeth. Physiol Meas 1996;17(3):121-46.
50. Meyer-Lueckel H, Paris S. Progression of artificial enamel caries lesions after infiltration with experimental light curing resins. Caries Res 2008;42(2):117-24.
51. Damen JJ, Exterkate RA, ten Cate JM. Reproducibility of TMR for the determination of longitudinal mineral changes in dental hard tissues. Adv Dent Res 1997;11(4):415-9.
52. Angmar B CD, Glas J-E. . Studies on the ultrastructure of dental enamel. (Pt 4). The mineralisation of normal human enamel. J Ultrastruct Res 1963;8:12-23.
53. Mellberg JR, Castrovince LA, Rotsides ID. In vivo remineralization by a monofluorophosphate dentifrice as determined with a thin-section sandwich method. J Dent Res 1986;65(8):1078-83.
54. Exterkate RA, Damen JJ, ten Cate JM. A single-section model for enamel de- and remineralization studies. (Pt 1). The effects of different Ca/P ratios in remineralization solutions. J Dent Res 1993;72(12):1599-603.
55. Thomas RZ, Ruben JL, de Vries J, ten Bosch JJ, Huysmans MC. Transversal wavelength-independent microradiography, a method for monitoring caries lesions over time, validated with transversal microradiography. Caries Res 2006;40(4):281-91.
56. Lagerweij MD, de Josselin de Jong E, ten Cate JM. The video camera compared with the densitometer as a scanning device for microradiography. Caries Res 1994;28(5):353-62.
69
57. Huysmans MC, Thomas RZ. [Research methods in dentistry. (Pt 6). In vivo and in vitro methods for studying caries lesion progression]. Ned Tijdschr Tandheelkd 2004;111(12):471-6.
58. Kim I, Paik KS, Lee SP. Quantitative evaluation of the accuracy of micro-computed tomography in tooth measurement. Clin Anat 2007;20(1):27-34.
59. Wong FS, Anderson P, Fan H, Davis GR. X-ray microtomographic study of mineral concentration distribution in deciduous enamel. Arch Oral Biol 2004;49(11):937-44.
60. Hahn SK, Kim JW, Lee SH, Kim CC, Hahn SH, Jang KT. Microcomputed tomographic assessment of chemomechanical caries removal. Caries Res 2004;38(1):75-8.
61. Stauber M, Muller R. Micro-computed tomography: a method for the non-destructive evaluation of the three-dimensional structure of biological specimens. Methods Mol Biol 2008;455:273-92.
62. Postnov AA, Vinogradov AV, Van Dyck D, Saveliev SV, De Clerck NM. Quantitative analysis of bone mineral content by x-ray microtomography. Physiol Meas 2003;24(1):165-78.
63. Huang TT, Jones AS, He LH, Darendeliler MA, Swain MV. Characterization of enamel white spot lesions using X-ray microtomography. J Dent 2007;35(9):737-43.
64. Schwass DR, Swain MV, Purton DG, Leichter JW. A system of calibrating microtomography for use in caries research. Caries Res 2009;43(4):314-21.
65. Kazakia GJ, Burghardt AJ, Cheung S, Majumdar S. Assessment of bone tissue mineralization by conventional x-ray microcomputed tomography: comparison with synchrotron radiation microcomputed tomography and ash measurements. Med Phys 2008;35(7):3170-9.
66. Kato A, Ohno N. Construction of three-dimensional tooth model by micro-computed tomography and application for data sharing. Clin Oral Investig 2009; 13(1):43-6. Epub 2008 Apr 3.
67. Wong FS, Elliott JC, Anderson P, Davis GR. Mineral concentration gradients in rat femoral diaphyses measured by x-ray microtomography. Calcif Tissue Int 1995;56(1):62-70.
68. Chappard D, Basle MF, Legrand E, Audran M. Trabecular bone microarchitecture: a review. Morphologie 2008;92(299):162-70.
69. Dedrick DK, Goldstein SA, Brandt KD, O'Connor BL, Goulet RW, Albrecht M. A longitudinal study of subchondral plate and trabecular bone in cruciate-
70
deficient dogs with osteoarthritis followed up for 54 months. Arthritis Rheum 1993;36(10):1460-7.
70. Wong FS, Willmott NS, Davis GR. Dentinal carious lesion in three dimensions. Int J Paediatr Dent 2006;16(6):419-23.
71. Dowker SE, Elliott JC, Davis GR, Wassif HS. Longitudinal study of the three-dimensional development of subsurface enamel lesions during in vitro demineralization. Caries Res 2003;37(4):237-45.
72. Rhodes JS, Ford TR, Lynch JA, Liepins PJ, Curtis RV. Microcomputed tomography: a new tool for experimental endodontology. Int Endod J 1999;32(3):165-70.
73. Harris DA, Jones AS, Darendeliler MA. Physical properties of root cementum. (Pt 8). Volumetric analysis of root resorption craters after application of controlled intrusive light and heavy orthodontic forces: a microcomputed tomography scan study. Am J Orthod Dentofacial Orthop 2006;130(5):639-47.
74. Foo M, Jones A, Darendeliler MA. Physical properties of root cementum. (Pt 9). Effect of systemic fluoride intake on root resorption in rats. Am J Orthod Dentofacial Orthop 2007;131(1):34-43.
75. Clementino-Luedemann TN, Kunzelmann KH. Mineral concentration of natural human teeth by a commercial micro-CT. Dent Mater J 2006;25(1):113-9.
76. Zou W, Gao J, Jones AS, Hunter N, Swain MV. Characterization of a novel calibration method for mineral density determination of dentine by x-ray micro-tomography. Analyst 2009;134(1):72-9.
77. Schweizer S, Hattendorf B, Schneider P, et al. Preparation and characterization of calibration standards for bone density determination by microcomputed tomography. Analyst 2007;132(10):1040-5.
78. Bonse U, Busch F, Gunnewig O, et al. 3D computed x-ray tomography of human cancellous bone at 8 microns spatial and 10(-4) energy resolution. Bone Miner 1994;25(1):25-38.
79. Shen P, Cai F, Nowicki A, Vincent J, Reynolds EC. Remineralization of enamel subsurface lesions by sugar-free chewing gum containing casein phosphopeptide-amorphous calcium phosphate. J Dent Res 2001;80(12):2066-70.

71
ABSTRACT
72
THE EFFECT OF ACID ETCHING ON REMINERALIZATION
OF INCIPIENT CARIES LESIONS:
A MICRO-CT STUDY
by
Hanin Essam Yeslam
Indiana University School of Dentistry Indianapolis, Indiana
Etching of enamel caries lesions has been demonstrated to enhance
remineralization. However, this effect reaches a plateau after a period of time. This
study aimed at investigating the effectiveness of additional acid etching on
remineralization.
Forty 1 mm × 2 mm human enamel blocks with chemically induced artificial
incipient lesions were used. Ten specimens were randomly selected at the end of
demineralization for transverse microradiography (TMR) analysis. The remaining
specimens were then divided into three groups (n = 10). Group A was remineralized by a
pH cycling system with 1100 ppm sodium fluoride for 20 days. In group B, the
specimens were etched with 35-percent phosphoric acid for 30 s and then remineralized.
Group C was remineralized by same procedure as group B plus and given an additional
acid etch after 10 days of remineralization. Mineral density was measured by x-ray
73
microtomography (µ-CT). The volumetric mineral content [VM (µm3×105)] was
determined between 91 and 0-wt%. The µ-CT % mineral recovery (%) was calculated
using the formula 100×(remineralize VM - demineralization VM) / (sound VM -
demineralization VM). One-hundred-µm sections of demineralized and remineralized
specimens were used to assess the mineral loss (IML: vol%×µm) and lesion depth (µm)
using TMR.
The three groups showed no significant difference in mineral change or mineral
content for µ-CT or TMR lesion depth. The TMR IML showed a significant difference
between the demineralized specimens and the three remineralized groups. The
correlation between TMR IML and TMR lesion depth was 0.66 (p < 0.0001). The µ-CT
percent mineral recovery from demineralization was correlated with neither TMR IML
nor TMR lesion depth. When evaluated with µ-CT, the twice-acid-etched group
presented lower mineral gain values than the group etched only once with acid. Also,
the twice-etched group presented lower mineral gain and greater TMR IML compared
with the non-acid etch group. TMR images revealed reduction of surface layer in the
acid-etched groups, especially in the twice-etched group, in which significant reduction
or loss of surface layer occurred.
Based on these results, we conclude that additional acid etching with 35-percent
phosphoric acid does not enhance remineralization compared with a single application of
acid etching. We believe that the viable existence of the surface layer is essential for
remineralization of the lesion. Further investigations into the accuracy of µ-CT to detect
minute mineral changes in incipient caries lesions are probably needed.

74
CURRICULUM VITAE
74
75
Hanin Essam Yeslam
July 2004 BDS King AbdulAziz University School of Dentistry Jeddah, Saudi Arabia
July 2005 Internship year King AbdulAziz University School of Dentistry Jeddah, Saudi Arabia
August 2005 GP Dentist NorthWest Armed Forces Hospital Tabuk, Saudi Arabia
June 2007 Teacher's Assistant King AbdulAziz University School of Dentistry, Operative Dentistry Department Jeddah, Saudi Arabia
December 2009 MSD Graduate Operative Program, Indiana University School of Dentistry Indianapolis, IN
Professional Organizations
Saudi Dental Association American Dental Association (ADA) Academy of Operative Dentistry