the effect of a hospital nurse staffing mandate on …mstep/nursestaffingfinaljan2012.pdf · the...
TRANSCRIPT
The Effect of a Hospital Nurse Staffing Mandate on Patient Health Outcomes: Evidence from California’s Minimum Staffing Regulation*
Andrew Cook, Resolution Economics LLC Martin Gaynor, Carnegie Mellon University, University of Bristol, and NBER
Melvin Stephens, Jr., University of Michigan and NBER Lowell Taylor, Carnegie Mellon University and NORC
January 16, 2012
*Acknowledgements: We wish to thank the California Office of Statewide Health Planning and Development for providing the data used in this study. We wish to thank David Cutler, two anonymous referees, Melissa Taylor, and participants in a session at the 2009 American Economic Association annual meeting for comments and suggestions that led to substantial improvements in the paper. All responsibility for the content of this paper rests with the authors alone.
Abstract
We evaluate the impact of California Assembly Bill 394, which mandated maximum levels of
patients per nurse in the hospital setting. When the law was passed, some hospitals already met the
requirements, while others did not. Thus changes in staffing ratios from the pre- to post-mandate periods
are driven in part by the legislation. We find persuasive evidence that AB394 had the intended effect of
decreasing patient/nurse ratios in hospitals that previously did not meet mandated standards. However,
these improvements in staffing ratios do not appear to be associated with relative improvements in
measured patient safety in affected hospitals.
1. Introduction
Hospitals are currently under pressure to control the cost of medical care, while at the same time
improving patient health outcomes, especially through the reduction of medical errors (Kohn, Corrigan,
and Donaldson, 1999). These twin concerns are at play in an important and contentious decision facing
hospitals—choosing appropriate nurse staffing levels.
Intuitively, one would expect relatively high nurse staffing ratios to be associated with improved
patient outcomes, and if this intuition is correct, these patient benefits should be a key consideration in the
determination of nurse staffing levels. Ideally, hospitals’ decisions about nurse staffing should be guided
by clear empirical evidence on this matter, and indeed a number of recent studies have examined this
issue. The best known of these papers are the seminal contributions of Aiken, et al. (2002) and
Needleman, et al. (2002) (see also the review by Kane et al., 2007). Using data from 168 hospitals in
Pennsylvania covering a 20-month span, Aiken, et al. (2002) demonstrate that cross-sectional variation in
nurse staffing levels is negatively correlated with patient mortality, measured as risk-adjusted 30-day
mortality and “failure to rescue rates” (i.e., rates of death from complications which, under normal
circumstances, might have been prevented). The Needleman, et al. (2002) analysis of administrative data
from 799 hospitals in 11 states over a one-year span also finds higher levels of nurse staffing to be
associated with lower failure to rescue rates, and they also report improved patient outcomes along a
variety of other specific dimensions, e.g., rates of urinary tract infection, upper gastrointestinal bleeding,
pneumonia, and shock or cardiac arrest.1
The regression analyses of Aiken, et al. (2002) and Needleman, et al. (2002), provide important
evidence about cross-sectional correlations, but concerns remain about causal relationships. In this
regard, there are two important potential problems.
The first problem is a particular form of omitted variable bias. There exists considerable
variation across hospitals in the level of resources devoted to patient care. This variation exists in nurse
staffing practices, of course, but also along many other dimensions—the quantity and quality of medical 1 See also Lang, et al., (2004) for a review and discussion of the literature.
2
equipment, the adoption of educational efforts to keep medical staff current on best practices, the efficacy
of management practices, etc. (e.g., McClellan and Staiger, 2000; Bloom et al., 2009; Propper and Van
Reenen, 2010). In cross-sectional regression analyses, researchers often are careful to control for such
factors. See, e.g., Aiken, et al., 2002; Mark et al., 2003; Needleman et al., 2002; Sochalski et al., 2008.
Still, such work is limited by the extent to which all relevant factors can be measured and made available
in data sets. If, as one might suspect, hospitals that have relatively high nurse staffing levels also have
above-average levels of other (unobserved) factors that affect patient care, cross-sectional regression
analysis will tend to overstate the impact of a high nurse/patient ratio on patient health outcomes.
The second problem has to do with endogenous sorting. In general we would expect that medical
providers will devote relatively high resources to patients for whom these resources are likely to have the
highest impact—often to those patients who are at greatest risk of adverse outcomes. For example, we
expect high mortality rates on medical units with high nurse/patient ratios. Again, a researcher can
attempt to control for the severity of patients’ medical conditions, but it is hard to know how effective
observable data measures are at controlling for underlying patient severity. In this case, researchers will
tend to underestimate the beneficial impact of high nurse-to-patient ratios on patient outcomes.
Similar concerns pertain to evaluations based on hospital-level panel data (e.g., Mark et al., 2003;
Sochalski, et al., 2008). Thus, hospitals that experience improved nurse staffing levels might well be
increasing resources along other (unobserved) dimensions. Conversely, hospitals that increase their nurse
staffing levels might well be doing so in response to increases in general acuity levels of their patients.
A sensible response to these concerns is for the researcher to search for exogenous shifts to nurse
staffing, and then use that variation to explore the impact on patient outcomes. Although truly exogenous
variation (e.g., randomized assignment) is unavailable for this purpose, there are some attempts to find
“natural experiments” for generating plausibly exogenous changes in nurse-per-patient ratios. A good
example of this approach is the innovative work of Evans and Kim (2006). Their identification strategy is
to exploit natural variation that occurs in hospital admissions, which in turn creates variation in patient
3
loads. Using this approach, Evans and Kim find that patients admitted when the patient loads are high
tend to have higher mortality, but effects are estimated to be quite small and are not statistically
significant in several of their specifications. As the authors acknowledge, interpretation is difficult
because they “have no independent data about how hospitals deal with a sudden influx of patients.” Thus,
if hospitals respond by offering overtime shifts to nurses, in fact the nurse-to-patient ratios might not be
changing much when there is a surge in hospital admissions. This could lead the authors to underestimate
the impact of patient loads on patient outcomes.2
Our paper contributes by providing a new analysis that exploits an arguably exogenous shock to
nurse staffing levels for the purpose of studying the relationship between nurse staffing levels and patient
outcomes. Specifically, we look at the impact of California Assembly Bill 394, which mandated
maximum levels of patients per nurse in the hospital setting. When the law was passed, some hospitals
already had acceptable staffing levels, while others had nurse staffing ratios that did not meet mandated
standards. Thus changes in hospital-level staffing ratios from the pre- to post-mandate periods are driven
in part by the legislation. Our goal is to look at the impact on key patient health outcomes.
2. California Assembly Bill 394
In 1999 the California legislature passed AB394, which started a process whereby maximum
patient-to-nurse ratios were set for the State’s hospitals. After the Bill initially passed, the California
Department of Health Services (DHS) spent two years holding hearings in which stakeholders were
invited to make recommendations regarding the appropriate nurse staffing levels. In response to the
invitation, the top two nurse unions, the California Nurses Association and the Service Employees
International Union, along with the California Healthcare Association (an organization representing many
of California’s hospitals), proposed ratios that they considered appropriate (Spetz, 2004). In addition, the
DHS presented their own draft nurse staffing ratios (in January of 2002). In mid-2002, the DHS
2 See also Dobkin (2003) and Bartel, et al. (2009) for studies that employ similar identification strategies.
4
announced the final standards, which were initially to be implemented in July 2003. This proposed
mandate was finally implemented on January 1, 2004.3
The hope, of course, was that increased levels of nurse staffing would be beneficial to patient
outcomes. But from the outset nursing unions noted two major concerns about the legislation that could
undermine that goal. The first issue was enforcement. Under the current guidelines, the DHS is only
permitted to require an “action plan” created by the hospital, which would address any violations that
occur in the hospital, and how these deficiencies will be rectified, but assesses no fine or set period in
which the plan must be implemented (Spetz, 2004). Below we present evidence, consistent with Spetz, et
al. (2009) and Matsudaira (2009) that in fact patient-to-nurse ratios did decline in hospitals that did not
meet standards prior to the legislation implementation. The second concern was that in the process of
complying with the patient-to-nurse ratio requirements, hospitals might reduce employment of non-
nursing personnel, and ask nurses to perform tasks previously undertaken by these employees (Coffman,
Seago, and Spetz, 2002; Clarke, 2003; and Spetz, 2004). Such actions would presumably reduce the
effectiveness of the legislation in promoting improved patient outcomes. While we cannot directly
analyze this issue directly, we have some evidence on this point, and we do of course look at the key
issue—the impact on patient outcomes. First we describe our data.
3. Data and Descriptives
A. Data Sources and Key Variables
This study utilizes data from California’s Office of Statewide Health Planning and Development
(OSHPD) financial reports and patient discharge database for nonfederal hospitals for the years 2000
through 2006. The annual hospital financial reports contain information on financial status, service mix,
3 The ratios are implemented for the following hospital units in general acute care, acute psychiatric, and specialty hospitals: critical care unit, burn unit, labor and delivery unit, post-anesthesia service area, emergency department, operating room, pediatric unit, step-down/intermediate care unit, specialty care unit, telemetry unit, general medical care unit, sub-acute care unit, and transitional inpatient care unit.

5
staffing levels, patient loads, and cost allocations.4 The administrative patient discharge data provide
information on each patient discharged, including patient characteristics, the patient’s medical condition,
the condition severity, and any procedures performed on the patient before discharge. As we have
mentioned, AB394 was implemented in January 2004, but was under discussion for two years prior to
implementation. Thus, we treat the years 2000-2002 as the “pre-implementation” period. We use 2005-
2006 as the “post-implementation” period, which allows for a one-year period for hospital adjustment to
the regulation.
The use of administrative discharge data is quite common in the study of patient outcomes.
These publicly available data include all non-federal California hospitals, and they include all the
necessary variables (age, sex, DRGs, MDCs, etc.) to obtain risk-adjusted rates for the patient safety
indicators that we will be analyzing in this study.5 These data do, however, likely have measurement
error (due to self-reported information), and, as Dobkin (2003) and others have noted, the staffing hours
do not differentiate between patient-care hours and those hours spent employed in such non-patient work
as administration, teaching, or attending educational functions.
Our focus is general medical/surgical hospital units, which represent roughly half of all inpatient
discharges in non-federal California hospitals. General medical/surgical units treat patients with medical
and/or surgical conditions who do not require an intensive care setting. We concentrate on these units as
the OSHPD data only provide the necessary nurse labor information for such units.6 One difficulty
concerning OSHPD patient discharge data is that there are no identifiers for the unit where a patient was
treated. To create such units from the available OSHPD data, we use a methodology created by the
Institute for Health and Socio-Economic Policy (Institute for Health and Socio-Economic Policy, 2001)
4 The financial data are reported on a fiscal year basis, while the discharge data are reported on a calendar year basis. This means that hospitals’ fiscal years include some information from the previous calendar year. 5 We use Agency for Healthcare Research and Quality (AHRQ) software to create the patient safety indicators, as discussed below. See http://www.qualityindicators.ahrq.gov/psi_overview.htm. 6 We considered analyzing two additional types of hospital units, critical care and step-down/telemetry. However, critical care units already had strict patient-to-nurse requirements and were thus unaffected by this legislation. We did not have sufficient observations to evaluate patient health outcomes in step-down/telemetry units.
6
whereby an RN expert panel is used to assign DRGs (diagnosis related groups) to one of seven hospital-
level units: intensive care unit, burn care, definitive observation, medical/surgical, pediatrics,
psychiatrics, and obstetrics. Appendix A provides a detailed discussion of this methodology.
For our sample, we construct a balanced panel from the OSHPD data so that we may examine
how hospitals are impacted by the change in legislation. Between 2000 and 2006, the OSHPD data
contains information for 395 distinct general medical/surgical hospital units. Of these 395 general
medical/surgical hospital units, 294 ultimately possess useable information during the period 2000
through 2006. Due to hospital openings and/or closings each year between 2000 and 2006, as well as
units that possess useable data in some years, but not other years, there exist considerably more than 294
general medical/surgical hospital units in any given year.7 Of the remaining 101 hospital units that do not
possess useable information on general medical/surgical units for every year during the analysis time
period, various reasons lead to their exclusion: 8 general medical/surgical hospital units open during the
time period; 34 general medical/surgical hospital units close during the time period; and 59 general
medical/surgical hospital units possess missing data for one or more years within the time period.
The first key variable is an approximation useful for examining the nurse staffing level. The
OSHPD Annual Hospital Financial Data provide information sufficient for this purpose. In particular,
OSHPD requests that hospitals report unit-level productive hours worked for RNs, LVNs, and
aides/orderlies. Productive hours worked are total hours worked by each staffing level, excluding
vacation, leave, etc. OSHPD also provides unit-level information on patient census days (total days
patients spend in the unit). Thus, to obtain ratios, we first must calculate hours per patient day (HPPD),
as the ratio of “productive hours worked” to “patient census days.”8 Section 3(b) of AB394 indicates that
the law pertains to licensed nurses—both registered nurses (RNs) and licensed vocational nurses (LVNs).
7 The lowest count occurs in 2006 (358 units), while the highest count occurs in 2000 (388 units). 8 We remove hospital units with missing information on productive hours worked and/or patient census days. We also removed 5 hospital units that had implausible HPPD outlier values, as depicted on page II-7 in Kravitz and Sauve (2002).
7
So for the purpose of this study, “productive hours worked” includes hours for both. Then, to obtain an
approximation of nurse-to-patient staffing ratios, we divide HPPD by 24. This calculation implicitly
assumes that the average patient day is 24 hours—an assumption that is generally not correct — so in this
respect our patient-to-nurse ratio can be thought of as an upper bound. For the analysis below we use the
reciprocal of this measure — the patient-to-nurse ratio — as the key nurse staffing variable.9
Our study uses two patient safety indicators (PSIs) created by the Agency for Healthcare
Research and Quality (AHRQ) to measure adverse health outcomes in the patient hospital population,
both of which are potentially affected by nurse staffing—estimated rates of “failure to rescue” and
“decubitus ulcers.” Appendix B provides details.
Failure to rescue indicates patients who have died after developing a complication while in the
hospital—patients who, under normal circumstances of care, might have been “rescued” from the
complication. There are six complications associated with this indicator: pneumonia, deep vein
thrombosis/pulmonary embolism, sepsis, acute renal failure, shock/cardiac arrest, and gastrointestinal
hemorrhage/acute ulcer. Medical personnel in high-quality hospitals are expected to identify these
complications promptly and treat them aggressively. AHRQ has designated this outcome as potentially
sensitive to changes in nurse staffing (Agency for Healthcare Research and Quality, 2003). As we discuss
above, in both Aiken, et al. (2002) and Needleman, et al. (2002) high patient-to-nurse ratios are
associated with relatively higher rates of failure to rescue.
Decubitus ulcers are bedsores which develop when there is a failure to frequently move an
immobile patient (or other factors such as low blood pressure or diabetes). Knowledge of decubitus ulcer
formation and prevention is a topic that is carefully covered in nursing school curriculum (Rosdahl and
Kowalski, 2007). Several cross-sectional studies indicate that high patient-to-nurse ratios are associated
9 Analyses based on the nurse-to-patient ratio values yield qualitatively similar results.
8
with relatively higher rates of decubitus ulcers. Examples include Lichtig, et al. (1999), Unruh (2003),
Stone, et al. (2007).10
B. Descriptive Statistics
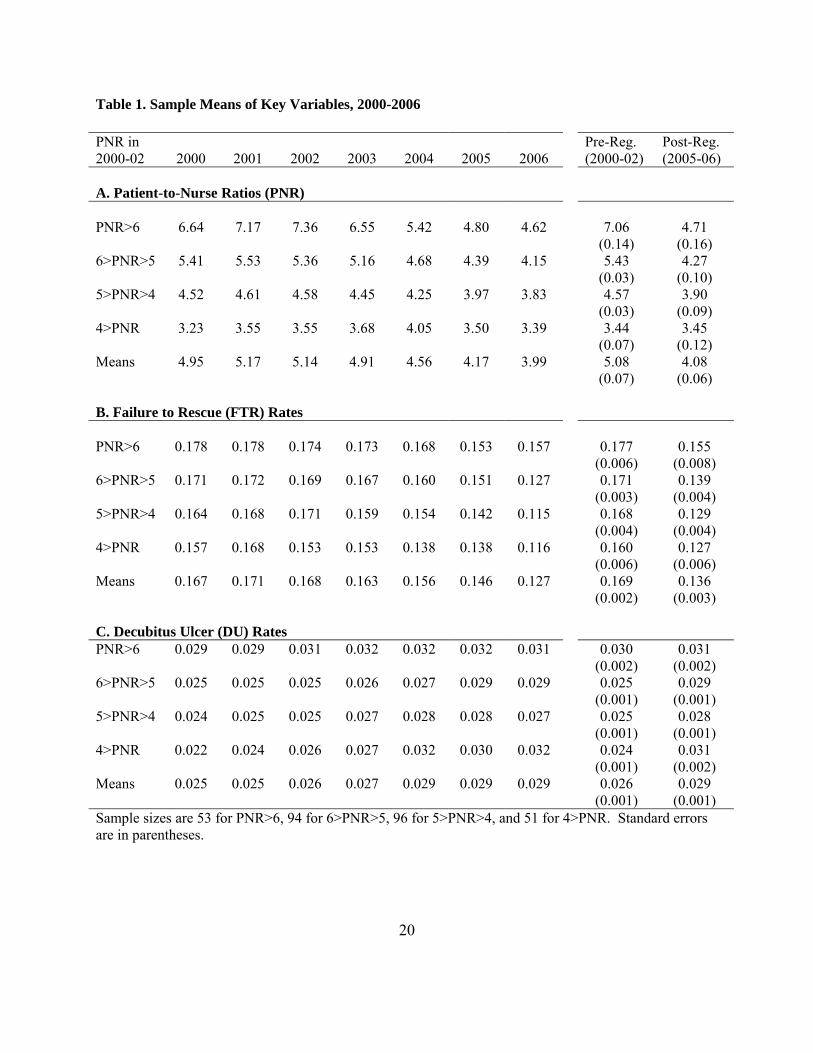
Table 1 shows mean levels for key variables—the patient-to-nurse ratio (PNR), the failure to
rescue rate (FTR) and the decubitus ulcer rate (DU)—for each year in the study period. In presenting
these means, we categorize units by the units’ average PNR as calculated over the 2000-2002 period.
AB394, as implemented in 2004, requires the PNR to be 5 or lower on medical/surgical units.11 We
divide our sample into four groups: two groups of hospitals not compliant with the regulation (hospitals
with PNR > 6, and 6 ≥ PNR > 5) and two groups of hospitals with PNRs that conform to the regulation
(those with 5 ≥ PNR > 4, and those for which 4 ≥ PNR). Using these four groups allow us to distinguish
between hospitals that are closer to the boundary of the regulation versus those that are well above or well
below the required ratio.
Consider Panel A of Table 1. The first three columns show that there was considerable variation
in observed PNRs among California’s non-federal hospitals. For example, 53 of the 294 hospitals in our
sample averaged PNR > 6 over the 2000-2002 period, and the averages in these units were 6.64, 7.17, and
7.36, respectively, in 2000, 2001, and 2002. At the opposite extreme, there were 51 hospitals with PNR
averages of 4 or less, with average ratios of 3.23 in 2000 and 3.55 in both 2001 and 2002. Thus, many
hospitals were using patient loads that substantially exceeded the mandate established by AB394.
Statistics presented in Table 1 also show that these same hospitals substantially reduced patient/nurse
ratios post-regulation—likely in response to the regulation. In particular, those hospitals that initially had
the highest patient/nurse ratios in 2000-2002 experienced sharply declining ratios by 2005-2006, while in
10 However, Needleman, et al. (2001) and Donaldson (2005) find no evidence of this relationship, and Cho, et al. (2003) actually find a positive relationship between the rates of decubitus ulcers and nurse staffing. Below we discuss difficulties in interpreting the relationship between the patient-to-nurse ratio and the rate of decubitus ulcers. 11 The requirement was initially 6 (January, 2004), then adjusted to 5 in March 2005.
9
contrast, those hospitals that initially had the lowest patient/nurse ratios in 2000-2002 on average had
little change in the average PNR.
Panel B of Table 1 provides sample means for failure to rescue (FTR) rates over the study period.
Two important features merit emphasis. First, we observe that in the pre-regulation years, FTR rates were
generally highest in units that had high patient/nurse ratios. Second, we notice that FTR rates generally
declined from the pre-regulation period (2000-2002) to the post-regulation period (2005-2006). These
declines were observed in each category of hospitals, i.e., in hospitals that initially had high patient/nurse
ratios (and which were therefore likely affected by the new regulation) and in hospitals that initially had
relatively low patient/nurse ratios (and which were not likely affected by the regulation). 12 This Panel
provides initial evidence for the key findings of our analysis: failure to rescue improved in all hospitals
and, contrary to expectations, improvements were not relatively larger in those hospitals that initially had
high PNR levels.
Panel C of Table 1 shows trends in rates of decubitus ulcers (DU). We notice that in the pre-
regulation period (2000-2002), hospitals with low patient/nurse ratios tended to have relatively low DU
rates. Over time, though, these same hospitals are observed to have increases in DU rates, while DU rates
remain roughly stable in units that initially had high patient/nurse ratios.
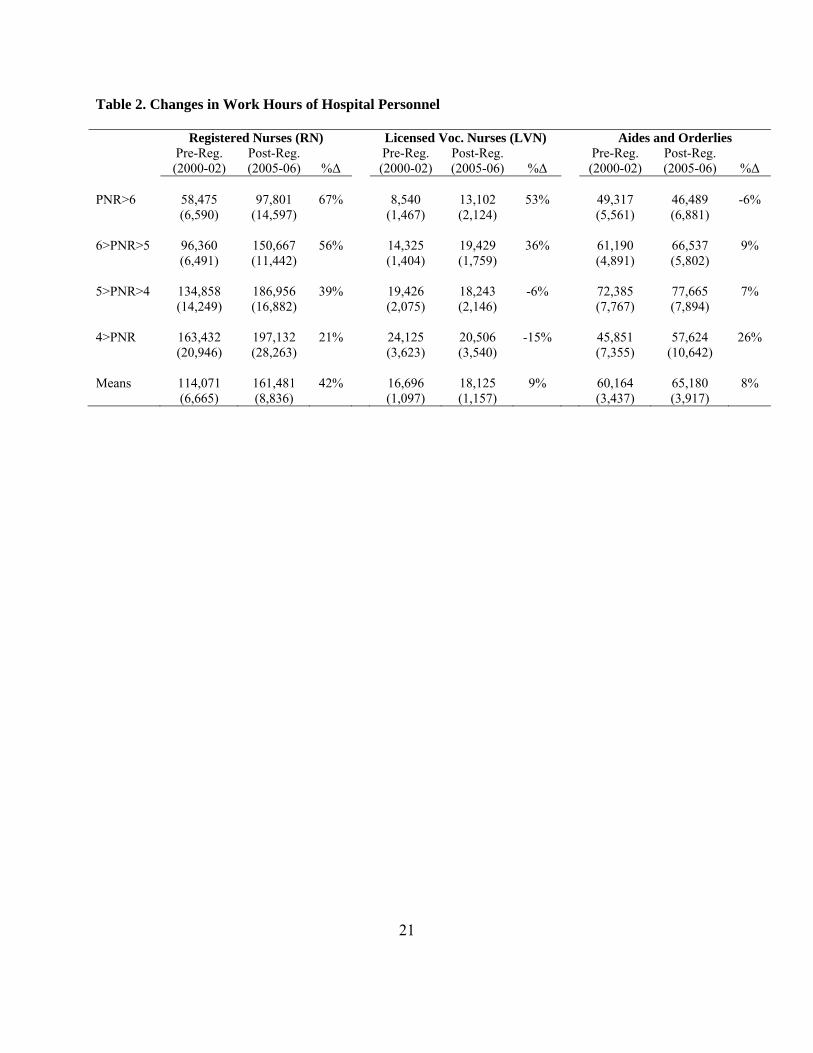
Below we provide a systematic analysis of the trends shown in Table 1. Before doing so, we
provide evidence about a potentially important issue—that when hospitals adjust nurse staffing levels in
response to the legal change they might substitute away from high-skill registered nurses (RNs) toward
relatively lower-skilled licensed vocational nurses (LVNs), and might also adjust the use of aides and
orderlies. Table 2 shows that in general, hospitals in our study use far fewer LVN hours than RN hours.
Also we notice that hospitals with the highest PNRs—that is, hospitals where the law should have had the
12 Hospital FTR rates are positively correlated across time, even given changes induced by AB394. For example, we computed a correlation between 2000-2002 rates and 2005-2006 rates of 0.32 (p-value < 0.0001).
10
greatest impact—increased the hours of both RNs and LVNs, and that the proportional increase for RN
hours was greater than the increase for LVN hours.
An additional possible response by hospitals required to increase the use of nurses (i.e., hospitals
where PNR was initially greater than 5) was a reduction in the use of aides and orderlies. We see some
evidence of such an outcome in Table 2. Overall, for hospitals in which the PNR>5, the number of hours
provided by aides and orderlies increased slightly (by 2.3 percent for all of these hospitals) from the pre-
regulation period to the post-regulation period. However, we cannot rule out the possibility that this
increase would have been larger in the absence of AB394, and indeed the increase in aides and orderlies
was larger for hospitals that initially had PNR<5.
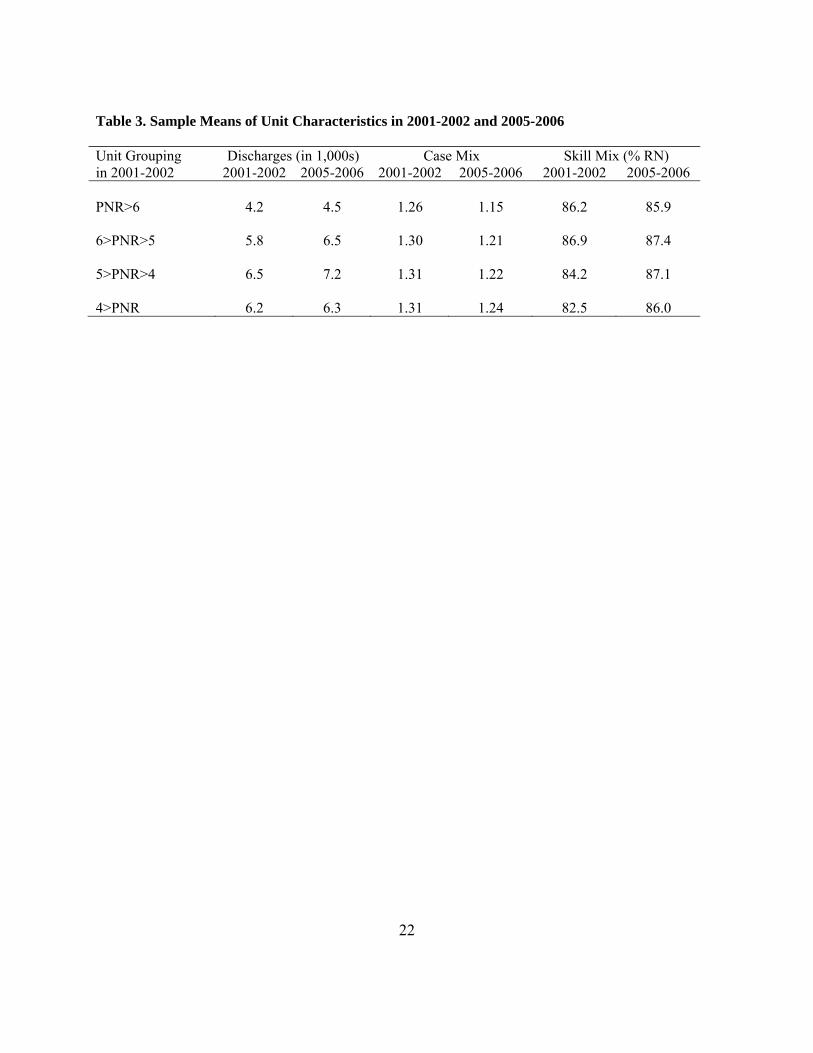
Before turning to our main analysis, we provide in Table 3 summary statistics for some
characteristics of the medical/surgical hospital units used in our regressions. For our analysis below, we
will often estimate “difference equations” in which we treat 2001-2002 as the “pre-regulation period” and
2005-2006 as the “post-regulation period,” so in this Table we present statistics for both of these periods.
We leave 2000 out of the “pre-regulation period” here because we use that year for forming instruments
to use in our instrumental variable analysis.
We see from Table 3 that hospitals that have high patient/nurse ratios (PNR>6) tend to be
generally smaller than other hospitals, as measured by “discharges.”13 The “case mix” variable, which
indicates the severity of illness in each hospital unit, is calculated by taking the average of the relative
weighting factor for all diagnosis related groups (DRGs) in the hospital unit during the period analyzed.14
As this variable is constructed, higher values are associated with relatively greater severity in patient
acuity on a unit.
13 Discharges are defined as the number of inpatient population who are medically cleared to leave the hospital in the given period analyzed. In our case, this would be the number of discharges averaged between 2001 and 2002 or between 2005 and 2006. 14 The relative weighting factor for each DRG in a given year is obtained from the Federal Register in the corresponding year that contains this information. The volume and number of the Federal Register differs in each calendar year. (Details are available from the authors upon request.)
11
Finally, the “skill mix” variable given in the third set of columns in Table 3 gives the percent of
productive hours provided by licensed nurses—RNs and LVNs combined—that were provided by the
higher-skilled RNs. As we have noted, in general this percentage is quite high; in the units we study most
nurses are RNs. Also, this variable is stable or increasing slightly over time in each of the four sets of
hospitals we examine. Thus, while changes in the skill mix might naturally be an endogenous
consequence of AB394, any such changes were apparently quite small over our period of study.
4. Regression Analysis
As we have noted, the goal of AB394 was to increase nurse staffing levels, thereby reducing
adverse patient health outcomes. As we also noted, much of the evidence pertaining to the hoped-for
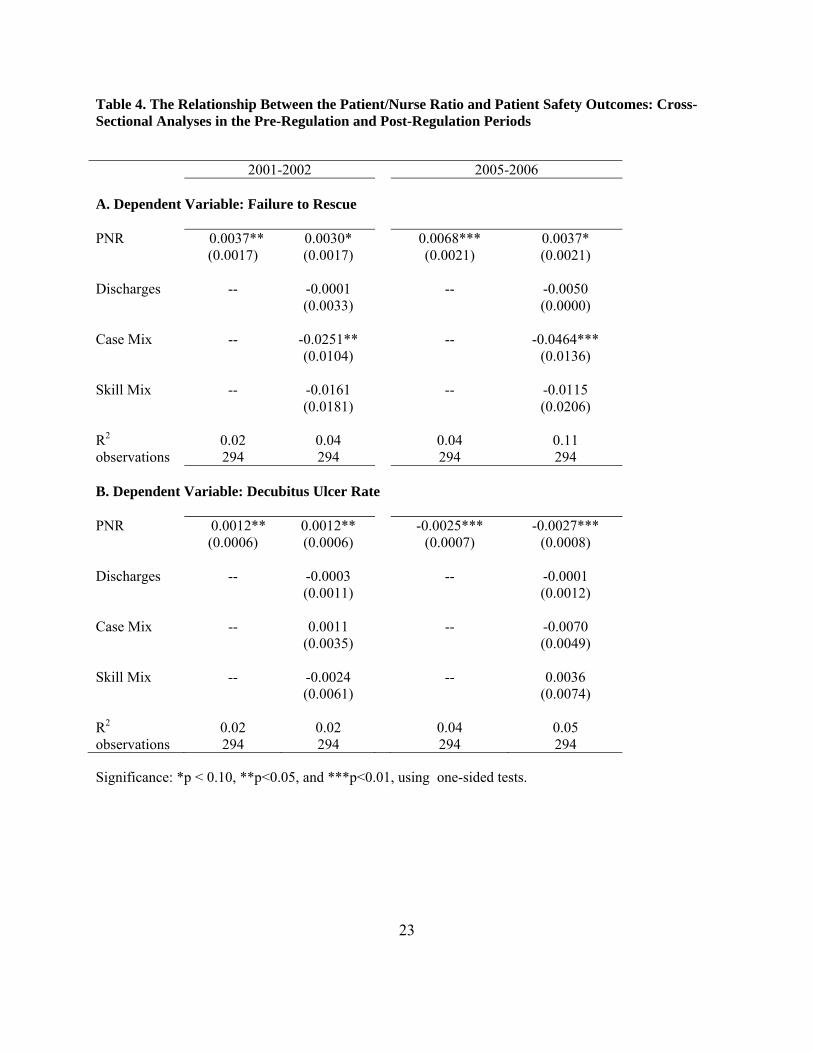
improvements has come from cross-sectional analysis. With this in mind, we begin by looking at the
cross-sectional relationships between our patient outcomes and the patient-to-nurse ratios. In particular
we estimate cross-section regressions of the form:
(1) PSIi = α0 + α1PNRi + α2Xi + εi ,
where PSIi is a measure of hospital unit i’s patient safety indicator (PSI) rate, averaged over the period
under study, PNRi is a measure of the unit patient-to-nurse ratio averaged over the period, and Xi is a
vector of unit-specific covariates averaged over the period (discharges, RN skill mix, and case mix).
We begin by estimating equation (1) using failure to rescue as the PSI. Results are given in Panel
A of Table 4, for two time periods, the pre-regulation period (2001-2002) and the post-regulation period
(2005-2006). We estimate this regression without and with covariates. In both specifications and in both
periods, the PNR is positively correlated with failure to rescue. As in the previous literature using cross-
sectional data, we observe higher failure to rescue where there is a higher patient/nurse ratio. The
relationship is statistically significant, and the estimated effect is non-negligible. For example, in the
2001-2002 regression that includes “controls,” an increase in the number of patients per nurse by 1 is
associated with an increase in the rate of failure to rescue of 0.003—an increase of approximately 2%.
12
We next estimate equation (1) using the decubitus ulcer (DU) rate as the PSI, again for the two
time periods, 2001-2002 and 2005-2006. Results are in Panel B of Table 4. The estimated coefficients
for the 2001-2002 period are as one would expect. Higher patient/nurse ratios are associated with higher
DU rates. Surprisingly, the relationship reverses in 2005-2006.
To get an idea of what might be happening with reported DU rates in our data, we return to Table
1. Consider those hospitals that in the 2000-2002 period had the lowest patient loads (fewer than 4
patients per nurse). In 2000, DU rates were very low in these hospitals, but DU rates increased steadily in
these same hospitals, so that by 2006 these units had the relatively high DU rates. Notice that this
increase in reported DU rates occurred even though those same units continued to have generally low
patient/nurse loads (see Panel A of Table 1) and were steadily improving on our other key PSI—failure to
rescue (see Panel C of Table 1). A plausible explanation has to do with the nature of reported decubitus
ulcers. Over the past several years, there has been considerable attention given to this condition, due in
part, no doubt, to legal suits in which patients with DUs have won substantial awards. In addition, the
Centers for Medicare and Medicaid Services (CMS) have been pushing a well-publicized migration to a
severity-based payment system, under which payments to hospitals have been reduced for patients that
develop DUs.15 The consequence is that nurses on well-run units have become increasingly sensitive
about diagnosing DU cases present on admission (POA). This is a potentially important issue because
previous research indicates that in California in 2003, 89% of DU cases were POA (Houchens,
Elixhauser, and Romano, 2008). The point here is that the increasing DU rates reported for the “best
hospitals” might be an indication that medical personnel in these hospitals are especially attentive to
diagnosing DU cases POA. In principal this should not be a problem since we exclude DU cases that are
indicated as POA. But it is difficult to know the level of accuracy of these records.16
15 These new rules went into effect in October 2008, but attentive health care providers no doubt began to pay closer attention to DU rates during the years leading up to the implementation of this policy. 16 Polancich, Restrepo, and Prosser’s (2006) validation study, which matched AHRQ patient safety indicators with patient medical charts, suggests that the AHRQ methodology substantially over-estimates DU rates. (They point out
13
Given the concerns we have raised in the previous paragraph, we do not conduct further analysis
on DU rates using our data. Instead, we view this case as underscoring previous work cautioning
researchers who use DU rates as a PSI (e.g., Houchens et al., 2008, and Polancich, et al., 2006).
We turn now to our primary analysis, which is intended to measure the causal relationship
between patient/nurse ratios and our other PSI, failure to rescue. As we have emphasized, our concern is
that the true relationship between patient safety and the PNR is given not by (1), but instead by
(2) PSIi = α0 + α1PNRi + α2Xi + α3Si + εi ,
which includes an additional (unobserved) set of variables, Si. If we estimate (1) rather than (2), the OLS
estimate of α1 is of course inconsistent if Si and PNRi are correlated, as seems quite plausible. In our case,
we can make headway as follows. We first take a “first difference” of equation (2),
(3) ΔPSIi = β0 + β1ΔPNRi + β2ΔXi + [ β3ΔSi + Δεi] ,
where differences are taken between the 2005-2006 and 2001-2002 time periods. We have no data for
ΔSi (indeed we do not even know what variables appropriately should be included in S) and if we were to
estimate (3), treating the term in brackets as an error term, that error term might well be correlated with
PNRi, If so, OLS would obviously still give inconsistent estimates of regression parameters.
Given the new regulation, though, we have a reasonable way to proceed. As we have seen in
Table 1, hospitals that initially had high levels of PNR generally had substantial decreases in PNR from
the pre-regulation time period to the post-regulation time period. This makes sense. After all, the 2004
regulation mandated that all hospitals maintain the mandated staffing minimum, which meant that some
hospitals had to substantially increase staffing levels, while others did not. To capture that idea, we
define Di to be the difference between the required nurse staffing level (as implemented in 2004) and
hospital i’s staffing level in 2000. Clearly, we expect that the change in the patient/nurse ratio, ΔPNRi , to
be correlated with Di, and we expect that relationship to be nonlinear, so we use Di, Di2, and Di
3 as
that many patients who transfer from nursing facility are admitted via an order from an emergency department physician, and are therefore recorded as an emergency department admission.)
14
instruments.17 Thus we have a standard instrumental variables (IV) procedure: The first stage regression
has
(4) ΔPNRi = θ0 + θ1 Di + θ2Di2+ θ3 Di
3 + θ4ΔXh + νh .
Then in the second stage we use the predicted value of ΔPNRi in estimating regression (3).18
It’s worth noting that the data seem to have common trends. Examining Panel B of Table 1 we
see that the 2000-2002 differences in FTR rates differ very little across hospitals in the PNR groups. For
example, it’s 0.004 for hospitals in the highest (PNR>6) group and also 0.004 for hospitals in the lowest
(4>PNR) group.
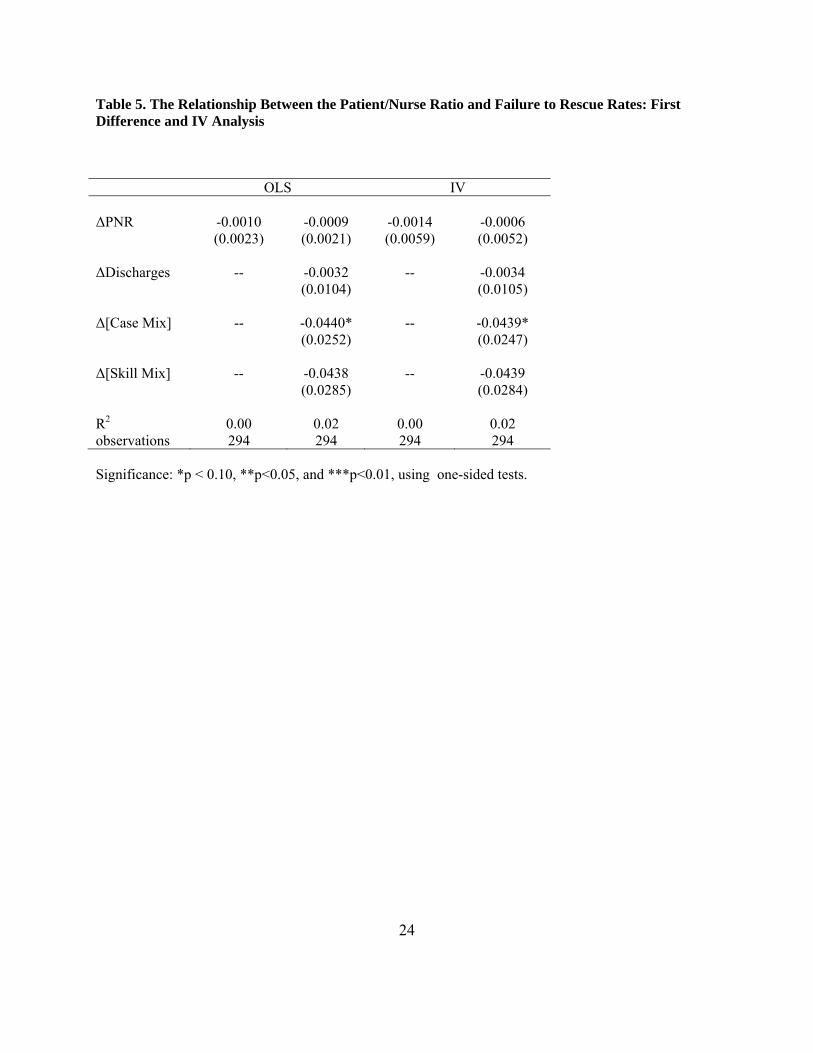
Table 5 provides the results. The first two columns show OLS estimates for two specifications
based on (3)—one without covariates and one with covariates. Estimates of the key parameter of
interest—the association between PNR and failure to rescue—are very close to 0. Turning to the IV
estimates, we note, first of all, that in the first stage the instruments are both individually and jointly
highly significant.19 As is clear, though, from the second set of columns in Table 6, we find no significant
effect of the change in the patient/nurse ratio on failure to rescue. Estimated effects are very small and
are imprecisely estimated.20 While the IV point estimates are different from the cross-sectional point
estimates (reported in Table 4), we cannot reject the equality of these two sets of estimates.21
17 As a test for the sensitivity of our results to functional form, we used dummies for difference between required and actual nurse staffing levels (>1 patient above, 0-1 patient above, 0-1 patient below, >1 patient below) instead of a cubic in the difference. The results are unchanged. 18 Notice that ΔPNRi is measured from 2005-2006 to 2001-2002, while the instruments Di, Di
2, and Di3 are formed in
2000. Our reason for using a different year for the instruments is concern about measurement error. As discussed above, our PNR variable is measured with error. Thus if we had formed instruments using the same year as our
ΔPNRi variables, it is possible that the correlation might be due simply to this measurement error. Our strategy then relies on an assumption that measurement error in our PNR measures are not correlated between 2000 (data used to form instruments) and either 2001-2002 or 2005-2006 (data used to form differences in PNR). 19 Estimates of the coefficients for D, D2, and D3,and their standard errors (in parentheses) are, respectively, 0.464 (0.074), -0.109 (0.032), and -0.013 (0.010). The F statistic for the joint significance of the instruments is 17.0, so we clearly do not have the problem of “weak instruments” (as discussed, e.g., in Staiger and Stock, 1997). 20 We also estimated these equations for intensive care units (ICU), since patients there could be affected by the legislation. We find the same results: the IV estimates of the effect of the patient nurse ratio are insignificant. 21 For example, the 95% confidence interval for the cross-sectional PNR coefficient in the 4th column of Table 4, Panel A is entirely contained within the 95% confidence interval for the IV PNR coefficient in the 4th column of Table 5. The 95% confidence interval for the coefficient in the last column of Table 5 (our key point estimate) includes all of the estimated coefficients for PNR from the cross-sectional results in Table 4, Panel A.
15
In sum, we find no evidence of a causal impact of the patient/nurse ratio on failure to rescue. The
basic story is seen clearly from Tables 1. From the pre-regulation period to the post-regulation period,
there was apparently an impact of AB394 on nurse staffing levels in some hospitals. However,
improvements in the failure to rescue rates were similar among all categories of hospitals—those with
initially high patient/nurse ratios and those with initially low patient/nurse ratios. The regression results
reported in Table 5 confirm these basic observations. Of course, this does not mean that nurse staffing
has no impact in general on patient outcomes. Rather, our work shows that any such effects do not
appear, in clear ways, in the form of improvements in readily-available and commonly used measures of
patient well-being.22
4. Discussion
This paper presents an analysis of California’s AB394, a law that mandated minimum nurse
staffing levels in that State. We examine rates of decubitus ulcers, and conclude that such analysis is not
helpful in measuring the impact of the law on patient safety. More helpfully, we examine the impact on
failure to rescue rates.
We find persuasive evidence that AB394 did have the intended effect of decreasing patient/nurse
ratios in hospitals that previously did not meet mandated standards. However, our analysis suggests that
failure to rescue rates did not disproportionately improve in these same hospitals. That is, we do not find
persuasive evidence that the regulation change improved patient safety in the affected hospitals.
There is an important caveat to our analysis. Our empirical results suggest that a mandate
reducing patient/nurse ratios, on its own, need not lead to improved patient safety. This is not to say,
though, that nurse staffing decisions are unimportant as a component in a hospital’s overall strategy for
ensuring high patient safety. In particular, it is worth emphasizing that in our data there is a statistically
significant positive cross-sectional relationship between patient/nurse ratios and failure to rescue, as in
22 We note that it is possible there is underlying heterogeneity in hospital responses which our analysis does not identify; we estimate mean effects. Also, it is also possible that there could be responses over a longer time period than the one we analyze.
16
much of the previous literature. We have noted the difficulties associated with drawing causal inferences
on the basis of such results. Nonetheless, apparently those hospitals that are most effective in ensuring
patient safety generally find it optimal to employ more nurses per patient. Perhaps there are
complementarities between nursing inputs and other (possibly unobserved) inputs and policies that lead to
better patient safety. Thus, improved nurse staffing might be crucial in improving patient safety, but only
in combination with other elements. It is important that analysts, policy-makers, and healthcare providers
sort out these important issues.
17
References
Agency for Healthcare Research and Quality. 2003. AHRQ Quality Indicators: Guide to Patient Safety
Indicators (Rep. No. 03-R203 – Version 3.1.) Rockville, MD: AHRQ. Aiken L.H., Clarke S.P., Sloane D.M., Sochalski J., and Silber J.H. 2002. Hospital Nurse Staffing and
Patient Mortality, Nurse Burnout, and Job Dissatisfaction. Journal of the American Medical Association, 288(16): 1987-1993.
Bartel A.P., Phibbs C.S., Beaulieu N., and Stone P.W., 2009. Human Capital and Productivity: The Case
of Nursing Teams. Working Paper, Columbia Business School. Bloom, N. Propper, C., Seiler, S. and Van Reenen, J. 2009. Management Practices in Hospitals.
unpublished manuscript, London School of Economics. Cho S.H., Ketefian S., Barkauskas V.H., and Smith D.G. 2003. The Effects of Nurse Staffing on
Adverse Events, Morbidity, Mortality, and Medical Costs. Nursing Research, 52(2): 71-79. Clarke S.P. 2003. Balancing Staffing and Safety. Nursing Management, 34(6): 44-48. Clarke S.P. 2005. The Policy Implications of Staffing-Outcomes Research. Journal of Nursing
Administration, 35(1): 17-19. Coffman J.M., Seago J.A., and Spetz, J. 2002. Minimum Nurse-to-Patient Ratios in Acute Care
Hospitals in California. Health Affairs, 21(5): 53-64. Cook, A. 2009. Is There a Nurse in the House? The Effect of Nurse Staffing Increases on Patient Health
Outcomes. Chapter 3, unpublished doctoral dissertation, Carnegie Mellon University. Dobkin C. 2003. Hospital Staffing and Patient Mortality. Working Paper, Department of Economics,
University of California, Berkeley. Available at http://people.ucsc.edu/~cdobkin/Papers. Donaldson N.E. 2005. Impact of CA’s Licensed Nurse-Patient Ratios on Unit-Level Nurse Staffing and
Patient Outcomes. Policy, Politics, and Nursing Practice, 6(3): 198-210. Dunton N. and Schumann M.J. 2005. Early Evidence on California Staffing Ratios Should be
Interpreted with Caution. Policy, Politics, and Nursing Practice, 6(4):354-357. Evans W.N. and Kim B. 2006. Patient Outcomes When Hospitals Experience a Surge in Admissions.
Journal of Health Economics, 25(2): 365-388. Gerdtz M.F. 2007. 5-20: A Model of Minimum Nurse-to-Patient Ratios in Victoria, Australia. Journal
of Nursing Management, 15: 64-71. Goodin H.J. 2003. The Nursing Shortage in the United States of America: An Integrative Review of the
Literature. Journal of Advanced Nursing, 43(3): 335-350.
18
Houchens R., Elixhauser A. and Romano, P. 2008. How Often are Potential Patient Safety Events Present on Admission? Joint Commission Journal on Quality and Patient Safety, 34(3): 154-163.
Institute for Health and Socio-Economic Policy. 2001. AB 394: California and the Demand for Safe and
Effective Nurse to Patient Staffing Ratios. Prepared for the California Nurses Association. Kane, R.L., Shamliyan, T., Mueller, C. Duval, S., and Wilt, T. 2007. The Association of Registered
Nurse Staffing Levels and Patient Outcomes: Systematic Review and Meta-Analysis. Medical Care, 45(12): 1195-1204.
Kohn, L.T., Corrigan, J.M., and Donaldson, M. 1999. To Err is Human: Building a Safer Health System.
Washington, DC: National Academy Press. Lang, T.A., Hodge, M., Olson, V., Romano, P.S., and Kravitz, R.L. 2004. Nurse-Patient Ratios: A
Systematic Review on the Effects of Nurse Staffing on Patient, Nurse Employee, and Hospital Outcomes. Journal of Nursing Administration, 34(7-8): 326-337.
Lichtig, L.K., Knauf, R.A., and Milholland, D.K. 1999. Some Impact of Nursing on Acute Care Hospital
Outcomes. Journal of Nursing Administration, 29(2): 25-33. Mark, B.A., Salyer, J., and Wan, T.T. 2003. Professional Nursing Practice: Impact on Organizational
and Patient Outcomes. Journal of Nursing Administration, 33: 224-234. Mark, B.A., Harless, D., McCue, M., and Yihua, X. 2004. A Longitudinal Examination of Hospital
Registered Nurse Staffing and Quality of Care. Health Services Research, 39: 279-299. Matsudaira, J. 2009. The Labor Market Effects of Minimum Staffing Legislation: Direct Tests for
Monopsony in High- and Low-Skilled Labor Markets. unpublished manuscript, Cornell University.
McClellan, M. and Staiger, D. 2000. Comparing the Quality of Health Care Providers. In Frontiers in
Health Policy Research, vol. 3, pp. 113–36. A. Garber, ed. Cambridge, MA: MIT Press. Needleman, J., Buerhaus, P.I., Mattke, S., Stewart, M., and Zelvinsky, K. 2001. Nurse Staffing and
Patient Outcomes in Hospitals. Final Report of US DHHS Health Resources and Services Administration, Contract No. 230-99-0021.
Needleman, J., Buerhaus, P., Mattke, S., Stewart, M., and Zelevinsky, K. 2002. Nurse Staffing Levels
and the Quality of Care in Hospitals. The New England Journal of Medicine, 346(22): 1715-1722.
Polancich, S., Restrepo, E., and Prosser, J. 2006. Cautious Use of Administrative Data for Decubitus
Ulcer Outcome Reporting. American Journal of medical Quality, 21(4): 262-268. Propper, C. and Van Reenen, J. 2010. Can Pay Regulation Kill? Panel Data Evidence on the Effect of
Labor Markets on Hospital Performance. Journal of Political Economy, 118: 222-273. Rosdahl, C.B. and Kowalski, M.T. 2007. Textbook of Basic Nursing. Lippincott, Williams, and Wilkins,
9th Edition.
19
Seago, J.A. 2002. The California Experiment: Alternatives for Minimum Nurse-to-Patient Ratios.
Journal of Nursing Administration, 32(1): 48-58. Sochalski, J., Konetzka, T., Zhu, J., and Volpp, K. 2008. Will Mandatory Nurse Staffing Ratios Lead to
Better Patient Outcomes in Hospitals? Medical Care, 46(6): 606-13. Spetz, J. 2004. California’s Minimum Nurse-to-Patient Ratios: The First Few Months. Journal of
Nursing Administration, 34(12): 571-578. Spetz, J., Chapman S., Herrera, C., Kaiser, J., Seago, J.A., and Dower, C. 2009. Assessing the Impact of
California’s Nurse Staffing Ratios on Hospitals and Patient Care. California Healthcare Foundation: Issue Brief – February.
Staiger, D. and Stock, J. 1997. Instrumental Variables Regression with Weak Instruments.
Econometrica, 65(3): 557-586. Stone, P.W., Mooney-Kane, C., Larson, E.L., Horan, T., Glance, L.G., Zwanziger, J., Dick, A.W. 2007.
Nurse Working Conditions and Patient Safety Outcomes. Medical Care, 45(6): 571-578. Unruh, L. 2003. Licensed Nurse Staffing and Adverse Events in Hospitals. Medical Care, 41(1): 142-
152. United States Department of Health and Human Services. 2005. Pocket Guide to Minority Health
Resources. Washington D.C.: United States Department of Health and Human Services – Office of Public Health and Science.
20
Table 1. Sample Means of Key Variables, 2000-2006
PNR in 2000-02
2000
2001
2002
2003
2004
2005
2006
Pre-Reg. (2000-02)
Post-Reg. (2005-06)
A. Patient-to-Nurse Ratios (PNR) PNR>6 6.64 7.17 7.36 6.55 5.42 4.80 4.62 7.06 4.71 (0.14) (0.16) 6>PNR>5 5.41 5.53 5.36 5.16 4.68 4.39 4.15 5.43 4.27 (0.03) (0.10) 5>PNR>4 4.52 4.61 4.58 4.45 4.25 3.97 3.83 4.57 3.90 (0.03) (0.09) 4>PNR 3.23 3.55 3.55 3.68 4.05 3.50 3.39 3.44 3.45 (0.07) (0.12) Means 4.95 5.17 5.14 4.91 4.56 4.17 3.99 5.08 4.08 (0.07) (0.06) B. Failure to Rescue (FTR) Rates PNR>6 0.178 0.178 0.174 0.173 0.168 0.153 0.157 0.177 0.155 (0.006) (0.008) 6>PNR>5 0.171 0.172 0.169 0.167 0.160 0.151 0.127 0.171 0.139 (0.003) (0.004) 5>PNR>4 0.164 0.168 0.171 0.159 0.154 0.142 0.115 0.168 0.129 (0.004) (0.004) 4>PNR 0.157 0.168 0.153 0.153 0.138 0.138 0.116 0.160 0.127 (0.006) (0.006) Means 0.167 0.171 0.168 0.163 0.156 0.146 0.127 0.169 0.136 (0.002) (0.003) C. Decubitus Ulcer (DU) Rates PNR>6 0.029 0.029 0.031 0.032 0.032 0.032 0.031 0.030 0.031 (0.002) (0.002) 6>PNR>5 0.025 0.025 0.025 0.026 0.027 0.029 0.029 0.025 0.029 (0.001) (0.001) 5>PNR>4 0.024 0.025 0.025 0.027 0.028 0.028 0.027 0.025 0.028 (0.001) (0.001) 4>PNR 0.022 0.024 0.026 0.027 0.032 0.030 0.032 0.024 0.031 (0.001) (0.002) Means 0.025 0.025 0.026 0.027 0.029 0.029 0.029 0.026 0.029 (0.001) (0.001) Sample sizes are 53 for PNR>6, 94 for 6>PNR>5, 96 for 5>PNR>4, and 51 for 4>PNR. Standard errors are in parentheses.
21
Table 2. Changes in Work Hours of Hospital Personnel Registered Nurses (RN) Licensed Voc. Nurses (LVN) Aides and Orderlies Pre-Reg.
(2000-02) Post-Reg. (2005-06) %Δ
Pre-Reg. (2000-02)
Post-Reg. (2005-06) %Δ
Pre-Reg. (2000-02)
Post-Reg. (2005-06) %Δ
PNR>6 58,475 97,801 67% 8,540 13,102 53% 49,317 46,489 -6% (6,590) (14,597) (1,467) (2,124) (5,561) (6,881) 6>PNR>5 96,360 150,667 56% 14,325 19,429 36% 61,190 66,537 9% (6,491) (11,442) (1,404) (1,759) (4,891) (5,802) 5>PNR>4 134,858 186,956 39% 19,426 18,243 -6% 72,385 77,665 7% (14,249) (16,882) (2,075) (2,146) (7,767) (7,894) 4>PNR 163,432 197,132 21% 24,125 20,506 -15% 45,851 57,624 26% (20,946) (28,263) (3,623) (3,540) (7,355) (10,642) Means 114,071 161,481 42% 16,696 18,125 9% 60,164 65,180 8% (6,665) (8,836) (1,097) (1,157) (3,437) (3,917)
22
Table 3. Sample Means of Unit Characteristics in 2001-2002 and 2005-2006
Unit Grouping Discharges (in 1,000s) Case Mix Skill Mix (% RN) in 2001-2002 2001-2002 2005-2006 2001-2002 2005-2006 2001-2002 2005-2006 PNR>6 4.2 4.5 1.26 1.15 86.2 85.9 6>PNR>5 5.8 6.5 1.30 1.21 86.9 87.4 5>PNR>4 6.5 7.2 1.31 1.22 84.2 87.1 4>PNR 6.2 6.3 1.31 1.24 82.5 86.0
23
Table 4. The Relationship Between the Patient/Nurse Ratio and Patient Safety Outcomes: Cross-Sectional Analyses in the Pre-Regulation and Post-Regulation Periods
Significance: *p < 0.10, **p<0.05, and ***p<0.01, using one-sided tests.
2001-2002 2005-2006 A. Dependent Variable: Failure to Rescue PNR 0.0037** 0.0030* 0.0068*** 0.0037* (0.0017) (0.0017) (0.0021) (0.0021) Discharges -- -0.0001 -- -0.0050 (0.0033) (0.0000) Case Mix -- -0.0251** -- -0.0464*** (0.0104) (0.0136) Skill Mix -- -0.0161 -- -0.0115 (0.0181) (0.0206) R2 0.02 0.04 0.04 0.11 observations 294 294 294 294 B. Dependent Variable: Decubitus Ulcer Rate PNR 0.0012** 0.0012** -0.0025*** -0.0027*** (0.0006) (0.0006) (0.0007) (0.0008) Discharges -- -0.0003 -- -0.0001 (0.0011) (0.0012) Case Mix -- 0.0011 -- -0.0070 (0.0035) (0.0049) Skill Mix -- -0.0024 -- 0.0036 (0.0061) (0.0074) R2 0.02 0.02 0.04 0.05 observations 294 294 294 294
24
Table 5. The Relationship Between the Patient/Nurse Ratio and Failure to Rescue Rates: First Difference and IV Analysis
Significance: *p < 0.10, **p<0.05, and ***p<0.01, using one-sided tests.
OLS IV ΔPNR -0.0010 -0.0009 -0.0014 -0.0006 (0.0023) (0.0021) (0.0059) (0.0052) ΔDischarges -- -0.0032 -- -0.0034 (0.0104) (0.0105) Δ[Case Mix] -- -0.0440* -- -0.0439* (0.0252) (0.0247) Δ[Skill Mix] -- -0.0438 -- -0.0439 (0.0285) (0.0284) R2 0.00 0.02 0.00 0.02 observations 294 294 294 294
1
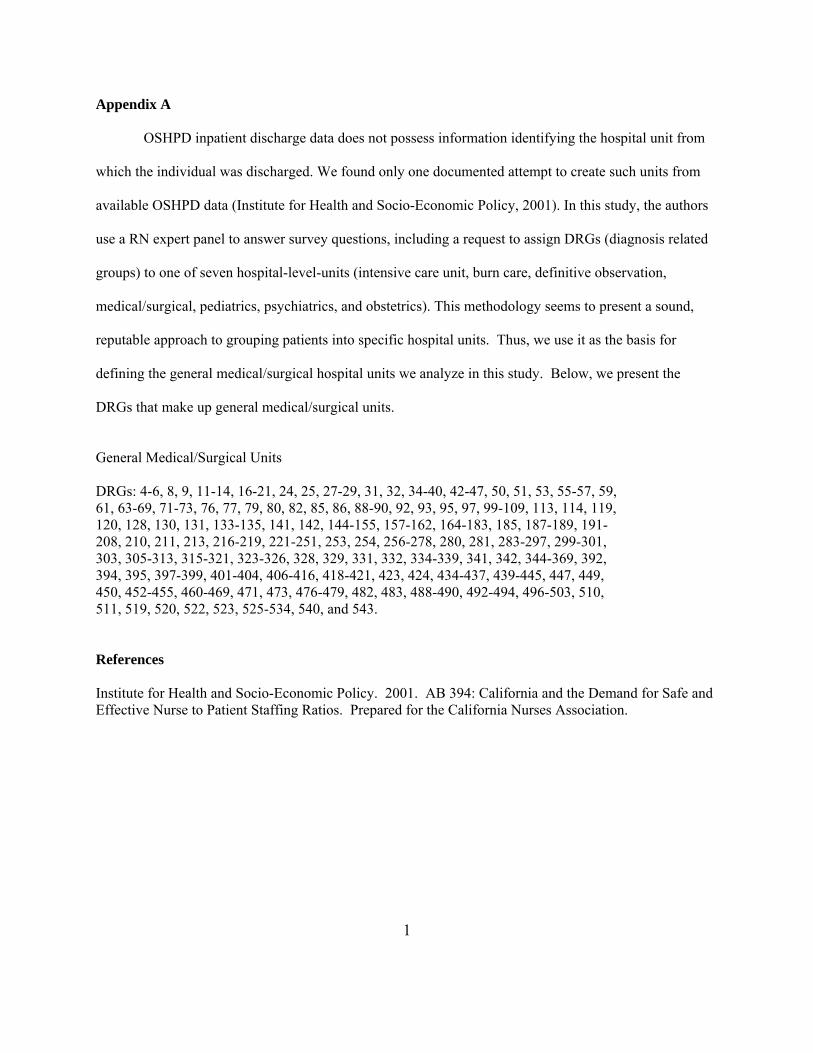
Appendix A
OSHPD inpatient discharge data does not possess information identifying the hospital unit from
which the individual was discharged. We found only one documented attempt to create such units from
available OSHPD data (Institute for Health and Socio-Economic Policy, 2001). In this study, the authors
use a RN expert panel to answer survey questions, including a request to assign DRGs (diagnosis related
groups) to one of seven hospital-level-units (intensive care unit, burn care, definitive observation,
medical/surgical, pediatrics, psychiatrics, and obstetrics). This methodology seems to present a sound,
reputable approach to grouping patients into specific hospital units. Thus, we use it as the basis for
defining the general medical/surgical hospital units we analyze in this study. Below, we present the
DRGs that make up general medical/surgical units.
General Medical/Surgical Units DRGs: 4-6, 8, 9, 11-14, 16-21, 24, 25, 27-29, 31, 32, 34-40, 42-47, 50, 51, 53, 55-57, 59, 61, 63-69, 71-73, 76, 77, 79, 80, 82, 85, 86, 88-90, 92, 93, 95, 97, 99-109, 113, 114, 119, 120, 128, 130, 131, 133-135, 141, 142, 144-155, 157-162, 164-183, 185, 187-189, 191- 208, 210, 211, 213, 216-219, 221-251, 253, 254, 256-278, 280, 281, 283-297, 299-301, 303, 305-313, 315-321, 323-326, 328, 329, 331, 332, 334-339, 341, 342, 344-369, 392, 394, 395, 397-399, 401-404, 406-416, 418-421, 423, 424, 434-437, 439-445, 447, 449, 450, 452-455, 460-469, 471, 473, 476-479, 482, 483, 488-490, 492-494, 496-503, 510, 511, 519, 520, 522, 523, 525-534, 540, and 543. References Institute for Health and Socio-Economic Policy. 2001. AB 394: California and the Demand for Safe and Effective Nurse to Patient Staffing Ratios. Prepared for the California Nurses Association.
1
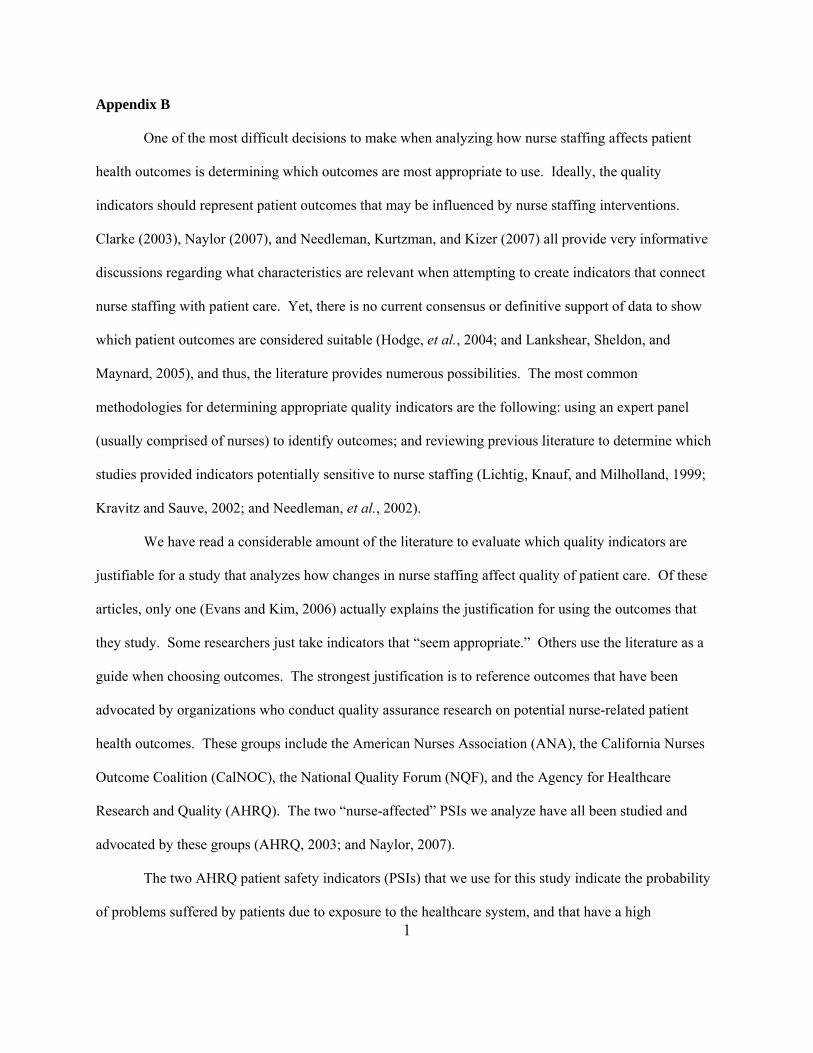
Appendix B
One of the most difficult decisions to make when analyzing how nurse staffing affects patient
health outcomes is determining which outcomes are most appropriate to use. Ideally, the quality
indicators should represent patient outcomes that may be influenced by nurse staffing interventions.
Clarke (2003), Naylor (2007), and Needleman, Kurtzman, and Kizer (2007) all provide very informative
discussions regarding what characteristics are relevant when attempting to create indicators that connect
nurse staffing with patient care. Yet, there is no current consensus or definitive support of data to show
which patient outcomes are considered suitable (Hodge, et al., 2004; and Lankshear, Sheldon, and
Maynard, 2005), and thus, the literature provides numerous possibilities. The most common
methodologies for determining appropriate quality indicators are the following: using an expert panel
(usually comprised of nurses) to identify outcomes; and reviewing previous literature to determine which
studies provided indicators potentially sensitive to nurse staffing (Lichtig, Knauf, and Milholland, 1999;
Kravitz and Sauve, 2002; and Needleman, et al., 2002).
We have read a considerable amount of the literature to evaluate which quality indicators are
justifiable for a study that analyzes how changes in nurse staffing affect quality of patient care. Of these
articles, only one (Evans and Kim, 2006) actually explains the justification for using the outcomes that
they study. Some researchers just take indicators that “seem appropriate.” Others use the literature as a
guide when choosing outcomes. The strongest justification is to reference outcomes that have been
advocated by organizations who conduct quality assurance research on potential nurse-related patient
health outcomes. These groups include the American Nurses Association (ANA), the California Nurses
Outcome Coalition (CalNOC), the National Quality Forum (NQF), and the Agency for Healthcare
Research and Quality (AHRQ). The two “nurse-affected” PSIs we analyze have all been studied and
advocated by these groups (AHRQ, 2003; and Naylor, 2007).
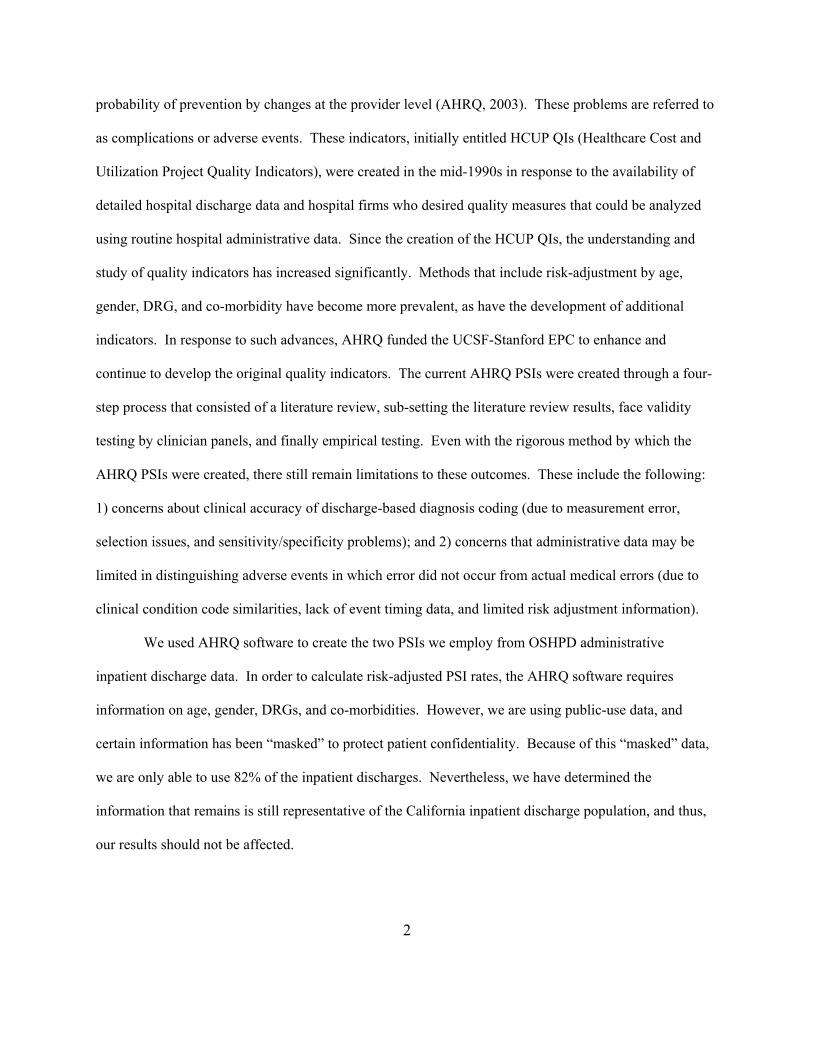
The two AHRQ patient safety indicators (PSIs) that we use for this study indicate the probability
of problems suffered by patients due to exposure to the healthcare system, and that have a high
2
probability of prevention by changes at the provider level (AHRQ, 2003). These problems are referred to
as complications or adverse events. These indicators, initially entitled HCUP QIs (Healthcare Cost and
Utilization Project Quality Indicators), were created in the mid-1990s in response to the availability of
detailed hospital discharge data and hospital firms who desired quality measures that could be analyzed
using routine hospital administrative data. Since the creation of the HCUP QIs, the understanding and
study of quality indicators has increased significantly. Methods that include risk-adjustment by age,
gender, DRG, and co-morbidity have become more prevalent, as have the development of additional
indicators. In response to such advances, AHRQ funded the UCSF-Stanford EPC to enhance and
continue to develop the original quality indicators. The current AHRQ PSIs were created through a four-
step process that consisted of a literature review, sub-setting the literature review results, face validity
testing by clinician panels, and finally empirical testing. Even with the rigorous method by which the
AHRQ PSIs were created, there still remain limitations to these outcomes. These include the following:
1) concerns about clinical accuracy of discharge-based diagnosis coding (due to measurement error,
selection issues, and sensitivity/specificity problems); and 2) concerns that administrative data may be
limited in distinguishing adverse events in which error did not occur from actual medical errors (due to
clinical condition code similarities, lack of event timing data, and limited risk adjustment information).
We used AHRQ software to create the two PSIs we employ from OSHPD administrative
inpatient discharge data. In order to calculate risk-adjusted PSI rates, the AHRQ software requires
information on age, gender, DRGs, and co-morbidities. However, we are using public-use data, and
certain information has been “masked” to protect patient confidentiality. Because of this “masked” data,
we are only able to use 82% of the inpatient discharges. Nevertheless, we have determined the
information that remains is still representative of the California inpatient discharge population, and thus,
our results should not be affected.
3
References Agency for Healthcare Research and Quality. 2003. AHRQ Quality Indicators: Guide to Patient Safety
Indicators (Rep. No. 03-R203 – Version 3.1.) Rockville, MD: AHRQ. Clarke S.P. 2005. The Policy Implications of Staffing-Outcomes Research. Journal of Nursing Administration, 35(1): 17-19. Evans W.N. and Kim B. 2006. Patient Outcomes When Hospitals Experience a Surge in Admissions.
Journal of Health Economics, 25(2): 365-388. Hodge M., Romano P.S., Harvey D., Damuels S.J., Olson V.A., Sauve M., and Kravitz R.L. 2004.
Licensed Caregiver Characteristics and Staffing in California Acute Care Hospital Units. Journal of Nursing Administration, 34(3): 125-133.
Kravitz, R.L. and Sauve, M.J. 2002. Hospital Nursing Staff Ratios and Quality of Care: Final Report on
Evidence, Administrative Data, and Expert Panel Process, and a Hospital Staffing Survey. UC Davis. Prepared for California Department of Health Services.
Lankshear, A.J., Sheldon, T.A., and Maynard, A. 2005. Nurse Staffing and Healthcare Outcomes: A
Systematic Review of the International Research Evidence. ANS Advances in Nursing Science, 28: 163-174.
Lichtig, L.K., Knauf, R.A., and Milholland, D.K. 1999. Some Impact of Nursing on Acute Care Hospital
Outcomes. Journal of Nursing Administration, 29(2): 25-33. Naylor, M.D. 2007. Advancing the Science in the Measurement of Health Care Quality Influenced by
Nurses. Medical Care Review and Research, 64(2): 144S-169S. Needleman, J., Buerhaus, P., Mattke, S., Stewart, M., and Zelevinsky, K. 2002. Nurse Staffing Levels
and the Quality of Care in Hospitals. The New England Journal of Medicine, 346(22): 1715-1722.
Needleman, J., Kurtzman, E.T., and Kizer, K.W. 2007. Performance Measurement of Nursing Care:
State of the Science and the Current Consensus. Medical Care Research and Review, 64(2): 10S-43S.