the efectiveness of gallery walk - iain ponorogo
TRANSCRIPT

THE EFECTIVENESS OF GALLERY WALK
TECHNIQUE TO THE STUDENTS’ SPEAKING
SKILL IN EIGHT GRADES OF SMP N 1
BABADAN
THESIS
BY
ERIKA RIYANTI
210915039
ENGLISH EDUCATION DEPARTMENT
FACULTY OF TARBIYAH AND TEACHING
TRAINING
STATE INSTITUTE OF ISLAMIC STUDIES
PONOROGO
2019

ABSTRACT
RIYANTI, ERIKA. 2019. The Effectiveness of Gallery
Walk Technique to the Students’ Speaking Skill in
Eight Grades at SMPN 1 Babadan, Thesis, English
Education Department, Tarbiyah Faculty, State
Institute for Islamic Studies of Ponrogo (IAIN),
Ponorogo. Advisor Dr. Dolar Yuwono, M. Pd
Keywords: Gallery Walk, Speaking Skill
Speaking is one of the basic language skills that
must be mastered by students. Trough speaking the
students are able to express their idea and interact with
each other in conversation. In fact, most students have a
problem related to speaking skill. They complained that
they have nothing to say, they have no motivated to
express themselves because feeling guilty to speak. With
Gallery Walk, they can go around the class, view the
ideas of each group, create ideas, and present in front of
the class. they can interact and communicate with their
friends. It makes students more confident in making
conversation. The objective of this research was to know
about the Effectiveness of Gallery Walk to teach
speaking skill at eighth graders at SMPN 1 Babadan in
the academic year 2018/ 2019.
The research applied a quantitative approach and
used a quasi-experimental design. In this research, the
researcher used two class which are taught by using
different strategies. The experiment class was taught
using Gallery Walk technique and control class was
taught by using lecturing, question and answer strategy.
The population was a student of SMPN 1 Babadan which
consist of 160 students. The sample is 51 students

(25experimental classes, 26 control classes). The data
were gathered though test. This research was conducted
by the following procedure: giving pre- test, applying the
treatment, and giving post- test.
After getting the score of the test, the data were
analyzed and processed by using the T- test formula by
using SPSS. The result of this research showed that the
average of pre- test of an experimental class was 48,6 and
the average post- test is 66,00. The value of t test = 3,362
was consulted with 5% significant level with df 49, that
is 2,01 (t test> t table). So, Ha is accepted and H0 is
rejected.
So, it can be concluded that there is a significant
different on students' speaking skill that is taught by
using Gallery Walk. In other words, Gallery Walk is
effective on students' speaking skill of eighth-grade
students at SMPN 1 Babadan. It becomes important for
the teachers to increase and to develop their ability in
teaching. The teacher should be able to use the
appropriate technique in learning English, especially in
learning speaking to make the students are more
motivated in learning speaking.


CHAPTER I
INTRODUCTION
A. Background of the Study
Language is an essential tool to
communicate for human in any aspect of
activities. It is principle thing for human to
communicate and interact with others as
Pinker in Brown, language is complex,
specialized skill, which develops in the child
spontaneously, without conscious effort or
formal instruction, is deployed without
awareness of its underlying logic, is
qualitatively the same in every individual, and
is distinct from more general abilities to
process information or behave intelligently.1
1 H. Douglas Brown, Principles of Language Learning and
Teaching, (USA: Pearson Education, Inc, 2007), 5th Ed, 7.

Based on the definition, it seems that the
function of language is crucial in our daily
life, through language people can express
their thought, feeling, and concept.
There are many languages in the
world. English is one of the languages that is
applied as an International language. English
is one of the most widely used International
languages because most of the world
population use English to communicate with
people from a different country. English is
used for daily conversation, education,
research, and science. When someone is
learning English, they will know the
development of knowledge, education,
technology, and science because many of
book, journal, and literature were written in

English. From this function, learning English
is important. In Indonesia, English is the main
foreign language because it is used to
communicate, to be learned, and to be taught
in educational institutions, from kindergarten
to university level.
English is supported by four major
skills that should be mastered. They are
listening, reading, speaking, and writing. The
productive skills of speaking and writing
allow us to hear and see the process as it is
performed. And reading and listening belong
to receptive skill.2 Speaking is one of the
skills that has high difficulty for students. It is
because the different pronunciation, even the
accent. Florez stated as quoted in Achmad,
2 H. Douglas Brown, Language Assessment: Principle and
Classroom Practice, (New York: Longman. Inc., 2003), 116.

“Speaking is a key to communicate”.3 From
those statement, speaking is considered as one
of abilities which important to be learned by
the students since its key to understand what
people say in English. Speaking skill is
observed as difficult to be maintained. It was
reflected from students’ ability to
communicate in English. The students tended
to be silent in the classroom because they lack
self- confidence. Students also more need
practice since through practice students could
learn to express their feeling, emotion,
thought, and their intention.
Based on the observation when the
researcher taught in the classroom, there were
many reasons that students less in speaking. It
3 Achmad, “The Use of Role- Play to Motivate the Students
to Speak: A class experience,” Jurnal Humaniora, Sains. Pendidikan
Pengajaran, 1 (November, 2012), 1.

may be caused by the students’ shy or lack of
self—confidence to speak English. They often
complained that they have nothing to say,
they have no motivated to express themselves
because feeling guilty to speak. They did not
use English in daily life although in giving
gratitude and meeting. Then, According to
Penny Ur, there are some difficulties in
English speaking such as fear of making
mistakes, shyness, students’ have no
motivation, lack of vocabulary, they prefer to
use their mother tongue and tend to have low
participants in the class.4
As a teacher, after knowing and
learning students’ difficulties in speaking, the
teacher should help students to solve their
4 Ur, Penny, A Course in Language Teaching. Practice and
Theory. (Cambridge: Cambridge University Press. 1996), 21.

problem. One of the ways to help students is
applying an appropriate technique in the
classroom which can make the students
interested to start to speak in English. There
are many techniques that can be used in
teaching speaking, for examples gallery walk,
role-play, storytelling, number head together,
jigsaw, talking stick, etc. One of the
alternative techniques that can be conducted
in the classroom is a gallery walk. Gallery
walk is one of the most versatile learners-
centered activities. The gallery walks connect
learners to each other and learners to the
training topic of interesting, interactive ways.5
By using Gallery Walk in the classroom,
students are not allowed to sit because they
5 Sharon L. Bowman, The Gallery Walk: An Opening,
Closing, and Review Activity (2005), retrieved on November 27,
1018. http://www.boperson.com/BOWPERSON/GalleryWalk.pdf.

have to go around the class, view the ideas of
each group, create ideas, and present them in
front of the class. They can interact and
communicate with their friends, and they can
ask question and answer related to a related
topic. Gallery Walk can be collaborated with
various media, such as computer, carton,
paper or graph.
Therefore, this research tries to
investigate the use of gallery walk to enhance
students’ speaking skill in the second grade of
junior high school. In addition, this research
was expected that using gallery walk could
give better effect in improving students’
speaking skill, and for students, hopefully,
they can get more information and knowledge
from teaching speaking use gallery walk.

Based on the problem above the
researcher is going to conduct a research
entitled “The Effectiveness of Gallery Walk
Technique to Student’s Speaking Skill at
SMP N 1 Babadan Ponorogo”.
B. The Limitation of the Problem
Based on the background of the study that
explained above, the researcher gives
limitation of the problem that far ranging of
discussion. The limitation of study is:
1. Gallery Walk
2. Students’ Speaking Skill in Eight grades
of SMPN 1 Babadan
C. Statement of the Problem
Based on the limitation stated, the
problem could be formulated as follows:

“Is there any significant difference in
speaking achievement between students who
are taught by using gallery walk and those
who are not taught by using gallery walk?”
D. Objective of the Study
The purpose of the study is to know gallery
walk is effective for teaching speaking at the
eighth grades of Junior High School One
Babadan in Academic Year 2018/ 2019.
E. Significance of the Study
The result of the study hopefully can be useful
for
1. Theoretically
The findings of this study are expected
can enrich the theory about the using of
Gallery Walk in teaching speaking skill.
2. Practically

a. Students
By using gallery walk and picture
drawing media students will be fun and
enjoy in learning English class. If they
feel enjoy, fun and relax, the technique
will be useful for students to enhance
them in mastering their speaking ability.
b. Teachers
From this research, it is expected
to give benefit for all English teachers to
know new knowledge and information
about new technique which is appropriate
in teaching speaking skill.
c. Further researcher
This study can also be a reference
for the next researcher who want to
conduct a further research that related to

teaching speaking ability through gallery
walk.
F. Organization of the Thesis
This research will consist of five chapters.
Each chapter has different elements as
follows:

Chapter
I
: Give an explanation of the introduction.
The researcher will explain about the
general background of the study,
limitation of the study, statement of the
study, the objective of the study,
significance of the study, and
organization of the thesis.
Chapter
II
: Describes the review of related
information about galley walk technique,
theoretical background, theoretical
framework, and hypothesis. The writer
takes some books written by many
experts as references which will explain
more about gallery walk and speaking
skill.
Chapter
III
: Discusses research method. It covers the
research method, population and sample,

data collection instrument, data collection
technique, and analysis data technique.
Chapter
IV
: Presents about the implementation of the
research findings and research result. It
includes the analysis of the gallery walk
and how to enhance students’ speaking
skill in English lesson.
Chapter
V
: Consists of conclusion and
recommendation. It contains all of data
analysis and gives some suggestion of the
problem discussed. The last part is
reference and appendices.

CHAPTER II
PREVIOUS RESEARCH FINDING,
THEORITICAL BACKGROUND, THEORITICAL
FRAMEWORK AND HYPHOTHESIS
A. Previous Research Finding
a. Research Finding
This study will discuss the previous study
from another thesis. First, it was the research
arranged by Desi Lestari in 2017 conduct
research about “The Effect of Gallery Walk
Strategy on the Students’ Ability in Writing
Descriptive Paragraph at MAS Al Ihtijhadiyah,
Medan”.
The technique used in her research was
experimental research, which conducted the
experimental class and control class. The
population of research, which conducted the

students of MAS Al- Ihtijhadiyah Medan in
Academic Year 2016/ 2017, the number of
students was 39 students consist of two classes.
The experimental class XI- IPA was 19 students
and control class XI- IPS was 20 students as the
sample. The researcher gave writing test to
collect the data. The research finding shows that
there was a significant effect of gallery walk
technique on the students’ ability in writing a
descriptive paragraph at MAS Al- Ihtijhadiyah
Medan in 2016/ 2017 academic year.
From research conduct by Desi Lestari
was different from the writer. The researcher
covers the research about the effectiveness of
using gallery walk to enhance students’
speaking skill. The researcher use gallery walk
to enhance students’ skill, while previous study,

use gallery walk to enhance students’ writing
descriptive paragraph.
Second, research arranged by Devina
Nizzu in 2016 conduct research about
“Improving Students’ Speaking Skill Through
Retelling Story by Using Picture Series at
SMAN 7 Bandar Lampung”.
The method use in her research was
experimental research. The population of this
research was the seconds grade students of
SMAN 7 Bandar Lampung consisting of 36
students as experimental class, which was
selected by using lottery. Speaking test was
used to collect in her research. The result
showed that the students’ mean score of pre-
tests was 59.16 and their score of post- tests
after the implementation of retelling story by

using picture series was 67. 86, in which gain
amounted 8.70. It can be concluded that
retelling stories using picture series could be
used to improve students’ speaking skills.
The study conducted by the researcher for
her thesis was different from the previous
research. The researcher use gallery walk to
enhance students’ speaking skill, while previous
study uses picture series to improve students’
speaking skill.
B. Theoretical Background
1. Gallery Walk
a. Gallery Walk
The gallery walk is a
powerful opening, closing, or
review activity. In this activity,
participants write on various

pieces of chart paper that you’ve
taped to the training room walls.
With the gallery walk, you can
gather a lot of learners- created
information in a little time.6 While
Fox and Hoffman said that gallery
walks in the social studies
classroom are a way for students to
become actively involved in
gathering, organizing, and sharing
information. Gallery walks also get
students out of their chairs and
actively involve them in
synthesizing important concepts in
consensus building, writing, and
6 Sharon L. Bowman, The Ten- Minute Trainer: Ways
to Teach It Quick and Make It Stick, (San Francisco: Pfeiffer A
Wiley Imprint: 2005), 93.

public speaking.7 While Jennings
and Caulfield (2005) stated as
quoted by Chintis Depega, Gallery
Walks is a way to students add
comments. Answer, or solution to
posed question or topics written on
newsprint mounted on the wall by
circulating clockwise around the
room.8 It means that Gallery Walks
can give more chance for students
to actively participate in the class.
b. Gallery Walk in Teaching
Speaking
7Jenifer Fox, Whitney Hoffman, The Differentiated
Instruction: Book of List, (San Francisco: Jossey- Bass, 2011), 182. 8Chintis Depega,“Teaching Speaking by Combaining
Gallery Walk Strategy and Study Group Strategy for X Grade at
Senoir High School,” dalam Jurnal Pendidikan Bahasa Inggris,
Retrived February 25, 2019 from
https://id.portalgaruda.org/index.php?ref=browse&mod=viewaticle
=317119

Gallery walk connects learners
to each other and learners to the
training topic in a number of
interesting, interactive ways.
Bowman suggests the general
instruction for teaching gallery
walks are as follows:
1. Before the training, tape a
number of large sheets of chart
paper to the walls of the
training room. Space the charts
pages so that learners have to
walk from one chart to another.
2. Label each chart with
questions, statement, or issue
related to the topic.

3. Learners walk around the room
writing their response on the
charts.
4. Assign a direction to move or
they can move randomly. They
can do the activity as
individuals or in groups.
5. After the learners have written
on all the charts and jotting
their observation their
observations on a works sheet,
learners then spend a short
period of time in small groups
discussing their observation.
6. Finally, they discuss the
activity with the whole group.9
9 L. Bowman, Sharon. The Gallery Walk an Opening,
Closing, and Review Activity. (2005), Retrived on November

c. Steps of Gallery Walk
The steps of Gallery Walk
implementation
Source:
http://serc.carleton.edu/introgeo/galler
ywalk/what.html
1. The facilitator groups of the
students into several small group
discussions depending on the
27,2018 from
http://www.boperson.com/BOWPERSON/GalleryWalk.pdf,

number of topics explained in the
classroom meeting.
2. Each group member discusses the
topic given.
3. The group conclusion is written on
the flipchart and then posted on the
classroom wall.
4. After posting, the facilitator invites
all group members to stand in front
of their posted paper.
5. The facilitator begins to deliver the
instructions that all group
members will visit other groups
papers and observe, think critically
as well as.
6. The visit will come to an end when
all group members arrived back in
their paper.10
2. Speaking
a. Definition of Speaking
Speaking is considered as one of
the most important and essential skills
that must be practiced communicating
orally. By speaking, people are able to
know what kinds of situations the
world, are easier to communicate with
each other. Nunan informs that
speaking is a part of the productive
skill in English language teaching and
10 Muhammad Ridwan, Gallery Walk; An Alternative
Learning Strategy in Increasing Students’ Active Learning,
Makassar, 2015, Retrived on December 13, 2018 from
http://repository.unhas.ac.id/bitstream/handle/123456789/18762/SL
A%20Paper.pdf?sequence=1.

it consists of producing systematic
verbal utterance to convey meaning.11
As state by Chaney which is
quoted by Kayi, speaking is the
process of building and sharing
meaning through the use of verbal and
non- verbal symbols, in a variety of
contexts.12 So, speaking is an
interactive process of constructing
meaning that involves producing and
receiving processing information.
b. Teaching Speaking
Speaking is generally known as the
process of building and sharing
11 Kathleen M. Bailey, Practical English Language
Teaching: Speaking (Singapore: McGraw Hill Companies, 2004), 2. 12Hayriye, Kayi, Teaching Speaking: Activities to
Promote Speaking in a Second Language, (Nevada, 2006), retrieved
on December 8, 2018 from http://iteslj.org/Articles/Kayi- Teaching-
Speakig.html

meaning through the use of verbal and
non- verbal symbols, in a variety of
contexts. Speaking is a crucial part of
second language learning and
teaching. Teaching speaking is that
teachers should provide something for
learners to talk.13
What is meant by teaching
speaking is to teach EFL learners to:
1. Produce the English speech sounds
and sound patterns.
2. Use word and sentence stress,
intonation patterns and the rhythm
of the second language.
13 Hayriye, Kayi, Teaching Speaking: Activities to
Promote Speaking in a Second Language, (Nevada, 2006), retrieved
on December 8, 2018 from http://iteslj.org/Articles/Kayi-
Teaching-Speakig.html

3. Select appropriate words and
sentences according to the proper
social setting, audience, situation
and subject matter.
4. Organize their thought in a
meaningful and logical sequence.
5. Use language as a means of
expressing values and judgments.
6. Use of the language quickly and
confidently with new unnatural
pauses, which is called as fluency.
Speaking is an interactive task and
it happens under real time processing
constraints. It means that they will be
able to use words and phrase fluently

without very much conscious
thought.14
c. The roles of the Teacher in
Speaking
During speaking activities,
teachers need to play number of
different roles. They can be prompter,
participant, even feedback provider as
view by Jeremy Harmer as follows:
a. Prompter
Students sometimes get lost,
cannot think of what to say next,
or in some other way lose the
fluency we expect of them.
Teacher can leave them to struggle
out of such situation on their own,
14 Feri Huda, “Teaching Speaking Using Describe and Draw
Picture,” Cakrawala Pendidikan, 2 (Oktober, 2015), 159.
and indeed sometimes this may be
the best option. However, teacher
may able to help students and the
activity to progress by offering
discrete suggestion.
b. Participant
Teachers can join in a
discussion with the students. As a
participant the teacher can prompt
secretly, introduce new
information, ensure continuing
students’ involvement and
maintain a creative atmosphere.
However, the teacher should be
very careful that they do not
participate to much or dominate
the discussion.

c. Feedback provider
In giving feedback. Teachers
should be very careful because
over- correction may restrain them
and take the communicativeness
out of the activity.
On the other hand, helpful and
gentle correction may get students
out of difficult misunderstanding
and hesitation. Everything depends
upon teacher’s tact and the
appropriacy of the feedback
given.15
d. Element of Speaking
Jeremy Harmer identifies that
the ability to speak in English
15 Jeremy Harmer. The Practice of English Language
Teaching. (UK: Longman, 2001), 275- 276.

needs the elements necessary for
the spoken production as the
following:
a. Language Features
1) Connected speech is
effective speakers of
English need to be able not
only to produce the
individual phonemes of
English but also the use of
fluent connected speech. In
connected speech sounds
are modified, omitted,
added or weakened.
2) Expensive device: native
speaker of English changes
the pitch of particular part

of utterance, vary volume
and speed, and show by
other physical and
nonverbal means how they
are feeling (especially in
face to face interaction)
3) Lexis and grammar:
teachers should therefore
supply a variety of phrase
for different function such
as agreeing or disagreeing,
expressing surprise, shock
or approval.
4) Negotiation language:
effective speaking benefits
from the negotiator
language we use to seek
clarification and show the
structure of what we are
saying. We often need to
ask for clarification when
we are listening to
someone else talks and it is
very crucial for students.
b. Mental/ social processing
1) Language processing:
effective speaker needs to
be able to process language
in their own heads and put
it into coherent order so
that it comes out in forms
that are not only
comprehensible, but also
convey the meanings that

are intended. Language
processing involves the
retrieval of words and their
assembly into syntactically
and propositionally
appropriate sequence.
2) Interacting with others:
effective speaking also
involves a good deal of
listening, and
understanding of how the
other participants are
feeling, and knowledge of
how linguistically to take
turns of allow others to do
so.
3) (On the spot) information
processing: quite apart
from our response to
others’ feeling, we also
need to be able to process
the information they tell us
at the moment we get it.16
e. The calculated is used to measure
speaking skill
Speaking can be assessed by
asking students questions and
involving them in conversation. You
can assess students by asking specific
questions during class, and by talking
to them personally. When assessing
16 Jeremy Harmer. The Practice of English Language
Teaching. (UK: Longman, 2001), 269- 271.

students' oral skills, you might want to
use analytical or holistic rubrics. The
following is a rubric for assessing
students' speaking skills:
Table 2.1 Analytical Oral
Assessment by Caroline T. Linse17
Aspect Sc
ore
Criteria
Gramm
ar
1 Errors in grammar and word order so
severe as to make unintelligible.
2 Grammar and word order errors make
comprehension difficult. Must often
rephrase and/or restrict him/herself to
basic patterns.
3 Makes frequent errors of grammar and
word order that occasionally obscure
meaning.
4 Occasionally makes grammatical and/or
word order errors that do not obscure
meaning.
5 Grammar and word order approximate
that of a native speaker.
17 Caroline T. Linse, Practical English Language Teaching:
Young Learners (New York: McGraw Hill Companies), 149.
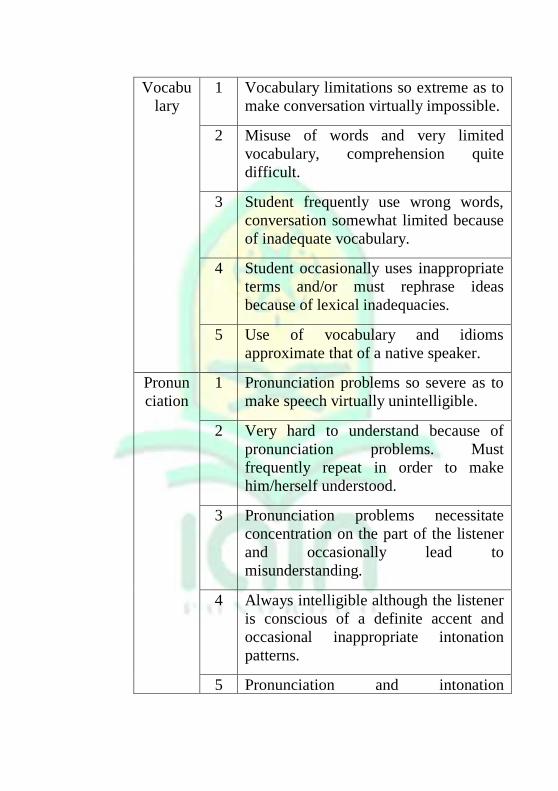
Vocabu
lary
1 Vocabulary limitations so extreme as to
make conversation virtually impossible.
2 Misuse of words and very limited
vocabulary, comprehension quite
difficult.
3 Student frequently use wrong words,
conversation somewhat limited because
of inadequate vocabulary.
4 Student occasionally uses inappropriate
terms and/or must rephrase ideas
because of lexical inadequacies.
5 Use of vocabulary and idioms
approximate that of a native speaker.
Pronun
ciation
1 Pronunciation problems so severe as to
make speech virtually unintelligible.
2 Very hard to understand because of
pronunciation problems. Must
frequently repeat in order to make
him/herself understood.
3 Pronunciation problems necessitate
concentration on the part of the listener
and occasionally lead to
misunderstanding.
4 Always intelligible although the listener
is conscious of a definite accent and
occasional inappropriate intonation
patterns.
5 Pronunciation and intonation

approximate that of a native speaker.
Fluency 1 Speech is halting and fragmentary as to
make conversation virtually impossible.
2 Usually hesitant; often forced into
silence by language limitations.
3 Speech in everyday conversation and
classroom discussion frequently
disrupted by the student’s search for the
correct manner of expression.
4 Speech in everyday conversation and
classroom discussion generally fluent,
with occasional lapse while the student
searches for the correct manner of
expression.
5 Speech in everyday conversation and
classroom discussion fluent and
effortless; approximating that of a
native speaker.
C. Theoretical Framework
Theoretical framework is a
concept in the thesis about how
theorist can be related to the
factors which are identified as

important problems. This research
has two variables, independent and
dependent. And X and Y symbols
are used to distinguish between
two sentences, symbol X used for
independent and symbol Y used to
dependent, such as:
X : Speaking Skill
Y : Gallery Walk
D. Hypothesis
The hypothesis of the result study is formulated
as follows:
Ha : there is a significant different
achievement in teaching speaking skill
between students who are taught by using
Gallery Walk and the students who are
taught without using Gallery Walk at the

eighth grade of Junior High School One
Babadan.
Ho : there is no significant different
achievement in teaching speaking skill
between students who are taught by using
Gallery Walk and the students who are
taught without using Gallery Walk at the
eighth grades of Junior High School One
Babadan.

CHAPTER III
RESEARCH METODOLOGY
The existence of the research
method has a goal of guiding, the
researcher order to work systematically.
The research methodology covers a set
of research activities conducted by
researcher. It involves research design,
population and sample, instrument of
data collection, technique of data
collection, and technique of data
analysis.
A. Research Design
There is various design in a
research. In this study, researcher use
quantitative research methods.
Quantitative research is explaining
phenomena by collecting numerical data
that are analyzed used mathematically
based methods in particular statistics.18 It
means, to analyze the data the researcher
used statistical calculation.
In this research, the researcher
applied experimental research.
Experimental research is an
experimental method is find the effect of
treatment toward something in
controlled condition.19According to
Cook and Campbell, experimental
research is all experiments involve at
least a treatment, an outcome measure,
units of assignment, and some
18 Daniel Muijs, Doing Quantitative Research in Education
with SPSS (London: Sage Publication Ltd, 2004), 1 19 Sugiyono, Metode Penelitian Pendidikan: Pendekatan
Kuantitatif, Kualitatif, dan R&D (Bandung: Alfabeta, 2008), 107.

comparison from which change can be
interfered and hopefully attribute to the
treatment.20 This research will have two
classes, one class as experiment and the
others as control class. The process of
this research includes pre-test,
experimental treatment, and post-test.
The researcher teaches the students in
the experimental class by using Gallery
Walk technique. And for the control
class, the researcher taught by traditional
teaching, explain the material and giving
question. Pre-test is given before the
treatment to measure their speaking
ability. And for the post-test is given
after the researcher gives a treatment to
20 Dale T. Griffe, An Introduction to Second Language
Research Methods: Design and Data (America, 2012), 71.
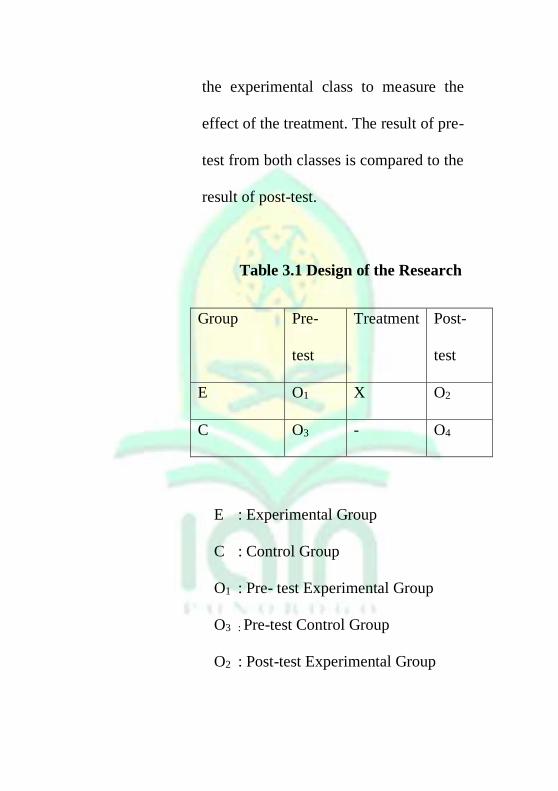
the experimental class to measure the
effect of the treatment. The result of pre-
test from both classes is compared to the
result of post-test.
Table 3.1 Design of the Research
Group Pre-
test
Treatment Post-
test
E O1 X O2
C O3 - O4
E : Experimental Group
C : Control Group
O1 : Pre- test Experimental Group
O3 : Pre-test Control Group
O2 : Post-test Experimental Group

O4 : Post-test Control Group
B. Population and Sample
1. Population
Before conducting the
observation, the researcher needs to
determine the population. According
Fred N. Kerlinger, population is
defined as all members of any well-
defined class people, event or
object.21 A population is a group of
individuals who have the same
character. For example, all teachers
would make up the population of
teachers, and all high school
administrator in a school district
21 John W. Creswell, Research Design Qualitative,
Quantitative, Direct Methods Approach, (United Kingdom: Sage
Publication, 2009), 160.

would comprise the population of
administrators.22From those
statement, population is all of the
students will be observed by the
researcher. Population is also the
whole object that the researcher
wants to search which has specific
characteristics. The population of
this research is taken from the
eighth-grade students ‘of SMPN 1
Babadan. The eight-grade student of
SMPN 1 Babadan consists of 6
classes: VIII A, B, C, D, E, and F in
academic years 2018/2019. Each
class consist of 25 students.
22John W. Creswell, Educational Research: Planning,
Conducting, and Evaluating Quantitative and Qualitative Research,
(Boston: Addison Wesley, 2011), 4th Ed., 142

2. Sample
A sample is a subgroup of the
target population that the researcher
plans to study for generalizing about
the target population.23 The sampling
technique applied in this was cluster
random sampling. Cluster random
sampling or sample area (group) is
ideal when it is impossible or
impractical to compile a list of the
elements composing the
population.24The researcher chooses
this sampling technique because
cluster random sampling was easier
in the implementation and
23 John W. Creswell, Research Design Qualitative,
Quantitative, Direct Methods Approach, 142. 24 John W. Creswell, Educational Research: Planning,
Conducting, and Evaluating Quantitative and Qualitative Research,
148.
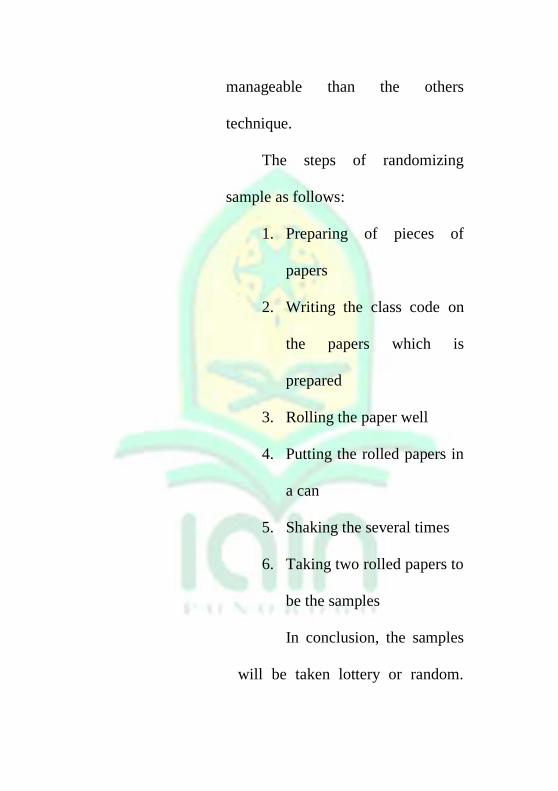
manageable than the others
technique.
The steps of randomizing
sample as follows:
1. Preparing of pieces of
papers
2. Writing the class code on
the papers which is
prepared
3. Rolling the paper well
4. Putting the rolled papers in
a can
5. Shaking the several times
6. Taking two rolled papers to
be the samples
In conclusion, the samples
will be taken lottery or random.

The two class are the class VIII D
as the experiment class and class
VIII F as control group.
C. Data Collection Instrument
Instrument is a tool that used by
researcher in collecting the data in order
that he or she works more easily; the
result is better, accurate, complete, and
systemic, so that the data are easy to be
processed.
Table 3.2 The Research
Instrument
Title Varia
ble
Indicat
ors
Instrum
ent
Item
of
instru
ment

The
Effecti
veness
of
Gallery
Walk
Techni
que to
Student
s’
Speaki
ng
Skill at
The
Eight
Grade
of
X:
Galler
y
Walk
Y:
Speak
ing
Skill
Student
s are
able to
tell
story
about
recount
text
Perfor
mance
test
Oral/
Spoke
n
assess
ment

SMPN
1
Babada
n in
academ
ic year
2018/
2019
In this research, the
instrument of data collection is
test. The data in this research is the
result of the test and taken from
oral test. The assessment of the
speaking test is adapted from
rubric for speaking. An analytic
rubric provides information in four

categories. They are grammar,
vocabulary, pronunciation, and
fluency.
Before the instrument used
in this research, the researcher
tests the instrument with two tests,
first is validity test and second is
reliability test.
D. Validity and Reliability
1. Validity Test
To calculate the validity,
the researcher used SPSS program
or use the formula as follows:
rxy=𝑁𝛴𝑋𝑌−(𝛴𝑋)(Σ𝑌)
√(𝑁Σ𝑋2−(Σ𝑋)2(𝑁Σ𝑌2)−(Σ𝑋)2)
rxy = Digit of index Product
Moment Correlation
x = The total score X
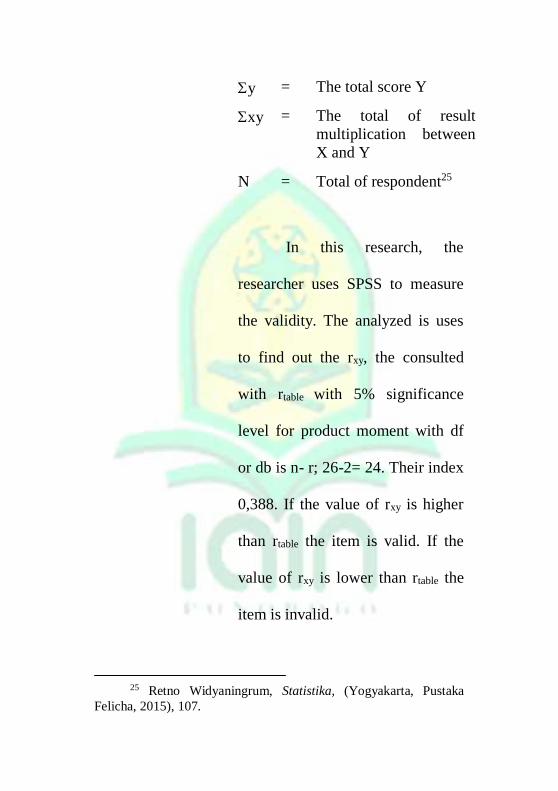
y = The total score Y
xy = The total of result
multiplication between
X and Y
N = Total of respondent25
In this research, the
researcher uses SPSS to measure
the validity. The analyzed is uses
to find out the rxy, the consulted
with rtable with 5% significance
level for product moment with df
or db is n- r; 26-2= 24. Their index
0,388. If the value of rxy is higher
than rtable the item is valid. If the
value of rxy is lower than rtable the
item is invalid.
25 Retno Widyaningrum, Statistika, (Yogyakarta, Pustaka
Felicha, 2015), 107.

To test validity and
reliability of the item, the
researcher takes sample 26
respondents from VIII E, the
researcher gave 10 question for
this class and with the speaking
scoring rubric; grammar,
vocabulary, pronunciation, and
fluency. So, the researcher
calculated the validity test from
four scoring rubrics op speaking.
From of result the test validity
instrument all question or scoring
rubric are valid. The calculation of
validity as follows:
Table 3.3 Recapitulation
Test Item Validity

Item “r”
calcul
ated
“r”
table
Expla
nation
Grammar 0, 684 0, 388 Valid
Vocabulary 0, 668 0, 388 Valid
Pronunciati
on
0, 509 0, 388 Valid
Fluency 0, 600 0, 388 Valid
2. Reliability Test
Reliability is defined as the
extent to which the results can be
considered consistent or stable.26 It
means that if the same test is tested
to some different students in two
different time, it will give the
stable result or similar result. The
technique to analyze of reliability
26 Brown, Testing in Language Programs (United States of
America: Prentice Hall Regents, 1996), 185.

of this instrument was Cronbach
Alpha coefficient.27
Table 3.4 Reliability test
Case Processing Summary
N %
Case
s
Valid 26 100.0
Exclude
da 0 .0
Total 26 100.0
a. Listwise deletion based on all
variables in the procedure.
Reliability Statistics
Cronbach's
Alpha N of Items
.419 4
Table 3.5 Test item reliable
“r”
alpha
“r”
table
Relia
ble
0, 419 0, 388 Valid
27 Brown, Testing in Language Programs, 179.

The sample is (n) eight
grade students, n= 26 and the
significance the price of r table is 0,
388. Based on the calculation
above, the reliability of students’
instrument is 0, 419. The value of
reliability is consulted “r” table on
the significance level of 5%.
Because the value of “r” index
reliability is 0,419, > “r” table
(0,388) so the test is reliable.
E. Technique of Data Collection
1. Test
The technique to collecting
data is test. Test is methods of
measuring of person’s ability,
knowledge, or performance in a
given domain. A well- constructed
test as an instalment that provides
an accurate measure of the test-
taker’s ability within a particular
domain.28 In this test, the
researcher uses subjective test. In
general, a subjective test are
questions that require students to
answer in the form of describing,
explaining, discussing, comparing,
reasoning, and other similar forms
in accordance with the demands of
the question by using words and
language itself. The number of
questions a subjective form is
usually not much, only about 5-10
28 H. Douglas Brown, Language Assessment (New York:
Longman, 2004), 3-4.

pieces of matter within
approximately 90-120 minutes.
The test in this research are
divided into two parts, pre- test
and post- post. Pre- test used to
know the students’ previous level
of speaking skill, while the post-
test used to know the students’
level of their speaking ability after
the researcher give a treatment in
teaching speaking skill. In this
research, the researcher used a test
which has been prepared by the
researcher to find out the
effectiveness of using Gallery
Walk technique to students
speaking skill of eight grade class.

The time of research is showed on
the table below:
Table 3. 6 Research Time
Date Activities
March 4th,
2019
Pre- test experiment &
control class
March 5th,
2019
First treatment experiment
class
March 18th,
2019
First meeting control class
March 18th,
2019
Second treatment
experiment class
March 21th,
2019
Second meeting control
class
March 25th,
2019
Post- test experiment and
control class
F. Technique of Data Analysis
After collecting the data by giving
pre-test and post-test to the students,

then the researcher will analyze the data.
The result of pre-test and post-test will
be analyzed by using T-test. Before
using T-test, the data will be analyzed
by using normality and homogeneity
test.
1. Normality Test
Normality test is used to know
whether the data come the
distribution or not. There are many
ways to conduct normality test, that
is Kolmogorov-Smirnov, Lilliefors,
and Chi Square.29
2. Homogeneity Test
Homogeneity means the
similarly variance of each groups, so
29 Retno Widyaningrum, Statistika (Yogyakarta: Pustaka
Felicha, 2014), 204.

the researcher will face with groups
that have same condition from the
beginning.30 In experimental
research, homogeneity is used to
know whether experiment and
control class that are taken from
population have same variant or not.
The formula of homogeneity
test as follows:
F=𝑉𝑎𝑟 𝑀𝑎𝑥
𝑉𝑎𝑟 𝑀𝑖𝑛=
𝑆𝐷2 𝑀𝑎𝑥
𝑆𝐷2 𝑀𝑖𝑛
3. T- test
After testing of normality
and homogeneity, the researcher
continues to analyze the data by
using T- test. T-test is to determine
30 Retno Widyaningrum, 203.

whether the mean of two groups
are statistically different from one
another. In T-test researcher
analyze the data by comparing the
score between experimental and
control class in pre-test and post-
test. The result of the calculation
will show whether Gallery Walk
Technique is effective in teaching
speaking or not.
T = 𝑀1−𝑀2
𝑆𝐸 𝑚1−𝑚2
T : The value of T
M1 : Mean variable
of experiment
group
M2 : Mean variable
of control
group

After
calculating the T value, the researcher
proposed the alternative hypothesis
(ha) and null hypothesis (ho) which is
described as follows:
Ho: If T test < T table in significant
degree 5%
Ha: If T test > T table in significant
degree 5%
Meanwhile, the degree of freedom
(df)= (N1+ N2) – 2
SE M1-
M2
: Difference of
standard error
between
experiment and
control group

CHAPTER IV
FINDING AND DISCUSSION
In this chapter, the researcher will discuss about
data description, analysis of the data, discussion and
interpretation.
A. Research Location
1. Historical
SMPN I Babadan is one of
education institutions in Kecamatan Babadan
Ponorogo. It has stood and operated on 1983.
This school occupies an area 10.200 m2.
SMPN I Babadan has 24 classrooms. This
school used 2013 curriculum. This curriculum
was developed from the standard of content
by school based on their content and

potentials. They improved the curriculum
based on demands of the times. The
headmaster which lead at SMPN I Babadan is
Mr. Imam Saifudin
2. Geographical Location
SMPN 1 Babadan is located on Jl.
Teuku Umar, Babadan Village, Babadan Sub-
District, Ponorogo District, Postal Code
63491.
3. Vision and Mission of SMPN 1 Babadan
a. Vision
Very good in achievement, knowledge,
and technology, culture and caring for the
environment based on faith and piety.
b. Mission
1. Develop active, creative, innovative
and fun learning programs

2. Develop students' potential through
ICT-based learning
3. Develop the potential of students in
the fields of sports and art
4. Creating discipline, order, cleanliness,
noble character and noble character
5. Establish a good and synergic
relationship between local residents,
agencies and the community
c. Motto
Build togetherness to create a school that
is conducive, aspirational and innovative
B. Data Description
In this research, the researcher used quasi-
experimental where the researcher took two
groups of students’ samples. Then, they are taught
by using different treatment to find out the

effectiveness of certain treatment. In this
research, the researcher took the eight class of
SMP N 1 Babadan Ponorogo as population. Then
the researcher took two classes as a sample, one
class as control groups, and one class as an
experimental class. The total number of students
from two classes is 51 students, the experimental
class consisted of 25 students and control class
consisted of 26 students. In experiment class, the
students were taught by using the Gallery Walk
technique, while in the control class the students
were not taught by using Gallery Walk. At the
end of the research, the researcher wants to
compare the result of the test between students
are taught using Gallery Walk and students are
not taught using Gallery Walk.

1. The procedure of the research in
experimental class and control class
In the experimental class,
the researcher taught the students
by using the Gallery Walk
technique. The learning process
was done in a set of the learning
process involved in this study pre-
test, first treatment, second
treatment, post-test.
While in control class, the
researcher did not teach the
students by using Gallery Walk,
but the researcher using lecturing
technique then using question and
answer strategy. The researcher
gave an explanation about the
recount text to the students during
the class. If there is something that
students did not understand the
material, they can ask some
questions to the teacher and the
teacher will give the answer. The
learning process was done in a set
of the learning process involved in
this study such as pre-test, first
meeting, second meeting, and
post- test.
Before giving the treatment
in each class, the researcher gave
the pre- test to both classes to
know the condition in each class.
The form of pre- test was an oral

test. This test from recount text
themed holiday.
After giving treatment by
using the Gallery Walk technique,
the researcher held post- test for
both experiment class and control
class. It was aimed to know
students’ achievement after giving
treatment. The item tests the same
for both classes. That is an oral test
form of recount text.
2. Students’ Speaking Test Score in
Experiment Class
A. The result of students’ speaking
skill of pre- test in Experiment
Class (VIIID)

The table below showed the score
of pre- tests of students who are
taught using Gallery Walk
Table 4.1 Pre- test Experiment Class
Nama
Aspect Total G
ramm
ar
Vocab
ulary
Pro
nunciatio
n
Flu
ency
Afifah Adilah
Pringgandini
5 20 20 10 55
Amelia Nia
Agustin
5 20 20 15 60
Anizza Nur
Safira
10 15 15 15 55
Aqila Putri
Fania
10 20 10 10 50
Diah Febiani 5 15 10 10 40
Diki Prasetya 5 20 10 10 45
Endang Nur
Cahyaningtyas
5 10 10 10 35
Erika Dewi
Nur Ngaeni
5 20 10 10 45

Feri Setiawan 5 15 10 10 40
Gita Melinda
Wardani
5 15 5 5 30
Hamdhani
Akila
Hermansyah
5 10 10 10 35
Heri Prabowo 5 15 10 10 40
Ilham
Prasetyo
5 20 10 10 45
Jenisa
Pandawik
5 10 20 20 55
Kamzing Eka
Pratama
5 15 10 10 40
Oktaviana
Abel
Romadhoni
5 15 20 20 60
Popy Dea
Apriliasari
5 10 20 20 55
Putri Meilita
Kumala Sari
5 15 15 15 50
Putri
Wulandari
10 10 20 20 60
Ramanda
Perdana Putra
5 10 20 20 55
Regeta Nur
Cahyani
10 20 10 10 50
Tiara Agung
Chandra K.
4 15 10 10 45

Tiya Rizqi
Ramadhani
5 10 20 20 55
Trisna
Alfiditya Putri
5 20 20 15 60
Tuti
Apriliasari
5 10 20 20 55
Total 1215
Mean 48,6
From the table above, could be
seen that pre- test of the students who
taught using Gallery Walk were
varieties. There were 4 students got 60,
7 students got 55, 3 students got 50, 4
students got 45, 4 students got 40, 2
students got 35, 1 student got 30.

4.2.Histogram for The Pre- test
for Students Who are Taught
by Using Gallery Walk in
VIII D.
B. The result of students’ speaking
skill of post- test Experiment Class
(VIIID)
The table below showed the score
of post- tests of students who are
taught using Gallery Walk
Table 4.3 Post- test Experiment Class

Nama
Aspect Total
Gram
mar
Vocab
ulary
Pro
nunciatio
n
Flu
ency
Afifah Adilah
Pringgandini
10 20 20 20 70
Amelia Nia
Agustin
20 20 20 20 80
Anizza Nur
Safira
15 20 20 20 75
Aqila Putri
Fania
15 15 20 20 75
Diah Febiani 15 20 20 20 65
Diki Prasetya 15 15 15 15 60
Endang Nur
Cahyaningtyas
5 10 20 20 55
Erika Dewi
Nur Ngaeni
15 20 20 15 70
Feri Setiawan 15 20 10 10 55
Gita Melinda
Wardani
15 20 15 10 60
Hamdhani
Akila
Hermansyah
10 10 10 10 40

Heri Prabowo 15 15 20 10 60
Ilham
Prasetyo
15 20 15 15 65
Jenisa
Pandawik
10 10 20 20 60
Kamzing Eka
Pratama
10 10 15 15 50
Oktaviana
Abel
Romadhoni
15 20 20 15 70
Popy Dea
Apriliasari
15 20 20 20 75
Putri Meilita
Kumala Sari
20 20 20 15 75
Putri
Wulandari
15 15 20 20 70
Ramanda
Perdana Putra
10 20 15 15 60
Regeta Nur
Cahyani
10 20 10 10 50
Tiara Agung
Chandra K.
15 15 20 20 70
Tiya Rizqi
Ramadhani
20 20 20 20 80
Trisna
Alfiditya Putri
15 25 20 20 80
Tuti
Apriliasari
15 15 25 25 80

Total 1660
Mean 66,4
From the table above, could be
seen that the post- test of the students
taught using Gallery Walk was
varieties. There were 4 students got 80,
4 students got 75, 5 students got 70, 2
students got 65, 5 students got 60, 2
students got 55, 2 students got 50, 1
student got 40. So, we can conclude
that post-test of the students who are
taught using Gallery Walk is better than
pre- test. The total score post-test in
experiment class is 1660 with the mean
is 66,4.

4.4 Histogram for The Post- test
for Students Who are Taught
by Using Gallery Walk in VIII
D.
C. The Result of Students Speaking
Skill of Control Group (VIII F)
The table below showed the score
of pre- tests of students who are
not taught using Gallery Walk
Table 4.5 Pre- test of
Control Group
Nama
Aspect Total
Gram
mar
Vocab
ulary
Pro
nunciatio
n
Flu
ency
Abdul Aziz 5 10 10 10 35
Adib Gilang
Ramadan
5 10 10 5 30
Afif
Muhammad
Maulana
5 15 5 5 35
Andre Risky
Setiawan
5 15 5 5 40
Bimo
Brahman Tyo
S.
5 10 10 10 35
Devira
Saputri
10 10 10 10 40
Dona Dwi
Luvita S.
10 15 10 10 45
Eko Budi
Cahyono
5 10 10 5 30
Elsya Nuraini
F.
5 15 10 10 50
Elsya
Safitriane
10 20 15 10 55
Erika Novita 5 20 10 10 45

Sari
Ersa Venanda
Maysadani
5 5 25 15 50
Fani Cahya
Widyiana
5 20 15 15 55
Fidela
Maharani
Angelica
10 20 15 15 60
Fina Cahya
Widyiana
5 20 15 10 50
Gischa
Alyssa
Ananta
5 20 15 15 55
Heri
Purnairawan
5 15 10 10 40
Irma Fatma
Wandari
5 20 10 10 45
Khoirin Erfin
Aria F.
5 10 10 10 35
Nike
Widyaningsih
5 20 15 10 50
Septian M.
Saputra
5 15 10 10 40
Siti
Qomariyah
10 15 15 10 50
Surya Adi
Saputra
5 15 15 10 45
Whensen
Bagus Priyo
5 10 10 15 40

P.
Yoga
Firmansyah
5 10 10 10 35
Ageng Suto
Wiyoso
5 15 10 10 40
Total 1130
Mean 43,46
From the table above, we
can see that the pre- test of
students who are not taught using
Gallery Walk was varieties. There
was 1 student who gets 60, 3
students got 55, 5 students got 50,
4 students got 45, 6 students got
40, 5 students got 35, 2 students
got 30. So that could be concluded
the pre- test of students who are
not taught using Gallery Walk was
moderate. The total score of pre-
test control class is 1130 with the
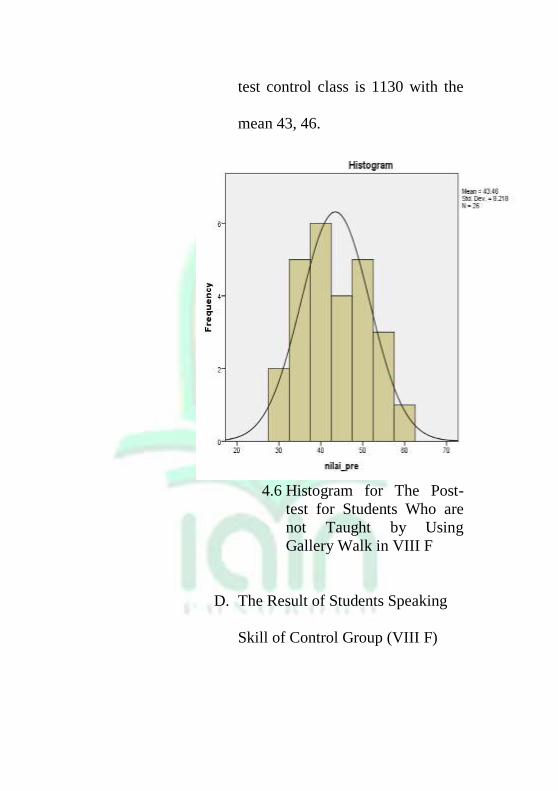
mean 43, 46.
4.6 Histogram for The Post-
test for Students Who are
not Taught by Using
Gallery Walk in VIII F
D. The Result of Students Speaking
Skill of Control Group (VIII F)

The table below showed the score
of post- tests of students who are
not taught using Gallery Walk
Table 4.7 Post-test of control
class
Nama
Aspect
Total
Gram
mar
Vocab
ulary
Pro
nunciatio
n
Flu
ency
Abdul Aziz 10 10 15 15 50
Adib Gilang
Ramadan
10 15 10 10 45
Afif
Muhammad
Maulana
10 10 15 15 50
Andre Risky
Setiawan
10 15 15 15 55
Bimo
Brahman Tyo
S.
10 10 10 10 40
Devira
Saputri
10 15 15 15 55

Dona Dwi
Luvita S.
10 20 15 15 60
Eko Budi
Cahyono
5 15 10 10 35
Elsya Nuraini
F.
10 20 15 15 60
Elsya
Safitriane
15 15 15 15 60
Erika Novita
Sari
15 20 20 20 65
Ersa Venanda
Maysadani
10 10 20 20 60
Fani Cahya
Widyiana
15 15 20 20 70
Fidela
Maharani
Angelica
15 20 20 20 75
Fina Cahya
Widyiana
10 10 20 20 60
Gischa
Alyssa
Ananta
10 20 20 20 70
Heri
Purnairawan
10 15 10 10 45
Irma Fatma
Wandari
10 20 15 15 60
Khoirin Erfin
Aria F.
5 20 10 10 45
Nike 10 20 20 20 70

Widyaningsih
Septian M.
Saputra
10 15 15 10 50
Siti
Qomariyah
10 15 15 15 55
Surya Adi
Saputra
10 10 15 15 50
Whensen
Bagus Priyo
P.
10 20 15 10 55
Yoga
Firmansyah
10 10 15 15 50
Ageng Suto
Wiyoso
5 20 15 15 55
Total 1445
Mean 55,57
E. Data Analysis
Before testing the
hypothesis, the data most fulfill the
assumption in which the data must
be normally distributed and
homogeneous. Therefore,
normality and homogeneity test be
provided.
1. Normality
Normality test is
used to know whether the
data come to the
distribution or not. There
are many ways to conduct
a normality test, that is
Kolmogorov- Smirnov,
Lilieforsc, and Chi-
Square.31 In this study, the
researcher uses SPSS
program version 23 with
31 Retno Widyaningrum, Statistika ( Yogyakarta: Pustaka
Felicha, 2004), 204.

Kolmogorov- Smirnov to
analyze the normality.
a. Normality test of
experiment class
Table 4.8 Normality
Test for Experiment
Class
One-Sample Kolmogorov-Smirnov
Test
Unstandardi
zed Residual
N 25
Normal
Parameter
sa,b
Mean .0000000
Std.
Deviation 7.68733694
Most
Extreme
Difference
s
Absolute .156
Positive .097
Negative -.156
Test Statistic .156
Asymp. Sig. (2-tailed) .119c
a. Test distribution is Normal.
b. Calculated from data.

c. Lilliefors Significance Correction.
Based on the
calculation of SPSS
version 23 above, it can
be seen that the test used
a one-sample
Kolmogorov- Smirnov
test. The data of
experiment group is
normality distributed. It
can be seen from the
value of Sig. (2-tailed)
that is higher than a (0,
199 > 0,05).
b. Normality test of
control class
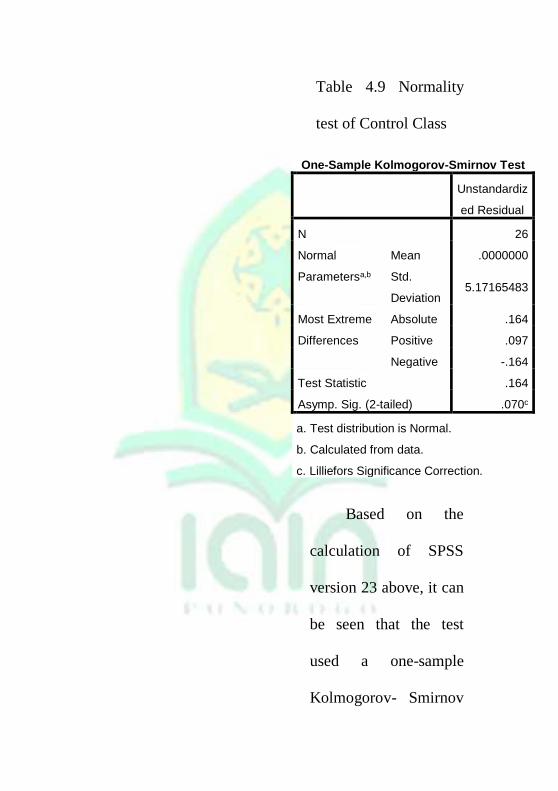
Table 4.9 Normality
test of Control Class
One-Sample Kolmogorov-Smirnov Test
Unstandardiz
ed Residual
N 26
Normal
Parametersa,b
Mean .0000000
Std.
Deviation 5.17165483
Most Extreme
Differences
Absolute .164
Positive .097
Negative -.164
Test Statistic .164
Asymp. Sig. (2-tailed) .070c
a. Test distribution is Normal.
b. Calculated from data.
c. Lilliefors Significance Correction.
Based on the
calculation of SPSS
version 23 above, it can
be seen that the test
used a one-sample
Kolmogorov- Smirnov

test. The data of the
control group is
normality distributed. It
can be seen from the
value of Sig. (2-tailed)
that is higher than a
(0,070 > 0,05).
2. Homogeneity
Homogeneity test
is used to know
whether the data come
from the homogeneous
variance or not. To
calculate the data, the
researcher uses the
SPSS program version

23. The result of the
calculation as below:
Table 4.10 The Result
of Homogeneity Test
Test of Homogeneity of
Variances
Hasil Belajar Bahasa Inggris
Levene
Statistic df1 df2 Sig.
.707 1 49 .405
Based on table 4.10
above, the researcher
concluded that the data is
homogeneously
distributed because the
value of a statistic is
higher (0, 405 > 0, 05)
3. T- test
After testing the
normality and
homogeneity,
researchers tested the
hypothesis. The
researcher used the T-
test to analyze the data.
T-test is a type of
statistical testing used
to test hypotheses in
data. It is used to
compare students.
speaking skills are
divided into two groups

taught using different
methods. The
researcher compared
the average score of
students 'speaking skills
taught by using the
Walk Gallery and
students' speaking skills
that were not taught
using the Gallery Walk.
Table 4. 11 The Result of
Mean Score of
Experiment and Control
Class
Group Statistics
kelompo
k N Mean Std. Deviation
Std.
Error Mean

nilai Experim
ent
Class
25 66.00 10.801 2.160
Control
Class 26 56.73 8.825 1.731
Based on the table
above, the result of data
analysis showed that the means
score students of experiment
class (students who are taught
by using Gallery Walk) is
66,00 while the means score of
control class (students who are
not taught by using Gallery
Walk) is 56,73.
Table 4. 12 The Result of
T- test Calculation

Independent Samples Test
Leve
ne's
Test
for
Equ
ality
of
Vari
ance
s t-test for Equality of Means
F
S
ig
. t Df
S
ig
.
(
2
-
t
ai
le
d
)
M
ea
n
Dif
fer
en
ce
Std.
Error
Differenc
e
95%
Confidence
Interval of the
Difference
Lower
Uppe
r

nilai Eq
ual
vari
anc
es
ass
um
ed
1
.
6
4
0
.
2
0
6
3.
36
2
49
.
0
0
2
9.
26
9
2.757 3.729 14.81
0
Eq
ual
vari
anc
es
not
ass
um
ed
3.
34
9
46.
362
.
0
0
2
9.
26
9
2.768 3.699 14.84
0
Based on the result of T-
test above, mean = 9.269, it refers
to the average difference of
students speaking score between
experimental and control class.
Standard Error = 2.768.

Confidence interval in lower and
upper refers to the size of
confidence is 95% level. T value
is the result of T-test = Degree of
freedom (df ) = 49 (db - 2; 51 – 2
= 49). Score sig.(2- tiled) = 0,002.
To interpret the data above, the
researcher formulates a
hypothesis as below:
Ha : There is significant difference in
speaking skill of students who
are taught by using Gallery Walk
H0 : There is no significant difference
in speaking skill of students who
are taught by using Gallery Walk
The research result, t
=3.362, with df = 49, on level

significance 5%. Pursuant to the
table value “t” = 2,01. Then “t”
account more than t table (3,362
> 2,01). It can be concluded that
the students taught by using
Gallery Walk get a better score
in speaking then the students
who are not taught by using
Gallery Walk.
F. Discussion and Interpretation
From the computation
above, it was shown that the
different coefficient of students
taught using Gallery Walk and
students not being taught using
the Gallery Walk technique is
3,362. That result was used to
find out whether the difference
coefficient was a significant
coefficient or not, and
furthermore, it could be used a
basic generate the population.
Hypothesis test (t0) at
3,362 from the computation above
would be compared to the “t”
index (tt) with the condition below:
1. If the t0 ≥ t0 Ha was
accepted. It means
that there was a
significant difference
between two
variables.
2. If the t0 < t0 Ha was
refused. It means that

there was no
significant difference
between two
variables.
To determine that value
of t0, the researcher is
checking db and
consulted with the tt
score:
Db = n1 + n2 – 2
= 25 + 26 – 2
= 51 – 2
= 49
At the significant
standard 5% the value of
tt is 2,01. Then, the value
of t0 is 3, 362, so to > tt. it
means that Ha is
accepted, and Ho is
rejected.
From the
calculation above, it can
be seen that the students
who are taught by using
the Gallery Walk
technique got a better
score than those who are
not. So, it can be
concluded that there is a
significant difference to
the student’s speaking
skill between students’
who are taught by using
Gallery Walk technique

and those who are not at
the eighth grades students
of SMP N 1 Babadan in
academic year
2018/2019.

CHAPTER V
CLOSING
A. Conclusion
Based on the data
analysis, the researcher could
conclude that there was a
significant in speaking score
between the students who are
taught by using Gallery Walk
and who are not taught by using
Gallery Walk at the eighth
grade of SMPN 1 Babadan in
academic year 2018/2019. The
result from this research is the
students who are taught by
using Gallery Walk get better
score of the student’s post-test
from experimental group (66, 4)
is higher than control group (55,
57). It has been found that the
comparison between students’
speaking skill who are taught by
using Gallery Walk is (3,362)
and who are not is (3,349). This
score is higher than t table
which is 2,01 at the level of
significant 5% with db = 49. It
means it Ha is accepted. In the
order word, the use of Gallery
Walk has significant difference
in improving students’ speaking
skill.
B. Recommendation

When taking the data
at the eighth grades students of
SMPN 1 Babadan, the
researcher experienced some
difficulties in applying the
Gallery Walk technique. Below
are some difficulties that occur
when the author applied the
Gallery Walk technique.
The first difficulty,
students were quite difficult to
team up and sharing discussion
groups. Group discussion is one
of the requirements that must be
exist in this technique. But
some students always complain
when choosing discussion

groups. They just want to group
with close friends, and they
complained if there were no
close friends in the group. In
overcoming this, the writer tried
to talk kindly to students who
cannot be invited to work
together in group selection. The
researcher tried to talk to them,
that all students in the class
were their friends so they
cannot to be picky in choosing
friend.
The second difficulty,
students who difficult to follow
the researcher’s instructions.
There were some students who

too lazy to walk around the
class because they were
accustomed to learning by the
discourse method. Students
usually only listen to the
teacher’s explanation and rarely
do the activities that involved
the whole body to move. To
overcome this, the researcher
gave the understanding to
students who are lazy, that what
is learned today will be benefit
for them one day and tried
giving them rewards after the
lesson, so they were excited
when doing activities in class.

From the conclusion
above, the researcher would like
to suggest:
1. For the teacher
The English
teachers should be
chosen an appropriate
technique in the class.
The gallery walk
technique is
recommended for
teaching and learning
speaking. The students
will be active
participants in the class,
and it makes students
confident to share their

ideas. Furthermore,
English Teachers
should be more
understanding the
condition of their
students, if the students
in the classroom are
bored with the teacher’s
technique or method,
the teacher has to find
out another the
appropriate method or
technique.
2. For the students
The researcher
hopes that the students
should have a great

motivation to learn,
especially the English
lesson. So, they have a
consideration that they
have to improve their
language skill.
3. For further reading
The researcher
hopes for the readers
that the result of this
research can be a
useful reference for
further research
concerning English
speaking.

Bibliography
Achmad, “The Use of Role- Play to Motivate the
Students to Speak: A class experience,”
Jurnal Humaniora, Sains. Pendidikan
Pengajaran, 1. 2012.
Depega, Chintis. Teaching Speaking by
Combaining Gallery Walk Strategy and
Study Group Strategy for X Grade at
Senoir High School. Dalam Jurnal
Pendidikan Bahasa Inggris
https://id.portalgaruda.org/index.php?ref=b
rowse&mod=viewaticle=317119
Douglas Brown, H. Language Assessment:
Principle and Classroom Practice. New
York: Longman. Inc.,2003.
Douglas Brown, H. Principles of Language
Learning and Teaching. USA: Pearson
Education, Inc: 2007.
Fox, Jenifer, Whitney Hoffman, The Differentiated
Instruction: Book of List. San Francisco:
Jossey- Bass, 2011.
Harmer, Jeremy. The Practice of English Language
Teaching. UK: Longman, 2001.
Hayriye, Kayi, Teaching Speaking: Activities to
Promote Speaking in a Second Language.
Nevada: 2006,
http://iteslj.org/Articles/Kayi- Teaching-
Speakig.html, retrieved on December 8,
2018.
Huda, Feri. “Teaching Speaking Using Describe
and Draw Picture”. Cakrawala Pendidikan,
Oktober, 2015. 2.
L. Bowman, Sharon. The Gallery Walk: An
Opening, Closing, and Review Activity
(2005),
http://www.boperson.com/BOWPERSON/
GalleryWalk.pdf, retrieved on Novem
[ber 27, 1018.
L. Bowman, Sharon. The Ten- Minute Trainer:
Ways to Teach It Quick and Make It Stick.
San Francisco: Pfeiffer A Wiley Imprint,
2005.

Muijs, Daniel. Doing Quantitative Research in
Education with SPSS. London: Sage
Publication Ltd, 2004.
Nunan, David. Practical English Language
Teaching. New York: The McGraw- Hill
Companies, Inc., 2005.
Penny, Ur. A Course in Language Teaching.
Practice and Theory. Cambridge:
Cambridge University Press, 1996.
Ridwan, Muhammad. Gallery Walk; An Alternative
Learning Strategy in Increasing Students’
Active Learning, Makassar, 2015,
http://repository.unhas.ac.id/bitstream/handl
e/123456789/18762/SLA%20Paper.pdf?seq
uence=1, access on December 13, 2018
Sugiyono. Metode Penelitian Pendidikan:
Pendekatan Kuantitatif, Kualitatif, dan
R&D. Bandung: Alfabeta, 2008.
T. Griffe, Dale. An Introduction to Second
Language Research Methods: Design and
Data. America: 2012.
W. Creswell, John. Educational Research:
Planning, Conducting, and Evaluating

Quantitative and Qualitative Research.
Boston: Addison Wesley, 2011.
W. Creswell, John. Research Design Qualitative,
Quantitative, Direct Methods Approach.
United Kingdom: Sage Publication, 2009.
Widyaningrum, Retno. Statistika. Yogyakarta:
Pustaka Felicha, 2015.