the economy of lisbon in figures 2015
DESCRIPTION
The Economy of Lisbon in Figures 2015TRANSCRIPT

www.cm-lisboa.pt

DG Economy and Innovation | Studies and Prospective Division
2015The Economy of Lisbon in Figures
1
ÍNDEX
GENERAL OVERVIEW 7
(PAG.)
BUSINESS AND ENTREPRENEURSHIP 19
(PAG.)
HUMAN CAPITAL AND KNOWLEDGE 31
(PAG.)
OPEN ECONOMY TO THE WORLD 41
(PAG.)
Access to excel files of statistical indicators for each thematic area The Economy of Lisbon in Figures 2014

DG Economy and Innovation | Studies and Prospective Division
2015
2
The Economy of Lisbon in Figures
°0 500250km
Lisbon - Region
Lisbo
n - C
ity
Portugal
Lisbon - Region
Spain
Algeria
Libya
Egypt
Morocco Tunisia
France
Italia
Austria
Germany
United Kingdom
Ireland
Poland
Denmark
Belgium
Holland
Norway
Lithuania
Sweden
Finland
Latvia
Czech republic
Greece
HungaryRomania
Ukraine
Bulgaria
Belarus
Turkey
LISBON
Lisbon
Sintra
Cascais
Almada
Sesimbra
Loures
Mafra
Setubal
Palmela
Montijo
V. Francade Xira
Seixal
Montijo
MoitaBarreiro
Oeiras
Amadora
Odivelas
Alcochete
Serbia
Switzerland

DG Economy and Innovation | Studies and Prospective Division
2015The Economy of Lisbon in Figures
3
°0 500250km
Lisbon - Region
Lisbo
n - C
ity
Portugal
Lisbon - Region
Spain
Algeria
Libya
Egypt
Morocco Tunisia
France
Italia
Austria
Germany
United Kingdom
Ireland
Poland
Denmark
Belgium
Holland
Norway
Lithuania
Sweden
Finland
Latvia
Czech republic
Greece
HungaryRomania
Ukraine
Bulgaria
Belarus
Turkey
LISBON
Lisbon
Sintra
Cascais
Almada
Sesimbra
Loures
Mafra
Setubal
Palmela
Montijo
V. Francade Xira
Seixal
Montijo
MoitaBarreiro
Oeiras
Amadora
Odivelas
Alcochete
Serbia
Switzerland

DG Economy and Innovation | Studies and Prospective Division
2015
4
The Economy of Lisbon in Figures
Altitude Lisbon (City) Lisbon (Region) Portugal
Maximum227 528 2.351
(m) (m) (m)
Source: INE, I.P., Anuário Estatístico Ed.2014, Year: 2013
Climate Indicators of Lisbon
Annual average air temperature
Maximum
21,6°(Celsius)
Mean
17,4°(Celsius)
Minimum
13,1° (Celsius)
Annual precipitation*
743(mm)
Days without rain
256 (No.)
Area
Lisbon (City)
100,05(Km²)
Lisbon (Region)
3.015,24(Km²)
Portugal
92.225,24(Km²)
Source: INE, I.P., Anuário Estatístico Ed.2014, Year: 2013 Source: INE, I.P., Anuário Estatístico, Ed.2014, Year: 2013*Lisbon (Region)

DG Economy and Innovation | Studies and Prospective Division
2015The Economy of Lisbon in Figures
5

DG Economy and Innovation | Studies and Prospective Division
2015
6
The Economy of Lisbon in Figures

DG Economy and Innovation | Studies and Prospective Division
2015The Economy of Lisbon in Figures
7
Lisbon is the capital of a country with 10.4 million inhabitants and the Hub of a metropolitan region with 2.8 million inhabitants.
Daily, the number of the city users increases more than 70%, due to the commuting movements (from house-to work and school).
After 5 decades of population decrease, that reached 257 thousand inhabitants (1/3 of the initial population), Lisbon’s population stabilized(slowing down the demographic decrease registered in the previous decades, with only a 3%
population decay in the last decade), due to the growth of the number of families and young residents rate. Currently the issue of demographic loss is again a problem across the country, factor that may lead to a reversion of these facts.
The majority of the national economic decision centers are located in Lisbon’s region, representing 37% of the national GDP and employing 1385 thousand persons (29% of national employment), reaching an apparent labor productivity 1.3 times higher than the national average.
GENERAL OVERVIEW

DG Economy and Innovation | Studies and Prospective Division
2015
8
The Economy of Lisbon in Figures
DEMOGRAPHY
Source: Statistics Portugal, Statistical Yearbook of Lisboa Region, Year: 2013
Lisbon (City) Lisbon (Region)
Resident Population
516.815 2.807.525(No.) (No.)
Proportion of people on the total population in the country 5,0 26,9
(%) (%)
Density
5.165 931(inh/km2) (inh/km2)
0
8
16
Crude death rateCrude birth rate
‰
10,3‰
LISBON(CITY)
9,7‰
LISBON(REGION)
7,9‰
PORTUGAL
13,4‰
LISBON(CITY)
9,4‰
LISBON(REGION)
10,2‰
PORTUGAL
Birth/Death Rate
Source: Statistics Portugal, Statistical Yearbook of Lisboa Region, Year: 2013

DG Economy and Innovation | Studies and Prospective Division
2015The Economy of Lisbon in Figures
9
Population density in the European Context
0
2000
4000
6000
8000
10000
Tallin
nRig
a
Vilnius
Dublin
Nicosia
Buchare
stSo
fia
Ljublja
na
Wars
aw
HelsinkiBern
Luxe
mbourgOslo
Bratisl
ava
Stock
holmRom
e
Budapest
Copenhagen
Mad
ridLis
bonPari
s
Amste
rdam
Athens
Valletta
Prague
Berlin
Vienna
Brusse
ls
London
940,3 Lisbon
Inh/km2
116,90 UE 27
Source: Team of project DMEI/DEP from Eurostat data, Year: 2012; Region NUTS IILegend:value of capital - Indicator data of the local region

DG Economy and Innovation | Studies and Prospective Division
2015
10
The Economy of Lisbon in Figures
Source: Statistics Portugal, Census 2011, Year: 2011
Population
Lisbon (City)
547.733 Inh. 925.959 Inh.
Resident Population Resident Population + Commuting Population
Source: Statistics Portugal, Census 2011, Year: 2011Legend: (1) Resident population in territories outside the city of Lisbon, that for reasons of work or study enter in the city of Lisbon in a daily bases. (2) Resident population in the city of Lisbon, that for reasons of work or study moves to territories outside the city of Lisbon
Commuting population*
Lisbon (City)
425.747 47.521 378.226Number of people
entering in city (1) Number of people leaving the city (2) Balance (1)-(2)
Weight of people leaving (daily) the city
9%
=ou 10%
POPULATION OF LISBON (CITY)
+
= 169%
Weight of persons entering (daily) in the city
78% RESIDENT POPULATION
SUSPENDED POPULATION
CENSOS

DG Economy and Innovation | Studies and Prospective Division
2015The Economy of Lisbon in Figures
11
Source: Statistics Portugal, Census 1960 to 2011
24 %
12 %
Pop. +65
Pop. 0-14
5 %
15 %
25 %
201120011991198119711960
Population aged ‘0 to 14 years’ and ‘65 years or over
Source: Statistics Portugal , Census 1960 to 2011
200
250
300
201120011991198119701960500
700
900
201120011991198119711960
Thousand Thousand
243.892
547.733
Demographic of Lisbon (city)
Family population Resident population
Source: Statistics Portugal , Census 1960 to 2011
50
100
150
20112001199119811971196050
110
170
201120011991198119711960
Thousand Thousand
130.960
65.988
Resident Population (+ 65 years) Resident Population (-14 Years)
CENSOS

DG Economy and Innovation | Studies and Prospective Division
2015
12
The Economy of Lisbon in Figures
ECONOMIC INDICATORS
Lisbon (Region) Relation of the region with the country
GDP (Gross domestic product) 63.902 37,3%
(million €) (Weight of the Region in the country)
GVA (Gross Value added) 56.154 37,3%
(million €) (Weight of the Region in the country)
Employment*
1.386 29,0%
(thousands) (Weight of the Region in the country)
GDP per capita
22,7 1,39(thousands €) (Ratio Region/country)
Apparent labour productivity (GVA/Employment)* 41,7 1,29
(thousands €) (Ratio Region/country)
Source: Statistics Portugal., Regional Accounts, Year: 2013, provisory values Legend: * (GVA/Employment), data 2011

DG Economy and Innovation | Studies and Prospective Division
2015The Economy of Lisbon in Figures
13
0
20
40
60
80
100
Buchare
stRig
a
Vilnius
Tallin
nSo
fia
Valletta
Nicosia
Ljublja
na
Wars
aw
Lisbon
Athens
Budapest
BerlinRom
e
Mad
rid
Dublin
Amste
rdam
Helsinki
Copenhagen
Vienna
Prague
Stock
holmPari
s
Bratisl
ava
Oslo
Brusse
ls
Luxe
mbourg
London
26,90 Lisbon
thousand €
25,20 UE 27
Gross Domestic Product (PPS per capita), the European Regions
Source: Statistics Portugal, Statistical Yearbook of Lisboa Region, Year: 2011; NUTS II RegionLegend: value of capital - Indicator data of the local region
DG Economy and Innovation | Studies and Prospective Division
2015
14
The Economy of Lisbon in Figures
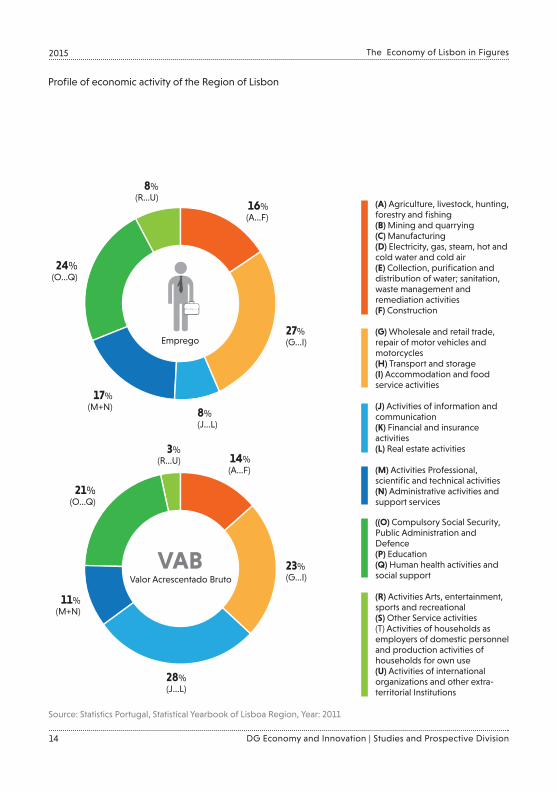
Profile of economic activity of the Region of Lisbon
Source: Statistics Portugal, Statistical Yearbook of Lisboa Region, Year: 2011
(A) Agriculture, livestock, hunting, forestry and fishing(B) Mining and quarrying(C) Manufacturing(D) Electricity, gas, steam, hot and cold water and cold air(E) Collection, purification and distribution of water; sanitation, waste management and remediation activities(F) Construction
(G) Wholesale and retail trade, repair of motor vehicles and motorcycles(H) Transport and storage(I) Accommodation and food service activities
(J) Activities of information and communication(K) Financial and insurance activities(L) Real estate activities
(M) Activities Professional, scientific and technical activities(N) Administrative activities and support services
((O) Compulsory Social Security, Public Administration and Defence(P) Education(Q) Human health activities and social support
(R) Activities Arts, entertainment, sports and recreational(S) Other Service activities(T) Activities of households as employers of domestic personnel and production activities of households for own use(U) Activities of international organizations and other extra-territorial Institutions
16%(A...F)
27%(G...I)
8%(J...L)
17%(M+N)
24%(O...Q)
8%(R...U)
14%(A...F)
23%(G...I)
28%(J...L)
11%(M+N)
21%(O...Q)
3%(R...U)
Emprego
Valor Acrescentado Bruto
VAB

DG Economy and Innovation | Studies and Prospective Division
2015The Economy of Lisbon in Figures
15
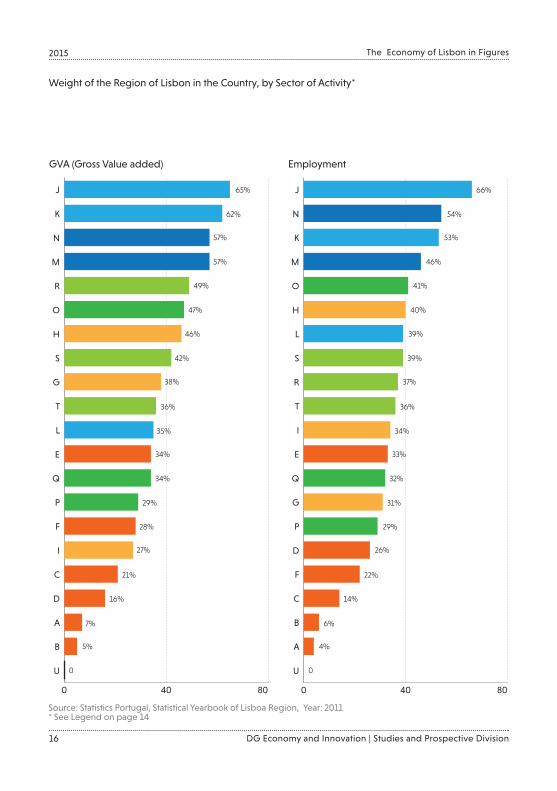
Source: Statistics Portugal, Statistical Yearbook of Lisboa Region, Year: 2011* See Legend on the previous page
GVA (million of euros) Employment (thousands of people)
8.209,72
6.667,174
5.968,84
5.786,644
4.227,338
3.738,279
3.295,353
3.213,923
2.972,175
3.136,122
2.945,794
2.378,522
2.056,326
849,097
612,888
602,906
507,786
429,734
209,756
30,716
0
0 5.000 10.000
U
B
A
T
D
R
E
S
I
F
N
P
M
Q
H
J
C
L
O
K
G 217,37
158,285
125,485
111,929
98,474
96,263
92,539
86,653
82,071
66,877
49,825
47,735
47,715
41,761
20,859
14,738
13,486
10,683
2,231
0,78
0
0 125 250
U
B
D
L
E
R
A
S
T
J
K
H
M
F
P
I
C
Q
O
N
G
GVA and Employment by economic activity in Region of Lisbon*
DG Economy and Innovation | Studies and Prospective Division
2015
16
The Economy of Lisbon in Figures
0 40 80
U
B
A
D
C
I
F
P
Q
E
L
T
G
S
H
O
R
M
N
K
J 65%
62%
57%
57%
49%
47%
46%
42%
38%
36%
35%
34%
34%
29%
28%
27%
21%
16%
7%
5%
0
0 40 80
U
A
B
C
F
D
P
G
Q
E
I
T
R
S
L
H
O
M
K
N
J 66%
54%
53%
46%
41%
40%
39%
39%
37%
36%
34%
33%
32%
31%
29%
26%
22%
14%
6%
4%
0
Source: Statistics Portugal, Statistical Yearbook of Lisboa Region, Year: 2011* See Legend on page 14
GVA (Gross Value added) Employment
Weight of the Region of Lisbon in the Country, by Sector of Activity*

DG Economy and Innovation | Studies and Prospective Division
2015The Economy of Lisbon in Figures
17

DG Economy and Innovation | Studies and Prospective Division
2015
18
The Economy of Lisbon in Figures
DG Economy and Innovation | Studies and Prospective Division
2015The Economy of Lisbon in Figures
19
The Lisbon region concentrates a significant number of high technology companies, and 317.000 companies’ headquarters are located in this area.
It’s also the region with most employees in foreign enterprises and in high technology companies, comparing with the national average.
Lisbon has a good performance in foreign investment attraction (with the set up and expansion of several multinational companies), and reveals potential for the location of shared and near shoring services , as well as for ICT , health and well-being companies.
BUSINESS AND ENTREPRENEURSHIP

DG Economy and Innovation | Studies and Prospective Division
2015
20
The Economy of Lisbon in Figures
Structure of the Business sector of the Lisbon (Region)
Source: INE, I.P., Empresas em Portugal 2012; Ed. 2014, Year: 2012
EnterpriseWeight in
the country Rate variation
2011/2012
Total of enterprises
316.962 29,2 -5,0(No.) (%) (%)
Persons Employed
1.305.115 36,0 -6,0 (No.) (%) (%)
GVA (Gross Value added) 43.519 50,7 -7,1
(million €) (%) (%)
Turnover
185.525 50,8 -5,7
(million €) (%) (%)
Economic Activity overall
Activity developed by non-financial enterprises
Activity developed by enterprises
Focus of the analysis of the corporate structure of territory

DG Economy and Innovation | Studies and Prospective Division
2015The Economy of Lisbon in Figures
21
Total companies in Lisbon City
Source: Team of DMEI project, the data from the INE, Year: 2012
Structure of the Non-Financial Sector of the Lisbon (City)
Source: INE, I.P., Sistema de Contas Integradas das Empresas (SCIE), Year: 2012
Lisbon (City) Weight of the city in the country
Enterprises93.076 8,8
(No.) (%)
Companies43.876 12,4
(No.) (%)
Persons Employed 560.719 16,0
(No.) (%)
GVA (Gross Value added)
20.103 26,5(million €) (%)

DG Economy and Innovation | Studies and Prospective Division
2015
22
The Economy of Lisbon in Figures
9%(A...F) 18%
(A...F)
36%(G...I)
35%(G...I)
8%(J...L)
6%(J...L)
33%(M+N)
27%(M+N)
10%(O...Q)
10%(O...Q)
4%(R...U)
22%(A...F)
28%(G...I)
20%(J...L)
19%(M+N)
9%(O...Q)
2%(R...U)
4%(R...U)
27%(A...F)
32%(G...I)
14%(J...L)
17%(M+N)
8%(O...Q)
2%(R...U)
Lisbon (Region)*Lisboa (City)*
Lisbon (Region)*
GVALisbon (City)*
GVA
Profile of the Business Sector (non-financial)
Persons employed in enterprises by head office:
GVA of enterprises by head office:
Source: Statistics Portugal, Statistical Yearbook of Lisboa Region, Year: 2012*See the Legend on page 14

DG Economy and Innovation | Studies and Prospective Division
2015The Economy of Lisbon in Figures
23
Intersection of weight of sectors with its intensity of specialization
Specialisation Profile of Region of Lisbon*
Indicator of specialization
Source: CML/DMEI, data from INE, I. P. , SCIE, 2014* This representation is based on the weight of the sectors in Region, according to the staff at the service, following the delimitation sectorial elaborated in study in development for the Region of Lisbon by the Calouste Gulbenkian Foundation
15
8
2119
22235
12
6
71113
3
10 4 9
16
14
20
17
1
Reference Sector QL
6 Pharmaceutical Industry 1,87
17Services to families and social
1,70
21 Tertiary - Creative 1,48
16Business Services knowledge-intensive
1,48
15Business Services - Other
1,47
19Infrastructure Sectors - structural
1,46
22Tertiary - Culture, Leisure and Tourism
1,03
3 State - Education 1,02
20Tertiary -Trade, Restoration and repair
1,01
23 Tertiary - Other 0,98
14Public and private Health
0,98
9 Basic Industry 0,90
1Construction and Real Estate
0,90
11Industries - Shipping Materials
0,73
4 Industry - Other 0,68
8Food Industry Tobacco Drinks
0,60
10Goods Industry equip. and components
0,45
13 Primary 0,31
5Industria rubber and plastics
0,29
12 Forest Industries 0,28
7The Textile, clothing and footwear
0,06
2 State - Public n.d.
18 Financial Services n.d.
QL =
Weight of the sector in the Region
Weight of the sector in the Country

DG Economy and Innovation | Studies and Prospective Division
2015
24
The Economy of Lisbon in Figures
www.incubadorasLisbon.pt
VISIT O
UR NETWORK OF INCUBATORS

DG Economy and Innovation | Studies and Prospective Division
2015The Economy of Lisbon in Figures
25
Persons EmployedWeight of the
Sector in the Region
Weight of the Sector in the Region in the
Sector of the Country
Sea
55.174 4,5% 32,8%
Health
95.926 7,7% 37,6%
Creative
54.417 4,4% 47,3%
ICT
53.404 4,3% 66,4%
Total*
253.642 20,5% 41,8%
Commerce
175.962 14,2% 34,8%
Tourism
172.276 13,9% 41,8%
Construction and Real Estate
110.235 8,9% 28,3%
Other Business Services
53.974 4,4% 45,4%
Areas of High and Medium-High Technology
80.406 6,5% 45,6%
Source: CML/DMEI, data from INE, I. P. , SCIE, 2014 Year: 2012* The delimitation of the strategic sectors was prepared by CML/DMEI. The total number of sectors is lower than the sum of the amounts due to the overlap of sectors.
Strategic Sectors in the Region of Lisbon
DG Economy and Innovation | Studies and Prospective Division
2015
26
The Economy of Lisbon in Figures
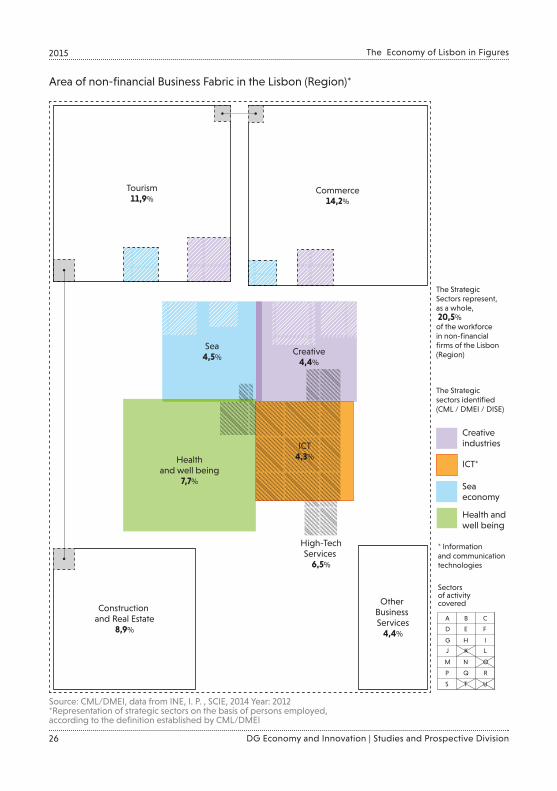
Area of non-financial Business Fabric in the Lisbon (Region)*
Source: CML/DMEI, data from INE, I. P. , SCIE, 2014 Year: 2012*Representation of strategic sectors on the basis of persons employed, according to the definition established by CML/DMEI
Healthand well being
7,7%
High-TechServices
6,5%
Sea4,5%
Tourism11,9%
Construction and Real Estate
8,9%
The Strategic Sectors represent, as a whole, 20,5% of the workforce in non-financial firms of the Lisbon(Region)
The Strategic sectors identified(CML / DMEI / DISE)
Sectors of activity covered
* Informationand communication technologies
Creativeindustries
Health andwell being
Seaeconomy
ICT*
Other Business Services
4,4%
Commerce14,2%
ICT4,3%
Creative4,4%
A B C
D E F
G H I
J K L
M N O
P Q R
S T U

DG Economy and Innovation | Studies and Prospective Division
2015The Economy of Lisbon in Figures
27
Area of non-financial Business Fabric in the Lisbon (Region)*
Source: CML/DMEI, data from INE, I. P. , SCIE, 2014 Year: 2012*Segmentation of the strategic sectors defined by CML/DMEI, on the basis of persons employed, according to sectorial boundaries drawn up in developing study for the Lisbon Region by the Calouste Gulbenkian Foundation(referred to in pg. 23)
Health ICT
Health7,7%
Sea4,5%
ICT4,3%
Creative4,4%
1%Tertiary
Creative
2% Industry - Other
5% Pharmaceutical Industry
0,4% Base Industries
0% Goods Industry equip. and components
4% Goods Industry equip. and components
90% Public and private Health
4% Business Services - Other2% Business services
knowledge-intensive
1% Services to families and social
53% Business services knowledge-intensive
25% Infrastructure
Sectors
13% Tertiary -
Trade, Restoration and repair
CreativeSea
0,1% Tertiary - Other
53% Tertiary Creative
11% Tertiary - Culture,Tourism and leisure
0,1% Tertiary - Culture, Leisure
and Tourism
1% Construction and Real Estate
1% State - Education 0,3% State - Education0,3% Industry - Other
0% Industry - Other1% Textile, clothing and footwear
2% Food Industry Tobacco Drinks
2% Goods Industry equip. and components
4% Primary
9% Business Services - Other
24% Business Services - Other
32% Business services knowledge-intensive
10% Businessservices knowledge-intensive15%
Infrastructure Sectors
13% Tertiary -Trade, Restoration and repair
21% Tertiary -
Trade, Restoration
and repair
1% Industries - Shipping Materials

DG Economy and Innovation | Studies and Prospective Division
2015
28
The Economy of Lisbon in Figures
0
2
4
6
8
10
Vilnius
Riga
Nicosia
Tallin
n
Luxembourg
AthensLis
bon
Amsterdam
Warsaw
ViennaSofia
Rome
Valletta
London
Ljublja
naBern
Berlin
Brussels
OsloParis
Helsinki
Budapest
Prague
Madrid
Dublin
Stockh
olm
Bratislava
Copenhagen
Buchare
st
4,7 Lisbon
thousand €
High-tech sectors, in European Regions
Source: Statistics Portugal, Statistical Yearbook of Lisboa Region, Year: 2012; NUTS II RegionLegend: value of capital - Indicator data of the local region

DG Economy and Innovation | Studies and Prospective Division
2015The Economy of Lisbon in Figures
29

DG Economy and Innovation | Studies and Prospective Division
2015
30
The Economy of Lisbon in Figures

DG Economy and Innovation | Studies and Prospective Division
2015The Economy of Lisbon in Figures
31
HUMAN CAPITAL AND KNOWLEDGE
Lisbon labor market presents highly competitive, multilingual, creative, flexible and qualified human resources. More than ¼ of Lisbon is inhabitants has higher education, with a competitive wage level, comparing with other European cities.
The Lisbon region concentrates ¼ of national active and employed population, and unemployment reaches 265 thousand persons. The activity rate is a few points below national average, particularly in 45 year old or more age range.
In Lisbon the expenses on Research and Development (R&D) reach 1.8% of regional GDP, a very significant level in the European regional context.
With nearly 138.000 students enrolled in tertiary education, in 2012 more than 35.000 students graduated at tertiary education institutions, with particular relevance in the areas of business and administration, health, social sciences and engineering, which accounted for more than 50% of the graduates.
The Lisbon region concentrates more than 47% of national R&D expenditures, and it´s where company’s invest more in this area.

DG Economy and Innovation | Studies and Prospective Division
2015
32
The Economy of Lisbon in Figures
Indicators of Resident Population Towards Employment
Source: Statistics Portugal, Statistical Yearbook of Lisboa Region, Year: 2013
Lisbon (Region)
Weight of the region in the country
Active Population
1.389,3 26,3(thousands) (%)
Employed Population
1.132,9 25,6(thousands) (%)
Unemployed Population
256,4 30,0(thousands) (%)
QUALIFIED HUMAN CAPITAL
Indicators of Activity and Employment
Source: Statistics Portugal, Statistical Yearbook of Lisboa Region, Year: 2013
Lisbon (Region) Portugal
Activity rate
49,4 50,6(%) (%)
Female Activity rate
47,0 46,7(%) (%)
15-24 years Activity rate
34,9 35,0(%) (%)
15-24 years Employment rate
60,4 60,6(%) (%)

DG Economy and Innovation | Studies and Prospective Division
2015The Economy of Lisbon in Figures
33
Resident Population by Highest completed level of education
Source: Project team DMEI / DEP from INE data, Year: 2011
45,3%
17,9% 18,5%
38,1%
16,4% 16,2%
0
10
20
30
40
50
Total female 15-24 years old
Lisbon (Region)
Lisbon (Region)
Lisbon (Region)
Portugal
Portugal Portugal
Unemployment Rate
Source: Statistics Portugal, Statistical Yearbook of Lisboa Region, Year: 2013
0 20 40 60 80 100%
Lisbon (Region)
17%
Lisbon (City)
27%
Tertiary educationSecondary EducationBasic educationNone
Portugal 12%

DG Economy and Innovation | Studies and Prospective Division
2015
34
The Economy of Lisbon in Figures
Gross Salary Level (NY=100))
Source: UBS, Price and Earnings 2012
44,0
0 70 140
Bratislava
Istanbul
Tallinn
Moscow
Ljubljana
Athens
Lisbon
Rome
Madrid
Nicosia
Milan
Toronto
Dublin
Paris
Amsterdam
Berlin
London
Vienna
Helsinki
Brussels
Stockholm
Los Angeles
Frankfurt
Munich
NewYork
Luxembourg
Oslo
Copenhagen
Geneva
Zurich
Source: Statistics Portugal, Statistical Yearbook of Lisboa Region, Year: 2012Legend: * Continent
Lisbon (City) Lisbon (Region) Portugal*
Average Monthly Earning
1590,6 1392,8 1095,6(€) (€) (€)

DG Economy and Innovation | Studies and Prospective Division
2015The Economy of Lisbon in Figures
35

DG Economy and Innovation | Studies and Prospective Division
2015
36
The Economy of Lisbon in Figures
Indicators in Tertiary Education
Source: Statistics Portugal, Statistical Yearbook of Lisboa Region, Year: 2013 / 2014
Lisbon (City) Lisbon (Region)Weight of the
region in the country
Educational institutions
70 96 32,5(No.) (No.) (%)
Students enrolled
113.390 137.774 38,0(No.) (No.) (%)
Teaching staff
10.476 13.007 38,8(No.) (No.) (%)
KNOWLEDGE AND INNOVATION
Art
Law course
Architectureand Construction
Training of Teachers/or trainers/
as and Educational Sciences
Engineeringand Related Technical
Social Sciencesand Behavior
Health
Business Science
Students Graduated in Tertiary Education - Main areas of study
Source: Statistics Portugal, Statistical Yearbook of Lisboa Region, Year: 2012/2013
Students Graduated at Tertiary Education Institutions
Source: Statistics Portugal, Statistical Yearbook of Lisboa Region, Year: 2012/2013
Lisbon Region
35.824 (No.)
Weight of the region in the country
37,8(%)

DG Economy and Innovation | Studies and Prospective Division
2015The Economy of Lisbon in Figures
37
9.000
12.000
15.000
2012/132011/122010/112009/102008/092007/082006/072005/062004/05
13.776
Evolution of foreign nationality students enrolled in higher education in the Region of Lisbon
Source: DGEEC/MEC Direção-Geral de Estatísticas da Educação e Ciência
Ocenia
Asia
America
Africa
Europe
Germany
Italy
Spain
C. Verde
Angola
Brazil
18%
9%
6%2%0%
20%
18%
10%
7%6% 4%
LISBON(REGION)
Other nationalities (by continent)35%
Source: DGEEC/MEC Direção-Geral de Estatísticas da Educação e Ciência, Year: 2012 / 2013*Includes Erasmus Program, Protocol/Partnership with a foreign institution and other Community Programs
Foreign nationality students enrolled
Lisbon City Lisbon RegionWeight of the
region in the country
Total
12.143 13.776 45(No.) (No.) (%)
From which in programs of international mobility* 3.338 3.790 38
(No.) (No.) (%)

DG Economy and Innovation | Studies and Prospective Division
2015
38
The Economy of Lisbon in Figures
50%Companies
7%State
34%Higher
education
9%Private not-for-profit
institutions
50%Companies
5%State
36%Higher
education
9%Private not-for-profit
institutions
PORTUGAL
LISBON(REGION)
5%Foreign
PORTUGAL
LISBON(REGION)
49%Companies
40%State
4%Higher education
2%Private not-for-profit
institutions
5%Foreign
46%Companies
43%State
4%Higher education
2%Private not-for-profit
institutions
R&D expenditure by Sector of Performance R&D expenditure by Financing Source
Research and Development (R&D) Indicators R&D expenditure
Source: Statistics Portugal, Statistical Yearbook of Lisboa Region, Year: 2012
Source: Statistics Portugal, Statistical Yearbook of Lisboa Region, Year: 2012
Source: Statistics Portugal, Statistical Yearbook of Lisboa Region, Year: 2011
Source: Statistics Portugal, Statistical Yearbook of Lisboa Region, Year: 2012
Lisbon (Region) Portugal
GERD as percentage of GDP
1,8% 1,4%
R&D personnel (FTE) in active population
14,9‰ 8,8‰
R&D Researchers (FTE) in active population
1,4% 0,8%
Lisbon (Region)(million €) 1.103,2
Portugal(million €) 2.320,1
Peso da Region no País 47,5%

DG Economy and Innovation | Studies and Prospective Division
2015The Economy of Lisbon in Figures
39
0
1
2
3
4
5
6
Buchare
st
NicosiaRig
a
Valletta
Athens
Vilnius
Sofia
London
Bratisl
ava
Wars
aw
Brusse
ls
Luxe
mbourg
Budapest
DublinRom
e
Mad
rid
Lisbon
Amste
rdam
Tallin
n
Prague
Paris
Ljublja
naOslo
Berlin
Vienna
Stock
holm
Helsinki
Copenhagen
2,09 Lisbon
%
2,05UE 27
Expenditure on R&D as % of GDP in European Regions
Source: Statistics Portugal, Statistical Yearbook of Lisboa Region, Year: 2011; NUTS II RegionLegend: value of capital - Indicator data of the local region

DG Economy and Innovation | Studies and Prospective Division
2015
40
The Economy of Lisbon in Figures

DG Economy and Innovation | Studies and Prospective Division
2015The Economy of Lisbon in Figures
41
Capital city, with several ports in its hinterland, Lisbon is considered from long time a privileged commercial platform for different continents. With easy access to 500 million European consumers, it has a modern network of highways, railroads and other transport and logistic infrastructures.
Lisbon has an excellent geostrategic location, with strong business and economic connections with the seven Portuguese speaking countries, that makes this city the ideal place for companies who want to export or invest in those markets.
The importance of international trade has been growing in the region, originating more than 1/3 of national exports, and the destination of more
than half of national imports. In 2013 the exports registered a growth of more than 30% facing the last 5 years.
Lisbon is the destination of more than 4.4 million tourists per year, half of them originated from foreign markets, in particular from Spain, Brazil, France, Germany, United Kingdom and Ireland. Lisbon is often choosed for international congresses, as demonstrated by the main international rankings, being a capital full of dynamism and creative events all year long.
Lisbon positioning in international rankings is becoming more relevant each year, proving that Lisbon is seen and felt as an Atlantic city with unique characteristics to study, live, work and invest.
AN ECONOMY OPEN TO THE WORLD

DG Economy and Innovation | Studies and Prospective Division
2015
42
The Economy of Lisbon in Figures
Transports
Airport of Lisbon Port of Lisbon
Flights / Ships
146.361 2.824(No.) (No.)
Passengers
16.025 559 (thousands) (thousands)
Cargo
88,5 12.029,7(thousands ton.) (thousands ton.)
LISBOA
100
200
300
2013201220112010200920082007200620052004
175
136
Metropolitano Carris
milhõespassageiros
Evolution of passengers - Bus and Metro of Lisbon
Source: Team of project DMEI/DEP from data of Metropolitan of Lisbon
Source: ANA, Aeroporto Nacional, SA e Porto de Lisbon, Year: 2013
TRANSPORT

DG Economy and Innovation | Studies and Prospective Division
2015The Economy of Lisbon in Figures
43
INTERNATIONAL TRADE
Import/Export
Source: Statistics Portugal, Statistical Yearbook of Lisboa Region, Year 2013 (Provisory data)
Lisbon (City) Lisbon (Region)Weight of the
region in the country
Exports
7.397,6 16.077,7 34,0(million €) (million €) (%)
Imports
17.472,3 31.649,2 56,3(million €) (million €) (%)
26%
11%0,03%
17%
33%
12%
17%
10%
9%0,07%8%
19%
9%
29%
Goods not specified in other categories
Consumer Goods not specified in other categories
Transport equipment and accessories
Machinery and other capital goods (except transport equipment) and its accessories
Fuels and lubricants
Industrial Supplies not specified in other categories
Food Products and beverages
Exportation Importation
Exports of Lisbon (Region)
Source: Statistics Portugal, Statistical Yearbook of Lisboa Region, Year 2013 (Provisory data)
Imports of Lisbon (Region)

DG Economy and Innovation | Studies and Prospective Division
2015
44
The Economy of Lisbon in Figures
INTERNATIONAL TRADE - EXPORTS + IMPORTS
Source: Equipa de projeto DMEI, a partir de dados do INE, I.P. Anuário Estatístico, Ed. 2013, Year: 2012
!
!
!
!
! !
!
!
!
!
!
!
!
!!!
!
!!
!!!
!!
!
!!
!!!
!!
!!
!!!! !
!
!
! !
!
! !!
°
0Km
1.000 2.000
África
Ásia
Américado Sul
Américado Norte
!
!
!
! !
!
!
!
!
!
!
°
..m
0Km
1.000 2.000
Camarões
!
!
!
!
!
!
!
!
!
!
!!
!
!
!
!
!
!
!!
!
!!
!
!
!
!
°
0Km
250 500
Luxemburgo
Hungria
Países Baixos
Exportações + Importações (million €)
6 - 50 51 - 500 501 - 5.000 5.001 - 11 .085Countries - Comercial transactionswith Lisbon (Region)
Region of Lisbon - Africa
Region of Lisbon - Europa / Africa / America / Asia
Region of Lisbon - Europe (EU 27)
DG Economy and Innovation | Studies and Prospective Division
2015The Economy of Lisbon in Figures
45
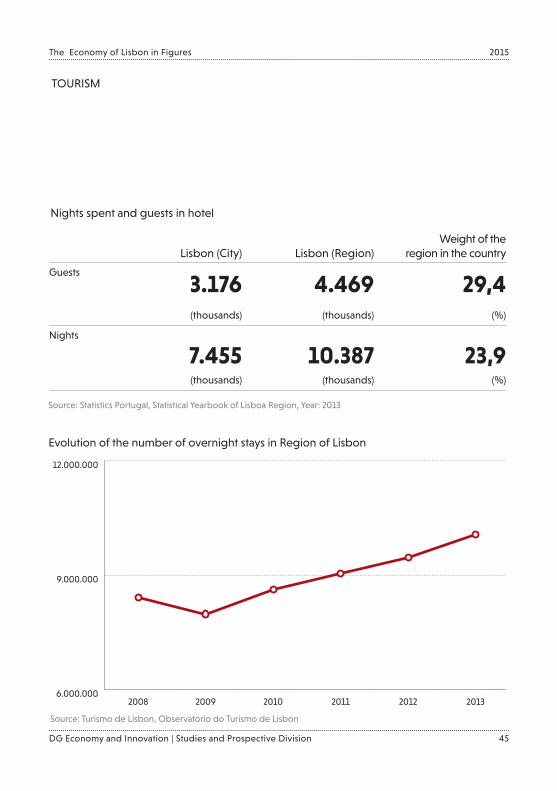
TOURISM
6.000.000
9.000.000
12.000.000
201320122011201020092008
Evolution of the number of overnight stays in Region of Lisbon
Source: INE, I.P. Anuário Estatístico, Year. 2012
Lisbon (City) Lisbon (Region)Weight of the
region in the country
Guests
3.176 4.469 29,4(thousands) (thousands) (%)
Nights
7.455 10.387 23,9(thousands) (thousands) (%)
Nights spent and guests in hotel
Source: Statistics Portugal, Statistical Yearbook of Lisboa Region, Year: 2013
Source: Turismo de Lisbon, Observatório do Turismo de Lisbon

DG Economy and Innovation | Studies and Prospective Division
2015
46
The Economy of Lisbon in Figures

DG Economy and Innovation | Studies and Prospective Division
2015The Economy of Lisbon in Figures
47
Source: CML/DMEI
PRICES AND EARNINGS (2012)
Lisbon proves to be competitive at the cost of hand labor, with a level of gross salary of around 40.0 (NY = 100), values that are in Dublin encrypt in 77.7, Madrid 57.0 and Barcelona 59.6.
EUROPEAN ENTREPRENEURIAL REGION (EER) 2015
Lisbon was distinguished by the EU Committee of the Regions with the European prize for entrepreneurship - City European Entrepreneurial 2015 - by strategy designed to foster entrepreneurship and run European policies.
QUALITY OF LIVING WORLDWIDE CITY RAKINGS 2014
Lisbon integrates the top 50 of Citys with better quality of life (at the 43 th position).
2012 URBANISM AWARDS
Lisbon was elected the European city of the Year 2012 award which is based on criteria such as governance, success and commercial viability, social and environmental sustainability and functionality.
FT FDI: EUROPEAN CITIES AND REGIONS OF THE FUTURE 2014-15
Lisbon appears in a prominent position in Citys of southern Europe and as far as the strategy of attracting foreign direct investment occupies the 2ND position, preceded by Barcelona.
TOP 10 DESTINATIONS IN EUROPE 2013
The City of Lisbon was elected by EBD - European Best Destinations as the second best European destination in Year 2013, only exceeded by Istanbul.
WORLD TRAVEL AWARDS 2014
Portugal has received more than 40 nominations for the “Oscars” of European tourism. The City of Lisbon falls into five distinct categories: Best overall destination European; Best destination of “city breaks”; Best destination for cruises; Best cruise port and Best airport.
THE GLOBAL COMPETITIVENCES REPORT 2013 - 2014
Portugal occupies the 51ST position assumed a particular emphasis on the following topics: Qual-ity of infrastructure Education and Health; Fitness and Technological Innovation.
GLOBAL BENCHMARK REPORT 2014
Portugal occupies the 23 th place in relation to the Index of Competitiveness in the context of the OECD countries with emphasis on the following aspects: the existence of favorable conditions for entrepreneurship; Capacity of business creation-gazelle; average Inflation (last 5 Years) and Trade Openness.
CORRUPTION PERCEPTION INDEX 2013
Portugal occupies the 33RD position (between countries around the world) while Denmark and New Zealand occupy, ex-aequo, 1ST position, Spain the 40TH position, Hungary the 47TH and
DOING BUSINESS 2014
Portugal occupies the 31 th position in relation to the ease of starting a business (out of a universe of 189 countries analyzed).
LISBON - INTERNACIONAL RANKING

DG Economy and Innovation | Studies and Prospective Division
2015
48
The Economy of Lisbon in Figures
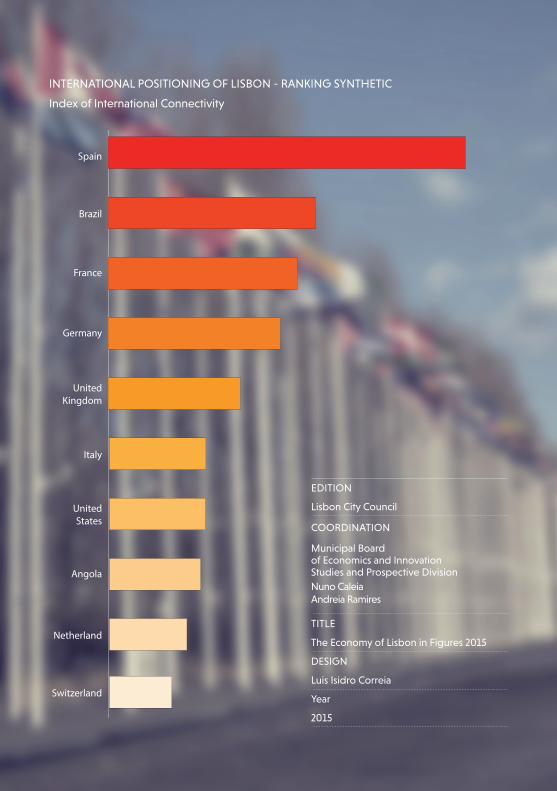
INDEX OF INTERNATIONAL CONNECTIVITY
Source: CML/DMEIThe Index of International Conetividade has as objective measure the intensity of the relationship between the various countries and the Region of Lisbon. It is a synthetic index composed of four components, two of human dimension - foreign students enrolled in higher education in Region of Lisbon and passengers (shipped + landed) at the airport of Lisbon; and two material dimension - international trade (exports + imports) with origin/destination in Region and Subsidiaries of multinational companies located in Region. Your score varies between 0 (no relation) and 100 (maximum intensity that would be achieved by a country that is sorted in the first place ranking in all variables).
BrazilAngola
Cape verde
Spain
Italy
Poland
São Tomé e Príncipe
France Germany
Mozambique Ukraine
TurkeyChina
Guinea Bissau Romania
SpainUnited States
France
United Kingdom
Germany
Netherlands
Luxembourg
Italy
Switzerland
BelgiumSweden
JapanIreland
Denmark Brazil
SpainFrance
Brazil
Germany
United Kingdom
Italy
Switzerland
Netherlands
Belgium
UnitedStates
Angola
Cape verdeSenegal
Morocco
IrelandDenmark
SpainGermany
Angola
France
United Kingdom
Netherlands
United States
Italy
Brazil
China Belgium
NigeriaKazakhstan
Saudi Arabia Argelia
Foreign Students
Passenger
Affiliates
International Trade
Other variables
SpainBrazil
France
Germany
United Kingdom
Italy
United States
Netherlands
Belgium
SwedenIreland
CanadaÁustria
JapanDenmark
GermanyFrance
United Kingdom
Brazil
Angola
Japan
Russia
Spain
Sweden
UnitedStates
Israel
ItalyBelgium
CzechRepublic
Poland
BrazilCabo-Verde
Angola
Guinea Bissau
Romania
São Tomé e Príncipe
China
Spain
France
ÍndiaMozambique
United KingdomRussia
BulgariaGermany
Foreign Population Touristic Nights Filming
Basic Variables
INTERNATIONAL POSITIONING OF LISBON - RANKING SYNTHETIC
Switzerland
Netherland
Angola
UnitedStates
Italy
UnitedKingdom
Germany
France
Brazil
Spain
Index of International Connectivity
EDITION
Lisbon City Council
COORDINATION
Municipal Board of Economics and Innovation Studies and Prospective DivisionNuno CaleiaAndreia Ramires
TITLE
The Economy of Lisbon in Figures 2015
DESIGN
Luis Isidro Correia
Year
2015

www.cm-lisboa.pt