the economist/yougov poll july 17 - 20, 2021 - 1500 u.s
TRANSCRIPT

The Economist /YouGov PollJuly 17 - 20, 2021 - 1500 U.S. Adult Citizens
List of Tables
1. Direction of Country . . . . . . . . . . . . . . . . . . . . . . . . . . . . . . . . . . . . . . . . . . . . . . . . . . . . . . . . . . . . . . . . . . . . . . . . . . . . . 22. State of the Economy . . . . . . . . . . . . . . . . . . . . . . . . . . . . . . . . . . . . . . . . . . . . . . . . . . . . . . . . . . . . . . . . . . . . . . . . . . . . 43. Unemployment or Inflation . . . . . . . . . . . . . . . . . . . . . . . . . . . . . . . . . . . . . . . . . . . . . . . . . . . . . . . . . . . . . . . . . . . . . . . . . 64. Following News . . . . . . . . . . . . . . . . . . . . . . . . . . . . . . . . . . . . . . . . . . . . . . . . . . . . . . . . . . . . . . . . . . . . . . . . . . . . . . . 85. People I Know – Has Been Laid Off from Work Due to COVID-19 . . . . . . . . . . . . . . . . . . . . . . . . . . . . . . . . . . . . . . . . . . . . . . . . . . . . 106. People I Know – Has Tested Positive for COVID-19 . . . . . . . . . . . . . . . . . . . . . . . . . . . . . . . . . . . . . . . . . . . . . . . . . . . . . . . . . . . . 127. People I Know – Has Died Due to Complications from COVID-19 . . . . . . . . . . . . . . . . . . . . . . . . . . . . . . . . . . . . . . . . . . . . . . . . . . . . 148. Personal Worry about COVID-19 . . . . . . . . . . . . . . . . . . . . . . . . . . . . . . . . . . . . . . . . . . . . . . . . . . . . . . . . . . . . . . . . . . . . . . 169. Frequency of Wearing a Facemask . . . . . . . . . . . . . . . . . . . . . . . . . . . . . . . . . . . . . . . . . . . . . . . . . . . . . . . . . . . . . . . . . . . . . 1810. Vaccination . . . . . . . . . . . . . . . . . . . . . . . . . . . . . . . . . . . . . . . . . . . . . . . . . . . . . . . . . . . . . . . . . . . . . . . . . . . . . . . . . 2011. Vaccine Manufacturer Received . . . . . . . . . . . . . . . . . . . . . . . . . . . . . . . . . . . . . . . . . . . . . . . . . . . . . . . . . . . . . . . . . . . . . . 2312. Side Effects of Vaccination . . . . . . . . . . . . . . . . . . . . . . . . . . . . . . . . . . . . . . . . . . . . . . . . . . . . . . . . . . . . . . . . . . . . . . . . 2513. Bigger Risk . . . . . . . . . . . . . . . . . . . . . . . . . . . . . . . . . . . . . . . . . . . . . . . . . . . . . . . . . . . . . . . . . . . . . . . . . . . . . . . . . 2714. Biden Job Approval on COVID-19 . . . . . . . . . . . . . . . . . . . . . . . . . . . . . . . . . . . . . . . . . . . . . . . . . . . . . . . . . . . . . . . . . . . . . 2915. Most New COVID-19 Cases . . . . . . . . . . . . . . . . . . . . . . . . . . . . . . . . . . . . . . . . . . . . . . . . . . . . . . . . . . . . . . . . . . . . . . . . 3116. Unvaccinated Good Reasons . . . . . . . . . . . . . . . . . . . . . . . . . . . . . . . . . . . . . . . . . . . . . . . . . . . . . . . . . . . . . . . . . . . . . . . 3317. Heard about Delta Variant . . . . . . . . . . . . . . . . . . . . . . . . . . . . . . . . . . . . . . . . . . . . . . . . . . . . . . . . . . . . . . . . . . . . . . . . . 3518. Worry about Delta Variant . . . . . . . . . . . . . . . . . . . . . . . . . . . . . . . . . . . . . . . . . . . . . . . . . . . . . . . . . . . . . . . . . . . . . . . . . 3719. Watch Olympics . . . . . . . . . . . . . . . . . . . . . . . . . . . . . . . . . . . . . . . . . . . . . . . . . . . . . . . . . . . . . . . . . . . . . . . . . . . . . . 3920. Ioc Good Decision During COVID-19 . . . . . . . . . . . . . . . . . . . . . . . . . . . . . . . . . . . . . . . . . . . . . . . . . . . . . . . . . . . . . . . . . . . 4121. Successful Olympics . . . . . . . . . . . . . . . . . . . . . . . . . . . . . . . . . . . . . . . . . . . . . . . . . . . . . . . . . . . . . . . . . . . . . . . . . . . . 4322. Attend Olympics . . . . . . . . . . . . . . . . . . . . . . . . . . . . . . . . . . . . . . . . . . . . . . . . . . . . . . . . . . . . . . . . . . . . . . . . . . . . . . 4523. Approve of Olympics Not Allowing Spectators . . . . . . . . . . . . . . . . . . . . . . . . . . . . . . . . . . . . . . . . . . . . . . . . . . . . . . . . . . . . . . 4724. Approve of U.S. Sending Athletes . . . . . . . . . . . . . . . . . . . . . . . . . . . . . . . . . . . . . . . . . . . . . . . . . . . . . . . . . . . . . . . . . . . . . 4925. Athletes Vaccinated . . . . . . . . . . . . . . . . . . . . . . . . . . . . . . . . . . . . . . . . . . . . . . . . . . . . . . . . . . . . . . . . . . . . . . . . . . . . 5126. Likelihood of COVID-19 Outbreak at Olympics . . . . . . . . . . . . . . . . . . . . . . . . . . . . . . . . . . . . . . . . . . . . . . . . . . . . . . . . . . . . . . 5327. Heard about Child Tax Credit . . . . . . . . . . . . . . . . . . . . . . . . . . . . . . . . . . . . . . . . . . . . . . . . . . . . . . . . . . . . . . . . . . . . . . . 5528. Know Someone with Child Tax Credit . . . . . . . . . . . . . . . . . . . . . . . . . . . . . . . . . . . . . . . . . . . . . . . . . . . . . . . . . . . . . . . . . . . 5729. Approve of Expanded Child Tax Credit . . . . . . . . . . . . . . . . . . . . . . . . . . . . . . . . . . . . . . . . . . . . . . . . . . . . . . . . . . . . . . . . . . 5930. Expanded Tax Credit Permanent . . . . . . . . . . . . . . . . . . . . . . . . . . . . . . . . . . . . . . . . . . . . . . . . . . . . . . . . . . . . . . . . . . . . . 6131. Immigration Better or Worse (Past) . . . . . . . . . . . . . . . . . . . . . . . . . . . . . . . . . . . . . . . . . . . . . . . . . . . . . . . . . . . . . . . . . . . . 6332. Legal Immigration . . . . . . . . . . . . . . . . . . . . . . . . . . . . . . . . . . . . . . . . . . . . . . . . . . . . . . . . . . . . . . . . . . . . . . . . . . . . . 6533. Seriousness of National Immigration Problem . . . . . . . . . . . . . . . . . . . . . . . . . . . . . . . . . . . . . . . . . . . . . . . . . . . . . . . . . . . . . . 6734. Seriousness of Local Immigration Problem . . . . . . . . . . . . . . . . . . . . . . . . . . . . . . . . . . . . . . . . . . . . . . . . . . . . . . . . . . . . . . . . 6935. Know Illegal Immigrant . . . . . . . . . . . . . . . . . . . . . . . . . . . . . . . . . . . . . . . . . . . . . . . . . . . . . . . . . . . . . . . . . . . . . . . . . . . 7136. Undocumented Immigrants . . . . . . . . . . . . . . . . . . . . . . . . . . . . . . . . . . . . . . . . . . . . . . . . . . . . . . . . . . . . . . . . . . . . . . . . 73
1

The Economist /YouGov PollJuly 17 - 20, 2021 - 1500 U.S. Adult Citizens
37. Illegal Immigrants Policy . . . . . . . . . . . . . . . . . . . . . . . . . . . . . . . . . . . . . . . . . . . . . . . . . . . . . . . . . . . . . . . . . . . . . . . . . . 7538. Civil or Criminal Matter . . . . . . . . . . . . . . . . . . . . . . . . . . . . . . . . . . . . . . . . . . . . . . . . . . . . . . . . . . . . . . . . . . . . . . . . . . 7739. Crime Likelihood . . . . . . . . . . . . . . . . . . . . . . . . . . . . . . . . . . . . . . . . . . . . . . . . . . . . . . . . . . . . . . . . . . . . . . . . . . . . . . 7940. Offer Asylum Escaping Violence or Political Persecution . . . . . . . . . . . . . . . . . . . . . . . . . . . . . . . . . . . . . . . . . . . . . . . . . . . . . . . . 8141. Offer Asylum Escaping Religious Persecution . . . . . . . . . . . . . . . . . . . . . . . . . . . . . . . . . . . . . . . . . . . . . . . . . . . . . . . . . . . . . . 8342. Favor Daca . . . . . . . . . . . . . . . . . . . . . . . . . . . . . . . . . . . . . . . . . . . . . . . . . . . . . . . . . . . . . . . . . . . . . . . . . . . . . . . . . 8543. Heard about Daca Ruling . . . . . . . . . . . . . . . . . . . . . . . . . . . . . . . . . . . . . . . . . . . . . . . . . . . . . . . . . . . . . . . . . . . . . . . . . 8744. Heard about Dem Immigration Reform . . . . . . . . . . . . . . . . . . . . . . . . . . . . . . . . . . . . . . . . . . . . . . . . . . . . . . . . . . . . . . . . . . 8945. Support Dem Immigration Reform . . . . . . . . . . . . . . . . . . . . . . . . . . . . . . . . . . . . . . . . . . . . . . . . . . . . . . . . . . . . . . . . . . . . 9146. Support Aid to Central American Countries . . . . . . . . . . . . . . . . . . . . . . . . . . . . . . . . . . . . . . . . . . . . . . . . . . . . . . . . . . . . . . . 9347. Pass with Budget Reconciliation . . . . . . . . . . . . . . . . . . . . . . . . . . . . . . . . . . . . . . . . . . . . . . . . . . . . . . . . . . . . . . . . . . . . . 9548. Heard about Flooding in Europe . . . . . . . . . . . . . . . . . . . . . . . . . . . . . . . . . . . . . . . . . . . . . . . . . . . . . . . . . . . . . . . . . . . . . 9749. Opinion of Climate Change . . . . . . . . . . . . . . . . . . . . . . . . . . . . . . . . . . . . . . . . . . . . . . . . . . . . . . . . . . . . . . . . . . . . . . . . 9950. Flooding Result of Climate Change . . . . . . . . . . . . . . . . . . . . . . . . . . . . . . . . . . . . . . . . . . . . . . . . . . . . . . . . . . . . . . . . . . . . 10151A. Relationship of Severe Weather And Climate Change — California drought emergency . . . . . . . . . . . . . . . . . . . . . . . . . . . . . . . . . . . . . . . 10351B. Relationship of Severe Weather And Climate Change — Polar vortex . . . . . . . . . . . . . . . . . . . . . . . . . . . . . . . . . . . . . . . . . . . . . . . . . 10551C. Relationship of Severe Weather And Climate Change — Rising sea levels . . . . . . . . . . . . . . . . . . . . . . . . . . . . . . . . . . . . . . . . . . . . . . 10751D. Relationship of Severe Weather And Climate Change — Pacific Northwest heat wave in 2021 . . . . . . . . . . . . . . . . . . . . . . . . . . . . . . . . . . . 10951E. Relationship of Severe Weather And Climate Change — Texas cold snap in 2021 . . . . . . . . . . . . . . . . . . . . . . . . . . . . . . . . . . . . . . . . . . 11151F. Relationship of Severe Weather And Climate Change — Severe hurricanes (e.g. Katrina, Harvey) . . . . . . . . . . . . . . . . . . . . . . . . . . . . . . . . . 11352A. Issue Importance — Jobs and the economy . . . . . . . . . . . . . . . . . . . . . . . . . . . . . . . . . . . . . . . . . . . . . . . . . . . . . . . . . . . . . . 11552B. Issue Importance — Immigration . . . . . . . . . . . . . . . . . . . . . . . . . . . . . . . . . . . . . . . . . . . . . . . . . . . . . . . . . . . . . . . . . . . . 11752C. Issue Importance — Climate change and the environment . . . . . . . . . . . . . . . . . . . . . . . . . . . . . . . . . . . . . . . . . . . . . . . . . . . . . . 11952D. Issue Importance — Foreign policy . . . . . . . . . . . . . . . . . . . . . . . . . . . . . . . . . . . . . . . . . . . . . . . . . . . . . . . . . . . . . . . . . . . 12152E. Issue Importance — National Security . . . . . . . . . . . . . . . . . . . . . . . . . . . . . . . . . . . . . . . . . . . . . . . . . . . . . . . . . . . . . . . . . 12352F. Issue Importance — Education . . . . . . . . . . . . . . . . . . . . . . . . . . . . . . . . . . . . . . . . . . . . . . . . . . . . . . . . . . . . . . . . . . . . . 12552G. Issue Importance — Health care . . . . . . . . . . . . . . . . . . . . . . . . . . . . . . . . . . . . . . . . . . . . . . . . . . . . . . . . . . . . . . . . . . . . 12752H. Issue Importance — Taxes and government spending . . . . . . . . . . . . . . . . . . . . . . . . . . . . . . . . . . . . . . . . . . . . . . . . . . . . . . . . . 12952I. Issue Importance — Abortion . . . . . . . . . . . . . . . . . . . . . . . . . . . . . . . . . . . . . . . . . . . . . . . . . . . . . . . . . . . . . . . . . . . . . . . 13152J. Issue Importance — Civil rights . . . . . . . . . . . . . . . . . . . . . . . . . . . . . . . . . . . . . . . . . . . . . . . . . . . . . . . . . . . . . . . . . . . . . 13352K. Issue Importance — Civil liberties . . . . . . . . . . . . . . . . . . . . . . . . . . . . . . . . . . . . . . . . . . . . . . . . . . . . . . . . . . . . . . . . . . . . 13552L. Issue Importance — Guns . . . . . . . . . . . . . . . . . . . . . . . . . . . . . . . . . . . . . . . . . . . . . . . . . . . . . . . . . . . . . . . . . . . . . . . . 13752M. Issue Importance — Crime . . . . . . . . . . . . . . . . . . . . . . . . . . . . . . . . . . . . . . . . . . . . . . . . . . . . . . . . . . . . . . . . . . . . . . . 13952N. Issue Importance — Criminal justice reform . . . . . . . . . . . . . . . . . . . . . . . . . . . . . . . . . . . . . . . . . . . . . . . . . . . . . . . . . . . . . . 14153. Most Important Issue . . . . . . . . . . . . . . . . . . . . . . . . . . . . . . . . . . . . . . . . . . . . . . . . . . . . . . . . . . . . . . . . . . . . . . . . . . . 14354A. Favorability of Individuals — Joe Biden . . . . . . . . . . . . . . . . . . . . . . . . . . . . . . . . . . . . . . . . . . . . . . . . . . . . . . . . . . . . . . . . . 14654B. Favorability of Individuals — Kamala Harris . . . . . . . . . . . . . . . . . . . . . . . . . . . . . . . . . . . . . . . . . . . . . . . . . . . . . . . . . . . . . . . 14854C. Favorability of Individuals — Nancy Pelosi . . . . . . . . . . . . . . . . . . . . . . . . . . . . . . . . . . . . . . . . . . . . . . . . . . . . . . . . . . . . . . . 150
2

The Economist /YouGov PollJuly 17 - 20, 2021 - 1500 U.S. Adult Citizens
54D. Favorability of Individuals — Kevin McCarthy . . . . . . . . . . . . . . . . . . . . . . . . . . . . . . . . . . . . . . . . . . . . . . . . . . . . . . . . . . . . . . 15254E. Favorability of Individuals — Mitch McConnell . . . . . . . . . . . . . . . . . . . . . . . . . . . . . . . . . . . . . . . . . . . . . . . . . . . . . . . . . . . . . 15454F. Favorability of Individuals — Chuck Schumer . . . . . . . . . . . . . . . . . . . . . . . . . . . . . . . . . . . . . . . . . . . . . . . . . . . . . . . . . . . . . . 15654G. Favorability of Individuals — Donald Trump . . . . . . . . . . . . . . . . . . . . . . . . . . . . . . . . . . . . . . . . . . . . . . . . . . . . . . . . . . . . . . . 15855A. Favorability of Political Parties — The Democratic Party . . . . . . . . . . . . . . . . . . . . . . . . . . . . . . . . . . . . . . . . . . . . . . . . . . . . . . . . 16055B. Favorability of Political Parties — The Republican Party . . . . . . . . . . . . . . . . . . . . . . . . . . . . . . . . . . . . . . . . . . . . . . . . . . . . . . . . 16256. Biden Job Approval . . . . . . . . . . . . . . . . . . . . . . . . . . . . . . . . . . . . . . . . . . . . . . . . . . . . . . . . . . . . . . . . . . . . . . . . . . . . 16457A. Biden Issue Approval — Jobs and the economy . . . . . . . . . . . . . . . . . . . . . . . . . . . . . . . . . . . . . . . . . . . . . . . . . . . . . . . . . . . . 16657B. Biden Issue Approval — Immigration . . . . . . . . . . . . . . . . . . . . . . . . . . . . . . . . . . . . . . . . . . . . . . . . . . . . . . . . . . . . . . . . . . 16857C. Biden Issue Approval — Climate change and the environment . . . . . . . . . . . . . . . . . . . . . . . . . . . . . . . . . . . . . . . . . . . . . . . . . . . . 17057D. Biden Issue Approval — Civil rights . . . . . . . . . . . . . . . . . . . . . . . . . . . . . . . . . . . . . . . . . . . . . . . . . . . . . . . . . . . . . . . . . . . 17257E. Biden Issue Approval — Civil liberties . . . . . . . . . . . . . . . . . . . . . . . . . . . . . . . . . . . . . . . . . . . . . . . . . . . . . . . . . . . . . . . . . . 17457F. Biden Issue Approval — Crime . . . . . . . . . . . . . . . . . . . . . . . . . . . . . . . . . . . . . . . . . . . . . . . . . . . . . . . . . . . . . . . . . . . . . . 17657G. Biden Issue Approval — Criminal justice reform . . . . . . . . . . . . . . . . . . . . . . . . . . . . . . . . . . . . . . . . . . . . . . . . . . . . . . . . . . . . 17858. Biden Perceived Ideology . . . . . . . . . . . . . . . . . . . . . . . . . . . . . . . . . . . . . . . . . . . . . . . . . . . . . . . . . . . . . . . . . . . . . . . . . 18059. Biden Cares about People Like You . . . . . . . . . . . . . . . . . . . . . . . . . . . . . . . . . . . . . . . . . . . . . . . . . . . . . . . . . . . . . . . . . . . . 18260. Biden Likability . . . . . . . . . . . . . . . . . . . . . . . . . . . . . . . . . . . . . . . . . . . . . . . . . . . . . . . . . . . . . . . . . . . . . . . . . . . . . . . 18461. Biden Leadership Abilities . . . . . . . . . . . . . . . . . . . . . . . . . . . . . . . . . . . . . . . . . . . . . . . . . . . . . . . . . . . . . . . . . . . . . . . . . 18662. Biden Honesty . . . . . . . . . . . . . . . . . . . . . . . . . . . . . . . . . . . . . . . . . . . . . . . . . . . . . . . . . . . . . . . . . . . . . . . . . . . . . . . 18863. Biden Confidence in International Crisis . . . . . . . . . . . . . . . . . . . . . . . . . . . . . . . . . . . . . . . . . . . . . . . . . . . . . . . . . . . . . . . . . 19064. Biden Sincerity . . . . . . . . . . . . . . . . . . . . . . . . . . . . . . . . . . . . . . . . . . . . . . . . . . . . . . . . . . . . . . . . . . . . . . . . . . . . . . . 19265. Biden Bring Country Together . . . . . . . . . . . . . . . . . . . . . . . . . . . . . . . . . . . . . . . . . . . . . . . . . . . . . . . . . . . . . . . . . . . . . . . 19466. Optimism . . . . . . . . . . . . . . . . . . . . . . . . . . . . . . . . . . . . . . . . . . . . . . . . . . . . . . . . . . . . . . . . . . . . . . . . . . . . . . . . . . 19667. Approval of U.S. Congress . . . . . . . . . . . . . . . . . . . . . . . . . . . . . . . . . . . . . . . . . . . . . . . . . . . . . . . . . . . . . . . . . . . . . . . . 19868. Pelosi Job Approval . . . . . . . . . . . . . . . . . . . . . . . . . . . . . . . . . . . . . . . . . . . . . . . . . . . . . . . . . . . . . . . . . . . . . . . . . . . . 20069. Schumer Job Approval . . . . . . . . . . . . . . . . . . . . . . . . . . . . . . . . . . . . . . . . . . . . . . . . . . . . . . . . . . . . . . . . . . . . . . . . . . . 20270. McConnell Job Approval . . . . . . . . . . . . . . . . . . . . . . . . . . . . . . . . . . . . . . . . . . . . . . . . . . . . . . . . . . . . . . . . . . . . . . . . . . 20471. Approval of the Supreme Court of the United States . . . . . . . . . . . . . . . . . . . . . . . . . . . . . . . . . . . . . . . . . . . . . . . . . . . . . . . . . . . 20672. Ideology of the Supreme Court of the United States . . . . . . . . . . . . . . . . . . . . . . . . . . . . . . . . . . . . . . . . . . . . . . . . . . . . . . . . . . . 20873. Trend of Economy . . . . . . . . . . . . . . . . . . . . . . . . . . . . . . . . . . . . . . . . . . . . . . . . . . . . . . . . . . . . . . . . . . . . . . . . . . . . . 21074. Stock Market Expectations Over Next Year . . . . . . . . . . . . . . . . . . . . . . . . . . . . . . . . . . . . . . . . . . . . . . . . . . . . . . . . . . . . . . . . 21275. Stock Ownership . . . . . . . . . . . . . . . . . . . . . . . . . . . . . . . . . . . . . . . . . . . . . . . . . . . . . . . . . . . . . . . . . . . . . . . . . . . . . . 21476. Change in Personal Finances Over Past Year . . . . . . . . . . . . . . . . . . . . . . . . . . . . . . . . . . . . . . . . . . . . . . . . . . . . . . . . . . . . . . 21577. Jobs in Six Months . . . . . . . . . . . . . . . . . . . . . . . . . . . . . . . . . . . . . . . . . . . . . . . . . . . . . . . . . . . . . . . . . . . . . . . . . . . . . 21778. Worried about Losing Job . . . . . . . . . . . . . . . . . . . . . . . . . . . . . . . . . . . . . . . . . . . . . . . . . . . . . . . . . . . . . . . . . . . . . . . . . 21979. Job Availability . . . . . . . . . . . . . . . . . . . . . . . . . . . . . . . . . . . . . . . . . . . . . . . . . . . . . . . . . . . . . . . . . . . . . . . . . . . . . . . 22180. Happy with Job . . . . . . . . . . . . . . . . . . . . . . . . . . . . . . . . . . . . . . . . . . . . . . . . . . . . . . . . . . . . . . . . . . . . . . . . . . . . . . . 223
3

The Economist /YouGov PollJuly 17 - 20, 2021 - 1500 U.S. Adult Citizens
1. Direction of CountryWould you say things in this country today are...
Gender White Men White Women Race
Total Male Female No degree College Grad No degree College Grad Black Hispanic
Generally headed in theright direction 35% 38% 33% 29% 39% 24% 33% 54% 45%
Off on the wrong track 51% 52% 50% 62% 55% 57% 53% 33% 34%
Not sure 14% 10% 18% 9% 6% 18% 14% 13% 20%
Totals 100% 100% 101% 100% 100% 99% 100% 100% 99%
Unweighted N (1,500) (731) (769) (331) (191) (347) (202) (168) (164)
Age Income Region
Total 18-29 30-44 45-64 65+ Under $50K $50-100K $100K or more Northeast Midwest South West
Generally headed in theright direction 35% 37% 37% 35% 33% 33% 37% 44% 37% 27% 34% 44%
Off on the wrong track 51% 42% 44% 55% 59% 50% 53% 47% 48% 57% 53% 43%
Not sure 14% 22% 19% 10% 8% 17% 10% 9% 15% 16% 13% 13%
Totals 100% 101% 100% 100% 100% 100% 100% 100% 100% 100% 100% 100%
Unweighted N (1,500) (195) (355) (595) (355) (602) (420) (287) (253) (308) (540) (399)
4

The Economist /YouGov PollJuly 17 - 20, 2021 - 1500 U.S. Adult Citizens
Registered 2020 Vote Party ID Ideology
Total Voters Biden Trump Dem Rep Ind Lib Mod Con
Generally headed in theright direction 35% 36% 64% 6% 68% 7% 29% 64% 40% 11%
Off on the wrong track 51% 52% 22% 89% 20% 86% 57% 24% 48% 81%
Not sure 14% 11% 14% 4% 11% 7% 14% 12% 12% 8%
Totals 100% 99% 100% 99% 99% 100% 100% 100% 100% 100%
Unweighted N (1,500) (1,272) (584) (531) (516) (371) (445) (436) (430) (492)
5

The Economist /YouGov PollJuly 17 - 20, 2021 - 1500 U.S. Adult Citizens
2. State of the EconomyHow would you describe the current state of the American economy?
Gender White Men White Women Race
Total Male Female No degree College Grad No degree College Grad Black Hispanic
Excellent 4% 6% 2% 2% 9% 1% 4% 8% 3%
Good 24% 28% 21% 23% 36% 14% 28% 26% 26%
Fair 37% 34% 40% 36% 34% 39% 40% 44% 31%
Poor 29% 27% 30% 33% 21% 38% 26% 14% 28%
Don’t know 6% 6% 7% 6% 1% 8% 2% 7% 12%
Totals 100% 101% 100% 100% 101% 100% 100% 99% 100%
Unweighted N (1,500) (731) (769) (331) (191) (347) (202) (168) (164)
Age Income Region
Total 18-29 30-44 45-64 65+ Under $50K $50-100K $100K or more Northeast Midwest South West
Excellent 4% 5% 7% 2% 1% 4% 3% 7% 5% 2% 3% 6%
Good 24% 22% 26% 24% 23% 17% 29% 38% 26% 18% 23% 30%
Fair 37% 37% 32% 38% 41% 39% 39% 31% 37% 41% 37% 34%
Poor 29% 24% 27% 30% 31% 34% 25% 22% 25% 32% 30% 26%
Don’t know 6% 12% 7% 5% 3% 7% 4% 1% 7% 7% 7% 4%
Totals 100% 100% 99% 99% 99% 101% 100% 99% 100% 100% 100% 100%
Unweighted N (1,500) (195) (355) (595) (355) (602) (420) (287) (253) (308) (540) (399)
6

The Economist /YouGov PollJuly 17 - 20, 2021 - 1500 U.S. Adult Citizens
Registered 2020 Vote Party ID Ideology
Total Voters Biden Trump Dem Rep Ind Lib Mod Con
Excellent 4% 4% 5% 2% 5% 3% 4% 7% 4% 2%
Good 24% 25% 40% 11% 42% 12% 20% 40% 30% 11%
Fair 37% 38% 38% 38% 38% 38% 38% 35% 40% 38%
Poor 29% 29% 12% 47% 12% 45% 32% 15% 22% 46%
Don’t know 6% 5% 5% 2% 4% 2% 7% 4% 5% 3%
Totals 100% 101% 100% 100% 101% 100% 101% 101% 101% 100%
Unweighted N (1,500) (1,272) (584) (531) (516) (371) (445) (436) (430) (492)
7

The Economist /YouGov PollJuly 17 - 20, 2021 - 1500 U.S. Adult Citizens
3. Unemployment or InflationWhich do you think is a more important problem facing the U.S. today: unemployment or inflation?
Gender White Men White Women Race
Total Male Female No degree College Grad No degree College Grad Black Hispanic
Unemployment 19% 21% 18% 18% 23% 13% 24% 23% 20%
Inflation 30% 33% 26% 37% 38% 29% 31% 19% 24%
Both equal 41% 38% 45% 38% 33% 48% 39% 48% 41%
Not sure 9% 8% 11% 8% 6% 10% 6% 9% 15%
Totals 99% 100% 100% 101% 100% 100% 100% 99% 100%
Unweighted N (1,499) (730) (769) (331) (190) (347) (202) (168) (164)
Age Income Region
Total 18-29 30-44 45-64 65+ Under $50K $50-100K $100K or more Northeast Midwest South West
Unemployment 19% 23% 23% 15% 18% 19% 17% 24% 21% 18% 15% 26%
Inflation 30% 28% 21% 34% 35% 26% 35% 32% 30% 32% 31% 25%
Both equal 41% 33% 41% 45% 43% 45% 40% 38% 40% 41% 43% 39%
Not sure 9% 15% 14% 6% 4% 10% 7% 6% 9% 9% 10% 9%
Totals 99% 99% 99% 100% 100% 100% 99% 100% 100% 100% 99% 99%
Unweighted N (1,499) (195) (355) (595) (354) (601) (420) (287) (253) (308) (540) (398)
8

The Economist /YouGov PollJuly 17 - 20, 2021 - 1500 U.S. Adult Citizens
Registered 2020 Vote Party ID Ideology
Total Voters Biden Trump Dem Rep Ind Lib Mod Con
Unemployment 19% 20% 31% 8% 31% 8% 15% 32% 19% 10%
Inflation 30% 32% 22% 47% 20% 49% 31% 21% 28% 45%
Both equal 41% 43% 40% 44% 41% 41% 46% 39% 45% 42%
Not sure 9% 6% 7% 1% 8% 2% 8% 8% 7% 3%
Totals 99% 101% 100% 100% 100% 100% 100% 100% 99% 100%
Unweighted N (1,499) (1,271) (583) (531) (516) (371) (445) (435) (430) (492)
9

The Economist /YouGov PollJuly 17 - 20, 2021 - 1500 U.S. Adult Citizens
4. Following NewsHow closely are you following the news about COVID-19?
Gender White Men White Women Race
Total Male Female No degree College Grad No degree College Grad Black Hispanic
Very closely 27% 28% 26% 21% 39% 19% 36% 32% 29%
Somewhat closely 43% 44% 42% 43% 47% 46% 40% 45% 35%
Not very closely 21% 19% 22% 24% 12% 24% 20% 14% 23%
Not following at all 9% 9% 10% 11% 3% 12% 4% 9% 13%
Totals 100% 100% 100% 99% 101% 101% 100% 100% 100%
Unweighted N (1,500) (731) (769) (331) (191) (347) (202) (168) (164)
Age Income Region
Total 18-29 30-44 45-64 65+ Under $50K $50-100K $100K or more Northeast Midwest South West
Very closely 27% 12% 23% 33% 36% 23% 30% 38% 31% 25% 25% 30%
Somewhat closely 43% 49% 39% 41% 42% 40% 47% 43% 44% 40% 45% 40%
Not very closely 21% 28% 24% 17% 16% 23% 18% 15% 17% 24% 21% 20%
Not following at all 9% 11% 13% 9% 6% 14% 5% 5% 8% 10% 9% 10%
Totals 100% 100% 99% 100% 100% 100% 100% 101% 100% 99% 100% 100%
Unweighted N (1,500) (195) (355) (595) (355) (602) (420) (287) (253) (308) (540) (399)
10

The Economist /YouGov PollJuly 17 - 20, 2021 - 1500 U.S. Adult Citizens
Registered 2020 Vote Party ID Ideology
Total Voters Biden Trump Dem Rep Ind Lib Mod Con
Very closely 27% 32% 45% 25% 38% 22% 24% 37% 27% 24%
Somewhat closely 43% 44% 45% 44% 47% 42% 41% 49% 44% 40%
Not very closely 21% 18% 9% 23% 11% 27% 23% 10% 22% 23%
Not following at all 9% 6% 1% 8% 4% 9% 12% 4% 7% 12%
Totals 100% 100% 100% 100% 100% 100% 100% 100% 100% 99%
Unweighted N (1,500) (1,272) (584) (531) (516) (371) (445) (436) (430) (492)
11

The Economist /YouGov PollJuly 17 - 20, 2021 - 1500 U.S. Adult Citizens
5. People I Know – Has Been Laid Off from Work Due to COVID-19Do you personally know anyone who... [has been laid off from work due to covid-19]? Check all that apply.
Gender White Men White Women Race
Total Male Female No degree College Grad No degree College Grad Black Hispanic
Yes, me 10% 9% 10% 7% 10% 9% 9% 11% 15%
Yes, a family member 15% 13% 16% 13% 12% 15% 20% 15% 16%
Yes, a close friend 14% 15% 13% 11% 20% 10% 15% 14% 14%
No 65% 65% 65% 68% 62% 70% 61% 62% 63%
Prefer not to say 2% 3% 2% 3% 0% 2% 0% 4% 1%
Unweighted N (1,500) (731) (769) (331) (191) (347) (202) (168) (164)
Age Income Region
Total 18-29 30-44 45-64 65+ Under $50K $50-100K $100K or more Northeast Midwest South West
Yes, me 10% 14% 13% 10% 2% 12% 6% 9% 11% 11% 8% 9%
Yes, a family member 15% 20% 13% 15% 10% 16% 15% 15% 16% 16% 14% 14%
Yes, a close friend 14% 14% 15% 16% 8% 13% 15% 17% 16% 13% 12% 15%
No 65% 55% 64% 63% 77% 64% 67% 63% 60% 66% 68% 63%
Prefer not to say 2% 4% 3% 1% 1% 2% 1% 1% 3% 2% 2% 2%
Unweighted N (1,500) (195) (355) (595) (355) (602) (420) (287) (253) (308) (540) (399)
12

The Economist /YouGov PollJuly 17 - 20, 2021 - 1500 U.S. Adult Citizens
Registered 2020 Vote Party ID Ideology
Total Voters Biden Trump Dem Rep Ind Lib Mod Con
Yes, me 10% 9% 10% 6% 10% 7% 10% 12% 10% 6%
Yes, a family member 15% 14% 15% 14% 15% 13% 15% 14% 16% 14%
Yes, a close friend 14% 15% 16% 11% 15% 10% 16% 16% 15% 11%
No 65% 66% 65% 71% 64% 72% 63% 62% 63% 72%
Prefer not to say 2% 1% 1% 1% 2% 1% 2% 2% 0% 1%
Unweighted N (1,500) (1,272) (584) (531) (516) (371) (445) (436) (430) (492)
13

The Economist /YouGov PollJuly 17 - 20, 2021 - 1500 U.S. Adult Citizens
6. People I Know – Has Tested Positive for COVID-19Do you personally know anyone who... [has tested positive for covid-19]? Check all that apply.
Gender White Men White Women Race
Total Male Female No degree College Grad No degree College Grad Black Hispanic
Yes, me 8% 8% 7% 8% 11% 7% 8% 8% 9%
Yes, a family member 29% 27% 30% 27% 30% 32% 28% 27% 30%
Yes, a close friend 28% 29% 27% 31% 36% 25% 39% 23% 17%
No 44% 44% 45% 42% 36% 44% 40% 49% 52%
Prefer not to say 2% 3% 2% 3% 1% 2% 0% 4% 1%
Unweighted N (1,500) (731) (769) (331) (191) (347) (202) (168) (164)
Age Income Region
Total 18-29 30-44 45-64 65+ Under $50K $50-100K $100K or more Northeast Midwest South West
Yes, me 8% 8% 8% 8% 7% 6% 7% 11% 9% 9% 8% 5%
Yes, a family member 29% 29% 23% 31% 30% 26% 29% 32% 26% 32% 29% 26%
Yes, a close friend 28% 28% 24% 30% 30% 22% 34% 35% 31% 31% 27% 24%
No 44% 41% 52% 42% 43% 51% 41% 35% 42% 42% 45% 48%
Prefer not to say 2% 3% 4% 1% 1% 2% 2% 2% 3% 2% 2% 2%
Unweighted N (1,500) (195) (355) (595) (355) (602) (420) (287) (253) (308) (540) (399)
14

The Economist /YouGov PollJuly 17 - 20, 2021 - 1500 U.S. Adult Citizens
Registered 2020 Vote Party ID Ideology
Total Voters Biden Trump Dem Rep Ind Lib Mod Con
Yes, me 8% 9% 7% 10% 4% 12% 9% 4% 8% 11%
Yes, a family member 29% 30% 30% 32% 27% 30% 28% 29% 27% 31%
Yes, a close friend 28% 31% 34% 30% 28% 29% 31% 33% 27% 30%
No 44% 42% 40% 43% 45% 45% 44% 40% 46% 45%
Prefer not to say 2% 2% 1% 2% 2% 1% 2% 3% 1% 1%
Unweighted N (1,500) (1,272) (584) (531) (516) (371) (445) (436) (430) (492)
15

The Economist /YouGov PollJuly 17 - 20, 2021 - 1500 U.S. Adult Citizens
7. People I Know – Has Died Due to Complications from COVID-19Do you personally know anyone who... [has died due to complications from covid-19]? Check all that apply.
Gender White Men White Women Race
Total Male Female No degree College Grad No degree College Grad Black Hispanic
Yes, a family member 9% 8% 10% 6% 10% 8% 8% 12% 12%
Yes, a close friend 16% 15% 17% 15% 14% 14% 18% 24% 14%
No 73% 74% 72% 77% 74% 76% 73% 61% 69%
Prefer not to say 4% 4% 4% 3% 4% 3% 2% 8% 6%
Unweighted N (1,500) (731) (769) (331) (191) (347) (202) (168) (164)
Age Income Region
Total 18-29 30-44 45-64 65+ Under $50K $50-100K $100K or more Northeast Midwest South West
Yes, a family member 9% 11% 7% 9% 7% 7% 9% 10% 10% 7% 9% 9%
Yes, a close friend 16% 10% 12% 19% 22% 16% 19% 14% 17% 18% 17% 12%
No 73% 75% 75% 71% 72% 74% 72% 75% 72% 74% 70% 77%
Prefer not to say 4% 6% 8% 2% 2% 4% 1% 3% 4% 3% 5% 3%
Unweighted N (1,500) (195) (355) (595) (355) (602) (420) (287) (253) (308) (540) (399)
16

The Economist /YouGov PollJuly 17 - 20, 2021 - 1500 U.S. Adult Citizens
Registered 2020 Vote Party ID Ideology
Total Voters Biden Trump Dem Rep Ind Lib Mod Con
Yes, a family member 9% 9% 10% 7% 9% 9% 9% 9% 9% 8%
Yes, a close friend 16% 18% 21% 18% 20% 17% 16% 16% 19% 17%
No 73% 72% 71% 74% 70% 75% 73% 74% 71% 75%
Prefer not to say 4% 3% 1% 2% 3% 3% 3% 2% 3% 2%
Unweighted N (1,500) (1,272) (584) (531) (516) (371) (445) (436) (430) (492)
17

The Economist /YouGov PollJuly 17 - 20, 2021 - 1500 U.S. Adult Citizens
8. Personal Worry about COVID-19Taking into consideration both your risk of contracting it and the seriousness of the illness, how worried are you personally about experiencing COVID-19?
Gender White Men White Women Race
Total Male Female No degree College Grad No degree College Grad Black Hispanic
Very worried 14% 14% 15% 9% 11% 13% 10% 20% 28%
Somewhat worried 32% 29% 36% 24% 28% 31% 39% 37% 38%
Not too worried 30% 32% 28% 36% 32% 33% 32% 25% 18%
Not worried at all 23% 26% 21% 31% 28% 22% 19% 19% 16%
Totals 99% 101% 100% 100% 99% 99% 100% 101% 100%
Unweighted N (1,499) (730) (769) (330) (191) (347) (202) (168) (164)
Age Income Region
Total 18-29 30-44 45-64 65+ Under $50K $50-100K $100K or more Northeast Midwest South West
Very worried 14% 15% 17% 15% 11% 16% 13% 13% 14% 11% 15% 17%
Somewhat worried 32% 40% 34% 30% 28% 31% 33% 38% 35% 29% 34% 31%
Not too worried 30% 27% 29% 28% 36% 31% 31% 23% 32% 34% 26% 30%
Not worried at all 23% 19% 21% 27% 25% 23% 23% 26% 19% 26% 25% 22%
Totals 99% 101% 101% 100% 100% 101% 100% 100% 100% 100% 100% 100%
Unweighted N (1,499) (195) (355) (595) (354) (602) (419) (287) (252) (308) (540) (399)
18

The Economist /YouGov PollJuly 17 - 20, 2021 - 1500 U.S. Adult Citizens
Registered 2020 Vote Party ID Ideology
Total Voters Biden Trump Dem Rep Ind Lib Mod Con
Very worried 14% 14% 21% 8% 22% 7% 14% 17% 19% 7%
Somewhat worried 32% 32% 40% 19% 40% 23% 29% 43% 33% 20%
Not too worried 30% 30% 30% 33% 26% 34% 31% 29% 30% 32%
Not worried at all 23% 24% 9% 41% 11% 36% 26% 10% 18% 41%
Totals 99% 100% 100% 101% 99% 100% 100% 99% 100% 100%
Unweighted N (1,499) (1,271) (584) (530) (516) (370) (445) (436) (430) (491)
19

The Economist /YouGov PollJuly 17 - 20, 2021 - 1500 U.S. Adult Citizens
9. Frequency of Wearing a FacemaskIn the past seven days, how often have you worn a mask on your face when outside your home?
Gender White Men White Women Race
Total Male Female No degree College Grad No degree College Grad Black Hispanic
Always 27% 24% 30% 12% 17% 21% 17% 57% 47%
Most of the time 16% 16% 16% 14% 17% 12% 15% 22% 19%
Some of the time 26% 26% 26% 30% 29% 31% 35% 12% 18%
Never 31% 34% 27% 44% 37% 37% 32% 9% 16%
Totals 100% 100% 99% 100% 100% 101% 99% 100% 100%
Unweighted N (1,499) (731) (768) (331) (191) (347) (201) (168) (164)
Age Income Region
Total 18-29 30-44 45-64 65+ Under $50K $50-100K $100K or more Northeast Midwest South West
Always 27% 28% 31% 27% 21% 32% 21% 25% 27% 18% 30% 31%
Most of the time 16% 22% 18% 12% 15% 16% 17% 16% 14% 14% 18% 16%
Some of the time 26% 25% 21% 27% 31% 24% 31% 27% 32% 27% 22% 28%
Never 31% 24% 30% 33% 32% 29% 31% 32% 27% 41% 29% 25%
Totals 100% 99% 100% 99% 99% 101% 100% 100% 100% 100% 99% 100%
Unweighted N (1,499) (195) (354) (595) (355) (602) (420) (286) (252) (308) (540) (399)
20

The Economist /YouGov PollJuly 17 - 20, 2021 - 1500 U.S. Adult Citizens
Registered 2020 Vote Party ID Ideology
Total Voters Biden Trump Dem Rep Ind Lib Mod Con
Always 27% 26% 37% 13% 41% 13% 24% 37% 31% 15%
Most of the time 16% 17% 20% 11% 20% 11% 16% 21% 19% 10%
Some of the time 26% 27% 29% 25% 26% 30% 25% 25% 26% 28%
Never 31% 30% 14% 51% 14% 46% 35% 17% 24% 47%
Totals 100% 100% 100% 100% 101% 100% 100% 100% 100% 100%
Unweighted N (1,499) (1,271) (584) (530) (516) (370) (445) (436) (430) (491)
21

The Economist /YouGov PollJuly 17 - 20, 2021 - 1500 U.S. Adult Citizens
10. VaccinationHow would you describe your personal situation regarding COVID-19 vaccines?
Gender White Men White Women Race
Total Male Female No degree College Grad No degree College Grad Black Hispanic
I have received all theinjections required tobe fully vaccinatedagainst COVID-19 58% 57% 59% 55% 69% 56% 72% 49% 47%
I have started thevaccination process,but need another shot 5% 6% 3% 4% 6% 2% 3% 8% 9%
I plan to get vaccinated 8% 10% 6% 6% 7% 5% 2% 17% 10%
I will not get vaccinated 18% 15% 20% 18% 15% 20% 17% 15% 19%
I’m not sure about gettingvaccinated 12% 12% 13% 17% 4% 17% 7% 12% 15%
Totals 101% 100% 101% 100% 101% 100% 101% 101% 100%
Unweighted N (1,495) (729) (766) (330) (191) (345) (202) (168) (164)
22

The Economist /YouGov PollJuly 17 - 20, 2021 - 1500 U.S. Adult Citizens
Age Income Region
Total 18-29 30-44 45-64 65+ Under $50K $50-100K $100K or more Northeast Midwest South West
I have received all theinjections required tobe fully vaccinatedagainst COVID-19 58% 39% 47% 64% 78% 48% 67% 68% 64% 58% 52% 63%
I have started thevaccination process,but need another shot 5% 11% 7% 2% 0% 5% 3% 7% 2% 3% 5% 6%
I plan to get vaccinated 8% 18% 10% 4% 1% 9% 8% 5% 7% 7% 9% 7%
I will not get vaccinated 18% 15% 21% 20% 12% 21% 14% 13% 16% 20% 20% 13%
I’m not sure about gettingvaccinated 12% 17% 15% 10% 8% 16% 8% 6% 11% 12% 14% 11%
Totals 101% 100% 100% 100% 99% 99% 100% 99% 100% 100% 100% 100%
Unweighted N (1,495) (194) (355) (593) (353) (601) (419) (286) (253) (307) (537) (398)
23

The Economist /YouGov PollJuly 17 - 20, 2021 - 1500 U.S. Adult Citizens
Registered 2020 Vote Party ID Ideology
Total Voters Biden Trump Dem Rep Ind Lib Mod Con
I have received all theinjections required tobe fully vaccinatedagainst COVID-19 58% 64% 83% 55% 73% 53% 54% 77% 56% 50%
I have started thevaccination process,but need another shot 5% 4% 4% 2% 6% 3% 5% 6% 6% 3%
I plan to get vaccinated 8% 6% 5% 3% 10% 4% 7% 8% 11% 5%
I will not get vaccinated 18% 16% 3% 28% 4% 30% 20% 5% 14% 30%
I’m not sure about gettingvaccinated 12% 9% 5% 11% 7% 10% 14% 4% 12% 13%
Totals 101% 99% 100% 99% 100% 100% 100% 100% 99% 101%
Unweighted N (1,495) (1,268) (583) (528) (516) (371) (441) (436) (429) (489)
24

The Economist /YouGov PollJuly 17 - 20, 2021 - 1500 U.S. Adult Citizens
11. Vaccine Manufacturer ReceivedWhich vaccine did you receive?Among people who have been vaccinated
Gender White Men White Women Race
Total Male Female No degree College Grad No degree College Grad Black Hispanic
Pfizer-BioNtech 47% 44% 50% 43% 41% 50% 53% 45% 47%
Moderna 40% 40% 39% 44% 46% 40% 37% 39% 27%
Oxford-AstraZeneca 2% 2% 1% 4% 3% 1% 0% 1% 2%
Johnson & Johnson 12% 14% 10% 9% 10% 10% 11% 15% 23%
Totals 101% 100% 100% 100% 100% 101% 101% 100% 99%
Unweighted N (990) (494) (496) (203) (146) (203) (158) (104) (111)
Age Income Region
Total 18-29 30-44 45-64 65+ Under $50K $50-100K $100K or more Northeast Midwest South West
Pfizer-BioNtech 47% 58% 43% 47% 43% 46% 49% 42% 44% 51% 46% 47%
Moderna 40% 17% 41% 39% 53% 43% 37% 39% 43% 39% 39% 40%
Oxford-AstraZeneca 2% 4% 2% 1% 0% 1% 2% 3% 2% 1% 1% 2%
Johnson & Johnson 12% 21% 14% 13% 4% 10% 12% 15% 11% 9% 14% 11%
Totals 101% 100% 100% 100% 100% 100% 100% 99% 100% 100% 100% 100%
Unweighted N (990) (108) (206) (401) (275) (339) (304) (224) (174) (195) (326) (295)
25

The Economist /YouGov PollJuly 17 - 20, 2021 - 1500 U.S. Adult Citizens
Registered 2020 Vote Party ID Ideology
Total Voters Biden Trump Dem Rep Ind Lib Mod Con
Pfizer-BioNtech 47% 46% 49% 41% 47% 41% 48% 51% 44% 41%
Moderna 40% 41% 39% 47% 38% 49% 38% 37% 41% 47%
Oxford-AstraZeneca 2% 1% 0% 1% 2% 1% 1% 1% 1% 2%
Johnson & Johnson 12% 12% 12% 11% 14% 8% 13% 12% 14% 11%
Totals 101% 100% 100% 100% 101% 99% 100% 101% 100% 101%
Unweighted N (990) (895) (513) (305) (426) (216) (272) (373) (290) (266)
26

The Economist /YouGov PollJuly 17 - 20, 2021 - 1500 U.S. Adult Citizens
12. Side Effects of VaccinationHave you experienced any negative reactions to the vaccine?Among people who have been vaccinated
Gender White Men White Women Race
Total Male Female No degree College Grad No degree College Grad Black Hispanic
Yes 21% 18% 23% 17% 23% 21% 28% 16% 11%
No 76% 79% 73% 81% 74% 75% 69% 78% 87%
Not sure 3% 3% 3% 2% 2% 4% 2% 7% 2%
Totals 100% 100% 99% 100% 99% 100% 99% 101% 100%
Unweighted N (991) (494) (497) (203) (146) (204) (158) (104) (111)
Age Income Region
Total 18-29 30-44 45-64 65+ Under $50K $50-100K $100K or more Northeast Midwest South West
Yes 21% 30% 22% 22% 13% 20% 19% 27% 26% 20% 19% 19%
No 76% 66% 74% 74% 85% 75% 78% 70% 71% 76% 79% 76%
Not sure 3% 4% 4% 4% 2% 5% 2% 3% 3% 4% 2% 4%
Totals 100% 100% 100% 100% 100% 100% 99% 100% 100% 100% 100% 99%
Unweighted N (991) (108) (206) (402) (275) (340) (304) (224) (174) (196) (326) (295)
27

The Economist /YouGov PollJuly 17 - 20, 2021 - 1500 U.S. Adult Citizens
Registered 2020 Vote Party ID Ideology
Total Voters Biden Trump Dem Rep Ind Lib Mod Con
Yes 21% 21% 21% 19% 22% 21% 20% 26% 14% 21%
No 76% 76% 77% 76% 77% 75% 77% 71% 83% 75%
Not sure 3% 2% 1% 4% 1% 4% 4% 2% 3% 4%
Totals 100% 99% 99% 99% 100% 100% 101% 99% 100% 100%
Unweighted N (991) (895) (513) (305) (426) (216) (272) (373) (290) (266)
28

The Economist /YouGov PollJuly 17 - 20, 2021 - 1500 U.S. Adult Citizens
13. Bigger RiskWhich of do you think is a greater risk: possibly contracting COVID-19, or possibly having a bad reaction to the COVID-19 vaccine?
Gender White Men White Women Race
Total Male Female No degree College Grad No degree College Grad Black Hispanic
Possibly contractingCOVID-19 59% 61% 57% 61% 67% 55% 69% 51% 51%
Possibly having a badreaction to theCOVID-19 vaccine 41% 39% 43% 39% 33% 45% 31% 49% 49%
Totals 100% 100% 100% 100% 100% 100% 100% 100% 100%
Unweighted N (1,485) (726) (759) (327) (190) (342) (201) (166) (162)
Age Income Region
Total 18-29 30-44 45-64 65+ Under $50K $50-100K $100K or more Northeast Midwest South West
Possibly contractingCOVID-19 59% 52% 52% 60% 71% 53% 66% 66% 63% 58% 56% 62%
Possibly having a badreaction to theCOVID-19 vaccine 41% 48% 48% 40% 29% 47% 34% 34% 37% 42% 44% 38%
Totals 100% 100% 100% 100% 100% 100% 100% 100% 100% 100% 100% 100%
Unweighted N (1,485) (193) (352) (591) (349) (595) (417) (284) (249) (306) (534) (396)
29

The Economist /YouGov PollJuly 17 - 20, 2021 - 1500 U.S. Adult Citizens
Registered 2020 Vote Party ID Ideology
Total Voters Biden Trump Dem Rep Ind Lib Mod Con
Possibly contractingCOVID-19 59% 63% 81% 48% 76% 48% 56% 82% 60% 44%
Possibly having a badreaction to theCOVID-19 vaccine 41% 37% 19% 52% 24% 52% 44% 18% 40% 56%
Totals 100% 100% 100% 100% 100% 100% 100% 100% 100% 100%
Unweighted N (1,485) (1,262) (583) (525) (515) (363) (440) (435) (427) (484)
30

The Economist /YouGov PollJuly 17 - 20, 2021 - 1500 U.S. Adult Citizens
14. Biden Job Approval on COVID-19Do you approve or disapprove of the way Joe Biden is handling COVID-19?
Gender White Men White Women Race
Total Male Female No degree College Grad No degree College Grad Black Hispanic
Strongly approve 28% 26% 29% 22% 30% 20% 37% 45% 25%
Somewhat approve 24% 24% 24% 17% 26% 23% 21% 25% 30%
Somewhat disapprove 11% 11% 10% 13% 12% 14% 5% 10% 10%
Strongly disapprove 25% 29% 22% 37% 27% 27% 26% 5% 15%
Not sure 13% 10% 16% 11% 5% 16% 10% 14% 20%
Totals 101% 100% 101% 100% 100% 100% 99% 99% 100%
Unweighted N (1,499) (730) (769) (331) (191) (347) (202) (167) (164)
Age Income Region
Total 18-29 30-44 45-64 65+ Under $50K $50-100K $100K or more Northeast Midwest South West
Strongly approve 28% 14% 25% 33% 35% 26% 30% 34% 35% 27% 22% 32%
Somewhat approve 24% 37% 28% 18% 16% 24% 23% 23% 26% 18% 24% 26%
Somewhat disapprove 11% 14% 11% 9% 11% 12% 12% 9% 9% 14% 11% 8%
Strongly disapprove 25% 12% 18% 32% 34% 23% 27% 27% 21% 25% 28% 23%
Not sure 13% 22% 19% 8% 5% 16% 8% 6% 9% 16% 14% 11%
Totals 101% 99% 101% 100% 101% 101% 100% 99% 100% 100% 99% 100%
Unweighted N (1,499) (194) (355) (595) (355) (602) (420) (286) (252) (308) (540) (399)
31

The Economist /YouGov PollJuly 17 - 20, 2021 - 1500 U.S. Adult Citizens
Registered 2020 Vote Party ID Ideology
Total Voters Biden Trump Dem Rep Ind Lib Mod Con
Strongly approve 28% 32% 64% 3% 60% 5% 19% 56% 31% 6%
Somewhat approve 24% 22% 30% 11% 28% 14% 27% 29% 31% 12%
Somewhat disapprove 11% 10% 1% 18% 4% 19% 12% 3% 13% 16%
Strongly disapprove 25% 28% 2% 62% 2% 55% 28% 5% 14% 57%
Not sure 13% 8% 3% 7% 6% 7% 14% 7% 12% 9%
Totals 101% 100% 100% 101% 100% 100% 100% 100% 101% 100%
Unweighted N (1,499) (1,271) (584) (531) (516) (371) (445) (436) (430) (491)
32

The Economist /YouGov PollJuly 17 - 20, 2021 - 1500 U.S. Adult Citizens
15. Most New COVID-19 CasesAre most new cases of COVID-19 among people who are. . .
Gender White Men White Women Race
Total Male Female No degree College Grad No degree College Grad Black Hispanic
Vaccinated 7% 8% 7% 6% 10% 4% 8% 7% 14%
Unvaccinated 58% 61% 55% 60% 71% 53% 67% 55% 47%
Equally split betweenvaccinated andunvaccinated 14% 12% 15% 13% 9% 17% 12% 15% 18%
Not sure 21% 18% 23% 22% 10% 26% 14% 23% 21%
Totals 100% 99% 100% 101% 100% 100% 101% 100% 100%
Unweighted N (1,497) (730) (767) (331) (190) (346) (201) (168) (164)
Age Income Region
Total 18-29 30-44 45-64 65+ Under $50K $50-100K $100K or more Northeast Midwest South West
Vaccinated 7% 11% 13% 5% 2% 7% 7% 9% 9% 5% 8% 7%
Unvaccinated 58% 49% 46% 60% 76% 52% 68% 62% 64% 59% 52% 63%
Equally split betweenvaccinated andunvaccinated 14% 16% 16% 14% 9% 16% 11% 15% 11% 12% 16% 14%
Not sure 21% 24% 25% 20% 13% 25% 14% 14% 16% 24% 23% 17%
Totals 100% 100% 100% 99% 100% 100% 100% 100% 100% 100% 99% 101%
Unweighted N (1,497) (194) (354) (594) (355) (601) (420) (285) (252) (307) (540) (398)
33

The Economist /YouGov PollJuly 17 - 20, 2021 - 1500 U.S. Adult Citizens
Registered 2020 Vote Party ID Ideology
Total Voters Biden Trump Dem Rep Ind Lib Mod Con
Vaccinated 7% 7% 4% 8% 6% 9% 7% 6% 6% 10%
Unvaccinated 58% 64% 85% 51% 75% 50% 56% 81% 60% 48%
Equally split betweenvaccinated andunvaccinated 14% 13% 4% 22% 5% 19% 18% 4% 16% 19%
Not sure 21% 16% 7% 20% 14% 22% 19% 9% 18% 23%
Totals 100% 100% 100% 101% 100% 100% 100% 100% 100% 100%
Unweighted N (1,497) (1,269) (582) (531) (514) (371) (444) (435) (428) (492)
34

The Economist /YouGov PollJuly 17 - 20, 2021 - 1500 U.S. Adult Citizens
16. Unvaccinated Good ReasonsDo you believe that most unvaccinated Americans have a good reason for not being vaccinated?Asked of those who have been vaccinated or plan on getting vaccinated
Gender White Men White Women Race
Total Male Female No degree College Grad No degree College Grad Black Hispanic
Yes 17% 21% 13% 21% 19% 11% 10% 29% 11%
No 62% 62% 63% 59% 70% 59% 76% 52% 63%
Not sure 20% 17% 24% 21% 10% 30% 14% 19% 26%
Totals 99% 100% 100% 101% 99% 100% 100% 100% 100%
Unweighted N (1,081) (550) (531) (222) (160) (218) (162) (126) (121)
Age Income Region
Total 18-29 30-44 45-64 65+ Under $50K $50-100K $100K or more Northeast Midwest South West
Yes 17% 19% 17% 20% 12% 18% 15% 22% 20% 14% 20% 14%
No 62% 57% 62% 61% 69% 57% 70% 63% 64% 64% 58% 67%
Not sure 20% 24% 21% 19% 19% 25% 16% 15% 16% 22% 22% 19%
Totals 99% 100% 100% 100% 100% 100% 101% 100% 100% 100% 100% 100%
Unweighted N (1,081) (137) (240) (424) (280) (382) (334) (237) (187) (213) (364) (317)
35

The Economist /YouGov PollJuly 17 - 20, 2021 - 1500 U.S. Adult Citizens
Registered 2020 Vote Party ID Ideology
Total Voters Biden Trump Dem Rep Ind Lib Mod Con
Yes 17% 18% 5% 38% 11% 31% 19% 9% 16% 32%
No 62% 65% 84% 42% 73% 46% 63% 80% 64% 42%
Not sure 20% 17% 11% 21% 16% 23% 18% 11% 20% 25%
Totals 99% 100% 100% 101% 100% 100% 100% 100% 100% 99%
Unweighted N (1,081) (961) (540) (323) (467) (230) (294) (400) (323) (288)
36

The Economist /YouGov PollJuly 17 - 20, 2021 - 1500 U.S. Adult Citizens
17. Heard about Delta VariantHow much, if anything, have you heard in the news recently about the Delta variant of the COVID-19 virus?
Gender White Men White Women Race
Total Male Female No degree College Grad No degree College Grad Black Hispanic
A lot 40% 40% 40% 35% 51% 32% 57% 39% 35%
A little 48% 50% 46% 52% 48% 52% 37% 42% 48%
Nothing at all 12% 10% 15% 13% 1% 17% 6% 18% 18%
Totals 100% 100% 101% 100% 100% 101% 100% 99% 101%
Unweighted N (1,497) (730) (767) (330) (191) (346) (202) (167) (164)
Age Income Region
Total 18-29 30-44 45-64 65+ Under $50K $50-100K $100K or more Northeast Midwest South West
A lot 40% 15% 33% 48% 57% 34% 44% 50% 44% 38% 37% 43%
A little 48% 61% 51% 44% 39% 47% 47% 49% 45% 51% 48% 46%
Nothing at all 12% 24% 15% 8% 4% 19% 9% 1% 11% 11% 14% 11%
Totals 100% 100% 99% 100% 100% 100% 100% 100% 100% 100% 99% 100%
Unweighted N (1,497) (195) (354) (594) (354) (600) (419) (287) (253) (307) (540) (397)
37

The Economist /YouGov PollJuly 17 - 20, 2021 - 1500 U.S. Adult Citizens
Registered 2020 Vote Party ID Ideology
Total Voters Biden Trump Dem Rep Ind Lib Mod Con
A lot 40% 45% 61% 37% 52% 31% 40% 53% 39% 36%
A little 48% 45% 35% 56% 38% 57% 49% 38% 49% 54%
Nothing at all 12% 10% 4% 7% 10% 12% 11% 9% 12% 9%
Totals 100% 100% 100% 100% 100% 100% 100% 100% 100% 99%
Unweighted N (1,497) (1,271) (584) (530) (516) (370) (444) (436) (430) (491)
38

The Economist /YouGov PollJuly 17 - 20, 2021 - 1500 U.S. Adult Citizens
18. Worry about Delta VariantA variant of the COVID-19 virus known as the Delta variant, first identified in India, is spreading rapidly in some regions, and now makes up the majorityof COVID-19 cases in the United States. Taking into consideration both your risk of contracting it and the seriousness of the illness, how worried are youpersonally about experiencing this new variant?
Gender White Men White Women Race
Total Male Female No degree College Grad No degree College Grad Black Hispanic
Very worried 15% 14% 16% 11% 8% 11% 9% 25% 30%
Somewhat worried 35% 32% 38% 26% 35% 38% 40% 34% 40%
Not too worried 29% 30% 29% 34% 32% 33% 34% 26% 17%
Not worried at all 21% 24% 17% 28% 25% 18% 17% 16% 13%
Totals 100% 100% 100% 99% 100% 100% 100% 101% 100%
Unweighted N (1,496) (731) (765) (331) (191) (346) (200) (167) (164)
Age Income Region
Total 18-29 30-44 45-64 65+ Under $50K $50-100K $100K or more Northeast Midwest South West
Very worried 15% 15% 17% 17% 10% 18% 13% 13% 15% 13% 15% 17%
Somewhat worried 35% 46% 39% 30% 29% 34% 37% 38% 36% 34% 35% 34%
Not too worried 29% 25% 25% 28% 39% 27% 32% 27% 29% 29% 29% 30%
Not worried at all 21% 13% 19% 25% 22% 21% 18% 22% 19% 23% 21% 18%
Totals 100% 99% 100% 100% 100% 100% 100% 100% 99% 99% 100% 99%
Unweighted N (1,496) (194) (353) (594) (355) (600) (419) (286) (252) (307) (540) (397)
39

The Economist /YouGov PollJuly 17 - 20, 2021 - 1500 U.S. Adult Citizens
Registered 2020 Vote Party ID Ideology
Total Voters Biden Trump Dem Rep Ind Lib Mod Con
Very worried 15% 15% 23% 7% 26% 7% 12% 22% 17% 7%
Somewhat worried 35% 34% 43% 21% 43% 26% 32% 46% 38% 21%
Not too worried 29% 29% 26% 36% 23% 37% 32% 25% 31% 34%
Not worried at all 21% 21% 7% 37% 8% 30% 24% 8% 15% 37%
Totals 100% 99% 99% 101% 100% 100% 100% 101% 101% 99%
Unweighted N (1,496) (1,270) (584) (531) (516) (371) (443) (436) (430) (491)
40

The Economist /YouGov PollJuly 17 - 20, 2021 - 1500 U.S. Adult Citizens
19. Watch OlympicsThinking about the Summer Olympics this year, how much of the games do you expect you will you watch?
Gender White Men White Women Race
Total Male Female No degree College Grad No degree College Grad Black Hispanic
I will watch events everyday 6% 7% 6% 4% 13% 5% 5% 10% 8%
I will watch lots of eventswhen I can 11% 12% 11% 8% 18% 8% 14% 15% 13%
I will watch a few events 31% 33% 29% 31% 30% 26% 42% 33% 29%
I will not watch any ofthem 40% 37% 42% 44% 35% 49% 30% 27% 36%
Not sure 12% 11% 12% 13% 5% 12% 10% 15% 14%
Totals 100% 100% 100% 100% 101% 100% 101% 100% 100%
Unweighted N (1,499) (731) (768) (331) (191) (346) (202) (168) (164)
Age Income Region
Total 18-29 30-44 45-64 65+ Under $50K $50-100K $100K or more Northeast Midwest South West
I will watch events everyday 6% 6% 7% 7% 4% 5% 7% 10% 8% 6% 6% 7%
I will watch lots of eventswhen I can 11% 12% 13% 11% 10% 11% 14% 13% 11% 10% 11% 14%
I will watch a few events 31% 34% 28% 28% 35% 28% 37% 37% 33% 25% 32% 32%
I will not watch any ofthem 40% 35% 35% 45% 41% 43% 34% 32% 38% 46% 39% 36%
Not sure 12% 13% 17% 9% 9% 13% 9% 8% 9% 13% 13% 10%
Totals 100% 100% 100% 100% 99% 100% 101% 100% 99% 100% 101% 99%
Unweighted N (1,499) (195) (354) (595) (355) (601) (420) (287) (253) (307) (540) (399)
41

The Economist /YouGov PollJuly 17 - 20, 2021 - 1500 U.S. Adult Citizens
Registered 2020 Vote Party ID Ideology
Total Voters Biden Trump Dem Rep Ind Lib Mod Con
I will watch events everyday 6% 7% 11% 5% 10% 5% 6% 9% 7% 5%
I will watch lots of eventswhen I can 11% 12% 13% 9% 13% 9% 12% 13% 13% 9%
I will watch a few events 31% 32% 38% 31% 36% 32% 29% 37% 34% 29%
I will not watch any ofthem 40% 39% 30% 47% 31% 47% 41% 32% 35% 47%
Not sure 12% 10% 8% 8% 10% 8% 12% 10% 10% 10%
Totals 100% 100% 100% 100% 100% 101% 100% 101% 99% 100%
Unweighted N (1,499) (1,271) (584) (530) (516) (371) (444) (436) (430) (491)
42

The Economist /YouGov PollJuly 17 - 20, 2021 - 1500 U.S. Adult Citizens
20. Ioc Good Decision During COVID-19Do you think the International Olympic Committee made a good decision in holding the Summer Olympic Games in Tokyo, Japan in light of the COVID-19pandemic?
Gender White Men White Women Race
Total Male Female No degree College Grad No degree College Grad Black Hispanic
Good decision 21% 28% 15% 26% 32% 13% 18% 17% 25%
Bad decision 35% 35% 35% 31% 40% 33% 39% 39% 28%
Not sure 44% 37% 50% 43% 28% 53% 43% 44% 47%
Totals 100% 100% 100% 100% 100% 99% 100% 100% 100%
Unweighted N (1,500) (731) (769) (331) (191) (347) (202) (168) (164)
Age Income Region
Total 18-29 30-44 45-64 65+ Under $50K $50-100K $100K or more Northeast Midwest South West
Good decision 21% 29% 19% 23% 14% 17% 26% 29% 20% 22% 21% 21%
Bad decision 35% 24% 33% 37% 45% 35% 36% 37% 36% 31% 36% 38%
Not sure 44% 47% 48% 41% 41% 48% 38% 34% 45% 47% 43% 41%
Totals 100% 100% 100% 101% 100% 100% 100% 100% 101% 100% 100% 100%
Unweighted N (1,500) (195) (355) (595) (355) (602) (420) (287) (253) (308) (540) (399)
43

The Economist /YouGov PollJuly 17 - 20, 2021 - 1500 U.S. Adult Citizens
Registered 2020 Vote Party ID Ideology
Total Voters Biden Trump Dem Rep Ind Lib Mod Con
Good decision 21% 23% 15% 32% 16% 25% 25% 15% 23% 28%
Bad decision 35% 37% 49% 27% 45% 33% 32% 50% 34% 29%
Not sure 44% 40% 36% 42% 39% 42% 43% 35% 43% 43%
Totals 100% 100% 100% 101% 100% 100% 100% 100% 100% 100%
Unweighted N (1,500) (1,272) (584) (531) (516) (371) (445) (436) (430) (492)
44

The Economist /YouGov PollJuly 17 - 20, 2021 - 1500 U.S. Adult Citizens
21. Successful OlympicsDo you expect the Summer Olympics in Tokyo, Japan to be successful or unsuccessful?
Gender White Men White Women Race
Total Male Female No degree College Grad No degree College Grad Black Hispanic
Very successful 9% 10% 7% 8% 9% 7% 5% 15% 13%
Somewhat successful 31% 31% 32% 30% 28% 31% 39% 32% 29%
Somewhat unsuccessful 19% 23% 15% 25% 28% 13% 22% 12% 14%
Very unsuccessful 10% 12% 9% 10% 18% 9% 7% 9% 12%
Not sure 31% 25% 37% 28% 17% 40% 27% 32% 33%
Totals 100% 101% 100% 101% 100% 100% 100% 100% 101%
Unweighted N (1,499) (730) (769) (331) (191) (347) (202) (167) (164)
Age Income Region
Total 18-29 30-44 45-64 65+ Under $50K $50-100K $100K or more Northeast Midwest South West
Very successful 9% 14% 11% 7% 4% 10% 7% 10% 11% 6% 8% 11%
Somewhat successful 31% 34% 26% 32% 33% 28% 38% 35% 31% 33% 32% 29%
Somewhat unsuccessful 19% 11% 20% 19% 25% 18% 18% 24% 19% 19% 19% 20%
Very unsuccessful 10% 9% 11% 10% 10% 9% 11% 14% 12% 8% 10% 12%
Not sure 31% 32% 33% 31% 28% 34% 25% 17% 28% 35% 32% 29%
Totals 100% 100% 101% 99% 100% 99% 99% 100% 101% 101% 101% 101%
Unweighted N (1,499) (195) (355) (594) (355) (601) (420) (287) (253) (308) (539) (399)
45

The Economist /YouGov PollJuly 17 - 20, 2021 - 1500 U.S. Adult Citizens
Registered 2020 Vote Party ID Ideology
Total Voters Biden Trump Dem Rep Ind Lib Mod Con
Very successful 9% 9% 9% 7% 10% 9% 6% 9% 9% 9%
Somewhat successful 31% 33% 34% 34% 33% 35% 32% 30% 38% 32%
Somewhat unsuccessful 19% 19% 24% 18% 20% 18% 22% 24% 21% 18%
Very unsuccessful 10% 11% 8% 12% 11% 9% 9% 12% 7% 12%
Not sure 31% 28% 25% 27% 27% 28% 30% 25% 26% 29%
Totals 100% 100% 100% 98% 101% 99% 99% 100% 101% 100%
Unweighted N (1,499) (1,271) (583) (531) (515) (371) (445) (436) (429) (492)
46

The Economist /YouGov PollJuly 17 - 20, 2021 - 1500 U.S. Adult Citizens
22. Attend OlympicsIf you could afford it and were permitted to attend, would you want to go see the Olympic Games in person in Tokyo this year or not?Asked of respondents who indicated they plan to watch the Olympic Games
Gender White Men White Women Race
Total Male Female No degree College Grad No degree College Grad Black Hispanic
Yes 23% 30% 15% 26% 38% 12% 16% 22% 28%
No 70% 63% 76% 69% 58% 77% 81% 67% 63%
Not sure 8% 7% 9% 5% 4% 11% 4% 11% 9%
Totals 101% 100% 100% 100% 100% 100% 101% 100% 100%
Unweighted N (754) (386) (368) (142) (118) (135) (124) (98) (94)
Age Income Region
Total 18-29 30-44 45-64 65+ Under $50K $50-100K $100K or more Northeast Midwest South West
Yes 23% 30% 27% 23% 11% 19% 23% 31% 24% 27% 19% 24%
No 70% 59% 63% 70% 86% 73% 71% 63% 68% 67% 74% 67%
Not sure 8% 10% 10% 8% 3% 7% 6% 6% 8% 6% 7% 9%
Totals 101% 99% 100% 101% 100% 99% 100% 100% 100% 100% 100% 100%
Unweighted N (754) (109) (180) (285) (180) (271) (240) (174) (133) (134) (261) (226)
47

The Economist /YouGov PollJuly 17 - 20, 2021 - 1500 U.S. Adult Citizens
Registered 2020 Vote Party ID Ideology
Total Voters Biden Trump Dem Rep Ind Lib Mod Con
Yes 23% 22% 18% 28% 21% 21% 30% 21% 22% 25%
No 70% 71% 75% 67% 73% 75% 62% 74% 70% 68%
Not sure 8% 6% 7% 5% 6% 3% 9% 5% 8% 7%
Totals 101% 99% 100% 100% 100% 99% 101% 100% 100% 100%
Unweighted N (754) (666) (366) (238) (317) (167) (210) (269) (234) (215)
48

The Economist /YouGov PollJuly 17 - 20, 2021 - 1500 U.S. Adult Citizens
23. Approve of Olympics Not Allowing SpectatorsDo you approve or disapprove of the decision to not allow spectators at any events in the Summer Olympics this year?
Gender White Men White Women Race
Total Male Female No degree College Grad No degree College Grad Black Hispanic
Strongly approve 32% 28% 35% 23% 33% 31% 47% 36% 25%
Somewhat approve 21% 24% 18% 19% 23% 20% 20% 20% 29%
Somewhat disapprove 13% 15% 12% 20% 12% 15% 12% 11% 8%
Strongly disapprove 12% 15% 9% 14% 19% 10% 7% 8% 9%
Not sure 22% 19% 26% 23% 11% 24% 15% 25% 30%
Totals 100% 101% 100% 99% 98% 100% 101% 100% 101%
Unweighted N (1,494) (729) (765) (330) (191) (346) (201) (166) (163)
Age Income Region
Total 18-29 30-44 45-64 65+ Under $50K $50-100K $100K or more Northeast Midwest South West
Strongly approve 32% 24% 28% 35% 36% 30% 37% 34% 33% 28% 31% 35%
Somewhat approve 21% 32% 24% 14% 18% 23% 19% 21% 26% 20% 18% 24%
Somewhat disapprove 13% 9% 10% 14% 18% 13% 16% 15% 12% 13% 16% 11%
Strongly disapprove 12% 10% 10% 15% 11% 8% 13% 18% 10% 14% 11% 13%
Not sure 22% 25% 27% 21% 17% 26% 15% 12% 18% 26% 24% 18%
Totals 100% 100% 99% 99% 100% 100% 100% 100% 99% 101% 100% 101%
Unweighted N (1,494) (194) (352) (593) (355) (599) (418) (286) (251) (307) (538) (398)
49

The Economist /YouGov PollJuly 17 - 20, 2021 - 1500 U.S. Adult Citizens
Registered 2020 Vote Party ID Ideology
Total Voters Biden Trump Dem Rep Ind Lib Mod Con
Strongly approve 32% 35% 55% 18% 47% 20% 27% 50% 34% 19%
Somewhat approve 21% 20% 24% 14% 23% 17% 23% 24% 26% 15%
Somewhat disapprove 13% 15% 7% 23% 8% 22% 16% 6% 14% 21%
Strongly disapprove 12% 13% 4% 24% 5% 20% 14% 5% 10% 21%
Not sure 22% 17% 11% 19% 16% 21% 21% 14% 17% 23%
Totals 100% 100% 101% 98% 99% 100% 101% 99% 101% 99%
Unweighted N (1,494) (1,268) (582) (530) (515) (370) (444) (435) (429) (489)
50

The Economist /YouGov PollJuly 17 - 20, 2021 - 1500 U.S. Adult Citizens
24. Approve of U.S. Sending AthletesDo you approve or disapprove of the decision for the United States to send athletes to the Summer Olympics Games in Tokyo, Japan in light of the COVID-19pandemic?
Gender White Men White Women Race
Total Male Female No degree College Grad No degree College Grad Black Hispanic
Strongly approve 20% 26% 15% 27% 31% 15% 23% 11% 15%
Somewhat approve 26% 28% 24% 24% 33% 25% 29% 23% 23%
Somewhat disapprove 17% 16% 18% 15% 18% 18% 15% 19% 18%
Strongly disapprove 11% 9% 12% 9% 6% 12% 6% 17% 16%
Not sure 26% 21% 32% 24% 12% 30% 27% 30% 28%
Totals 100% 100% 101% 99% 100% 100% 100% 100% 100%
Unweighted N (1,493) (727) (766) (330) (190) (346) (200) (167) (163)
Age Income Region
Total 18-29 30-44 45-64 65+ Under $50K $50-100K $100K or more Northeast Midwest South West
Strongly approve 20% 19% 17% 25% 17% 15% 27% 27% 20% 21% 20% 21%
Somewhat approve 26% 27% 22% 25% 29% 25% 27% 31% 29% 25% 23% 28%
Somewhat disapprove 17% 13% 18% 16% 23% 18% 17% 16% 17% 17% 18% 16%
Strongly disapprove 11% 7% 12% 10% 13% 13% 9% 7% 10% 7% 13% 11%
Not sure 26% 33% 32% 23% 18% 30% 20% 18% 25% 29% 27% 23%
Totals 100% 99% 101% 99% 100% 101% 100% 99% 101% 99% 101% 99%
Unweighted N (1,493) (192) (353) (593) (355) (600) (417) (285) (251) (306) (538) (398)
51
The Economist /YouGov PollJuly 17 - 20, 2021 - 1500 U.S. Adult Citizens
Registered 2020 Vote Party ID Ideology
Total Voters Biden Trump Dem Rep Ind Lib Mod Con
Strongly approve 20% 23% 14% 35% 13% 29% 23% 16% 15% 33%
Somewhat approve 26% 27% 31% 26% 32% 23% 27% 28% 32% 21%
Somewhat disapprove 17% 16% 22% 11% 21% 17% 18% 23% 19% 13%
Strongly disapprove 11% 11% 10% 11% 12% 11% 7% 11% 9% 10%
Not sure 26% 23% 23% 18% 23% 20% 26% 22% 24% 23%
Totals 100% 100% 100% 101% 101% 100% 101% 100% 99% 100%
Unweighted N (1,493) (1,268) (582) (530) (514) (370) (445) (434) (429) (490)
52

The Economist /YouGov PollJuly 17 - 20, 2021 - 1500 U.S. Adult Citizens
25. Athletes VaccinatedDo you believe that Olympics athletes should be required to get vaccinated in order to participate in the Summer Olympic Games?
Gender White Men White Women Race
Total Male Female No degree College Grad No degree College Grad Black Hispanic
They should be requiredto get vaccinated 56% 55% 56% 48% 62% 54% 65% 59% 52%
They should not berequired to getvaccinated 26% 29% 24% 33% 29% 27% 24% 18% 22%
Not sure 18% 17% 19% 19% 9% 19% 11% 23% 26%
Totals 100% 101% 99% 100% 100% 100% 100% 100% 100%
Unweighted N (1,498) (730) (768) (331) (191) (346) (202) (167) (164)
Age Income Region
Total 18-29 30-44 45-64 65+ Under $50K $50-100K $100K or more Northeast Midwest South West
They should be requiredto get vaccinated 56% 50% 51% 56% 66% 53% 59% 60% 59% 54% 52% 61%
They should not berequired to getvaccinated 26% 27% 26% 29% 22% 25% 26% 30% 25% 25% 29% 23%
Not sure 18% 24% 23% 15% 12% 21% 14% 10% 16% 21% 18% 16%
Totals 100% 101% 100% 100% 100% 99% 99% 100% 100% 100% 99% 100%
Unweighted N (1,498) (194) (355) (594) (355) (600) (420) (287) (253) (307) (539) (399)
53

The Economist /YouGov PollJuly 17 - 20, 2021 - 1500 U.S. Adult Citizens
Registered 2020 Vote Party ID Ideology
Total Voters Biden Trump Dem Rep Ind Lib Mod Con
They should be requiredto get vaccinated 56% 58% 85% 35% 77% 41% 52% 82% 60% 35%
They should not berequired to getvaccinated 26% 27% 6% 50% 11% 45% 30% 9% 23% 48%
Not sure 18% 14% 9% 15% 12% 14% 18% 10% 17% 17%
Totals 100% 99% 100% 100% 100% 100% 100% 101% 100% 100%
Unweighted N (1,498) (1,270) (584) (530) (515) (370) (445) (436) (429) (491)
54

The Economist /YouGov PollJuly 17 - 20, 2021 - 1500 U.S. Adult Citizens
26. Likelihood of COVID-19 Outbreak at OlympicsHow likely or unlikely do you think it is that there will be a serious outbreak of COVID-19 among the athletes or staff of the Summer Olympics Games?
Gender White Men White Women Race
Total Male Female No degree College Grad No degree College Grad Black Hispanic
Very likely 14% 12% 16% 9% 12% 17% 20% 14% 17%
Somewhat likely 38% 37% 38% 35% 44% 36% 44% 43% 31%
Not very likely 19% 21% 16% 21% 24% 19% 15% 14% 17%
Not likely at all 9% 11% 6% 12% 11% 6% 7% 6% 7%
Not sure 21% 18% 23% 22% 9% 22% 14% 23% 28%
Totals 101% 99% 99% 99% 100% 100% 100% 100% 100%
Unweighted N (1,496) (729) (767) (330) (191) (346) (202) (167) (164)
Age Income Region
Total 18-29 30-44 45-64 65+ Under $50K $50-100K $100K or more Northeast Midwest South West
Very likely 14% 12% 15% 14% 15% 12% 15% 18% 14% 13% 11% 20%
Somewhat likely 38% 39% 33% 37% 41% 37% 41% 42% 41% 33% 40% 36%
Not very likely 19% 17% 16% 19% 23% 17% 23% 20% 21% 20% 18% 17%
Not likely at all 9% 8% 10% 10% 5% 9% 8% 9% 9% 9% 9% 7%
Not sure 21% 23% 25% 19% 16% 25% 14% 11% 15% 24% 22% 21%
Totals 101% 99% 99% 99% 100% 100% 101% 100% 100% 99% 100% 101%
Unweighted N (1,496) (193) (354) (595) (354) (600) (420) (285) (253) (307) (537) (399)
55

The Economist /YouGov PollJuly 17 - 20, 2021 - 1500 U.S. Adult Citizens
Registered 2020 Vote Party ID Ideology
Total Voters Biden Trump Dem Rep Ind Lib Mod Con
Very likely 14% 15% 23% 8% 22% 8% 12% 24% 14% 7%
Somewhat likely 38% 39% 51% 28% 48% 28% 39% 49% 44% 28%
Not very likely 19% 20% 12% 33% 11% 31% 19% 11% 19% 28%
Not likely at all 9% 9% 2% 15% 3% 16% 9% 2% 6% 18%
Not sure 21% 17% 12% 17% 15% 16% 21% 14% 17% 20%
Totals 101% 100% 100% 101% 99% 99% 100% 100% 100% 101%
Unweighted N (1,496) (1,270) (584) (530) (514) (371) (443) (435) (428) (491)
56

The Economist /YouGov PollJuly 17 - 20, 2021 - 1500 U.S. Adult Citizens
27. Heard about Child Tax CreditHow much, if anything, have you heard about the expanded child tax credits this year?
Gender White Men White Women Race
Total Male Female No degree College Grad No degree College Grad Black Hispanic
A lot 26% 24% 27% 21% 30% 24% 32% 33% 26%
A little 55% 55% 55% 54% 58% 59% 59% 45% 50%
Nothing at all 19% 21% 18% 25% 13% 18% 9% 22% 24%
Totals 100% 100% 100% 100% 101% 101% 100% 100% 100%
Unweighted N (1,497) (729) (768) (330) (190) (346) (202) (168) (164)
Age Income Region
Total 18-29 30-44 45-64 65+ Under $50K $50-100K $100K or more Northeast Midwest South West
A lot 26% 9% 26% 33% 31% 25% 27% 32% 27% 27% 26% 23%
A little 55% 53% 53% 55% 59% 52% 57% 54% 51% 55% 53% 60%
Nothing at all 19% 38% 21% 13% 11% 23% 15% 14% 22% 17% 20% 17%
Totals 100% 100% 100% 101% 101% 100% 99% 100% 100% 99% 99% 100%
Unweighted N (1,497) (195) (354) (594) (354) (601) (420) (285) (252) (307) (540) (398)
57

The Economist /YouGov PollJuly 17 - 20, 2021 - 1500 U.S. Adult Citizens
Registered 2020 Vote Party ID Ideology
Total Voters Biden Trump Dem Rep Ind Lib Mod Con
A lot 26% 28% 32% 28% 30% 25% 24% 28% 25% 27%
A little 55% 55% 59% 56% 56% 55% 57% 58% 57% 54%
Nothing at all 19% 17% 9% 16% 13% 21% 19% 15% 18% 19%
Totals 100% 100% 100% 100% 99% 101% 100% 101% 100% 100%
Unweighted N (1,497) (1,270) (584) (529) (516) (370) (443) (436) (428) (492)
58

The Economist /YouGov PollJuly 17 - 20, 2021 - 1500 U.S. Adult Citizens
28. Know Someone with Child Tax CreditThis year, expanded child tax credits worth up to $300 a month per child will be distributed to those who qualify via cash payments. Do you personally knowanyone who received an expanded child tax credit?
Gender White Men White Women Race
Total Male Female No degree College Grad No degree College Grad Black Hispanic
Yes, me 10% 7% 12% 4% 14% 10% 14% 11% 10%
Yes, a family member 22% 21% 22% 22% 19% 22% 19% 30% 19%
Yes, a close friend 8% 8% 9% 6% 12% 9% 11% 10% 7%
Yes, an acquaintance 10% 9% 10% 7% 9% 9% 12% 14% 14%
No 56% 59% 53% 64% 54% 55% 54% 42% 52%
Prefer not to say 4% 3% 5% 3% 0% 5% 2% 6% 6%
Unweighted N (1,500) (731) (769) (331) (191) (347) (202) (168) (164)
Age Income Region
Total 18-29 30-44 45-64 65+ Under $50K $50-100K $100K or more Northeast Midwest South West
Yes, me 10% 12% 18% 8% 1% 10% 10% 13% 13% 11% 7% 10%
Yes, a family member 22% 20% 15% 25% 24% 20% 24% 25% 17% 24% 23% 20%
Yes, a close friend 8% 7% 13% 9% 5% 7% 10% 11% 4% 11% 8% 9%
Yes, an acquaintance 10% 10% 11% 10% 8% 10% 10% 9% 8% 11% 10% 10%
No 56% 54% 51% 54% 64% 57% 54% 50% 59% 54% 54% 57%
Prefer not to say 4% 6% 6% 2% 3% 4% 2% 3% 3% 4% 5% 3%
Unweighted N (1,500) (195) (355) (595) (355) (602) (420) (287) (253) (308) (540) (399)
59

The Economist /YouGov PollJuly 17 - 20, 2021 - 1500 U.S. Adult Citizens
Registered 2020 Vote Party ID Ideology
Total Voters Biden Trump Dem Rep Ind Lib Mod Con
Yes, me 10% 9% 9% 6% 11% 7% 9% 9% 12% 5%
Yes, a family member 22% 23% 24% 23% 24% 24% 21% 26% 23% 20%
Yes, a close friend 8% 9% 11% 6% 10% 5% 10% 11% 9% 6%
Yes, an acquaintance 10% 11% 12% 8% 11% 10% 10% 10% 12% 8%
No 56% 56% 54% 60% 51% 57% 59% 53% 52% 62%
Prefer not to say 4% 3% 2% 2% 2% 2% 4% 3% 2% 3%
Unweighted N (1,500) (1,272) (584) (531) (516) (371) (445) (436) (430) (492)
60

The Economist /YouGov PollJuly 17 - 20, 2021 - 1500 U.S. Adult Citizens
29. Approve of Expanded Child Tax CreditDo you approve or disapprove of the expanded child tax credits this year?
Gender White Men White Women Race
Total Male Female No degree College Grad No degree College Grad Black Hispanic
Strongly approve 27% 25% 28% 19% 30% 22% 30% 43% 25%
Somewhat approve 24% 25% 23% 22% 23% 22% 24% 29% 29%
Somewhat disapprove 10% 10% 10% 13% 9% 11% 11% 7% 4%
Strongly disapprove 19% 23% 14% 25% 29% 17% 18% 5% 17%
Not sure 21% 17% 25% 21% 9% 28% 17% 15% 25%
Totals 101% 100% 100% 100% 100% 100% 100% 99% 100%
Unweighted N (1,499) (731) (768) (331) (191) (347) (201) (168) (164)
Age Income Region
Total 18-29 30-44 45-64 65+ Under $50K $50-100K $100K or more Northeast Midwest South West
Strongly approve 27% 29% 29% 26% 23% 28% 26% 29% 31% 25% 23% 31%
Somewhat approve 24% 29% 24% 22% 22% 28% 21% 25% 20% 20% 27% 25%
Somewhat disapprove 10% 8% 8% 11% 13% 8% 13% 12% 11% 9% 10% 10%
Strongly disapprove 19% 5% 14% 23% 29% 16% 23% 22% 21% 22% 18% 14%
Not sure 21% 30% 25% 18% 14% 21% 17% 12% 17% 24% 22% 20%
Totals 101% 101% 100% 100% 101% 101% 100% 100% 100% 100% 100% 100%
Unweighted N (1,499) (195) (355) (594) (355) (601) (420) (287) (252) (308) (540) (399)
61

The Economist /YouGov PollJuly 17 - 20, 2021 - 1500 U.S. Adult Citizens
Registered 2020 Vote Party ID Ideology
Total Voters Biden Trump Dem Rep Ind Lib Mod Con
Strongly approve 27% 28% 46% 7% 44% 9% 23% 51% 27% 8%
Somewhat approve 24% 23% 31% 16% 31% 19% 23% 29% 28% 17%
Somewhat disapprove 10% 10% 5% 16% 6% 16% 10% 3% 11% 15%
Strongly disapprove 19% 22% 6% 46% 6% 35% 23% 5% 15% 39%
Not sure 21% 16% 12% 16% 13% 21% 21% 12% 17% 22%
Totals 101% 99% 100% 101% 100% 100% 100% 100% 98% 101%
Unweighted N (1,499) (1,271) (583) (531) (516) (371) (444) (436) (429) (492)
62

The Economist /YouGov PollJuly 17 - 20, 2021 - 1500 U.S. Adult Citizens
30. Expanded Tax Credit PermanentThe expanded child tax credit payments are scheduled to expire in one year. Should Congress make them permanent?
Gender White Men White Women Race
Total Male Female No degree College Grad No degree College Grad Black Hispanic
Yes, they should bepermanent 29% 31% 27% 26% 38% 22% 28% 39% 32%
No, they should not bepermanent 43% 47% 39% 51% 46% 43% 40% 32% 37%
Not sure 28% 22% 34% 23% 15% 35% 32% 29% 31%
Totals 100% 100% 100% 100% 99% 100% 100% 100% 100%
Unweighted N (1,497) (728) (769) (330) (191) (347) (202) (166) (164)
Age Income Region
Total 18-29 30-44 45-64 65+ Under $50K $50-100K $100K or more Northeast Midwest South West
Yes, they should bepermanent 29% 35% 39% 26% 19% 29% 31% 35% 30% 28% 25% 35%
No, they should not bepermanent 43% 24% 32% 51% 58% 42% 45% 46% 40% 43% 47% 37%
Not sure 28% 41% 30% 23% 23% 29% 24% 19% 30% 29% 28% 28%
Totals 100% 100% 101% 100% 100% 100% 100% 100% 100% 100% 100% 100%
Unweighted N (1,497) (193) (355) (594) (355) (601) (419) (286) (252) (307) (540) (398)
63

The Economist /YouGov PollJuly 17 - 20, 2021 - 1500 U.S. Adult Citizens
Registered 2020 Vote Party ID Ideology
Total Voters Biden Trump Dem Rep Ind Lib Mod Con
Yes, they should bepermanent 29% 30% 47% 10% 47% 13% 25% 54% 28% 11%
No, they should not bepermanent 43% 46% 24% 75% 25% 66% 49% 18% 45% 69%
Not sure 28% 24% 29% 14% 29% 21% 26% 28% 26% 20%
Totals 100% 100% 100% 99% 101% 100% 100% 100% 99% 100%
Unweighted N (1,497) (1,270) (583) (531) (515) (371) (444) (436) (428) (491)
64

The Economist /YouGov PollJuly 17 - 20, 2021 - 1500 U.S. Adult Citizens
31. Immigration Better or Worse (Past)In general, do you think immigration has made the U.S. better off or worse off, or has it not made much difference?
Gender White Men White Women Race
Total Male Female No degree College Grad No degree College Grad Black Hispanic
Better off 33% 36% 31% 32% 42% 21% 48% 35% 28%
Worse off 32% 35% 29% 42% 35% 39% 25% 22% 22%
Hasn’t made muchdifference 18% 16% 19% 14% 15% 17% 15% 26% 20%
Not sure 17% 13% 21% 12% 8% 23% 11% 17% 30%
Totals 100% 100% 100% 100% 100% 100% 99% 100% 100%
Unweighted N (1,499) (731) (768) (331) (191) (347) (202) (168) (163)
Age Income Region
Total 18-29 30-44 45-64 65+ Under $50K $50-100K $100K or more Northeast Midwest South West
Better off 33% 35% 31% 31% 38% 28% 37% 44% 34% 31% 31% 40%
Worse off 32% 21% 22% 37% 43% 31% 33% 32% 28% 35% 34% 27%
Hasn’t made muchdifference 18% 18% 25% 17% 10% 23% 16% 14% 16% 20% 18% 17%
Not sure 17% 26% 22% 15% 8% 18% 14% 9% 22% 14% 17% 16%
Totals 100% 100% 100% 100% 99% 100% 100% 99% 100% 100% 100% 100%
Unweighted N (1,499) (195) (354) (595) (355) (601) (420) (287) (252) (308) (540) (399)
65

The Economist /YouGov PollJuly 17 - 20, 2021 - 1500 U.S. Adult Citizens
Registered 2020 Vote Party ID Ideology
Total Voters Biden Trump Dem Rep Ind Lib Mod Con
Better off 33% 37% 60% 16% 52% 16% 32% 62% 35% 16%
Worse off 32% 34% 10% 64% 13% 64% 31% 10% 28% 59%
Hasn’t made muchdifference 18% 16% 19% 10% 21% 9% 22% 18% 22% 13%
Not sure 17% 13% 11% 9% 14% 12% 15% 11% 15% 12%
Totals 100% 100% 100% 99% 100% 101% 100% 101% 100% 100%
Unweighted N (1,499) (1,271) (583) (531) (515) (371) (445) (435) (430) (492)
66

The Economist /YouGov PollJuly 17 - 20, 2021 - 1500 U.S. Adult Citizens
32. Legal ImmigrationDo you think the federal government should increase or decrease the level of LEGAL immigration into the United States, or leave the level the same?
Gender White Men White Women Race
Total Male Female No degree College Grad No degree College Grad Black Hispanic
Increase LEGALimmigration 29% 30% 27% 26% 38% 17% 44% 25% 26%
Decrease LEGALimmigration 23% 25% 21% 29% 26% 29% 11% 21% 22%
Not change the level ofLEGAL immigration 31% 33% 29% 35% 30% 30% 33% 30% 26%
Not sure 17% 11% 23% 10% 6% 24% 12% 23% 26%
Totals 100% 99% 100% 100% 100% 100% 100% 99% 100%
Unweighted N (1,500) (731) (769) (331) (191) (347) (202) (168) (164)
Age Income Region
Total 18-29 30-44 45-64 65+ Under $50K $50-100K $100K or more Northeast Midwest South West
Increase LEGALimmigration 29% 37% 27% 25% 29% 24% 33% 38% 33% 27% 24% 35%
Decrease LEGALimmigration 23% 9% 23% 29% 29% 25% 20% 24% 20% 25% 25% 21%
Not change the level ofLEGAL immigration 31% 28% 27% 34% 35% 29% 36% 32% 30% 34% 33% 27%
Not sure 17% 27% 24% 13% 7% 22% 10% 6% 18% 15% 18% 17%
Totals 100% 101% 101% 101% 100% 100% 99% 100% 101% 101% 100% 100%
Unweighted N (1,500) (195) (355) (595) (355) (602) (420) (287) (253) (308) (540) (399)
67

The Economist /YouGov PollJuly 17 - 20, 2021 - 1500 U.S. Adult Citizens
Registered 2020 Vote Party ID Ideology
Total Voters Biden Trump Dem Rep Ind Lib Mod Con
Increase LEGALimmigration 29% 31% 49% 14% 42% 11% 29% 55% 27% 13%
Decrease LEGALimmigration 23% 24% 11% 40% 15% 41% 22% 10% 22% 38%
Not change the level ofLEGAL immigration 31% 32% 27% 41% 29% 40% 32% 23% 34% 41%
Not sure 17% 12% 12% 6% 15% 8% 16% 12% 17% 8%
Totals 100% 99% 99% 101% 101% 100% 99% 100% 100% 100%
Unweighted N (1,500) (1,272) (584) (531) (516) (371) (445) (436) (430) (492)
68

The Economist /YouGov PollJuly 17 - 20, 2021 - 1500 U.S. Adult Citizens
33. Seriousness of National Immigration ProblemHow serious a problem is illegal immigration in the U.S. as a whole?
Gender White Men White Women Race
Total Male Female No degree College Grad No degree College Grad Black Hispanic
Very serious 37% 41% 34% 50% 41% 39% 34% 26% 29%
Somewhat serious 22% 20% 25% 17% 22% 27% 24% 21% 20%
A minor problem 23% 24% 23% 17% 26% 17% 26% 30% 29%
Not a problem 6% 6% 7% 7% 7% 6% 8% 5% 10%
Not sure 11% 9% 12% 9% 4% 11% 7% 18% 13%
Totals 99% 100% 101% 100% 100% 100% 99% 100% 101%
Unweighted N (1,494) (730) (764) (330) (191) (344) (202) (167) (163)
Age Income Region
Total 18-29 30-44 45-64 65+ Under $50K $50-100K $100K or more Northeast Midwest South West
Very serious 37% 14% 25% 49% 54% 35% 41% 37% 33% 38% 42% 32%
Somewhat serious 22% 22% 23% 21% 23% 22% 22% 26% 21% 26% 20% 24%
A minor problem 23% 34% 28% 20% 14% 23% 24% 25% 30% 16% 20% 30%
Not a problem 6% 14% 7% 4% 3% 6% 8% 8% 7% 7% 6% 5%
Not sure 11% 16% 17% 6% 5% 14% 6% 5% 9% 12% 12% 9%
Totals 99% 100% 100% 100% 99% 100% 101% 101% 100% 99% 100% 100%
Unweighted N (1,494) (194) (353) (592) (355) (599) (417) (287) (252) (307) (538) (397)
69

The Economist /YouGov PollJuly 17 - 20, 2021 - 1500 U.S. Adult Citizens
Registered 2020 Vote Party ID Ideology
Total Voters Biden Trump Dem Rep Ind Lib Mod Con
Very serious 37% 41% 13% 78% 16% 69% 39% 12% 29% 72%
Somewhat serious 22% 23% 29% 16% 26% 20% 25% 26% 30% 14%
A minor problem 23% 23% 39% 3% 38% 7% 21% 41% 27% 7%
Not a problem 6% 7% 11% 1% 8% 2% 7% 13% 5% 2%
Not sure 11% 6% 9% 1% 12% 3% 8% 9% 9% 5%
Totals 99% 100% 101% 99% 100% 101% 100% 101% 100% 100%
Unweighted N (1,494) (1,266) (579) (530) (513) (371) (443) (433) (428) (491)
70

The Economist /YouGov PollJuly 17 - 20, 2021 - 1500 U.S. Adult Citizens
34. Seriousness of Local Immigration ProblemHow serious a problem is illegal immigration in your LOCAL community?
Gender White Men White Women Race
Total Male Female No degree College Grad No degree College Grad Black Hispanic
Very serious 12% 15% 10% 13% 17% 11% 7% 9% 17%
Somewhat serious 17% 21% 14% 19% 22% 14% 13% 13% 22%
A minor problem 23% 22% 24% 24% 24% 22% 30% 22% 23%
Not a problem 27% 26% 28% 26% 28% 29% 35% 29% 15%
Not sure 20% 15% 24% 17% 9% 24% 16% 27% 23%
Totals 99% 99% 100% 99% 100% 100% 101% 100% 100%
Unweighted N (1,486) (727) (759) (328) (190) (340) (202) (167) (163)
Age Income Region
Total 18-29 30-44 45-64 65+ Under $50K $50-100K $100K or more Northeast Midwest South West
Very serious 12% 6% 11% 17% 13% 11% 12% 13% 10% 8% 15% 15%
Somewhat serious 17% 14% 15% 17% 22% 16% 20% 21% 13% 12% 21% 19%
A minor problem 23% 25% 25% 21% 23% 24% 25% 23% 20% 21% 24% 27%
Not a problem 27% 32% 25% 27% 24% 25% 30% 31% 37% 33% 20% 26%
Not sure 20% 22% 25% 17% 18% 24% 14% 11% 21% 25% 21% 13%
Totals 99% 99% 101% 99% 100% 100% 101% 99% 101% 99% 101% 100%
Unweighted N (1,486) (193) (353) (588) (352) (593) (418) (285) (252) (303) (535) (396)
71

The Economist /YouGov PollJuly 17 - 20, 2021 - 1500 U.S. Adult Citizens
Registered 2020 Vote Party ID Ideology
Total Voters Biden Trump Dem Rep Ind Lib Mod Con
Very serious 12% 14% 4% 25% 8% 20% 13% 5% 11% 22%
Somewhat serious 17% 18% 10% 26% 12% 23% 20% 10% 18% 25%
A minor problem 23% 24% 24% 25% 24% 27% 26% 24% 25% 25%
Not a problem 27% 28% 46% 11% 39% 15% 25% 46% 29% 11%
Not sure 20% 15% 16% 14% 18% 15% 16% 14% 17% 17%
Totals 99% 99% 100% 101% 101% 100% 100% 99% 100% 100%
Unweighted N (1,486) (1,262) (580) (526) (512) (366) (441) (434) (427) (484)
72

The Economist /YouGov PollJuly 17 - 20, 2021 - 1500 U.S. Adult Citizens
35. Know Illegal ImmigrantDo you personally know anyone who is an illegal immigrant?
Gender White Men White Women Race
Total Male Female No degree College Grad No degree College Grad Black Hispanic
Yes 20% 23% 17% 21% 27% 12% 19% 8% 31%
No 63% 60% 65% 63% 62% 70% 65% 72% 50%
Not sure 18% 16% 19% 16% 12% 17% 16% 21% 19%
Totals 101% 99% 101% 100% 101% 99% 100% 101% 100%
Unweighted N (1,499) (731) (768) (331) (191) (347) (201) (168) (164)
Age Income Region
Total 18-29 30-44 45-64 65+ Under $50K $50-100K $100K or more Northeast Midwest South West
Yes 20% 20% 19% 22% 18% 17% 22% 24% 15% 15% 19% 29%
No 63% 61% 63% 62% 65% 64% 67% 63% 67% 69% 63% 53%
Not sure 18% 19% 18% 16% 17% 19% 12% 13% 18% 16% 18% 18%
Totals 101% 100% 100% 100% 100% 100% 101% 100% 100% 100% 100% 100%
Unweighted N (1,499) (194) (355) (595) (355) (602) (420) (286) (252) (308) (540) (399)
73

The Economist /YouGov PollJuly 17 - 20, 2021 - 1500 U.S. Adult Citizens
Registered 2020 Vote Party ID Ideology
Total Voters Biden Trump Dem Rep Ind Lib Mod Con
Yes 20% 22% 18% 27% 16% 19% 25% 21% 18% 24%
No 63% 62% 68% 55% 70% 67% 57% 66% 66% 58%
Not sure 18% 17% 15% 18% 14% 14% 18% 13% 16% 18%
Totals 101% 101% 101% 100% 100% 100% 100% 100% 100% 100%
Unweighted N (1,499) (1,271) (584) (531) (516) (371) (445) (436) (430) (492)
74

The Economist /YouGov PollJuly 17 - 20, 2021 - 1500 U.S. Adult Citizens
36. Undocumented ImmigrantsWhich comes closest to your view about illegal immigrants who are living in the U.S.?
Gender White Men White Women Race
Total Male Female No degree College Grad No degree College Grad Black Hispanic
They should be allowedto stay in the U.S. andapply for citizenship. 48% 42% 54% 37% 40% 48% 54% 55% 54%
They should be allowedto stay in the U.S., butnot become citizens. 13% 15% 11% 10% 13% 5% 14% 24% 17%
They should be requiredto leave the U.S. 39% 43% 36% 53% 46% 47% 32% 21% 29%
Totals 100% 100% 101% 100% 99% 100% 100% 100% 100%
Unweighted N (1,490) (729) (761) (329) (191) (343) (201) (167) (163)
Age Income Region
Total 18-29 30-44 45-64 65+ Under $50K $50-100K $100K or more Northeast Midwest South West
They should be allowedto stay in the U.S. andapply for citizenship. 48% 60% 48% 44% 43% 50% 45% 44% 50% 52% 44% 49%
They should be allowedto stay in the U.S., butnot become citizens. 13% 18% 18% 11% 5% 15% 10% 17% 11% 8% 14% 17%
They should be requiredto leave the U.S. 39% 23% 35% 45% 51% 36% 45% 40% 39% 41% 42% 34%
Totals 100% 101% 101% 100% 99% 101% 100% 101% 100% 101% 100% 100%
Unweighted N (1,490) (194) (354) (589) (353) (598) (418) (285) (251) (306) (537) (396)
75

The Economist /YouGov PollJuly 17 - 20, 2021 - 1500 U.S. Adult Citizens
Registered 2020 Vote Party ID Ideology
Total Voters Biden Trump Dem Rep Ind Lib Mod Con
They should be allowedto stay in the U.S. andapply for citizenship. 48% 48% 75% 15% 68% 19% 44% 74% 49% 22%
They should be allowedto stay in the U.S., butnot become citizens. 13% 12% 12% 9% 16% 9% 13% 11% 18% 9%
They should be requiredto leave the U.S. 39% 41% 13% 76% 16% 72% 43% 15% 33% 69%
Totals 100% 101% 100% 100% 100% 100% 100% 100% 100% 100%
Unweighted N (1,490) (1,265) (581) (528) (514) (370) (440) (435) (427) (489)
76

The Economist /YouGov PollJuly 17 - 20, 2021 - 1500 U.S. Adult Citizens
37. Illegal Immigrants PolicyIf you had to choose, what do you think should happen to illegal immigrants?
Gender White Men White Women Race
Total Male Female No degree College Grad No degree College Grad Black Hispanic
They should be given achance to keep theirjobs and eventuallyapply for legal status. 51% 47% 55% 39% 49% 45% 62% 59% 59%
They should be deportedback to their nativecountry. 37% 43% 31% 51% 46% 41% 30% 23% 25%
Not sure 12% 10% 14% 11% 5% 13% 8% 18% 16%
Totals 100% 100% 100% 101% 100% 99% 100% 100% 100%
Unweighted N (1,491) (727) (764) (329) (191) (346) (201) (164) (164)
Age Income Region
Total 18-29 30-44 45-64 65+ Under $50K $50-100K $100K or more Northeast Midwest South West
They should be given achance to keep theirjobs and eventuallyapply for legal status. 51% 63% 56% 44% 45% 51% 49% 55% 58% 49% 47% 54%
They should be deportedback to their nativecountry. 37% 21% 29% 45% 46% 35% 40% 37% 30% 39% 39% 36%
Not sure 12% 16% 15% 11% 9% 14% 10% 7% 13% 12% 14% 10%
Totals 100% 100% 100% 100% 100% 100% 99% 99% 101% 100% 100% 100%
Unweighted N (1,491) (193) (351) (593) (354) (598) (418) (285) (251) (307) (536) (397)
77

The Economist /YouGov PollJuly 17 - 20, 2021 - 1500 U.S. Adult Citizens
Registered 2020 Vote Party ID Ideology
Total Voters Biden Trump Dem Rep Ind Lib Mod Con
They should be given achance to keep theirjobs and eventuallyapply for legal status. 51% 51% 79% 19% 73% 24% 48% 81% 56% 22%
They should be deportedback to their nativecountry. 37% 38% 12% 73% 16% 69% 38% 12% 32% 69%
Not sure 12% 10% 9% 8% 11% 7% 14% 6% 13% 9%
Totals 100% 99% 100% 100% 100% 100% 100% 99% 101% 100%
Unweighted N (1,491) (1,264) (580) (529) (514) (369) (444) (435) (429) (488)
78

The Economist /YouGov PollJuly 17 - 20, 2021 - 1500 U.S. Adult Citizens
38. Civil or Criminal MatterDo you think crossing the border into the United States without proper documentation should be treated by government officials as a civil matter or a criminalmatter?
Gender White Men White Women Race
Total Male Female No degree College Grad No degree College Grad Black Hispanic
Civil matter 38% 34% 42% 26% 39% 30% 51% 49% 40%
Criminal matter 43% 52% 34% 60% 52% 43% 34% 29% 34%
Not sure 19% 14% 25% 14% 9% 27% 15% 22% 26%
Totals 100% 100% 101% 100% 100% 100% 100% 100% 100%
Unweighted N (1,492) (728) (764) (329) (191) (345) (202) (166) (162)
Age Income Region
Total 18-29 30-44 45-64 65+ Under $50K $50-100K $100K or more Northeast Midwest South West
Civil matter 38% 50% 37% 32% 36% 38% 38% 42% 44% 38% 32% 44%
Criminal matter 43% 26% 35% 51% 53% 40% 46% 47% 38% 42% 47% 40%
Not sure 19% 24% 27% 17% 11% 22% 16% 11% 19% 19% 21% 17%
Totals 100% 100% 99% 100% 100% 100% 100% 100% 101% 99% 100% 101%
Unweighted N (1,492) (193) (350) (594) (355) (598) (419) (286) (252) (305) (537) (398)
79

The Economist /YouGov PollJuly 17 - 20, 2021 - 1500 U.S. Adult Citizens
Registered 2020 Vote Party ID Ideology
Total Voters Biden Trump Dem Rep Ind Lib Mod Con
Civil matter 38% 39% 63% 11% 58% 16% 36% 67% 40% 15%
Criminal matter 43% 46% 18% 83% 20% 75% 47% 16% 41% 75%
Not sure 19% 15% 19% 6% 22% 9% 17% 17% 19% 10%
Totals 100% 100% 100% 100% 100% 100% 100% 100% 100% 100%
Unweighted N (1,492) (1,267) (582) (531) (514) (371) (445) (435) (429) (491)
80

The Economist /YouGov PollJuly 17 - 20, 2021 - 1500 U.S. Adult Citizens
39. Crime LikelihoodDo you think undocumented immigrants are more likely or less likely to commit crimes than American citizens?
Gender White Men White Women Race
Total Male Female No degree College Grad No degree College Grad Black Hispanic
More likely 29% 37% 21% 42% 41% 27% 22% 18% 18%
Less likely 22% 21% 22% 16% 24% 16% 32% 24% 28%
Equally likely 32% 30% 34% 31% 28% 37% 31% 34% 31%
Not sure 17% 12% 22% 11% 7% 21% 14% 23% 23%
Totals 100% 100% 99% 100% 100% 101% 99% 99% 100%
Unweighted N (1,495) (729) (766) (330) (190) (346) (201) (167) (164)
Age Income Region
Total 18-29 30-44 45-64 65+ Under $50K $50-100K $100K or more Northeast Midwest South West
More likely 29% 22% 23% 31% 37% 26% 30% 38% 25% 31% 30% 28%
Less likely 22% 25% 21% 20% 22% 19% 22% 25% 22% 20% 19% 26%
Equally likely 32% 30% 31% 36% 30% 36% 34% 26% 36% 30% 33% 29%
Not sure 17% 24% 25% 12% 11% 19% 13% 11% 16% 18% 18% 16%
Totals 100% 101% 100% 99% 100% 100% 99% 100% 99% 99% 100% 99%
Unweighted N (1,495) (194) (353) (593) (355) (600) (418) (287) (253) (307) (538) (397)
81

The Economist /YouGov PollJuly 17 - 20, 2021 - 1500 U.S. Adult Citizens
Registered 2020 Vote Party ID Ideology
Total Voters Biden Trump Dem Rep Ind Lib Mod Con
More likely 29% 30% 9% 58% 11% 57% 31% 11% 25% 54%
Less likely 22% 24% 43% 4% 39% 5% 18% 43% 21% 6%
Equally likely 32% 34% 37% 29% 35% 29% 35% 33% 38% 30%
Not sure 17% 12% 11% 8% 15% 9% 17% 12% 17% 10%
Totals 100% 100% 100% 99% 100% 100% 101% 99% 101% 100%
Unweighted N (1,495) (1,268) (581) (530) (515) (371) (444) (435) (429) (491)
82

The Economist /YouGov PollJuly 17 - 20, 2021 - 1500 U.S. Adult Citizens
40. Offer Asylum Escaping Violence or Political PersecutionOverall, do you think the United States should or should not offer asylum to people who come to the US to escape violence or political persecution in theirhome country?
Gender White Men White Women Race
Total Male Female No degree College Grad No degree College Grad Black Hispanic
Should offer asylum 52% 52% 53% 48% 58% 46% 64% 54% 49%
Should not offer asylum 22% 27% 18% 30% 26% 22% 16% 19% 21%
Not sure 25% 21% 29% 22% 16% 32% 21% 27% 31%
Totals 99% 100% 100% 100% 100% 100% 101% 100% 101%
Unweighted N (1,487) (727) (760) (328) (190) (342) (201) (166) (163)
Age Income Region
Total 18-29 30-44 45-64 65+ Under $50K $50-100K $100K or more Northeast Midwest South West
Should offer asylum 52% 55% 50% 51% 55% 49% 55% 62% 55% 53% 48% 57%
Should not offer asylum 22% 15% 20% 25% 26% 22% 24% 25% 20% 20% 25% 21%
Not sure 25% 30% 29% 25% 18% 29% 21% 13% 25% 27% 27% 22%
Totals 99% 100% 99% 101% 99% 100% 100% 100% 100% 100% 100% 100%
Unweighted N (1,487) (192) (351) (591) (353) (594) (419) (287) (248) (305) (538) (396)
83

The Economist /YouGov PollJuly 17 - 20, 2021 - 1500 U.S. Adult Citizens
Registered 2020 Vote Party ID Ideology
Total Voters Biden Trump Dem Rep Ind Lib Mod Con
Should offer asylum 52% 56% 77% 36% 71% 35% 51% 81% 53% 37%
Should not offer asylum 22% 23% 10% 40% 11% 40% 23% 9% 20% 38%
Not sure 25% 21% 14% 24% 18% 25% 26% 10% 26% 25%
Totals 99% 100% 101% 100% 100% 100% 100% 100% 99% 100%
Unweighted N (1,487) (1,264) (582) (529) (513) (369) (441) (434) (426) (490)
84

The Economist /YouGov PollJuly 17 - 20, 2021 - 1500 U.S. Adult Citizens
41. Offer Asylum Escaping Religious PersecutionOverall, do you think the United States should or should not offer asylum to people who come to the US to escape religious persecution in their homecountry?
Gender White Men White Women Race
Total Male Female No degree College Grad No degree College Grad Black Hispanic
Should offer asylum 53% 53% 53% 50% 60% 45% 65% 56% 46%
Should not offer asylum 20% 25% 15% 26% 25% 19% 10% 18% 22%
Not sure 27% 22% 32% 23% 15% 36% 24% 25% 32%
Totals 100% 100% 100% 99% 100% 100% 99% 99% 100%
Unweighted N (1,487) (725) (762) (329) (190) (347) (199) (163) (163)
Age Income Region
Total 18-29 30-44 45-64 65+ Under $50K $50-100K $100K or more Northeast Midwest South West
Should offer asylum 53% 58% 49% 51% 55% 48% 57% 61% 54% 54% 50% 56%
Should not offer asylum 20% 14% 19% 23% 23% 22% 20% 24% 16% 22% 21% 20%
Not sure 27% 28% 32% 26% 22% 30% 23% 16% 30% 25% 29% 24%
Totals 100% 100% 100% 100% 100% 100% 100% 101% 100% 101% 100% 100%
Unweighted N (1,487) (192) (354) (591) (350) (596) (416) (286) (250) (307) (535) (395)
85

The Economist /YouGov PollJuly 17 - 20, 2021 - 1500 U.S. Adult Citizens
Registered 2020 Vote Party ID Ideology
Total Voters Biden Trump Dem Rep Ind Lib Mod Con
Should offer asylum 53% 56% 73% 41% 67% 38% 53% 76% 54% 42%
Should not offer asylum 20% 21% 11% 32% 13% 34% 20% 10% 19% 32%
Not sure 27% 23% 16% 27% 20% 28% 27% 15% 27% 26%
Totals 100% 100% 100% 100% 100% 100% 100% 101% 100% 100%
Unweighted N (1,487) (1,260) (578) (528) (511) (369) (441) (432) (427) (488)
86

The Economist /YouGov PollJuly 17 - 20, 2021 - 1500 U.S. Adult Citizens
42. Favor DacaDo you support or oppose, DACA, Deferred Action for Childhood Arrivals, which is a policy that grants temporary legal status to "dreamers", otherwiselaw-abiding children and young adults who were brought into the United States at a very young age by parents who are illegal immigrants?
Gender White Men White Women Race
Total Male Female No degree College Grad No degree College Grad Black Hispanic
Support strongly 32% 25% 39% 19% 33% 32% 47% 36% 34%
Support somewhat 20% 20% 20% 18% 21% 21% 21% 20% 19%
Oppose somewhat 12% 15% 9% 15% 12% 10% 6% 13% 14%
Oppose strongly 19% 25% 13% 31% 26% 16% 13% 9% 14%
Not sure 18% 15% 20% 17% 7% 22% 13% 22% 18%
Totals 101% 100% 101% 100% 99% 101% 100% 100% 99%
Unweighted N (1,495) (728) (767) (329) (191) (346) (202) (167) (163)
Age Income Region
Total 18-29 30-44 45-64 65+ Under $50K $50-100K $100K or more Northeast Midwest South West
Support strongly 32% 37% 29% 30% 35% 29% 36% 35% 40% 28% 29% 36%
Support somewhat 20% 21% 21% 19% 19% 22% 18% 21% 20% 18% 22% 20%
Oppose somewhat 12% 12% 10% 11% 13% 12% 14% 12% 10% 12% 12% 12%
Oppose strongly 19% 7% 13% 25% 26% 15% 22% 24% 15% 20% 20% 18%
Not sure 18% 24% 27% 15% 7% 22% 10% 9% 16% 22% 18% 14%
Totals 101% 101% 100% 100% 100% 100% 100% 101% 101% 100% 101% 100%
Unweighted N (1,495) (193) (355) (593) (354) (600) (419) (286) (251) (307) (539) (398)
87

The Economist /YouGov PollJuly 17 - 20, 2021 - 1500 U.S. Adult Citizens
Registered 2020 Vote Party ID Ideology
Total Voters Biden Trump Dem Rep Ind Lib Mod Con
Support strongly 32% 35% 65% 5% 55% 10% 27% 66% 33% 7%
Support somewhat 20% 20% 19% 22% 19% 22% 22% 16% 23% 22%
Oppose somewhat 12% 12% 6% 18% 9% 16% 14% 5% 14% 17%
Oppose strongly 19% 21% 3% 44% 6% 39% 20% 4% 13% 40%
Not sure 18% 12% 7% 11% 12% 13% 18% 8% 17% 14%
Totals 101% 100% 100% 100% 101% 100% 101% 99% 100% 100%
Unweighted N (1,495) (1,268) (583) (529) (516) (370) (443) (435) (429) (490)
88

The Economist /YouGov PollJuly 17 - 20, 2021 - 1500 U.S. Adult Citizens
43. Heard about Daca RulingHow much, if anything, have you heard in the news this week about the DACA program, Deferred Action for Childhood Arrivals, being ruled illegal by afederal judge?
Gender White Men White Women Race
Total Male Female No degree College Grad No degree College Grad Black Hispanic
A lot 17% 21% 14% 15% 30% 11% 20% 17% 19%
A little 42% 45% 39% 44% 49% 42% 41% 40% 41%
Nothing at all 41% 34% 46% 41% 21% 47% 39% 42% 40%
Totals 100% 100% 99% 100% 100% 100% 100% 99% 100%
Unweighted N (1,497) (729) (768) (329) (191) (347) (202) (167) (164)
Age Income Region
Total 18-29 30-44 45-64 65+ Under $50K $50-100K $100K or more Northeast Midwest South West
A lot 17% 9% 13% 19% 27% 13% 19% 29% 20% 12% 17% 20%
A little 42% 38% 40% 42% 48% 39% 47% 46% 36% 46% 43% 42%
Nothing at all 41% 53% 46% 40% 25% 48% 34% 25% 44% 41% 40% 38%
Totals 100% 100% 99% 101% 100% 100% 100% 100% 100% 99% 100% 100%
Unweighted N (1,497) (193) (354) (595) (355) (601) (419) (287) (253) (307) (539) (398)
89

The Economist /YouGov PollJuly 17 - 20, 2021 - 1500 U.S. Adult Citizens
Registered 2020 Vote Party ID Ideology
Total Voters Biden Trump Dem Rep Ind Lib Mod Con
A lot 17% 20% 23% 21% 20% 18% 17% 21% 16% 20%
A little 42% 45% 49% 46% 46% 44% 41% 47% 40% 45%
Nothing at all 41% 34% 27% 33% 34% 38% 41% 32% 44% 35%
Totals 100% 99% 99% 100% 100% 100% 99% 100% 100% 100%
Unweighted N (1,497) (1,269) (582) (531) (515) (371) (445) (434) (430) (492)
90

The Economist /YouGov PollJuly 17 - 20, 2021 - 1500 U.S. Adult Citizens
44. Heard about Dem Immigration ReformHow much, if anything, have you heard in the news this week about an immigration bill supported by Democrats in Congress?
Gender White Men White Women Race
Total Male Female No degree College Grad No degree College Grad Black Hispanic
A lot 9% 11% 7% 7% 12% 6% 6% 12% 16%
A little 34% 39% 29% 30% 51% 28% 32% 33% 37%
Nothing at all 58% 50% 65% 63% 37% 66% 61% 55% 48%
Totals 101% 100% 101% 100% 100% 100% 99% 100% 101%
Unweighted N (1,494) (728) (766) (329) (191) (346) (202) (168) (161)
Age Income Region
Total 18-29 30-44 45-64 65+ Under $50K $50-100K $100K or more Northeast Midwest South West
A lot 9% 8% 9% 9% 10% 8% 10% 10% 10% 6% 9% 12%
A little 34% 32% 32% 31% 39% 30% 36% 47% 31% 32% 35% 34%
Nothing at all 58% 60% 59% 60% 51% 62% 54% 43% 59% 62% 56% 54%
Totals 101% 100% 100% 100% 100% 100% 100% 100% 100% 100% 100% 100%
Unweighted N (1,494) (193) (352) (594) (355) (599) (419) (287) (253) (306) (539) (396)
91

The Economist /YouGov PollJuly 17 - 20, 2021 - 1500 U.S. Adult Citizens
Registered 2020 Vote Party ID Ideology
Total Voters Biden Trump Dem Rep Ind Lib Mod Con
A lot 9% 10% 9% 11% 10% 8% 10% 10% 8% 10%
A little 34% 36% 38% 36% 37% 36% 32% 36% 36% 34%
Nothing at all 58% 54% 54% 53% 53% 55% 59% 55% 56% 56%
Totals 101% 100% 101% 100% 100% 99% 101% 101% 100% 100%
Unweighted N (1,494) (1,269) (583) (531) (514) (371) (444) (435) (428) (491)
92

The Economist /YouGov PollJuly 17 - 20, 2021 - 1500 U.S. Adult Citizens
45. Support Dem Immigration ReformAn immigration bill proposed by Democrats in Congress would grant protections from deportation and a path to citizenship for a greater group of undoc-umented immigrants, including those brought to the U.S. as children, those under temporary protected status, and those working as essential and farmworkers. Would you support or oppose this proposal?
Gender White Men White Women Race
Total Male Female No degree College Grad No degree College Grad Black Hispanic
Strongly support 28% 23% 32% 18% 31% 26% 39% 36% 24%
Somewhat support 19% 22% 17% 17% 22% 17% 20% 21% 25%
Somewhat oppose 11% 12% 10% 14% 11% 11% 7% 13% 13%
Strongly oppose 22% 28% 17% 36% 30% 21% 18% 9% 14%
Not sure 19% 14% 24% 15% 6% 25% 15% 22% 25%
Totals 99% 99% 100% 100% 100% 100% 99% 101% 101%
Unweighted N (1,496) (729) (767) (330) (191) (345) (202) (168) (164)
Age Income Region
Total 18-29 30-44 45-64 65+ Under $50K $50-100K $100K or more Northeast Midwest South West
Strongly support 28% 30% 27% 25% 32% 24% 31% 32% 33% 25% 25% 32%
Somewhat support 19% 19% 22% 20% 16% 22% 18% 21% 17% 20% 19% 21%
Somewhat oppose 11% 17% 9% 11% 9% 11% 12% 14% 12% 10% 12% 10%
Strongly oppose 22% 6% 16% 29% 33% 18% 27% 25% 18% 24% 23% 21%
Not sure 19% 28% 28% 14% 11% 25% 13% 8% 20% 21% 20% 15%
Totals 99% 100% 102% 99% 101% 100% 101% 100% 100% 100% 99% 99%
Unweighted N (1,496) (193) (354) (594) (355) (599) (420) (287) (253) (308) (539) (396)
93

The Economist /YouGov PollJuly 17 - 20, 2021 - 1500 U.S. Adult Citizens
Registered 2020 Vote Party ID Ideology
Total Voters Biden Trump Dem Rep Ind Lib Mod Con
Strongly support 28% 31% 59% 3% 51% 6% 23% 61% 27% 5%
Somewhat support 19% 18% 24% 14% 23% 13% 24% 18% 29% 14%
Somewhat oppose 11% 11% 6% 16% 8% 19% 10% 6% 14% 15%
Strongly oppose 22% 25% 2% 56% 4% 48% 25% 4% 14% 51%
Not sure 19% 14% 9% 11% 14% 13% 17% 11% 17% 15%
Totals 99% 99% 100% 100% 100% 99% 99% 100% 101% 100%
Unweighted N (1,496) (1,268) (581) (530) (514) (370) (445) (434) (430) (491)
94

The Economist /YouGov PollJuly 17 - 20, 2021 - 1500 U.S. Adult Citizens
46. Support Aid to Central American CountriesThe legislation would also provide billions of dollars’ worth of aid to Central American countries to attempt to stem migration trends. Would you support oroppose this aid to Central American countries to try and keep their citizens from trying to move to the U.S.?
Gender White Men White Women Race
Total Male Female No degree College Grad No degree College Grad Black Hispanic
Strongly support 17% 15% 19% 11% 21% 15% 23% 28% 11%
Somewhat support 21% 24% 19% 19% 27% 15% 21% 25% 25%
Somewhat oppose 12% 13% 12% 13% 12% 11% 13% 12% 16%
Strongly oppose 27% 33% 21% 41% 34% 27% 25% 10% 20%
Not sure 22% 15% 29% 15% 6% 32% 18% 25% 28%
Totals 99% 100% 100% 99% 100% 100% 100% 100% 100%
Unweighted N (1,494) (728) (766) (329) (191) (345) (202) (166) (164)
Age Income Region
Total 18-29 30-44 45-64 65+ Under $50K $50-100K $100K or more Northeast Midwest South West
Strongly support 17% 19% 17% 17% 16% 18% 15% 18% 20% 15% 16% 20%
Somewhat support 21% 27% 20% 19% 21% 20% 24% 26% 20% 16% 21% 28%
Somewhat oppose 12% 16% 14% 12% 9% 12% 13% 15% 16% 11% 12% 12%
Strongly oppose 27% 9% 18% 34% 40% 23% 31% 29% 24% 33% 27% 23%
Not sure 22% 29% 30% 18% 14% 27% 17% 12% 21% 25% 24% 17%
Totals 99% 100% 99% 100% 100% 100% 100% 100% 101% 100% 100% 100%
Unweighted N (1,494) (194) (354) (591) (355) (597) (420) (287) (252) (307) (537) (398)
95

The Economist /YouGov PollJuly 17 - 20, 2021 - 1500 U.S. Adult Citizens
Registered 2020 Vote Party ID Ideology
Total Voters Biden Trump Dem Rep Ind Lib Mod Con
Strongly support 17% 19% 33% 4% 31% 8% 14% 35% 16% 6%
Somewhat support 21% 21% 30% 13% 28% 14% 23% 31% 24% 13%
Somewhat oppose 12% 12% 11% 11% 12% 13% 14% 10% 18% 11%
Strongly oppose 27% 31% 7% 62% 8% 52% 31% 7% 21% 55%
Not sure 22% 18% 19% 10% 20% 13% 18% 17% 20% 15%
Totals 99% 101% 100% 100% 99% 100% 100% 100% 99% 100%
Unweighted N (1,494) (1,269) (582) (531) (516) (370) (442) (436) (426) (492)
96

The Economist /YouGov PollJuly 17 - 20, 2021 - 1500 U.S. Adult Citizens
47. Pass with Budget ReconciliationRepublicans are likely to filibuster this new immigration reform bill. Would you support the U.S. Senate using budget reconciliation to avoid a filibuster andpass this immigration reform on a simple majority vote?Asked of those who support the immigration proposal
Gender White Men White Women Race
Total Male Female No degree College Grad No degree College Grad Black Hispanic
Yes 55% 60% 50% 57% 67% 40% 66% 56% 43%
No 18% 20% 16% 18% 18% 19% 9% 20% 26%
Not sure 28% 20% 34% 25% 14% 41% 25% 24% 31%
Totals 101% 100% 100% 100% 99% 100% 100% 100% 100%
Unweighted N (731) (340) (391) (117) (107) (144) (126) (102) (87)
Age Income Region
Total 18-29 30-44 45-64 65+ Under $50K $50-100K $100K or more Northeast Midwest South West
Yes 55% 38% 53% 60% 65% 46% 62% 63% 66% 53% 47% 59%
No 18% 24% 21% 16% 11% 21% 13% 21% 10% 15% 21% 20%
Not sure 28% 38% 26% 24% 25% 32% 25% 16% 24% 32% 31% 22%
Totals 101% 100% 100% 100% 101% 99% 100% 100% 100% 100% 99% 101%
Unweighted N (731) (99) (184) (282) (166) (288) (208) (155) (122) (138) (250) (221)
97
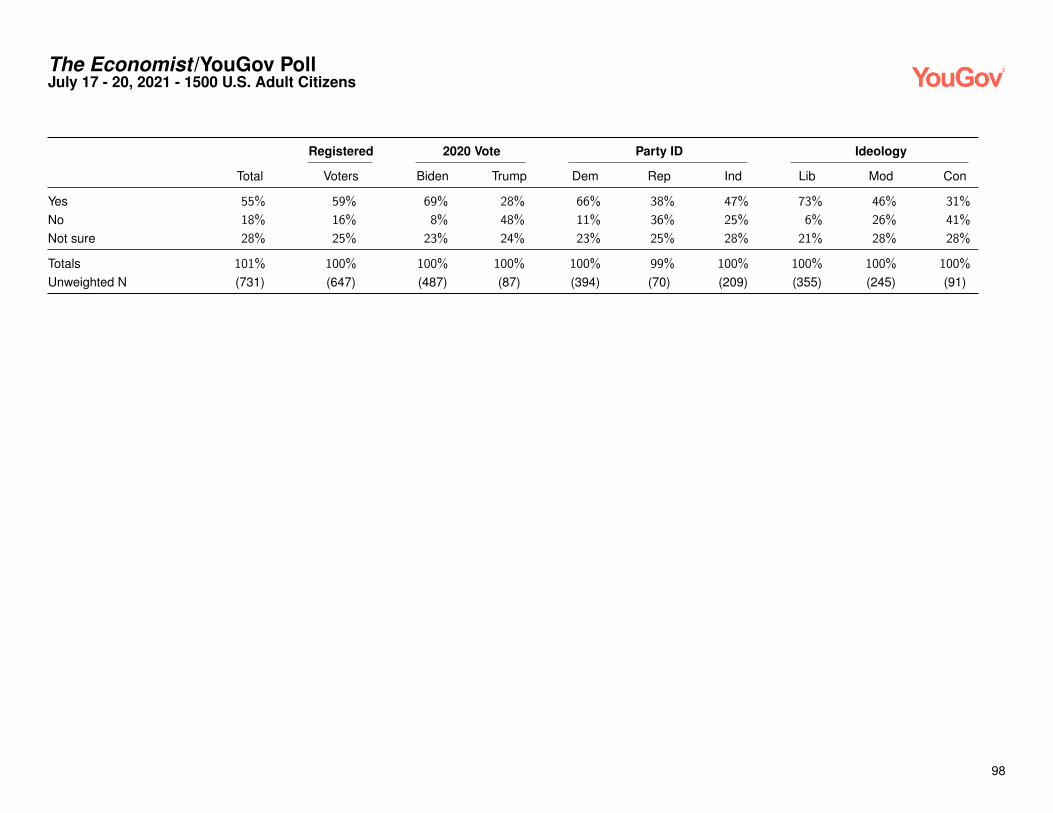
The Economist /YouGov PollJuly 17 - 20, 2021 - 1500 U.S. Adult Citizens
Registered 2020 Vote Party ID Ideology
Total Voters Biden Trump Dem Rep Ind Lib Mod Con
Yes 55% 59% 69% 28% 66% 38% 47% 73% 46% 31%
No 18% 16% 8% 48% 11% 36% 25% 6% 26% 41%
Not sure 28% 25% 23% 24% 23% 25% 28% 21% 28% 28%
Totals 101% 100% 100% 100% 100% 99% 100% 100% 100% 100%
Unweighted N (731) (647) (487) (87) (394) (70) (209) (355) (245) (91)
98

The Economist /YouGov PollJuly 17 - 20, 2021 - 1500 U.S. Adult Citizens
48. Heard about Flooding in EuropeHow much, if anything, have you heard in the news recently about flooding in western Europe?
Gender White Men White Women Race
Total Male Female No degree College Grad No degree College Grad Black Hispanic
A lot 19% 22% 17% 19% 23% 12% 24% 22% 23%
A little 46% 48% 44% 45% 59% 46% 48% 42% 40%
Nothing at all 35% 31% 39% 36% 17% 41% 28% 36% 37%
Totals 100% 101% 100% 100% 99% 99% 100% 100% 100%
Unweighted N (1,497) (729) (768) (329) (191) (347) (202) (167) (164)
Age Income Region
Total 18-29 30-44 45-64 65+ Under $50K $50-100K $100K or more Northeast Midwest South West
A lot 19% 11% 15% 20% 31% 18% 19% 28% 23% 16% 18% 21%
A little 46% 38% 43% 48% 52% 41% 52% 50% 42% 47% 46% 46%
Nothing at all 35% 51% 42% 32% 17% 41% 29% 22% 34% 37% 36% 32%
Totals 100% 100% 100% 100% 100% 100% 100% 100% 99% 100% 100% 99%
Unweighted N (1,497) (194) (355) (593) (355) (601) (419) (287) (253) (308) (539) (397)
99

The Economist /YouGov PollJuly 17 - 20, 2021 - 1500 U.S. Adult Citizens
Registered 2020 Vote Party ID Ideology
Total Voters Biden Trump Dem Rep Ind Lib Mod Con
A lot 19% 23% 29% 18% 26% 17% 18% 26% 19% 17%
A little 46% 49% 51% 53% 48% 48% 47% 47% 45% 50%
Nothing at all 35% 29% 20% 29% 27% 35% 36% 27% 35% 33%
Totals 100% 101% 100% 100% 101% 100% 101% 100% 99% 100%
Unweighted N (1,497) (1,269) (582) (531) (515) (371) (444) (435) (429) (492)
100

The Economist /YouGov PollJuly 17 - 20, 2021 - 1500 U.S. Adult Citizens
49. Opinion of Climate ChangeOn the subject of climate change do you think:
Gender White Men White Women Race
Total Male Female No degree College Grad No degree College Grad Black Hispanic
The world’s climate ischanging as a result ofhuman activity 53% 50% 57% 44% 55% 51% 63% 58% 54%
The world’s climate ischanging but NOTbecause of humanactivity 24% 30% 19% 33% 29% 22% 21% 19% 18%
The world’s climate isNOT changing 9% 9% 8% 9% 8% 10% 7% 9% 9%
Not sure 14% 11% 16% 13% 7% 16% 9% 15% 19%
Totals 100% 100% 100% 99% 99% 99% 100% 101% 100%
Unweighted N (1,494) (729) (765) (330) (191) (345) (202) (167) (162)
101

The Economist /YouGov PollJuly 17 - 20, 2021 - 1500 U.S. Adult Citizens
Age Income Region
Total 18-29 30-44 45-64 65+ Under $50K $50-100K $100K or more Northeast Midwest South West
The world’s climate ischanging as a result ofhuman activity 53% 56% 59% 52% 47% 53% 55% 57% 61% 54% 44% 63%
The world’s climate ischanging but NOTbecause of humanactivity 24% 18% 15% 29% 34% 21% 27% 29% 21% 25% 27% 22%
The world’s climate isNOT changing 9% 9% 8% 8% 9% 9% 9% 7% 5% 7% 12% 6%
Not sure 14% 17% 18% 11% 9% 16% 9% 6% 13% 13% 17% 9%
Totals 100% 100% 100% 100% 99% 99% 100% 99% 100% 99% 100% 100%
Unweighted N (1,494) (193) (354) (592) (355) (599) (419) (286) (251) (308) (538) (397)
Registered 2020 Vote Party ID Ideology
Total Voters Biden Trump Dem Rep Ind Lib Mod Con
The world’s climate ischanging as a result ofhuman activity 53% 54% 86% 19% 77% 23% 53% 86% 60% 22%
The world’s climate ischanging but NOTbecause of humanactivity 24% 27% 8% 53% 11% 44% 27% 8% 22% 45%
The world’s climate isNOT changing 9% 9% 1% 17% 4% 18% 8% 1% 7% 19%
Not sure 14% 10% 5% 10% 8% 14% 12% 6% 11% 14%
Totals 100% 100% 100% 99% 100% 99% 100% 101% 100% 100%
Unweighted N (1,494) (1,269) (583) (530) (516) (368) (444) (436) (428) (491)
102

The Economist /YouGov PollJuly 17 - 20, 2021 - 1500 U.S. Adult Citizens
50. Flooding Result of Climate ChangeDo you think the recent floods in western Europe are the result of climate change, or do these kind of events just happen from time to time?
Gender White Men White Women Race
Total Male Female No degree College Grad No degree College Grad Black Hispanic
Result of climate change 41% 39% 43% 28% 43% 37% 50% 51% 46%
Just happen from time totime 36% 43% 29% 52% 45% 38% 26% 24% 25%
Not sure 23% 18% 28% 20% 12% 25% 24% 25% 30%
Totals 100% 100% 100% 100% 100% 100% 100% 100% 101%
Unweighted N (1,495) (730) (765) (330) (191) (347) (199) (168) (163)
Age Income Region
Total 18-29 30-44 45-64 65+ Under $50K $50-100K $100K or more Northeast Midwest South West
Result of climate change 41% 43% 45% 37% 40% 41% 42% 45% 44% 35% 37% 51%
Just happen from time totime 36% 26% 27% 40% 47% 34% 38% 40% 33% 40% 39% 30%
Not sure 23% 30% 28% 22% 13% 25% 20% 15% 23% 25% 25% 19%
Totals 100% 99% 100% 99% 100% 100% 100% 100% 100% 100% 101% 100%
Unweighted N (1,495) (193) (354) (593) (355) (600) (420) (286) (252) (307) (538) (398)
103
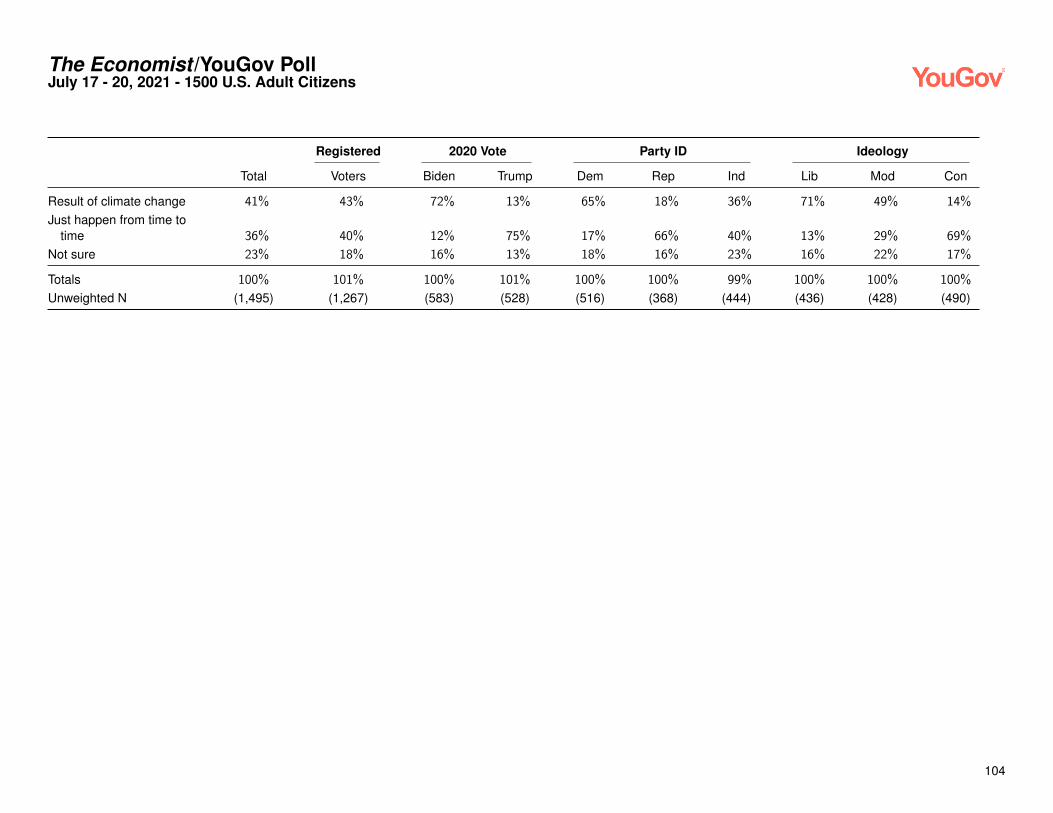
The Economist /YouGov PollJuly 17 - 20, 2021 - 1500 U.S. Adult Citizens
Registered 2020 Vote Party ID Ideology
Total Voters Biden Trump Dem Rep Ind Lib Mod Con
Result of climate change 41% 43% 72% 13% 65% 18% 36% 71% 49% 14%
Just happen from time totime 36% 40% 12% 75% 17% 66% 40% 13% 29% 69%
Not sure 23% 18% 16% 13% 18% 16% 23% 16% 22% 17%
Totals 100% 101% 100% 101% 100% 100% 99% 100% 100% 100%
Unweighted N (1,495) (1,267) (583) (528) (516) (368) (444) (436) (428) (490)
104

The Economist /YouGov PollJuly 17 - 20, 2021 - 1500 U.S. Adult Citizens
51A. Relationship of Severe Weather And Climate Change — California drought emergencyDo you think the severity of the weather events listed below are the result of climate change or do these kind of events just happen from time to time?
Gender White Men White Women Race
Total Male Female No degree College Grad No degree College Grad Black Hispanic
Result of climate change 46% 45% 47% 36% 47% 40% 56% 54% 50%
Just happen from time totime 37% 43% 32% 51% 44% 38% 30% 24% 31%
Not sure 17% 12% 21% 14% 9% 22% 14% 22% 19%
Totals 100% 100% 100% 101% 100% 100% 100% 100% 100%
Unweighted N (1,498) (730) (768) (331) (191) (346) (202) (167) (164)
Age Income Region
Total 18-29 30-44 45-64 65+ Under $50K $50-100K $100K or more Northeast Midwest South West
Result of climate change 46% 50% 48% 44% 45% 45% 49% 49% 51% 42% 41% 55%
Just happen from time totime 37% 29% 29% 43% 45% 36% 37% 42% 35% 41% 39% 33%
Not sure 17% 21% 24% 13% 10% 19% 14% 10% 13% 17% 21% 12%
Totals 100% 100% 101% 100% 100% 100% 100% 101% 99% 100% 101% 100%
Unweighted N (1,498) (194) (355) (594) (355) (600) (420) (287) (253) (308) (538) (399)
105

The Economist /YouGov PollJuly 17 - 20, 2021 - 1500 U.S. Adult Citizens
Registered 2020 Vote Party ID Ideology
Total Voters Biden Trump Dem Rep Ind Lib Mod Con
Result of climate change 46% 48% 81% 15% 72% 21% 39% 78% 50% 17%
Just happen from time totime 37% 40% 11% 74% 18% 66% 41% 14% 31% 70%
Not sure 17% 12% 8% 11% 10% 14% 19% 8% 18% 13%
Totals 100% 100% 100% 100% 100% 101% 99% 100% 99% 100%
Unweighted N (1,498) (1,270) (583) (530) (516) (370) (445) (436) (429) (492)
106

The Economist /YouGov PollJuly 17 - 20, 2021 - 1500 U.S. Adult Citizens
51B. Relationship of Severe Weather And Climate Change — Polar vortexDo you think the severity of the weather events listed below are the result of climate change or do these kind of events just happen from time to time?
Gender White Men White Women Race
Total Male Female No degree College Grad No degree College Grad Black Hispanic
Result of climate change 38% 35% 40% 27% 37% 35% 41% 44% 43%
Just happen from time totime 35% 42% 27% 47% 50% 31% 35% 21% 23%
Not sure 28% 22% 33% 25% 13% 34% 24% 35% 34%
Totals 101% 99% 100% 99% 100% 100% 100% 100% 100%
Unweighted N (1,499) (730) (769) (331) (191) (347) (202) (167) (164)
Age Income Region
Total 18-29 30-44 45-64 65+ Under $50K $50-100K $100K or more Northeast Midwest South West
Result of climate change 38% 40% 40% 36% 35% 38% 38% 40% 42% 35% 32% 46%
Just happen from time totime 35% 24% 30% 40% 42% 29% 39% 44% 35% 41% 34% 30%
Not sure 28% 36% 30% 24% 23% 33% 23% 16% 23% 24% 34% 24%
Totals 101% 100% 100% 100% 100% 100% 100% 100% 100% 100% 100% 100%
Unweighted N (1,499) (194) (355) (595) (355) (601) (420) (287) (253) (308) (539) (399)
107

The Economist /YouGov PollJuly 17 - 20, 2021 - 1500 U.S. Adult Citizens
Registered 2020 Vote Party ID Ideology
Total Voters Biden Trump Dem Rep Ind Lib Mod Con
Result of climate change 38% 39% 65% 13% 58% 16% 35% 63% 43% 14%
Just happen from time totime 35% 38% 13% 69% 19% 61% 38% 15% 29% 64%
Not sure 28% 24% 22% 18% 23% 23% 27% 22% 28% 22%
Totals 101% 101% 100% 100% 100% 100% 100% 100% 100% 100%
Unweighted N (1,499) (1,271) (583) (531) (516) (371) (445) (436) (430) (492)
108

The Economist /YouGov PollJuly 17 - 20, 2021 - 1500 U.S. Adult Citizens
51C. Relationship of Severe Weather And Climate Change — Rising sea levelsDo you think the severity of the weather events listed below are the result of climate change or do these kind of events just happen from time to time?
Gender White Men White Women Race
Total Male Female No degree College Grad No degree College Grad Black Hispanic
Result of climate change 54% 54% 55% 49% 53% 49% 62% 57% 58%
Just happen from time totime 30% 35% 26% 38% 38% 31% 27% 21% 22%
Not sure 16% 11% 19% 13% 8% 20% 12% 22% 20%
Totals 100% 100% 100% 100% 99% 100% 101% 100% 100%
Unweighted N (1,499) (730) (769) (331) (191) (347) (202) (167) (164)
Age Income Region
Total 18-29 30-44 45-64 65+ Under $50K $50-100K $100K or more Northeast Midwest South West
Result of climate change 54% 61% 56% 51% 51% 53% 56% 59% 59% 50% 47% 66%
Just happen from time totime 30% 20% 24% 34% 40% 28% 32% 31% 29% 36% 32% 24%
Not sure 16% 19% 20% 14% 10% 19% 12% 9% 11% 14% 21% 10%
Totals 100% 100% 100% 99% 101% 100% 100% 99% 99% 100% 100% 100%
Unweighted N (1,499) (194) (355) (595) (355) (601) (420) (287) (253) (308) (539) (399)
109

The Economist /YouGov PollJuly 17 - 20, 2021 - 1500 U.S. Adult Citizens
Registered 2020 Vote Party ID Ideology
Total Voters Biden Trump Dem Rep Ind Lib Mod Con
Result of climate change 54% 55% 86% 23% 78% 26% 53% 84% 60% 25%
Just happen from time totime 30% 33% 7% 65% 13% 59% 32% 9% 25% 60%
Not sure 16% 12% 7% 12% 9% 15% 15% 6% 15% 15%
Totals 100% 100% 100% 100% 100% 100% 100% 99% 100% 100%
Unweighted N (1,499) (1,271) (583) (531) (516) (371) (445) (436) (430) (492)
110

The Economist /YouGov PollJuly 17 - 20, 2021 - 1500 U.S. Adult Citizens
51D. Relationship of Severe Weather And Climate Change — Pacific Northwest heat wave in 2021Do you think the severity of the weather events listed below are the result of climate change or do these kind of events just happen from time to time?
Gender White Men White Women Race
Total Male Female No degree College Grad No degree College Grad Black Hispanic
Result of climate change 50% 48% 53% 39% 49% 45% 60% 59% 55%
Just happen from time totime 34% 40% 28% 48% 43% 34% 29% 21% 24%
Not sure 16% 12% 19% 12% 8% 20% 11% 20% 22%
Totals 100% 100% 100% 99% 100% 99% 100% 100% 101%
Unweighted N (1,499) (730) (769) (331) (191) (347) (202) (167) (164)
Age Income Region
Total 18-29 30-44 45-64 65+ Under $50K $50-100K $100K or more Northeast Midwest South West
Result of climate change 50% 59% 54% 46% 45% 50% 52% 52% 52% 49% 45% 58%
Just happen from time totime 34% 20% 24% 40% 47% 31% 36% 38% 36% 36% 35% 29%
Not sure 16% 21% 22% 14% 8% 18% 12% 9% 12% 15% 20% 12%
Totals 100% 100% 100% 100% 100% 99% 100% 99% 100% 100% 100% 99%
Unweighted N (1,499) (194) (355) (595) (355) (601) (420) (287) (253) (308) (539) (399)
111

The Economist /YouGov PollJuly 17 - 20, 2021 - 1500 U.S. Adult Citizens
Registered 2020 Vote Party ID Ideology
Total Voters Biden Trump Dem Rep Ind Lib Mod Con
Result of climate change 50% 51% 84% 17% 76% 20% 48% 82% 57% 19%
Just happen from time totime 34% 37% 9% 74% 14% 69% 36% 10% 27% 69%
Not sure 16% 12% 7% 9% 11% 11% 16% 8% 16% 12%
Totals 100% 100% 100% 100% 101% 100% 100% 100% 100% 100%
Unweighted N (1,499) (1,271) (583) (531) (516) (371) (445) (436) (430) (492)
112

The Economist /YouGov PollJuly 17 - 20, 2021 - 1500 U.S. Adult Citizens
51E. Relationship of Severe Weather And Climate Change — Texas cold snap in 2021Do you think the severity of the weather events listed below are the result of climate change or do these kind of events just happen from time to time?
Gender White Men White Women Race
Total Male Female No degree College Grad No degree College Grad Black Hispanic
Result of climate change 42% 38% 47% 32% 35% 41% 55% 47% 46%
Just happen from time totime 39% 47% 31% 54% 53% 37% 35% 26% 23%
Not sure 19% 15% 22% 14% 11% 22% 11% 27% 30%
Totals 100% 100% 100% 100% 99% 100% 101% 100% 99%
Unweighted N (1,499) (730) (769) (331) (191) (347) (202) (167) (164)
Age Income Region
Total 18-29 30-44 45-64 65+ Under $50K $50-100K $100K or more Northeast Midwest South West
Result of climate change 42% 47% 46% 39% 40% 42% 43% 43% 46% 42% 36% 51%
Just happen from time totime 39% 26% 29% 45% 51% 36% 40% 48% 38% 41% 41% 34%
Not sure 19% 27% 24% 16% 10% 22% 17% 9% 16% 18% 23% 15%
Totals 100% 100% 99% 100% 101% 100% 100% 100% 100% 101% 100% 100%
Unweighted N (1,499) (194) (355) (595) (355) (601) (420) (287) (253) (308) (539) (399)
113

The Economist /YouGov PollJuly 17 - 20, 2021 - 1500 U.S. Adult Citizens
Registered 2020 Vote Party ID Ideology
Total Voters Biden Trump Dem Rep Ind Lib Mod Con
Result of climate change 42% 43% 75% 12% 66% 17% 37% 74% 46% 13%
Just happen from time totime 39% 43% 14% 79% 19% 71% 43% 14% 34% 75%
Not sure 19% 14% 12% 9% 15% 12% 19% 12% 20% 13%
Totals 100% 100% 101% 100% 100% 100% 99% 100% 100% 101%
Unweighted N (1,499) (1,271) (583) (531) (516) (371) (445) (436) (430) (492)
114

The Economist /YouGov PollJuly 17 - 20, 2021 - 1500 U.S. Adult Citizens
51F. Relationship of Severe Weather And Climate Change — Severe hurricanes (e.g. Katrina, Harvey)Do you think the severity of the weather events listed below are the result of climate change or do these kind of events just happen from time to time?
Gender White Men White Women Race
Total Male Female No degree College Grad No degree College Grad Black Hispanic
Result of climate change 41% 39% 43% 29% 42% 38% 51% 47% 48%
Just happen from time totime 44% 50% 39% 58% 50% 44% 37% 34% 32%
Not sure 15% 12% 18% 13% 9% 19% 12% 19% 20%
Totals 100% 101% 100% 100% 101% 101% 100% 100% 100%
Unweighted N (1,500) (731) (769) (331) (191) (347) (202) (168) (164)
Age Income Region
Total 18-29 30-44 45-64 65+ Under $50K $50-100K $100K or more Northeast Midwest South West
Result of climate change 41% 41% 43% 40% 40% 41% 42% 44% 47% 36% 37% 47%
Just happen from time totime 44% 38% 34% 48% 53% 42% 45% 47% 41% 48% 45% 42%
Not sure 15% 21% 23% 11% 7% 17% 13% 8% 12% 15% 18% 12%
Totals 100% 100% 100% 99% 100% 100% 100% 99% 100% 99% 100% 101%
Unweighted N (1,500) (195) (355) (595) (355) (602) (420) (287) (253) (308) (540) (399)
115

The Economist /YouGov PollJuly 17 - 20, 2021 - 1500 U.S. Adult Citizens
Registered 2020 Vote Party ID Ideology
Total Voters Biden Trump Dem Rep Ind Lib Mod Con
Result of climate change 41% 42% 72% 12% 68% 14% 34% 73% 43% 13%
Just happen from time totime 44% 47% 19% 81% 20% 75% 51% 18% 40% 76%
Not sure 15% 11% 9% 7% 12% 11% 14% 9% 17% 10%
Totals 100% 100% 100% 100% 100% 100% 99% 100% 100% 99%
Unweighted N (1,500) (1,272) (584) (531) (516) (371) (445) (436) (430) (492)
116

The Economist /YouGov PollJuly 17 - 20, 2021 - 1500 U.S. Adult Citizens
52A. Issue Importance — Jobs and the economyHow important are the following issues to you?
Gender White Men White Women Race
Total Male Female No degree College Grad No degree College Grad Black Hispanic
Very Important 68% 68% 68% 67% 63% 68% 64% 76% 71%
Somewhat Important 27% 27% 27% 26% 31% 26% 31% 20% 23%
Not very Important 4% 4% 4% 5% 5% 5% 2% 4% 4%
Unimportant 1% 1% 1% 2% 1% 1% 2% 0% 2%
Totals 100% 100% 100% 100% 100% 100% 99% 100% 100%
Unweighted N (1,499) (730) (769) (331) (191) (347) (202) (167) (164)
Age Income Region
Total 18-29 30-44 45-64 65+ Under $50K $50-100K $100K or more Northeast Midwest South West
Very Important 68% 59% 60% 73% 75% 70% 66% 65% 70% 65% 70% 64%
Somewhat Important 27% 33% 31% 23% 23% 25% 29% 30% 24% 31% 24% 29%
Not very Important 4% 7% 7% 3% 1% 4% 5% 4% 5% 2% 4% 6%
Unimportant 1% 1% 2% 1% 1% 2% 0% 1% 0% 1% 2% 1%
Totals 100% 100% 100% 100% 100% 101% 100% 100% 99% 99% 100% 100%
Unweighted N (1,499) (195) (355) (595) (354) (602) (419) (287) (253) (308) (539) (399)
117

The Economist /YouGov PollJuly 17 - 20, 2021 - 1500 U.S. Adult Citizens
Registered 2020 Vote Party ID Ideology
Total Voters Biden Trump Dem Rep Ind Lib Mod Con
Very Important 68% 70% 68% 75% 67% 72% 63% 66% 61% 74%
Somewhat Important 27% 27% 27% 23% 27% 23% 32% 28% 33% 23%
Not very Important 4% 3% 4% 1% 5% 4% 4% 5% 5% 2%
Unimportant 1% 1% 1% 1% 1% 1% 1% 1% 1% 1%
Totals 100% 101% 100% 100% 100% 100% 100% 100% 100% 100%
Unweighted N (1,499) (1,271) (583) (531) (515) (371) (445) (435) (430) (492)
118

The Economist /YouGov PollJuly 17 - 20, 2021 - 1500 U.S. Adult Citizens
52B. Issue Importance — ImmigrationHow important are the following issues to you?
Gender White Men White Women Race
Total Male Female No degree College Grad No degree College Grad Black Hispanic
Very Important 45% 44% 45% 49% 43% 45% 44% 39% 45%
Somewhat Important 35% 35% 36% 29% 40% 34% 39% 34% 39%
Not very Important 15% 16% 14% 16% 13% 17% 11% 19% 11%
Unimportant 5% 5% 5% 6% 4% 5% 6% 8% 4%
Totals 100% 100% 100% 100% 100% 101% 100% 100% 99%
Unweighted N (1,500) (731) (769) (331) (191) (347) (202) (168) (164)
Age Income Region
Total 18-29 30-44 45-64 65+ Under $50K $50-100K $100K or more Northeast Midwest South West
Very Important 45% 32% 36% 47% 62% 41% 46% 46% 41% 43% 48% 44%
Somewhat Important 35% 38% 37% 35% 31% 34% 37% 34% 37% 37% 34% 34%
Not very Important 15% 24% 20% 13% 5% 18% 12% 16% 18% 16% 12% 18%
Unimportant 5% 6% 8% 5% 2% 6% 5% 5% 5% 5% 6% 4%
Totals 100% 100% 101% 100% 100% 99% 100% 101% 101% 101% 100% 100%
Unweighted N (1,500) (195) (355) (595) (355) (602) (420) (287) (253) (308) (540) (399)
119

The Economist /YouGov PollJuly 17 - 20, 2021 - 1500 U.S. Adult Citizens
Registered 2020 Vote Party ID Ideology
Total Voters Biden Trump Dem Rep Ind Lib Mod Con
Very Important 45% 48% 34% 70% 36% 62% 40% 35% 36% 64%
Somewhat Important 35% 34% 43% 22% 41% 27% 36% 39% 43% 24%
Not very Important 15% 13% 19% 5% 18% 8% 18% 22% 16% 9%
Unimportant 5% 4% 4% 3% 4% 3% 6% 4% 5% 4%
Totals 100% 99% 100% 100% 99% 100% 100% 100% 100% 101%
Unweighted N (1,500) (1,272) (584) (531) (516) (371) (445) (436) (430) (492)
120

The Economist /YouGov PollJuly 17 - 20, 2021 - 1500 U.S. Adult Citizens
52C. Issue Importance — Climate change and the environmentHow important are the following issues to you?
Gender White Men White Women Race
Total Male Female No degree College Grad No degree College Grad Black Hispanic
Very Important 46% 41% 50% 35% 41% 44% 52% 56% 51%
Somewhat Important 28% 28% 28% 27% 27% 31% 27% 29% 30%
Not very Important 15% 17% 13% 22% 15% 17% 11% 11% 10%
Unimportant 11% 14% 9% 16% 17% 9% 10% 5% 9%
Totals 100% 100% 100% 100% 100% 101% 100% 101% 100%
Unweighted N (1,500) (731) (769) (331) (191) (347) (202) (168) (164)
Age Income Region
Total 18-29 30-44 45-64 65+ Under $50K $50-100K $100K or more Northeast Midwest South West
Very Important 46% 52% 49% 41% 44% 45% 47% 47% 53% 45% 41% 49%
Somewhat Important 28% 33% 33% 26% 21% 32% 25% 26% 27% 26% 29% 28%
Not very Important 15% 10% 10% 15% 23% 14% 16% 14% 11% 16% 17% 14%
Unimportant 11% 4% 8% 18% 11% 9% 12% 13% 9% 13% 12% 9%
Totals 100% 99% 100% 100% 99% 100% 100% 100% 100% 100% 99% 100%
Unweighted N (1,500) (195) (355) (595) (355) (602) (420) (287) (253) (308) (540) (399)
121

The Economist /YouGov PollJuly 17 - 20, 2021 - 1500 U.S. Adult Citizens
Registered 2020 Vote Party ID Ideology
Total Voters Biden Trump Dem Rep Ind Lib Mod Con
Very Important 46% 46% 77% 13% 69% 19% 40% 74% 45% 19%
Somewhat Important 28% 26% 18% 28% 24% 27% 31% 20% 36% 25%
Not very Important 15% 16% 4% 31% 6% 30% 18% 4% 11% 31%
Unimportant 11% 12% 1% 28% 2% 25% 11% 2% 8% 25%
Totals 100% 100% 100% 100% 101% 101% 100% 100% 100% 100%
Unweighted N (1,500) (1,272) (584) (531) (516) (371) (445) (436) (430) (492)
122

The Economist /YouGov PollJuly 17 - 20, 2021 - 1500 U.S. Adult Citizens
52D. Issue Importance — Foreign policyHow important are the following issues to you?
Gender White Men White Women Race
Total Male Female No degree College Grad No degree College Grad Black Hispanic
Very Important 38% 41% 35% 41% 42% 34% 35% 41% 40%
Somewhat Important 42% 41% 42% 39% 45% 41% 49% 34% 41%
Not very Important 15% 14% 17% 15% 11% 20% 13% 17% 16%
Unimportant 5% 4% 6% 6% 2% 5% 4% 8% 3%
Totals 100% 100% 100% 101% 100% 100% 101% 100% 100%
Unweighted N (1,499) (731) (768) (331) (191) (346) (202) (168) (164)
Age Income Region
Total 18-29 30-44 45-64 65+ Under $50K $50-100K $100K or more Northeast Midwest South West
Very Important 38% 33% 28% 40% 49% 35% 41% 40% 42% 32% 42% 35%
Somewhat Important 42% 40% 47% 41% 39% 40% 44% 45% 40% 43% 40% 45%
Not very Important 15% 20% 19% 14% 10% 19% 13% 13% 15% 20% 14% 13%
Unimportant 5% 6% 6% 4% 2% 7% 3% 2% 3% 5% 4% 6%
Totals 100% 99% 100% 99% 100% 101% 101% 100% 100% 100% 100% 99%
Unweighted N (1,499) (195) (355) (595) (354) (601) (420) (287) (253) (307) (540) (399)
123

The Economist /YouGov PollJuly 17 - 20, 2021 - 1500 U.S. Adult Citizens
Registered 2020 Vote Party ID Ideology
Total Voters Biden Trump Dem Rep Ind Lib Mod Con
Very Important 38% 42% 38% 48% 38% 48% 34% 39% 32% 48%
Somewhat Important 42% 42% 45% 40% 44% 34% 46% 45% 46% 36%
Not very Important 15% 13% 14% 9% 14% 14% 16% 14% 17% 12%
Unimportant 5% 3% 3% 3% 4% 4% 3% 3% 5% 4%
Totals 100% 100% 100% 100% 100% 100% 99% 101% 100% 100%
Unweighted N (1,499) (1,271) (584) (531) (516) (370) (445) (436) (430) (491)
124

The Economist /YouGov PollJuly 17 - 20, 2021 - 1500 U.S. Adult Citizens
52E. Issue Importance — National SecurityHow important are the following issues to you?
Gender White Men White Women Race
Total Male Female No degree College Grad No degree College Grad Black Hispanic
Very Important 62% 62% 61% 65% 63% 64% 54% 65% 58%
Somewhat Important 28% 29% 28% 26% 28% 26% 34% 25% 29%
Not very Important 7% 6% 9% 6% 7% 7% 9% 5% 10%
Unimportant 3% 3% 3% 3% 2% 2% 2% 5% 3%
Totals 100% 100% 101% 100% 100% 99% 99% 100% 100%
Unweighted N (1,499) (731) (768) (331) (191) (346) (202) (168) (164)
Age Income Region
Total 18-29 30-44 45-64 65+ Under $50K $50-100K $100K or more Northeast Midwest South West
Very Important 62% 45% 46% 69% 81% 61% 61% 58% 61% 59% 66% 57%
Somewhat Important 28% 38% 35% 26% 16% 27% 31% 32% 31% 32% 25% 29%
Not very Important 7% 12% 14% 4% 2% 7% 7% 9% 7% 7% 7% 8%
Unimportant 3% 5% 6% 1% 1% 4% 1% 2% 1% 2% 2% 6%
Totals 100% 100% 101% 100% 100% 99% 100% 101% 100% 100% 100% 100%
Unweighted N (1,499) (195) (354) (595) (355) (601) (420) (287) (253) (308) (539) (399)
125

The Economist /YouGov PollJuly 17 - 20, 2021 - 1500 U.S. Adult Citizens
Registered 2020 Vote Party ID Ideology
Total Voters Biden Trump Dem Rep Ind Lib Mod Con
Very Important 62% 65% 56% 82% 56% 75% 60% 47% 58% 79%
Somewhat Important 28% 27% 35% 14% 35% 19% 28% 38% 34% 16%
Not very Important 7% 7% 8% 3% 7% 4% 9% 12% 5% 4%
Unimportant 3% 1% 2% 1% 2% 2% 3% 3% 3% 1%
Totals 100% 100% 101% 100% 100% 100% 100% 100% 100% 100%
Unweighted N (1,499) (1,271) (584) (531) (516) (370) (445) (436) (429) (492)
126

The Economist /YouGov PollJuly 17 - 20, 2021 - 1500 U.S. Adult Citizens
52F. Issue Importance — EducationHow important are the following issues to you?
Gender White Men White Women Race
Total Male Female No degree College Grad No degree College Grad Black Hispanic
Very Important 61% 57% 64% 50% 57% 60% 65% 73% 67%
Somewhat Important 29% 31% 28% 36% 31% 33% 28% 17% 23%
Not very Important 7% 8% 5% 9% 9% 6% 4% 4% 6%
Unimportant 3% 4% 3% 4% 3% 1% 3% 6% 4%
Totals 100% 100% 100% 99% 100% 100% 100% 100% 100%
Unweighted N (1,499) (731) (768) (331) (191) (347) (202) (168) (163)
Age Income Region
Total 18-29 30-44 45-64 65+ Under $50K $50-100K $100K or more Northeast Midwest South West
Very Important 61% 60% 56% 60% 66% 62% 59% 57% 61% 61% 60% 60%
Somewhat Important 29% 29% 32% 28% 28% 26% 32% 34% 31% 29% 29% 29%
Not very Important 7% 7% 7% 7% 5% 7% 7% 6% 6% 8% 7% 6%
Unimportant 3% 4% 5% 4% 1% 5% 2% 3% 2% 2% 3% 6%
Totals 100% 100% 100% 99% 100% 100% 100% 100% 100% 100% 99% 101%
Unweighted N (1,499) (195) (355) (594) (355) (602) (420) (286) (253) (308) (539) (399)
127

The Economist /YouGov PollJuly 17 - 20, 2021 - 1500 U.S. Adult Citizens
Registered 2020 Vote Party ID Ideology
Total Voters Biden Trump Dem Rep Ind Lib Mod Con
Very Important 61% 62% 69% 54% 67% 56% 55% 66% 57% 55%
Somewhat Important 29% 29% 26% 33% 27% 31% 32% 28% 32% 31%
Not very Important 7% 7% 4% 9% 4% 9% 9% 4% 7% 9%
Unimportant 3% 2% 1% 4% 2% 4% 4% 2% 3% 4%
Totals 100% 100% 100% 100% 100% 100% 100% 100% 99% 99%
Unweighted N (1,499) (1,271) (584) (530) (516) (371) (444) (436) (429) (492)
128

The Economist /YouGov PollJuly 17 - 20, 2021 - 1500 U.S. Adult Citizens
52G. Issue Importance — Health careHow important are the following issues to you?
Gender White Men White Women Race
Total Male Female No degree College Grad No degree College Grad Black Hispanic
Very Important 65% 58% 71% 57% 57% 71% 67% 72% 65%
Somewhat Important 27% 31% 23% 33% 32% 25% 24% 21% 26%
Not very Important 6% 8% 4% 8% 8% 4% 6% 2% 7%
Unimportant 2% 3% 2% 2% 3% 1% 4% 4% 2%
Totals 100% 100% 100% 100% 100% 101% 101% 99% 100%
Unweighted N (1,500) (731) (769) (331) (191) (347) (202) (168) (164)
Age Income Region
Total 18-29 30-44 45-64 65+ Under $50K $50-100K $100K or more Northeast Midwest South West
Very Important 65% 53% 63% 67% 75% 68% 65% 57% 69% 64% 66% 61%
Somewhat Important 27% 36% 25% 25% 22% 25% 26% 30% 25% 30% 26% 26%
Not very Important 6% 10% 8% 6% 3% 4% 7% 11% 5% 5% 5% 10%
Unimportant 2% 2% 4% 3% 0% 3% 2% 3% 2% 1% 3% 3%
Totals 100% 101% 100% 101% 100% 100% 100% 101% 101% 100% 100% 100%
Unweighted N (1,500) (195) (355) (595) (355) (602) (420) (287) (253) (308) (540) (399)
129

The Economist /YouGov PollJuly 17 - 20, 2021 - 1500 U.S. Adult Citizens
Registered 2020 Vote Party ID Ideology
Total Voters Biden Trump Dem Rep Ind Lib Mod Con
Very Important 65% 67% 86% 50% 79% 51% 59% 80% 62% 51%
Somewhat Important 27% 26% 12% 36% 18% 36% 31% 17% 30% 35%
Not very Important 6% 6% 1% 11% 2% 10% 9% 3% 6% 10%
Unimportant 2% 2% 1% 3% 1% 3% 2% 1% 2% 4%
Totals 100% 101% 100% 100% 100% 100% 101% 101% 100% 100%
Unweighted N (1,500) (1,272) (584) (531) (516) (371) (445) (436) (430) (492)
130

The Economist /YouGov PollJuly 17 - 20, 2021 - 1500 U.S. Adult Citizens
52H. Issue Importance — Taxes and government spendingHow important are the following issues to you?
Gender White Men White Women Race
Total Male Female No degree College Grad No degree College Grad Black Hispanic
Very Important 59% 61% 58% 63% 62% 59% 55% 56% 60%
Somewhat Important 31% 28% 34% 26% 27% 32% 36% 34% 30%
Not very Important 8% 9% 8% 9% 7% 8% 7% 9% 9%
Unimportant 2% 2% 1% 2% 4% 0% 2% 1% 0%
Totals 100% 100% 101% 100% 100% 99% 100% 100% 99%
Unweighted N (1,497) (730) (767) (330) (191) (346) (202) (168) (163)
Age Income Region
Total 18-29 30-44 45-64 65+ Under $50K $50-100K $100K or more Northeast Midwest South West
Very Important 59% 46% 48% 66% 73% 57% 60% 59% 64% 61% 59% 54%
Somewhat Important 31% 36% 38% 27% 25% 33% 29% 31% 24% 27% 33% 36%
Not very Important 8% 16% 12% 6% 2% 8% 9% 9% 12% 10% 6% 8%
Unimportant 2% 2% 3% 1% 1% 2% 1% 1% 0% 2% 2% 2%
Totals 100% 100% 101% 100% 101% 100% 99% 100% 100% 100% 100% 100%
Unweighted N (1,497) (195) (355) (593) (354) (601) (420) (286) (253) (306) (539) (399)
131

The Economist /YouGov PollJuly 17 - 20, 2021 - 1500 U.S. Adult Citizens
Registered 2020 Vote Party ID Ideology
Total Voters Biden Trump Dem Rep Ind Lib Mod Con
Very Important 59% 63% 49% 82% 46% 75% 61% 46% 56% 74%
Somewhat Important 31% 28% 39% 16% 41% 21% 28% 38% 35% 21%
Not very Important 8% 7% 10% 2% 11% 2% 10% 14% 8% 4%
Unimportant 2% 1% 2% 0% 2% 2% 1% 2% 1% 2%
Totals 100% 99% 100% 100% 100% 100% 100% 100% 100% 101%
Unweighted N (1,497) (1,269) (584) (529) (516) (370) (443) (436) (429) (490)
132

The Economist /YouGov PollJuly 17 - 20, 2021 - 1500 U.S. Adult Citizens
52I. Issue Importance — AbortionHow important are the following issues to you?
Gender White Men White Women Race
Total Male Female No degree College Grad No degree College Grad Black Hispanic
Very Important 42% 37% 46% 38% 37% 49% 47% 38% 40%
Somewhat Important 25% 27% 23% 22% 31% 24% 22% 25% 32%
Not very Important 20% 20% 20% 19% 21% 20% 20% 21% 18%
Unimportant 13% 15% 11% 20% 11% 8% 11% 17% 9%
Totals 100% 99% 100% 99% 100% 101% 100% 101% 99%
Unweighted N (1,496) (730) (766) (331) (191) (346) (202) (166) (163)
Age Income Region
Total 18-29 30-44 45-64 65+ Under $50K $50-100K $100K or more Northeast Midwest South West
Very Important 42% 41% 37% 41% 49% 43% 39% 38% 43% 40% 43% 42%
Somewhat Important 25% 27% 31% 23% 20% 21% 30% 28% 23% 26% 25% 26%
Not very Important 20% 23% 18% 20% 18% 22% 21% 19% 21% 21% 18% 21%
Unimportant 13% 10% 14% 15% 12% 14% 11% 15% 14% 14% 14% 11%
Totals 100% 101% 100% 99% 99% 100% 101% 100% 101% 101% 100% 100%
Unweighted N (1,496) (195) (355) (592) (354) (600) (420) (286) (253) (307) (537) (399)
133

The Economist /YouGov PollJuly 17 - 20, 2021 - 1500 U.S. Adult Citizens
Registered 2020 Vote Party ID Ideology
Total Voters Biden Trump Dem Rep Ind Lib Mod Con
Very Important 42% 44% 45% 47% 43% 50% 33% 47% 31% 48%
Somewhat Important 25% 25% 25% 23% 25% 24% 27% 25% 28% 24%
Not very Important 20% 19% 18% 18% 20% 17% 22% 19% 25% 16%
Unimportant 13% 12% 13% 11% 12% 9% 17% 9% 17% 12%
Totals 100% 100% 101% 99% 100% 100% 99% 100% 101% 100%
Unweighted N (1,496) (1,268) (582) (530) (515) (370) (443) (436) (428) (490)
134

The Economist /YouGov PollJuly 17 - 20, 2021 - 1500 U.S. Adult Citizens
52J. Issue Importance — Civil rightsHow important are the following issues to you?
Gender White Men White Women Race
Total Male Female No degree College Grad No degree College Grad Black Hispanic
Very Important 59% 52% 64% 48% 50% 60% 63% 74% 62%
Somewhat Important 27% 28% 26% 31% 26% 27% 27% 19% 27%
Not very Important 10% 12% 8% 11% 18% 11% 8% 3% 7%
Unimportant 5% 8% 2% 10% 6% 2% 2% 5% 4%
Totals 101% 100% 100% 100% 100% 100% 100% 101% 100%
Unweighted N (1,498) (731) (767) (331) (191) (346) (202) (168) (163)
Age Income Region
Total 18-29 30-44 45-64 65+ Under $50K $50-100K $100K or more Northeast Midwest South West
Very Important 59% 57% 56% 59% 61% 59% 58% 52% 57% 55% 59% 62%
Somewhat Important 27% 29% 29% 25% 25% 28% 27% 25% 27% 30% 26% 25%
Not very Important 10% 9% 10% 10% 10% 8% 11% 15% 12% 10% 10% 7%
Unimportant 5% 5% 5% 5% 4% 5% 4% 7% 3% 4% 5% 6%
Totals 101% 100% 100% 99% 100% 100% 100% 99% 99% 99% 100% 100%
Unweighted N (1,498) (195) (355) (594) (354) (601) (420) (286) (253) (307) (539) (399)
135

The Economist /YouGov PollJuly 17 - 20, 2021 - 1500 U.S. Adult Citizens
Registered 2020 Vote Party ID Ideology
Total Voters Biden Trump Dem Rep Ind Lib Mod Con
Very Important 59% 60% 78% 41% 74% 45% 50% 78% 51% 46%
Somewhat Important 27% 26% 17% 34% 20% 35% 31% 16% 35% 31%
Not very Important 10% 10% 3% 17% 4% 14% 13% 5% 10% 15%
Unimportant 5% 5% 1% 8% 2% 7% 7% 1% 5% 8%
Totals 101% 101% 99% 100% 100% 101% 101% 100% 101% 100%
Unweighted N (1,498) (1,270) (584) (530) (516) (370) (444) (436) (429) (491)
136

The Economist /YouGov PollJuly 17 - 20, 2021 - 1500 U.S. Adult Citizens
52K. Issue Importance — Civil libertiesHow important are the following issues to you?
Gender White Men White Women Race
Total Male Female No degree College Grad No degree College Grad Black Hispanic
Very Important 58% 53% 62% 50% 54% 55% 65% 70% 57%
Somewhat Important 29% 32% 27% 33% 30% 32% 25% 20% 32%
Not very Important 9% 10% 8% 10% 10% 11% 7% 5% 7%
Unimportant 4% 6% 2% 6% 6% 2% 3% 4% 4%
Totals 100% 101% 99% 99% 100% 100% 100% 99% 100%
Unweighted N (1,497) (730) (767) (331) (190) (346) (202) (168) (163)
Age Income Region
Total 18-29 30-44 45-64 65+ Under $50K $50-100K $100K or more Northeast Midwest South West
Very Important 58% 54% 54% 60% 62% 58% 56% 57% 61% 55% 58% 57%
Somewhat Important 29% 34% 31% 27% 26% 28% 32% 28% 26% 32% 29% 28%
Not very Important 9% 9% 9% 9% 8% 10% 9% 10% 10% 8% 8% 10%
Unimportant 4% 3% 5% 4% 4% 4% 3% 5% 3% 4% 4% 5%
Totals 100% 100% 99% 100% 100% 100% 100% 100% 100% 99% 99% 100%
Unweighted N (1,497) (195) (355) (593) (354) (601) (420) (285) (253) (307) (539) (398)
137

The Economist /YouGov PollJuly 17 - 20, 2021 - 1500 U.S. Adult Citizens
Registered 2020 Vote Party ID Ideology
Total Voters Biden Trump Dem Rep Ind Lib Mod Con
Very Important 58% 61% 73% 50% 68% 47% 53% 74% 49% 51%
Somewhat Important 29% 27% 22% 32% 26% 35% 32% 20% 38% 30%
Not very Important 9% 8% 3% 11% 4% 12% 12% 4% 10% 12%
Unimportant 4% 4% 1% 6% 2% 6% 3% 2% 3% 7%
Totals 100% 100% 99% 99% 100% 100% 100% 100% 100% 100%
Unweighted N (1,497) (1,269) (583) (530) (515) (370) (444) (436) (428) (491)
138

The Economist /YouGov PollJuly 17 - 20, 2021 - 1500 U.S. Adult Citizens
52L. Issue Importance — GunsHow important are the following issues to you?
Gender White Men White Women Race
Total Male Female No degree College Grad No degree College Grad Black Hispanic
Very Important 52% 50% 54% 54% 42% 48% 53% 64% 52%
Somewhat Important 26% 27% 26% 22% 33% 30% 26% 21% 23%
Not very Important 14% 14% 14% 13% 16% 17% 14% 8% 15%
Unimportant 8% 10% 6% 11% 9% 5% 6% 7% 9%
Totals 100% 101% 100% 100% 100% 100% 99% 100% 99%
Unweighted N (1,498) (731) (767) (331) (191) (346) (202) (167) (164)
Age Income Region
Total 18-29 30-44 45-64 65+ Under $50K $50-100K $100K or more Northeast Midwest South West
Very Important 52% 39% 44% 59% 62% 51% 53% 48% 51% 50% 54% 51%
Somewhat Important 26% 33% 30% 23% 19% 25% 26% 32% 29% 26% 26% 24%
Not very Important 14% 17% 16% 13% 11% 16% 14% 13% 11% 16% 12% 17%
Unimportant 8% 10% 10% 6% 8% 9% 7% 7% 9% 8% 8% 8%
Totals 100% 99% 100% 101% 100% 101% 100% 100% 100% 100% 100% 100%
Unweighted N (1,498) (195) (355) (594) (354) (601) (419) (287) (253) (307) (539) (399)
139

The Economist /YouGov PollJuly 17 - 20, 2021 - 1500 U.S. Adult Citizens
Registered 2020 Vote Party ID Ideology
Total Voters Biden Trump Dem Rep Ind Lib Mod Con
Very Important 52% 55% 55% 63% 53% 59% 47% 52% 45% 60%
Somewhat Important 26% 26% 26% 19% 30% 21% 24% 26% 30% 21%
Not very Important 14% 12% 13% 10% 11% 11% 18% 15% 15% 11%
Unimportant 8% 8% 6% 8% 5% 8% 11% 7% 10% 7%
Totals 100% 101% 100% 100% 99% 99% 100% 100% 100% 99%
Unweighted N (1,498) (1,270) (583) (531) (515) (370) (445) (435) (430) (491)
140

The Economist /YouGov PollJuly 17 - 20, 2021 - 1500 U.S. Adult Citizens
52M. Issue Importance — CrimeHow important are the following issues to you?
Gender White Men White Women Race
Total Male Female No degree College Grad No degree College Grad Black Hispanic
Very Important 62% 61% 62% 66% 50% 66% 48% 74% 67%
Somewhat Important 30% 30% 30% 26% 36% 28% 41% 22% 27%
Not very Important 6% 6% 6% 6% 9% 5% 9% 3% 4%
Unimportant 2% 2% 2% 2% 5% 1% 3% 1% 3%
Totals 100% 99% 100% 100% 100% 100% 101% 100% 101%
Unweighted N (1,496) (731) (765) (331) (191) (346) (200) (167) (164)
Age Income Region
Total 18-29 30-44 45-64 65+ Under $50K $50-100K $100K or more Northeast Midwest South West
Very Important 62% 47% 49% 69% 78% 66% 59% 52% 63% 59% 67% 56%
Somewhat Important 30% 38% 37% 26% 20% 27% 33% 35% 28% 34% 25% 34%
Not very Important 6% 12% 9% 4% 1% 5% 7% 9% 7% 5% 6% 8%
Unimportant 2% 3% 4% 1% 1% 2% 1% 4% 2% 3% 2% 2%
Totals 100% 100% 99% 100% 100% 100% 100% 100% 100% 101% 100% 100%
Unweighted N (1,496) (195) (355) (593) (353) (600) (420) (285) (253) (308) (539) (396)
141

The Economist /YouGov PollJuly 17 - 20, 2021 - 1500 U.S. Adult Citizens
Registered 2020 Vote Party ID Ideology
Total Voters Biden Trump Dem Rep Ind Lib Mod Con
Very Important 62% 63% 55% 78% 59% 74% 55% 49% 56% 75%
Somewhat Important 30% 28% 32% 20% 31% 21% 37% 35% 38% 21%
Not very Important 6% 7% 10% 2% 8% 3% 6% 13% 4% 2%
Unimportant 2% 2% 2% 0% 2% 2% 2% 3% 2% 2%
Totals 100% 100% 99% 100% 100% 100% 100% 100% 100% 100%
Unweighted N (1,496) (1,268) (582) (529) (514) (370) (444) (434) (430) (490)
142

The Economist /YouGov PollJuly 17 - 20, 2021 - 1500 U.S. Adult Citizens
52N. Issue Importance — Criminal justice reformHow important are the following issues to you?
Gender White Men White Women Race
Total Male Female No degree College Grad No degree College Grad Black Hispanic
Very Important 53% 50% 56% 46% 39% 51% 45% 76% 66%
Somewhat Important 31% 31% 32% 31% 36% 36% 40% 14% 26%
Not very Important 11% 12% 9% 13% 18% 11% 11% 6% 4%
Unimportant 5% 7% 3% 10% 7% 2% 4% 4% 4%
Totals 100% 100% 100% 100% 100% 100% 100% 100% 100%
Unweighted N (1,498) (731) (767) (331) (191) (346) (202) (167) (164)
Age Income Region
Total 18-29 30-44 45-64 65+ Under $50K $50-100K $100K or more Northeast Midwest South West
Very Important 53% 54% 53% 51% 56% 59% 52% 38% 50% 52% 55% 54%
Somewhat Important 31% 32% 33% 31% 30% 27% 33% 38% 35% 32% 29% 32%
Not very Important 11% 10% 9% 12% 10% 9% 11% 16% 10% 13% 11% 9%
Unimportant 5% 4% 5% 6% 4% 5% 5% 8% 5% 4% 5% 5%
Totals 100% 100% 100% 100% 100% 100% 101% 100% 100% 101% 100% 100%
Unweighted N (1,498) (195) (355) (594) (354) (601) (419) (287) (253) (307) (539) (399)
143

The Economist /YouGov PollJuly 17 - 20, 2021 - 1500 U.S. Adult Citizens
Registered 2020 Vote Party ID Ideology
Total Voters Biden Trump Dem Rep Ind Lib Mod Con
Very Important 53% 53% 67% 36% 66% 39% 46% 67% 50% 39%
Somewhat Important 31% 31% 29% 36% 28% 33% 36% 27% 35% 33%
Not very Important 11% 12% 3% 19% 6% 19% 12% 4% 10% 19%
Unimportant 5% 4% 1% 9% 1% 9% 6% 1% 5% 9%
Totals 100% 100% 100% 100% 101% 100% 100% 99% 100% 100%
Unweighted N (1,498) (1,270) (583) (530) (515) (370) (445) (435) (430) (491)
144

The Economist /YouGov PollJuly 17 - 20, 2021 - 1500 U.S. Adult Citizens
53. Most Important IssueWhich of these is the most important issue for you?
Gender White Men White Women Race
Total Male Female No degree College Grad No degree College Grad Black Hispanic
Jobs and the economy 13% 14% 12% 10% 12% 14% 9% 19% 15%
Immigration 6% 7% 6% 7% 9% 8% 3% 2% 8%
Climate change and theenvironment 13% 13% 14% 12% 15% 12% 23% 7% 15%
Foreign policy 1% 1% 0% 1% 1% 0% 0% 0% 0%
National Security 6% 7% 5% 9% 5% 6% 7% 3% 5%
Education 6% 6% 5% 4% 7% 4% 4% 8% 9%
Health care 18% 17% 20% 22% 16% 21% 17% 15% 15%
Taxes and governmentspending 8% 10% 6% 13% 13% 8% 7% 2% 2%
Abortion 5% 4% 6% 3% 5% 6% 8% 1% 4%
Civil rights 8% 5% 10% 2% 4% 7% 10% 20% 8%
Civil liberties 3% 3% 4% 2% 4% 2% 7% 4% 1%
Guns 5% 6% 4% 9% 5% 4% 1% 5% 4%
Crime 5% 5% 5% 3% 4% 5% 3% 10% 12%
Criminal justice reform 3% 2% 3% 1% 2% 3% 1% 6% 3%
Totals 100% 100% 100% 98% 102% 100% 100% 102% 101%
Unweighted N (1,431) (700) (731) (317) (183) (329) (196) (159) (155)
145
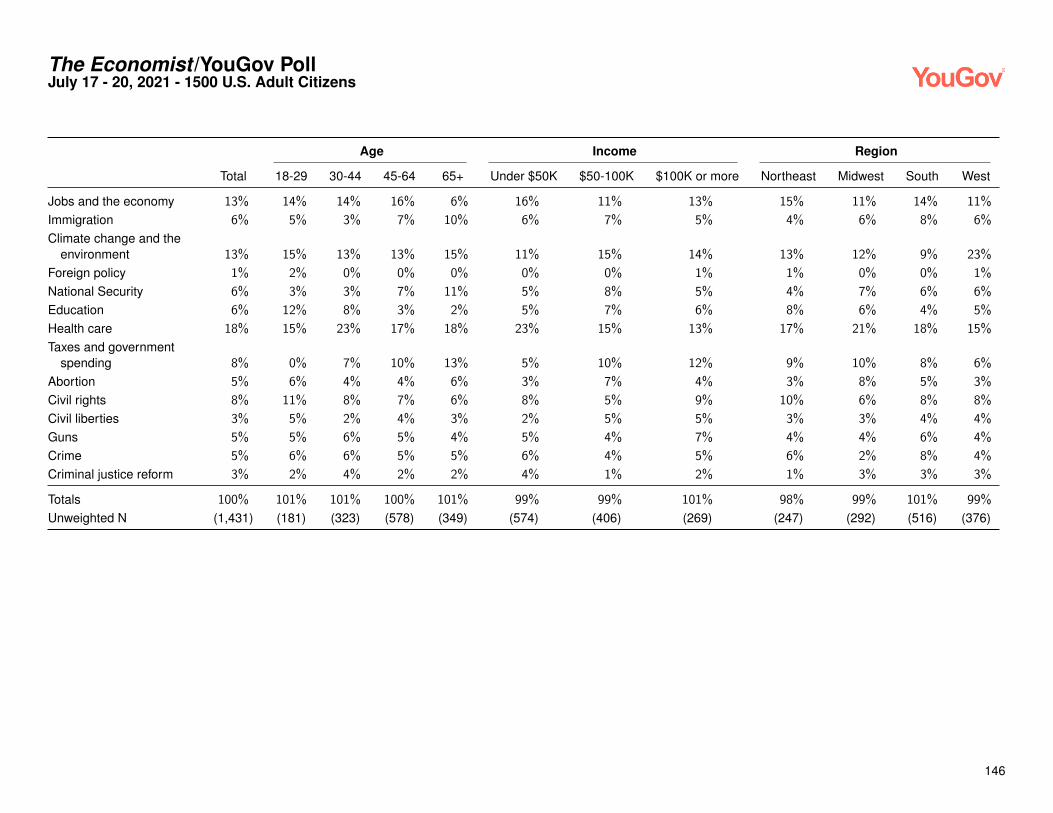
The Economist /YouGov PollJuly 17 - 20, 2021 - 1500 U.S. Adult Citizens
Age Income Region
Total 18-29 30-44 45-64 65+ Under $50K $50-100K $100K or more Northeast Midwest South West
Jobs and the economy 13% 14% 14% 16% 6% 16% 11% 13% 15% 11% 14% 11%
Immigration 6% 5% 3% 7% 10% 6% 7% 5% 4% 6% 8% 6%
Climate change and theenvironment 13% 15% 13% 13% 15% 11% 15% 14% 13% 12% 9% 23%
Foreign policy 1% 2% 0% 0% 0% 0% 0% 1% 1% 0% 0% 1%
National Security 6% 3% 3% 7% 11% 5% 8% 5% 4% 7% 6% 6%
Education 6% 12% 8% 3% 2% 5% 7% 6% 8% 6% 4% 5%
Health care 18% 15% 23% 17% 18% 23% 15% 13% 17% 21% 18% 15%
Taxes and governmentspending 8% 0% 7% 10% 13% 5% 10% 12% 9% 10% 8% 6%
Abortion 5% 6% 4% 4% 6% 3% 7% 4% 3% 8% 5% 3%
Civil rights 8% 11% 8% 7% 6% 8% 5% 9% 10% 6% 8% 8%
Civil liberties 3% 5% 2% 4% 3% 2% 5% 5% 3% 3% 4% 4%
Guns 5% 5% 6% 5% 4% 5% 4% 7% 4% 4% 6% 4%
Crime 5% 6% 6% 5% 5% 6% 4% 5% 6% 2% 8% 4%
Criminal justice reform 3% 2% 4% 2% 2% 4% 1% 2% 1% 3% 3% 3%
Totals 100% 101% 101% 100% 101% 99% 99% 101% 98% 99% 101% 99%
Unweighted N (1,431) (181) (323) (578) (349) (574) (406) (269) (247) (292) (516) (376)
146

The Economist /YouGov PollJuly 17 - 20, 2021 - 1500 U.S. Adult Citizens
Registered 2020 Vote Party ID Ideology
Total Voters Biden Trump Dem Rep Ind Lib Mod Con
Jobs and the economy 13% 12% 11% 12% 11% 15% 14% 11% 14% 13%
Immigration 6% 7% 0% 15% 1% 14% 5% 1% 4% 13%
Climate change and theenvironment 13% 14% 26% 1% 20% 3% 14% 24% 16% 3%
Foreign policy 1% 1% 0% 1% 0% 0% 2% 0% 1% 0%
National Security 6% 7% 3% 12% 4% 11% 6% 2% 6% 12%
Education 6% 5% 5% 2% 6% 3% 6% 6% 7% 3%
Health care 18% 16% 25% 6% 24% 6% 18% 24% 19% 9%
Taxes and governmentspending 8% 9% 2% 19% 2% 14% 11% 2% 8% 15%
Abortion 5% 5% 3% 9% 3% 10% 4% 4% 1% 10%
Civil rights 8% 7% 12% 2% 12% 5% 5% 13% 8% 3%
Civil liberties 3% 4% 2% 5% 3% 3% 6% 2% 6% 4%
Guns 5% 5% 4% 6% 5% 8% 3% 6% 4% 7%
Crime 5% 5% 3% 8% 5% 7% 3% 3% 4% 7%
Criminal justice reform 3% 2% 3% 1% 4% 1% 2% 2% 3% 2%
Totals 100% 99% 99% 99% 100% 100% 99% 100% 101% 101%
Unweighted N (1,431) (1,231) (569) (519) (489) (356) (427) (418) (402) (479)
147

The Economist /YouGov PollJuly 17 - 20, 2021 - 1500 U.S. Adult Citizens
54A. Favorability of Individuals — Joe BidenDo you have a favorable or an unfavorable opinion of the following people?
Gender White Men White Women Race
Total Male Female No degree College Grad No degree College Grad Black Hispanic
Very favorable 29% 26% 31% 19% 32% 22% 38% 47% 32%
Somewhat favorable 21% 20% 22% 15% 17% 18% 19% 33% 27%
Somewhat unfavorable 8% 9% 7% 12% 11% 12% 5% 1% 7%
Very unfavorable 35% 39% 32% 49% 38% 40% 35% 8% 27%
Don’t know 6% 5% 7% 5% 2% 8% 3% 10% 8%
Totals 99% 99% 99% 100% 100% 100% 100% 99% 101%
Unweighted N (1,489) (725) (764) (329) (191) (345) (201) (167) (160)
Age Income Region
Total 18-29 30-44 45-64 65+ Under $50K $50-100K $100K or more Northeast Midwest South West
Very favorable 29% 21% 26% 32% 35% 27% 29% 36% 34% 25% 26% 33%
Somewhat favorable 21% 36% 28% 16% 9% 25% 20% 17% 22% 20% 20% 24%
Somewhat unfavorable 8% 14% 9% 7% 5% 8% 9% 8% 6% 11% 8% 8%
Very unfavorable 35% 21% 27% 42% 47% 31% 40% 36% 32% 40% 37% 30%
Don’t know 6% 9% 10% 4% 4% 8% 2% 3% 5% 4% 8% 6%
Totals 99% 101% 100% 101% 100% 99% 100% 100% 99% 100% 99% 101%
Unweighted N (1,489) (192) (351) (593) (353) (599) (417) (287) (249) (308) (537) (395)
148

The Economist /YouGov PollJuly 17 - 20, 2021 - 1500 U.S. Adult Citizens
Registered 2020 Vote Party ID Ideology
Total Voters Biden Trump Dem Rep Ind Lib Mod Con
Very favorable 29% 33% 64% 3% 63% 5% 18% 57% 31% 7%
Somewhat favorable 21% 19% 29% 4% 27% 6% 25% 28% 30% 7%
Somewhat unfavorable 8% 7% 3% 9% 4% 9% 11% 5% 12% 7%
Very unfavorable 35% 38% 3% 82% 4% 78% 38% 6% 22% 76%
Don’t know 6% 3% 1% 2% 2% 2% 8% 4% 5% 3%
Totals 99% 100% 100% 100% 100% 100% 100% 100% 100% 100%
Unweighted N (1,489) (1,265) (580) (528) (513) (370) (442) (433) (429) (489)
149

The Economist /YouGov PollJuly 17 - 20, 2021 - 1500 U.S. Adult Citizens
54B. Favorability of Individuals — Kamala HarrisDo you have a favorable or an unfavorable opinion of the following people?
Gender White Men White Women Race
Total Male Female No degree College Grad No degree College Grad Black Hispanic
Very favorable 22% 18% 25% 12% 19% 16% 29% 47% 19%
Somewhat favorable 21% 22% 20% 17% 24% 16% 24% 24% 26%
Somewhat unfavorable 8% 10% 7% 9% 9% 10% 7% 7% 7%
Very unfavorable 38% 41% 34% 52% 43% 44% 33% 11% 27%
Don’t know 12% 9% 14% 10% 5% 14% 6% 12% 20%
Totals 101% 100% 100% 100% 100% 100% 99% 101% 99%
Unweighted N (1,487) (721) (766) (328) (188) (346) (201) (167) (160)
Age Income Region
Total 18-29 30-44 45-64 65+ Under $50K $50-100K $100K or more Northeast Midwest South West
Very favorable 22% 13% 21% 25% 26% 22% 22% 22% 24% 18% 20% 26%
Somewhat favorable 21% 32% 22% 17% 16% 21% 21% 22% 24% 18% 19% 25%
Somewhat unfavorable 8% 16% 8% 6% 4% 7% 9% 10% 8% 9% 8% 7%
Very unfavorable 38% 20% 29% 46% 51% 34% 41% 39% 31% 44% 41% 32%
Don’t know 12% 19% 21% 6% 3% 15% 7% 7% 13% 11% 13% 10%
Totals 101% 100% 101% 100% 100% 99% 100% 100% 100% 100% 101% 100%
Unweighted N (1,487) (192) (349) (594) (352) (601) (415) (284) (250) (307) (536) (394)
150

The Economist /YouGov PollJuly 17 - 20, 2021 - 1500 U.S. Adult Citizens
Registered 2020 Vote Party ID Ideology
Total Voters Biden Trump Dem Rep Ind Lib Mod Con
Very favorable 22% 25% 49% 1% 49% 2% 13% 46% 22% 5%
Somewhat favorable 21% 20% 34% 4% 34% 5% 20% 33% 28% 7%
Somewhat unfavorable 8% 8% 8% 4% 6% 6% 11% 8% 11% 6%
Very unfavorable 38% 41% 5% 87% 5% 82% 42% 7% 28% 78%
Don’t know 12% 7% 4% 3% 5% 4% 14% 6% 12% 5%
Totals 101% 101% 100% 99% 99% 99% 100% 100% 101% 101%
Unweighted N (1,487) (1,261) (576) (528) (510) (369) (442) (430) (429) (489)
151

The Economist /YouGov PollJuly 17 - 20, 2021 - 1500 U.S. Adult Citizens
54C. Favorability of Individuals — Nancy PelosiDo you have a favorable or an unfavorable opinion of the following people?
Gender White Men White Women Race
Total Male Female No degree College Grad No degree College Grad Black Hispanic
Very favorable 17% 15% 19% 9% 17% 12% 25% 37% 15%
Somewhat favorable 18% 17% 18% 13% 21% 14% 21% 17% 21%
Somewhat unfavorable 10% 12% 8% 8% 12% 8% 11% 11% 11%
Very unfavorable 41% 45% 38% 60% 45% 49% 37% 12% 28%
Don’t know 14% 11% 17% 10% 4% 18% 6% 22% 24%
Totals 100% 100% 100% 100% 99% 101% 100% 99% 99%
Unweighted N (1,486) (724) (762) (330) (187) (343) (200) (168) (161)
Age Income Region
Total 18-29 30-44 45-64 65+ Under $50K $50-100K $100K or more Northeast Midwest South West
Very favorable 17% 8% 12% 20% 25% 17% 14% 21% 19% 13% 16% 21%
Somewhat favorable 18% 16% 23% 18% 14% 16% 21% 19% 21% 17% 15% 20%
Somewhat unfavorable 10% 19% 12% 7% 4% 11% 9% 11% 10% 11% 9% 11%
Very unfavorable 41% 26% 33% 48% 54% 39% 43% 42% 34% 48% 45% 35%
Don’t know 14% 31% 20% 7% 3% 17% 11% 7% 16% 12% 15% 14%
Totals 100% 100% 100% 100% 100% 100% 98% 100% 100% 101% 100% 101%
Unweighted N (1,486) (192) (348) (592) (354) (597) (415) (286) (250) (307) (537) (392)
152

The Economist /YouGov PollJuly 17 - 20, 2021 - 1500 U.S. Adult Citizens
Registered 2020 Vote Party ID Ideology
Total Voters Biden Trump Dem Rep Ind Lib Mod Con
Very favorable 17% 19% 40% 2% 39% 2% 10% 37% 17% 4%
Somewhat favorable 18% 18% 35% 2% 32% 2% 16% 32% 22% 5%
Somewhat unfavorable 10% 8% 11% 3% 11% 5% 12% 12% 13% 5%
Very unfavorable 41% 44% 6% 90% 7% 84% 49% 10% 33% 81%
Don’t know 14% 10% 7% 3% 11% 6% 13% 9% 15% 6%
Totals 100% 99% 99% 100% 100% 99% 100% 100% 100% 101%
Unweighted N (1,486) (1,265) (578) (530) (511) (371) (440) (429) (430) (490)
153

The Economist /YouGov PollJuly 17 - 20, 2021 - 1500 U.S. Adult Citizens
54D. Favorability of Individuals — Kevin McCarthyDo you have a favorable or an unfavorable opinion of the following people?
Gender White Men White Women Race
Total Male Female No degree College Grad No degree College Grad Black Hispanic
Very favorable 7% 10% 4% 9% 12% 4% 8% 5% 6%
Somewhat favorable 15% 20% 11% 20% 25% 14% 11% 11% 15%
Somewhat unfavorable 12% 16% 9% 17% 16% 10% 9% 12% 10%
Very unfavorable 30% 29% 32% 28% 33% 24% 43% 34% 23%
Don’t know 35% 25% 45% 26% 14% 49% 28% 38% 47%
Totals 99% 100% 101% 100% 100% 101% 99% 100% 101%
Unweighted N (1,482) (724) (758) (329) (189) (342) (200) (166) (159)
Age Income Region
Total 18-29 30-44 45-64 65+ Under $50K $50-100K $100K or more Northeast Midwest South West
Very favorable 7% 5% 6% 6% 9% 6% 7% 10% 6% 6% 8% 6%
Somewhat favorable 15% 11% 15% 13% 22% 13% 16% 21% 15% 13% 16% 16%
Somewhat unfavorable 12% 12% 10% 13% 13% 11% 13% 16% 12% 12% 14% 10%
Very unfavorable 30% 16% 24% 36% 41% 25% 38% 34% 32% 34% 27% 31%
Don’t know 35% 55% 45% 31% 14% 46% 26% 20% 35% 35% 35% 36%
Totals 99% 99% 100% 99% 99% 101% 100% 101% 100% 100% 100% 99%
Unweighted N (1,482) (192) (350) (588) (352) (595) (414) (286) (250) (306) (536) (390)
154

The Economist /YouGov PollJuly 17 - 20, 2021 - 1500 U.S. Adult Citizens
Registered 2020 Vote Party ID Ideology
Total Voters Biden Trump Dem Rep Ind Lib Mod Con
Very favorable 7% 8% 3% 15% 4% 16% 5% 4% 4% 15%
Somewhat favorable 15% 16% 6% 30% 9% 27% 17% 7% 15% 27%
Somewhat unfavorable 12% 12% 8% 16% 11% 11% 16% 8% 15% 15%
Very unfavorable 30% 35% 57% 16% 45% 17% 29% 53% 30% 17%
Don’t know 35% 29% 26% 23% 31% 29% 34% 29% 38% 27%
Totals 99% 100% 100% 100% 100% 100% 101% 101% 102% 101%
Unweighted N (1,482) (1,258) (573) (528) (507) (369) (442) (429) (428) (488)
155

The Economist /YouGov PollJuly 17 - 20, 2021 - 1500 U.S. Adult Citizens
54E. Favorability of Individuals — Mitch McConnellDo you have a favorable or an unfavorable opinion of the following people?
Gender White Men White Women Race
Total Male Female No degree College Grad No degree College Grad Black Hispanic
Very favorable 4% 6% 2% 5% 6% 1% 4% 8% 4%
Somewhat favorable 18% 20% 16% 20% 23% 17% 15% 19% 15%
Somewhat unfavorable 17% 22% 12% 25% 24% 17% 13% 6% 15%
Very unfavorable 40% 38% 43% 35% 41% 37% 54% 45% 33%
Don’t know 21% 14% 27% 14% 5% 28% 14% 22% 33%
Totals 100% 100% 100% 99% 99% 100% 100% 100% 100%
Unweighted N (1,489) (724) (765) (330) (189) (345) (201) (167) (160)
Age Income Region
Total 18-29 30-44 45-64 65+ Under $50K $50-100K $100K or more Northeast Midwest South West
Very favorable 4% 4% 5% 3% 5% 4% 4% 6% 4% 1% 5% 6%
Somewhat favorable 18% 19% 15% 16% 21% 17% 19% 22% 14% 16% 21% 17%
Somewhat unfavorable 17% 16% 14% 19% 18% 15% 20% 20% 14% 19% 19% 15%
Very unfavorable 40% 22% 35% 49% 49% 36% 46% 42% 45% 43% 36% 41%
Don’t know 21% 39% 30% 13% 6% 28% 12% 11% 23% 21% 19% 21%
Totals 100% 100% 99% 100% 99% 100% 101% 101% 100% 100% 100% 100%
Unweighted N (1,489) (192) (350) (593) (354) (601) (414) (287) (251) (308) (537) (393)
156

The Economist /YouGov PollJuly 17 - 20, 2021 - 1500 U.S. Adult Citizens
Registered 2020 Vote Party ID Ideology
Total Voters Biden Trump Dem Rep Ind Lib Mod Con
Very favorable 4% 5% 2% 7% 3% 8% 3% 3% 3% 7%
Somewhat favorable 18% 19% 8% 34% 11% 35% 16% 10% 16% 30%
Somewhat unfavorable 17% 17% 6% 30% 10% 22% 22% 7% 19% 26%
Very unfavorable 40% 44% 74% 19% 62% 18% 39% 68% 41% 22%
Don’t know 21% 15% 9% 10% 14% 16% 19% 12% 21% 14%
Totals 100% 100% 99% 100% 100% 99% 99% 100% 100% 99%
Unweighted N (1,489) (1,263) (577) (529) (510) (370) (443) (431) (429) (490)
157

The Economist /YouGov PollJuly 17 - 20, 2021 - 1500 U.S. Adult Citizens
54F. Favorability of Individuals — Chuck SchumerDo you have a favorable or an unfavorable opinion of the following people?
Gender White Men White Women Race
Total Male Female No degree College Grad No degree College Grad Black Hispanic
Very favorable 13% 13% 13% 8% 14% 7% 18% 24% 15%
Somewhat favorable 18% 19% 17% 14% 26% 13% 25% 22% 16%
Somewhat unfavorable 10% 13% 8% 10% 13% 9% 12% 11% 10%
Very unfavorable 32% 37% 27% 48% 41% 32% 29% 11% 23%
Don’t know 26% 18% 34% 19% 6% 39% 16% 32% 35%
Totals 99% 100% 99% 99% 100% 100% 100% 100% 99%
Unweighted N (1,485) (722) (763) (329) (188) (344) (201) (167) (159)
Age Income Region
Total 18-29 30-44 45-64 65+ Under $50K $50-100K $100K or more Northeast Midwest South West
Very favorable 13% 3% 11% 16% 20% 12% 13% 16% 17% 10% 11% 16%
Somewhat favorable 18% 17% 22% 16% 18% 16% 20% 23% 19% 17% 16% 21%
Somewhat unfavorable 10% 16% 10% 9% 6% 10% 9% 14% 10% 11% 10% 9%
Very unfavorable 32% 12% 21% 41% 48% 27% 38% 33% 28% 34% 36% 27%
Don’t know 26% 52% 36% 17% 9% 34% 19% 13% 25% 27% 27% 27%
Totals 99% 100% 100% 99% 101% 99% 99% 99% 99% 99% 100% 100%
Unweighted N (1,485) (189) (349) (594) (353) (599) (413) (286) (251) (305) (537) (392)
158

The Economist /YouGov PollJuly 17 - 20, 2021 - 1500 U.S. Adult Citizens
Registered 2020 Vote Party ID Ideology
Total Voters Biden Trump Dem Rep Ind Lib Mod Con
Very favorable 13% 15% 31% 1% 30% 3% 7% 27% 15% 4%
Somewhat favorable 18% 20% 36% 5% 32% 6% 15% 35% 20% 5%
Somewhat unfavorable 10% 10% 11% 5% 11% 6% 13% 10% 15% 7%
Very unfavorable 32% 37% 5% 78% 6% 66% 38% 8% 21% 69%
Don’t know 26% 19% 17% 11% 21% 19% 26% 20% 29% 15%
Totals 99% 101% 100% 100% 100% 100% 99% 100% 100% 100%
Unweighted N (1,485) (1,260) (574) (530) (507) (371) (443) (427) (430) (491)
159

The Economist /YouGov PollJuly 17 - 20, 2021 - 1500 U.S. Adult Citizens
54G. Favorability of Individuals — Donald TrumpDo you have a favorable or an unfavorable opinion of the following people?
Gender White Men White Women Race
Total Male Female No degree College Grad No degree College Grad Black Hispanic
Very favorable 24% 26% 22% 35% 23% 31% 22% 9% 20%
Somewhat favorable 15% 17% 13% 16% 24% 15% 15% 7% 13%
Somewhat unfavorable 9% 11% 6% 9% 11% 6% 5% 10% 12%
Very unfavorable 46% 40% 52% 35% 38% 41% 55% 69% 44%
Don’t know 6% 6% 6% 5% 4% 7% 3% 6% 12%
Totals 100% 100% 99% 100% 100% 100% 100% 101% 101%
Unweighted N (1,480) (718) (762) (330) (184) (343) (201) (165) (160)
Age Income Region
Total 18-29 30-44 45-64 65+ Under $50K $50-100K $100K or more Northeast Midwest South West
Very favorable 24% 13% 18% 30% 32% 24% 24% 25% 20% 24% 28% 22%
Somewhat favorable 15% 13% 17% 14% 15% 14% 15% 19% 13% 18% 13% 15%
Somewhat unfavorable 9% 18% 7% 7% 5% 8% 10% 10% 8% 8% 10% 7%
Very unfavorable 46% 48% 45% 47% 44% 46% 48% 42% 54% 45% 41% 49%
Don’t know 6% 8% 13% 3% 3% 8% 3% 5% 6% 4% 7% 7%
Totals 100% 100% 100% 101% 99% 100% 100% 101% 101% 99% 99% 100%
Unweighted N (1,480) (192) (345) (591) (352) (599) (409) (285) (251) (305) (535) (389)
160

The Economist /YouGov PollJuly 17 - 20, 2021 - 1500 U.S. Adult Citizens
Registered 2020 Vote Party ID Ideology
Total Voters Biden Trump Dem Rep Ind Lib Mod Con
Very favorable 24% 27% 3% 58% 4% 58% 23% 6% 13% 54%
Somewhat favorable 15% 14% 2% 29% 5% 25% 18% 3% 17% 24%
Somewhat unfavorable 9% 7% 4% 8% 8% 10% 10% 5% 13% 9%
Very unfavorable 46% 48% 90% 3% 80% 5% 44% 83% 53% 10%
Don’t know 6% 4% 1% 2% 3% 2% 6% 3% 5% 3%
Totals 100% 100% 100% 100% 100% 100% 101% 100% 101% 100%
Unweighted N (1,480) (1,256) (570) (529) (503) (370) (442) (424) (428) (490)
161

The Economist /YouGov PollJuly 17 - 20, 2021 - 1500 U.S. Adult Citizens
55A. Favorability of Political Parties — The Democratic PartyDo you have a favorable or unfavorable opinion of the political parties?
Gender White Men White Women Race
Total Male Female No degree College Grad No degree College Grad Black Hispanic
Very favorable 19% 18% 20% 13% 18% 12% 21% 39% 23%
Somewhat favorable 24% 23% 25% 15% 27% 22% 30% 32% 23%
Somewhat unfavorable 13% 14% 11% 16% 13% 12% 11% 12% 14%
Very unfavorable 34% 38% 30% 49% 40% 38% 34% 8% 21%
Don’t know 11% 7% 14% 6% 2% 17% 4% 10% 20%
Totals 101% 100% 100% 99% 100% 101% 100% 101% 101%
Unweighted N (1,458) (710) (748) (325) (185) (338) (196) (163) (157)
Age Income Region
Total 18-29 30-44 45-64 65+ Under $50K $50-100K $100K or more Northeast Midwest South West
Very favorable 19% 18% 18% 19% 21% 20% 17% 22% 20% 15% 20% 21%
Somewhat favorable 24% 27% 29% 22% 18% 24% 24% 26% 25% 21% 21% 30%
Somewhat unfavorable 13% 22% 14% 9% 9% 12% 13% 13% 14% 14% 13% 11%
Very unfavorable 34% 16% 22% 43% 47% 29% 39% 36% 32% 38% 35% 28%
Don’t know 11% 18% 18% 6% 4% 15% 6% 3% 9% 13% 10% 10%
Totals 101% 101% 101% 99% 99% 100% 99% 100% 100% 101% 99% 100%
Unweighted N (1,458) (189) (345) (575) (349) (581) (411) (281) (242) (299) (528) (389)
162

The Economist /YouGov PollJuly 17 - 20, 2021 - 1500 U.S. Adult Citizens
Registered 2020 Vote Party ID Ideology
Total Voters Biden Trump Dem Rep Ind Lib Mod Con
Very favorable 19% 21% 41% 2% 47% 2% 8% 40% 17% 6%
Somewhat favorable 24% 24% 43% 5% 41% 7% 22% 41% 32% 6%
Somewhat unfavorable 13% 11% 11% 7% 5% 13% 20% 10% 19% 10%
Very unfavorable 34% 38% 4% 83% 3% 75% 40% 6% 23% 73%
Don’t know 11% 6% 2% 3% 4% 3% 11% 4% 10% 5%
Totals 101% 100% 101% 100% 100% 100% 101% 101% 101% 100%
Unweighted N (1,458) (1,240) (568) (517) (504) (361) (435) (427) (420) (482)
163

The Economist /YouGov PollJuly 17 - 20, 2021 - 1500 U.S. Adult Citizens
55B. Favorability of Political Parties — The Republican PartyDo you have a favorable or unfavorable opinion of the political parties?
Gender White Men White Women Race
Total Male Female No degree College Grad No degree College Grad Black Hispanic
Very favorable 10% 9% 11% 11% 10% 14% 10% 6% 11%
Somewhat favorable 22% 22% 21% 28% 26% 28% 21% 14% 13%
Somewhat unfavorable 19% 24% 15% 24% 26% 14% 17% 16% 20%
Very unfavorable 37% 36% 38% 31% 37% 27% 48% 53% 36%
Don’t know 11% 8% 14% 6% 3% 17% 4% 12% 20%
Totals 99% 99% 99% 100% 102% 100% 100% 101% 100%
Unweighted N (1,451) (706) (745) (325) (181) (338) (197) (160) (156)
Age Income Region
Total 18-29 30-44 45-64 65+ Under $50K $50-100K $100K or more Northeast Midwest South West
Very favorable 10% 9% 10% 10% 12% 10% 8% 14% 8% 9% 14% 8%
Somewhat favorable 22% 17% 20% 22% 29% 24% 22% 20% 18% 24% 23% 21%
Somewhat unfavorable 19% 26% 17% 19% 16% 17% 22% 21% 17% 19% 21% 19%
Very unfavorable 37% 29% 35% 42% 39% 34% 41% 41% 48% 36% 32% 40%
Don’t know 11% 20% 18% 7% 3% 15% 7% 5% 10% 12% 11% 12%
Totals 99% 101% 100% 100% 99% 100% 100% 101% 101% 100% 101% 100%
Unweighted N (1,451) (189) (341) (573) (348) (578) (405) (283) (242) (299) (523) (387)
164

The Economist /YouGov PollJuly 17 - 20, 2021 - 1500 U.S. Adult Citizens
Registered 2020 Vote Party ID Ideology
Total Voters Biden Trump Dem Rep Ind Lib Mod Con
Very favorable 10% 11% 2% 22% 4% 31% 5% 5% 3% 23%
Somewhat favorable 22% 23% 5% 45% 7% 49% 22% 7% 22% 40%
Somewhat unfavorable 19% 18% 16% 21% 19% 14% 25% 13% 26% 20%
Very unfavorable 37% 41% 74% 9% 66% 4% 36% 71% 39% 11%
Don’t know 11% 7% 3% 3% 5% 3% 11% 4% 10% 6%
Totals 99% 100% 100% 100% 101% 101% 99% 100% 100% 100%
Unweighted N (1,451) (1,235) (563) (521) (497) (362) (436) (421) (419) (484)
165

The Economist /YouGov PollJuly 17 - 20, 2021 - 1500 U.S. Adult Citizens
56. Biden Job ApprovalDo you approve or disapprove of the way Joe Biden is handling his job as President?
Gender White Men White Women Race
Total Male Female No degree College Grad No degree College Grad Black Hispanic
Strongly approve 24% 22% 27% 16% 27% 19% 33% 41% 24%
Somewhat approve 24% 24% 23% 17% 24% 19% 23% 30% 33%
Somewhat disapprove 8% 10% 7% 12% 9% 11% 2% 8% 4%
Strongly disapprove 32% 35% 29% 46% 38% 37% 34% 8% 20%
Not sure 12% 9% 15% 9% 3% 14% 8% 14% 19%
Totals 100% 100% 101% 100% 101% 100% 100% 101% 100%
Unweighted N (1,500) (731) (769) (331) (191) (347) (202) (168) (164)
Age Income Region
Total 18-29 30-44 45-64 65+ Under $50K $50-100K $100K or more Northeast Midwest South West
Strongly approve 24% 12% 21% 29% 32% 24% 25% 28% 28% 22% 22% 28%
Somewhat approve 24% 36% 31% 18% 12% 25% 23% 24% 24% 25% 20% 28%
Somewhat disapprove 8% 10% 8% 8% 7% 10% 7% 9% 7% 9% 9% 6%
Strongly disapprove 32% 17% 22% 40% 46% 28% 38% 34% 30% 34% 35% 27%
Not sure 12% 25% 18% 5% 3% 14% 7% 5% 12% 10% 14% 11%
Totals 100% 100% 100% 100% 100% 101% 100% 100% 101% 100% 100% 100%
Unweighted N (1,500) (195) (355) (595) (355) (602) (420) (287) (253) (308) (540) (399)
166
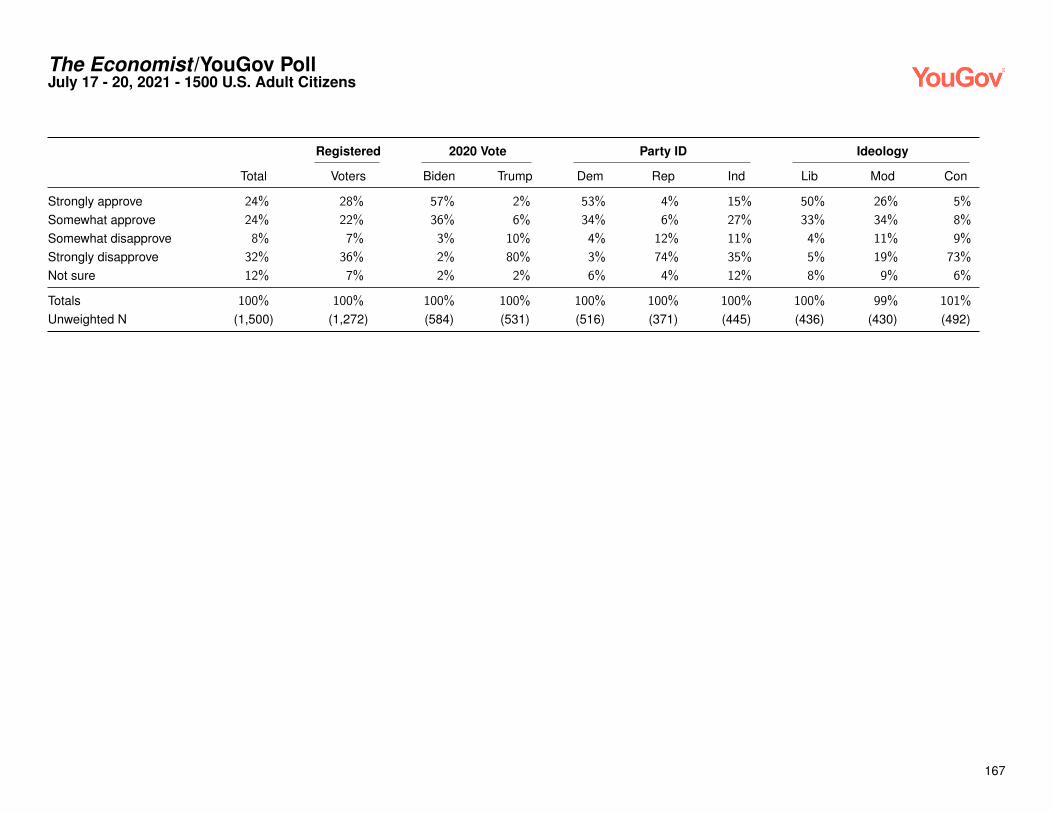
The Economist /YouGov PollJuly 17 - 20, 2021 - 1500 U.S. Adult Citizens
Registered 2020 Vote Party ID Ideology
Total Voters Biden Trump Dem Rep Ind Lib Mod Con
Strongly approve 24% 28% 57% 2% 53% 4% 15% 50% 26% 5%
Somewhat approve 24% 22% 36% 6% 34% 6% 27% 33% 34% 8%
Somewhat disapprove 8% 7% 3% 10% 4% 12% 11% 4% 11% 9%
Strongly disapprove 32% 36% 2% 80% 3% 74% 35% 5% 19% 73%
Not sure 12% 7% 2% 2% 6% 4% 12% 8% 9% 6%
Totals 100% 100% 100% 100% 100% 100% 100% 100% 99% 101%
Unweighted N (1,500) (1,272) (584) (531) (516) (371) (445) (436) (430) (492)
167

The Economist /YouGov PollJuly 17 - 20, 2021 - 1500 U.S. Adult Citizens
57A. Biden Issue Approval — Jobs and the economyDo you approve or disapprove of the way Joe Biden is handling these specific issues?
Gender White Men White Women Race
Total Male Female No degree College Grad No degree College Grad Black Hispanic
Strongly approve 23% 22% 23% 13% 29% 14% 30% 38% 26%
Somewhat approve 24% 23% 25% 21% 23% 21% 23% 28% 29%
Somewhat disapprove 10% 11% 10% 11% 12% 12% 11% 8% 4%
Strongly disapprove 29% 34% 25% 45% 33% 32% 26% 6% 24%
No opinion 14% 11% 16% 11% 3% 20% 9% 20% 16%
Totals 100% 101% 99% 101% 100% 99% 99% 100% 99%
Unweighted N (1,491) (728) (763) (328) (191) (344) (200) (168) (163)
Age Income Region
Total 18-29 30-44 45-64 65+ Under $50K $50-100K $100K or more Northeast Midwest South West
Strongly approve 23% 18% 21% 24% 26% 22% 21% 33% 27% 17% 20% 29%
Somewhat approve 24% 26% 31% 23% 17% 25% 24% 21% 27% 25% 22% 24%
Somewhat disapprove 10% 13% 11% 9% 10% 11% 11% 10% 11% 11% 11% 9%
Strongly disapprove 29% 13% 20% 37% 42% 24% 35% 31% 26% 31% 33% 24%
No opinion 14% 29% 17% 8% 5% 18% 9% 5% 9% 16% 15% 14%
Totals 100% 99% 100% 101% 100% 100% 100% 100% 100% 100% 101% 100%
Unweighted N (1,491) (192) (351) (593) (355) (598) (420) (285) (249) (306) (539) (397)
168

The Economist /YouGov PollJuly 17 - 20, 2021 - 1500 U.S. Adult Citizens
Registered 2020 Vote Party ID Ideology
Total Voters Biden Trump Dem Rep Ind Lib Mod Con
Strongly approve 23% 25% 50% 3% 47% 6% 14% 45% 25% 6%
Somewhat approve 24% 23% 37% 6% 35% 6% 27% 35% 31% 9%
Somewhat disapprove 10% 10% 5% 13% 7% 14% 12% 6% 12% 13%
Strongly disapprove 29% 33% 2% 75% 3% 68% 31% 4% 17% 66%
No opinion 14% 8% 6% 3% 9% 5% 16% 10% 15% 6%
Totals 100% 99% 100% 100% 101% 99% 100% 100% 100% 100%
Unweighted N (1,491) (1,267) (583) (529) (514) (369) (442) (434) (427) (491)
169

The Economist /YouGov PollJuly 17 - 20, 2021 - 1500 U.S. Adult Citizens
57B. Biden Issue Approval — ImmigrationDo you approve or disapprove of the way Joe Biden is handling these specific issues?
Gender White Men White Women Race
Total Male Female No degree College Grad No degree College Grad Black Hispanic
Strongly approve 13% 13% 14% 8% 17% 9% 13% 23% 17%
Somewhat approve 25% 26% 24% 18% 31% 19% 29% 29% 32%
Somewhat disapprove 10% 10% 10% 10% 8% 7% 13% 16% 10%
Strongly disapprove 35% 39% 31% 52% 39% 42% 32% 8% 25%
No opinion 16% 12% 20% 12% 6% 24% 12% 23% 16%
Totals 99% 100% 99% 100% 101% 101% 99% 99% 100%
Unweighted N (1,488) (723) (765) (328) (187) (346) (201) (166) (163)
Age Income Region
Total 18-29 30-44 45-64 65+ Under $50K $50-100K $100K or more Northeast Midwest South West
Strongly approve 13% 14% 16% 12% 12% 14% 11% 16% 14% 9% 11% 20%
Somewhat approve 25% 24% 28% 25% 22% 24% 28% 30% 27% 25% 23% 26%
Somewhat disapprove 10% 13% 11% 10% 7% 10% 11% 10% 11% 10% 12% 8%
Strongly disapprove 35% 16% 23% 43% 52% 31% 39% 35% 32% 36% 38% 31%
No opinion 16% 33% 21% 9% 7% 21% 11% 9% 15% 19% 16% 15%
Totals 99% 100% 99% 99% 100% 100% 100% 100% 99% 99% 100% 100%
Unweighted N (1,488) (194) (347) (593) (354) (599) (416) (285) (250) (306) (535) (397)
170

The Economist /YouGov PollJuly 17 - 20, 2021 - 1500 U.S. Adult Citizens
Registered 2020 Vote Party ID Ideology
Total Voters Biden Trump Dem Rep Ind Lib Mod Con
Strongly approve 13% 14% 25% 3% 27% 3% 9% 25% 15% 4%
Somewhat approve 25% 25% 46% 4% 44% 6% 24% 44% 31% 7%
Somewhat disapprove 10% 10% 13% 6% 11% 6% 13% 10% 16% 6%
Strongly disapprove 35% 39% 4% 84% 5% 77% 38% 6% 24% 74%
No opinion 16% 12% 12% 3% 14% 7% 16% 14% 15% 8%
Totals 99% 100% 100% 100% 101% 99% 100% 99% 101% 99%
Unweighted N (1,488) (1,263) (580) (528) (511) (370) (441) (432) (428) (489)
171

The Economist /YouGov PollJuly 17 - 20, 2021 - 1500 U.S. Adult Citizens
57C. Biden Issue Approval — Climate change and the environmentDo you approve or disapprove of the way Joe Biden is handling these specific issues?
Gender White Men White Women Race
Total Male Female No degree College Grad No degree College Grad Black Hispanic
Strongly approve 18% 17% 18% 13% 19% 15% 18% 28% 23%
Somewhat approve 26% 25% 26% 19% 32% 20% 34% 31% 25%
Somewhat disapprove 10% 10% 10% 12% 9% 10% 11% 8% 9%
Strongly disapprove 27% 33% 22% 41% 33% 29% 22% 9% 21%
No opinion 19% 14% 24% 16% 7% 28% 15% 24% 21%
Totals 100% 99% 100% 101% 100% 102% 100% 100% 99%
Unweighted N (1,486) (724) (762) (327) (188) (344) (201) (166) (163)
Age Income Region
Total 18-29 30-44 45-64 65+ Under $50K $50-100K $100K or more Northeast Midwest South West
Strongly approve 18% 15% 17% 18% 20% 18% 16% 21% 22% 14% 16% 21%
Somewhat approve 26% 29% 30% 23% 22% 24% 27% 32% 30% 24% 22% 29%
Somewhat disapprove 10% 12% 11% 8% 10% 11% 12% 9% 10% 10% 11% 9%
Strongly disapprove 27% 15% 18% 33% 39% 23% 33% 28% 24% 29% 30% 23%
No opinion 19% 29% 24% 17% 10% 25% 12% 10% 13% 23% 21% 17%
Totals 100% 100% 100% 99% 101% 101% 100% 100% 99% 100% 100% 99%
Unweighted N (1,486) (192) (346) (593) (355) (597) (417) (286) (249) (306) (537) (394)
172

The Economist /YouGov PollJuly 17 - 20, 2021 - 1500 U.S. Adult Citizens
Registered 2020 Vote Party ID Ideology
Total Voters Biden Trump Dem Rep Ind Lib Mod Con
Strongly approve 18% 20% 39% 2% 37% 3% 13% 33% 22% 4%
Somewhat approve 26% 26% 45% 7% 41% 9% 26% 44% 31% 9%
Somewhat disapprove 10% 10% 5% 13% 6% 12% 14% 6% 14% 10%
Strongly disapprove 27% 31% 2% 66% 3% 61% 29% 4% 16% 61%
No opinion 19% 14% 9% 12% 14% 15% 18% 13% 16% 16%
Totals 100% 101% 100% 100% 101% 100% 100% 100% 99% 100%
Unweighted N (1,486) (1,263) (577) (531) (509) (370) (444) (430) (428) (491)
173

The Economist /YouGov PollJuly 17 - 20, 2021 - 1500 U.S. Adult Citizens
57D. Biden Issue Approval — Civil rightsDo you approve or disapprove of the way Joe Biden is handling these specific issues?
Gender White Men White Women Race
Total Male Female No degree College Grad No degree College Grad Black Hispanic
Strongly approve 18% 17% 20% 14% 19% 14% 20% 32% 24%
Somewhat approve 25% 24% 26% 15% 30% 20% 32% 32% 29%
Somewhat disapprove 12% 14% 10% 15% 12% 12% 8% 13% 10%
Strongly disapprove 28% 32% 23% 41% 34% 30% 27% 7% 18%
No opinion 17% 13% 21% 15% 5% 24% 13% 16% 20%
Totals 100% 100% 100% 100% 100% 100% 100% 100% 101%
Unweighted N (1,487) (725) (762) (328) (188) (342) (201) (168) (163)
Age Income Region
Total 18-29 30-44 45-64 65+ Under $50K $50-100K $100K or more Northeast Midwest South West
Strongly approve 18% 16% 19% 19% 19% 19% 18% 19% 22% 13% 18% 22%
Somewhat approve 25% 25% 27% 26% 22% 24% 26% 30% 32% 24% 22% 26%
Somewhat disapprove 12% 16% 11% 10% 13% 12% 12% 10% 8% 13% 14% 11%
Strongly disapprove 28% 13% 19% 34% 40% 23% 34% 31% 25% 30% 30% 24%
No opinion 17% 30% 25% 12% 6% 22% 11% 10% 14% 20% 17% 17%
Totals 100% 100% 101% 101% 100% 100% 101% 100% 101% 100% 101% 100%
Unweighted N (1,487) (193) (347) (592) (355) (598) (417) (286) (250) (306) (536) (395)
174

The Economist /YouGov PollJuly 17 - 20, 2021 - 1500 U.S. Adult Citizens
Registered 2020 Vote Party ID Ideology
Total Voters Biden Trump Dem Rep Ind Lib Mod Con
Strongly approve 18% 20% 37% 2% 38% 5% 12% 35% 20% 5%
Somewhat approve 25% 26% 45% 8% 41% 8% 24% 40% 32% 10%
Somewhat disapprove 12% 12% 7% 14% 6% 13% 17% 8% 16% 12%
Strongly disapprove 28% 31% 3% 69% 4% 65% 28% 4% 16% 63%
No opinion 17% 11% 9% 6% 12% 8% 18% 13% 16% 10%
Totals 100% 100% 101% 99% 101% 99% 99% 100% 100% 100%
Unweighted N (1,487) (1,263) (579) (529) (509) (370) (443) (431) (428) (490)
175

The Economist /YouGov PollJuly 17 - 20, 2021 - 1500 U.S. Adult Citizens
57E. Biden Issue Approval — Civil libertiesDo you approve or disapprove of the way Joe Biden is handling these specific issues?
Gender White Men White Women Race
Total Male Female No degree College Grad No degree College Grad Black Hispanic
Strongly approve 17% 16% 19% 11% 18% 13% 17% 31% 25%
Somewhat approve 25% 25% 26% 17% 30% 19% 32% 32% 29%
Somewhat disapprove 10% 12% 8% 14% 11% 9% 10% 7% 10%
Strongly disapprove 29% 33% 25% 43% 33% 32% 28% 8% 17%
No opinion 18% 15% 22% 14% 7% 26% 14% 22% 19%
Totals 99% 101% 100% 99% 99% 99% 101% 100% 100%
Unweighted N (1,484) (720) (764) (326) (185) (345) (200) (168) (163)
Age Income Region
Total 18-29 30-44 45-64 65+ Under $50K $50-100K $100K or more Northeast Midwest South West
Strongly approve 17% 16% 18% 17% 18% 18% 17% 19% 20% 12% 17% 21%
Somewhat approve 25% 28% 28% 25% 22% 25% 27% 27% 30% 25% 22% 27%
Somewhat disapprove 10% 10% 10% 10% 12% 10% 10% 11% 9% 11% 10% 11%
Strongly disapprove 29% 14% 20% 35% 41% 25% 34% 31% 25% 31% 32% 24%
No opinion 18% 33% 25% 13% 7% 23% 12% 11% 16% 22% 18% 17%
Totals 99% 101% 101% 100% 100% 101% 100% 99% 100% 101% 99% 100%
Unweighted N (1,484) (193) (346) (593) (352) (598) (413) (286) (249) (306) (537) (392)
176

The Economist /YouGov PollJuly 17 - 20, 2021 - 1500 U.S. Adult Citizens
Registered 2020 Vote Party ID Ideology
Total Voters Biden Trump Dem Rep Ind Lib Mod Con
Strongly approve 17% 19% 35% 3% 36% 4% 12% 33% 18% 6%
Somewhat approve 25% 26% 43% 7% 42% 8% 25% 40% 34% 9%
Somewhat disapprove 10% 10% 7% 13% 6% 13% 14% 7% 14% 10%
Strongly disapprove 29% 32% 2% 71% 3% 65% 30% 5% 17% 64%
No opinion 18% 13% 12% 7% 13% 10% 19% 15% 18% 10%
Totals 99% 100% 99% 101% 100% 100% 100% 100% 101% 99%
Unweighted N (1,484) (1,260) (576) (529) (508) (368) (443) (429) (428) (489)
177

The Economist /YouGov PollJuly 17 - 20, 2021 - 1500 U.S. Adult Citizens
57F. Biden Issue Approval — CrimeDo you approve or disapprove of the way Joe Biden is handling these specific issues?
Gender White Men White Women Race
Total Male Female No degree College Grad No degree College Grad Black Hispanic
Strongly approve 15% 14% 16% 6% 18% 11% 16% 31% 21%
Somewhat approve 23% 24% 22% 18% 29% 15% 27% 29% 27%
Somewhat disapprove 10% 11% 8% 12% 8% 10% 7% 10% 10%
Strongly disapprove 33% 38% 28% 49% 38% 36% 31% 8% 23%
No opinion 20% 14% 25% 14% 7% 29% 20% 22% 19%
Totals 101% 101% 99% 99% 100% 101% 101% 100% 100%
Unweighted N (1,488) (725) (763) (327) (189) (345) (200) (168) (162)
Age Income Region
Total 18-29 30-44 45-64 65+ Under $50K $50-100K $100K or more Northeast Midwest South West
Strongly approve 15% 16% 16% 14% 14% 16% 12% 18% 16% 12% 14% 19%
Somewhat approve 23% 24% 24% 22% 22% 21% 28% 25% 25% 17% 24% 25%
Somewhat disapprove 10% 9% 11% 10% 8% 11% 9% 11% 11% 8% 11% 8%
Strongly disapprove 33% 15% 23% 40% 48% 28% 38% 33% 29% 37% 35% 27%
No opinion 20% 36% 26% 14% 8% 24% 13% 13% 19% 25% 17% 21%
Totals 101% 100% 100% 100% 100% 100% 100% 100% 100% 99% 101% 100%
Unweighted N (1,488) (194) (349) (593) (352) (597) (418) (285) (247) (306) (539) (396)
178

The Economist /YouGov PollJuly 17 - 20, 2021 - 1500 U.S. Adult Citizens
Registered 2020 Vote Party ID Ideology
Total Voters Biden Trump Dem Rep Ind Lib Mod Con
Strongly approve 15% 16% 29% 3% 29% 4% 10% 26% 17% 5%
Somewhat approve 23% 23% 42% 4% 40% 7% 22% 38% 29% 9%
Somewhat disapprove 10% 9% 9% 9% 8% 8% 12% 9% 13% 8%
Strongly disapprove 33% 37% 4% 79% 4% 72% 36% 6% 22% 70%
No opinion 20% 15% 16% 5% 18% 8% 20% 21% 19% 8%
Totals 101% 100% 100% 100% 99% 99% 100% 100% 100% 100%
Unweighted N (1,488) (1,263) (581) (528) (513) (368) (442) (433) (428) (489)
179

The Economist /YouGov PollJuly 17 - 20, 2021 - 1500 U.S. Adult Citizens
57G. Biden Issue Approval — Criminal justice reformDo you approve or disapprove of the way Joe Biden is handling these specific issues?
Gender White Men White Women Race
Total Male Female No degree College Grad No degree College Grad Black Hispanic
Strongly approve 14% 14% 13% 8% 16% 10% 11% 26% 19%
Somewhat approve 22% 22% 23% 15% 28% 14% 29% 33% 26%
Somewhat disapprove 12% 13% 11% 13% 14% 12% 9% 10% 11%
Strongly disapprove 31% 35% 27% 47% 33% 34% 32% 8% 21%
No opinion 21% 16% 26% 16% 9% 30% 19% 23% 23%
Totals 100% 100% 100% 99% 100% 100% 100% 100% 100%
Unweighted N (1,483) (722) (761) (326) (187) (345) (200) (166) (163)
Age Income Region
Total 18-29 30-44 45-64 65+ Under $50K $50-100K $100K or more Northeast Midwest South West
Strongly approve 14% 12% 17% 13% 14% 15% 13% 15% 15% 10% 14% 16%
Somewhat approve 22% 21% 23% 24% 21% 21% 24% 28% 24% 18% 22% 26%
Somewhat disapprove 12% 15% 12% 9% 13% 12% 12% 13% 11% 13% 13% 9%
Strongly disapprove 31% 14% 22% 38% 44% 27% 36% 31% 28% 34% 34% 26%
No opinion 21% 38% 26% 16% 9% 25% 14% 12% 22% 25% 18% 23%
Totals 100% 100% 100% 100% 101% 100% 99% 99% 100% 100% 101% 100%
Unweighted N (1,483) (193) (350) (588) (352) (595) (418) (284) (247) (306) (534) (396)
180

The Economist /YouGov PollJuly 17 - 20, 2021 - 1500 U.S. Adult Citizens
Registered 2020 Vote Party ID Ideology
Total Voters Biden Trump Dem Rep Ind Lib Mod Con
Strongly approve 14% 14% 27% 2% 28% 3% 9% 25% 15% 5%
Somewhat approve 22% 23% 42% 6% 38% 7% 21% 37% 29% 8%
Somewhat disapprove 12% 12% 12% 12% 10% 11% 15% 12% 15% 11%
Strongly disapprove 31% 34% 3% 74% 5% 69% 33% 7% 19% 67%
No opinion 21% 16% 17% 7% 19% 9% 22% 20% 23% 9%
Totals 100% 99% 101% 101% 100% 99% 100% 101% 101% 100%
Unweighted N (1,483) (1,259) (577) (528) (510) (368) (440) (431) (425) (489)
181

The Economist /YouGov PollJuly 17 - 20, 2021 - 1500 U.S. Adult Citizens
58. Biden Perceived IdeologyWould you say Joe Biden is...
Gender White Men White Women Race
Total Male Female No degree College Grad No degree College Grad Black Hispanic
Very liberal 29% 35% 24% 42% 37% 30% 28% 10% 22%
Liberal 24% 25% 24% 21% 27% 21% 28% 31% 21%
Moderate 24% 23% 24% 16% 29% 17% 29% 30% 27%
Conservative 4% 5% 4% 5% 4% 3% 5% 6% 4%
Very conservative 2% 2% 3% 2% 1% 2% 0% 5% 3%
Not sure 16% 11% 21% 14% 2% 26% 9% 18% 24%
Totals 99% 101% 100% 100% 100% 99% 99% 100% 101%
Unweighted N (1,494) (728) (766) (329) (191) (346) (202) (168) (161)
Age Income Region
Total 18-29 30-44 45-64 65+ Under $50K $50-100K $100K or more Northeast Midwest South West
Very liberal 29% 17% 22% 30% 44% 24% 34% 34% 29% 28% 31% 26%
Liberal 24% 34% 17% 24% 23% 20% 27% 29% 28% 24% 22% 26%
Moderate 24% 23% 25% 25% 21% 24% 24% 27% 23% 23% 22% 28%
Conservative 4% 5% 9% 3% 2% 5% 6% 4% 3% 5% 5% 4%
Very conservative 2% 4% 2% 2% 1% 3% 2% 1% 2% 2% 2% 3%
Not sure 16% 16% 24% 17% 8% 24% 7% 5% 14% 17% 18% 14%
Totals 99% 99% 99% 101% 99% 100% 100% 100% 99% 99% 100% 101%
Unweighted N (1,494) (193) (352) (594) (355) (599) (420) (287) (253) (307) (538) (396)
182

The Economist /YouGov PollJuly 17 - 20, 2021 - 1500 U.S. Adult Citizens
Registered 2020 Vote Party ID Ideology
Total Voters Biden Trump Dem Rep Ind Lib Mod Con
Very liberal 29% 33% 8% 67% 11% 63% 27% 14% 15% 64%
Liberal 24% 25% 31% 18% 35% 17% 23% 42% 24% 16%
Moderate 24% 26% 46% 4% 40% 4% 27% 34% 40% 7%
Conservative 4% 5% 5% 2% 4% 3% 5% 5% 6% 3%
Very conservative 2% 2% 2% 1% 1% 3% 2% 1% 2% 2%
Not sure 16% 11% 7% 8% 9% 10% 16% 5% 13% 8%
Totals 99% 102% 99% 100% 100% 100% 100% 101% 100% 100%
Unweighted N (1,494) (1,269) (583) (530) (513) (371) (445) (436) (428) (491)
183

The Economist /YouGov PollJuly 17 - 20, 2021 - 1500 U.S. Adult Citizens
59. Biden Cares about People Like YouHow much do you think Joe Biden cares about the needs and problems of people like you?
Gender White Men White Women Race
Total Male Female No degree College Grad No degree College Grad Black Hispanic
A lot 26% 23% 28% 15% 25% 17% 35% 46% 28%
Some 23% 25% 22% 19% 27% 20% 20% 32% 27%
Not much 11% 11% 11% 13% 9% 15% 9% 3% 11%
Doesn’t care at all 31% 35% 28% 45% 37% 36% 29% 8% 19%
Not sure 9% 6% 12% 7% 2% 12% 7% 10% 15%
Totals 100% 100% 101% 99% 100% 100% 100% 99% 100%
Unweighted N (1,492) (727) (765) (329) (191) (346) (202) (166) (161)
Age Income Region
Total 18-29 30-44 45-64 65+ Under $50K $50-100K $100K or more Northeast Midwest South West
A lot 26% 17% 20% 31% 31% 25% 24% 31% 28% 22% 23% 31%
Some 23% 38% 33% 16% 12% 24% 26% 22% 24% 22% 22% 27%
Not much 11% 16% 12% 7% 10% 11% 10% 11% 10% 14% 8% 12%
Doesn’t care at all 31% 15% 21% 40% 44% 28% 35% 32% 27% 36% 35% 24%
Not sure 9% 14% 14% 6% 3% 12% 5% 4% 10% 7% 12% 5%
Totals 100% 100% 100% 100% 100% 100% 100% 100% 99% 101% 100% 99%
Unweighted N (1,492) (191) (353) (594) (354) (597) (420) (286) (252) (306) (538) (396)
184

The Economist /YouGov PollJuly 17 - 20, 2021 - 1500 U.S. Adult Citizens
Registered 2020 Vote Party ID Ideology
Total Voters Biden Trump Dem Rep Ind Lib Mod Con
A lot 26% 29% 56% 2% 57% 5% 15% 51% 28% 6%
Some 23% 22% 33% 6% 32% 7% 28% 33% 32% 9%
Not much 11% 10% 6% 14% 3% 16% 13% 8% 12% 11%
Doesn’t care at all 31% 34% 2% 75% 4% 68% 35% 5% 21% 68%
Not sure 9% 5% 2% 3% 4% 5% 10% 4% 7% 5%
Totals 100% 100% 99% 100% 100% 101% 101% 101% 100% 99%
Unweighted N (1,492) (1,266) (582) (530) (511) (371) (445) (436) (427) (490)
185

The Economist /YouGov PollJuly 17 - 20, 2021 - 1500 U.S. Adult Citizens
60. Biden LikabilityRegardless of whether you agree with him, do you like or dislike Joe Biden as a person?
Gender White Men White Women Race
Total Male Female No degree College Grad No degree College Grad Black Hispanic
Like a lot 26% 23% 28% 18% 25% 17% 39% 47% 24%
Like somewhat 16% 16% 17% 10% 19% 18% 15% 13% 23%
Neither like nor dislike 19% 21% 18% 17% 21% 19% 14% 25% 21%
Dislike somewhat 8% 9% 7% 12% 8% 10% 3% 4% 8%
Dislike a lot 21% 24% 19% 34% 24% 25% 23% 5% 13%
Not sure 9% 7% 11% 9% 3% 12% 6% 6% 11%
Totals 99% 100% 100% 100% 100% 101% 100% 100% 100%
Unweighted N (1,493) (727) (766) (328) (191) (346) (201) (168) (162)
Age Income Region
Total 18-29 30-44 45-64 65+ Under $50K $50-100K $100K or more Northeast Midwest South West
Like a lot 26% 15% 19% 32% 33% 24% 28% 29% 28% 24% 25% 27%
Like somewhat 16% 24% 23% 12% 10% 17% 16% 19% 20% 17% 12% 21%
Neither like nor dislike 19% 25% 22% 15% 18% 20% 18% 19% 19% 17% 20% 20%
Dislike somewhat 8% 11% 6% 6% 9% 9% 8% 7% 7% 11% 7% 7%
Dislike a lot 21% 10% 14% 29% 28% 19% 26% 21% 19% 23% 24% 18%
Not sure 9% 14% 16% 6% 3% 12% 5% 5% 8% 8% 12% 6%
Totals 99% 99% 100% 100% 101% 101% 101% 100% 101% 100% 100% 99%
Unweighted N (1,493) (193) (352) (593) (355) (599) (418) (287) (253) (306) (539) (395)
186

The Economist /YouGov PollJuly 17 - 20, 2021 - 1500 U.S. Adult Citizens
Registered 2020 Vote Party ID Ideology
Total Voters Biden Trump Dem Rep Ind Lib Mod Con
Like a lot 26% 30% 61% 2% 57% 3% 17% 54% 28% 5%
Like somewhat 16% 16% 23% 5% 21% 8% 16% 24% 19% 7%
Neither like nor dislike 19% 17% 12% 20% 14% 19% 28% 13% 28% 17%
Dislike somewhat 8% 8% 1% 14% 3% 13% 9% 3% 8% 13%
Dislike a lot 21% 24% 1% 54% 1% 51% 22% 3% 10% 50%
Not sure 9% 5% 2% 4% 4% 5% 9% 3% 7% 7%
Totals 99% 100% 100% 99% 100% 99% 101% 100% 100% 99%
Unweighted N (1,493) (1,268) (582) (530) (511) (371) (445) (435) (428) (491)
187

The Economist /YouGov PollJuly 17 - 20, 2021 - 1500 U.S. Adult Citizens
61. Biden Leadership AbilitiesWould you say Joe Biden is a strong or a weak leader?
Gender White Men White Women Race
Total Male Female No degree College Grad No degree College Grad Black Hispanic
Very strong 20% 19% 21% 15% 21% 14% 22% 43% 16%
Somewhat strong 29% 27% 31% 19% 30% 26% 30% 38% 36%
Somewhat weak 15% 14% 16% 13% 10% 19% 16% 11% 21%
Very weak 36% 40% 32% 53% 39% 41% 32% 8% 27%
Totals 100% 100% 100% 100% 100% 100% 100% 100% 100%
Unweighted N (1,488) (726) (762) (328) (190) (344) (200) (167) (162)
Age Income Region
Total 18-29 30-44 45-64 65+ Under $50K $50-100K $100K or more Northeast Midwest South West
Very strong 20% 13% 19% 24% 21% 21% 18% 22% 22% 17% 19% 23%
Somewhat strong 29% 40% 39% 23% 20% 29% 29% 30% 31% 29% 25% 35%
Somewhat weak 15% 25% 18% 11% 9% 19% 13% 13% 18% 14% 16% 12%
Very weak 36% 22% 24% 42% 49% 31% 41% 35% 29% 40% 40% 29%
Totals 100% 100% 100% 100% 99% 100% 101% 100% 100% 100% 100% 99%
Unweighted N (1,488) (191) (351) (591) (355) (597) (420) (285) (252) (307) (536) (393)
188

The Economist /YouGov PollJuly 17 - 20, 2021 - 1500 U.S. Adult Citizens
Registered 2020 Vote Party ID Ideology
Total Voters Biden Trump Dem Rep Ind Lib Mod Con
Very strong 20% 21% 43% 1% 42% 5% 12% 40% 18% 7%
Somewhat strong 29% 28% 46% 4% 45% 3% 31% 43% 39% 8%
Somewhat weak 15% 13% 9% 12% 10% 16% 19% 14% 20% 9%
Very weak 36% 38% 2% 83% 4% 76% 39% 4% 23% 76%
Totals 100% 100% 100% 100% 101% 100% 101% 101% 100% 100%
Unweighted N (1,488) (1,266) (582) (530) (512) (371) (439) (435) (427) (489)
189

The Economist /YouGov PollJuly 17 - 20, 2021 - 1500 U.S. Adult Citizens
62. Biden HonestyDo you think Joe Biden is honest and trustworthy, or not?
Gender White Men White Women Race
Total Male Female No degree College Grad No degree College Grad Black Hispanic
Honest and trustworthy 44% 43% 44% 29% 49% 33% 54% 65% 51%
Not honest andtrustworthy 40% 44% 36% 57% 45% 46% 34% 13% 29%
Not sure 17% 13% 20% 14% 6% 20% 11% 22% 20%
Totals 101% 100% 100% 100% 100% 99% 99% 100% 100%
Unweighted N (1,493) (729) (764) (330) (191) (343) (202) (168) (162)
Age Income Region
Total 18-29 30-44 45-64 65+ Under $50K $50-100K $100K or more Northeast Midwest South West
Honest and trustworthy 44% 40% 46% 45% 41% 40% 44% 53% 45% 40% 41% 51%
Not honest andtrustworthy 40% 30% 33% 44% 49% 38% 46% 38% 38% 45% 41% 35%
Not sure 17% 30% 21% 11% 10% 22% 9% 10% 17% 16% 18% 14%
Totals 101% 100% 100% 100% 100% 100% 99% 101% 100% 101% 100% 100%
Unweighted N (1,493) (192) (353) (593) (355) (599) (419) (287) (252) (307) (538) (396)
190

The Economist /YouGov PollJuly 17 - 20, 2021 - 1500 U.S. Adult Citizens
Registered 2020 Vote Party ID Ideology
Total Voters Biden Trump Dem Rep Ind Lib Mod Con
Honest and trustworthy 44% 46% 86% 6% 83% 9% 35% 79% 52% 11%
Not honest andtrustworthy 40% 42% 4% 87% 7% 83% 45% 10% 30% 80%
Not sure 17% 11% 10% 7% 9% 8% 20% 11% 18% 9%
Totals 101% 99% 100% 100% 99% 100% 100% 100% 100% 100%
Unweighted N (1,493) (1,268) (582) (530) (513) (371) (443) (435) (428) (490)
191

The Economist /YouGov PollJuly 17 - 20, 2021 - 1500 U.S. Adult Citizens
63. Biden Confidence in International CrisisAre you confident in Joe Biden’s ability to deal wisely with an international crisis, or are you uneasy about his approach?
Gender White Men White Women Race
Total Male Female No degree College Grad No degree College Grad Black Hispanic
Confident 39% 38% 40% 26% 45% 30% 47% 59% 43%
Uneasy 45% 50% 40% 62% 48% 52% 39% 19% 35%
Not sure 16% 12% 20% 12% 7% 18% 14% 23% 22%
Totals 100% 100% 100% 100% 100% 100% 100% 101% 100%
Unweighted N (1,492) (728) (764) (330) (191) (345) (202) (166) (161)
Age Income Region
Total 18-29 30-44 45-64 65+ Under $50K $50-100K $100K or more Northeast Midwest South West
Confident 39% 33% 43% 41% 38% 38% 39% 47% 41% 35% 35% 47%
Uneasy 45% 38% 36% 48% 57% 42% 51% 45% 43% 48% 49% 36%
Not sure 16% 30% 21% 12% 6% 20% 10% 8% 16% 17% 16% 16%
Totals 100% 101% 100% 101% 101% 100% 100% 100% 100% 100% 100% 99%
Unweighted N (1,492) (192) (353) (595) (352) (599) (419) (287) (253) (308) (536) (395)
192

The Economist /YouGov PollJuly 17 - 20, 2021 - 1500 U.S. Adult Citizens
Registered 2020 Vote Party ID Ideology
Total Voters Biden Trump Dem Rep Ind Lib Mod Con
Confident 39% 42% 79% 5% 75% 8% 32% 73% 47% 11%
Uneasy 45% 48% 9% 91% 13% 88% 48% 14% 38% 83%
Not sure 16% 11% 12% 4% 12% 4% 19% 14% 15% 7%
Totals 100% 101% 100% 100% 100% 100% 99% 101% 100% 101%
Unweighted N (1,492) (1,266) (581) (529) (513) (371) (443) (434) (428) (490)
193

The Economist /YouGov PollJuly 17 - 20, 2021 - 1500 U.S. Adult Citizens
64. Biden SincerityDo you think Joe Biden...
Gender White Men White Women Race
Total Male Female No degree College Grad No degree College Grad Black Hispanic
Says what he believes 39% 36% 42% 29% 41% 33% 46% 63% 39%
Says what he thinkspeople want to hear 44% 51% 37% 59% 54% 47% 41% 17% 36%
Not sure 17% 13% 21% 12% 6% 20% 13% 20% 25%
Totals 100% 100% 100% 100% 101% 100% 100% 100% 100%
Unweighted N (1,492) (728) (764) (329) (191) (346) (202) (167) (161)
Age Income Region
Total 18-29 30-44 45-64 65+ Under $50K $50-100K $100K or more Northeast Midwest South West
Says what he believes 39% 33% 39% 42% 41% 39% 40% 44% 41% 36% 37% 46%
Says what he thinkspeople want to hear 44% 40% 39% 46% 49% 41% 48% 47% 44% 51% 44% 36%
Not sure 17% 27% 22% 12% 10% 20% 12% 9% 15% 14% 19% 18%
Totals 100% 100% 100% 100% 100% 100% 100% 100% 100% 101% 100% 100%
Unweighted N (1,492) (192) (352) (594) (354) (599) (418) (287) (252) (306) (538) (396)
194

The Economist /YouGov PollJuly 17 - 20, 2021 - 1500 U.S. Adult Citizens
Registered 2020 Vote Party ID Ideology
Total Voters Biden Trump Dem Rep Ind Lib Mod Con
Says what he believes 39% 42% 77% 7% 73% 10% 31% 68% 46% 13%
Says what he thinkspeople want to hear 44% 44% 12% 83% 16% 79% 50% 21% 38% 75%
Not sure 17% 13% 11% 10% 11% 11% 19% 11% 16% 12%
Totals 100% 99% 100% 100% 100% 100% 100% 100% 100% 100%
Unweighted N (1,492) (1,266) (582) (527) (514) (368) (445) (435) (429) (489)
195

The Economist /YouGov PollJuly 17 - 20, 2021 - 1500 U.S. Adult Citizens
65. Biden Bring Country TogetherDo you think that Joe Biden will be able to bring the country together as President?
Gender White Men White Women Race
Total Male Female No degree College Grad No degree College Grad Black Hispanic
Yes 23% 24% 21% 16% 24% 14% 18% 39% 34%
No 51% 57% 46% 67% 60% 55% 50% 31% 34%
Not sure 26% 19% 33% 18% 16% 31% 32% 30% 33%
Totals 100% 100% 100% 101% 100% 100% 100% 100% 101%
Unweighted N (1,494) (729) (765) (330) (191) (346) (202) (167) (163)
Age Income Region
Total 18-29 30-44 45-64 65+ Under $50K $50-100K $100K or more Northeast Midwest South West
Yes 23% 26% 27% 22% 15% 24% 19% 27% 23% 15% 22% 30%
No 51% 42% 42% 57% 60% 47% 59% 53% 45% 57% 55% 44%
Not sure 26% 32% 31% 21% 25% 29% 22% 20% 32% 28% 23% 26%
Totals 100% 100% 100% 100% 100% 100% 100% 100% 100% 100% 100% 100%
Unweighted N (1,494) (194) (352) (593) (355) (599) (420) (287) (253) (308) (538) (395)
196

The Economist /YouGov PollJuly 17 - 20, 2021 - 1500 U.S. Adult Citizens
Registered 2020 Vote Party ID Ideology
Total Voters Biden Trump Dem Rep Ind Lib Mod Con
Yes 23% 22% 37% 4% 45% 7% 14% 37% 25% 9%
No 51% 53% 23% 92% 19% 86% 62% 26% 46% 83%
Not sure 26% 25% 40% 4% 36% 6% 25% 37% 28% 8%
Totals 100% 100% 100% 100% 100% 99% 101% 100% 99% 100%
Unweighted N (1,494) (1,268) (581) (530) (512) (371) (444) (435) (427) (491)
197

The Economist /YouGov PollJuly 17 - 20, 2021 - 1500 U.S. Adult Citizens
66. OptimismAre you optimistic or pessimistic about the next four years with Joe Biden as President?
Gender White Men White Women Race
Total Male Female No degree College Grad No degree College Grad Black Hispanic
Optimistic 43% 42% 43% 29% 45% 32% 49% 63% 52%
Pessimistic 39% 44% 33% 54% 49% 43% 33% 12% 28%
Not sure 19% 14% 23% 18% 6% 24% 17% 25% 19%
Totals 101% 100% 99% 101% 100% 99% 99% 100% 99%
Unweighted N (1,488) (727) (761) (329) (191) (342) (202) (166) (161)
Age Income Region
Total 18-29 30-44 45-64 65+ Under $50K $50-100K $100K or more Northeast Midwest South West
Optimistic 43% 47% 46% 41% 38% 43% 41% 51% 44% 37% 38% 53%
Pessimistic 39% 25% 30% 45% 50% 34% 45% 39% 36% 43% 41% 32%
Not sure 19% 28% 25% 14% 11% 23% 14% 10% 19% 19% 21% 15%
Totals 101% 100% 101% 100% 99% 100% 100% 100% 99% 99% 100% 100%
Unweighted N (1,488) (192) (349) (592) (355) (596) (419) (285) (252) (305) (535) (396)
198

The Economist /YouGov PollJuly 17 - 20, 2021 - 1500 U.S. Adult Citizens
Registered 2020 Vote Party ID Ideology
Total Voters Biden Trump Dem Rep Ind Lib Mod Con
Optimistic 43% 46% 83% 6% 80% 11% 34% 80% 48% 12%
Pessimistic 39% 41% 5% 85% 8% 80% 43% 9% 30% 78%
Not sure 19% 13% 11% 8% 12% 9% 24% 12% 22% 10%
Totals 101% 100% 99% 99% 100% 100% 101% 101% 100% 100%
Unweighted N (1,488) (1,264) (582) (528) (513) (370) (441) (435) (425) (489)
199

The Economist /YouGov PollJuly 17 - 20, 2021 - 1500 U.S. Adult Citizens
67. Approval of U.S. CongressOverall, do you approve or disapprove of the way that the United States Congress is handling its job?
Gender White Men White Women Race
Total Male Female No degree College Grad No degree College Grad Black Hispanic
Strongly approve 6% 6% 6% 3% 7% 3% 3% 16% 8%
Somewhat approve 15% 17% 13% 9% 24% 9% 13% 23% 21%
Neither approve nordisapprove 15% 15% 16% 10% 7% 20% 9% 19% 23%
Somewhat disapprove 19% 18% 21% 21% 19% 19% 31% 16% 11%
Strongly disapprove 32% 37% 27% 47% 41% 29% 34% 13% 20%
Not sure 13% 8% 18% 10% 2% 20% 9% 13% 17%
Totals 100% 101% 101% 100% 100% 100% 99% 100% 100%
Unweighted N (1,493) (728) (765) (329) (191) (346) (201) (167) (162)
Age Income Region
Total 18-29 30-44 45-64 65+ Under $50K $50-100K $100K or more Northeast Midwest South West
Strongly approve 6% 6% 12% 4% 3% 8% 3% 7% 5% 4% 6% 8%
Somewhat approve 15% 20% 17% 15% 8% 15% 15% 21% 16% 12% 14% 18%
Neither approve nordisapprove 15% 20% 18% 14% 11% 19% 12% 11% 14% 16% 15% 15%
Somewhat disapprove 19% 18% 15% 19% 26% 18% 26% 21% 20% 22% 20% 15%
Strongly disapprove 32% 12% 21% 40% 47% 25% 38% 35% 32% 34% 31% 30%
Not sure 13% 24% 17% 8% 5% 15% 7% 6% 14% 12% 13% 13%
Totals 100% 100% 100% 100% 100% 100% 101% 101% 101% 100% 99% 99%
Unweighted N (1,493) (192) (352) (594) (355) (600) (420) (285) (252) (306) (538) (397)
200

The Economist /YouGov PollJuly 17 - 20, 2021 - 1500 U.S. Adult Citizens
Registered 2020 Vote Party ID Ideology
Total Voters Biden Trump Dem Rep Ind Lib Mod Con
Strongly approve 6% 7% 10% 2% 12% 1% 4% 10% 7% 3%
Somewhat approve 15% 16% 27% 3% 29% 5% 9% 29% 15% 6%
Neither approve nordisapprove 15% 14% 15% 7% 16% 10% 17% 13% 20% 11%
Somewhat disapprove 19% 20% 24% 18% 19% 21% 22% 21% 23% 18%
Strongly disapprove 32% 36% 19% 63% 14% 54% 38% 18% 26% 55%
Not sure 13% 8% 5% 6% 9% 9% 10% 9% 9% 8%
Totals 100% 101% 100% 99% 99% 100% 100% 100% 100% 101%
Unweighted N (1,493) (1,267) (583) (529) (513) (370) (445) (436) (428) (489)
201

The Economist /YouGov PollJuly 17 - 20, 2021 - 1500 U.S. Adult Citizens
68. Pelosi Job ApprovalDo you approve or disapprove of the way Nancy Pelosi is handling her job as the Speaker of the U.S. House of Representatives?
Gender White Men White Women Race
Total Male Female No degree College Grad No degree College Grad Black Hispanic
Strongly approve 16% 14% 17% 8% 17% 8% 24% 35% 16%
Somewhat approve 21% 23% 20% 14% 24% 17% 22% 31% 28%
Somewhat disapprove 10% 11% 8% 11% 12% 8% 11% 8% 12%
Strongly disapprove 37% 41% 33% 55% 43% 46% 35% 9% 21%
Not sure 16% 11% 21% 12% 4% 22% 10% 17% 24%
Totals 100% 100% 99% 100% 100% 101% 102% 100% 101%
Unweighted N (1,487) (727) (760) (328) (190) (344) (201) (167) (161)
Age Income Region
Total 18-29 30-44 45-64 65+ Under $50K $50-100K $100K or more Northeast Midwest South West
Strongly approve 16% 10% 12% 18% 22% 15% 17% 18% 16% 12% 16% 18%
Somewhat approve 21% 28% 24% 19% 16% 20% 21% 27% 26% 18% 19% 24%
Somewhat disapprove 10% 14% 15% 7% 5% 11% 9% 8% 11% 11% 8% 9%
Strongly disapprove 37% 17% 27% 46% 53% 34% 42% 38% 31% 44% 40% 30%
Not sure 16% 33% 22% 11% 4% 19% 11% 9% 16% 16% 16% 18%
Totals 100% 102% 100% 101% 100% 99% 100% 100% 100% 101% 99% 99%
Unweighted N (1,487) (193) (351) (589) (354) (595) (419) (285) (251) (308) (534) (394)
202

The Economist /YouGov PollJuly 17 - 20, 2021 - 1500 U.S. Adult Citizens
Registered 2020 Vote Party ID Ideology
Total Voters Biden Trump Dem Rep Ind Lib Mod Con
Strongly approve 16% 18% 36% 1% 36% 2% 9% 35% 16% 3%
Somewhat approve 21% 21% 40% 3% 37% 5% 20% 35% 28% 7%
Somewhat disapprove 10% 8% 11% 3% 9% 6% 13% 11% 13% 4%
Strongly disapprove 37% 41% 5% 89% 4% 82% 44% 7% 27% 78%
Not sure 16% 11% 9% 4% 14% 5% 15% 12% 15% 8%
Totals 100% 99% 101% 100% 100% 100% 101% 100% 99% 100%
Unweighted N (1,487) (1,264) (580) (530) (513) (369) (443) (435) (427) (492)
203

The Economist /YouGov PollJuly 17 - 20, 2021 - 1500 U.S. Adult Citizens
69. Schumer Job ApprovalDo you approve or disapprove of the way Chuck Schumer is handling his job as Majority Leader of the U.S. Senate?
Gender White Men White Women Race
Total Male Female No degree College Grad No degree College Grad Black Hispanic
Strongly approve 12% 11% 13% 6% 14% 6% 17% 25% 13%
Somewhat approve 20% 21% 18% 14% 26% 15% 27% 25% 20%
Somewhat disapprove 12% 14% 9% 13% 16% 9% 10% 11% 13%
Strongly disapprove 32% 37% 26% 48% 38% 32% 30% 12% 22%
Not sure 25% 16% 33% 19% 6% 39% 16% 27% 32%
Totals 101% 99% 99% 100% 100% 101% 100% 100% 100%
Unweighted N (1,491) (727) (764) (329) (190) (345) (202) (166) (162)
Age Income Region
Total 18-29 30-44 45-64 65+ Under $50K $50-100K $100K or more Northeast Midwest South West
Strongly approve 12% 9% 10% 14% 14% 11% 13% 15% 15% 9% 12% 13%
Somewhat approve 20% 19% 20% 19% 21% 18% 21% 25% 22% 18% 17% 23%
Somewhat disapprove 12% 11% 17% 10% 8% 13% 11% 12% 11% 14% 11% 10%
Strongly disapprove 32% 14% 21% 39% 47% 26% 37% 34% 32% 33% 35% 25%
Not sure 25% 46% 32% 18% 10% 31% 18% 15% 21% 27% 24% 29%
Totals 101% 99% 100% 100% 100% 99% 100% 101% 101% 101% 99% 100%
Unweighted N (1,491) (194) (353) (589) (355) (599) (418) (286) (253) (306) (536) (396)
204

The Economist /YouGov PollJuly 17 - 20, 2021 - 1500 U.S. Adult Citizens
Registered 2020 Vote Party ID Ideology
Total Voters Biden Trump Dem Rep Ind Lib Mod Con
Strongly approve 12% 14% 28% 2% 28% 2% 6% 26% 12% 4%
Somewhat approve 20% 21% 40% 4% 36% 7% 17% 37% 22% 6%
Somewhat disapprove 12% 10% 11% 7% 10% 9% 16% 11% 18% 8%
Strongly disapprove 32% 36% 4% 77% 5% 67% 37% 7% 23% 67%
Not sure 25% 18% 17% 10% 21% 16% 23% 19% 25% 16%
Totals 101% 99% 100% 100% 100% 101% 99% 100% 100% 101%
Unweighted N (1,491) (1,264) (580) (529) (511) (370) (444) (436) (427) (489)
205

The Economist /YouGov PollJuly 17 - 20, 2021 - 1500 U.S. Adult Citizens
70. McConnell Job ApprovalDo you approve or disapprove of the way Mitch McConnell is handling his job as Minority Leader of the U.S. Senate?
Gender White Men White Women Race
Total Male Female No degree College Grad No degree College Grad Black Hispanic
Strongly approve 5% 6% 4% 4% 6% 2% 6% 9% 6%
Somewhat approve 16% 21% 11% 18% 27% 14% 10% 11% 20%
Somewhat disapprove 18% 22% 15% 25% 24% 17% 16% 12% 10%
Strongly disapprove 39% 38% 39% 38% 38% 34% 53% 43% 31%
Not sure 22% 13% 31% 15% 6% 33% 14% 26% 34%
Totals 100% 100% 100% 100% 101% 100% 99% 101% 101%
Unweighted N (1,483) (725) (758) (327) (191) (343) (201) (167) (158)
Age Income Region
Total 18-29 30-44 45-64 65+ Under $50K $50-100K $100K or more Northeast Midwest South West
Strongly approve 5% 7% 5% 4% 3% 4% 5% 8% 4% 3% 6% 6%
Somewhat approve 16% 16% 16% 13% 19% 14% 18% 21% 16% 14% 16% 17%
Somewhat disapprove 18% 20% 13% 19% 23% 18% 22% 18% 19% 17% 22% 15%
Strongly disapprove 39% 19% 35% 47% 47% 36% 42% 40% 43% 44% 34% 38%
Not sure 22% 38% 31% 17% 8% 28% 13% 13% 18% 22% 23% 25%
Totals 100% 100% 100% 100% 100% 100% 100% 100% 100% 100% 101% 101%
Unweighted N (1,483) (193) (347) (590) (353) (593) (416) (286) (250) (306) (533) (394)
206

The Economist /YouGov PollJuly 17 - 20, 2021 - 1500 U.S. Adult Citizens
Registered 2020 Vote Party ID Ideology
Total Voters Biden Trump Dem Rep Ind Lib Mod Con
Strongly approve 5% 5% 3% 7% 5% 9% 3% 4% 4% 8%
Somewhat approve 16% 17% 8% 28% 12% 29% 14% 12% 11% 26%
Somewhat disapprove 18% 19% 8% 33% 10% 28% 22% 6% 21% 30%
Strongly disapprove 39% 43% 71% 20% 58% 18% 39% 64% 41% 20%
Not sure 22% 16% 10% 12% 15% 16% 22% 14% 23% 15%
Totals 100% 100% 100% 100% 100% 100% 100% 100% 100% 99%
Unweighted N (1,483) (1,258) (577) (527) (508) (368) (442) (430) (424) (488)
207

The Economist /YouGov PollJuly 17 - 20, 2021 - 1500 U.S. Adult Citizens
71. Approval of the Supreme Court of the United StatesDo you approve or disapprove of the way the Supreme Court of the United States is handling its job?
Gender White Men White Women Race
Total Male Female No degree College Grad No degree College Grad Black Hispanic
Strongly approve 8% 10% 6% 11% 8% 7% 6% 11% 9%
Somewhat approve 30% 36% 25% 34% 42% 24% 29% 32% 27%
Somewhat disapprove 23% 22% 24% 23% 26% 22% 33% 22% 12%
Strongly disapprove 15% 15% 14% 15% 17% 12% 16% 10% 16%
Not sure 24% 17% 31% 16% 7% 35% 15% 25% 36%
Totals 100% 100% 100% 99% 100% 100% 99% 100% 100%
Unweighted N (1,486) (725) (761) (327) (190) (343) (201) (168) (160)
Age Income Region
Total 18-29 30-44 45-64 65+ Under $50K $50-100K $100K or more Northeast Midwest South West
Strongly approve 8% 6% 9% 7% 9% 8% 9% 9% 9% 8% 7% 9%
Somewhat approve 30% 25% 26% 33% 36% 30% 34% 36% 34% 27% 32% 28%
Somewhat disapprove 23% 20% 18% 24% 29% 19% 29% 24% 22% 25% 21% 26%
Strongly disapprove 15% 10% 15% 18% 13% 13% 14% 16% 16% 15% 15% 14%
Not sure 24% 38% 32% 18% 12% 30% 14% 15% 20% 25% 25% 24%
Totals 100% 99% 100% 100% 99% 100% 100% 100% 101% 100% 100% 101%
Unweighted N (1,486) (192) (350) (590) (354) (594) (419) (285) (252) (302) (538) (394)
208

The Economist /YouGov PollJuly 17 - 20, 2021 - 1500 U.S. Adult Citizens
Registered 2020 Vote Party ID Ideology
Total Voters Biden Trump Dem Rep Ind Lib Mod Con
Strongly approve 8% 9% 7% 12% 8% 12% 6% 6% 8% 11%
Somewhat approve 30% 33% 29% 40% 29% 40% 33% 30% 30% 39%
Somewhat disapprove 23% 25% 32% 22% 26% 21% 24% 27% 27% 20%
Strongly disapprove 15% 16% 17% 14% 15% 15% 14% 20% 9% 14%
Not sure 24% 18% 15% 12% 21% 14% 23% 17% 25% 15%
Totals 100% 101% 100% 100% 99% 102% 100% 100% 99% 99%
Unweighted N (1,486) (1,262) (580) (527) (512) (369) (441) (434) (424) (490)
209

The Economist /YouGov PollJuly 17 - 20, 2021 - 1500 U.S. Adult Citizens
72. Ideology of the Supreme Court of the United StatesIn general, how would you describe the political viewpoint of the Supreme Court of the United States?
Gender White Men White Women Race
Total Male Female No degree College Grad No degree College Grad Black Hispanic
Very liberal 5% 6% 4% 5% 5% 2% 5% 3% 9%
Liberal 10% 12% 8% 11% 14% 10% 7% 7% 10%
Moderate 30% 35% 25% 37% 41% 29% 23% 27% 23%
Conservative 22% 22% 21% 23% 24% 16% 32% 22% 18%
Very conservative 10% 9% 10% 7% 11% 5% 18% 13% 8%
Not sure 24% 15% 32% 18% 5% 37% 14% 28% 32%
Totals 101% 99% 100% 101% 100% 99% 99% 100% 100%
Unweighted N (1,491) (726) (765) (329) (191) (346) (201) (165) (162)
Age Income Region
Total 18-29 30-44 45-64 65+ Under $50K $50-100K $100K or more Northeast Midwest South West
Very liberal 5% 7% 9% 3% 1% 5% 6% 7% 4% 4% 5% 7%
Liberal 10% 8% 10% 11% 10% 10% 10% 12% 11% 9% 10% 10%
Moderate 30% 26% 23% 34% 34% 27% 36% 35% 32% 28% 30% 29%
Conservative 22% 20% 18% 22% 27% 20% 25% 23% 23% 22% 21% 22%
Very conservative 10% 4% 9% 10% 15% 6% 12% 12% 7% 11% 10% 10%
Not sure 24% 34% 31% 20% 14% 32% 12% 10% 24% 27% 24% 21%
Totals 101% 99% 100% 100% 101% 100% 101% 99% 101% 101% 100% 99%
Unweighted N (1,491) (193) (352) (592) (354) (597) (420) (286) (252) (306) (536) (397)
210

The Economist /YouGov PollJuly 17 - 20, 2021 - 1500 U.S. Adult Citizens
Registered 2020 Vote Party ID Ideology
Total Voters Biden Trump Dem Rep Ind Lib Mod Con
Very liberal 5% 5% 5% 6% 7% 5% 3% 8% 2% 6%
Liberal 10% 10% 4% 16% 6% 17% 11% 6% 10% 15%
Moderate 30% 33% 17% 50% 21% 42% 37% 15% 36% 45%
Conservative 22% 24% 39% 13% 31% 15% 21% 35% 23% 16%
Very conservative 10% 11% 23% 1% 19% 2% 7% 23% 8% 2%
Not sure 24% 17% 13% 13% 17% 18% 22% 14% 20% 17%
Totals 101% 100% 101% 99% 101% 99% 101% 101% 99% 101%
Unweighted N (1,491) (1,266) (581) (530) (512) (371) (444) (436) (425) (490)
211

The Economist /YouGov PollJuly 17 - 20, 2021 - 1500 U.S. Adult Citizens
73. Trend of EconomyOverall, do you think the economy is getting better or worse?
Gender White Men White Women Race
Total Male Female No degree College Grad No degree College Grad Black Hispanic
Getting better 23% 25% 21% 17% 33% 13% 33% 37% 18%
About the same 26% 28% 23% 28% 28% 21% 21% 30% 29%
Getting worse 38% 38% 39% 46% 37% 49% 36% 17% 31%
Not sure 13% 9% 17% 8% 3% 17% 10% 16% 22%
Totals 100% 100% 100% 99% 101% 100% 100% 100% 100%
Unweighted N (1,491) (729) (762) (330) (190) (345) (201) (166) (162)
Age Income Region
Total 18-29 30-44 45-64 65+ Under $50K $50-100K $100K or more Northeast Midwest South West
Getting better 23% 18% 21% 25% 27% 20% 25% 33% 27% 19% 20% 30%
About the same 26% 27% 30% 24% 23% 25% 26% 30% 28% 25% 26% 23%
Getting worse 38% 30% 32% 44% 45% 41% 41% 31% 32% 46% 40% 33%
Not sure 13% 24% 17% 7% 6% 13% 8% 6% 13% 11% 14% 13%
Totals 100% 99% 100% 100% 101% 99% 100% 100% 100% 101% 100% 99%
Unweighted N (1,491) (194) (349) (593) (355) (597) (418) (287) (253) (307) (535) (396)
212

The Economist /YouGov PollJuly 17 - 20, 2021 - 1500 U.S. Adult Citizens
Registered 2020 Vote Party ID Ideology
Total Voters Biden Trump Dem Rep Ind Lib Mod Con
Getting better 23% 26% 48% 6% 45% 7% 17% 44% 26% 8%
About the same 26% 25% 31% 19% 34% 18% 28% 28% 33% 20%
Getting worse 38% 40% 13% 71% 12% 67% 43% 19% 29% 64%
Not sure 13% 9% 8% 5% 9% 8% 11% 9% 11% 8%
Totals 100% 100% 100% 101% 100% 100% 99% 100% 99% 100%
Unweighted N (1,491) (1,266) (580) (530) (512) (371) (444) (434) (427) (490)
213

The Economist /YouGov PollJuly 17 - 20, 2021 - 1500 U.S. Adult Citizens
74. Stock Market Expectations Over Next YearDo you think the stock market will be higher or lower 12 months from now?
Gender White Men White Women Race
Total Male Female No degree College Grad No degree College Grad Black Hispanic
Higher 21% 24% 18% 19% 26% 12% 21% 38% 18%
About the same 24% 27% 21% 23% 33% 22% 24% 17% 29%
Lower 24% 25% 23% 32% 26% 25% 24% 14% 16%
Not sure 32% 24% 39% 26% 16% 42% 31% 31% 37%
Totals 101% 100% 101% 100% 101% 101% 100% 100% 100%
Unweighted N (1,485) (725) (760) (329) (190) (342) (200) (166) (161)
Age Income Region
Total 18-29 30-44 45-64 65+ Under $50K $50-100K $100K or more Northeast Midwest South West
Higher 21% 24% 18% 20% 22% 19% 20% 27% 22% 19% 20% 22%
About the same 24% 27% 27% 22% 22% 22% 26% 31% 25% 21% 24% 25%
Lower 24% 19% 17% 27% 30% 24% 26% 24% 23% 26% 25% 20%
Not sure 32% 31% 38% 31% 26% 35% 28% 17% 29% 33% 31% 32%
Totals 101% 101% 100% 100% 100% 100% 100% 99% 99% 99% 100% 99%
Unweighted N (1,485) (191) (350) (592) (352) (593) (418) (286) (251) (307) (531) (396)
214

The Economist /YouGov PollJuly 17 - 20, 2021 - 1500 U.S. Adult Citizens
Registered 2020 Vote Party ID Ideology
Total Voters Biden Trump Dem Rep Ind Lib Mod Con
Higher 21% 23% 34% 10% 31% 14% 19% 31% 24% 14%
About the same 24% 24% 26% 20% 27% 20% 27% 28% 29% 18%
Lower 24% 25% 8% 47% 8% 42% 28% 10% 19% 43%
Not sure 32% 28% 32% 23% 34% 25% 26% 31% 28% 25%
Totals 101% 100% 100% 100% 100% 101% 100% 100% 100% 100%
Unweighted N (1,485) (1,259) (579) (528) (509) (369) (442) (433) (426) (488)
215

The Economist /YouGov PollJuly 17 - 20, 2021 - 1500 U.S. Adult Citizens
75. Stock OwnershipDo you personally (or jointly with a spouse), have any money invested in the stock market right now, either in an individual stock or in a mutual fund?
Gender White Men White Women Race
Total Male Female No degree College Grad No degree College Grad Black Hispanic
Yes 38% 45% 33% 40% 66% 23% 59% 26% 29%
No 62% 55% 67% 60% 34% 77% 41% 74% 71%
Totals 100% 100% 100% 100% 100% 100% 100% 100% 100%
Unweighted N (1,489) (727) (762) (328) (191) (343) (201) (167) (162)
Age Income Region
Total 18-29 30-44 45-64 65+ Under $50K $50-100K $100K or more Northeast Midwest South West
Yes 38% 29% 35% 40% 48% 20% 50% 69% 48% 39% 30% 45%
No 62% 71% 65% 60% 52% 80% 50% 31% 52% 61% 70% 55%
Totals 100% 100% 100% 100% 100% 100% 100% 100% 100% 100% 100% 100%
Unweighted N (1,489) (191) (352) (594) (352) (598) (419) (287) (252) (307) (534) (396)
Registered 2020 Vote Party ID Ideology
Total Voters Biden Trump Dem Rep Ind Lib Mod Con
Yes 38% 45% 46% 50% 38% 41% 45% 41% 43% 44%
No 62% 55% 54% 50% 62% 59% 55% 59% 57% 56%
Totals 100% 100% 100% 100% 100% 100% 100% 100% 100% 100%
Unweighted N (1,489) (1,264) (582) (526) (514) (370) (441) (435) (426) (488)
216

The Economist /YouGov PollJuly 17 - 20, 2021 - 1500 U.S. Adult Citizens
76. Change in Personal Finances Over Past YearWould you say that you and your family are...
Gender White Men White Women Race
Total Male Female No degree College Grad No degree College Grad Black Hispanic
Better off financially thanyou were a year ago 18% 21% 16% 14% 31% 11% 23% 24% 15%
About the samefinancially as you werea year ago 45% 43% 46% 44% 46% 43% 55% 47% 40%
Worse off financially thanyou were a year ago 28% 28% 28% 32% 19% 37% 18% 20% 32%
Not sure 9% 8% 10% 9% 4% 9% 3% 10% 13%
Totals 100% 100% 100% 99% 100% 100% 99% 101% 100%
Unweighted N (1,495) (728) (767) (329) (190) (346) (202) (168) (163)
Age Income Region
Total 18-29 30-44 45-64 65+ Under $50K $50-100K $100K or more Northeast Midwest South West
Better off financially thanyou were a year ago 18% 16% 21% 17% 20% 13% 19% 33% 18% 16% 17% 22%
About the samefinancially as you werea year ago 45% 43% 41% 46% 49% 41% 49% 51% 50% 44% 42% 46%
Worse off financially thanyou were a year ago 28% 23% 25% 32% 29% 36% 25% 13% 23% 29% 31% 25%
Not sure 9% 18% 13% 5% 2% 9% 6% 3% 9% 11% 10% 6%
Totals 100% 100% 100% 100% 100% 99% 99% 100% 100% 100% 100% 99%
Unweighted N (1,495) (194) (352) (595) (354) (600) (420) (286) (253) (308) (536) (398)
217

The Economist /YouGov PollJuly 17 - 20, 2021 - 1500 U.S. Adult Citizens
Registered 2020 Vote Party ID Ideology
Total Voters Biden Trump Dem Rep Ind Lib Mod Con
Better off financially thanyou were a year ago 18% 20% 30% 12% 26% 15% 16% 27% 19% 13%
About the samefinancially as you werea year ago 45% 47% 50% 46% 49% 47% 46% 46% 49% 46%
Worse off financially thanyou were a year ago 28% 28% 17% 39% 20% 34% 31% 22% 26% 35%
Not sure 9% 6% 3% 3% 6% 5% 7% 5% 6% 5%
Totals 100% 101% 100% 100% 101% 101% 100% 100% 100% 99%
Unweighted N (1,495) (1,270) (583) (530) (514) (370) (444) (436) (427) (491)
218

The Economist /YouGov PollJuly 17 - 20, 2021 - 1500 U.S. Adult Citizens
77. Jobs in Six MonthsSix months from now do you think there will be...
Gender White Men White Women Race
Total Male Female No degree College Grad No degree College Grad Black Hispanic
More jobs 32% 31% 34% 24% 34% 25% 37% 48% 36%
The same amount of jobs 29% 30% 28% 32% 32% 32% 31% 19% 29%
Fewer jobs 18% 22% 15% 25% 23% 18% 14% 10% 11%
Not sure 21% 18% 24% 19% 11% 25% 18% 22% 24%
Totals 100% 101% 101% 100% 100% 100% 100% 99% 100%
Unweighted N (1,493) (727) (766) (330) (188) (346) (202) (168) (163)
Age Income Region
Total 18-29 30-44 45-64 65+ Under $50K $50-100K $100K or more Northeast Midwest South West
More jobs 32% 31% 27% 32% 39% 31% 33% 37% 32% 28% 32% 38%
The same amount of jobs 29% 29% 32% 28% 27% 28% 33% 33% 26% 33% 30% 25%
Fewer jobs 18% 15% 16% 22% 18% 16% 19% 18% 22% 18% 18% 15%
Not sure 21% 25% 26% 18% 16% 25% 15% 13% 19% 22% 20% 22%
Totals 100% 100% 101% 100% 100% 100% 100% 101% 99% 101% 100% 100%
Unweighted N (1,493) (194) (352) (593) (354) (599) (418) (287) (253) (307) (536) (397)
219

The Economist /YouGov PollJuly 17 - 20, 2021 - 1500 U.S. Adult Citizens
Registered 2020 Vote Party ID Ideology
Total Voters Biden Trump Dem Rep Ind Lib Mod Con
More jobs 32% 35% 54% 17% 51% 19% 29% 49% 36% 19%
The same amount of jobs 29% 29% 22% 37% 21% 38% 31% 21% 31% 35%
Fewer jobs 18% 19% 5% 34% 8% 28% 22% 9% 16% 29%
Not sure 21% 18% 19% 13% 20% 15% 19% 21% 16% 17%
Totals 100% 101% 100% 101% 100% 100% 101% 100% 99% 100%
Unweighted N (1,493) (1,268) (581) (530) (512) (370) (445) (434) (429) (490)
220

The Economist /YouGov PollJuly 17 - 20, 2021 - 1500 U.S. Adult Citizens
78. Worried about Losing JobHow worried are you about losing your job?
Gender White Men White Women Race
Total Male Female No degree College Grad No degree College Grad Black Hispanic
Very worried 9% 10% 7% 6% 7% 6% 9% 16% 9%
Somewhat worried 28% 28% 28% 29% 23% 22% 23% 23% 39%
Not very worried 63% 62% 65% 65% 69% 72% 68% 61% 52%
Totals 100% 100% 100% 100% 99% 100% 100% 100% 100%
Unweighted N (865) (479) (386) (178) (151) (140) (123) (103) (119)
Age Income Region
Total 18-29 30-44 45-64 65+ Under $50K $50-100K $100K or more Northeast Midwest South West
Very worried 9% 13% 11% 6% 3% 12% 7% 9% 9% 8% 9% 9%
Somewhat worried 28% 32% 36% 24% 13% 33% 28% 19% 25% 23% 30% 31%
Not very worried 63% 55% 53% 69% 84% 55% 64% 72% 66% 69% 61% 60%
Totals 100% 100% 100% 99% 100% 100% 99% 100% 100% 100% 100% 100%
Unweighted N (865) (127) (259) (370) (109) (271) (283) (216) (155) (177) (292) (241)
221

The Economist /YouGov PollJuly 17 - 20, 2021 - 1500 U.S. Adult Citizens
Registered 2020 Vote Party ID Ideology
Total Voters Biden Trump Dem Rep Ind Lib Mod Con
Very worried 9% 9% 7% 8% 8% 6% 11% 9% 11% 5%
Somewhat worried 28% 27% 26% 24% 25% 25% 32% 27% 32% 26%
Not very worried 63% 64% 68% 68% 67% 69% 57% 64% 57% 69%
Totals 100% 100% 101% 100% 100% 100% 100% 100% 100% 100%
Unweighted N (865) (739) (341) (301) (305) (210) (253) (266) (247) (283)
222

The Economist /YouGov PollJuly 17 - 20, 2021 - 1500 U.S. Adult Citizens
79. Job AvailabilityIf you lost your job, how hard would it be for you to find a new job that paid as much as you are making now?
Gender White Men White Women Race
Total Male Female No degree College Grad No degree College Grad Black Hispanic
Very hard – I wouldprobably have to take apay cut. 25% 25% 24% 30% 21% 21% 30% 28% 19%
Somewhat hard – It mighttake a while before Ifound a job that paid asmuch. 30% 32% 28% 34% 34% 32% 32% 12% 37%
Not very hard 30% 29% 30% 21% 38% 32% 26% 36% 26%
Not sure 16% 14% 18% 15% 7% 15% 13% 24% 18%
Totals 101% 100% 100% 100% 100% 100% 101% 100% 100%
Unweighted N (863) (478) (385) (178) (151) (139) (123) (103) (118)
223

The Economist /YouGov PollJuly 17 - 20, 2021 - 1500 U.S. Adult Citizens
Age Income Region
Total 18-29 30-44 45-64 65+ Under $50K $50-100K $100K or more Northeast Midwest South West
Very hard – I wouldprobably have to take apay cut. 25% 23% 20% 28% 31% 27% 22% 26% 25% 25% 25% 24%
Somewhat hard – It mighttake a while before Ifound a job that paid asmuch. 30% 38% 32% 27% 20% 26% 36% 30% 32% 28% 30% 31%
Not very hard 30% 28% 31% 30% 28% 28% 29% 37% 28% 28% 30% 32%
Not sure 16% 11% 17% 15% 21% 18% 13% 7% 15% 19% 16% 13%
Totals 101% 100% 100% 100% 100% 99% 100% 100% 100% 100% 101% 100%
Unweighted N (863) (127) (259) (369) (108) (270) (282) (216) (155) (176) (292) (240)
Registered 2020 Vote Party ID Ideology
Total Voters Biden Trump Dem Rep Ind Lib Mod Con
Very hard – I wouldprobably have to take apay cut. 25% 26% 23% 30% 22% 28% 28% 21% 27% 27%
Somewhat hard – It mighttake a while before Ifound a job that paid asmuch. 30% 29% 31% 26% 31% 26% 34% 33% 36% 24%
Not very hard 30% 32% 33% 33% 34% 32% 24% 33% 24% 34%
Not sure 16% 14% 14% 10% 13% 13% 14% 13% 13% 15%
Totals 101% 101% 101% 99% 100% 99% 100% 100% 100% 100%
Unweighted N (863) (737) (341) (299) (305) (209) (252) (266) (247) (281)
224

The Economist /YouGov PollJuly 17 - 20, 2021 - 1500 U.S. Adult Citizens
80. Happy with JobHow happy would you say you are with your current job?
Gender White Men White Women Race
Total Male Female No degree College Grad No degree College Grad Black Hispanic
Very happy 26% 26% 25% 22% 33% 22% 33% 26% 21%
Happy 35% 37% 33% 39% 37% 35% 38% 30% 30%
Neither happy norunhappy 29% 27% 31% 26% 23% 32% 19% 39% 36%
Unhappy 7% 8% 6% 11% 5% 7% 6% 2% 11%
Very unhappy 3% 2% 4% 3% 1% 5% 4% 2% 2%
Totals 100% 100% 99% 101% 99% 101% 100% 99% 100%
Unweighted N (848) (466) (382) (171) (151) (137) (123) (102) (115)
Age Income Region
Total 18-29 30-44 45-64 65+ Under $50K $50-100K $100K or more Northeast Midwest South West
Very happy 26% 14% 30% 26% 33% 20% 28% 34% 27% 25% 20% 33%
Happy 35% 41% 32% 35% 36% 31% 34% 42% 33% 32% 38% 36%
Neither happy norunhappy 29% 35% 28% 27% 26% 37% 27% 14% 28% 30% 33% 22%
Unhappy 7% 7% 7% 8% 2% 9% 7% 8% 7% 6% 7% 7%
Very unhappy 3% 2% 3% 5% 3% 3% 4% 2% 4% 7% 2% 2%
Totals 100% 99% 100% 101% 100% 100% 100% 100% 99% 100% 100% 100%
Unweighted N (848) (125) (256) (362) (105) (261) (280) (216) (154) (172) (284) (238)
225

The Economist /YouGov PollJuly 17 - 20, 2021 - 1500 U.S. Adult Citizens
Registered 2020 Vote Party ID Ideology
Total Voters Biden Trump Dem Rep Ind Lib Mod Con
Very happy 26% 27% 27% 31% 30% 26% 23% 28% 23% 27%
Happy 35% 35% 39% 35% 40% 34% 36% 39% 35% 35%
Neither happy norunhappy 29% 28% 24% 24% 21% 32% 28% 21% 32% 29%
Unhappy 7% 7% 8% 7% 5% 6% 8% 9% 7% 7%
Very unhappy 3% 3% 3% 3% 3% 1% 4% 3% 3% 3%
Totals 100% 100% 101% 100% 99% 99% 99% 100% 100% 101%
Unweighted N (848) (731) (338) (298) (297) (207) (249) (262) (239) (280)
226

The Economist /YouGov PollJuly 17 - 20, 2021 - 1500 U.S. Adult Citizens
Sponsorship The Economist
Fieldwork YouGov
Interviewing Dates July 17 - 20, 2021
Target population US Adult Population
Sampling method Respondents were selected from YouGov’s opt-in Internet panel us-ing sample matching. A random sample (stratified by gender, age,race, education, and region) was selected from the 2018 AmericanCommunity Study. Voter registration was imputed from the November2018 Current Population Survey Registration and Voting Supplement.
Weighting The sample was weighted based on gender, age, race, education,and both 2016 and 2020 Presidential votes (or non-votes). Theweights range from 0.377 to 3.709, with a mean of one and a standarddeviation of 0.416.
Number of respondents 15001272 (Registered voters)
Margin of error ± 2.7% (adjusted for weighting)± 2.9% (Registered voters)
Survey mode Web-based interviews
Questions not reported 42 questions not reported.
227