the economics of what to produce filethe economics of what to produce larry lev, applied economics...
TRANSCRIPT

The Economics of What to Produce
Larry Lev, Applied EconomicsOregon State University
These efforts were supported by Agriculture and Food Research Initiative Competitive Grant no. 2015-68006-22906 from the USDA National Institute of Food and Agriculture.

Intro: A Tale of Two Food Systems
Fringe (10 %)
MAINSTREAM (90%)

A Tale of Two Food Systems
Fringe (4%)
MAINSTREAM (96%)

II. Enterprise Selection: Characteristics of a Good Specialty Crop
• Adequate size of target market• Extended production and marketing season• Potential for value added opportunities• Complementary to farm operation• Difficult to grow (steep learning curve)• Expensive to get into (high initial investment)• Supporting infrastructure available

Other Factors to Consider• Market information, research and analysis• Trends (demographic, economic, health, etc)• Crop adaptation to a specific location/area• Pest and disease issues• Supporting infrastructure & facilities• Laws and regulations (permits/licenses
needed) • Product/Service life cycle and seasonality are
critical

Market Driven Enterprise Screening Tool
• Intended to help growers assess potential of new crop/enterprise alternatives
• Organized into three sections:– Descriptive Section– Comparison worksheet– Example comparing three alternatives
• Emphasis on market issues

1. Market Driven Enterprise Screening Tool: http://sfp.ucdavis.edu/docs/new_enterprise.pdf2. Market Research for Market Readiness (OSU/FIC)http://fic.oregonstate.edu/food-innovation-center/product-development/market-research-market-readiness-mktrd-protocol

III. Values-based food supply chains• Deliver more products to a larger region
than farm-direct and are distinguished from mainstream food supply chains by:– Products differentiated based on
superior quality, environmental stewardship and social responsibilityand
– The characteristics of the strategic relationships that link the supply chain participants.

Two VBFSC examples• Country Natural Beef: A co-op of 60 ranch
families centered in the PNW that markets natural beef products through retailers and restaurants.
• Organic Valley: A national co-op with 1800 member farms that produces and distributes dairy and other products to retailers.

“Profit is not the only goal” (Organic Valley)
People
ProfitPlanet


Supply Chain Characteristics
• Deliver differentiated products and operate at a scale that provides some economies of size.
• Require high levels of performance and trust (including the sharing of critical information).
• Emphasize shared vision and decision making.
• Are committed to the welfare of all chain participants – generally seek to attain higher and more stable prices for producers.

Pay Price Comparison Chart
$16.18
$20.00
$12.21
$11.06
$11.83
$13.39
$12.05
$14.20
$10.57
$13.74
$10.97
$12.07
$14.00
$13.00
$11.89
$18.04
$16.75
$26.55
$24.55
$23.57
$23.75
$24.75
$22.50
$22.00
$14.30
$14.31
$14.43
$15.52
$15.14
$15.81
$15.56
$16.98
$17.10
$17.35
$17.18
$17.53$17.95
$18.20
$18.70
$16.90
$19.81
$12.00
$11.80
$11.88$12.37
$12.71 $12.90
$16.40
$9
$10
$11
$12
$13
$14
$15
$16
$17
$18
$19
$20
$21
$22
$23
$24
$25
$26
$27
1989 1990 1991 1992 1993 1994 1995 1996 1997 1998 1999 2000 2001 2002 2003 2004 2005 2006 2007 2008 2009 2010 2011 2012
CONVENTIONALBASEPAYPRICE-CWT(BasedonannualFMMOaverageblendpriceand2012estimate.)
ORGANICVALLEYBASEPAYPRICE-CWT(Midwest base price at 12.2% solids, with no component or quality premiums.)

“Commodity Price Tsunami”
• Whenever commodity prices go up, grower interest in participating in values –based supply chains goes down

Why they formed; how they operate
•“We formed this cooperative so that the individual ranches could preserve every possible bit of independence.” Doc Hatfield, CNB
•“We are a social experiment disguised as a business.” George Siemon, OV

IV. Other Specialty Food Business Examples…

Survey Results:
Very Important Factors in Choosing Suppliers (% of Firms)• 89%: Quality• 75%: Food safety practices• 65%: Year-round availability• 62%: Price• 59%: Local/regional sources• 40%: Logistics• 30% Stories associated w/ingredients:

Survey Results:
Benefits
0 10 20 30 40 50 60 70 80 90 100
Certifications
Source of Differentiation
Strong Marketing Messages
Flexibility in Logistics
Ease of Communication
Traceability
Reliability
Trust
Quality Assurance
Percent
Major Benefits of Purchasing from Known Farms
Can Identify Farms Cannot Identify Farms
Biggest differences

Survey Results:
Obstacles
0 10 20 30 40 50 60 70 80 90 100
Difficulty of Communication
Lack of Certifications
Lack of Flexibility in Logistics
Poor Quality Assurance
Lack of Trust
Liability Concerns
Unreliable Supply
Inability to Meet Volume
Inability - Food Safety
Cost
Inability - Year-Round Supply
Percent
Major Obstacles to Purchasing from Known Farms
Can Identify Farms Cannot Identify Farms
Few obstacles are noted by those already purchasing

Survey Results:
Where Are Products Sold?
Local25%
State-Wide7%
Regional33%
National24%
International11%
Scope of Retail Distribution
68% beyond state distribution


A Way to Market These Products
• “Food from Somewhere” (FFS) seeks to distinguish itself from “Food from Nowhere”
• FFS provides both traceability and also the possibility of staking out a claim of excellence
• “Local” is a subcategory of FFS

Survey Results:
Ingredient Purchases
Vertical Integration22%
Formal Contract23%
Informal Commitment
32%
Open Market Purchase
23%
Relationship with Principal Suppliers
Long-term relationships are typical
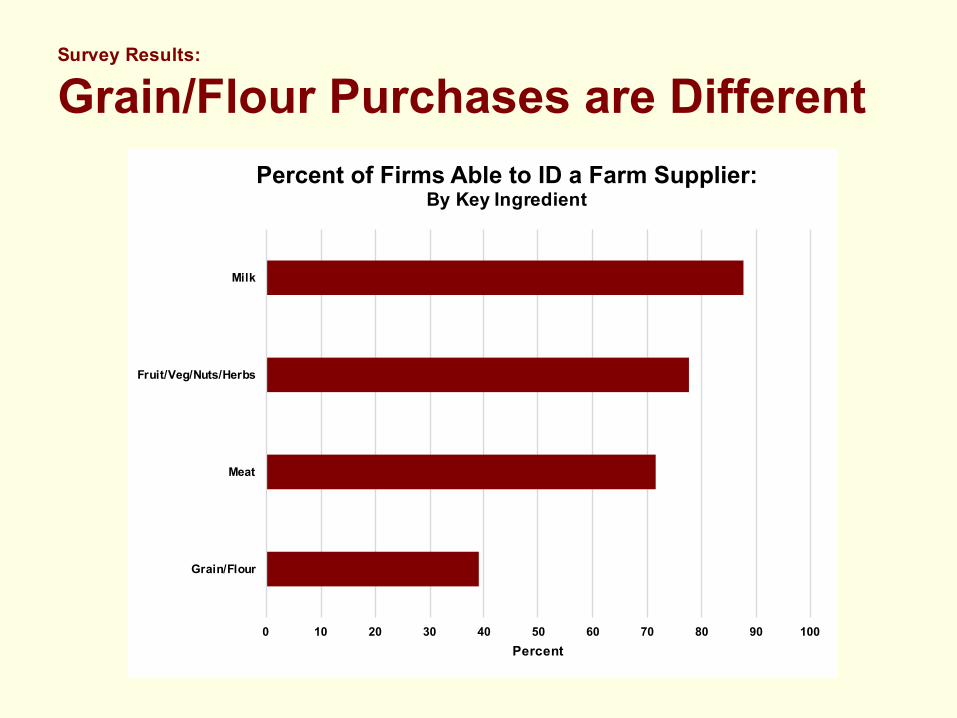
Survey Results:
Grain/Flour Purchases are Different
0 10 20 30 40 50 60 70 80 90 100
Grain/Flour
Meat
Fruit/Veg/Nuts/Herbs
Milk
Percent
Percent of Firms Able to ID a Farm Supplier: By Key Ingredient
