the economics of water harvesting and supplementary irrigation in the semi-arid tropics of india
TRANSCRIPT

Agricultural Systems 36 (1991 ) 207-220
• , i [ '" ,
The Economics of Water Harvesting and Supplementary Irrigation in the Semi-Arid Tropics of India
Sushil Pandey
Department of Agricultural Economics, The University of New England, Armidale, New South Wales 2351, Australia
(Received 30 July 1990; accepted 14 November 1990)
A B S T R A C T
A weather-driven bioeconomic simulation model & developed to evaluate the economic feasibility of water harvesting and supplementary irrigation in the semi-arid tropics o.1" India. Water harvesting was found to be economically feasible under the alternative assumptions of risk neutrality and risk aversion. For the proposed system, the critical parameters determining its economic feasibility were ident([ied as the probability of a successful dry season crop without irrigation and the seepage rate. The successful implementation of the scheme in the Indian context requires cooperation among the farmers.
INTRODUCTION
Water harvesting is the process of collecting water from prepared catchments for beneficial use. It consists basically of two components, viz the collection of water from or within the catchment and its storage for future use. Although the phrase 'water harvesting' is of relatively recent origin, the practise is at least 4000 years old (Myers, 1975). It is currently practised in different forms in the semi-arid regions of Australia, the United States, Middle East and the Indian subcontinent, where natural precipitation is inadequate and no other cheap source of water is available (Kerr, 1989).
The water harvesting system that is being examined in this paper is one of 207
Agricultural Systems 0308-521X/91/$03-50 © 1991 Elsevier Science Publishers Ltd, England. Printed in Great Britain

208 Sushil Pandey
the components of an improved cropping technology developed by the International Crops Research Institute for the Semi-Arid Tropics (ICRISAT). The improved technology is designed to facilitate double cropping in those regions of the Indian Semi-Arid Tropics (SAT) in which farms are cropped only in the dry season. The technology is appropriate to areas with deep Vertisol soil type having an average annual rainfall of over 750mm (Ryan et al., 1982). These areas are traditionally fallowed in the rainy season due to the lack of appropriate land and water management techniques. The distinctive feature of the proposed technology is that it is based on natural watersheds (of size 5-10 ha) instead of the individual farm as the basic production unit. Land management techniques have been designed to improve the workability of the soil, to increase the infiltration of rain water and to drain out safely any excess water. An important complementary component is the harvesting and storage of any excess water within these watersheds for subsequent use during periods when crops can respond favourably to supplementary irrigation. The stored water may also be used to irrigate the subsequent dry season crops.
The objective of this paper is to evaluate the economic feasibility of the water harvesting component of the overall technological package. A modelling approach is adopted because modelling permits evaluation of the system's performance over a wide range of stochastic regimes and the identification of critical parameters determining the system's feasibility without requiring a considerably long period of real-world experimentation. The model is applied to the Raisen district, Madhya Pradesh, India. More than 80% of the land is fallowed in the rainy season in this district. Wheat is the most common crop grown in the following dry season. Soybeans are the most appropriate rainy season crop in this district because they can perform well even under conditions of excessive moisture and fit well in the double cropping system in which wheat is the second crop.
AN ECONOMIC MODEL
The payoff from a system of water harvesting and supplementary irrigation (WHSI) depends on the amount of runoff available, plant response to water and the prices of various inputs and outputs. As illustrated in Fig. 1, the system consists of a catchment area (CA) from which runoff is collected into a dugout pond (called tank henceforth) and a command area (CM), which is irrigated by water collected in the tank. The sum of CA, CM and the area occupied by the tank is the area of watershed (WA).
Total quantity of water available (TW) in tank at time 't' is a function of CA, tank volume (TV), tank geometry (TG), previous withdrawal of water

Economics of water harvesting and supplementary irrigation 209
CatchmentTa A n r k ea
~ Command Area
Fig. 1. A hypothetical watershed.
from the tank (PWTDR) , rainfall pattern (RF), evaporation (EO), land management factors (LM), and seepage rate (SR)
TW = f(CA, TV, TG, PWTDR, RF, EO, LM, SR, u) (1)
where, u is the random error term. Per unit water availability (W) in the command area is
W = T W / C M (2)
Yield response to irrigation is given by function 'g'
Y = g(ID, exogenous factors, e) (13)
where Y is yield, ID is irrigation depth (ID <_ W), exogenous factors include all other factors determining yield and 'e' is the random error.
Total cost of irrigation (COST) is given as
C O S T = O(TW)+ 49(ID)CM 114)
where ~ is a function for calculating the cost of water stored. This includes the cost of the tank and associated land management costs. The function 49 represents the cost of water application. It includes the fuel cost of pumping water out of the tank and the associated labour costs.
The net return (NR) from W H S I is given by
N R = [ Py Y - 49( W) ] C M - qI( T W ) (5)
where, Pv is the price of the output.
210 Sushil Pandey
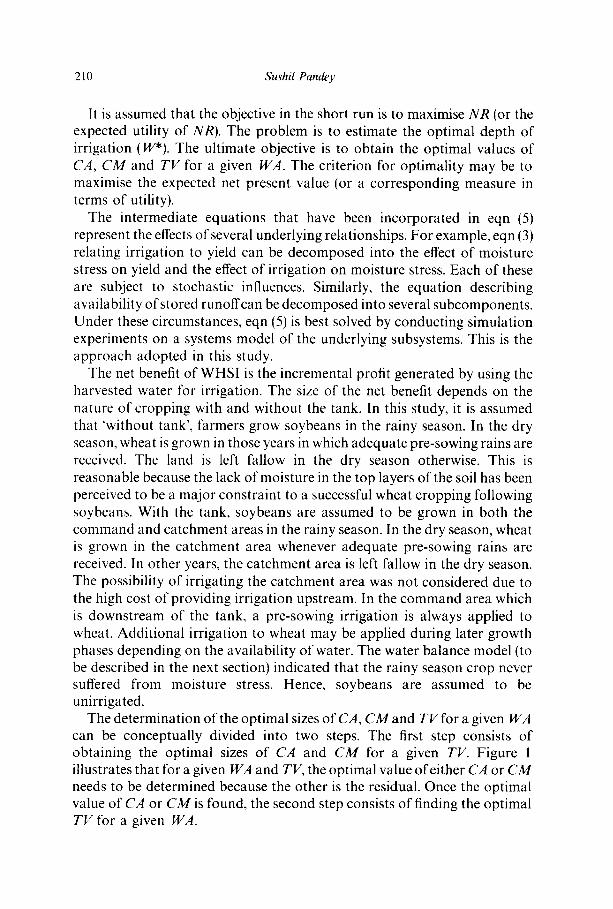
It is assumed that the objective in the short run is to maximise NR (or the expected utility of NR). The problem is to estimate the optimal depth of irrigation (W*). The ultimate objective is to obtain the optimal values of CA, CM and TV for a given WA. The criterion for optimality may be to maximise the expected net present value (or a corresponding measure in terms of utility).
The intermediate equations that have been incorporated in eqn (5) represent the effects of several underlying relationships. For example, eqn (3) relating irrigation to yield can be decomposed into the effect of moisture stress on yield and the effect of irrigation on moisture stress. Each of these are subject to stochastic influences. Similarly, the equation describing availability of stored runoffcan be decomposed into several subcomponents. Under these circumstances, eqn (5) is best solved by conducting simulation experiments on a systems model of the underlying subsystems. This is the approach adopted in this study.
The net benefit of WHSI is the incremental profit generated by using the harvested water for irrigation. The size of the net benefit depends on the nature of cropping with and without the tank. In this study, it is assumed that 'without tank', farmers grow soybeans in the rainy season. In the dry season, wheat is grown in those years in which adequate pre-sowing rains are received. The land is left fallow in the dry season otherwise. This is reasonable because the lack of moisture in the top layers of the soil has been perceived to be a major constraint to a successful wheat cropping following soybeans. With the tank, soybeans are assumed to be grown in both the command and catchment areas in the rainy season. In the dry season, wheal is grown in the catchment area whenever adequate pre-sowing rains are received. In other years, the catchment area is left fallow in the dry season. The possibility of irrigating the catchment area was not considered due to the high cost of providing irrigation upstream. In the command area which is downstream of the tank, a pre-sowing irrigation is always applied to wheat. Additional irrigation to wheat may be applied during later growth phases depending on the availability of water. The water balance model (to be described in the next section) indicated that the rainy season crop never suffered from moisture stress. Hence, soybeans are assumed to be unirrigated.
The determination of the optimal sizes of CA, CM and TV for a given WA can be conceptually divided into two steps. The first step consists of obtaining the optimal sizes of CA and CM for a given TV. Figure 1 illustrates that for a given WA and TV, the optimal value of either CA or CM needs to be determined because the other is the residual. Once the optimal value of CA or CM is found, the second step consists of finding the optimal TV for a given WA.

Economics of water harvesting and supplementary irrigation 211
DEVELOPMENT OF THE SIMULATION MODEL
The overall model consists of biophysical and economic submodels. The biophysical component consists of submodels describing the yield response to irrigation, the soil water balance, the rainfall runoff relationship and the rainfall and pan evaporation predictor. The economic component consists of the submodels for price forecasting and decision making.
Biophysical submodel
Following the literature (Vaux & Pruitt, 1983), yield response to irrigation was modelled as consisting of two components; the effect of moisture stress on yield and the effect of irrigation on moisture stress. The moisture stress is defined as the ratio of actual evapotranspiration to the potential evapotranspiration. A soil water balance model is required to predict the actual evapotranspiration. The evapotranspiration model developed by Ritchie (1972) was adapted and calibrated to the study area. The soil profile was divided into six layers with different moisture holding capacities. Based on the daily values of soil moisture content, the root depth, crop coefficient and the pan evaporation, the model predicts daily evapotranspiration.
The soil water balance model consists of an accounting identity. Effective rainfall and irrigation add to the soil moisture and evapotranspiration and percolation beyond the root zone deplete the soil moisture. The model updates the soil moisture content daily.
An evapotranspiration-based yield response to moisture stress was estimated for wheat. The model was specified as
Y = Y * H , ( E T / P E T ) ~ ' exp (e) (6)
where Y and Y* are actual yield and the yield in the absence of moisture stress, respectively, E T and P E T are the actual and potential evapo- transpirations, respectively, and 2 and 'i' are parameters and growth stage indices, respectively.
The 2 parameters in eqn (6) measure the elasticity of output with respect to moisture stress at different growth stages. The growth period of wheat was divided into four stages, viz sowing to ear initiation (65 days), ear initiation to flowering (10 days), flowering to soft dough (25 days) and soft dough to harvest (25 days). This classification of the growth stage was obtained from a local agronomist. Experimental data generated by Tomar et al. (1981) in conjunction with the water balance model was used to predict the actual evapotranspiration at different growth phases. The estimated values of 23 and 24 were 0-3 and 0.37, respectively. Both coefficients were statistically significant at the 5% level. The coefficients of the first two growth stages

212 Sushil Pandey
could not be estimated from the data used because both these stages never suffered from moisture stress during the experimental periods.
Surface runoff was predicted using a modified USDA runoff curve model (Pathak et al., 1984). In contrast to the original USDA model which is based on the prediction of the discrete runoff curve number, the modified model allows for a continuous change in the runoffgeneration potential depending on the antecedent soil moisture conditions. The model includes empirical adjustments for: (a) land smoothness effect caused by earlier rainfall, (b) the formation of micro-cracks on the surface of drying soils causing reduced runoff, and (c) the formation of deep cracks in very dry soils. The model requires daily input of rainfall and when linked with the soil water balance model discussed above, can be used to predict the daily values of runoff generated from a unit area of catchment.
The geometry and the design of tank determines its cost and loss of stored water through evaporation and seepage. Although many different designs are possible, only dug-out tanks of square or rectangular shape are considered here. The slope of the wall, the depth and the volume are the three parameters which describe these tank designs. On the basis of the design of some of the experimental tanks at ICRISAT, the slope of the walls and the maximum depth were assumed to be 1.5:1 and 3 m, respectively.
A tank water balance accounting submodel was developed to update the storage of water in the tank on a daily basis. The addition to tank water consists of direct precipitation and runoff from catchment. Water from the tank is lost through seepage, evaporation and irrigation withdrawals.
The submodel describing climate consists of rainfall and pan evaporation predictors. Instead of developing a statistical predictor, historical record of daily rainfall and pan evaporation were directly used to drive the simulation model. Daily records for 30 years for Begumgunj in the Raisen district were employed.
Each of the biophysical components were validated for the study region by using the available experimental data. The rainfall-runoff model was validated by Pathak et al. (1984). The soil water balance model was validated by comparing the predicted soil moisture content over time with the experimental records. The yield response model was similarly validated. The details of the validation exercise can be found in Pandey (1986). The main problem encountered in the validation exercise was the lack of detailed experimental data for a sufficient length of time.
Economic submodel
An irrigation tank is a durable asset providing a stream of benefits for several years. The maximisation of net present value of all benefits and cost streams throughout the life of the durable asset is a relevant decision

Economies of water harvesting and supplementary irrigation 213
criterion. Under risk-neutrality, farmers are assumed to maximise the expected net present value. In the case of non-neutral attitude to risk, a decision theoretic approach is to assume that the decision makers maximise expected utility. Investment evaluation under uncertainty requires a multidimensional utility appraisal (Dillon & Perry, 1977) because the outcomes have both time and risk profiles. Using some simplifying assumptions discussed by Meyer (1976), this general approach is equivalent to the maximisation of the utility of net present value. This is the decision criterion used in the case of analysis for risk-averse farmers.
In the analysis for risk-neutral farmers, all stochastic variables such as yield, price, etc., are represented in the model by their mean values, account being taken of the covariances where relevant. On the other hand, under risk aversion, the complete specification of the probability distribution function is required. In the present study, the distribution of all prices and yields are assumed to be stationary. Statistical analysis of the historical output price data indicated that the real prices of both soybeans and wheat are stationary and can be reasonably approximated by normal distributions.
The yield distributions are assumed to be approximately normal. Although the assumption of normality can not be valid in the strict sense because yields are always non-negative, it is used as a pragmatic and probably reasonable approximation.
The probability distribution of yield of unirrigated wheat was estimated from the historical data. In the case of irrigated wheat, yields were first predicted using the estimated yield response model in conjunction with the soil water balance model. The generated data were used to estimate the mean and variance of yields. In the case of the soybeans, yield data tbr three years of on-farm experiments were available. The complete probability distribution of soybeans was estimated by applying the sparse data rule (Anderson et al., 1977) and hand smoothing of the resulting cumulative probability distribution. For stochastic analysis, random samples were drawn from the respective price and yield distributions.
The net returns of various crops were estimated as the gross returns minus the cost of all variable inputs which included the cost of irrigation, fertiliser, seed and hired labour. The cost of irrigation includes the cost of applying water (Rs 1-5/ha mm) and the set up cost (Rs 10/irrigation). The fixed costs are the cost of the tank and the cost of watershed development. These costs were obtained from experimental watersheds. Both the cost of the tank and the watershed vary with their size.
Irrigation decision rule
The water balance model indicated that wheat following soybeans can be successfully established in 1 out of 3 years. In the remaining 2 years, wheat

214 Sushil Pandey
could not be successfully established because the top 15 cm of soil layer was too dry at the time of sowing wheat. Thus it was assumed that in these 2 out of 3 years, wheat is planted only in the area that could be irrigated by water stored in the tank. The depth of the pre-sowing irrigation was fixed at 5 cm and an irrigation efficiency of 80% was assumed.t If the volume of stored water was inadequate to irrigate the whole of the command area, wheat is assumed to be grown only in the irrigated portion with the unirrigated portion being left fallow. If excess water is in storage after providing a pre- sowing irrigation to the whole of the command area, additional irrigation was provided whenever the soil moisture content .in the root zone dropped below 80% of the maximum moisture holding capacity. This rule was considered appropriate because simulation experiments indicated that net returns are maximised under this rule.
M O D E L E X P E R I M E N T A T I O N A N D R E S U L T S
All submodels described above were linked together to form a simulation model of the overall system (Fig. 2). The simulation model was written in F O R T R A N and consisted of a main program and 12 subroutines.
Simulation experiments were conducted on a 5ha watershed at three seepage rates. A 5 x 5 factorial experiment on the tank size and the command area was specified. The present value 'with tank' was calculated by running the simulation model at each grid point for 30 years of weather record. The life of the tank was assumed to be 30 years and a discount rate of 10% was used. The difference in the expected net present value between 'with tank' and 'without tank' situations is the measure of the benefits resulting from the tank. A quadratic response surface was fitted to the resulting data and the optimal values for the tank size and the command area were obtained by solving the first order conditions for maximisation. The results are presented in Table 1.
The results indicate that the optimal tank size is insensitive to changes in seepage rate but the optimal size of the command area decreases with an increase in seepage rate. The ratio of the command area to the area of the watershed also decreased from 81% for a zero seepage rate to 66% for the seepage rate of 20 mm/day. This is expected because a larger catchment area is required for having a certain quantity of water in storage if the seepage rate is higher. Also with an increase in seepage rate, the area that can be
t Although the problem was formulated earlier in terms of finding the optimal design parameters and the optimal irrigation depth, a fixed irrigation depth is assumed because the gravity flow system of irrigation practised in the study restricts the manipulation of irrigation depth.

Economics of water harvesting and supplementary irrigation 215
Daily Climatic Data
Crop Coefficient
Model
I Runoff ~ Soil Water L.,. Irrigation I [Balance Modelp I Model Dec sion Rue
T a n k W a t e r [ . . . . . . . . . . . . . . . . . . . . . . . . . . . . . . . . . . . [Ba ance M o d e l ] . . . . . . . . . . . . . . . . . . .
I Evap°tra~:~lrati°n I
[ Resp~ine:: M°de' I
I oono=OoO ' 1 Fig. 2. Schematic flow diagram of the simulation model.
irrigated at a particular point in time is likely to contract. These two tendencies reinforce each other in increasing the ratio of catchment to the command area for a given watershed.
An isoquant map of present values obtained from the simulation output for the seepage rate of 10mm/day is shown in Fig. 3. The isoquant map indicates that the response to an increase in command area beyond the optimal value is very steep. On the other hand, as long as the tank size is
TABLE 1 Optimal Values of Design Parameters for a 5 ha Watershed
Seepage rate
(mm/day)
Optimal size o[ Optimal tank Optimal incremental command area size present value
(ha) (ha mm) ( Rs "000)
0 4'05 346 49 10 3.66 337 21 20 3"30 36b 3

216
Fig. 3.
4.75
4.25-
Command Area (ha)
3.75
3.25
2.75
Sushil Pande y
100 200 30o 400 500
Tank size (ha mm)
Isoquant map of present values evaluated at the seepage rate of 10mm/'day.
above 200 ha mm, the response to a change in tank size is moderate. These observations indicate that the profitability of tank depends more on the precise determination of the size of the command area (or the location of tank) than on the size of the tank. Also, it is safer to err on the side of over sizing than under sizing the tank.
Benefits from seepage control
The results presented earlier indicate that both the optimal values of the design parameters as well as the net present value depend on the seepage rate. The obvious question then is what is the benefit from seepage control. The benefits can be estimated at two levels. First, at the planning stage when only the size of the watershed is known, the optimal ratio of the command to catchment areas as well as the tank size vary with the change in seepage rate. Thus the benefit from seepage control is the incremental present value when all these parameters are allowed to adjust as seepage reduction is contemplated. Secondly, when a tank is already constructed at a given location in the watershed, the flexibility of changing the design parameters
Economies o f water harvesting and supplementary irrigation
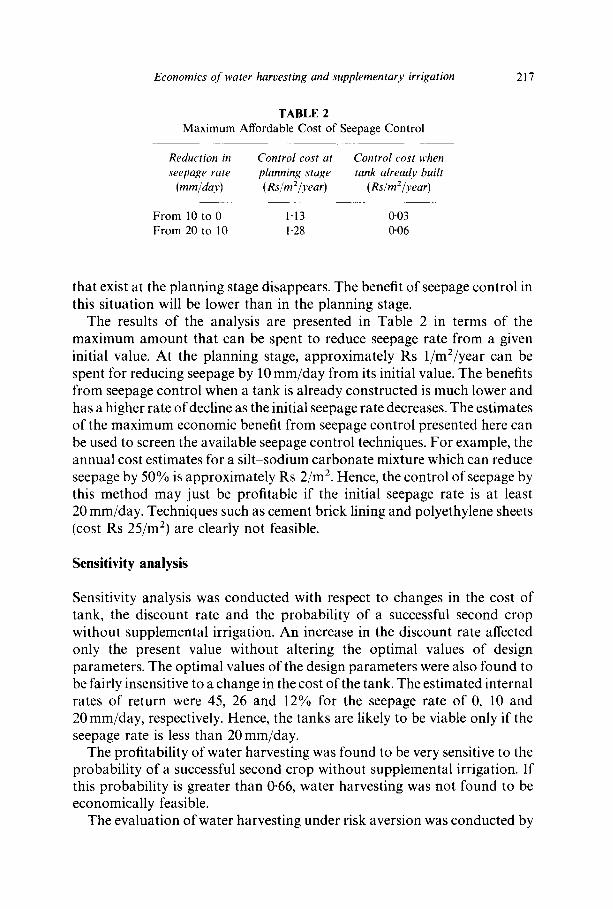
TABLE 2 Maximum Affordable Cost of Seepage Control
Reduction in Control cost at Control cost when seepage rate planning stage tank already built
(ram~day) (Rs/mZ/year) (Rs/m2/year)
From 10 to 0 1-13 0'03 From 20 to 10 1"28 0"06
217
that exist at the planning stage disappears. The benefit of seepage control in this situation will be lower than in the planning stage.
The results of the analysis are presented in Table 2 in terms of the maximum amount that can be spent to reduce seepage rate from a given initial value. At the planning stage, approximately Rs 1/m2/year can be spent for reducing seepage by 10 mm/day from its initial value. The benefits from seepage control when a tank is already constructed is much lower and has a higher rate of decline as the initial seepage rate decreases. The estimates of the maximum economic benefit from seepage control presented here can be used to screen the available seepage control techniques. For example, the annual cost estimates for a silt-sodium carbonate mixture which can reduce seepage by 50% is approximately Rs 2/m 2. Hence, the control of seepage by this method may just be profitable if the initial seepage rate is at least 20 mm/day. Techniques such as cement brick lining and polyethylene sheets (cost Rs 25/m 2) are clearly not feasible.
Sensitivity analysis
Sensitivity analysis was conducted with respect to changes in the cost of tank, the discount rate and the probability of a successful second crop without supplemental irrigation. An increase in the discount rate affected only the present value without altering the optimal values of design parameters. The optimal values of the design parameters were also found to be fairly insensitive to a change in the cost of the tank. The estimated internal rates of return were 45, 26 and 12% for the seepage rate of 0, 10 and 20 mm/day, respectively. Hence, the tanks are likely to be viable only if the seepage rate is less than 20 mm/day.
The profitability of water harvesting was found to be very sensitive to the probability of a successful second crop without supplemental irrigation. If this probability is greater than 0.66, water harvesting was not found to be economically feasible.
The evaluation of water harvesting under risk aversion was conducted by

218 Sushil Pandey
using Pratt's second order approximation (Pratt, 1964) to the certainty equivalent as shown in eqn (7).
CE =/~ - 0"5~r (7)
where CE is the certainty equivalent, # is the mean net present value, e is the coefficient of absolute risk aversion and a is the variance of net present value.
The mean and the variance of present value for both the with tank and without tank situations were obtained by Monte-Car lo sampling. The coefficient of absolute risk aversion for Indian farmers has been estimated by Pandey (1986) to be 4 x 10 -4". This value was used for calculating the certainty equivalents. The incremental certainty equivalents with tank were estimated at all grid points of a 5 x 5 factorial experiment and the optimal values of the design parameters calculated as in the case of the risk- neutrality. The optimal values of the design parameters were very similar. The tanks were found to be economically viable with their incremental certainty equivalents only slightly lower than the incremental expected net present values. The results indicate that the risk factors are seemingly not important enough to affect the desirability of tanks.
S U M M A R Y A N D CONCLUSIONS
A systems model was developed to evaluate the economic feasibility of water harvesting and supplementary irrigation which is a complementary component of an improved technological package developed at ICRISAT for the semi-arid tropics of India. The overall model consisted of a soil water balance model, a yield response model to moisture stress, a tank water balance model, a rainfall runoff model and a model of decision making. Most of the biological submodels were semi-empirical.
The results indicate that for the cropping patterns examined, water harvesting is economically attractive in the deep Vertisol regions which are fallowed in the rainy season and which have an average annual rainfall higher than 750 mm. When a rainy season crop is grown in these regions, the following dry season crop cannot be successfully established in two out of three years because the upper soil layers become too dry at the sowing time of the subsequent crop. When harvested water is available, farmers can successfully grow a second crop in these years. Irrigation may also be applied during the later growth phases of the second crop so as to achieve a higher yield.
The optimal ratio of the catchment to the commana area was found to depend on the assumed seepage rate, with the ratio increasing with an increase in seepage rate. With a zero seepage rate, the optimal ratio was

Economics of water harvesting and supplementary irrigation 219
found to be approximately 1:4. For a 5 ha watershed, the optimal tank size was approximately 300 ha mm. It was also found that the return from water harvesting is more sensitive to the location of tank than the size of the tank. Water harvesting was also found to be attractive both under the alternative assumptions of risk neutrality and risk aversion.
Two critical factors determining the feasibility of water harvesting are the probability of a successful second crop in the absence of irrigation and the seepage rate. If the probability of a successful second crop increases from 0.33 to 0.66, water harvesting is not economically feasible. Similarly, if the seepage rate is more than 20 mm/day, water harvesting is not feasible. Thus, the attractiveness of water harvesting is seemingly highly location specific.
In those regions in which water harvesting is technically and economically feasible, strong commitment and cooperation from the farmers are required for successful implementation of the scheme. The concept can be implemented when farmers in the watershed are willing to cooperate with each other to share the benefits and costs of the scheme. In the Indian context, where average farm size is very small, several farmers will have to make cooperative decisions on the management of their land as a single watershed and the distribution of water. Asymmetry arises in the distribution of benefits because farmers owning the catchment do not get direct economic gains from the harvested water. Farmers in the command area, who benefit from the harvested water, may need to somehow compensate the upstream catchment farmers. Such cooperative efforts are likely to be successful only when the farmers involved are socially and economically homogeneous (Olson, 1965). Otherwise, water harvesting is likely to be feasible only to large farmers who have adequate land to operate it as a watershed.
A C K N O W L E D G M E N T S
Funding from the University of New England and the International Crops Research Institute for the Semi-Arid Tropics, India, is gratefully acknowledged. The author is thankful to Jock Anderson, Jim Ryan, Brian Hardaker and Tom Walker for their assistance.
REFERENCES
Anderson, J. R., Dillon, J. L. & Hardaker, J. B. (1977). Agricultural Decision Analysis. Iowa State University Press, Ames, Iowa, 344pp.
Dillon, J. L. & Perry, C. (1977). Multiattribute utility theory: multiple objectives and uncertainty in ex ante project evaluation. Review of Marketing and Agricultural Economics, 45, 3-27.
220 Sushil Pandey
Kerr, C. (1989). Community Water Development. Intermediate Technology Publications, London, 302 pp.
Meyer, R. F. (1976). Preferences over time. In Decisions with Multiple Objectives: Preferences and Value Tradeoffs, eds R. L. Keeney & H. Raiffa. John Wiley and Sons, New York, 473-512.
Myers, L. E. (1975). Water harvesting: 2000 BC to 1974 AD. Proceedings of the Water Harvesting Symposium, Phoenix, Arizona, US Dept of Agriculture, Report no. ARS W-22, 1-7.
Oison, M. (1965). The Logic of Collective Action. Harvard University Press, Cambridge, Mass., 186 pp.
Pandey, S. (1986). Economics of water harvesting and supplementary irrigation in the semi-arid tropics of India: a systems approach. Unpublished Ph.D. thesis, University of New England, Armidale, 312 pp.
Pathak, P., Murty, V. V. N., El-Swaify, S. A., Singh, S. & Sudi, R. (1984). Runoff model for small semi-arid watersheds. Paper presented at the 21st Annual Convention of the Indian Society of Agricultural Engineers, Indian Agricultural Research Institute, New Delhi.
Pratt, J. (1964). Risk aversion in the small and the large. Econometrica, 3, 122-36. Ritchie, J. T. (1972). Model for predicting evapotranspiration from a row crop with
incomplete cover. Water Resources Research, 8, 1204-13. Ryan, J. G., Virmani, S. M. & Swindale, L. D. (1982). Potential technologies for deep
black soils in relatively dependent rainfall regions of India. Paper presented at the Seminar on Innovative Technologies for Integrated Rural Development organised by the Indian Bank, New Delhi.
Tomar, S. S., Gupta, R. K. & Tomar, A. S. (1981). Water Management of wheat in heavy clay soils of Madhya Pradesh. Indian Journal of Agricultural Science, 51, 493 7.
Vaux, H. J. & Pruitt, W. O. (1983). Crop-water production functions. Advances in Irrigation, 2, 61-97.