the economics of smallholder maize production in zimbabwe
TRANSCRIPT
MSU International Development Papers
The Economics of Smallholder MaizeProduction in Zimbabwe:Implications for Food Security
by
David D. Rohrbach
I
I!II,!,~.,
l~~i
i,i
f',
MSl! International Development
Paper No. II
19119
Department of Agricultural Economics
Michigan State University
East Lansing, Michigan 48824
Department of Agricultural
Economics and Extension
University of Zimhahwe
P.O. Box MP 167
Harare, Zimhahwe
MSU INTERNATIONAL DEVELOPMENT PAPERS
Carl K. Eicher, Carl Liedholm, and Michael T. WeberEditors
The MSU International Development Paper series is designed to further thecomparative analysis of international development activities in Africa, LatinAmerica, Asia, and the Near East. The papers report research findings onhistorical, as well as contemporary, international development problems. Theseries includes papers on a wide range of topics, such as alternative ruraldevelopment strategies; nonfarm employment and small scale industry; housingand construction; farming and marketing systems; food and nutrition policyanalysis; economics of rice production in West Africa; technological change,employment, and income distribution; computer techniques for farm andmarketing surveys; farming systems and food security research.
The papers are aimed at teachers, researchers, policy makers, donoragencies, and international development practitioners. Selected papers willbe translated into French and Spanish.
Individuals and institutions in Third World countries may receive singlecopies free of charge. See inside back cover for a list of available papersand their prices. For more information, write to:
MSU International Development PapersDepartment of Agricultural EconomicsAgriculture HallMichigan State UniversityEast Lansing, Michigan 48824-1039U.S.A.
I!
I
j
I~"r,ff:f
I,~ii
. fi 'I fI .I

THE ECONOMICS OF SMALLHOLDER MAIZE PRODUCTION IN ZIMBABWE:IMPLICATIONS FOR FOOD SECURITY
by
David D. Rohrbach
This paper is published by the Department of Agricultural Economics, MichiganState University (MSU), in collaboration with the Department of AgriculturalEconomics and Extension, University of Zimbabwe, under Food Security in AfricaCooperative Agreement DAN-1190-A-OO-4092-00, jointly funded by the Bureau ofScience and Technology (Office of Rural and Institutional Development), theAfrica Bureau (Office of Technical Resources), U.S. Agency for InternationalDevelopment, Washington, DC, and the Southern Africa Regional Office of theUSAID/Zimbabwe Mission.

ISSN 0731-3438
<E) All rights reserved by Michigan State University, 1989.
Michigan State University agrees to and does hereby grant to the United StatesGovernment a royalty-free, nonexclusive and irrevocable license throughout theworld to use, duplicate, disclose, or dispose of this publication in anymanner and for any purposes and to permit others to do so.
Published jointly by the Department of Agricultural Economics, Michigan StateUniversity, East lansing, Michigan 48824-1039 U.S.A., and by the Departmentof Agricultural Economics and Extension, University of Zimbabwe, Harare,
I!
THE ECONOMICS OF SMALLHOLDER MAIZE PRODUCTION IN ZIMBABWE:IMPLICATIONS FOR FOOD SECURITY
TABLE OF CONTENTS
Chapter Page
LIST OF FIGURES............................................. v
LIST OF TABLES.............................................. vi i
PREFACE..................................................... ix
ACKNOWLEDGEMENTS. . . . . . . . . . . . . . . . . . . . . . . . . . . . . . . . . . . . . . . . . . . . xi
I. INTRODUCTION. . . . . . . . . . . . . . . . . . . . . . . . . . . . . . . . . . . . . . . . . . . . . . . . 1A. The Pol icy Context................................... 2B. Smallholder Production and Food Security............. 3C. Data Collection...................................... 4D. Quality of Aggregate Production Data................. 6E. Chapter Overview..................................... 7
II. TRENDS IN SMALLHOLDER MAIZE PRODUCTION AND MARKETING:1970-1986................................................... 8
A. Maize Production Trends.............................. 8B. Trends in Maize Sales................................ 11C. Maize Stocks......................................... 13D. Location of Maize Growth............................. 14E. Smallholder Crop Substitution........................ 15F. Food Security Implications..................... ...... 16
III. SOURCES OF GROWTH OF SMALLHOLDER PRODUCTION AND SALES....... 18A. Pre - Independence. . . . . . . . . . . . . . . . . . . . . . . . . . . . . . . . . . . . . 18B. Ending of the War.................................... 19C. Relative Maize Prices................................ 20
I. Real Producer Prices.......................... 202. Relative Producer Prices...................... 213. Producer-to-Consumer Price Ratio.............. 224. Producer-to-Input Price Ratios................ 22
D. Credit............................................... 23E. Fertilizer and Seed Deliveries....................... 24F. Research and Extension............................... 25G. Market Expansion..................................... 27
I. Product Markets............................... 272. Input Markets................................. 30
H. Rainfall............................................. 30I. Summary of Sources of Growth......................... 31
iii
II
r
LI ST OF FI GURES
Figure
1 Mangwende and Chivi Survey Areas, Zimbabwe.................. 5
2 Zimbabwe Maize Production, 1970-1987........................ 9
3 Zimbabwe Maize Area by Farm Sector, 1970-1987............... 10
4 Zimbabwe Maize Yields by Farm Sector, 1970-1987............. 10
5 Zimbabwe Maize Sales by Farm Sector, 1970-1986.............. 12
6 Zimbabwe Grain Marketing Board Maize Stocks, 1970-1987...... 13
7 Zimbabwe: Real Maize Producer Prices, 1974-1986............. 21
8 Mangwende and Chivi Maize Deliveries to the GrainMarketing Board, 1971-1986............................... 37
9 Zimbabwe: Smallholder Per Capita Coarse Grain Retentions,1970-1986................................................ 54
v
LIST OF TABLES
1 Zimbabwe: Location of Growth of Smallholder MaizeProduction by Province 1977/78 to 1984/85................ 15
2
3
4
Zimbabwe: Smallholder Crop Area Trends 1977-1984(' 000 Hectares).......................................... 16
Zimbabwe: Smallholder Credit Offered by theAgricultural Finance Corporation, 1979-1986.............. 23
Zimbabwe: Hybrid Maize Seed and Fertilizer Deliveriesto Smallholder Farmers, 1974-1985........................ 25
Ir\
II
Zimbabwe: Expansion of Grain Marketing Board BuyingPoints, 1975-1986........................................ 28
6
5
Zimbabwe: Number of Communal Farmers Registered toSell Crops to the Grain Marketing Board, 1979-1986....... 29
7 Zimbabwe: Mangwende and Chi vi Farming Systems.............. 35
I\
Zimbabwe: Distribution of Maize Sales in Mangwende andChivi, 1984/85 and 1985/86 Cropping Seasons............ 39
Zimbabwe: Distribution of Maize Production in Mangwendeand Chivi, 1984/85 and 1985/86 Cropping Seasons.......... 39
9
8
10 Zimbabwe: Characteristics of Mangwende and ChiviSmallholders by Production System Category, 1984/85.... 42
11 Zimbabwe: Contribution of Agriculture to GDP andEmployment Growth, 1979-1985........................... 59
vii
PREFACE
The research discussed in this paper is one of many accomplishments thathas resulted from a long-term collaborative research project between theFaculty of Agriculture of the University of Zimbabwe (UZ) and the Departmentof Agricultural Economics of the Michigan State University (MSU). The projecthas been financed by the United States Agency for International Development.
Dr. Rohrbach initially worked in Zimbabwe from August 1985 through March1987 as a research associate under the collaborative UZ/MSU project. Aftercompleting his Ph.D. in agricultural economics at Michigan State University,he accepted a position with the International Food Policy Research Institute(IFPRI) and International Crops Research Institute for the Semi-Arid Tropics(ICRISAT) based, again, in Zimbabwe. His current scope of work covers theSouthern African Development Coordination Conference (SADCC) region. Readersinterested in the topics covered in this paper are encouraged to writedirectly to Dr. Rohrbach (SADCC/ICRISAT, P.O. Box 776, Bulawayo, Zimbabwe) orto Dr. Michael Weber (Department of Agricultural Economics, Michigan StateUniversity, East Lansing, MI 48824-1039).
ix
\
II!
IIII,II
II~,
IIIf
t
I[
I

ACKNOWLEDGEMENTS
Many people contributed to make the research underlying this paperpossible. Carl Eicher encouraged the topic choice, provided advisory supportwhile in Zimbabwe and read repeated drafts of all papers resulting. Hiscritiques were extensive. Rick Bernsten provided a great deal of advice andcomment while I was in Michigan. My colleagues at the University of Zimbabwe,including Mandivamba Rukuni, Joseph Rusike, Jane Stanning, and Kay MuirLeresche provided broad insights into the workings of the Zimbabwe agroeconomy and the role of smallholders within this. My research associate,Godswill Makombe, provided selfless assistance with the survey work andpreparation of data for analysis. While working together in the field heprovided interpretations of local custom and practice otherwise unobtainable.Lovemore Nyabako and Maxwell Chiwashira assisted with the initial dataprocessing. Thembi Sibanda and Peter Hopkins helped with fieldwork logistics.This research was funded by the United States Agency for InternationalDevelopment under a cooperative agreement between Michigan State Universityand the University of Zimbabwe.
This paper would not have been possible without the strong support ofMichael Weber, Director of the MSU Food Security Cooperative Agreement. Mikeoffered valuable insights derived from his comparative understanding of foodsecurity issues in West, East and Southern AFrica. These broadly informed theearly data analysis and facilitated the drafting of this report. Tworeviewers, Mandivamba Rukuni and Paul Hiesey contributed thoughtful critiqueand comment. Typing and technical support was provided by Julia McKay.
xi
THE ECONOMICS OF SMALLHOLDER MAIZE PRODUCTION IN ZIMBABWE:IMPLICATIONS FOR FOOD SECURITY
By
David D. Rohrbach
I. INTRODUCTION
Rapid growth in food production is essential to attain food security inSub-Saharan Africa. Since 1970, African food production has been growing atroughly half the rate of growth of population. African food securitystrategies have primarily sought to increase per capita production levels.National food and agricultural policies have emphasized food self-sufficiencygoals. Issues of household level food access have received secondaryattention under the assumption that consumption deficits can only be resolvedafter adequate and stable supplies are assured.
Yet high, and even increasing national food supplies, however important,do not necessarily ensure food for all households or individuals in need. l
Large segments of the population in many countries attaining high levels ofper capita food supply still do not have reliable or nutritionally adequatefood access. The most visible groups encompass the urban poor. But in manycountries, the largest number of food insecure households reside in the ruralareas. Farmers contributing to aggregate production growth have notnecessarily been those suffering the greatest food security constraints. Inmany cases, supplementary strategies, in addition to increasing national foodsupplies, are required to extend food production and income gains to amajority of food insecure households.
ISee Sen (1984), World Bank (1986), Rukuni and Eicher (1987).
1
I
Ii,,\
t
II
I~II

2
This study examines the relationship between food availability and foodaccess in the context of the rapid post-1979 growth of smallholder maizeproduction in Zimbabwe. The analysis is structured to answer three broadquestions. It first assesses why smallholder maize production increased sorapidly and whether this growth is likely to continue. Second, it examinesthe distribution of the production gains and explains differential levels ofparticipation. Third, the study evaluates how much national and householdfood security in Zimbabwe have improved. Finally, options are reviewed forfurther improving smallholder food availability and food access.
A. The Policy ContextBetween 1977-79 and 1985, cereal production in Zimbabwe increased by 80
percent. 2 The production of maize, the country's principal cereal staple3,more than doubled. Following the 1986 harvests, Zimbabwe held 1.8 million MTof maize in national stocks, 3.5 times the highest level achieved during the1970s and almost three times the average annual level of grain marketing boardsales for domestic consumption. As a result, following the 1986/87 drought,the government could mount a large domestic food for work program while stillexporting approximately 500,000 MT of maize to other countries in the region.At the beginning of the 1988 harvest, Zimbabwe still held maize stocks equalto more than one year of domestic sales.
More importantly, the largest share of maize production gains werecontributed by smallholders. These farmers had previously participated onlymarginally in producing maize for the market. During the 1970s, 5,000 to6,000 large-scale commercial farmers delivered over 90 percent of the maizesold in formal sector markets. Approximately 750,000 smallholders4
2See Appendix Table A.l. The sources of the major agricultural sectordata employed in this analysis are in Appendix A.
3Maize accounts for 70 percent of the cereal calories in the average diet(UNFAO, 1981).
4Smallholders were identified before independence in 1980 as Tribal TrustLand (TTL) farmers and thereafter as communal farmers. In this paper, theterms smallholder and communal farmer are used interchangeably. Unlessotherwise specified, the term commercial refers to the combined large andsmall-scale commercial sectors.
I
I
I
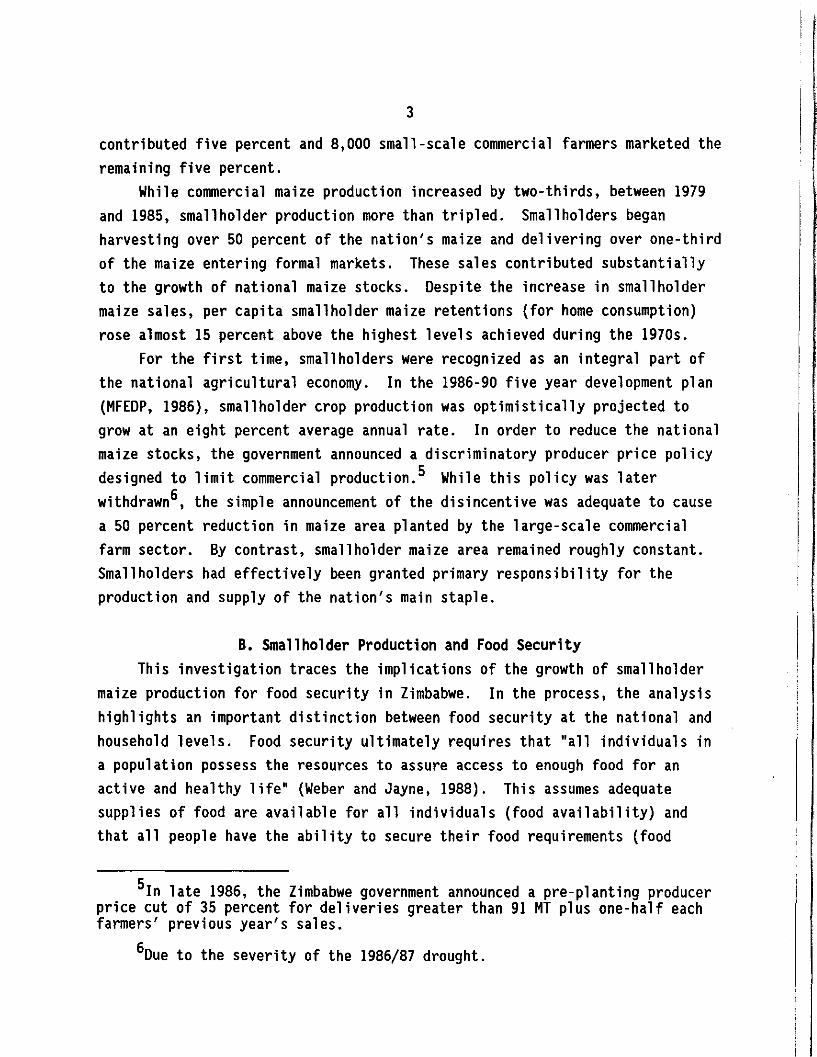
3
contributed five percent and 8,000 small-scale commercial farmers marketed theremaining five percent.
While commercial maize production increased by two-thirds, between 1979and 1985, smallholder production more than tripled. Smallholders beganharvesting over 50 percent of the nation's maize and delivering over one-thirdof the maize entering formal markets. These sales contributed substantiallyto the growth of national maize stocks. Despite the increase in smallholdermaize sales, per capita smallholder maize retentions (for home consumption)rose almost 15 percent above the highest levels achieved during the 1970s.
For the first time, smallholders were recognized as an integral part ofthe national agricultural economy. In the 1986-90 five year development plan(MFEDP, 1986), smallholder crop production was optimistically projected togrow at an eight percent average annual rate. In order to reduce the nationalmaize stocks, the government announced a discriminatory producer price policydesigned to limit commercial production. S While this policy was laterwi thdrawn6, the simple announcement of the disincentive was adequate to causea 50 percent reduction in maize area planted by the large-scale commercialfarm sector. 8y contrast, smallholder maize area remained roughly constant.Smallholders had effectively been granted primary responsibility for theproduction and supply of the nation's main staple.
B. Smallholder Production and Food SecurityThis investigation traces the implications of the growth of smallholder
maize production for food security in Zimbabwe. In the process, the analysishighlights an important distinction between food security at the national andhousehold levels. Food security ultimately requires that "all individuals ina population possess the resources to assure access to enough food for anactive and healthy life" (Weber and Jayne, 1988). This assumes adequatesupplies of food are available for all individuals (food availability) andthat all people have the ability to secure their food requirements (food
SIn late 1986, the Zimbabwe government announced a pre-planting producerprice cut of 35 percent for deliveries greater than 91 MT plus one-half eachfarmers' previous year's sales.
6Due to the severity of the 1986/87 drought.
5
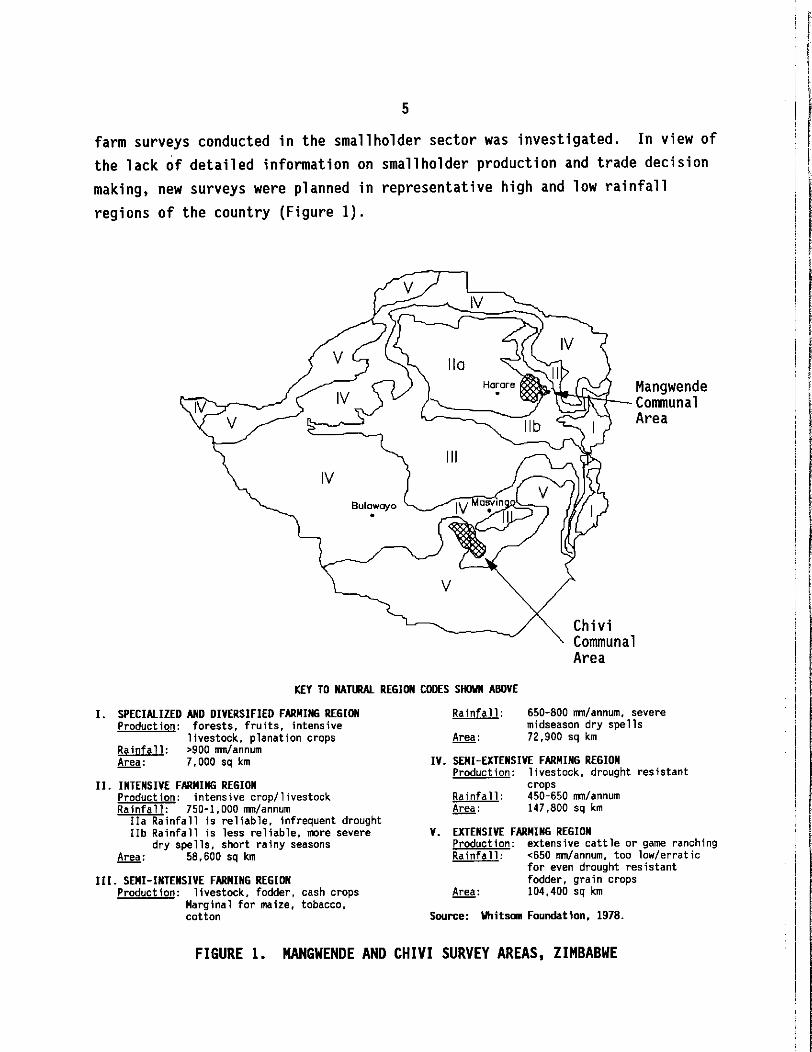
farm surveys conducted in the smallholder sector was investigated. In view ofthe lack of detailed information on smallholder production and trade decisionmaking, new surveys were planned in representative high and low rainfallregions of the country (Figure 1).
II!
II
V
IV
Bulowayo•
III
r'~-\\1~_ MangwendeCommunalArea
II
ChiviCommunalArea
KEY TO NATIIlAL REGIDII CODES SHDIIII ABOVE
IV. SEMI-EXTENSIVE FARMING REGIONProduction: livestock. drought resistant
cropsRainfall: 450-650 mm/annumArea: 147.800 sq km
V. EXTENSIVE FARMING REGIONProduction: extensive cattle or game ranchingRainfall: <650 mm/annum, too low/erratic
for even drought resistantfodder, grain crops
Area: 104.400 sq km
Source: lIhitsllll Foundation. 1978.
I. SPECiAliZED AND DIVERSIFIED FARMING REGIONProduction: forests, fruits, intensive
livestock. planation cropsRainfall: >900 rnm/annumArea: 7.000 sq km
II. INTENSIVE FARMING REGIONProduction: intensive crop/livestockRainfall: 750-1,000 rnm/annum
IIa Rainfall is reliable. infrequent droughtlIb Rainfall is less reliable. more severe
dry spells. short rainy seasonsArea: 58.600 sq km
III. SEMI-INTENSIVE FARMING REGIONProduction: livestock, fodder, cash crops
Marginal for maize, tobacco.cotton
Ra infall:
Area:
650-800 rnm/annum. severemidseason dry spells72.900 sq km
FIGURE 1. MANGWENDE AND CHIVI SURVEY AREAS, ZIMBABWE
6
The survey encompassed six villages in Mangwende, a high potentialsmallholder farming region situated in the northeastern part of the country,and six villages in Chivi, a low potential smallholder farming region in southcentral Zimbabwe (Figure I). Maize was the principal crop grown by allfarmers in each area. Seventeen farmers were interviewed in each village fora total sample of 204 households.
Four major sets of interviews were conducted with each household coveringthe 1984/85 season (by recall), the 1985/86 season and the planting period forthe 1986/87 season. Detailed information was collected on productionpractices, crop marketing, input and credit usage, incomes, majorexpenditures, crop storage and resource ownership. In addition, farmers wereasked to recall major changes in their cropping patterns, technology use andmarketing practices over the previous ten years. Interviews with inputsuppliers, transporters, crop buying agents and extension workers in eachregion provided additional insights on access to agricultural supportservices. 7
D. Quality of Aggregate Production DataThe value of information obtained from the farm level surveys derives in
part from questions regarding the accuracy of nationwide smallholderproduction estimates. While there seems little question that smallholdermaize production increased significantly after 1979, published and unpublishedstatistics indicating the absolute size, location and timing of this gain canonly be viewed as approximations. 8
The magnitude of the potential error in the aggregate production data isindicated by comparing two 1985 estimates of national and provincialsmallholder crop area and yield. 9 While the aggregate maize production
7Further information about the survey composition and procedures can beobtained from Rohrbach (I987).
8These data were generally corroborated by the more accurate statisticsfor crop sales to the Grain Marketing Board. This parastatal acts as the solebuyer of maize moving beyond smallholder district boundaries. They are alsosupported by the results of farm level surveys.
9See Appendix Table A.3.
I!
r
IIt
7
estimates for 1985 differ by only two percent, production estimates vary bymore than 35 percent in five of Zimbabwe's eight provinces. Similardiscrepancies characterize the provincial estimates of maize area and yield.Larger differences appear in the production estimates for more minor crops.
An additional problem is caused by the availability of multipleproduction estimates and difficulties in determining how the final officialcrop production estimates published by the Zimbabwe Central Statistical Office(CSO) are determined. The principal data used to compile these officialestimates were reviewed. 10
The use of official data is further complicated by the fact that theseCSO estimates do not provide a complete breakdown of the production levels ofeach farm sector. Data on millet production, the second most importantsmallholder crop, remain unpublished.
Notwithstanding the above problems, the current analysis has generallyemployed the published national level CSO statistics. In the fewcircumstances where disaggregated statistics have been required, the originalsources of CSO estimates are utilized. Aggregate millet production estimateswere drawn from the FAO (1987) production tapes.
E. Chapter OverviewFirst, the 1970-1986 trends in Zimbabwe's maize production, sales, stocks
and trade are briefly reviewed. Next, the major sources of growth insmallholder maize production are identified. Discussion of the food securityimplications of these findings begins with an assessment of the distributionof smallholder participation in the maize production and sales gains, and areview of factors helping explain this distribution. The food security gainsare then more directly examined with a review of the benefits offeredsmallholders facing production and consumption deficits. Finally, thechallenges facing Zimbabwe to further improve national and household foodsecurity are examined.
10The principal historical source of smallholder production data has beenthe forecasts of extension workers. Beginning in 1985, these were supplementedby Central Statistical Office surveys. These estimates are reviewed andsometimes modified by a Central Statistical Office Crop Forecasting Committee.
,
II,
I,
!I
II. TRENDS IN SMALLHOLDER MAIZE PRODUCTION ANDMARKETING: 1970-1986
This chapter briefly examines the aggregate trends in commercial andsmallholder maize production and market deliveries, and reviews the impact ofthese trends on national food supplies from 1970-1986. It assesses thebreadth of smallholder participation in the growth of sector-wide production.
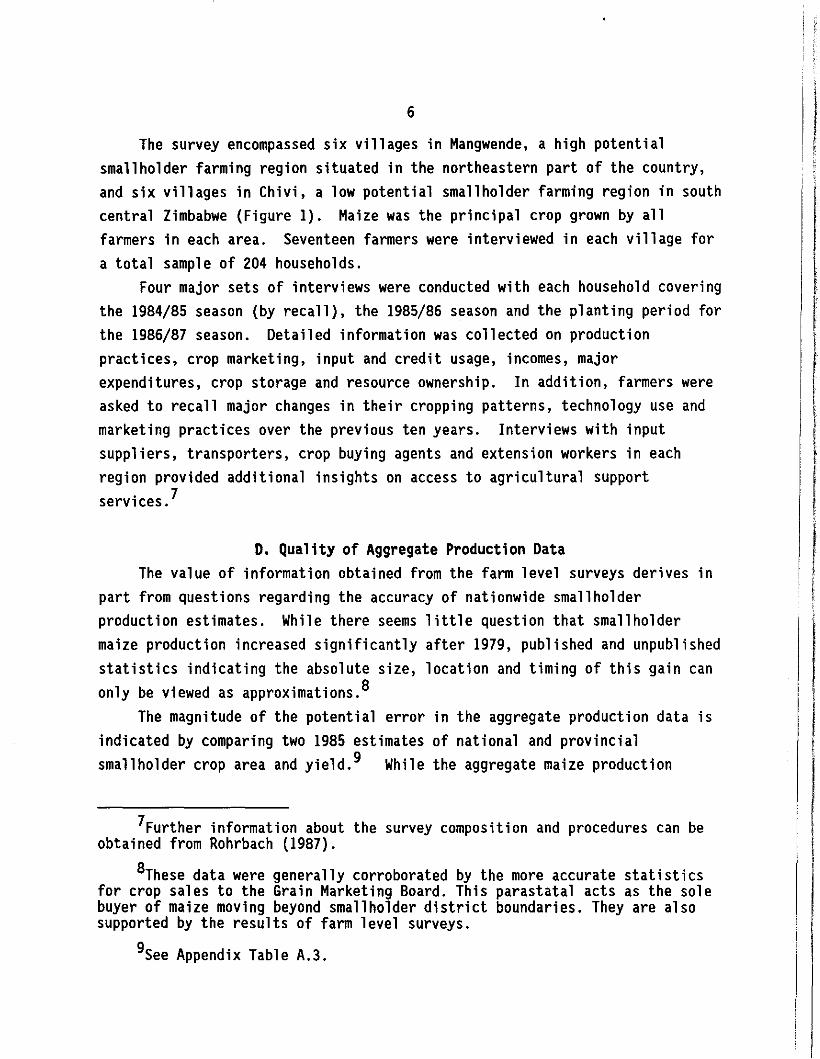
A. Maize Production TrendsZimbabwe's maize production trends are characterized by a) extreme
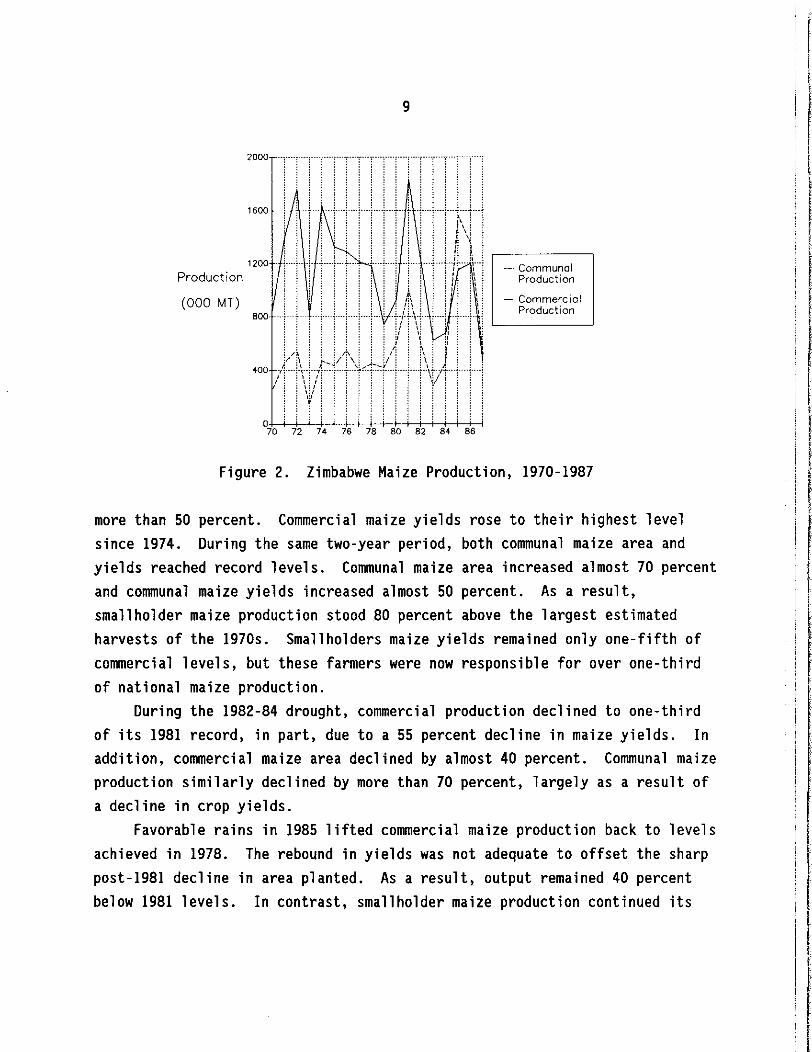
variability primarily associated with the incidence of mid-season dry spellsand drought; b) declining harvests during the mid to late 1970s, followed by asharp increase in production to record levels; c) a rising smallholder sectorcontribution to national production, particularly after 1979. Disaggregationof the commercial and smallholder production trends shows each farm sector hada unique maize supply response function (Figure 2). The differences in therespective trends merit comment.
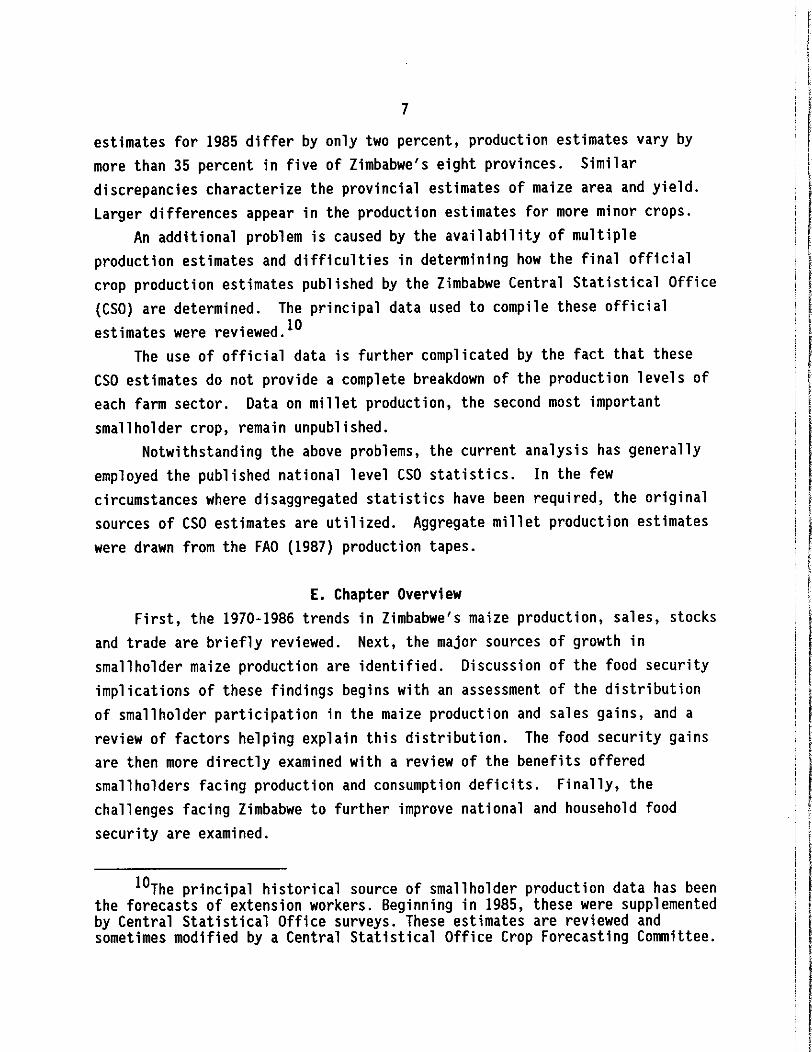
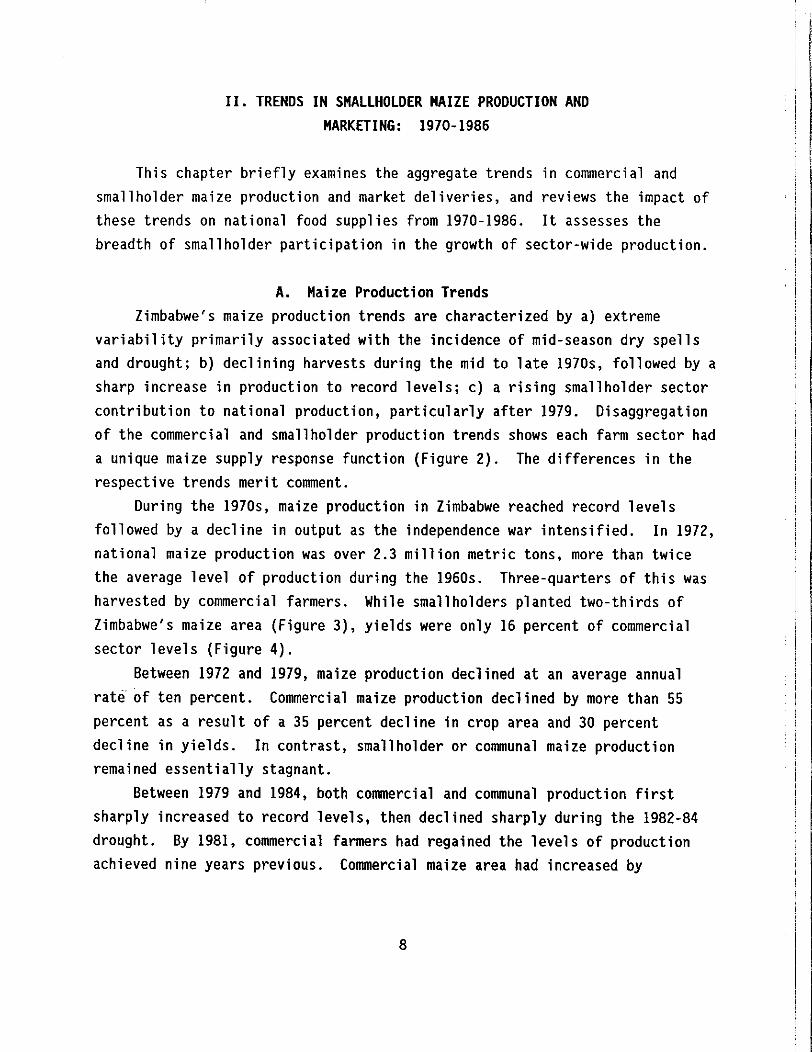
During the 1970s, maize production in Zimbabwe reached record levelsfollowed by a decline in output as the independence war intensified. In 1972,national maize production was over 2.3 million metric tons, more than twicethe average level of production during the 1960s. Three-quarters of this washarvested by commercial farmers. While smallholders planted two-thirds ofZimbabwe's maize area (Figure 3), yields were only 16 percent of commercialsector levels (Figure 4).
Between 1972 and 1979, maize production declined at an average annualrate of ten percent. Commercial maize production declined by more than 55percent as a result of a 35 percent decline in crop area and 30 percentdecline in yields. In contrast, smallholder or communal maize productionremained essentially stagnant.
Between 1979 and 1984, both commercial and communal production firstsharply increased to record levels, then declined sharply during the 1982-84drought. By 1981, commercial farmers had regained the levels of productionachieved nine years previous. Commercial maize area had increased by
8
9
l
I!
I
I- Commercial
Production
i.,.... '....'..•...~..•.•.•.. \ "r- ~ T i1\ : :II: :~ \: :r. I: :
• I: t :
.......+...L.fL.t..l ,-------,• : I 1: -_. Communal
:, .f: Production1 ii i\ i: I: i \ i
: Ii: i:
..,.... - -,-
1
i•1:1 :. 1:1 :: l!'l!. ..~. .····r. ..-;-"'" ~.. ,.~ . .
iii i i if i \! : '--------'
: : : :: II: I: ...f"",:.·
iii i if' \ :: Ii. : : : : :: I: :I:
400 )/..j\-.~-..r~J~T:.1~+~/.l""i._ ..l\1"/1,...i/ii\i/i "\/!'
: 1:/ :• III •,
BooL.
1600
2000
(000 MT)
1200
Production
07*0--+--'71:-2+-oi,.C-+-±76C+-:7*'B-+-:OBt'0+-±B2;+B±'-+-;B~6
Figure 2. Zimbabwe Maize Production, 1970-1987
more than 50 percent. Commercial maize yields rose to their highest levelsince 1974. During the same two-year period, both communal maize area andyields reached record levels. Communal maize area increased almost 70 percentand communal maize yields increased almost 50 percent. As a result,smallholder maize production stood 80 percent above the largest estimatedharvests of the 1970s. Smallholders maize yields remained only one-fifth ofcommercial levels, but these farmers were now responsible for over one-thirdof national maize production.
During the 1982-84 drought, commercial production declined to one-thirdof its 1981 record, in part, due to a 55 percent decline in maize yields. Inaddition, commercial maize area declined by almost 40 percent. Communal maizeproduction similarly declined by more than 70 percent, largely as a result ofa decline in crop yields.
Favorable rains in 1985 lifted commercial maize production back to levelsachieved in 1978. The rebound in yields was not adequate to offset the sharppost-1981 decline in area planted. As a result, output remained 40 percentbelow 1981 levels. In contrast, smallholder maize production continued its

10
Area
(000 HA)
1200
1000
800
600
400
200
--- CommunalMaize Area
- Commerc iaIMaize Area
oH-±-+-je-+-±-i-±-+:i:-+-±-+-je-+±-i~ n 74 76 n ~ 82 84 86
Figure 3. Zimbabwe Maize Area by Farm Sector, 1970-1987
6000
4000
Yield3000
(KG/HA)
2000
1000
........1" ' .
·j···+·:··+···f··+·--f-···!
--.l....l.._.l.... j.... j....1. ... ]....l...l....:....l.... l....:, i' !!!! j I i I ! i'<
···~····~····7 ......: ... ~.: .... ~.: ····;.:·····.i····i.:.... ;.;-.)'K.;_.,._+.: _.---:- ·+/-i····i\ -jj .......\ i ,:{ . \ .I" : \ i A-+-r-r-i-~r--! . 'L: / \
Y . j '~/i .
-- CommunalMaize Yield
- CommercialMaize Yield
Figure 4.
oHf--+-++-+-j--i--,i-+-+-+-+-+-:H--:i:--i70 72 74 76 78 M ~ 84 ~
Zimbabwe Maize Yields by Farm Sector, 1970-1987

11
post-independence climb as estimated yields again increased to record levels.Total small farm maize production increased an additional 55 percent above1981 levels, rising above commercial output for the first time. Smallholdernow harvested almost 60 percent of Zimbabwe's total maize output.
In effect, the post-1979 surge in smallholder production transformed thecommunal sector from a relatively minor participant in the national maizeeconomy to the principal source of national production growth. Small farmmaize area had almost doubled and small farm maize yields had more thandoubled from their average levels during the 1970s. Meanwhile, commercialsector maize production declined. National maize production reached recordlevels on the strength of communal sector gains. Government recognition ofthese advances in smallholder productivity led to a 1986 announcement ofdiscriminatory producer prices designed to promote a further shift incommercial farmland out of maize.
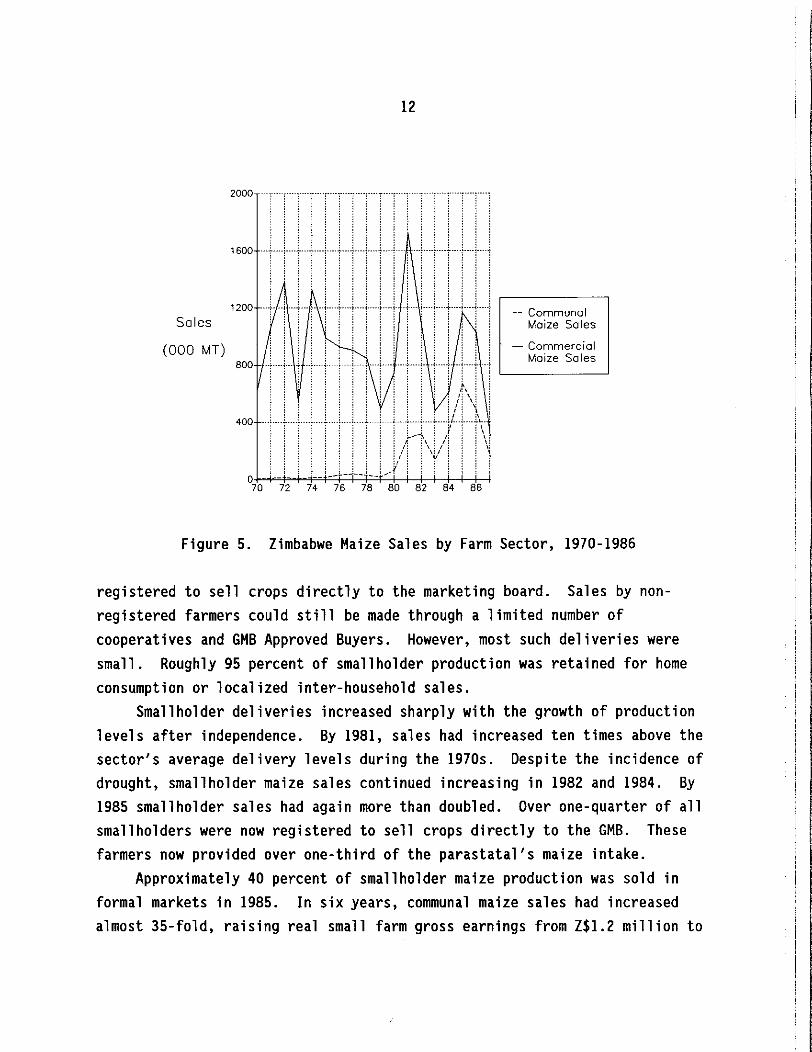
B. Trends in Maize SalesThe communal and commercial sector maize production trends are reflected
in their crop deliveries to the Grain Marketing Board1 (Figure 5). During the1970s, commercial farmers sold 70-75 percent of their production to the GMB,retaining the balance for animal feed and food for hired workers. Afterindependence, commercial sector retentions declined as a result of an increasein real maize prices and imposition of a minimum wage for farm labor2.Deliveries reached record levels in 1981, but declined marginally through thefull 1972 to 1986 period.
Until independence, communal maize sales averaged less than five percentof GMB intake. By the 1980 harvests, only three percent of smallholders were
1The GMB legally acts as the sole buyer of all maize sold by thecommercial sector and maize sold beyond communal land borders in thesmallholder sector. A guaranteed producer price, set by cabinet, applies tomaize, as graded, at each GMB delivery point. Transport to the GMB depots isprovided, except under unusual circumstances, by the private sector atcompetitive prices. In several recent years when sales have been large, thegovernment has provided farm-to-market transport assistance for late seasondeliveries.
2Some large-scale commercial farmers stopped giving their workers a maizeration when they were required to pay a minimum wage.
-------------l
12
2000,
1600 , ..+....; .. !, "1" .-: ..!,
-- CommunalMaize Sales
- CommercialMaize Sales
..
: . . . .··t ··f .. ~ ..+.. j- .+ .f···+·+···i.... j ...j
i :i ;
..1---1! ! ! '--- --.J
;. ! :r.\: :
• I: \: :: I: \: :: I: \: :
!/! ~, i..: I .. . ~... ..:.\•..
: : : : ~ : \
I,l-""lll i \('__ '__ ' _-'"-_ '__ ' ......1' , , ,
0-----
: ! !, ..•1 _!.400 ..+...j .. ~ ...
1200
Sales
(000 MT)
70 n U 76 n M ~ M 86
Figure 5. Zimbabwe Maize Sales by Farm Sector, 1970-1986
registered to sell crops directly to the marketing board. Sales by nonregistered farmers could still be made through a limited number ofcooperatives and GMB Approved Buyers. However, most such deliveries weresmall. Roughly 95 percent of smallholder production was retained for homeconsumption or localized inter-household sales.
Smallholder deliveries increased sharply with the growth of productionlevels after independence. By 1981, sales had increased ten times above thesector's average delivery levels during the 1970s. Despite the incidence ofdrought, smallholder maize sales continued increasing in 1982 and 1984. By1985 smallholder sales had again more than doubled. Over one-quarter of allsmallholders were now registered to sell crops directly to the GMB. Thesefarmers now provided over one-third of the parastatal's maize intake.
Approximately 40 percent of smallholder maize production was sold informal markets in 1985. In six years, communal maize sales had increasedalmost 35-fold, raising real small farm gross earnings from Z$1.2 million to
13
over Z$63.6 mi11ion. 3 Remarkably, at the same time, residual estimates of percapita smallholder retentions also increased to their highest level in morethan 15 years. 4
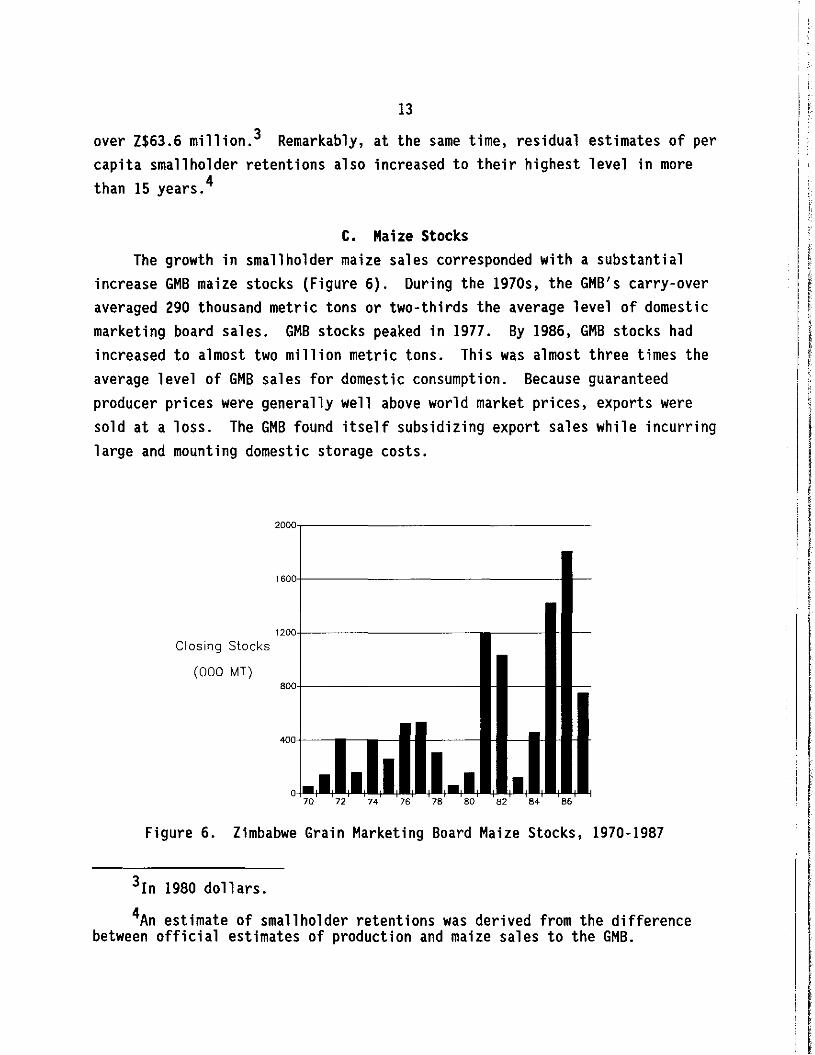
c. Maize StocksThe growth in smallholder maize sales corresponded with a substantial
increase GMB maize stocks (Figure 6). During the 1970s, the GMB's carry-overaveraged 290 thousand metric tons or two-thirds the average level of domesticmarketing board sales. GMB stocks peaked in 1977. By 1986, GMB stocks hadincreased to almost two million metric tons. This was almost three times theaverage level of GMB sales for domestic consumption. Because guaranteedproducer prices were generally well above world market prices, exports weresold at a loss. The GMB found itself subsidizing export sales while incurringlarge and mounting domestic storage costs.
2000,----------------
1600+--------------
1200+----------
Closing Slacks
(000 MT)800+----------
4001+--
IIl
III
70 72 74 76 78 80 82 84 86
Figure 6. Zimbabwe Grain Marketing Board Maize Stocks, 1970-1987
31n 1980 dollars.
4An estimate of smallholder retentions was derived from the differencebetween official estimates of production and maize sales to the GMB.

14
The government responded to the buildup of maize stocks by announcing areduction in official producer prices at the beginning of the 1986/87 croppingseason. A guaranted price of Z$180 per metric ton was offered for the first91 metric tons delivered plus one-half the level of each farmer's previousyear's sales. Any additional maize would be priced at Z$80 per ton. Thisdelivery quota effectively applied only to commercial farmers becausevirtually all smallholders produce less than the 91 metric ton limit.
The discriminatory price policy was later withdrawn due to the incidenceof a severe nationwide drought. Yet the preplanting announcement was enoughto stimulate a 50 percent reduction in large-scale commercial sector maizeplantings. This carried over into the 1987/88 production season. Smallholdermaize plantings declined only marginally.
Despite the drought, the GMB's maize stocks remained adequate to support500,000 metric tons of exports during the 1987/88 marketing year. More thanone-third of Zimbabwe's smallholders received drought relief assistance.Nevertheless, just prior to the 1988 harvest, the GMB still held enough maizeto support an average year of domestic sales.
D. location of Maize GrowthTo begin evaluating the implications of these gains for household food
security, it is necessary to examine which farmers participated in thissuccess story. A provincial level breakdown of production trends provides aninitial basis for this assessment.
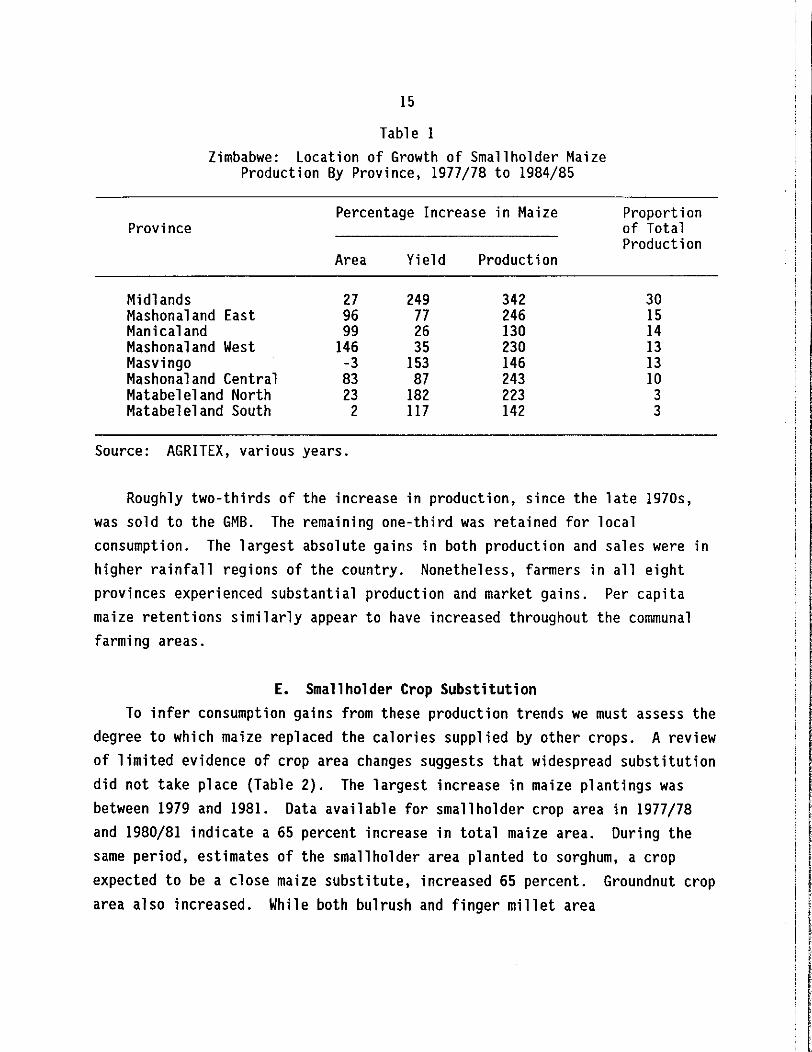
Maize is the most important smallholder crop, in terms of area planted,in seven of Zimbabwe's eight provinces and in 80 percent of the nation's 163communal farming areas (AGRITEX, various years). Between the 1977/78 and1984/85 cropping seasons,S smallholder maize area increased in seven provinces(Table 1). The largest increases in maize area were in the higher rainfallregions of the country. Farmers in all eight provinces registered increasesin average maize yields. Per hectare output more than doubled in fourprovinces, unexpectedly including three of the drier provinces in the country.As a result, smallholder maize production at least doubled in every province.
5Both were relatively good rainfall seasons.
15
Table 1Zimbabwe: Location of Growth of Smallholder Maize
Production By Province, 1977/78 to 1984/85
ProvincePercentage Increase in Maize Proportion
of TotalProduction
Area Yield Production
Midlands 27 249 342 30Mashonaland East 96 77 246 15Manicaland 99 26 130 14Mashonaland West 146 35 230 13Masvingo -3 153 146 13Mashonaland Central 83 87 243 10Matabeleland North 23 182 223 3Matabeleland South 2 117 142 3
Source: AGRITEX, various years.
Roughly two-thirds of the increase in production, since the late 1970s,was sold to the GMB. The remaining one-third was retained for localconsumption. The largest absolute gains in both production and sales were inhigher rainfall regions of the country. Nonetheless, farmers in all eightprovinces experienced substantial production and market gains. Per capitamaize retentions similarly appear to have increased throughout the communalfarming areas.
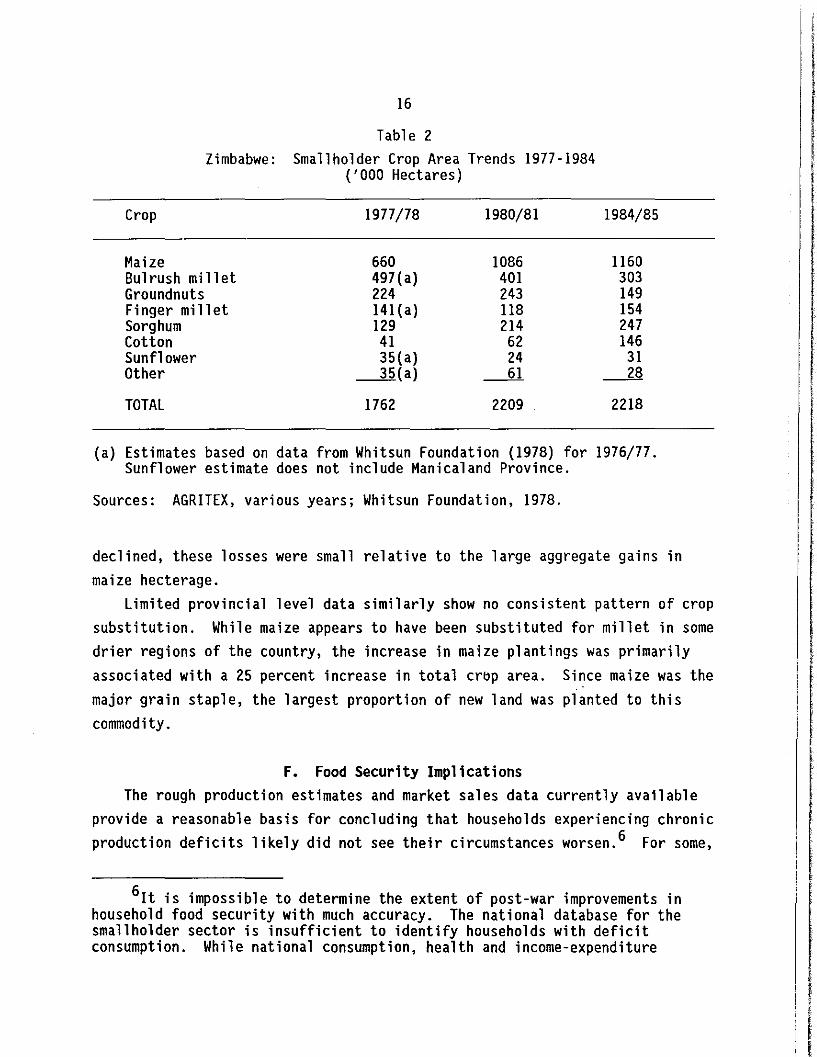
E. Smallholder Crop SubstitutionTo infer consumption gains from these production trends we must assess the
degree to which maize replaced the calories supplied by other crops. A reviewof limited evidence of crop area changes suggests that widespread substitutiondid not take place (Table 2). The largest increase in maize plantings wasbetween 1979 and 1981. Data available for smallholder crop area in 1977/78and 1980/81 indicate a 65 percent increase in total maize area. During thesame period, estimates of the smallholder area planted to sorghum, a cropexpected to be a close maize substitute, increased 65 percent. Groundnut croparea also increased. While both bulrush and finger millet area
16
Table 2Zimbabwe: Smallholder Crop Area Trends 1977-1984
('000 Hectares)
Crop 1977/78 1980/81 1984/85
Maize 660 1086 1160Bul rush mi 11 et 497(a) 401 303Groundnuts 224 243 149Fi nger mi 11 et 141(a) 118 154Sorghum 129 214 247Cotton 41 62 146Sunflower 35(a) 24 31Other ~(a) ~ ~
TOTAL 1762 2209 2218
(a) Estimates based on data from Whitsun Foundation (1978) for 1976/77.Sunflower estimate does not include Manicaland Province.
Sources: AGRITEX, various years; Whitsun Foundation, 1978.
declined, these losses were small relative to the large aggregate gains inmaize hecterage.
Limited provincial level data similarly show no consistent pattern of cropsubstitution. While maize appears to have been substituted for millet in somedrier regions of the country, the increase in maize plantings was primarilyassociated with a 25 percent increase in total crbp area. Since maize was themajor grain staple, the largest proportion of new land was planted to thiscommodity.
F. Food Security ImplicationsThe rough production estimates and market sales data currently available
provide a reasonable basis for concluding that households experiencing chronicproduction deficits likely did not see their circumstances worsen. 6 For some,
6It is impossible to determine the extent of post-war improvements inhousehold food security with much accuracy. The national database for thesmallholder sector is insufficient to identify households with deficitconsumption. While national consumption, health and income-expenditure
~-
II•
I

17
food availability probably improved. Production gains were widespread.Higher levels of regional supply increased the availability of maize invillage markets. Further, the growth of smallholder incomes resultingparticularly from the increase in formal sector sales increased localemployment opportunities. Households not participating directly in theproduction gains probably faced lower food prices and greater income earning
opportunities.In spite of the likely reduction in chronic food insecurity, transitory
food insecurity remains a major problem for Zimbabwe smallholders. Thevariability in national maize production levels has increased with the growthof smallholder maize production. 7 Zimbabwe faces some of the largestfluctuations in cereal grain production of any country in Africa. Thegovernment has responded by maintaining large and increasingly expensive maizestocks and by expanding its drought relief programs. In regions of severeproduction shortfall, farm families are provided food for work, and in somecases the cash with which to purchase food. While such programs preventstarvation, they do not prevent the severe dislocation associated with theselling off of farm assets and migration. Even with continuing growth inmaize output, it appears that domestic drought relief programs will remain animportant aspect of national food security strategies in the foreseeable
future.
surveys have recently been conducted, these do not provide a historicalperspective. At the time of this investigation, these Central StatisticalOffice surveys had not yet been analyzed.
7The coefficient of variation for aggregate maize production over the1970 to 1987 period is 0.36. Over the 1970 to 1979 period the coefficient ofvariation was 0.27.
I i

III. SOURCES OF GROWTH OF SMALLHOLDER PRODUCTION AND SALES
The growth of smallholder maize production since the ending of the war in1979 can largely be attributed to the rapid expansion of government andprivate sector support for smallholders after independence. The terminationof the war provided an initial impetus to production. This was reinforced bymajor investments in market infrastructure, the expansion of a new smallholdercredit program, improved extension assistance and higher maize prices. Risingfarmgate prices and net maize profitability helped stimulate the expansion ofcrop area. The availability of improved technologies, derived from over fortyyears of agricultural research, provided the means to improve maizeproductivity. The purpose of this chapter is to review the contribution ofthese changes in institutions, technologies and prices to the growth ofsmallholder maize production.
A. Pre-IndependenceBefore independence in 1980, agricultural policy was largely geared
toward meeting the needs of the large-scale commercial farmers. For example,by 1975, only one Grain Marketing Board depot had been established in thesmallholder farming areas. At independence, only three of 34 GMB depotsdirectly served small farmers. Input suppliers principally responded to largefarm demand and made little effort to promote input sales in the communalareas. The national agricultural research service operated under theassumption that most of its work was scale neutral and agroecological zonerather than farm sector specific. Yet most technology testing was conductedin higher rainfall regions under conditions similar to large farm practices.While extension support was provided smallholders, this often represented ameans of administrative control as much as a source of agricultural advice.In some regions, farmers explicitly ignored extension advice as a result ofthis tie. Also, smallholder extension programs emphasized training of the'best' farmers for ownership of freehold small-scale commercial farms. Asmall credit program was developed for communal and small-scale commercialfarmers in 1958. In practice, however, most loans were distributed to the
18

19
commercial farmers. A major objective of the independence war was the removalof this system of discrimination favoring large farmers.
B. Ending of the WarOnly rough estimates are available of the magnitude of dislocation caused
by the war. Data compiled for a refugee resettlement program run by AGRITEXin 1980 indicate almost one-third of communal families required post-warresettlement assistance (AGRITEX, 1980). Survey results1 and inquiries offarm leaders in each survey region suggest this estimate may be high. 2 Yetthe disruption of smallholder agriculture caused by the war was broader thanthe resettlement figures indicate. In areas of consistent fighting, familieswere moved into government camps. In regions of intermittent violence,farmers simply began to abandon distant fields. Toward the end of the war,when the probability of victory improved, enlistment in the guerrilla armiesexpanded. When men went off to war, women continued farming operations onsmaller crop areas. This loss does not appear in the aggregate sector-wideproduction figures, probably because the extension workers responsible formaking crop production estimates had been withdrawn from areas experiencinginstability.
After the war, farmers returned to their holdings, abandoned fields werereplanted and new fields were established. Young couples took advantage ofthe termination of rural violence to move off their parents holdings, andestablish independent farmsteads. New holdings were also created by familiesseeking to expand their acreage and obtain better land. Farmers who did notmove, replanted fields abandoned during the war and sought additional landallocations. Much of this expansion in crop area resulted from thecultivation of lands previously set aside for grazing.
The increase in both the number of holdings and in holding size helpsexplain why the maize area expanded in the context of an increase in totalcrop area. Since maize was the basic food staple in most parts of the
IFor Mangwende and Chibi Communal Areas.
2For example, refugee program estimates indicate over one-half of allChibi households had to be resettled after the war. Chibi farmers andcommunity leaders claimed refugee resettlement was limited.
II
I I
20
country, the increase in area allocated to this crop was larger than the gainin area allocated to its alternatives. Survey results show 71 percent ofMangwende's increase in maize area, between 1975 and 1981, resulted from anincrease in the number of households and 29 percent of the gain resulted froman increase in area per established household. In Chivi, 86 percent of theincrease in maize area resulted from an increase in the number of farmhouseholds.
In contrast to national trends, Mangwende and Chivi farmers claimed croparea expansion continued after 1981. In the high potential region, most ofthis gain resulted from an increase in the average area cultivated by existinghouseholds. In low rainfall Chivi, most area growth continued to beassociated with population gains.
c. Relative Maize PricesFarmers take account of four major sets of prices when deciding on the
quantity of land to plant to maize and the quantity of inputs to purchase:real maize producer prices, the relative producer price of maize in comparisonwith producer prices for substitute crops, the producer-to-input price ratioand the producer-to-consumer price ratio. The effect of each of these pricesis examined.
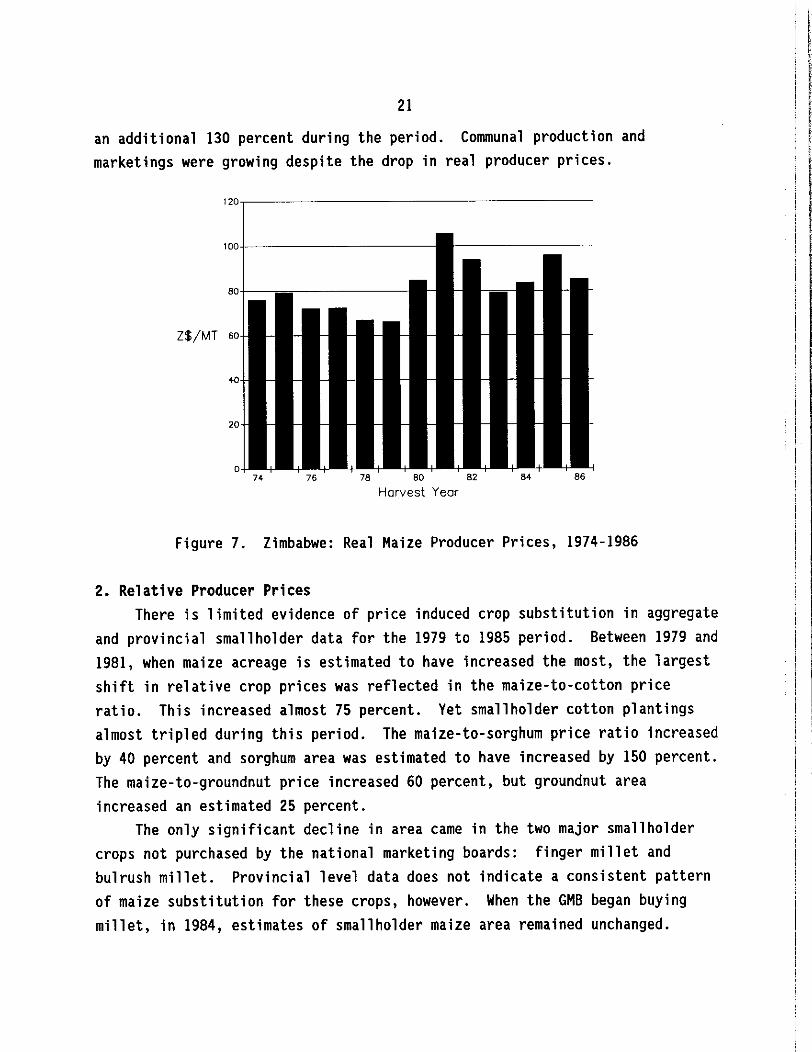
1. Real Producer PricesBetween 1979 and 1981, real maize prices, deflated by the GOP deflator,
increased by 60 percent (Figure 7). During this period, as noted above,smallholder maize area increased by more than 65 percent. Smallholder maizesales to the GMB rose fifteenfold. Commercial maize area similarly increasedby almost 50 percent and commercial sales increased by 250 percent.
Between 1981 and 1983, real maize prices declined by 25 percent, althoughby 1985 they had recovered two-thirds of this loss. In response, commercialmaize area and maize sales declined by almost 25 and 35 percent respectively.In contrast, aggregate estimates indicate communal maize area remainedessentially unchanged. Yield gains lifted smallholder maize production by 65percent between 1981 and 1985. Smallholder maize sales to the GMB increased
21
an additional 130 percent during the period. Communal production andmarketings were growing despite the drop in real producer prices.
120-,---------------------
868478 80 82
Harvest Year7674
o
100-1------------
20
40
Z$/MT 60
80
Figure 7. Zimbabwe: Real Maize Producer Prices, 1974-1986
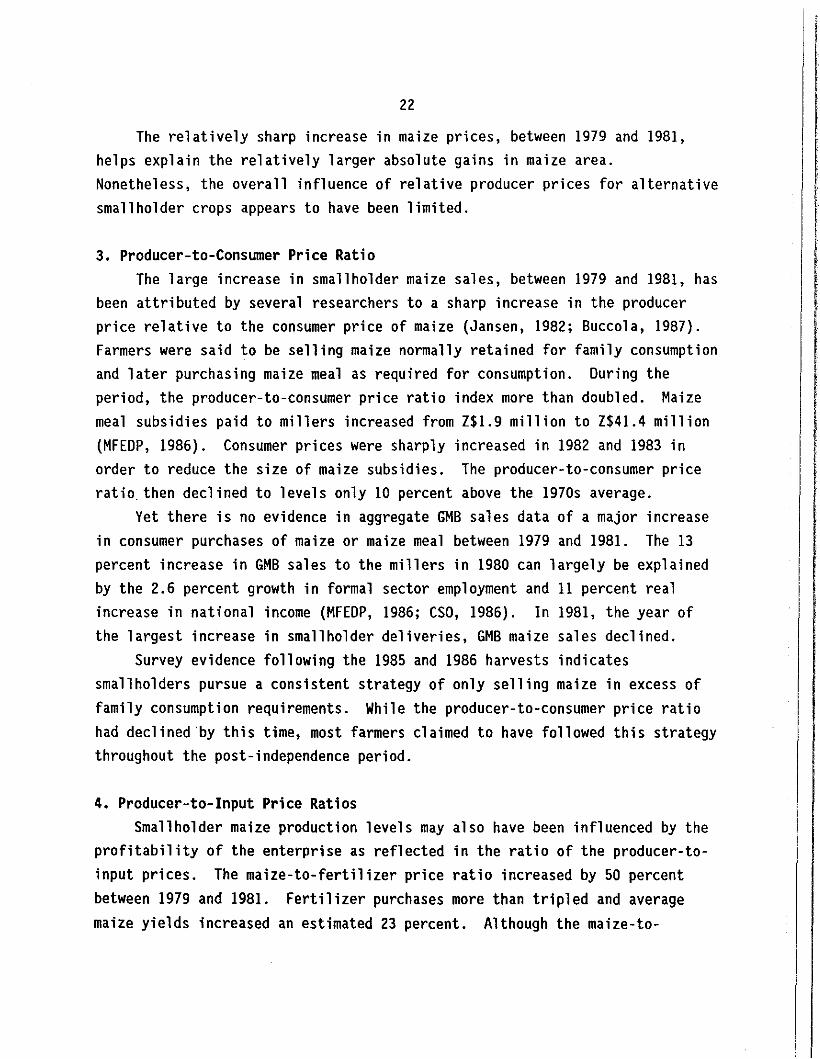
2. Relative Producer PricesThere is limited evidence of price induced crop substitution in aggregate
and provincial smallholder data for the 1979 to 1985 period. Between 1979 and1981, when maize acreage is estimated to have increased the most, the largestshift in relative crop prices was reflected in the maize-to-cotton priceratio. This increased almost 75 percent. Yet smallholder cotton plantingsalmost tripled during this period. The maize-to-sorghum price ratio increasedby 40 percent and sorghum area was estimated to have increased by 150 percent.The maize-to-groundnut price increased 60 percent, but groundnut areaincreased an estimated 25 percent.
The only significant decline in area came in the two major smallholdercrops not purchased by the national marketing boards: finger millet andbulrush millet. Provincial level data does not indicate a consistent patternof maize substitution for these crops, however. When the GMB began buyingmillet, in 1984, estimates of smallholder maize area remained unchanged.
22
The relatively sharp increase in maize prices, between 1979 and 1981,helps explain the relatively larger absolute gains in maize area.Nonetheless, the overall influence of relative producer prices for alternativesmallholder crops appears to have been limited.
3. Producer-to-Consumer Price RatioThe large increase in smallholder maize sales, between 1979 and 1981, has
been attributed by several researchers to a sharp increase in the producerprice relative to the consumer price of maize (Jansen, 1982; Buccola, 1987).Farmers were said to be selling maize normally retained for family consumptionand later purchasing maize meal as required for consumption. During theperiod, the producer-to-consumer price ratio index more than doubled. Maizemeal subsidies paid to millers increased from Z$I.9 million to Z$41.4 million(MFEDP, 1986). Consumer prices were sharply increased in 1982 and 1983 inorder to reduce the size of maize subsidies. The producer-to-consumer priceratio. then declined to levels only 10 percent above the 1970s average.
Yet there is no evidence in aggregate GMB sales data of a major increasein consumer purchases of maize or maize meal between 1979 and 1981. The 13percent increase in GMB sales to the millers in 1980 can largely be explainedby the 2.6 percent growth in formal sector employment and 11 percent realincrease in national income (MFEDP, 1986; CSO, 1986). In 1981, the year ofthe largest increase in smallholder deliveries, GMB maize sales declined.
Survey evidence following the 1985 and 1986 harvests indicatessmallholders pursue a consistent strategy of only selling maize in excess offamily consumption requirements. While the producer-to-consumer price ratiohad declined 'by this time, most farmers claimed to have followed this strategythroughout the post-independence period.
4. Producer-to-Input Price RatiosSmallholder maize production levels may also have been influenced by the
profitability of the enterprise as reflected in the ratio of the producer-toinput prices. The maize-to-fertilizer price ratio increased by 50 percentbetween 1979 and 1981. Fertilizer purchases more than tripled and averagemaize yields increased an estimated 23 percent. Although the maize-to-
II
I!
23
fertilizer price ratio declined by 30 percent between 1981 and 1985,smallholder fertilizer purchases increased an additional 33 percent. Surveyevidence indicates fertilizer purchases were more dependent on theavailability of credit required to resolve a farm household capital constraintthan the fertilizer price.
In summary, while the sharp increase in real producer prices may havehelped stimulate production and market sales immediately after the war, thestrength of this relationship appears limited. Other factors correlated withthe price change probably contributed to the increase in production. Thesefactors offset the impact of a decline in real producer prices after 1981.
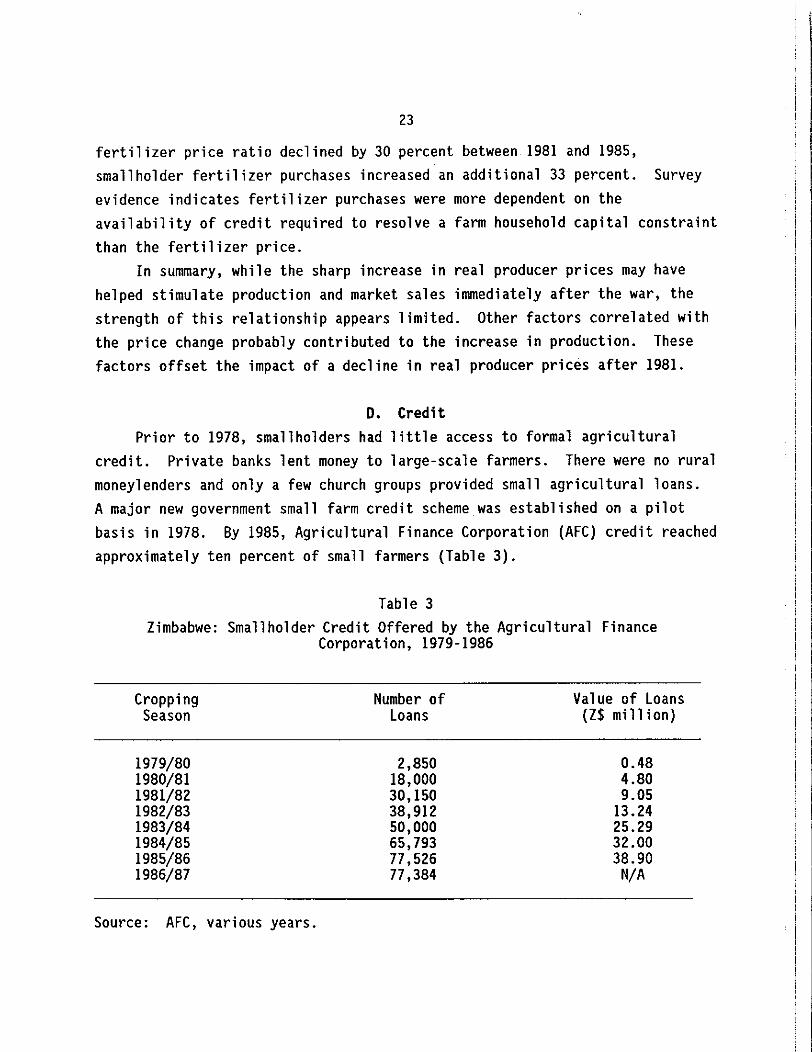
D. CreditPrior to 1978, smallholders had little access to formal agricultural
credit. Private banks lent money to large-scale farmers. There were no ruralmoneylenders and only a few church groups provided small agricultural loans.A major new government small farm credit scheme was established on a pilotbasis in 1978. By 1985, Agricultural Finance Corporation (AFC) credit reachedapproximately ten percent of small farmers (Table 3).
Table 3
Zimbabwe: Smallholder Credit Offered by the Agricultural FinanceCorporation, 1979-1986
CroppingSeason
1979/801980/811981/821982/831983/841984/851985/861986/87
Source: AFC, various years.
Number ofLoans
2,85018,00030,15038,91250,00065,79377,52677 ,384
Value of Loans(ZS million)
0.484.809.05
13.2425.2932.0038.90
N/A
24
Most AFC loans were for the purchase of designated input packages for astipulated crop. All short term credit in the two survey areas was for maize.Farmers complained they could not obtain loans for other crops, though inparts of the country loans were granted for cotton and sorghum. The inputpackages included seed, fertilizer and insecticide. Repayment was madethrough a stoporder3 on crop sales to the GMB. No payments were made to thefarmer for crops sold to GMB depots and collection points until all loans wererepaid.
In order to receive a loan, each farmer had to prove his or her abilityto produce a marketable surplus by showing a history of previous sales. Inregions without substantial marketings, potential credit recipients wereidentified with the help of local extension workers. In addition, farmerswere required to be members of credit groups. As a result, the majority ofcredit recipients were based in high rainfall zones and owned relativelygreater farm resources. 4
E. Fertilizer and Seed DeliveriesSmallholder purchases of fertilizer and hybrid maize seed were relatively
constant during the 1970s (Table 4). In 1980, sales of fertilizer more thantripled and sales of seed doubled. Roughly 60 percent of this increase infertilizer sales and 30 percent of this increase in hybrid seed sales can beattributed to government funded distribution of free inputs under a one yearrefugee resettlement program. This program called for the free delivery ofenterprise specific input packages and training in input use for farmersreturning to the land.
Between 1980 and 1985, smallholder purchases of fertilizer increased anadditional 45 percent and hybrid seed sales more than doubled. The growth infertilizer deliveries corresponded with the growth in the number and size ofsmallholder loans granted by the AFC. While some small farmers were investingincreasing amounts of their own resources in fertilizer, in parts of the
3Before farmers were paid for crops sold directly to the GMB, loanrepayments were automatically deducted.
4See Chapter four for a more detailed examination of this relationship.

25
Table 4Zimbabwe: Hybrid Maize Seed and Fertilizer Deliveries to Smallholder
Farmers, 1974-1985
II
CroppingSeason
1974/751975/761976/771977/781978/791979/801980/811981/821982/831983/841984/851985/86
Fertilizer Deliveries(MT)
24,00019,00020,00025,00025,00027,00090,00096,00098,000
106,000127,664130,000 (est)
Seed Deliveries(MT)
2,3503,9502,7003,7004,2504,3009,650
13,95016,90017 ,30019,50020,250 (est)
Sources: Windmill, 1987; Seed Cooperative, 1987.
country, credit became the dominant source of investment capital. InMangwende and Chivi, most fertilizer purchases were funded with credit andfarmers were investing a declining proportion of their own cash in this input.By 1986, AFC loans funded 72 percent and 88 percent of total fertilizerpurchases in Mangwende and Chivi respectively. Family cash resources werebeing invested largely in school fees and consumer goods.
F. Research and ExtensionThe adoption of improved technologies such as hybrid seed and fertilizer
was made possible by large historical investments in agricultural research andextension. Before independence, research efforts were largely directed towardthe needs of large-scale commercial farmers. Most research was conducted onexperiment stations based in the high potential farming areas and adaptivetrials were largely conducted on commercial farms. This orientationinfluenced the range of research issues considered and narrowed theapplicability of resulting recommendations.
26
Nevertheless, certain research outputs were relevant to each of the farmsectors. One important example was the development of a series of maizehybrids. Seed sale records indicate smallholders widely adopted hybrid maizeseed, particularly after independence. In 1979, an estimated 29 percent ofsmallholder maize area was planted to hybrids. This increased toapproximately 70 percent of plantings by 1985. In the drier Chi vi surveyzone, virtually 100 percent of the farmers operating before 1980 claim to haveadopted hybrid maize seed. According to farmers surveyed, improved seedrepresented a low cost input which provided higher yields, compared to openpollinated varieties. The yield advantage, farmers said, was evident evenwithout fertilizer and in years with poor rainfall. In Mangwende, 70 percentof farmers had adopted hybrid maize seed by 1980. Five years later, adoptionwas universal.
Fertilizer adoption and use has been concentrated in the nation's higherpotential smallholder farming areas. In Chivi, only 17 percent of the farmershave tried fertilizer. Less than half this number consistently use the input.In Mangwende, almost all farmers have tried fertilizer, most initially testingthe input before independence. In 1986, 80 percent of these farmers stillused fertilizer, though most applied only small quantities. The minority offarmers applying fertilizer near recommended levels were credit recipients.
The adoption of recommendations governing the use of insecticide andherbicide has been more limited. Aggregate data on agrochemical sales to thesmallholder sector are unavailable. Survey results indicate,however, thatinsecticide adoption and use for maize has been closely related to the receiptof this input in enterprise-specific credit packages. Before 1980, virtuallyno farmers in either area had tried maize insecticide. 5
Herbicide testing has been linked with participation in post-independenceresearch and agrochemical company extension trials. Twenty-two percent ofMangwende farmers tried herbicide by 1986. After the trials, however,adoption ended. No farmers continued using this input on their own. Noherbicide trials were performed in Chivi and no farmers have tested thisinput.
5Though smallholders were widely applying insecticide to grain instorage.
27
The relevance and adoption of technologies developed for communal sectorenterprises other than maize and cotton has been limited. Recognizing this,the national research service attached greater priority to research gearedspecifically to smallholder needs after independence. This included thedevelopment of a large program of on-farm trials in the smallholder farmingareas and expansion of research on more drought tolerant crops such as sorghumand sunflower. Thus far, there have been no direct returns to thisinvestment. But a 10 to 15 year investment period may be required beforesignificant payoffs appear.
During the war, agricultural extension agents were withdrawn from regionsexperiencing violence. In some areas, extension agent housing was destroyedin attacks against the Rhodesian government. After the war, these extensionagents were replaced, provided with improved housing and granted subsidizedloans for motor bikes. This increased the incentive to work in the ruralareas and expanded extension worker mobility. New staff training programswere developed, and in 1986, regional extension officers initiated a programof on-farm technology verification and demonstration trials.
It is difficult to estimate the effects of these changes. The quality oflocal level extension support is still highly variable. Many recommendations,particularly those for semi-arid regions and secondary crops, remain ofquestionable appropriateness. Nevertheless, these services are improving.
G. Market Expansion1. Product Markets
The number of communal area depots increased steadily after independence(Table 5). By 1986, 20 communal area depots had been established and by theend of 1988 the GMB plans to have created 66 depots. Most of the early depotswere situated in high rainfall regions with the largest prospective maizesales. Since 1986, an increasing number of depots have been built in thesemi-arid regions.
The GMB established a system of 135 temporary collection points in 1985in order to expand market access further. Producers using these facilitieswere charged a nominal amount for transport from the collection point to thenearest depot. Ultimately, the Board planned to locate these buying points

28
Table 5Zimbabwe: Expansion of Grain Marketing Board Buying Points, 1975-1986
Types of 1975 1980 1981 1982 1983 1984 1985 1986Buying Points
Commerical Depots 3 31 31 31 31 31 31 31Communal Depots 1 3 6 10 12 13 14 20Collection Points 0 0 0 0 0 0 135 56
Source: GMB (various years).
within 20 kilometers of each farmer. But the strong response to thisinfrastructure, particularly in regions more distant from major depots,created a concern that maize required for local consumption was beingextracted from regions experiencing production shortfalls. In addition, theoperation of collection points was costly. As a result, only 56 of thesetemporary facilities were opened in 1986 and only 17 were opened in 1987.
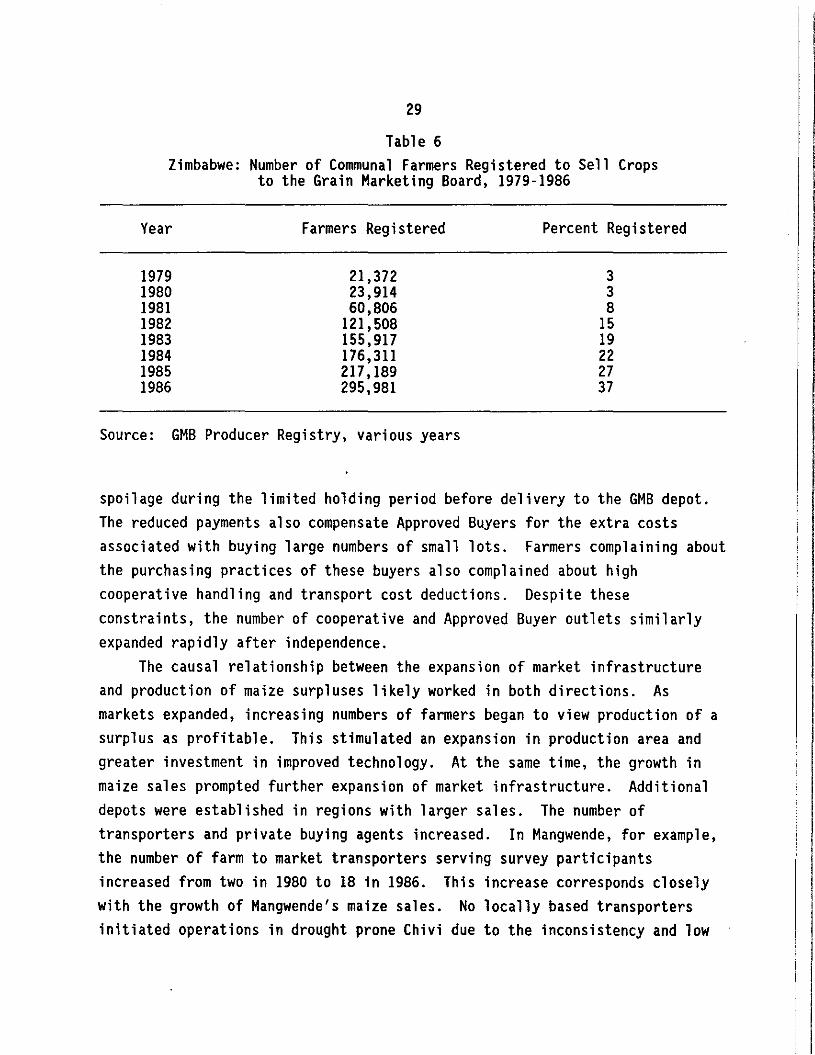
As product market facilities expanded, the number of small farmersregistered to sell crops to the GMB increased (Table 6). At independence,only three percent of smallholders held GMB registration cards. Six yearslater, the proportion had increased to 37 percent. This included farmers whodid not consistently use the depots or collection points. In 1986, roughlyone-half of these farmers directly sold crops to the GMB.
Historically, communal producers have also been able to sell grainthrough cooperatives and GMB Approved Buyers. These purchasing agents arerequired to pay government set prices after deducting a small charge forhandling and transport to the nearest depot. The actual level of thisdiscount depends on the purchaser. The Approved Buyers are generally localshop keepers. Some pay for grain by establishing credit accounts for thepurchase of goods from their stores. They also tend to price the grain at thelowest grade, regardless of quality. These practices cannot, however, besimply viewed as exploitative. The resulting margins help offset the risks of
!III
29
Table 6Zimbabwe: Number of Communal Farmers Registered to Sell Crops
to the Grain Marketing Board, 1979-1986
Year Farmers Registered Percent Registered
1979 21,372 31980 23,914 31981 60,806 81982 121,508 151983 155,917 191984 176,311 221985 217,189 271986 295,981 37
Source: GMB Producer Registry, various years
spoilage during the limited holding period before delivery to the GMB depot.The reduced payments also compensate Approved Buyers for the extra costsassociated with buying large numbers of small lots. Farmers complaining aboutthe purchasing practices of these buyers also complained about highcooperative handling and transport cost deductions. Despite theseconstraints, the number of cooperative and Approved Buyer outlets similarlyexpanded rapidly after independence.
The causal relationship between the expansion of market infrastructureand production of maize surpluses likely worked in both directions. Asmarkets expanded, increasing numbers of farmers began to view production of asurplus as profitable. This stimulated an expansion in production area andgreater investment in improved technology. At the same time, the growth inmaize sales prompted further expansion of market infrastructure. Additionaldepots were established in regions with larger sales. The number oftransporters and private buying agents increased. In Mangwende, for example,the number of farm to market transporters serving survey participantsincreased from two in 1980 to 18 in 1986. This increase corresponds closelywith the growth of Mangwende's maize sales. No locally based transportersinitiated operations in drought prone Chivi due to the inconsistency and low
I I. I
30
forThere were significant sales of cropscollection point was temporarily
volume of the region's crop sales.the first and only time when a GMBestablished in the area in 1985.
The expansion of product market infrastructure reduced the gap betweenofficial and farm gate prices. Farm to market transport costs declined.Approved Buyers and cooperatives faced greater competition. Survey evidenceindicates these gains were most significant in higher rainfall regions.
2. Input MarketsThere were three major sources of input market expansion during the post
independence period. Private sector companies manufacturing and distributinginputs expanded their sales and extension forces in the communal areas. Theypromoted the stocking of company products by local retailers and established aprogram of direct farm sales in some high potential regions. In addition, thecompanies sponsored a series of demonstration trials in regions believed tohave favorable market prospects.
Complementing this effort, urban based wholesalers branched out into thesmallholder farming areas and numerous small locally owner retailersestablished new businesses. Frequently, these shopkeepers or shop managerswere farmers themselves.
Finally the number of cooperatives selling inputs rapidly expanded.According the GMB records, the number of local cooperative branches increasedby 75 percent between 1980 and 1985. Almost all of this gain came after 1981.
These measures led to a decline in input costs as transport costsdeclined and retailers faced greater competition. Farmers also gained timelyaccess to inputs previously unavailable. Again, smallholders situated inhigher rainfall zones seem to have benefited most.
H. RainfallDebate persists about the appropriate measure of agriculturally useful
rainfall in Zimbabwe. Annual fluctuations differ widely across the nation'sagroecological zones. Rains may be normal in Zimbabwe's high potentialregions while long mid-season dry spells limit production in the low potentialareas. Yields depend not simply on the aggregate quantity of a season's
31
rainfall, but also on the timing. Productivity will decline if rains beginlate, end early or occur inconsistently.
Seventy-five percent of Zimbabwe's communal farming areas are situated insemi-arid regions (these receive less than 650 mm of average annualrainfall).6 These areas are also subject to frequent mid-season dry spellsand drought. Less than ten percent of the smallholder farming areasconsistently receive enough rain for good maize harvests. 7 Nevertheless,maize is a major crop in all parts of the country. Production levels are,accordingly, strongly affected by both the level and distribution of rain.
Since 1979, the variability of Zimbabwe's rainfall has been extreme. A1982 to 1984 drought was unusually long. In 1983 and 1987, nationwiderainfall declined to historically low levels. In 1981 and 1985, rainsthroughout the country were unusually good. These fluctuations largelyexplain the 75 percent decline in smallholder maize production between 1981and 1983 and the fivefold increase in production between 1983 and 1985. Duein part to the dominance of higher rainfall regions in deliveries of maize tothe GMB, rainfall fluctuations correspond less closely with smallholder salestrends.
I. Summary of Sources of GrowthA series of supply response equations (the quantity of maize deliveries
to the GMB as the dependent variable) were estimated in an attempt todistinguish the relative importance of this range of alternative explanatoryvariables (Rohrbach, 1988). However, conclusions drawn were relatively weakbecause data was unavailable for certain key explanatory variables, such aspopulation changes associated with the ending of the war and input marketexpansion. In addition, problems of multicollinearity limited theinterpretation of the formal supply response coefficients.
Yet an indication of the relative strength of alternative explanatoryvariables does emerge by combining results of the descriptive analysisreviewed above with insights from interviews with policy makers and farmers.
6Natural Regions IV and V.
7Natural Regions I and II.

32
These indicate that the growth of communal maize production cannot beattributed to any single factor such as favorable maize prices. In fact, thestrength of the response to official prices appears substantially lower thanexpected. Farmgate prices, and thereby, smallholder maize sales, were moresignificantly influenced by the expansion of market access resulting from thegrowth of market infrastructure. Most farmers did not become activeparticipants in national maize markets until the number of GMB buying outletsexpanded and farm to market transport facilities improved. Though. real andrelative producer price of maize declined after 1981, smallholder maize salescontinued increasing to record levels.
The sharp rise in smallholder maize area between 1979 and 1981, a gainfrequently attributed to the coincident increase in real maize prices, canlargely be explained by the ending of the war. Men and women who had joinedthe independence struggle returned to farming, new holdings were establishedand fields abandoned during the war were reclaimed. Survey evidence indicatesthis alone could account for over 70 percent of the immediate post-war areagain.
The growth of communal maize yields can be largely attributed to theavailability of improved technologies and the expansion of access to thesetechnologies. With the growth of input market infrastructure andestablishment of credit programs, hybrid maize seed and fertilizer salesincreased sharply. The purchase of maize inputs, in particular, was promoted.
IV. GROWTH OF SMALLHOLDER MAIZE PRODUCTION AND SALESBY REGION AND FARMER CHARACTERISTICS
This chapter examines the regional survey data in order to identify whichsmallholders contributed most to the aggregate trends and why. Conclusions aredrawn about the distributive effects of policy, institutional andtechnological changes introduced to date. Insights begin to emerge from thisanalysis that inform the issue of stimulating more widespread food securitygains among a broader cross section of smallholders.
A. Sector StratificationResearch funding constraints limited survey coverage to two communal
areas in Zimbabwe. Yet the potential for drawing sector-wide generalizationshas been tested by comparing the results of the location-specific researchwith the limited results of surveys conducted in other parts of the country.lIn addition, aggregate survey region trends in production and sales have beencompared with those for the smallholder sector as a whole. These tests ofcomparisons indicate Mangwende and Chivi are broadly representative of highand low rainfall agroecological zones in the country and of farm communitieswith variable market access. These key determinants of smallholder croppingstrategies were the principal criteria used to select areas. Ultimately,however, the conclusions drawn from this analysis require broader confirmationthrough similar survey research in other parts of the country.
Mangwende Communal Area is situated 60-85 km east of Harare in a highrainfall zone classified as Natural Region 11. 2 This agroecological zone
IFor example, ARDA, 1982; ARDA, 1983; CIMMYT, 1982; FMRS, 1984; MEU,1983; MEU, 1984; PTA, 1982; Rukuni, 1985; Shumba, 1985.
2Zimbabwe is divided into five Natural Regions according to rainfall andfarming potential. Natural Region I, a specialized and diversified farmingregion, consistently receives at least 900 mm of annual precipitation; NaturalRegion II, an intensive farming region, generally receives 750-1000 mm ofrain; Natural Region III, a semi-intensive farming region, receives 650-800 mmof rainfall; Much of this is in infrequent heavy falls and the area is subjectto mid-season dry spells. Natural Region IV, a semi-extensive farming regionreceives 450-650 mm, but is subject to severe mid-season dry spells anddrought. Natural Region V, an extensive farming region, receives less than
33
34
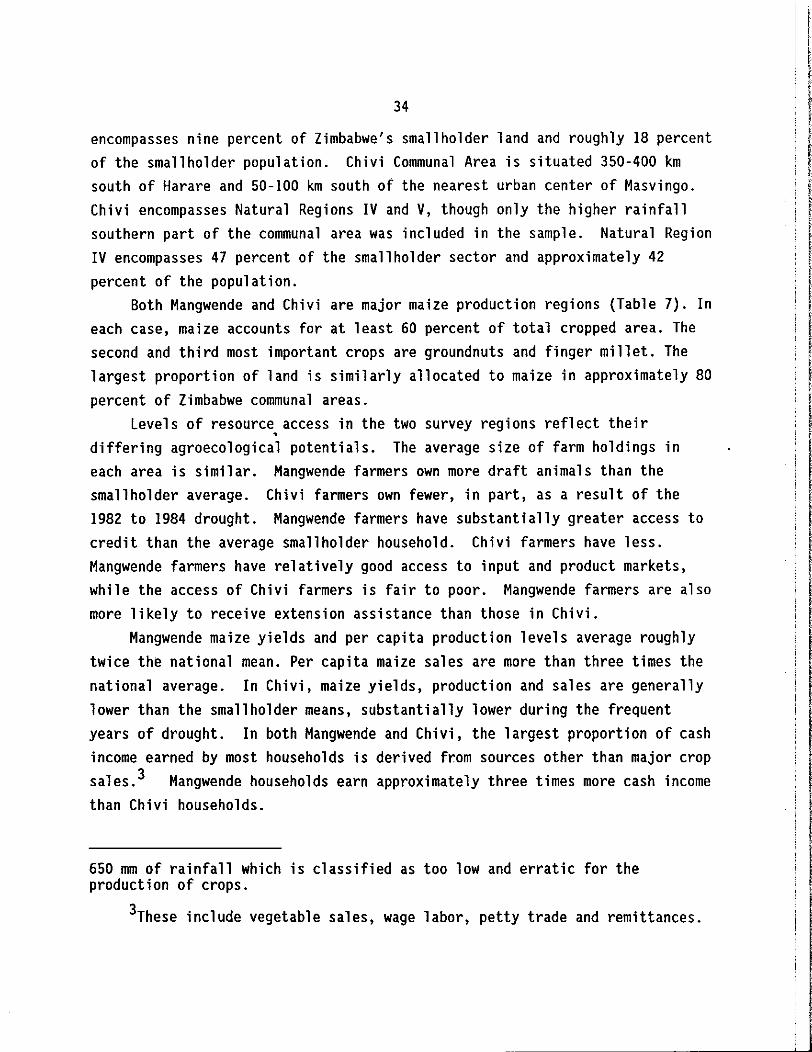
encompasses nine percent of Zimbabwe's smallholder land and roughly 18 percentof the smallholder population. Chivi Communal Area is situated 350-400 kmsouth of Harare and 50-100 km south of the nearest urban center of Masvingo.Chivi encompasses Natural Regions IV and V, though only the higher rainfallsouthern part of the communal area was included in the sample. Natural RegionIV encompasses 47 percent of the smallholder sector and approximately 42percent of the population.
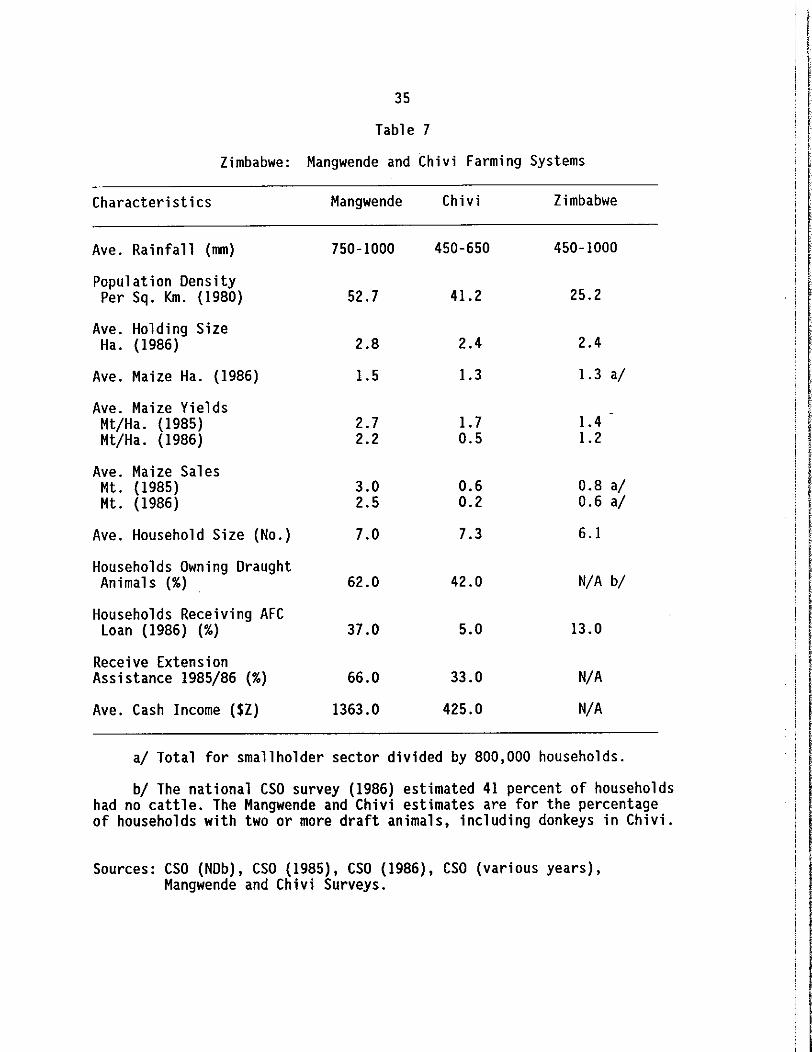
Both Mangwende and Chivi are major maize production regions (Table 7). Ineach case, maize accounts for at least 60 percent of total cropped area. Thesecond and third most important crops are groundnuts and finger millet. Thelargest proportion of land is similarly allocated to maize in approximately 80percent of Zimbabwe communal areas.
Levels of resource access in the two survey regions reflect their•
differing agroecological potentials. The average size of farm holdings ineach area is similar. Mangwende farmers own more draft animals than thesmallholder average. Chivi farmers own fewer, in part, as a result of the1982 to 1984 drought. Mangwende farmers have substantially greater access tocredit than the average smallholder household. Chivi farmers have less.Mangwende farmers have relatively good access to input and product markets,while the access of Chivi farmers is fair to poor. Mangwende farmers are alsomore likely to receive extension assistance than those in Chivi.
Mangwende maize yields and per capita production levels average roughlytwice the national mean. Per capita maize sales are more than three times thenational average. In Chivi, maize yields, production and sales are generallylower than the smallholder means, substantially lower during the frequentyears of drought. In both Mangwende and Chivi, the largest proportion of cashincome earned by most households is derived from sources other than major cropsales. 3 Mangwende households earn approximately three times more cash incomethan Chi vi households.
650 mm of rainfall which is classified as too low and erratic for theproduction of crops.
3These include vegetable sales, wage labor, petty trade and remittances.
\
II
35
Table 7
Zimbabwe: Mangwende and Chivi Farming Systems
Characteristics Mangwende Chivi Zimbabwe
Ave. Rainfall (mm) 750-1000 450-650 450-1000
Population DensityPer Sq. Km. (1980) 52.7 41.2 25.2
Ave. Holding SizeHa. (1986) 2.8 2.4 2.4
Ave. Maize Ha. (1986 ) 1.5 1.3 1.3 a/
Ave. Maize Yields IMt/Ha. (1985) 2.7 1.7 1.4 IMt/Ha. (1986) 2.2 0.5 1.2
,
Ave. Maize SalesMt. (1985) 3.0 0.6 0.8 a/Mt. (1986) 2.5 0.2 0.6 a/
Ave. Household Size (No. ) 7.0 7.3 6.1
Households Owning DraughtAnimals (%) 62.0 42.0 N/A b/
Households Receiving AFCLoan (1986) (%) 37.0 5.0 13.0
Receive ExtensionAssistance 1985/86 (%) 66.0 33.0 N/A
Ave. Cash Income ($Z) 1363.0 425.0 N/A
a/ Total for smallholder sector divided by 800,000 households.
b/ The national CSO survey (1986) estimated 41 percent of householdshad no cattle. The Mangwende and Chivi estimates are for the percentageof households with two or more draft animals, including donkeys in Chivi.
Sources: CSO (NOb), CSO (1985), CSO (1986), CSO (various years),Mangwende and Chivi Surveys.
36
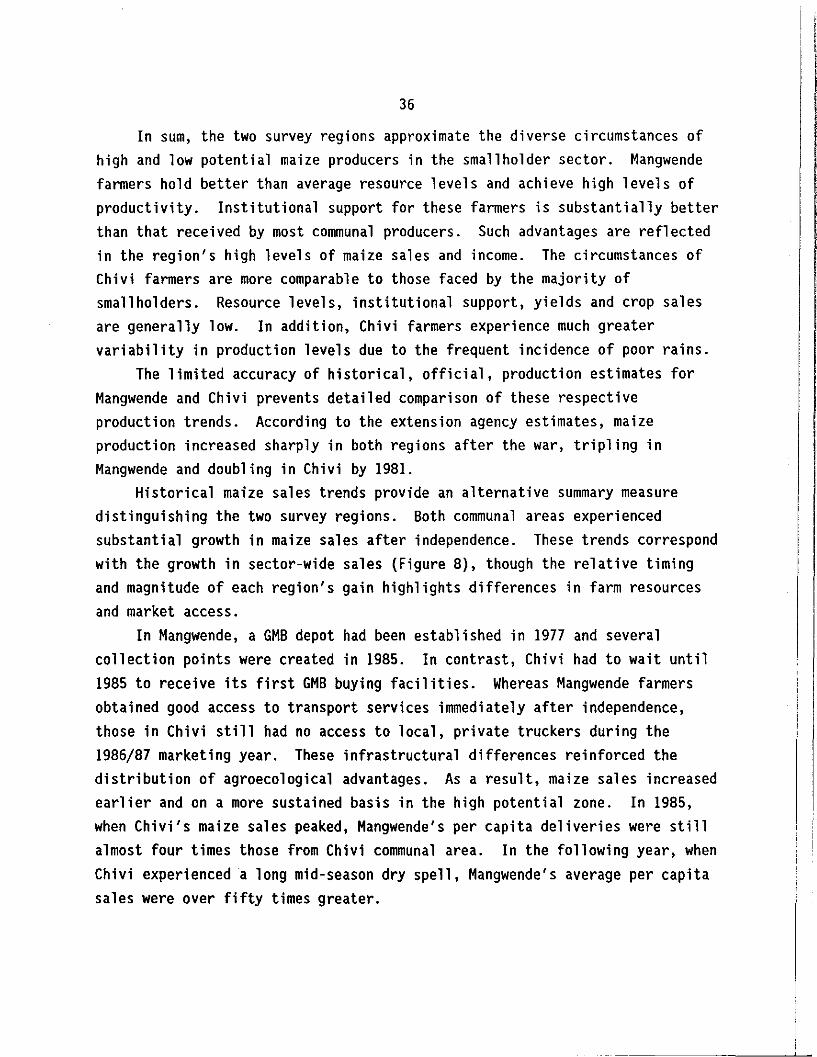
In sum, the two survey regions approximate the diverse circumstances ofhigh and low potential maize producers in the smallholder sector. Mangwendefarmers hold better than average resource levels and achieve high levels ofproductivity. Institutional support for these farmers is substantially betterthan that received by most communal producers. Such advantages are reflectedin the region's high levels of maize sales and income. The circumstances ofChivi farmers are more comparable to those faced by the majority ofsmallholders. Resource levels, institutional support, yields and crop salesare generally low. In addition, Chivi farmers experience much greatervariability in production levels due to the frequent incidence of poor rains.
The limited accuracy of historical, official, production estimates forMangwende and Chivi prevents detailed comparison of these respectiveproduction trends. According to the extension agency estimates, maizeproduction increased sharply in both regions after the war, tripling inMangwende and doubling in Chivi by 1981.
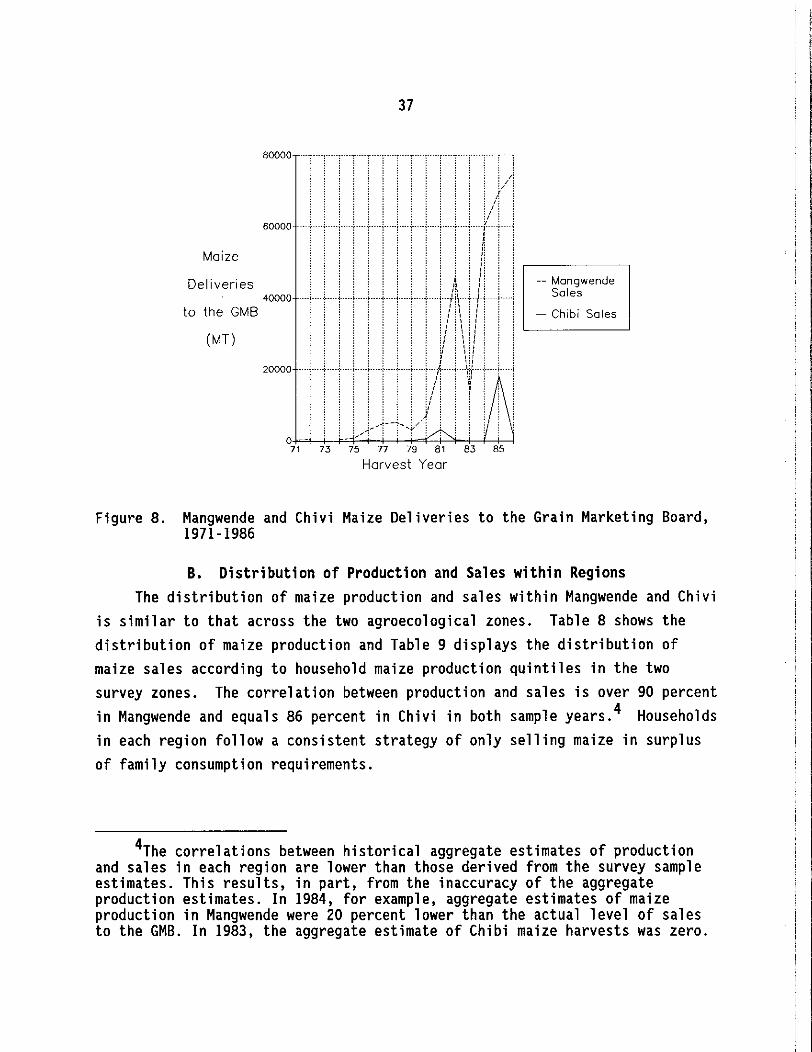
Historical maize sales trends provide an alternative summary measuredistinguishing the two survey regions. Both communal areas experiencedsubstantial growth in maize sales after independence. These trends correspondwith the growth in sector-wide sales (Figure 8), though the relative timingand magnitude of each region's gain highlights differences in farm resourcesand market access.
In Mangwende, a GMB depot had been established in 1977 and severalcollection points were created in 1985. In contrast, Chivi had to wait until1985 to receive its first GMB buying facilities. Whereas Mangwende farmersobtained good access to transport services immediately after independence,those in Chi vi still had no access to local, private truckers during the1986/87 marketing year. These infrastructural differences reinforced thedistribution of agroecological advantages. As a result, maize sales increasedearlier and on a more sustained basis in the high potential zone. In 1985,when Chivi's maize sales peaked, Mangwende's per capita deliveries were stillalmost four times those from Chivi communal area. In the following year, whenChivi experienced a long mid-season dry spell, Mangwende's average per capitasales were over fifty times greater.
!I
I ' iii60000 _·+···j·····j·····f····j
Maize
Deliveries
(MT)
80000
o --'71 73
37
.. "T"'-:-
75 77 79 81
Harvest Year
-- MangwendeSales
- Chibi Sales
Figure 8. Mangwende and Chivi Maize Deliveries to the Grain Marketing Board,1971-1986
B. Distribution of Production and Sales within RegionsThe distribution of maize production and sales within Mangwende and Chivi
is similar to that across the two agroecological zones. Table 8 shows thedistribution of maize production and Table 9 displays the distribution ofmaize sales according to household maize production quintiles in the twosurvey zones. The correlation between production and sales is over 90 percentin Mangwende and equals 86 percent in Chivi in both sample years. 4 Householdsin each region follow a consistent strategy of only selling maize in surplusof family consumption requirements.
4The correlations between historical aggregate estimates of productionand sales in each region are lower than those derived from the survey sampleestimates. This results, in part, from the inaccuracy of the aggregateproduction estimates. In 1984, for example, aggregate estimates of maizeproduction in Mangwende were 20 percent lower than the actual level of salesto the GMB. In 1983, the aggregate estimate of Chibi maize harvests was zero.

38
In both Mangwende and Chivi, twenty percent of the farmers produce atleast one-half of the region's maize. Depending on the quality of the season,they contribute a similar or higher proportion of each region's maize sales tothe GMB. These are the smallholders who benefited most from the expansion ofpost-independence support for communal agriculture.
In sharp contrast, the poorest 40 percent of maize producing householdsin both Mangwende and Chivi are largely subsistence producers. These farmersaccount for less than 13 percent of each region's maize production and lessthan seven percent of maize sales. In Mangwende, almost one-third of thesepoorer households appear to be consistent net maize buyers. Even in highrainfall years such as 1984/85, these households seem not to produce adequateharvests to meet family consumption requirements. Following the marginallypoorer 1985/86 season, 60 percent of these poorer farmers (14 percent of allfarm households) were net maize purchasers.
In Chivi, roughly one-half of the farmers in the lowest two householdmaize production quintiles appear to be chronically production insecure andhence are net maize buyers. A severe mid-season dry spell in 1985/86increased the proportion of net purchasers to over 60 percent of all farmhouseholds in the region.
The middle 40 percent of maize producing households in each region can betermed transitional. These harvest 25-40 percent of the maize in the twosurvey areas. In high rainfall Mangwende, most of these farmers generallysell small quantities of grain. In low rainfall Chivi, most of these farmersdo not participate in formal grain markets. In years in which rainfall isfavorable, these farmers generally satisfy their family consumptionrequirements through own-farm production. In drought years, many do not.
Farmers in each of these production quintile categories contributed tothe growth of aggregate smallholder maize production over the 1979 to 1985period. Though the relative size of the contributions of each group aredifficult to estimate, survey evidence, reviewed in more detail below,indicates the top twenty percent of producers in each region experienced thelargest production gains. These farmers similarly provided the principalsource of increased grain deliveries to the GMB.
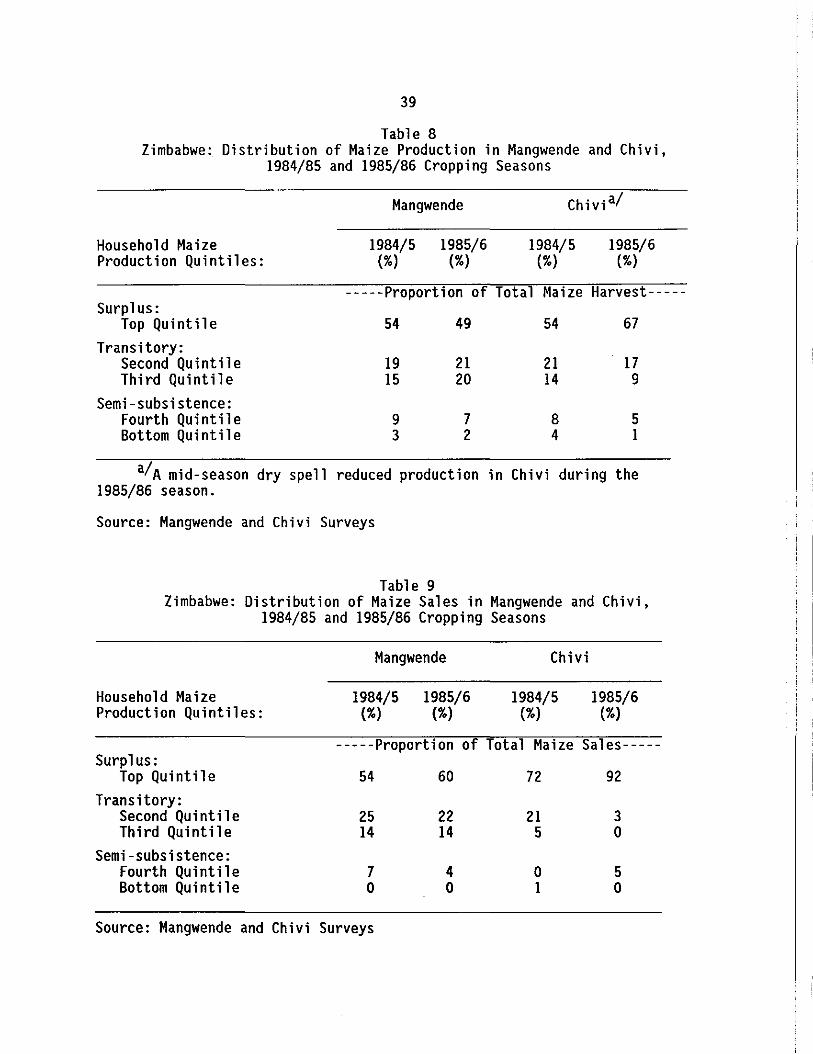
39
Table 8Zimbabwe: Distribution of Maize Production in Mangwende and Chivi,
1984/85 and 1985/86 Cropping Seasons
Mangwende Chivi a/
Household MaizeProduction Quintiles:
1984/5 1985/6(%) (%)
1984/5(%)
1985/6(%)
-----Proportion of Total Maize Harvest-----Surplus:
Top Qui nt il eTransitory:
Second Qu i nt il eThi rd Qui nt il e
Semi-subsistence:Fourth Qui nt il eBottom Qui nt il e
54
1915
93
49
2120
72
54
2114
84
67
179
51
a/A mid-season dry spell reduced production in Chi vi during the1985/86 season.
Source: Mangwende and Chivi Surveys
Table 9Zimbabwe: Distribution of Maize Sales in Mangwende and Chivi,
1984/85 and 1985/86 Cropping Seasons
Mangwende Chi vi
Household Maize 1984/5 1985/6 1984/5 1985/6Production Quintiles: (%) (%) (%) (%)
-----Proportion of Total Maize Sales-----Surplus:
Top Qui nt il e 54 60 72 92Trans itory:
Second Qu int il e 25 22 21 3Third Quintile 14 14 5 0
Semi-subsistence:Fourth Qui nt il e 7 4 0 5Bottom Quintile 0 0 1 0
Source: Mangwende and Chivi Surveys
40
c. Factors Distinguishing Alternative Smallholder Production SystemsTwo major, interrelated factors differentiate larger and smaller communal
maize producers and sellers in each agroecological zone: resource ownershipand access to institutional support. Farmers in the upper maize productionquintiles are better endowed and have obtained greater access to product andinput markets, credit, extension support and improved technology (Table 10).The expansion of agricultural support has still only reached part of thesmallholder sector. Additional programs of agricultural and other assistanceare required to improve the food security of farmers still suffering fromchronic and transitory supply shortfalls.
I. LandThere is a direct relationship between the size of a household's
landholding and the quantity of land planted to maize. Farmers across thethree surplus, transitory and semi-subsistence production system categoriesallocate roughly similar quantities of land to field crops other than maize.These are primarily grown for home consumption, though production surpluses ofsecondary crops are frequently offered for local sale. Most additional cropland on which farmers expect to produce a surplus is allocated to maize.
While smallholders in each production system category increased theircropping area after the war, many of the largest producers increased theirarea the most. Established producers sought additional land allocationsspecifically to expand maize production for the market. By 1985, surplusMangwende producers had 30 percent more land than transitory producers and 80percent more than semi-subsistence farmers. In Chivi, surplus producers hadalmost 50 percent more land than transitory producers and 90 percent more thansemi-subsistence farmers.
2. Draft PowerOwnership of draft power, a complementary resource to land, also
distinguishes farmers in each production system category. In Mangwende, thesurplus producers own almost four times as many draft animals as the bottom 40percent of semi-subsistence farmers. Most households in the lowest productionsystem category do not own enough animals to field a two-animal team. InChivi, the top 20 percent of producers own almost three times as many draft
41
animals as the poorest 40 percent. More than one-half of all households donot own enough draft animals to field a two animal ploughing team.
Farmers without draft power can generally borrow animals and equipmentfrom neighbors. As a result, virtually all fields in both Mangwende and Chiviare ploughed by animals. Nevertheless, ownership allows more timely ploughingand planting in coordination with the often inconsistent rains at thebeginning of the cropping season.
3. Farm laborThere appear to be no major differences in the quality and quantity of
full-time farm labor available to Mangwende households. This was unexpectedgiven that Zimbabwe smallholders are frequently said to face severe laborconstraints (low, 1986; Shumba, 1985). Perceived labor shortages provided themajor justification for on-farm herbicide trials conducted by both theagrochemica1 companies and a local farming systems research team. In Chivi,the top 20 percent of farmers have 20 percent more farm labor than the middleand bottom 80 percent (Table 10). In a production system based on low levelsof purchased inputs, this may be relatively important, particularly in higherrainfall years when weed competition is greater. 5
When survey respondents were asked to list their five greatest farmingproblems, few in either region cited labor constraints. A small numberidentified labor availability as a factor influencing their allocation of landamong different crops, however. The high labor requirements of finger millet,in particular, were noted.
Few farmers in either Mangwende or Chivi appeared to hire additionalagricultural labor. Farmers perceived labor hiring as expensive. High wagerates must be paid because of the availability of higher paying jobs in thenon-farm sector. Participation in communal labor groups was common,particularly in Chivi. But this did not increase the net availability oflabor to any particular household.
5labor availability did not significantly affect either the size of maizearea or yield levels in estimated regression equations for Mangwende andChibi. The plot specific data available for estimating Chibi's productionfunction were collected, however, during a season with a long mid-season dryspell.
I !, Ir !
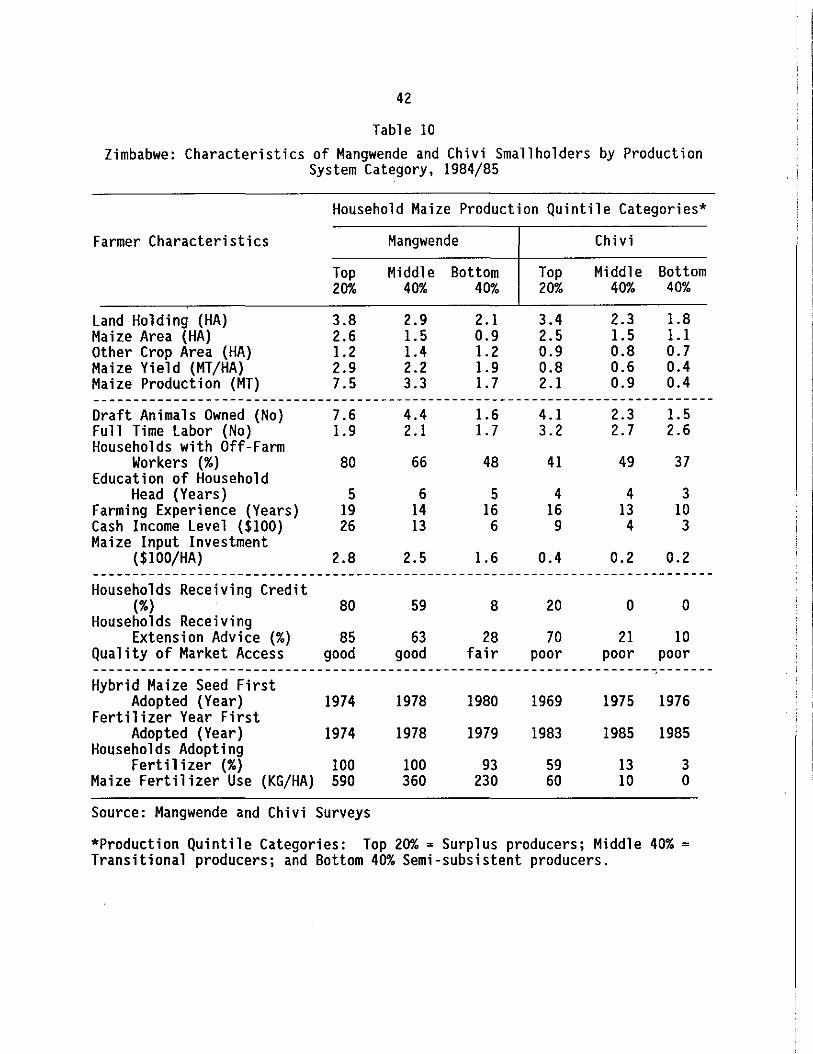
42
Table 10Zimbabwe: Characteristics of Mangwende and Chivi Smallholders by Production
System Category, 1984/85
Household Maize Production Quintile Categories*
Farmer Characteristics Mangwende Chivi
Top Middle Bottom Top Middle Bottom20% 40% 40% 20% 40% 40%
Land Holding (HA) 3.8 2.9 2.1 3.4 2.3 1.8Maize Area (HA) 2.6 1.5 0.9 2.5 1.5 1.1Other Crop Area (HA) 1.2 1.4 1.2 0.9 0.8 0.7Maize Yield (MT/HA) 2.9 2.2 1.9 0.8 0.6 0.4Maize Production (MT) 7.5 3.3 1.7 2.1 0.9 0.4------------------------------------------------------------------------------Draft Animals Owned (No) 7.6 4.4 1.6 4.1 2.3 1.5Full Time Labor (No) 1.9 2.1 1.7 3.2 2.7 2.6Households with Off-Farm
Workers (%) 80 66 48 41 49 37Education of Household
Head (Years) 5 6 5 4 4 3Farming Experience (Years) 19 14 16 16 13 10Cash Income Level ($100) 26 13 6 9 4 3Maize Input Investment
($100/HA) 2.8 2.5 1.6 0.4 0.2 0.2------------------------------------------------------------------------------Households Receiving Credit
(%) 80 59 8 20 0 0Households Receiving
Extension Advice (%) 85 63 28 70 21 10Quality of Market Access good good fair poor poor poor----------------------------------------------------------------------,-------Hybrid Maize Seed First
Adopted (Year) 1974 1978 1980 1969 1975 1976Fertilizer Year First
Adopted (Year) 1974 1978 1979 1983 1985 1985Households Adopting
Fertilizer (%) 100 100 93 59 13 3Maize Fertilizer Use (KG/HA) 590 360 230 60 10 0
Source: Mangwende and Chivi Surveys
*Production Quintile Categories: Top 20% = Surplus producers; Middle 40% =Transitional producers; and Bottom 40% Semi-subsistent producers.
43
Although household heads in Mangwende had an additional year or two ofeducation than those in Chivi, there are no significant differences in theeducational levels of the farmers across the three production classes withineach region. The surplus producing farmers tend, however, to have more yearsof farming experience in their current farm location.
4. Cash Availability for Input PurchasesThe various categories of producers in both Mangwende and Chi vi are also
differentiated by their relative access to cash for the purchase ofagricultural inputs. Most households rely heavily on cash derived fromsources other than crop production. The single largest income source wasfamily wage remittances. Additional cash was obtained from such sources aspoultry production, handicrafts, the provision of transport services andworking for other households during the winter season. Only the top 20percent of farmers in Mangwende earn the majority of their cash income fromfield crop sales. In both regions, surplus producers earn two to four timesas much cash income as households in the transitory and semi-subsistencecategories.
While all farmers view the availability of cash for input purchases as aconstraining resource, this problem is most severe for semi-subsistenceproducers in Mangwende and both transitory and semi-subsistence farmers inChivi. These households spend the most of their cash earnings on school fees.Many must also purchase food. After these expenses are paid, the resourcesleft for farm investments are small.
5. ExtensionThe larger maize producers generally have substantially greater access to
extension advice, though the significance of this interaction is difficult todetermine. Most such meetings are in a group context. Extension advice tendsto cover a wide range of crops and production techniques. Yet few farmersimplement the full range of maize recommendations and the advice received forother crops is generally ignored. Nevertheless, attendance at public meetingssuggests larger farmers view the advice as useful.
44
6. CreditThe distribution of agricultural credit favors larger producers in the
higher rainfall zone. Eighty percent .of the largest producers in Mangwendereceived credit during the 1985/86 season, whereas only eight percent of thesemi-subsistence producers obtained loans. Further, larger producers receivedloans averaging twice the level of those received by the medium and smallproducers. In Chivi, less than five percent of all farmers received loans.These were among the largest producers in the region.
7. Input and Product MarketsIntra-regional differences in market access within the Mangwende and
Chivi survey zones were more limited than originally anticipated when thesurvey samples were chosen. Distinctions appearing were more closely relatedto a household's relative level of market activity and proximity to amaintained dirt road, than the actual distance to major input and productmarket outlets. Farmers buying larger quantities of inputs and selling largerquantities of crops were more likely to be served by local transporters on atimely basis. This is because truckers sought to carry full loads and limitthe number of stops required for pick-up and delivery. Transporters alsopreferred to travel graded roads. A statistically significant relationshipwas estimated between proximity to a maintained road and maize sa1es. 6 Thislink was only partially offset by the organization of group deliveries.
The location and services offered by localized input retailers depends onthe demand for input supplies. Fertilizer and insecticide were more readilyavailable to farmers in areas containing many users.
D. Complementarity of Resources and InstitutionsBoth the aggregate analysis outlined in Chapter 3 and the 10cation
specific review of survey data in this chapter highlight the complementaryrelationship between farm resource levels, access to markets, the coverage ofagricultural support institutions such as credit and extension systems, andthe availability of improved technology. Smallholders situated in better
6See Rohrbach, 1988:255-257.
II[
I

45
agroecological zones with higher potential levels of productivity havebenefited from public and private investments in agricultural infrastructure.Government pricing policies more directly influenced the cropping strategiesof major market participants similarly concentrated in the high potentialzones.
Prior to independence, public policy makers and private businessmenviewed Zimbabwe's agricultural development in terms of the need to expandsupport for the large-scale commercial farm sector. Investments targetedtoward these commercial farmers were believed to yield the highest returns.Only at independence were major programs initiated in direct support ofsmallholder agriculture. Yet the same objective of seeking the highestinvestment returns oriented the expansion of infrastructural, institutionaland technological support in favor of small farmers in higher rainfall zonesand to farmers who had already proven themselves most productive. MostMangwende farmers received access to credit, whereas only a few of the largestfarmers in Chivi received loans. Mangwende received a GMB depot, three GMBcollection points and experienced a large increase in the number of localtransporters. Chivi obtained two collection points and no transport support.Mangwende farmers were visited by sales representatives from the major inputsupply companies and participated in privately run demonstration trials.Chivi farmers received no such assistance. Mangwende farmers were twice aslikely to see an extension agent and more likely to view a similar set ofrecommendations as relevant.
Within each agroecological zone, the largest smallholders received themost credit, extension and market support. Programs, policies andtechnologies initially defined as scale neutral, in practice, were not.Again, the distribution of benefits from public and private sector investmentsundertaken to date strongly favored smallholders with the largest farmresources. At least initially, ownership of farm resources was complementedby the opening of access to institutional resources.
There was not enough price variability in the survey regions to test thelocalized effects of maize price policy. Administered prices stood above
46
those in informal local markets. l Yet it appears that the complementaryrelationship between institutional, agroecological and farm resourcessimilarly characterizes the breadth of responsiveness to official prices.Farmers with access to more resources will always be most responsive. Thosewith fewer resources will be little affected by government producer pricepolicy.8 This conclusion corresponds with the results of the aggregateanalysis.
The post-independence expansion of smallholder maize production andmarket sales resulted from an explicit government policy of assistingsmallholder agriculture. This provided infrastructural and institutionalresources essential for taking advantage of available technology and favorableformal sector prices. It also provided a stimulus to a complementary set ofprivate sector investments on the part of major input suppliers, small-scaleretailers and locally based transporters. At least initially, better endowedfarmers benefited most.
E. Initial and Secondary GainsA major question for future government policy is how to sustain
smallholder production growth in the nation's high potential regions whileconstructing additional strategies to stimulate productivity growth amonghouseholds that are still food production and/or consumption insecure. Muchof the growth in smallholder maize production resulted from the expansion ofarea planted. Constraints on the further expansion of land holdings, whilenot as severe as suggested at independence, are becoming more difficult.Farmers have been expanding their crop area into grazing lands previously setaside as a means to limit environmental degradation and to ensure grazingresources for existing herds. These lands tend to have poorer soils and aresubject to greater erosion. A villagization program initiated by thegovernment in 1986 attempts to restrict the cropping of grazing lands andreclaim some lands already cleared.
lOuring the main post-harvest marketing season.
8They are more likely to be affected by consumer price policies.
l

47
Most of the area expansion immediately following the war resulted fromthe return of soldiers and refugees to farming and the termination of ruralviolence. This was a one-time gain. The growth of area per establishedproducer, particularly after 1981, marked a response to expanding productmarkets, improved access to credit and an initial relative decline in inputcosts. Though product markets are still expanding, the growth of credit hasslowed and input costs have substantially increased relative to productprices.
Yield gains resulted from the adoption of hybrid seed and application ofhigher rates of fertilizer. The expansion of hybrid seed use can largely beattributed to the expansion of input markets. Larger smallholders tended toadopt new seed earlier than smaller ones, most likely due to their greaterwillingness to accept risks. Yet the lag in adoption between the two groupswas not long. Both Mangwende and Chivi producers seem to have adopted hybridsearlier than the majority of Zimbabwe smallholders, most likely due to theirproximity to major roads linking urban market centers. Between 1979 and 1986,as the seed companies laid greater emphasis on expanding sales in thesmallholder farming areas, national rates of small farmer adoption increasedfrom an estimated 19 percent of maize hectareage in 1979 to 80 percent ofhectares planted in 1986. Future gains associated with the adoption ofexisting varieties of hybrid maize seed will be more limited.
Production function analysis in both Mangwende and Chivi identifiesfertilizer as the largest single determinant of maize yields (Rohrbach, 1988:181-192). The survey analysis also indicates that fertilizer purchases wereclosely related to credit access. Though most Mangwende farmers adoptedfertilizer before independence, rates of application were low. When creditbecame available, rates of application among credit recipients increased. In1986, 72 percent of fertilizer purchases in Mangwende were funded with credit,and credit recipients purchased 92 percent of total deliveries. In Chivi,fertilizer adoption followed the receipt of loans. Eighty-eight percent offertilizer purchases in 1986 were funded by credit and only credit recipientspurchased this input.
Credit recipients were generally larger smallholders who had proven theirability to produce enough surplus to repay their loans. Despite continuing
48
expansion in the proportion of smallholders registered to sell crops to theGMB during the 1980s, the growth of credit deliveries has slowed. Over twothirds of Mangwende farmers obtained loans between 1980 and 1986. By the endof this period, only 37 percent of these farmers still received agriculturalcredit. The proportion of recipients was declining. Only largersmallholders, most of whom had off-farm jobs, seemed to be consistentlyreceiving loans. In Chivi, credit was only granted to some of the largestproducers in the region and even these faced severe repayment difficulties. 9
The largest prospect for future gains in smallholder crop production liesin the development of improved location-specific technologies and increases inthe efficiency of current technology use. Smallholders haveproven their interest in adopting new seed varieties and hybrids. Mostrecognize the value of fertilizer, though investment costs are viewed as highrelative to expected returns and the alternative demands on family resources.This implies that the most promising new technologies will be low cost inputssuch "as new varieties and hybrids, and practices which help reduce productioncosts. The justification for highly variable rates of fertilizer applicationand similarly variable responses needs investigation. Enterprise budgetanalysis (Rohrbach, 1988) shows that rates of application recommended byextension services need reexamination. lO In higher rainfall zones, differentsets of recommendations may be justified for credit recipients and nonrecipients. In semi-arid regions such as Chivi, the development of improvedlow cost input recommendations is essential.
F. Distribution of Aggregate Production and Sales GrowthThe combination of aggregate and regional survey data provide a basis for
estimating the sector-wide distribution of smallholder maize production andmarket growth over the 1979 to 1986 period. Both aggregate and locationspecific data reveal that the increase in maize area was widely distributed,particularly during the immediate post-war period. Much of this gain resulted
9In 1984, 38.5 percent of the AFC's short term loans were in arrears(AFC, 1985).
10Recommended rates of application are too high.
I I

49
from an increase in the number of households and the reclamation of fieldsabandoned during the war. The Mangwende and Chivi survey data indicate, incontrast to national trends, that at least in these regions, smallholder maizearea continued expanding after 1982. This growth resulted, in part, fromcontinuing population growth. In addition, established farmers were stillexpanding their production for the market.
The aggregate smallholder sector data similarly indicate yieldsincreased throughout the country. A major justification for these gains wasthe expansion of area under hybrid seed. Research trials indicate theadoption of hybrid seed, without fertilizer, could increase yields by 30 to 45percent (Tattersfield, 1982; Olver, 1986). In addition, smallholders,particularly in the higher rainfall zones, were adopting and purchasing largerquantities of fertilizer. The use of fertilizer at rates close to recommendedlevels was estimated in research trials to increase maize yields up to 200percent.
The field survey data collected during this investigation primarilydepict the current distribution of smallholder maize production. In 1985 and1986, the top 20 percent of producers in Mangwende and Chivi accounted for atleast 50 percent of each region's total maize production. In 1985, averagemaize yields in Mangwende were 60 percent higher than those in Chivi, and in1986 they were more than four times greater. If the two survey regions areroughly representative of Zimbabwe's high and low rainfall agroecologicalzones, one can infer that, depending on the quality of the rainy season, 20percent of all smallholders produce 65 to 80 percent of the sector's totalmaize harvests.
These data also provide a basis for inferring that the largestsmallholder maize producers were the primary beneficiaries of governmentinvestments in credit, market infrastructure and high producer prices. Themajority of small holders cl assified as "transitory" or "semi -subsi stence"producers likely did not see their circumstances worsen. This is an importantaccomplishment. Yet these households still experience varying degrees of foodproduction and consumption insecurity.
Roughly 57 percent of the estimated growth in smallholder maizeproduction was delivered to the GMB. Most of this came from the larger
ft
!,I,
f

50
smallholders in the higher rainfall farming regions. If the distribution ofmaize sales in Mangwende and Chivi is roughly representative of thedistribution of deliveries from high and low rainfall maize production regionsof the country, then as few as 10 percent of smallholders may beresponsible for at least three-quarters of the sector's sales. In poorrainfall years, the skew is even greater.
Less than 27 percent of smallholders were registered to sell crops to theGMB following the record maize harvests of 1985. While unregistered farmerscould still sell crops through GMB Approved Buyers, survey evidence shows allconsistent maize sellers and most occasional sellers were registered. Thisevidence supports the results of the survey data. The growth of maize salesincreased the skew in smallholder incomes obtained from agriculturalproduction.
The sharp increase in GMB maize stocks, after 1980, reflects theproduction gains of a limited though significant proportion of the smallholderpopulation. It does not necessarily imply a general improvement insmallholder food security. Many of those households with the most limitedfarm resources contributed little to the sector-wide maize production gains.These households still have substantial need for expanded technological andinstitutional support. Zimbabwe's challenge is to sustain production advancesof the best endowed smallholders, while designing viable additional supportservices to improve both on-farm and off-farm production and employmentpotential for relatively low resource smallholders.
I
U
V. HOUSEHOLD FOOD SECURITY
The principal objective guiding government policies promoting thedevelopment of the smallholder sector in Zimbabwe was to encourage the growthof crop production (especially maize) and family incomes. This chapter takesa closer look at the effect of aggregate maize production growth on householdfood security. It evaluates the degree to which smallholder food securityactually improved.
A. Incidence of Smallholder Development PolicyGovernment policy aiming to promote smallholder development largely
treated the smallholder sector as a homogeneous group of farms. Most policieswere established with the intention of expanding support for all farmersirrespective of their resource levels, location or capacity to respond. Thesepolicies did not explicitly aim to maximize the productivity and growth of thelargest or most efficient smallholders. Nor did they directly aim to improvethe production and income levels of the poorest, or those households subjectto production and consumption deficits. Rather, a single set of governmentactions were broadly directed toward all smallholders throughout the country.
As can be seen from this analysis, the implementation of governmentpolicies was very successful among better endowed smallholders, particularlythose situated in higher rainfall zones. Extension recommendations were mostappropriate to farmers prepared to invest in modern inputs and theseexpenditures had the greatest payoff in the high potential regions. In lowrainfall regions, the value of these recommendations was questionable due tothe risks of drought and more severe cash constraints. Agroecological andfarm resource limitations influenced the distribution of smallholder credit.Agricultural loans reached ten percent of the country's most productive smallfarmers. Despite this, there were still repayment difficulties. There wasalso substantial growth in market infrastructure in the high potential zones.Expansion into regions of low productivity required significant additionalpublic sector operational subsidies. Official product and input pricingpolicies have primarily affected the minority of producers selling grain tothe GMB.
51

52
For logical economic reasons, private sector investment by inputsuppliers, retailers and transporters followed and reinforced public sectorcontributions. National vendors of fertilizer, seed and agrochemicalsexpanded sales in regions receiving the largest quantities of credit. Localretailers similarly expanded their stocks of inputs in response to risingmarket demand. Local farmers and small retailers invested in trucks toprovide farm-to-market transport as production and sales to the GMB increased.While these private sector investments increased rapidly in high potentialMangwende, investments in low potential Chivi remained severely limited.
Both public sector agencies and private sector agents sought to expandtheir services to smallholders while maximizing the returns on theirinvestments. 1 In order to offset this tendency, the Zimbabwe governmentplaced pressure on public agencies to expand the coverage of their services inthe low potential regions. The same types of assistance (e.g. credit termsand market infrastructure) were demanded in all regions of the country. Ineffect, public agencies were being asked to subsidize the provision ofservices to farmers in the low rainfall zones. Meanwhile, a governmentcommission was established to identify measures necessary to reduce parastataldebts. 2 The GMB's 19B6/87 marketing year trading deficit on maize alone wasZ$57.3 million (AMA, 1987). Agency administrators logically argued againstmeasures likely to increase their liabilities. 3
The net effect of these actions is revealed in the distribution of thegrowth of maize production and market sales. Factoring out the increases inproduction associated with the expansion in crop area due to the ending of thewar, only a minority of producers appear responsible for most of the growth insmallholder maize supplies. Most broadly, they encompass the 27 percent of
l Even in the national agricultural research service, scientistsinterviewed sought to concentrate their efforts on crops and in regions withthe highest potential payoffs. These were defined in terms of the probabilityof aggregate production gains and professional advancement.
2Though some of the largest of these debts were held by parastatalsoutside the agricultural sector.
3The AFC was under pressure to increase the number of loans in semi-aridsmallholder farming regions despite repayment risks. The GMB similarly facedpressure to expand the number of permanent depots in these areas.
---~-------- L
53
smallholders registered to sell crops to the GMB in 1985. Within this group,the ten percent of smallholders receiving AFC loans encompassed most of thelargest maize producers. Future efforts to broaden these gains may requirebetter targeting of support toward the specific needs of poorer, food insecurehouseholds.
B. Per Capita Coarse Grain RetentionsRoughly 40 percent of the estimated increase in communal sector maize
production, over the 1979 to 1985 period, was retained for family consumptionand inter-household sales at the village level. 4 Approximately two-thirds ofthe increase in these household retentions came before 1981. This gaincorresponds with the widespread expansion of cropped maize area following theending of the war. The growth of maize retentions after 1981 corresponds withcontinuing rural population growth and the substitution of maize foralternative coarse grains in consumption.
Using the official population growth estimate for the smallholder sectorof 2.8 percent (CSO, 1980), estimated per capita maize retentions increased 13percent between the two unusually favorable smallholder harvests of 1972 and1985. If, as seems to be commonly believed,5 the population growth rate wasactually over three percent, the increase in per capita retentions was stillmore than five percent.
The impact of the increase in maize retentions depends on the degree ofcrop substitution in consumption over the period. As discussed earlier,estimates by extension workers of crop area do not show a consistent patternof substitution in production. Smallholder sorghum area more than tripledbetween 1979 and 1983, the principal period of maize area gains. In contrast,estimated millet plantings declined by 30 percent during this period. Thisloss equalled the estimated increase in smallholder sorghum area, though someof the millet acreage was likely also reallocated to maize.
4Retentions in 1979 and 1985 were calculated by subtracting formal marketdeliveries to the GMB from estimated production.
5The World Bank (1985), for example, estimates Zimbabwe's populationgrowth rate was 3.2 percent per annum (1973-1983).
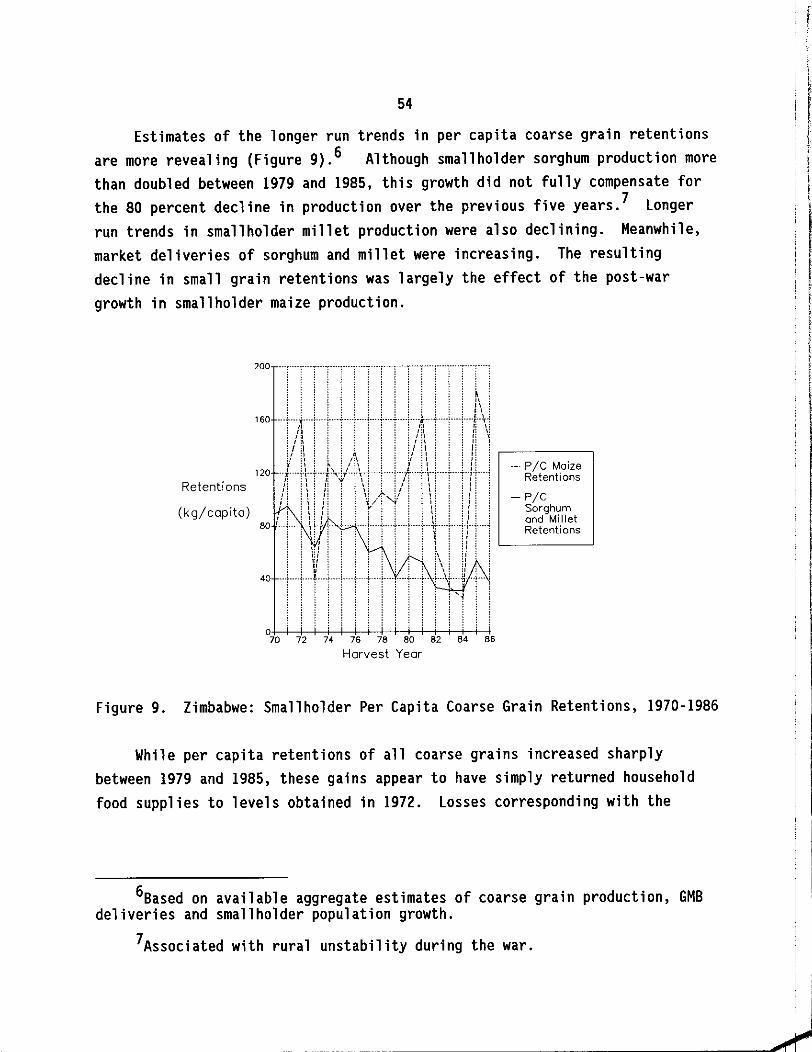
54
Estimates of the longer run trends in per capita coarse grain retentionsare more revealing (Figure 9).6 Although smallholder sorghum production morethan doubled between 1979 and 1985, this growth did not fully compensate forthe 80 percent decline in production over the previous five years. 7 Longerrun trends in smallholder millet production were also declining. Meanwhile,market deliveries of sorghum and millet were increasing. The resultingdecline in small grain retentions was largely the effect of the post-wargrowth in smallholder maize production.
I ;
I
200
-_. p/e MaizeRetentions
-p/eSorghumand MilletRetentions
-+- .~..40 "'f
! ! ),i i,i ,t\, i,i
i i .. i, ..160 "'j "J'··i· .1....i.....i ..: . . : ·~~·-·t ··~_··_;·_··fi.··t.:
: II : : 1:1 : : i ;i \in! l/i\! : I: t:/ q: : i: :/:1: .! ,'.! : -----,if ill ! i i l!\ i 1/ !\ ! I
120 ··J..··j·\··+···I-\·il+~+·~ .+..; ....~.\-.~ f··n ..!h i\ ! Ii 't' i \ i : / i . \ i i 1 i! i : \ :!: ) \/t~! i " \,!,: : I:I: i: iii!, ! i!
I . i Ii I: i Ii : I:
80 1••+ . \+i~' -+ B"'r ....:.,1....: .. ~t • • ~
\ : ii i[\! U ii \ i !I+.\ ._.~-
: '~
Retentions
(kg/capita)
o+---i-+--+-+---t-+--+-+---t-++-+-+-+-+-t70 72 74 76 78 80 82 84 86
Harvest Year
Figure 9. Zimbabwe: Smallholder Per Capita Coarse Grain Retentions, 1970-1986
While per capita retentions of all coarse grains increased sharplybetween 1979 and 1985, these gains appear to have simply returned householdfood supplies to levels obtained in 1972. Losses corresponding with the
6Based on available aggregate estimates of coarse grain production, GMBdeliveries and smallholder population growth.
7Associated with rural unstability during the war.
-
55
buildup of wartime instability were resolved. In the process, coarse grainconsumption patterns shifted in favor of maize.
If smallholder population growth rates were higher than official Zimbabweestimates, per capita coarse grain retentions may have declined. Yet,communal sector grain supplies were substantially larger than they would havebeen without the sharp post-independence maize production growth. The maizeproduction gains were geographically widespread, encompassing all majorproducing regions of the country. The larger relative gains in thehigh potential regions and among larger smallholders allowed the expansion ofmarket sales and helped build national stocks. Production advances in thesemi-arid regions and among more marginal producers were largely retained forhome utilization. This is where there was the most substitution of maize foralternative small grains in the diets of smallholder households.
C. Households with Continuing Production DeficitsSurvey results on the proportion of Mangwende and Chivi households who
remain net grain purchasers provide a basis for roughly estimating theproportion of smallholders experiencing persisting food production insecuritydespite the post-independence maize production gains. Mangwende and Chi vismallholders pursue a relatively consistent strategy of retaining grainrequired for household consumption and selling the remainder. Few householdssell grain shortly after harvest and repurchase their food requirements laterin the season. When this was done, only a small portion of the harvest wassold to meet immediate cash requirements. 8 In most cases, significant grainpurchases indicate a household did not produce enough to meet familyconsumption requirements.
In 1985, despite favorable rains, roughly 12 percent of Mangwendehouseholds did not produce enough maize to meet their family requirements. 9
In Chivi, though maize harvests reached record levels, almost one-quarter ofall households did not produce enough for their consumption needs. In both
8This strategy is also apparent in survey results from other parts of thecountry (e.g. Stanning, 1987).
9This observation is based on each household's estimate of itsconsumption requirements.
II
II
III
56
regions, local maize surpluses from net seller households amply covered therespective shortfalls of deficit producers. Quantities of grain available forvillage level sales were adequate to meet local market demand.
In 1986, due to poorer rains, 24 percent of Mangwende farm households andalmost 60 percent of Chivi households claimed they needed to purchaseadditional grain to meet family consumption requirements before the nextseason's harvests. While the needs of Mangwende's net purchasing householdscould still be met locally, estimated purchases in Chivi were more than twicethe total level of forecast maize sales. Hence, the Chivi region was a netmaize importer. Seven months after the 1986 harvests, the government begandistributing food aid in the area.
The principal result of product market expansion was to establish a floorprice effective in years of good harvests. Survey results for Mangwende andChi vi indicate that in years of favorable rainfall, official producer pricesoffered by the GMB roughly equalled local market prices less farm-to-markettransport costs. In drought years, local maize prices increased aboveofficial levels in net importing regions. The higher production levelsinduced by the expansion of support for smallholder agriculture helped limitthis rise in farmgate prices.
This relationship was particularly evident in drought prone Chivi. Theaverage price of inter-household maize sales following the good 1985 harvestswas about Z$0.14 per kilogram. In comparison, the price offered at local GMBcollection points averaged Z$0.17 per kilogram. The difference roughlycovered transport costs from farm to the collection point. Most sales weremade to the GMB. In contrast, following the poor 1986 harvest, the price ofinter-household transactions increased 30 percent above the GMB price. 10 Theonly sales made to the GMB were to repay credit obligations. If localproduction levels had not increased since independence, this price increasemight have been substantially greater.
The persistence of large groups of rural households with productiondeficits highlights a fundamental issue: increasing aggregate grainproduction will not automatically solve hunger and family food insecurity.
10Two months before the beginning of the 1986/87 season harvest.

57
While estimated household maize retentions increased, a substantial portion ofthe smallholder sector still experience both transitory and chronic foodproduction and consumption insecurity. Unexpectedly, this includes farmers inhigh as well as low rainfall regions of the country. The broadly focusednational programs to increase smallholder production improved smallholder foodsupplies. Yet the results of a disaggregated analysis show additionaltargeting of development assistance may be required to ensure that householdsstill facing production deficits have adequate food access.
D. Income and Employment GenerationBetween 1979 and 1985, the value of smallholder maize sales to the GMB
increased by more than Z$62 million in real terms. The real cost ofadditional fertilizer and hybrid seed purchases, the principal variable cashinput of maize producers, increased roughly $20 million. Even accounting forincreases in the costs of other production inputs, the infusion of capitalinto the smallholder economy was substantial.
The effects of this income growth were felt in numerous ways. Mangwendeand Chivi results indicate farmers invested a large portion of this gain inchildrens' schooling. As local incomes increased, investments in school feesalso rose. In addition, farmers sought to send their children to moreexpensive, higher quality schools. Interviews with local merchants andtransporters revealed that smallholders also invested in the expansion ofmarket services. A small number of households opened small retail storesselling agricultural inputs and consumer goods. A few purchased lorries totransport goods to market and inputs to the farm. Many invested in improvingtheir housing, purchased furniture and other consumer items. The limitedexpenditure data collected in 1985 and 1986 indicates investments in cattleand production equipment were relatively small.
While most market earnings were received by net maize sellers, theportion of income reinvested in local industry served to increase ruralemployment. Net maize purchasing households earn most of their cash incomerequired to purchase food from farm enterprises other than grain and oilseedproduction. These include poultry sales, transporting goods, handicrafts,vegetable sales and working for others. Data is unavailable to measure the
58
increase in these earnings over the post-independence period. It isreasonable to assume, however, that the substantial growth in maize productionand sales increased cash income earning opportunities.
Unexpectably, despite the broad expansion of smallholder maizeproduction, there was little evidence that farmers were hiring more fieldlabor. The labor demands of the high input maize enterprise are more thandouble those of low input maize in high potential Mangwende. ll Additionallabor was also required as a result of the expansion of cropped area. Yet thesurvey revealed these additional requirements were largely met from within thefamily.12
The growth of smallholder maize production can be linked, however, withan expansion in the nation's aggregate off-farm employment opportunities.Agriculture accounts for about 14 percent of GOP and is the second largestsingle sector of the economy behind manufacturing (23 percent of GOP).Agriculture provides 30 to 40 percent of the nation's foreign exchangeearnings. The foreign exchange earnings are of critical importance to themanufacturing sector which imports roughly 25 percent of its inputs (Morna,1987). The substantial contribution of smallholder agriculture to the growthof the agricultural sector as a whole, in 1980, 1981 and 1985, clearlycontributed to an increase in total GOP and to a corresponding increase informal sector employment (Table 11).
In Mangwende and Chivi, respectively 44 percent and 36 percent of malehousehold heads hold off-farm jobs. Many families have sons and daughtersworking off the farm. The remittances provided by these family membersprovide a source of investment capital for the farming system and a source ofcash to purchase food in periods of drought. Remittances both fund schoolfees and provide a major incentive for educational investments.
One of the most difficult problems Zimbabwe faces over the next twentyyears is the expansion of off-farm employment opportunities for secondaryschool graduates. In recent years, the expansion of formal sector employment
IISee Rohrbach (1988) Appendix B.
12The justification for this discrepancy requires further investigation.Though relatively few plots received high input applications, the sources ofadditional family labor are unknown.
!
II
\
I
If
I
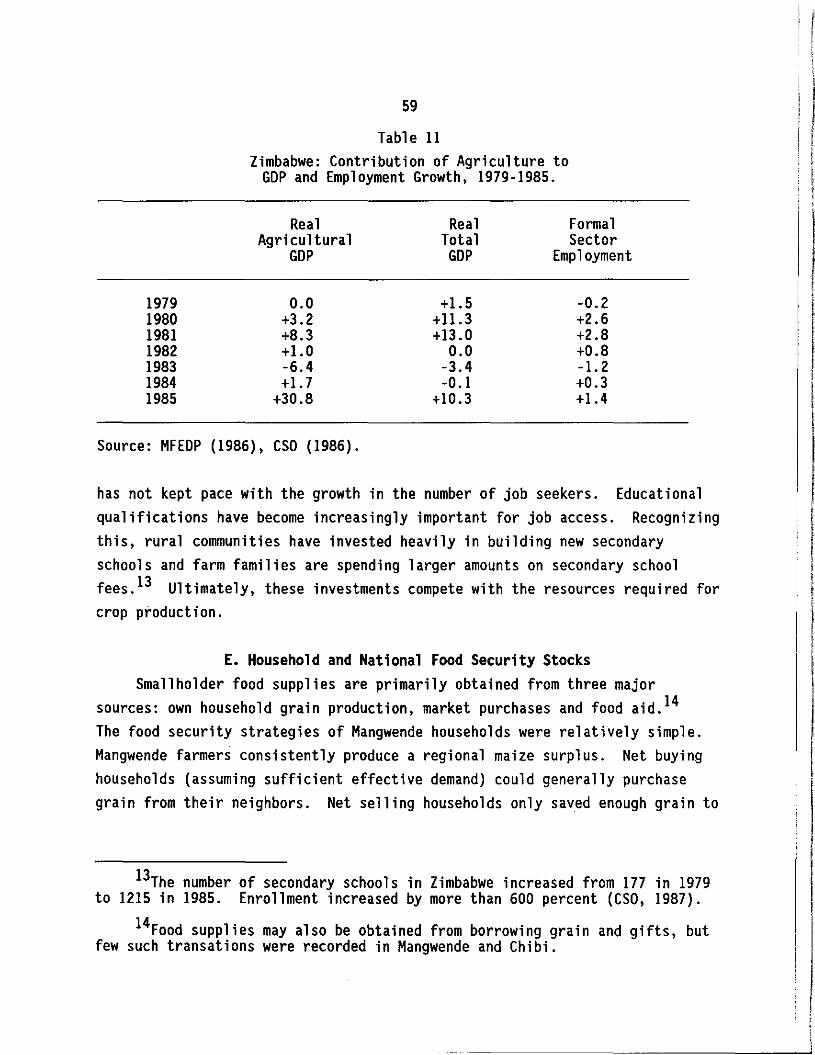
59
Table 11Zimbabwe: Contribution of Agriculture to
GOP and Employment Growth, 1979-1985.
Real Real FormalAgri cultura1 Total Sector
GOP GOP Employment
1979 0.0 +1.5 -0.21980 +3.2 +11.3 +2.61981 +8.3 +13.0 +2.81982 +1.0 0.0 +0.81983 -6.4 -3.4 -1. 21984 +1.7 -0.1 +0.31985 +30.8 +10.3 +1.4
Source: MFEDP (1986), CSO (1986).
has not kept pace with the growth in the number of job seekers. Educationalqualifications have become increasingly important for job access. Recognizingthis, rural communities have invested heavily in building new secondaryschools and farm families are spending larger amounts on secondary schoolfees. 13 Ultimately, these investments compete with the resources required forcrop production.
E. Household and National Food Security StocksSmallholder food supplies are primarily obtained from three major
sources: own household grain production, market purchases and food aid. 14
The food security strategies of Mangwende households were relatively simple.Mangwende farmers consistently produce a regional maize surplus. Net buyinghouseholds (assuming sufficient effective demand) could generally purchasegrain from their neighbors. Net selling households only saved enough grain to
13The number of secondary schools in Zimbabwe increased from 177 in 1979to 1215 in 1985. Enrollment increased by more than 600 percent (CSO, 1987).
14Food supplies may also be obtained from borrowing grain and gifts, butfew such transations were recorded in Mangwende and Chibi.
II
i
II,f
60
last until the next harvest. 15 If village supplies were limited, Mangwendefarmers could readily purchase maize meal in local retail outlets.
Food security strategies in Chivi were more complicated, especially indrought years when the region was a net importer. While maize is thepreferred food grain in this low rainfall region, sorghum and finger milletwere recognized as more drought tolerant crops. Maize-finger milletintercrops were common. Farmers reasoned that if rains were good, maizesupplies would be adequate and finger millet could be placed in storage andused for beer brewing. 16 If-rains were poor, finger millet supplies could beused for food. If a large quantity of finger millet remained in householdstocks, the proportion of land allocated to finger millet would be reduced.
Farmers in Chi vi also depended on access to food available under droughtrelief programs. These were particularly important for households withlimited cash to purchase maize meal in local shops. This included most Chi vihouseholds experiencing production deficits. The implementation of nationaldrought relief programs was made possible by the high post-independence levelsof national maize stocks. By contributing to the build up of GMB stocks,surplus producers were contributing indirectly to the food security of deficitproducers such as those in Chivi. These programs may also have increased thewillingness of farmers to risk the allocation of a larger proportion of theirland to maize.
Between 1982 and 1984, roughly one-third of the smallholder sectorreceived drought relief assistance. Approximately Z$100 million was allocatedto the drought relief program and another Z$10 million was allocated to anassociated set of public works projects (MFEDP, 1986). Concern over thepossibility of continued drought during the 1984/85 cropping season forcedZimbabwe to import maize in 1984. Yet these were the first, and last maizeimports since independence. Record smallholder maize production and sales in1985 again increased stocks to record levels. This allowed Zimbabwe to exportgrain while mounting a large domestic drought relief program in 1987.
15Farmers did not pursue a strategy of stocking maize across yearsbecause of the limited storage life of hybrid grain.
16Bulrush and finger millet could be stored, according to farmers in bothMangwende and Chibi, for up to ten years.

61
F. National and Household Food SecuritySmallholder food security undoubtedly improved as a result of the massive
post-independence growth of communal maize production and market sales. Theextent of this improvement appears less, however, than the aggregate supplytrends broadly indicate. This seeming contradiction highlights some importantdifferences between the growth of food availability and food access. Arelated set of distinctions characterize the relationship between national oraggregate food security and household food security.
While maize production increased throughout the smallholder sector, thelargest proportion of these gains were concentrated among larger smallholdersproducing for the market. Estimated per capita maize retentions increasedabove levels achieved in the early 1970s. But per capita retentions ofalternative coarse grains were declining. Total per capita grain availabilityin the communal areas was constant or could have fallen.
Households experiencing production shortfalls could offset these deficitsby purchasing grain. Besides production, food access is, accordingly,contingent on family income levels and food prices. Survey evidence indicatesthat most net food purchasing households were among the poorest in theirrespective regions. The allocation of family resources to the purchase offood limited the availability of cash for investment in crop production.Further, the multiplier effects of the aggregate increase in smallholder maizesales appear to have been limited. The largest increases in income were inhigh rainfall regions containing fewer households experiencing foodinsecurity. Further, much of this additional income seems to have beeninvested in manufactured goods produced outside the rural areas.
The expansion of access to GMB delivery points appears to have increasedlocal grain prices in favorable rainfall years. This provided an incentive toexpand crop area and production for outside markets. In effect, the GMBbecame a competitor with households consistently facing production deficitsfor surplus grain. In years of drought, however, the growth of regionalproduction helped limit the rise in local food prices.
Smallholder food security is clearly better than it would have beenwithout the large post-independence maize production and income gains. Yet asignificant proportion of these farmers face persisting transitory and chronic
I!l
IIIII
I!
I
62
insecurity. These are farmers unable to produce enough grain to meet familyconsumption requirements and, due to cash income constraints, have a limitedcapacity to purchase additional grain. In Mangwende, a communal area situatedin one of Zimbabwe's most favorable agroecological regions, few householdsexperience chronic consumption deficits, though upwards to 25 percent mayexperience transitory insecurity.I7 In Chivi, a region agroecologicallyrepresentative of the majority of the communal sector, up to 20 percent ofhouseholds face continuing difficulties obtaining adequate calorie supplies.At least 60 percent of Chivi households experience transitory shortfalls.Food insecurity persists throughout Zimbabwe's communal farming areas despitemassive maize stocks.
Smallholder food security policies must ultimately be judged in terms oftheir effect on the production and consumption levels of householdsexperiencing transitory and chronic consumption deficits. This analysis hasshown that record levels of smallholder maize production and national maizestocks have not resolved the food security constraints faced by many, if notmost, small farm households. Aggregate national food security is notautomatically equivalent with household food security. The growth of grainproduction by high potential smallholders is required to increase aggregatefood supplies. This contributes to household food security. Yet additionalactions are required to further aid families still experiencing persistentproduction and consumption constraints. Future smallholder developmentstrategies may need to be more targeted.
I7These estimates of the proportion of households experiencing foodinsecurity are only rough orders of magnitude based on survey data identifyinghouseholds with production deficits and general information regarding incomeconstraints.
II
I,
VI. SUMMARY AND DISCUSSION OF ON-GOING FOOD SECURITY CHALLENGES
The post-war tripling of smallholder maize production in Zimbabwe isremarkable. Average household food supplies sharply increased and rising cropsales improved average small farm incomes. Higher smallholder incomes fueledexpanded investment in rural small-scale trade and commerce. Farmers investedmore in their childrens' education. Most significantly, small farmers came tobe recognized as important actors in the nation's agricultural economy.
In Zimbabwe's First Five Year National Development Plan covering theperiod 1986 to 1990, smallholder crop production was forecast to grow at aneight percent average annual rate (MFEDP, 1986). This optimism was based onthe dramatic production record of the previous six years, and the belief thata strong institutional foundation for continuing growth had been laid. Theexpectation was that use and further expansion of these institutions wouldpromote growth across a widening cross-section of the communal farm sector.
This study's analysis of factors underlying the post-war growth ofsmallholder production indicates that a new, supplementary set of investmentstrategies are required to broaden the scope of past production advances.These new investments must build upon an understanding of the strengths andlimitations of past efforts, particularly considering the distinct needs offarmers still experiencing chronic and transitory food deficits. While theoptimism of the latest development plan is partially warranted, the extensionof post-independence production gains across a wider cross-section of thesmallholder population will undoubtedly be more difficult. Before discussingthese challenges, let's review findings from previous chapters about thefactors associated with Zimbabwe's success story.
A. The Sources of Growth of Maize ProductionThis study has shown that no single factor explains the growth of
smallholder maize production and sales during the post-war period. Rather,most of this growth must be attributed to a complementary set of changes inagricultural policies, institutions and technologies. Public sector actionswere reinforced by private sector investments. The relative effect of these
63
64
programs was influenced by the level and quality of production resourcesavailable to various types of smallholder households.
The six most important causes of smallholder maize production growthwere: a) the ending of the independence war, b) the expansion of productmarkets, c) the expansion of smallholder credit, d) the expansion of inputmarkets, e) the maintenance of favorable producer prices and f) strongresearch and extension support.
1. Ending of the Independence WarOne of the most significant explanatory factors for the growth of
smallholder production was simply the ending of the independence war. Thisstruggle had widely disrupted communal sector agriculture, particularly duringthe mid to late 1970s. Post-war estimates indicate up to one-third of allsmallholders required resettlement assistance. Fields had been abandoned,farmers had left their homes and fewer new holdings had been created. Inaddition, significant portions of the limited agricultural infrastructureavailable to small farmers had been destroyed. In many parts of the country,extension workers themselves had been withdrawn.
Most of the estimated 85 percent increase in smallholder maize area,between 1979 and 1981, can be attributed to the ending of the war. Surveyevidence from Mangwende and Chivi indicates substantial growth in producernumbers and widespread replanting of abandoned fields. Communal area andprovincial level data show similar area growth throughout the country. Maizearea expanded in the context of a 25 percent expansion in total cropped areain the smallholder sector. The amount of land planted to all other majorsmallholder sector crops, except millet, similarly increased. The largerrelative growth in maize area corresponds with this crop's status as theprincipal smallholder food staple. The majority of the associated increasesin production were retained for household consumption.
2. Expanded Access to Product MarketsPrior to independence most smallholders faced low
because they had limited access to GMB buying outlets.GMB depots had been established in the communal areas.
farm gate pricesBy 1980, only threeOnly three percent of
65
smallholders were registered to use these depots. While farmers could sell toGMB Approved Buyers, officially mandated prices were not enforced. Fewtransporters were available to provide farm-to-market deliveries.
By 1985, the GMB had established 14 communal area depots and 135temporary collection points. Approved Buyers faced increased competition fortheir services. The number of locally based transporters rapidly expanded,particularly in regions with large and consistent marketable surpluses. Atthe time of 1985 harvests, 27 percent of the nation's smallholders wereregistered to sell crops to the GMB. The initial growth of maize salescorresponds closely with the expansion of market infrastructure.
3. Smallholder CreditSmallholders first gained wide access to agricultural credit with the
establishment of a major small farm credit program in 1978. By 1985, roughly10 percent of communal farmers received agricultural loans. The expansion ofcredit access corresponds closely with the growth of fertilizer sales afterindependence. In Mangwende, three-quarters of all fertilizer purchases werefunded with loans in 1986. Almost 90 percent of the fertilizer purchased inChivi was funded by credit. Fertilizer adoption, in this low rainfall zone,corresponds with the initial receipt of AFC loans.
4. Input SuppliersPrivate sector input suppliers rapidly expanded their services in the
smallholder farming areas as the demand for their products increased.Fertilizer and agrochemical companies began promoting use of their inputs withvillage based sales and demonstration trials. Urban input wholesalersestablished branch outlets in rural growth points and the number of retailoutlets expanded. Private sectQr investments expanded most in areas receivingthe largest government investments in product market infrastucture credit.
5. Favorable Producer PricesThe influence of administered prices on smallholder production and sales
depended on the distribution of access to GMB buying points. The sharpproducer price increases in 1980 and 1981 primarily affected the small
I
I[i
66
proportion of farmers with good market access. When official producer pricesdeclined (in real terms) after 1981, sales continued increasing as marketinfrastructure expanded. Between 1981 and 1984, real maize prices declined bymore than 20 percent. Although drought reduced smallholder production levelsduring this period, maize sales increased a further 15 percent. In fact,maize sales in high potential Mangwende increased throughout the 1979 to 1985period. In low rainfall Chivi, deliveries remained marginal except whenseveral GMB collection points were temporarily established in 1985.
6. Research and ExtensionThe doubling of smallholder maize yields, between 1979 and 1985, was
possible because improved production technologies were available. Decades ofbreeding research had produced maize hybrids broadly adapted to both high andlow rainfall zones. Fertilizer trials had provided recommendations broadlyattuned to communal area conditions, particularly to regions with betterrains. A major portion of the payoff to this research only came after farmersobtained improved access to these inputs, and once the production of amarketable surplus became profitable.
Between 1979 and 1985, hybrid seed sales increased roughly fivefold.Smallholder sales of fertilizer increased by more than 400 percent. Newinterest in improved technologies sparked trials with herbicides andinsecticides.
B. The Limits on Future Maize Output GrowthMuch of the growth in smallholder maize production can be directly or
indirectly attributed to the ending of the independence war and establishmentof majority rule. These gains exemplify the economic losses resulting fromrestricting the scope of government and private sector agriculturalinitiatives. Yet the time has now come to reassess how best to capitalizeupon these advances. The pronouncements of the National Development Plannotwithstanding, the recent growth in smallholder maize production is unlikelyto continue. The limits facing each of the above factors supporting growthshould be recognized. As discussed below, new policies and programs need to
\
Ii
II
II
67
be defined that extend and expand the post-war gains in smallholderproductivity and food security.
From a macro perspective, the sudden and substantial growth in maize areaassociated with the ending of the war will not be repeated. While populationgrowth may stimulate further increases in crop area planted, this expansionwill not approach the magnitude of the immediate post-war gain. The capacityfor continuing expansion of smallholder crop land is unclear. The perceptionof severe communal sector land constraints has provided a major justificationfor government investments in the resettlement of small farmers onto largescale farms. The extension service is now actively restricting the expansionof smallholder crops onto lands previously set aside for grazing. And theoverall pace of resettlement has slowed. This implies that most future gainsin smallholder crop production will need to be derived primarily fromtechnological change.
Likewise, the coincidence of large national coarse grain stocks, downwardpressure on coarse grain prices, mounting input costs, and a large and risinggovernment budget deficit, calls for improved productivity in the use of farmand government resources. There have been major benefits for domesticconsumers (both rural and urban) of having large national maize stocks fromwhich drought relief programs could be mounted. There are, however, very highcosts associated with creating and maintaining such large maize stocks.
Ultimately, the further expansion of these stocks will not prove viableunless maize can be exported at an economic profit. Much of Zimbabwe's maizeexports since independence have been made at a financial loss. A majorobjective of programs aiming to further expand smallholder maize production,destined for the national as well as international market, must be to improvefarmer profitability while reducing production costs. To the extent thatnational maize output increases with constant or even declining real costs,food security of poor households purchasing maize can be more easily improved.
A major part of the post-war growth in smallholder maize yields resultedfrom the widespread adoption of hybrid seed. Rapid adoption by farmers inboth high and low rainfall zones is attributable to the large yield advantageover the old open pollinated varieties, with or without fertilizer.Correspondingly, by 1986, roughly 80 percent of smallholder maize land was
\
I[fI

68
planted to these hybrids. Extension of this coverage may require thedevelopment of new shorter season hybrids suitable to the country's droughtprone regions. Yet the national maize breeding program is concentrating onthe development of improved medium season hybrids more suitable to the higherrainfall zones (Olver, 1986).
Based on the current study, it does appear that there is considerablescope for increasing the technical and allocative efficiency with whichcurrent cropping technologies are employed. For example, the wide variabilityin rates of fertilizer application does not simply correspond with thequantities of fertilizer each household can purchase, nor with different soilconditions. And the causes of widely variable responses to similar rates ofapplication requires further investigation. One reason for the latter resultsfound in the current study is that many farmers are applying basal fertilizerto maize long after the period of optimal response.
Similarly, extension recommendations must be more closely tied with thechanging profitability of input investments. The effect of rising fertilizercosts on maize profitability has not been reflected in extension advice. Infact, little economic evaluation of extension recommendations for thesmallholder sector was even conducted during the immediate post-independenceperiod. This study has shown that most farmers were rejecting most extensionworker advice, particularly for crops other than maize. Both the research andextension services need to be asking why.
Maize yield gains also resulted from the adoption and higher rates ofapplication of fertilizer. Capital constraints and the risks of lossesresulting from drought have limited adoption of fertilizer in the smallholdersector's dominant low potential zones. Further, as fertilizer pricesincreased relative to maize product prices during the mid-1980s, theprofitability of fertilizer investments declined. Correspondingly, the rateof growth in fertilizer purchases has substantially slowed.
These problems are mirrored in the limited coverage of national creditprograms, the slowing of credit dispersement and rising repayment arrears.Based on farm survey evidence, rates of fertilizer application in both highand low rainfall areas are closely linked with the receipt of credit. Whiletwo-thirds of the small farmers in high potential Mangwende have received
I
I,Il

69
credit, fewer than ten percent of those in low rainfall Chi vi have receivedloans. More significantly, over half of the farmers in Mangwende who receivedcredit between 1980 and 1985, no longer received loans in 1986. Yet creditrecipients in Mangwende and Chivi account for 72 percent and 88 percent offertilizer purchases, respectively. limits in credit allocation translateinto limits in the growth of fertilizer usage. And despite the slowing incredit dispersement, the AFC has encountered a growing level of arrears.
Agricultural services and infrastructure require strengthening, in part,through better targeting. Recognizing these problems, the AFC has alreadybegun to decentralize its operations in order to improve responsiveness tofarmers' needs. The goal is to better identify credit worthy households,improve the tailoring of credit packages to location-specific needs andresolve repayment constraints in a more timely fashion. In the past, the AFChas faced pressure to rapidly increase the number and value of loans providedto the smallholder sector. The decentralization exercise should aim toimprove the efficient use of borrowed funds. Overall, capital shortagesappear to be among the most significant constraints limiting crop productioninvestments. Besides improving existing operations, the AFC must activelyseek new measures, such as group lending and local savings mobilization, tohelp promote agricultural investment.
While the number of GMB depots continues to expand, financial constraintshave limited the establishment of seasonal collection points. In 1985, manyregions sold grain to the GMB for the first time, because of the establishmentof a nearby collection point. Most of these temporary buying centers have notbeen reconstructed. Questions remain how best to assist the majority ofsmallholder farming areas which are characterized by generally low andvariable crop sales.
The GMB has recognized the need to assess the economic viability ofdepots and collection points, particularly those placed in lower rainfallareas. If marketing services are to expand, in both high and low potentialzones, public sector initiatives may be required to stimulate investments bythe private sector. For example, high GMB stockholding costs argue for theabolition of pan-seasonal producer prices so as to provide incentives forprivate traders to carry inventories. Also in some regions, investments in
!II
f
I
I1
70
transport infrastructure, including loans for trucks, may be more appropriatethan the establishment of additional buying points.
c. Strategies for Improving Household Food SecurityEvidence reviewed throughout this report testifies to the importance of
the distinction between the growth in aggregate, national maize supplies andimprovements in household food security. While maize production growth hascontributed importantly to national food security, significant portions of thesmallholder population continue to face production and consumption deficits.Large maize stocks have provided the basis for the almost perennial domesticdrought relief programs instituted in Zimbabwe since independence. Yetgreater and more consistent improvements in household food security requirespecial attention to the needs of the 40 percent of Mangwende and Chivifarmers identified as transitional, and the 40 percent classified as semisubsistence producers. 1
Much more needs to be learned about viable ways to raise incomes of thistarget population. The evidence derived from this study indicates at least 60percent of small farm households suffer transitory food production insecurityduring the frequent years of widespread mid-season dry spells and drought.These are farmers who have little or no involvement selling grain in nationalmarkets. 2 Roughly, 15 percent of all smallholders, concentrated in the semiarid regions, appear to suffer chronic food deficits. 3 These farmersconsistently do not produce adequate grain to meet household consumptionrequirements and have difficulty purchasing enough food to make up theirproduction deficits.
The Mangwende and Chivi farm surveys reveal that most householdsexperiencing production deficits earn the dominant share of their cash income
ISee Table 10.
2As of March 1986, only 37 percent of smallholders were registered tosell crops directly to the GM8.
3This estimate takes account of the results of Chibi farm surveys,Chibi's relative agroecological conditions and the limited results ofnutritional surveys conducted in the smallholder farming regions (World Bank,1984).

71
from enterprises other than crop production. These include the manufacture ofhandicrafts, beer brewing, working for others during the winter season and,most significantly, wage remittances. These cash sources provide the means topurchase (or earn) food necessary to make up production shortfalls.
Thus it is clear that small farm food insecurity cannot simply beconsidered a production problem. It is also an income problem. In lowrainfall regions, food security of some households may be more easily obtainedfrom the expansion of off-farm employment and non-farm income generationopportunities than from efforts to expand crop production. Interventionsfacilitating petty commerce and the flow of remittances back to farmhouseholds can provide a more steady stream of household income and food. Andmost smallholder households experiencing food insecurity are based in theselow rainfall regions.
Even so, most of Zimbabwe's smallholders will continue to rely on theirown crop production for their principal source of food for the foreseeablefuture. In this context, agricultural research and technical assistance mustaim to promote higher and more consistent crop yields derivable fromtechnologies requiring relatively little capital investment.
It is important to note that even poor farmers have shown a readywillingness to adopt improved technologies, such as hybrid maize seed. Whilefarmers complained that the cost of this seed limits the area they can plant,virtually 100 percent of the maize area in both Mangwende and Chivi wasplanted with new seed. Though concerned about costs, these farmers alsorecognized the opportunity to obtain substantial yield gains.
Most households facing continuing or frequent production deficits willnot, in the short run, benefit from the further expansion of product marketinfrastructure. Rising official product prices could be detrimental (atleast in the short run) to the food security of this population. Instead,greater benefits may be achieved by improving rural consumer markets and toreducing grain selling prices in rural areas. Likewise, food insecurehouseholds do not represent good credit risks, and will likely not benefitfrom expanded AFC programs, unless, perhaps, these are restructured tofacilitate the recovery of resources lost during drought years.
r,\
72
The majority of smallholders based in the nation's semi-arid areas aregrowing maize. Many have allocated an increasing proportion of their land tothis crop, despite extension worker advice to plant more drought tolerantsorghum and millet. A major reason for this is the lack of improved sorghumand millet varieties. Research on these crops has lagged, and has onlyreceived serious research attention in recent years. Until improved varietiesare available, farmers in the low rainfall regions will likely continuegrowing more maize.
Priority should also be placed on developing improved water harvestingtechnologies that do not require substantial capital investments. Suchresearch is difficult given the variability of rainfall in the majority ofsmallholder farming regions, and its payoff may not be seen in a larger flowof grain to the market. The longer-run returns, however, may be reflected inless dependence on drought relief programs or in the improvement of childnutrition.
Food security payoffs may also be achieved through research investmentsto improve crop processing and storage. One justification advanced for thepreference for maize over more drought tolerant small grains is the difficultyof small grain processing. Whereas maize can be brought to the ubiquitoushammermill in rural areas, small grains must be hand pounded. Sorghumdehullers are being introduced to reduce this labor burden. For still unknownreasons, the dehullers have experienced quite variable and limited success.
The limited storage life of hybrid maize is well known. Farmers commonlyacknowledge this to be eight to nine months, just enough to bring thehousehold to the next green maize harvest. Too little research has beenconducted to identify measures to improve maize storage practices.
Finally, much more attention should be paid to the integration of cropand livestock systems. Seventy-five percent of smallholder farming areas insemi-arid zones are classified as agroecologically most suited to livestockproduction. Yet efforts to improve the livestock production systems ofsmallholders have been limited. A few grazing schemes have been established,although with heavy public sector subsidies. These farmers have periodicallybeen called upon to increase their livestock marketing, although little effort
I
73
has been made to investigate and improve upon traditional grazing andmarketing systems.
D. Concluding ObservationsThis investigation sought primarily to identify the sources of the rapid
growth in smallholder maize production and sales during the post-independenceperiod. Although the relationship between production growth and food securitywas examined, most observations regarding household consumption levels andfood security strategies are indirect, and some should be considered aspreliminary. Nonetheless, important observations about the link betweensmallholder maize production growth and food security can be drawn.
Most importantly, while rapid growth in maize production may be anecessary condition for food security in Zimbabwe, it is not a sufficientcondition. The ultimate objective of food security is to ensure allhouseholds have consistent access to enough food for a healthy life.Zimbabwe's rapid maize production growth and the build up of national maizestocks contributed to this objective, but did not ensure its fulfillment.While maize production grew or increased throughout the smallholder sector,these gains were largest among the better endowed households. Most incomegains derived from the increasing maize sales went to households facing few,if any, food consumption constraints.
Households experiencing food production insecurity were undoubtedlybetter off as a result of these production gains. First, maize production ofmany of these households increased. Perhaps as important, when productionfell short, they could more readily rely on maize markets and maize baseddrought relief. Average consumption levels may have even improved. Yet itappears that many, if not the majority, of smallholder households continue toexperience both short term and chronic food production deficits.
Rapid growth in aggregate smallholder production ought to be pursued,especially if done through cost reducing technology that can keep maize pricesfor rural and urban consumers at affordable levels. In addition, specialassistance may need to be targeted toward households, in both high and lowpotential zones, facing persisting food consumption deficits. Broadlyfocussed agricultural development programs may have the best chance of
\
74
reaching small farmers who are relatively well endowed. Targeted foodsecurity programs can be correspondingly aimed at poorer households lesslikely to benefit from more generalized efforts to maximize the growth inmarketed production.
Most Zimbabwean smallholders live in relatively low potentialagroecological zones. A significant proportion of these farm households arenet food buyers in any given year. A much higher proportion are net foodpurchasers following Zimbabwe's frequent years of drought. And mosthouseholds facing production deficits also suffer severe income constraints.The limited available evidence indicates that these families derive thelargest share of the cash with which to purchase food from off-farm and nonfarm sources.
Food security policies should therefore encompass development strategiesaffecting food access as well as food supply. They must distinguish theadvantages of high GMB stocks to be used for drought relief and marketstabilization, from the gains associated with making individual householdsmore self-reliant. Such policies should not promote continuing dependence ona perennial series of drought relief programs. Rather, the aim should be topromote better use of severely limited resources, and perhaps ultimatelyfacilitate reliance on enterprises other than maize production.
Finally, this investigation highlights the importance of a wide range ofinterrelated factors influencing smallholder production opportunities andincentives. No single factor alone can stimulate expansion of food output andimpovements in food security. Where access to formal sector markets wasconstrained, the effect of higher official prices was limited. When marketinfrastructure expanded, farmers responded despite declining real productprices. Fertilizer use was more closely tied to the availability of creditthan fertilizer prices. The majority of post-war maize production gains wouldnot have been possible without improved technologies. Likewise, public andprivate sector investments were complementary.
Food security in Zimbabwe improved as a result of the dramatic growth ofsmallholder maize production at independence. Exploitation of the productionpotential of the small farm sector brought the rapid expansion of domesticfood supplies and national grain stocks. Many of Zimbabwe's small farmers
I

75
still face transitory and even chronic production shortfalls, and new programsof assistance will be required to extend the recent production and incomegains. Yet the potential smallholder response to improved productionopportunities and incentives has clearly been shown. Such bodes well forZimbabwe's agricultural future.
Ir
I!
APPENDICES
77
I
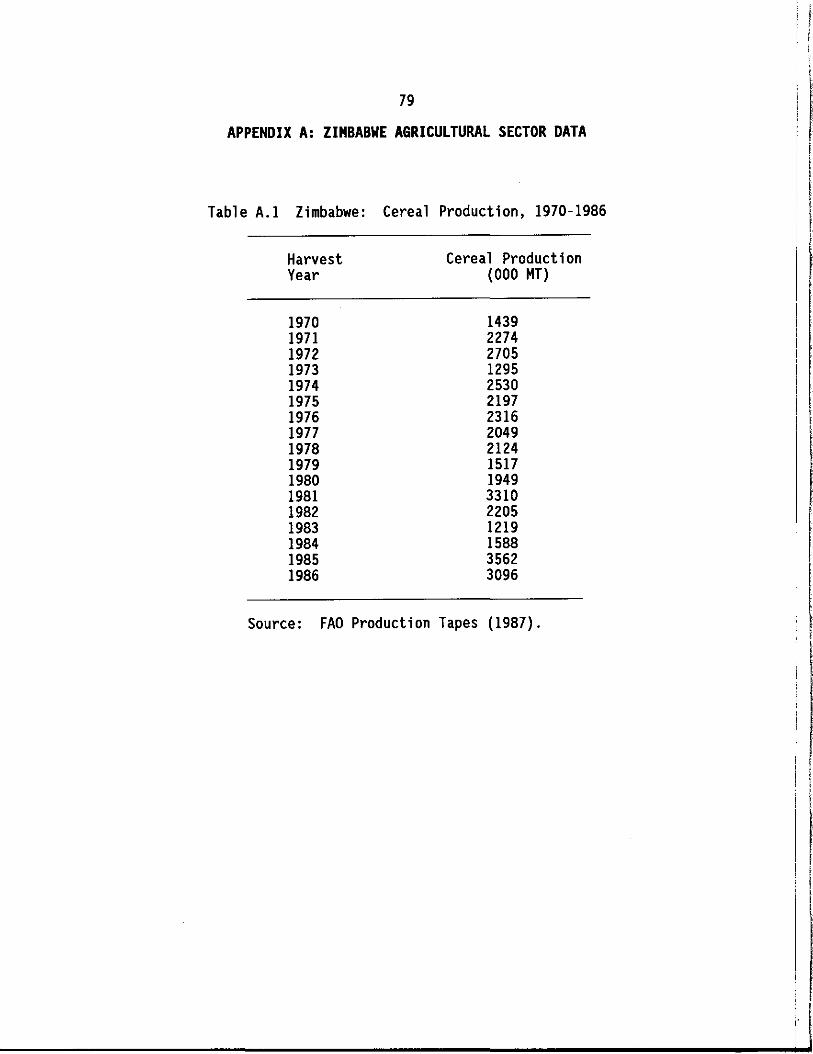
79
APPENDIX A: ZIMBABWE AGRICULTURAL SECTOR DATA
Table A.l Zimbabwe: Cereal Production, 1970-1986
Harvest Cerea1 Product ionYear (000 MT)
19701971197219731974197519761977197819791980198119821983198419851986
14392274270512952530219723162049212415171949331022051219158835623096
)
Source: FAD Production Tapes (1987).
i" I
\
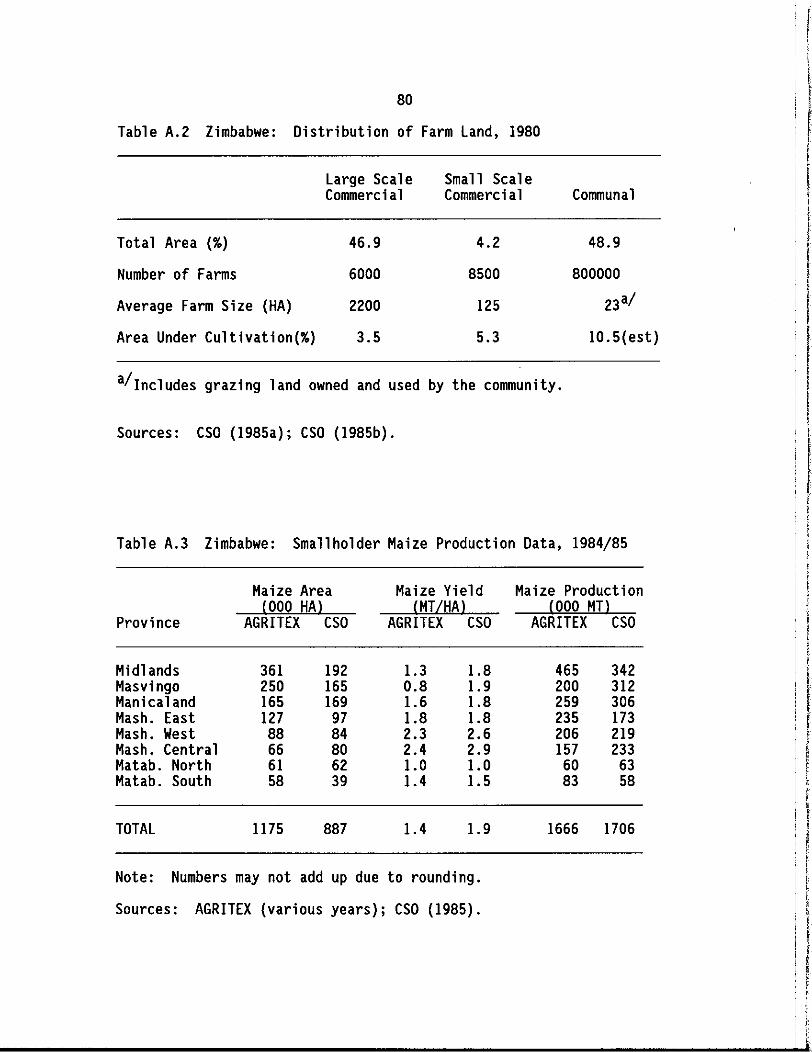
80
Table A.2 Zimbabwe: Distribution of Farm Land, 1980
Total Area (%)
Number of Farms
Average Farm Size (HA)
Area Under Cultivation(%)
Large ScaleCommerci al
46.9
6000
2200
3.5
Small ScaleCommercial
4.2
8500
125
5.3
Communal
48.9
800000
23a/
10.5(est)
a/Includes grazing land owned and used by the community.
Sources: CSO (1985a); CSO (1985b).
Table A.3 Zimbabwe: Smallholder Maize Production Data, 1984/85
Maize Area Maize Yield Maize Production(000 HAl (MT/HAl (000 MTl
Province AGRITEX CSO AGRITEX CSO AGRITEX CSO
Midlands 361 192 1.3 1.8 465 342Masvingo 250 165 0.8 1.9 200 312Manicaland 165 169 1.6 1.8 259 306Mash. East 127 97 1.8 1.8 235 173Mash. West 88 84 2.3 2.6 206 219Mash. Central 66 80 2.4 2.9 157 233Matab. North 61 62 1.0 1.0 60 63Matab. South 58 39 1.4 1.5 83 58
TOTAL 1175 887 1.4 1.9 1666 1706
Note: Numbers may not add up due to rounding.
Sources: AGRITEX (various years); CSO (1985).
I,t
rIi
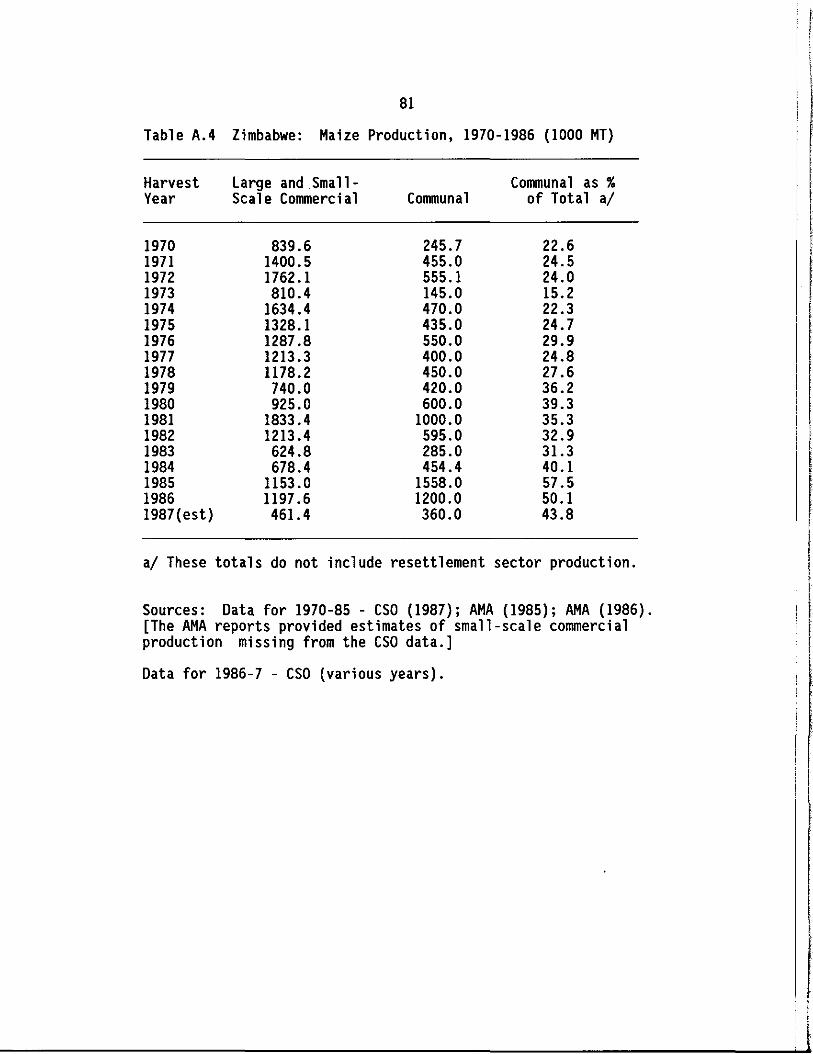
81
Table A.4 Zimbabwe: Haize Production, 1970-1986 {1000 HT}
Harvest Large and Small- Communal as %Year Scale Commercial Communal of Total a/
1970 839.6 245.7 22.61971 1400.5 455.0 24.51972 1762.1 555.1 24.01973 810.4 145.0 15.21974 1634.4 470.0 22.31975 1328.1 435.0 24.71976 1287.8 550.0 29.91977 1213.3 400.0 24.81978 1178.2 450.0 27.61979 740.0 420.0 36.21980 925.0 600.0 39.31981 1833.4 1000.0 35.31982 1213.4 595.0 32.91983 624.8 285.0 31.31984 678.4 454.4 40.11985 1153.0 1558.0 57.51986 1197.6 1200.0 50.11987{est} 461.4 360.0 43.8
a/ These totals do not include resettlement sector production.
Sources: Data for 1970-85 - CSO {1987}; AHA {1985}; AHA {1986}.[The AHA reports provided estimates of small-scale commercialproduction missing from the CSO data.]
Data for 1986-7 - CSO {various years}.
"
_____________________________________--L.Il

82
Table A.5 Zimbabwe: Maize Area, 1970-1987 (' 000 HA)
Harvest Large and Small- Communal as %Year Scale Commercial Communal of Total al
1970 292.0 610.8 67.71971 304.0 672.0 68.91972 338.0 664.7 66.31973 315.3 475.0 60.11974 311.1 725.0 70.01975 278.2 725.0 72.31976 257.3 760.0 74.71977 264.4 600.0 69.41978 273.1 700.0 71.91979 221.0 600.0 73.11980 249.0 900.0 78.31981 363.4 1000.0 73.31982 316.4 1100.0 77.71983 283.9 1050.0 78.71984 224.6 1136.0 83.51985 238.0 1018.0 81.11986 240.0 1000.0 80.61987(est) 145.7 900.0 86.1
al These totals do not include resettlement sector production.
Sources: Data for 1970-85 - CSO (1987); AMA (1985); AMA (1986).[The AMA reports provided estimates of small-scale commercialproduction missing from the CSO data.]
Data for 1986-7 - CSO (various years).
!il

83
Table A.6 Zimbabwe: Maize Yields, 1970-1986 (KG/HA)
Harvest Large and Sma11- Communal as %Year Scale Commercial Communal of Commercial
1970 2875 402 14.01971 4607 677 14.71972 5213 835 16.01973 2570 305 11.91974 5254 648 12.31975 4774 600 12.61976 5005 724 14.51977 4590 667 14.51978 4314 643 14.91979 3699 700 18.91980 4066 667 16.41981 5044 1000 19.81982 3835 595 15.51983 2201 271 12.31984 3021 400 13.21985 4844 1394 28.71986 4990 1200 24.01987(est) 3167 400 12.6
a/ These totals do not include resettlement sector production.
Sources: Data for 1970-85 - CSO (1987); AMA (1985); AMA (1986).The AHA reports provided estimates of small-scale commercialproduction missing from the CSO data.]
Data for 1986-7 - CSO (various years).
If
I,~
I,
I
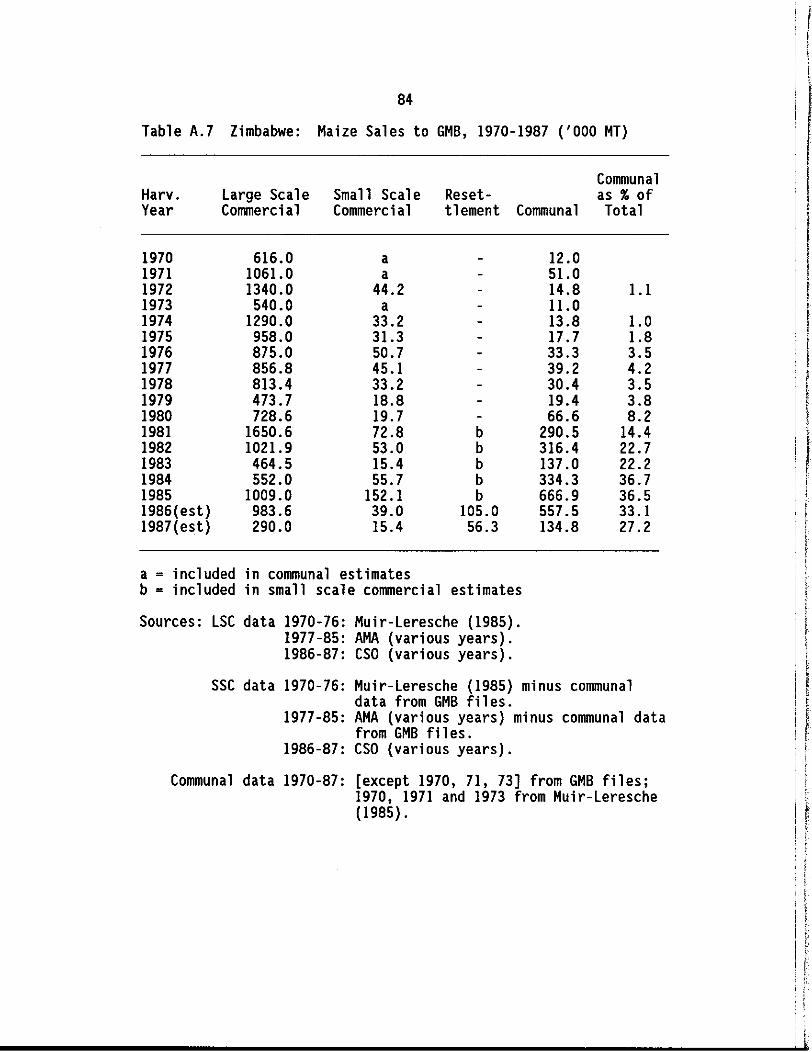
84
Table A.7 Zimbabwe: Maize Sales to 6MB, 1970-1987 ('000 MT)
CommunalHarv. large Scale Small Scal e Reset- as %ofYear Convnercial Commercial tlement Convnunal Total
1970 616.0 a 12.01971 1061. 0 a 51.01972 1340.0 44.2 14.8 1.11973 540.0 a 11.01974 1290.0 33.2 13.8 1.01975 958.0 31.3 17.7 1.81976 875.0 50.7 33.3 3.51977 856.8 45.1 39.2 4.21978 813.4 33.2 30.4 3.51979 473.7 18.8 19.4 3.81980 728.6 19.7 66.6 8.21981 1650.6 72.8 b 290.5 14.41982 1021.9 53.0 b 316.4 22.71983 464.5 15.4 b 137.0 22.21984 552.0 55.7 b 334.3 36.71985 1009.0 152.1 b 666.9 36.51986(est) 983.6 39.0 105.0 557.5 33.11987(est) 290.0 15.4 56.3 134.8 27.2
a = included in communal estimatesb = included in small scale commercial estimates
Sources: lSC data 1970-76: Muir-leresche (1985).1977-85: AMA (various years).1986-87: CSO (various years).
SSC data 1970-76: Muir-leresche (1985) minus communaldata from 6MB files.
1977-85: AMA (various years) minus communal datafrom 6MB files.
1986-87: CSO (various years).
Communal data 1970-87: [except 1970, 71, 73] from 6MB files;1970, 1971 and 1973 from Muir-leresche(1985).
II
Ij",
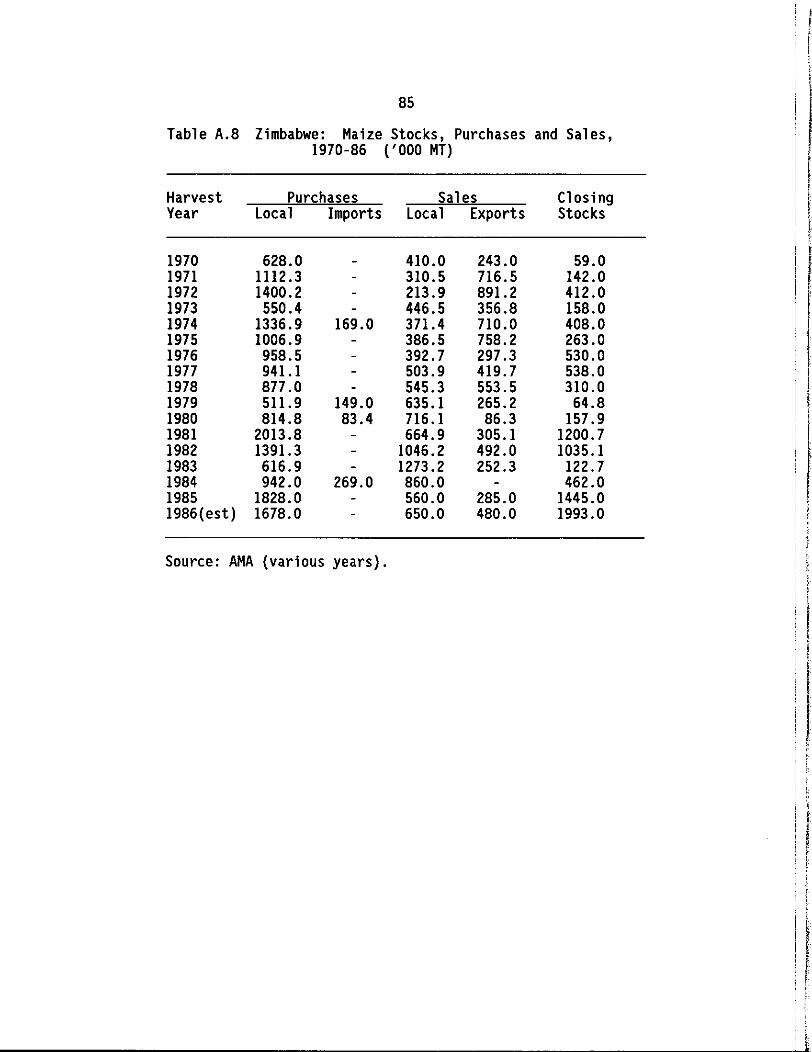
85
Table A.8 Zimbabwe: Maize Stocks, Purchases and Sales,1970-86 (' 000 MT)
Harvest Purchases Sales ClosingYear Local Imports Local Exports Stocks
1970 628.0 410.0 243.0 59.01971 1112.3 310.5 716.5 142.01972 1400.2 213.9 891.2 412.01973 550.4 446.5 356.8 158.01974 1336.9 169.0 371.4 710.0 408.01975 1006.9 386.5 758.2 263.01976 958.5 392.7 297.3 530.01977 941.1 503.9 419.7 538.01978 877 .0 545.3 553.5 310.01979 511.9 149.0 635.1 265.2 64.81980 814.8 83.4 716.1 86.3 157.9 I1981 2013.8 664.9 305.1 1200.71982 1391. 3 1046.2 492.0 1035.1
,
I1983 616.9 1273.2 252.3 122.71984 942.0 269.0 860.0 462.01985 1828.0 560.0 285.0 1445.0 !1986(est) 1678.0 650.0 480.0 1993.0 I
!,j
Source: AMA (various years).
II",
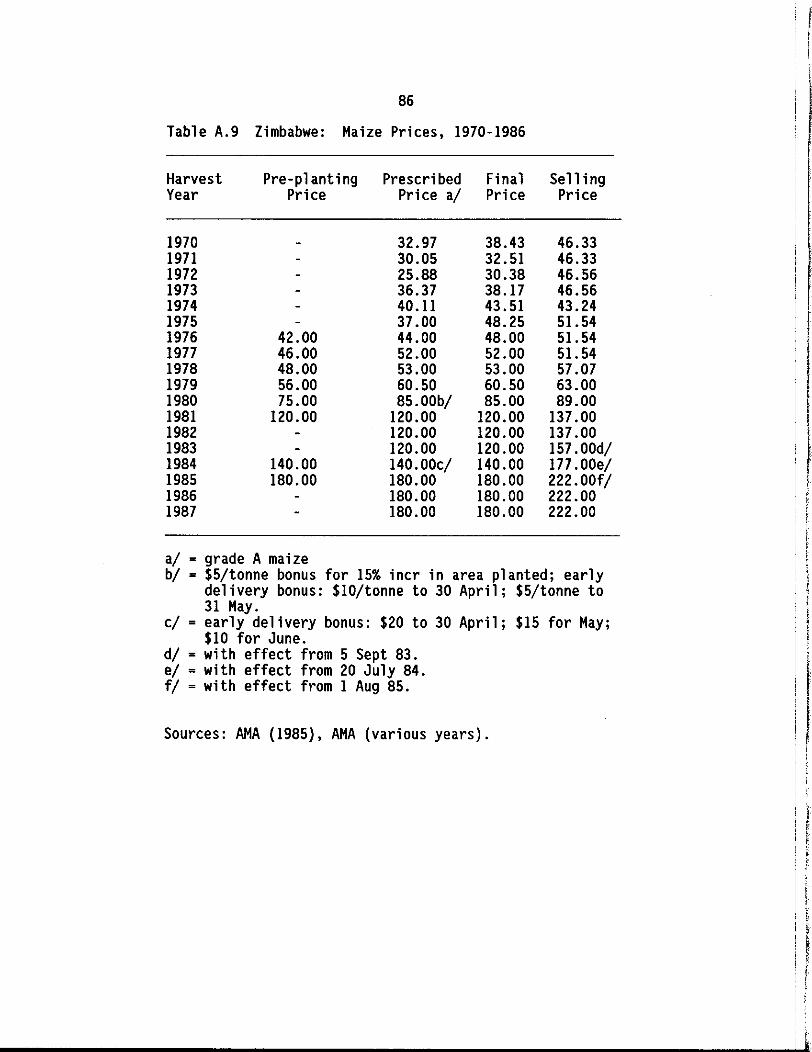
86
Table A.9 Zimbabwe: Maize Prices, 1970-1986
Harvest Pre-planting Prescribed Final Sell ingYear Price Pri ce a/ Price Price
1970 32.97 38.43 46.331971 30.05 32.51 46.331972 25.88 30.38 46.561973 36.37 38.17 46.561974 40.11 43.51 43.241975 37.00 48.25 51.541976 42.00 44.00 48.00 51.541977 46.00 52.00 52.00 51.541978 48.00 53.00 53.00 57.071979 56.00 60.50 60.50 63.001980 75.00 85.00b/ 85.00 89.001981 120.00 120.00 120.00 137.001982 120.00 120.00 137.001983 120.00 120.00 157.00d/1984 140.00 140.00c/ 140.00 177.00e/1985 180.00 180.00 180.00 222. OOf/1986 180.00 180.00 222.001987 180.00 180.00 222.00
a/ = grade A maizeb/ = S5/tonne bonus for 15% incr in area planted; early
delivery bonus: S10/tonne to 30 April; S5/tonne to31 May.
c/ = early delivery bonus: S20 to 30 April; SIS for May;$10 for June.
d/ = with effect from 5 Sept 83.e/ = with effect from 20 July 84.f/ = with effect from 1 Aug 85.
Sources: AMA (1985), AMA (various years).
I
Iif
, ,I k

87
Tabl e A.I0 Zimbabwe: Fertilizer Prices, 1971-1986 (Z$/tonne ex-Harare)
Cropping Season Comp D AN
1971/72 55.40 63.201972/73 55.40 63.201973/74 55.40 63.20 .1974/75 66.60 74.201975/76 91.40 127.401976/77 99.40 116.401977/78 106.00 129.401978/79 114.20 138.801979/80 128.20 141. 601980/81 154.00 168.201981/82 168.00 187.201982/83 189.40 206.801983/84 189.40 206.80 I1984/85 331.00 347.21 I1985/86 355.60 406.001986/87 355.60 406.00 ,,
f·
Source: Windmill (1986)
Table A.11 Zimbabwe: Population, 1970-86. (/000)
Year Population Year Population
1970 5400 1979 7240,~.1971 5590 1980 7480 ,;
1972 5780 1981 7730 I1973 5980 1982 76001974 6180 1983 78201975 6390 1984 8047
! r1976 6600 1985 8280 ,1977 6810 1986 85201978 7020 1987 8767
a = based on projection from 1982 census estimate of2.9% annual population growth rate.
Source: CSO (1986b)
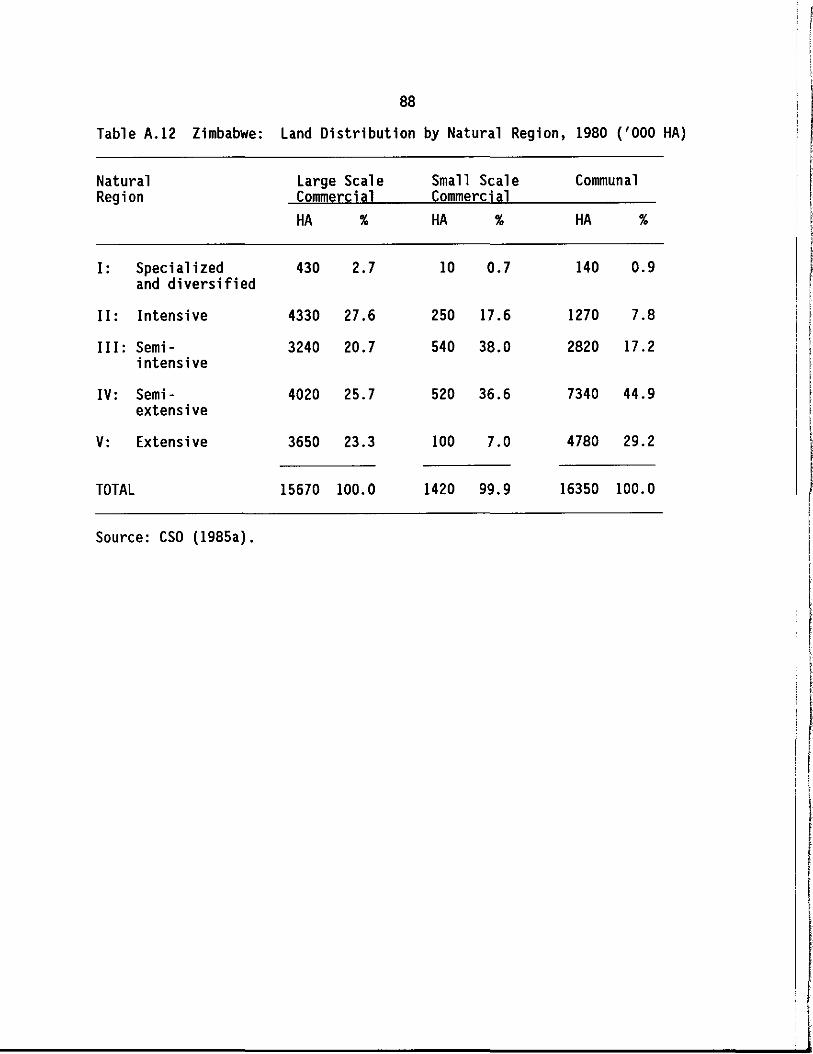
88
Table A.12 Zimbabwe: Land Distribution by Natural Region, 1980 ('000 HA)
Il
II
Natural Large Scale Small Scale CommunalRegion Commercial Commerci al
HA % HA % HA %
1,I: Specialized 430 2.7 10 0.7 140 0.9 !
Iand diversifiedI
II: Intensive 4330 27.6 250 17.6 1270 7.8 III I: Semi - 3240 20.7 540 38.0 2820 17.2 I
intensive tI
IV: Semi - 4020 25.7 520 36.6 7340 44.9textensive ,I
V: Extensive 3650 23.3 100 7.0 4780 29.2 ~
I
TOTAL 15670 100.0 1420 99.9 16350 100.0 ISource: CSO (1985a).
-------- .........1

89
Table A.13 Zimbabwe Rainfall, 1969-1986 (mm)
Belvedere ChiviMeterological Station Central Station
Year January February Total January February Total ,
1969 187.6 61.0 248.6 117.3 24.5 141.8 I1970 83.6 37.3 120.9 2.0 46.0 48.01971 132.6 129.8 262.4 275.8 17 .5 293.31972 352.3 149.6 501.9 302.4 130.1 432.51973 193.4 22.8 216.2 94.0 18.5 112.51974 141.8 324.0 465.8 97.6 103.7 201.31975 115.2 348.4 463.6 94.8 160.4 255.21976 265.0 107.8 372.8 66.1 164.6 230.71977 101.8 385.4 487.2 54.5 350.2 404.71978 280.7 246.3 527.0 178.0 54.5 232.51979 161. 7 67.0 228.7 101.0 90.5 191.51980 102.5 93.7 196.2 74.5 175.0 249.51981 140.8 394.5 535.3 254.1 105.0 359.11982 138.2 185.2 323.4 169.5 74.5 244.01983 115.9 57.0 172.4 27.0 34.6 61.61984 115.8 124.8 240.6 26.5 107.0 133.51985 379.1 107.8 486.9 277 .0 84.2 361.21986 70.0 0.0 70.0
Sources: 1969-85 Meterological Service.1986 FSRU (personal communication).
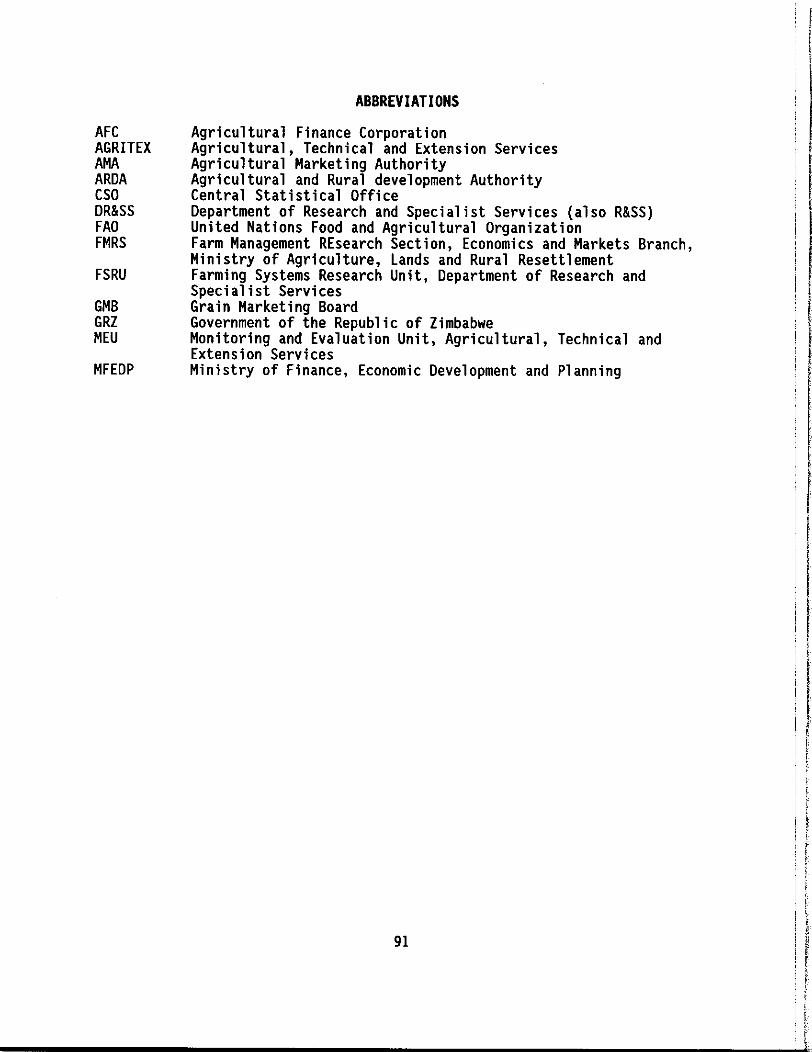
AFCAGRITEXAMAARDACSODR&SSFAOFMRS
FSRU
GMBGRZMEU
MFEDP
ABBREVIATIONS
Agricultural Finance CorporationAgricultural, Technical and Extension ServicesAgricultural Marketing AuthorityAgricultural and Rural development AuthorityCentral Statistical OfficeDepartment of Research and Specialist Services (also R&SS)United Nations Food and Agricultural OrganizationFarm Management REsearch Section, Economics and Markets Branch,Ministry of Agriculture, lands and Rural ResettlementFarming Systems Research Unit, Department of Research andSpecialist ServicesGrain Marketing BoardGovernment of the Republic of ZimbabweMonitoring and Evaluation Unit, Agricultural, Technical andExtension ServicesMinistry of Finance, Economic Development and Planning
91

93
BIBLIOGRAPHY
Agricultural Finance Corporation, various years. Annual Report. Harare:AFC.
Agricultural Marketing Authority, 1985. Economic Review of the AgriculturalIndustry of Zimbabwe. Harare: Agricultural Marketing Authority.
__~--~, various years. "Grain Situation and Outlook Report."Harare: Agricultural Marketing Authority.
Agricultural and Rural Development Authority, 1982. "Communal AreaDevelopment Report No.3: South Matabeleland; South Gwanda BaselineSurvey 1982." Harare: ARDA.
-----,c-=---,--' 1983. "A Review of the Agriculture in Some Communal Areasof Mashonaland West Province: Zvimba, Chirau, Magondi and Umfuli."Harare: ARDA.
Agricultural, Technical and Extension Services, 1980. Correspondence andMemoranda regarding the Refugee Resettlement Program - File A/195/2.(unpublished).
___________________ , 1982. Farm Management Handbook. Harare: AGRITEX.
_____~~~~--, 1984. "Dryland Crop Budgets, Communal Area Production,1984/85 Season." AGRITEX Advisory Notes No. 13/84. Harare: AGRITEX.
__________________ , (various years). "Communal Crop Forecasts." mimeo.
Barnum, Howard and lyn Squire, 1979. A Model of an Agricultural Household.Washington, D.C.: World Bank.
Berg, Allan, 1981. Malnourished People: A Pol icy View. Washington, D.C.:World Bank.
Bernsten, R. H. and David D. Rohrbach, 1985. "Inventory of Household levelAgricultural and Socio-Economic Data Sets in Zimbabwe: An InitialReport." mi meo .
Blackie, Malcolm J., 1987. "The Elusive Peasant: Zimbabwe AgriculturePolicy, 1965-1986." in Food Security for Southern Africa, edited byMandivamba Rukuni and Carl K. Eicher. Harare: UZ/MSU Food SecurityProject, Department of Agricultural Economics and Extension, Universityof Zimbabwe. pp. 114-144.
Bratton, Michael, 1984. "Draft Power, Draft Exchange and FarmerOrganizations." Department of land Management Working Paper No. 9/84.Harare: Department of land Management, University of Zimbabwe.
Iii~'!'
I ;I iI tI tI I-------- U
94
,1986. "Financing Smallholder Production: A Comparison of------TIn~dni~vTidLu~a'l and Group Credit Schemes in Zimbabwe." Public Administration
and Development. 6(2):115-132.
----.,.ZTim::;:b~aLbw:-:-e::-."" '1986. "Farmer Organizations and Food Production inWorld Development. 14(3):367-84.
Bratton, Michael and Kate Truscott, 1985. "Fertil izer Packages, Maize Yieldsand Economic Returns; An Evaluation in Wedza Communal Land." ZimbabweAgricultural Journal, 82(1):1-8.
Buccola, Steven 1. and Chrispen Sukume, 1987. "Food Price and StoragePolicies: Private Versus Social Optima Under Risk." mimeo.
Bushne11, D. G., 1984. "Fert il izer Market i ng in Zimbabwe: Its Present Stateand Future Possibilities." Paper prepared for the FAO/FIAC Seminar onFertilizer Marketing Policies, Harare, 21-25 May 1984. mimeo.
Callear, Diana, 1981. "Food Subsidies in Zimbabwe." Paper presented at theZimbabwe Economic Society Conference on Rural Development, June 1981.mimeo.
Central Statistical Office, 1982. "Social Conditions in District CouncilAreas, 1982." Statistical Monographs no. SSI/82. Harare: CentralStatistical Office.
____..--.--.-~' 1985a. Statistical Yearbook 1985: Zimbabwe. Harare:Central Statistical Office.
,1985b. "Area and Production Estimates for Crops in the------~Co::-mm~u::-na~l.-.Lands, 1984/85." ZNHSCP Report Number AL2. Harare: Central
Statistical Office.
,1986a. "Agricultural and Livestock Survey, Communal Lands,------~19~8~5~/~86- ..."~ ZNHSCP Report Number AL3. Harare: Central Statistical
Office.
______~~~~' 1986b. Ouarterly Digest of Statistics September: 1986.Harare: Central Statistical Office.
------~~~"-L' 1987. Ouarterly Digest of Statistics June:1987. Harare:Central Statistical Office.
,NDa. "Zimbabwe Census." mimeo.------------------,NOb. "Table 1: Population 1969 and 1982, Annual Average
------~Gr~o::-w:LtLh--.R.-:a-.-te, Land Area and Population Density of Local Authorities."mimeo.
I
__.",..,.."..,...,--__' (various years). "Crop Forecasting Committee Estimates."mimeo.
I_____-------'-'1
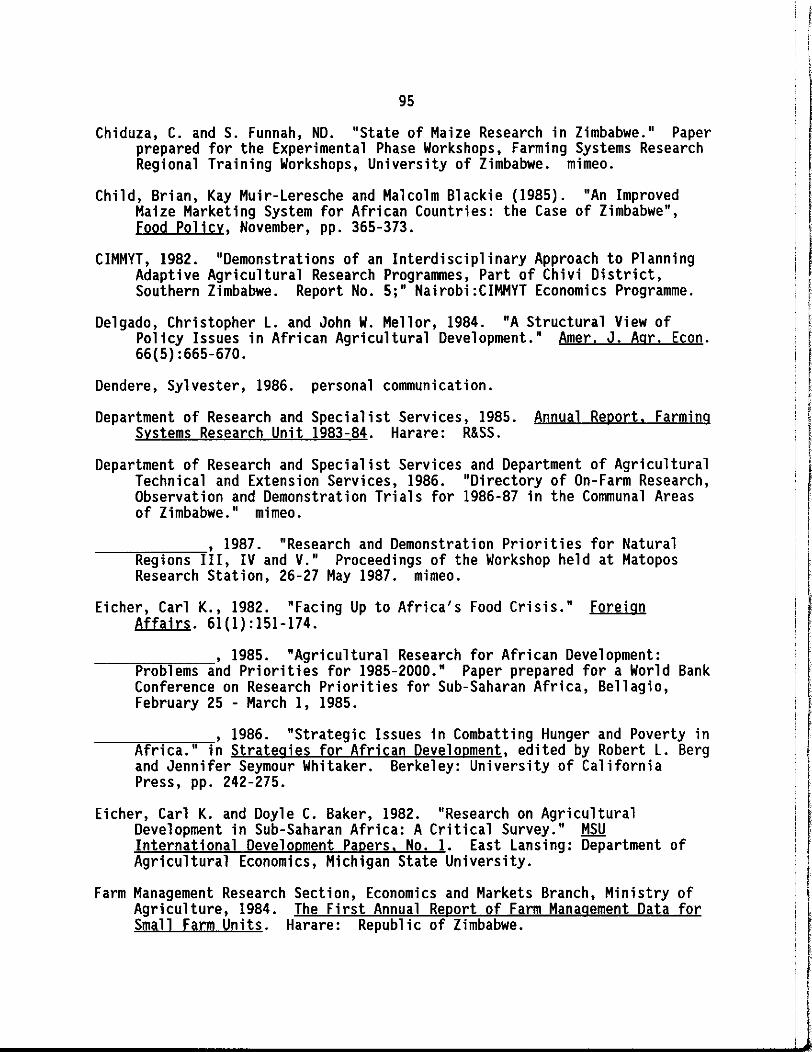
95
Chiduza, C. and S. Funnah, ND. "State of Maize Research in Zimbabwe." Paperprepared for the Experimental Phase Workshops, Farmin9 Systems ResearchRe9ional Training Workshops, University of Zimbabwe. mimeo.
Child, Brian, Kay Muir-Leresche and Malcolm Blackie (1985). "An ImprovedMaize Marketing System for African Countries: the Case of Zimbabwe",Food Policy, November, pp. 365-373.
CIMMYT, 1982. "Demonstrations of an Interdisciplinary Approach to PlanningAdaptive Agricultural Research Programmes, Part of Chivi District,Southern Zimbabwe. Report No.5;" Nairobi:CIMMYT Economics Programme.
Delgado, Christopher L. and John W. Mellor, 1984. "A Structural View ofPolicy Issues in African Agricultural Development." Amer. J. Agr. Econ.66(5}:665-670.
Dendere, Sylvester, 1986. personal communication.
Department of Research and Specialist Services, 1985. Annual Report. FarmingSystems Research Unit 1983-84. Harare: R&SS.
Department of Research and Specialist Services and Department of AgriculturalTechnical and Extension Services, 1986. "Directory of On-Farm Research,Observation and Demonstration Trials for 1986-87 in the Communal Areasof Zimbabwe." mimeo.
,1987. "Research and Demonstration Priorities for Natural--"R7.eg=-l"·o=-=nC::s--'rr I, IV and V." Proceedi ngs of the Workshop hel d at Matopos
Research Station, 26-27 May 1987. mimeo.
Eicher, Carl K., 1982. "Facing Up to Africa's Food Crisis." ForeignAffairs. 61(1}:151-174.
,1985. "Agricultural Research for African Development:------~Pr=o~b~l7.em=s~a·nd Priorities for 1985-2000." Paper prepared for a World Bank
Conference on Research Priorities for Sub-Saharan Africa, Bellagio,February 25 - March 1, 1985.
,1986. "Strategic Issues in Combatting Hunger and Poverty in------·AfEr~ic::c=-a'.'r' 'in Strategies for African Development, edited by Robert L. Berg
and Jennifer Seymour Whitaker. Berkeley: University of CaliforniaPress, pp. 242-275.
Eicher, Carl K. and Doyle C. Baker, 1982. "Research on AgriculturalDevelopment in Sub-Saharan Africa: A Critical Survey." MSUInternational Development Papers. No.1. East Lansing: Department ofAgricultural Economics, Michigan State University.
Farm Management Research Section, Economics and Markets Branch, Ministry ofAgriculture, 1984. The First Annual Report of Farm Management Data forSmall Farm Units. Harare: Republic of Zimbabwe.
III
I
I
I I
--------------U

96
Food and Agriculture Organization of the United Nations, 1984. Food BalanceSheets. 1979-81 Averages. Rome: UNFAO.
,1985a. FAO Production Yearbook. Rome: UNFAO.------
______~~~~~' 1985b. FAO Trade Yearbook. Rome: Food and AgricultureOrganization of the United Nations.
, 1987. "Review of Food Aid Pol icies and Programmes."------WwF~P~IMCF"'A~:~2~3/5. Rome: Food and Agriculture Organization of the United
Nations.
Government of the Republic of Zimbabwe, 1981. Growth With Equity. Harare:Government Printer.
,1982. Transitional National Development Plan 1982/83-----·IA9ft84·/u8~5~.--nHarare: Government Printer.
,1982. Report of the Commission of Inquiry into the-----·A~g~rTic~y~l·t~ur~al Industry. Harare: Government Printer.
------.n""'---~~' 1986. First Five Year National Development Plan: 19861990. Harare: Government Printer.
Grain Marketing Board, various years. Computer listings of smallholder cropsales. unpublished.
Gubbin, Kenneth and Henry Prankerd, 1983. "A Review of the Agriculture inSome Communal Areas of Mashonaland West Province: Zvimba, Chirau,Magondi, and Umful i." Harare: The Agricultural and Rural DevelopmentAuthority.
Heidhues, Franz and Frank Thalheimer, 1986. "Agricultural Production andMarketing in the Communal Areas of Zimbabwe since Independence." Reportprepared for GTZ, Harare.
Herdt, Robert W., 1987. "A Retrospective View of Technological and OtherChanges in Philippine Rice Farming, 1965-1982." Economic Developmentand Cultural Change. 35(2):329-49.
Hi 11, Polly, 1968. "The Myth of the Amorphous Peasantry: A Northern Nigeri anCase Study." Nigerian J. Econ. Soc. Studies. 10:239-61.
Jansen, Doris J., 1982. "Agricultural Prices and Subsidies in Zimbabwe:Benefits, Costs and Trade-offs." Report prepared for USAID, Harare.
Johnson, Peter, 1986. personal communication.
Johnson, R.W.M., 1964. "African Agricultural Development in SouthernRhodesia: 1945-1960." Food Research Instityte Studies, IV(2):165-223.
Lipton, Michael, 1977. Why Poor People Stay Poor. London: Temple Smith.
Il
!I
III
t
I
,I,

97
Lipton, Michael with Richard Longhurst, 1985. "Modern Varieties,International Agricultural Research and the Poor." CGIAR Study PaperNumber 2. Washington, D.C.: CGIAR, The World Bank.
Low, Allan, 1986. Agricultural Development in Southern Africa: FarmHousehold Economics and the Food Crisis. London: James Currey, Ltd.
Makombe, G., R. H. Bernsten and David D. Rohrbach, 1987. "The Economics ofGroundnut Production by Communal Farmers in Zimbabwe" in Food Securityfor Southern Africa, edited by Mandivamba Rukuni and Carl K. Eicher.Harare: UZ/MSU Food Security Project, Department of AgriculturalEconomics and Extension, University of Zimbabwe. pp. 185-215.
Mataruka, D. F., 1985. "Review of the Constraints to Maize Production in theCommunal Areas in Natural regions III, IV and V." Zimbabwe AgriculturalJournal. 82(5):171-175.
Matlon, Peter J., 1987. "The West African Semiarid Tropics." in AcceleratingFood Production in Sub-Saharan Africa, edited by John W. Mellor,Christopher L. Delgado and Malcolm J. Blackie. Baltimore: The JohnsHopkins University Press. pp. 59-77.
Ministry of Finance, Economic Planning and Development, 1986. Socio-EconomicReview of Zimbabwe 1980-1985. Harare: Republic of Zimbabwe.
Monitoring and Evaluation Unit, AGRITEX, 1983. "Wedza Baseline Study;Summary and Analysis." Wedza Evaluation No. 1. mimeo.
______~~~-.-' 1984. "Honde-Pungwe Valley Evaluation of Farmer-ExtensionContact." Evaluation Report No.2. mimeo.
____-=-==::__' 1985. "The Wedza Project." Wedza Evaluation No. 10.mimeo.
Muchena, S. and P. Murphy, 1985. "Agricultural Production in Zimbabwe andSome Factors Affecting Official Policy in the Sector." Paper presentedat the Seminar on "Agricultural Policy for the Developing Countries,"University of Minnesota, June-July 1985.
Mugwira, L. M., 1985. "Effects of Supplementing Communal Area Manures withLime and Fertilizers on Plant Growth and Nutrient Uptake." ZimbabweAgricultural Journal, 82(5):153-159.
,1984. "Relative Effectiveness of Fertilizer and Communal--TAr"'e"'a--"-Ma"'nC:-u""'res as Plant Nutrient Sources." Zimbabwe Agricultural Journal,
81(3) :85-90.
Mugwira, L.M. and L.M. Mukurumbira, 1984. "Comparative Effectiveness ofManures from the 'Communal Areas and Commercial Feedlots as PlantNutrient Sources." Zimbabwe Agricultural Journal, 81(6):241-250.
Ii :
___________________________u
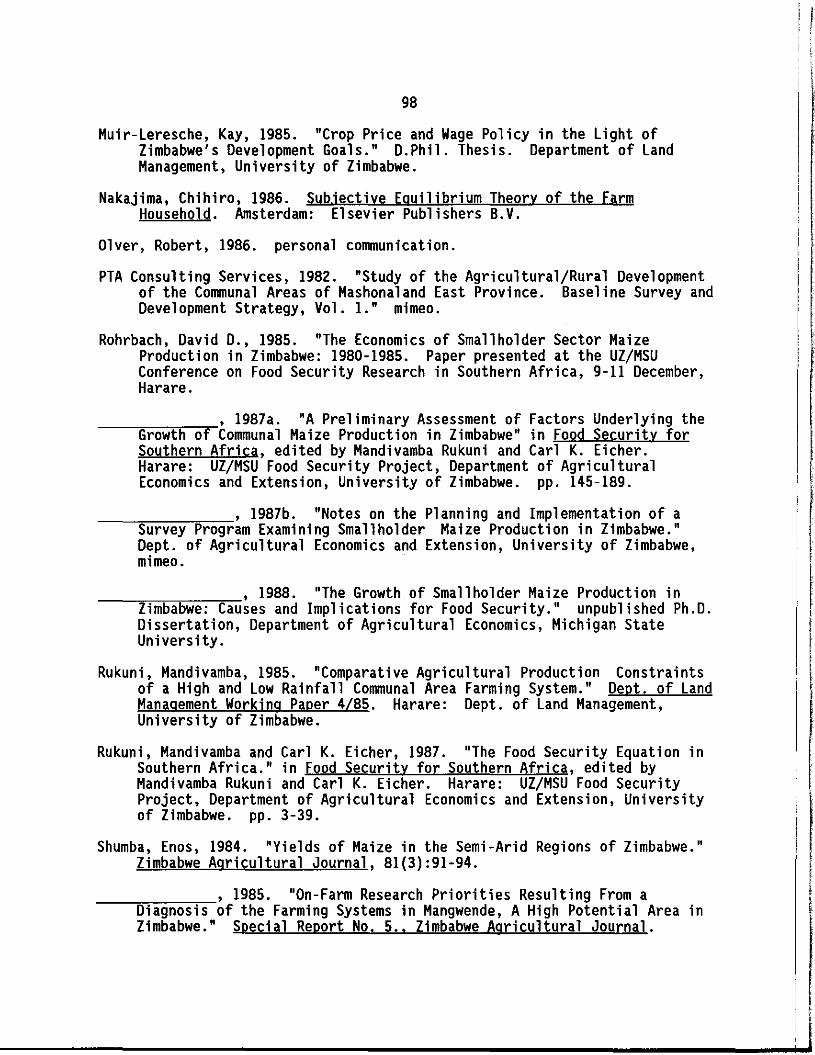
98
MUir-Leresche, Kay, 1985. "Crop Price and Wage Policy in the Light ofZimbabwe's Development Goals." D.Phil. Thesis. Department of LandManagement, University of Zimbabwe.
Nakajima, Chihiro, 1986. Subjective Equjljbrium Theory of the FarmHousehold. Amsterdam: Elsevier Publishers 8.V.
Olver, Robert, 1986. personal communication.
PTA Consulting Services, 1982. "Study of the Agricultural/Rural Developmentof the Communal Areas of Mashonaland East Province. 8aseline Survey andDevelopment Strategy, Vol. 1." mimeo.
Rohrbach, David D., 1985. "The Economics of Smallholder Sector MaizeProduction in Zimbabwe: 1980-1985. Paper presented at the UZ/MSUConference on Food Security Research in Southern Africa, 9-11 December,Harare.
,1987a. "A Preliminary Assessment of Factors Underlying the----~Gr~o~w~tLh~o~f~Communal Maize Production in Zimbabwe" in Food Security for
Southern Africa, edited by Mandivamba Rukuni and Carl K. Eicher.Harare: UZ/MSU Food Security Project, Department of AgriculturalEconomics and Extension, University of Zimbabwe. pp. 145-189.
,1987b. "Notes on the Planning and Implementation of a--"S""ur""'v""e""y""""Pr""'o:C:g:-:::ram Examining Smallholder Maize Production in Zimbabwe."
Dept. of Agricultural Economics and Extension, University of Zimbabwe,mimeo.
,1988. "The Growth of Smallholder Maize Production in--"""Z'im'b-a'b-w-e-:""'C'a-uses and Impl ications for Food Security." unpubl i shed Ph .0.
Dissertation, Department of Agricultural Economics, Michigan StateUni vers ity.
Rukuni, Mandivamba, 1985. "Comparative Agricultural Production Constraintsof a High and Low Rainfall Communal Area Farming System." Dept. of LandManagement Working Paper 4/85. Harare: Dept. of Land Management,University of Zimbabwe.
Rukuni, Mandivamba and Carl K. Eicher, 1987. "The Food Security Equation inSouthern Africa." in Food Security for Southern Africa, edited byMandivamba Rukuni and Carl K. Eicher. Harare: UZ/MSU Food SecurityProject, Department of Agricultural Economics and Extension, Universityof Zimbabwe. pp. 3-39.
Shumba, Enos, 1984. "Yields of Maize in the Semi-Arid Regions of Zimbabwe."Zimbabwe Agricultural Journal, 81(3):91-94.
,1985. "On-Farm Research Priorities Resulting From a----nDl~·a::-:g::-:n.,.,os::-:i~s-of the Farming Systems in Mangwende, A High Potential Area in
Zimbabwe." Special Report No.5., Zimbabwe Agricultural Journal.
I
------------- u
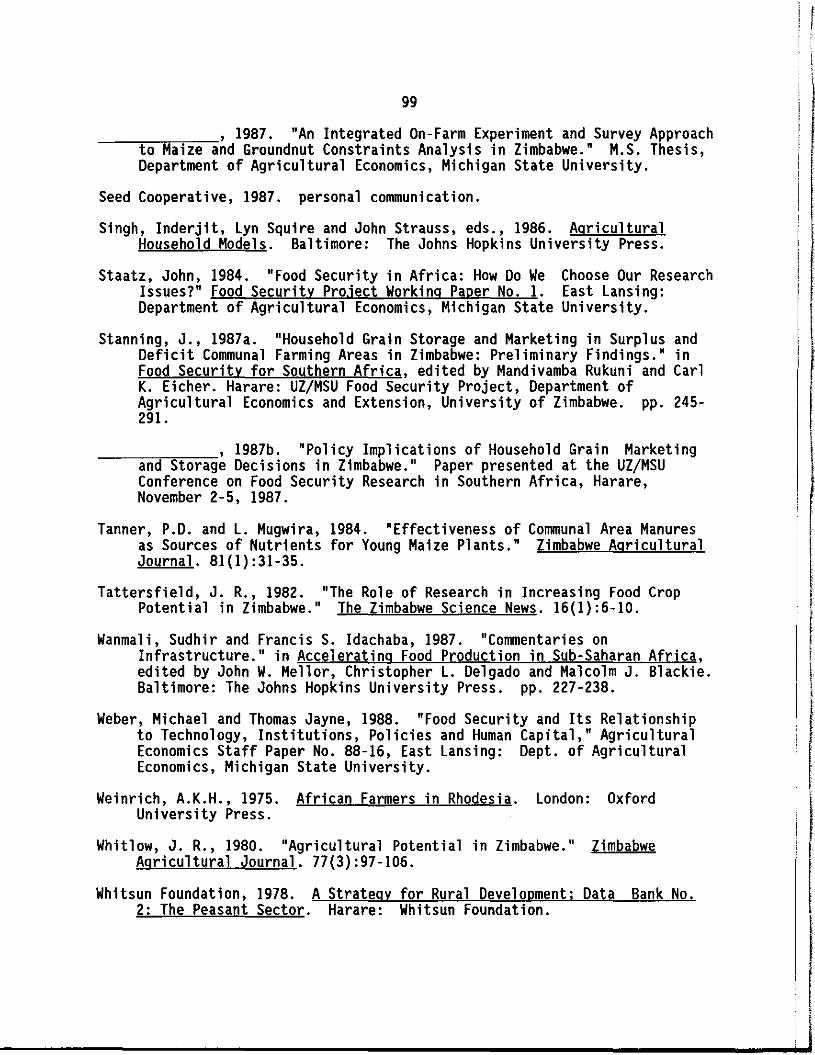
99
,1987. "An Integrated On-Farm Experiment and Survey Approach------~to=--McaTiz~e~a·nd Groundnut Constraints Analysis in Zimbabwe." M.S. Thesis,
Department of Agricultural Economics, Michigan State University.
Seed Cooperative, 1987. personal communication.
Singh, Inderjit, Lyn Squire and John Strauss, eds., 1986. AgriculturalHousehold Models. Baltimore: The Johns Hopkins University Press.
Staatz, John, 1984. "Food Security in Africa: How Do We Choose Our ResearchIssues?" Food Security Project Working Paper No.1. East Lansing:Department of Agricultural Economics, Michigan State University.
Stanning, J., 1987a. "Household Grain Storage and Marketing in Surplus andDeficit Communal Farming Areas in Zimbabwe: Preliminary Findings." inFood Security for Soythern Africa, edited by Mandivamba Rukuni and CarlK. Eicher. Harare: UZ/MSU Food Security Project, Department ofAgricultural Economics and Extension, University of Zimbabwe. pp. 245291.
,1987b. "Policy Implications of Household Grain Marketing-------::can~dr-rS~to::r:-::a-=ge Decisions in Zimbabwe." Paper presented at the UZ/MSU
Conference on Food Security Research in Southern Africa, Harare,November 2-5, 1987.
Tanner, P.D. and L. Mugwira, 1984. "Effectiveness of Communal Area Manuresas Sources of Nutrients for Young Maize Plants." Zimbabwe AgriculturalJoyrnal. 81(1):31-35.
Tattersfield, J. R., 1982. "The Role of Research in Increasing Food CropPotential in Zimbabwe." The Zimbabwe Science News. 16(1):6-10.
Wanmali, Sudhir and Francis S. Idachaba, 1987. "Commentaries onInfrastructure." in Accelerating Food Production in Sub-Saharan Africa,edited by John W. Mellor, Christopher L. Delgado and Malcolm J. Blackie.Baltimore: The Johns Hopkins University Press. pp. 227-238.
Weber, Michael and Thomas Jayne, 1988. "Food Security and Its Relationshipto Technology, Institutions, Policies and Human Capital," AgriculturalEconomics Staff Paper No. B8-16, East Lansing: Dept. of AgriculturalEconomics, Michigan State University.
Weinrich, A.K.H., 1975. African Farmers in Rhodesia. London: OxfordUniversity Press.
Whitlow, J. R., 1980. "Agricultural Potential in Zimbabwe." ZimbabweAgricultural Journal. 77(3):97-106.
Whitsun Foundation, 1978. A Strategy for Rural Development; Data Bank No.2: The Peasant Sector. Harare: Whitsun Foundation.
f
I\
I
------ u
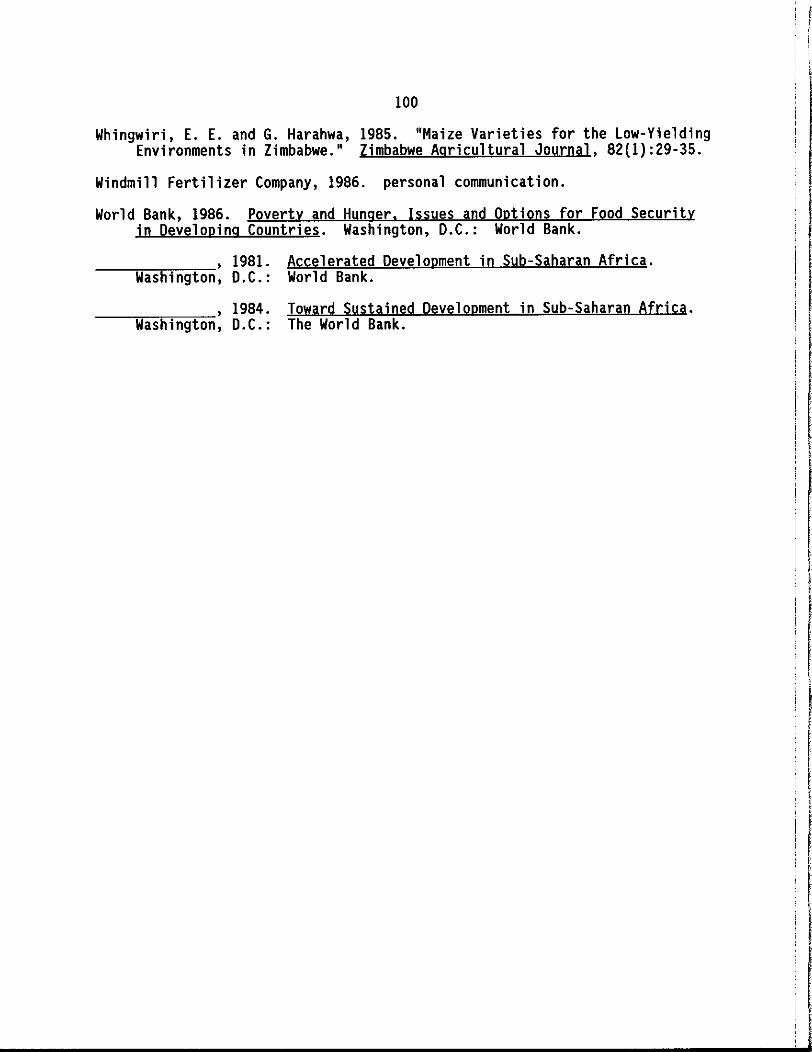
100
Whingwiri, E. E. and G. Harahwa, 1985. "Maize Varieties for the Low-YieldingEnvironments in Zimbabwe." Zimbabwe Agricultural Journal, 82(1):29-35.
Windmill Fertilizer Company, 1986. personal communication.
World Bank, 1986. Poverty and Hunger, Issues and Options for Food Securityin Developing Countries. Washington, D.C.: World Bank.
_____~~~~' 1981. Accelerated Development in Sub-Saharan Africa.Washington, D.C.: World Bank.
_____~~~~' 1984. Toward Sustained Development in Sub-Saharan Africa.Washington, D.C.: The World Bank.
II
Ir
I
IISU IRTERIlATlOIW. DEVELOI'IERT PAPERS
lOP No.1. IIResearch on Agricultural Development in Sub-Saharan Africa: A triticalSurvey," by Cart K. Eicher and Doyle C. Baker, 1982 (346 pp.).
lOP No. 1F. "Etude critique de La recherche sur le developpement asricole en Afriquesubsaharienne,'1 par Carl K. Eicher et Doyle C. Baker, 1985 (435 pp.).
lOP No.2. IIA S;rwlation Study of Constraints on Traditional Farming Systems in NorthernNigeda," by Eric W. Crawford, 1982 (136 pp.).
lOP No.3. IIFarming Systems Research in Eastern Africa: The Experience of CIMMYT and SomeNational AgricuLtural Research Services, 1976-81," by M.P. CoLlinson, 1982(67 1'1'.).
lOP No.4. "Animal Traction in Eastern Upper Volta: A Technical, Economic andInstitutional Analysis,'· by Vincent Barrett, Gregory Lassiter, David Wilcock,DoyLe Baker and Eric W. Crawford, 1982 (132 pp.).
lOP No.5. "Sodo-Economic Determinants of Food Cons~tion and Production in RuraLSierra Leone: Application of an AgricuLtural Household Model with SeveraLCornnodities," by John Strauss, 1983 (91 pp.).
lOP No.6. IIAppl ications of Decision Theory and the Measurement of Attitudes Towards Riskin Farm Management Research in Industrialized and Third WorLd Settings," byBeverly Fleisher and Lindon J. Robison, 1985 (106 pp.).
lOP No.7. IIPrivate Decisions and Public Policy: The Price oilenma in Food Systems ofDeveloping Countries,11 by C. Peter Tinmer, 1986 (58 pp.).
lOP No.8. IIRice Marketing in the Senegal River Valley: Research Findings and Pol icyReform Options," by Michael L. Morris, 1987 (89 pp.).
lOP No.9. Iismall Scale Industries in Developing COUltries: ErJ1)irical Evidence and Pol icyIq:>lications," by CarL LiedhoLm and Donald Mead, 1987 (141 pp.).
lOP No. 10. tlMaintaining the Momentun in Post-Green RevoLution Agricul ture: A Micro-LevelPerspective from Asia,1I by Derek Byerlee, 1987 (57 pp.).
IDP No. 11. liThe Economics of Smallholder Maize Production in Zimbabwe: lrJ1)l ications forFood SecuritY,I' by David D. Rohrbach, 1989 (100 pp.).
IISU .NTERIlATlllIIAL DEVELOI'IENT WlJIIKING PAPERS
WP No. 1. IIFarming Systems Research (FSR) in Honduras, 19n-81: A Case Stucfy,lI by DanielGalt, Alvaro Diaz, Mario Contreras, Frank Peairs, Joshua Posner and FranklinRosales, 1982 (48 pp.).
WP No.2. IICredit Agricole et Credit Informel dans le Region OrientaLe de Haute-Volta:Analyse Economique, Performance InstitutionneLLe et IrJ1)lications en Matiere dePol itique de Developpement Agricole,lI by Edouard 1(. Tapsoba, 1982 (125 pp.).
WP No.3. IIErJ1)Loyment and Construction: MulticOUltry Estimates of Costs and SubstitutionElasticities for Small Dwellings,ll by W.P. Strassmam, 1982 (48 pp.).
WP No.4. "Sub-contracting in Rural Areas of Thailand," by Donald C. Mead, 1982 (52 pp.).
WI' No.5. IIMicroconp.,lters and Progranmable Calculators for Agricultural Research inDeveloping COUltries,11 by Michael T. Weber, James Pease, Warren Vincent, Ericw. Crawford and Thomas Stilwell, 1983 (113 1'1'.).
WP No.6. IIPeriodicals for Microcc:xrp.lters: An Annotated BibL iography,11 by ThomasStilwell, 1983 (701'1'.).
$8.00
$10.00
$5.00
$4.00
$5.00
Out of Print
$5.00
$5.00
$5.00
$6.00
$5.00
$6.00
Out of Print
OUt of Print
Out of Print
OUt of Print
$5.00
See IDWI' #21
101
r
IlSlI IITERIlATilIIAL DE1IELlIFIlEIT IDllCIIIG PAPERS - ClIITlIaJEII
WP No.7. IIE""Loyment and HOUS;'lg in Lima, Peru, II by \I. Paul Strassmam, 1983 (96 pp.).
WP No.8. "Faire Face a La Crise Alimentaire de l'Afrique," by Carl !C. Eicher, 1983(29 pp.).
\,Ip No.9. IISoftware Directories for Microconp..Iters: An Annotated BibL iography,1I byThomas c. StiLweLL, 1963 (14 pp.).
\,Ip No. 10. "Instructional Aids for Teaching How to Use the n-59 ProgranmabLe Calculator,"by Ralph E. Hepp, 1983 (133 pp.).
WP No. 11. nprogranmable Calculator (T1-59) Programs for Marketing and Price Analysis inThird World Countries," by Michael L. Morris and Michael T. Weber, 1983(105 pp.).
WP No. 12. IIAn Amotated Directory of Statistical and Related MicrocOfl'fJUter Software forSocioeconanic Data Analysis," by Valerie Kelly, Robert D. Stevens, ThomasStilwell and Michael T. Weber, 1983 (165 pp.).
WP No. 13. I'Guidelines for Selection of Microc~ter Hardware,1I by Chris Wolf, 1983(90 pp.).
WP No. 14. "User's Guide to BENCOS~-A SuperCalc Tenplate for Benefit-Cost Analysis," byEric W. Crawford, Ting-rng Ho and A. Allan Schmid, 1984 (35 pp.).
Copy of BENCOS Tenplate in IBM PC-DOS 1.1 Format, on single sided doubledensity diskette (readable on most MS-DOS systems).
WP No. 15. "An Evaluation of Selected Microc~ter Statistical Programs,11 by James W.Pease and Raoul Lepage with Valerie Kelly, Rita Laker-Ojok, Brian Thelen andPaul Wolberg, 1984 (187 pp.).
WP No. 16. IISlnall Enterprises in Egypt: A Study of Two Governorates,'1 by StephenDavies, James Seale, Donald C. Mead, Mahmoud Badr, Nadia El Sheikh and AbdelRahman Saidi, 1984 (100 pp.).
WP No. 17. 'IMicroc~ter Statistical Packages for Agricultural Research,1I by Thomasc. Stilwell, 1984 (23 pp.).
WP No. 18. IIAn Amotated Directory of Citation Database, Educational, System Diagnosticsand Other Miscellaneous Microcomputer Software of Potential Use to AgriculturalScientists in Developing COlI1tries,'1 by Thomas C. Stilwell and P. Jordan Smith,1984 (34 pp.).
WP No. 19. IIIrrigation in Southern Africa: An Amotated Bibliography,1I by Amalia Rinaldi,1985 (60 pp.).
WP No. 20. "A MicroconpJter Based Plaming and Budgeting System for AgriculturalResearch Programs,11 by Daniel C. Goocinan, Jr •• Thomas C. Stilwell and P.Jordan Smith, 1985 (75 pp.).
WP No. 21. "Periodicals for Microc~ters: An Annotated Bibl iography," Second Edition,by Thomas C. Stilwell, 1985 (89 pp.).
WP No. 22. "Software Directories for Microcoop..lters: An Amotated Bibl iography,11 SecondEdition, by Thomas C. Stilwell, 1985 (21 pp.).
IJP No. 23. "A Diagnostic Prespective Assessment of the Production and Marketing Systemfor Mangoes in the Eastern Caribbean," by Alan Hrapsky with Michael Weber andHarold Riley, 1985 (106 pp.).
WP No. 24. IISubc:ontracting Systems and Assistance Programs: Opportunities forIntervention,11 by Donald C. Mead, 1985 (32 pp.).
Out of Print
Free
See IOWP fI22
OUt of Print
Out of Print
57.00
55.00
53.00
515.00
57.00
out of Print
Out of Print
53.00
$4.00
Out of Print
55.00
out of Print
55.00
Out of Print
IlSU IITERIlATlllIIAL DEVELlFllEIT IDlICIIG PAPERS - ClIITIIIUEII
WP No. 25. "smell Scale Enterprise Credit Schemes: Administrative Costs and the Role ofInventory Norms," by Carl Liedholm, 1985 <23 pp.). Out of Print
WP No. 26. IISubsector AnaLysis: Its Nature, Conduct and Potential Contribution to SmallEnterprise Development," by James J. Boomgard, Stephen P. Davies, SteveHaggblade and Donald C. Mead, 1986 (57 pp.). out of Print
WP No. 27. liThe Effect of Policy and Policy Reforms on Non-Agricultural Enterprises andE~loyment in Developing COlSItries: A Review of Past Experiences," by SteveHaggblade, Carl Liedholm and Donald C. Mead, 1986 (133 pp.). $5.00
WP No. 28. "Rural smalL Scale Enterprises in Zarrbia: Results of 8 1985 Country-WideSurvey," by John T. Milimo and Yacob Fisseha, 1986 (76 pp.). Out of Print
WP No. 29. "Fl.I'K:Iamentals of Price Analysis in Developing Countries I Food Systems: ATraining Manual to Accorrpany the MicroconpJter Software Program I MSTAT , III byStephan Goetz and Michael 1. Weber, 1986 (148 pp.). $7.00
WP No. 30. "Rapid Reconnaissance Guidel ines for Agricul tural Marketing and Food SystemResearch in Developing Countries," by John S. Holtzman, 1986 (75 pp.). $5.00
WP No. 31. "Contract Farming and Its Effect on Small Farmers in Less Developed Countries,1Iby Hichola. William Minot, 1986 (86 pp.). $5.00
WP No. 32. "Food Security Policy and the C~titiveness of Agriculture in the Sahel: ASl.ImI8ry of the "Beyond Mindelo" Seminar, II by Thomes S. Jayne and Nicholas Minot,1989 (27 pp.). $3.00
\lP No. 33. "small Scale Manufactudng Growth in Africa: In;tiel Evidence," by Carl Liedholmand Joan Parker, 1989 (40 pp.). $4.00
IlSU INTERIlATlOIIAL DEVELlFllEIT REPRIIT PAPERS
RP No. 1. liThe Private Sector Connection to Development,1I by Carl Liedholm, 1986(19 pp.). Out of Print
RP No.2. "Influencing the Design of Marketing Systems to Promote Development in ThirdWorld Countries," by James D. Shaffer with Michael Weber, Harold Riley and JohnStaatz, 1987 (21 pp.).
RP No.3. "Famine Prevention in Africa: The Long View," by Carl IC. Eicher, 1987(18 pp.).
RP No.4. IICereals Marketing in the Senegal River Valley (1985)," by Michael L. Morris,1987 (126 pp.).
RP No.5. liThe Food Security Equation in Southern Africa," by Mandivanba RuklM1i andCarl IC. Eicher, 1987 (32 pp.).
RP No.6. "Economic Analysis of Agronomic Trials for the Forl1lJlation of FarmerRecoomendations," by Eric Crawford and Mulllrba lCanuanga, 1988 (41 pp.).
$3.00
$3.00 I$6.00 l53.00 I
I$3.00
RP No. 6F. "LIAnalyse Economiques des Essais Agronomiques Pour la Forl1lJlation desRecoomandations aux Paysans," par Eric Crawford et Mulllrba 1C8ITlJanga, 1987(33 pp.). $3.00
RP No.7. "Economic Analysis of Livestock Trials," by Eric W. Crawford, 1987 (38 pp.). $3.00
$3.00RP No. 7F. IILIAnalyse Economique des Essais Zootechni~," par Eric Crawford, 1987
(36 pp.).
1
I I_- 1_0_'J U
MSlI INTERNATIOIIAL DE1IELllPIIENT REPR INT PAPERS - CllIITlIIJED
RP No.8. "A FieLd Study of FertHher Distribution and Use in Senegal, 1984: SlmIISryReport," by Eric Crawford and Valerie KeLLy. 1987 (32 pp.).
RP No. SF. "Enquete sur La Distribution et l'Utilisation de l'lEngrais au Senegal, 1984:Resl..ln6 Analytique," by Eric Crawford and Valerie Kelly, 1988 (43 pp).
RP No.9. "In.,roving Food Marketing Systems in Developing CCUltries: Experiences fromLatin America," by Kelly Harrison, Donald Henley. Harold RHey and JamesShaffer, 1987 (135 )
RP No. 10. "Policy Relevant Research on the Food and Agricultural System in Senegal,1Iby Mark Newman, Eric Crawford and Jacques Faye, 1987 (30 pp.).
RP No. 10F. IIOrientations et Progranmes de Researche Macro-Economiques sur Le SystemeAgro·Alimentaire Senegalais," par Mark Newman, Eric Crawford et Jacques Faye,1987 (37 pp.).
RP No. 11. "A Field Study of Fertilizer Distribution and Use in Senegal, 1984: FinalReport,'l by Eric Crawford, Curtis Jolly, Valerie Kelly, PhiUppe Larrbrecht,Makhona Mbaye and Matar Gaye, 1987 (111 pp.).
RP No. 11F. "Enquete sur la Distribution et l'Utilisation de l'Engrais au Senegal, 1984:Rapport Final,1t par Eric Crawford, Curtis Jolly, Valerie Kelly, PhilippeLambrecht, Makhona Mbaye et Matar Gaye, 1987 (106 pp.).
RP No. 12. "Private and Pool ic Sectors in Developing Cotritry Grain Markets: OrganizationIssues and Options in Senegal," by Marie. D. Newman, P. Alassane Sow andOUsseynou NOoye, 1987 (14 pp.).
RP No. 13. "Agricul tural Research and Extension in Francophone West Africa: The SenegalExperience," by R. James Bingen and Jacques Faye, 1987 (23 pp.).
RP No. 13F. liLa Liaison Recherche-Developpement en Afrique de LIOuest Francophone:L'Experience du Senegal," par R. James Bingen et Jacques Faye, 1987 (32 pp.).
RP No. 14. "Grain Marketing in SenegaL's Peanut Basin: 1984/85 Situation and Issues,'1by Mark O. Newman, 1987 (16 pp.).
RP No. 15. "Tradeoffs Between Domestic and Inp>rted Cereals in Senegal: A MarketingSystems Perspective,ll by Mark D. Newman, Ousseynou NDoye and P. Alassane Sow,1987 (41 pp.).
RP No. 15F. "C~r~aLes Locales et C~r~ales Inp>rtees au Sen6gal: La Pol itique Al imentairel\ Partier des Systenes de ComnerciaL isation," par Mark D. NelJlll8n, OUsseynouNeloye et P. Alassane Sow, 1988 (48 pp.).
RP No. 16. "An Orientation to Production Systems Research in Senegal," by R. JamesBingen, 1987 (88 pp.).
RP No. 16F. "0rientation de La Recherche sur les Systemes de Productions au Senegal," parR. James Bingen, 1987 (94 pp.).
RP No. 17. "A Contribution to Agronomic Knowledge of the lower Casamance (BibliographicalSynthesis),11 by J.L. Posner, 1988 (47 pp.).
RP No. 17F. "Contribution it La Connaissance Agronomique de La Basse Casamance (SyntheseBibUographique)," par J.L. Posner, 1988 (47 pp.).
RP No. 18. "Acquisition and Use of Agricultural Inputs in the Context of Senegal's NewAgricuLtural Policy: The Implications of Farmers' Attitudes and InputPurchasing Behavior for the Design of Agricultural PoLicy and ResearchPrograms,1I by Valerie Auserehl Kelly, 1988 (30 pp.).
$3.00
$4.00
$5.00
$3.00
$3.00
$6.00
$6.00
$3.00
$3.00
$3.00
$3.00
$3.00
$4.00
$5.00
$5.00
$4.00
$4.00
$3.00
10'-\
IISU INTEJlllATIllIW. DEVELOPMENT REPRINT PAPERS - alIITlIRJEII
RP No. 18F. IIAcquisition et Utilisation dllntrants Agdcoles dans Le Context de LaNouvelle Politique Agricole du Senegal: Implications des Attitudes et duComportement dlAchat d'lntrants des Exploitants pour l-Elaboration d'unePoUtique Agricole et de Progranmes de Recherches. 11 par Valerie AuserehlKelLy, 1988 (35 pp.).
RP No. 19. IIFanners' Demand for Fertilher in the Context of Senegal's New AgricuLturalPolicy: A Study of Factors Influencing Fanners' Fertilizer PurchasingDecisions,1I by Valerie Auserehl Kelly. 1988 (47 pp.).
RP No. 19F. "Demande d'Engrais de La Part des Exploitants dans les Contexte de La NouvellePolitique AgricoLe au SenegaL: Une Etude des Facteurs Influencant lesDecisions d'Achat d'Engrais Prises par les Exploitants," par Valerie AuserehlKeLLy, 1988 (58 pp.).
RP No. 20 "Production Systemes in the Lower Casamance and Farmer Strategies in Responseto Rainfall Deficits," by J.L. Posner, M. K8Alanga and S. Sall, 1988 (30 pp.).
RP No. 20F. "Les Systemes de Prod.Jction en Basse Casamance et les Strategies PaysamesFace au Deficit Pluviometrique,1I par J.L. Posner, M. K8fll.langa et S. Sall, 1988(33 pp.).
RP No. 21. IIInforming Food Security Decisions in Africa: Errpirical Analysis and Pol icyDialogue,lI by Michael T. Weber, John M. Staatz, John s. Holtzman, Eric W.Crawford and Richard H. Bernsten, 1988 (11 pp.).
RP No. 21F. IIConment Informer les Decisions Traitant de la Securite Alimentaire enAfrique: Analyses Enpiriques et Dialogue Politique,1I par Michael T. Weber,John M. Staatz, John S. Holt~n, Eric W. Crawford and Richard H. Bernsten,1989 (13 pp.).
RP No. 22. liThe Creation and Establ ishment of Prod.Jction Systems Research in a NationalAgricultural Research Institute: The Senegal Experience,lI by Jacques Faye,James Bingen, and Etienne Landais, 1988 (25 pp.).
RP No. 23. IIForeign Trade of Agricultural Products and Inputs in Senegal from 1975 to1984,11 by Frederic Martin and Ali<Ule Dieng, 1988 (45 pp.).
RP No. 24. IIRegulatory Uncertainty and Government Objectives for the Organization andPerformance of Cereal Markets: The Case of Senegal, II by Mark D. Nel«l'lBn,P. ALa..ane Sow and Ousseynou Ndoye, 1988 (24 pp.).
RP No. 24F. IIlncertitude Reglementaire, Objectifs Gouvernementaux, Organisation etPerformances des Marches Cereal iers: Le Cas du Senegal,11 par Mark O.Newman, P. Alassane Sow et ousseynou Ndoye, 1988 (24 pp.).
RP No. 25F. liE tude sur la Conmercialisation des Cereales dans la Region du FleuveSenegal: Methodologie,ll par Michael Morris, 1988 (48 pp.).
RP No. 26. liThe Regulation and Organization of Cereal Markets in Senegal: Report onthe Marketing Canpaigns of 1983/84 and 1984/8511 by P. Alassane Sow and MarkD. Newman, 1988 (29 pp.).
RP No. 26F. lila Reglementation et POrganisation des Marches Cerealiers au Senegal:Situation des Carrpagnes des Conmercial isation 1983/84 et 1984/85,11 parP. Alassane Sow et Mark D. Newman, 1988 (31 pp.).
RP No. 27. IIFarm level Cereal Situation in Lower Casamance: Results of a FieldStudy, II by C.M. Jolly, M. KamJanga, S. Sall and J.L. Posner, 1988 (35 pp.).
RP No. 27F. IISituation Cerealiere en Milieu Paysan en Basse Casamance: Resultats dll.l"leEnc:pJf!te de Terrain,11 par C.M. Jolly, M. 1C8IIlJ8nga, S. Sall et J.L. Posner,1988, (41 pp.).
$3.00
$4.00
$4.00
$3.00
$3.00
$3.00
$3.00
$3.00
$4.00
$3.00
$3.00
$4.00
$3.00
$3.00
$4.00
$4.00
)05
-
MSU INTERIlATllIIAL DEVELlIPIIENT REPRINT PAPERS - aJllTlIIJED
RP No. 28F. "Budgets de Culture au S~al,11 par Frederic Martin, 1988, (54 pp.. ).
Amexe 1- -IIBudgets de Culture et Analyse des Merges dans le BassinArachidier," 1988 (134 pp.).
Annexe 2-- IIBudgets de Culture et Analyse des Merges au Seregal Orientalet en Casamance,·1 1988 (204 ppoO).
Annexe 3-- I'Budgets de Culture et Analyse des Marges dans La Vallee duFlewe 5_gol," 1988 (214 pp.).
$4.00
$8.00
511.00
511.00
I!
Copies may be obtained from: M50 International Development Papers. Department of Agricultural Economics, 7AgricuLture Hall, Michigan State University, East Lansing, Michigan 48824-1039, U.S.A. All orders must beprepaid in United States currency. PLease do not send cash.. Make checks or money orders payabLe toMichigan State University. There is 8 10% discount on all orders of 10 or more sale copies. Individualsand institutions in the Third World and USAID officials may receive single copies free of charge.
ID~