the economic value of cover crops - iowa learning farms · pdf fileeconomic value of cover...
TRANSCRIPT
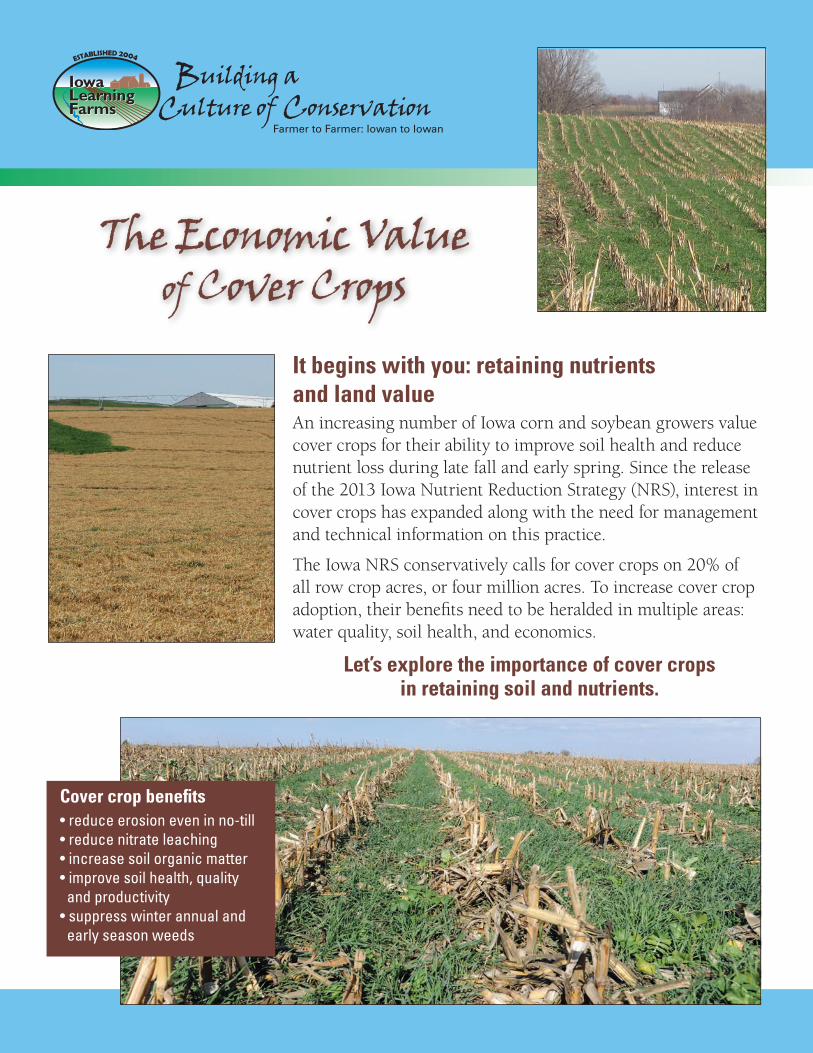
It begins with you: retaining nutrients and land valueAn increasing number of Iowa corn and soybean growers value cover crops for their ability to improve soil health and reduce nutrient loss during late fall and early spring. Since the release of the 2013 Iowa Nutrient Reduction Strategy (NRS), interest in cover crops has expanded along with the need for management and technical information on this practice.
The Iowa NRS conservatively calls for cover crops on 20% of all row crop acres, or four million acres. To increase cover crop adoption, their benefits need to be heralded in multiple areas: water quality, soil health, and economics.
The Economic Value of Cover Crops
Building aCulture of Conservation Farmer to Farmer: Iowan to Iowan
IowaLearningFarms
IowaLearningFarms
ESTABLISHED 2004
Let’s explore the importance of cover cropsin retaining soil and nutrients.
Cover crop benefits• reduce erosion even in no-till• reduce nitrate leaching• increase soil organic matter• improve soil health, quality and productivity• suppress winter annual and early season weeds
Economic value of cover crops projectA recent study, conducted by Iowa Learning Farms (ILF), Iowa State University Extension and Outreach, and Practical Farmers of Iowa (PFI), was to find the economic value of reduced soil erosion and reduced nutrient loss from cover
crop use. Other studies have only considered additional input costs and yield impacts of cover crops without including the benefits of reduced soil loss and retention of soil nutrients. Using RUSLE2 soil loss estimates, an economic value was generated for reduced soil erosion on cover cropped fields.
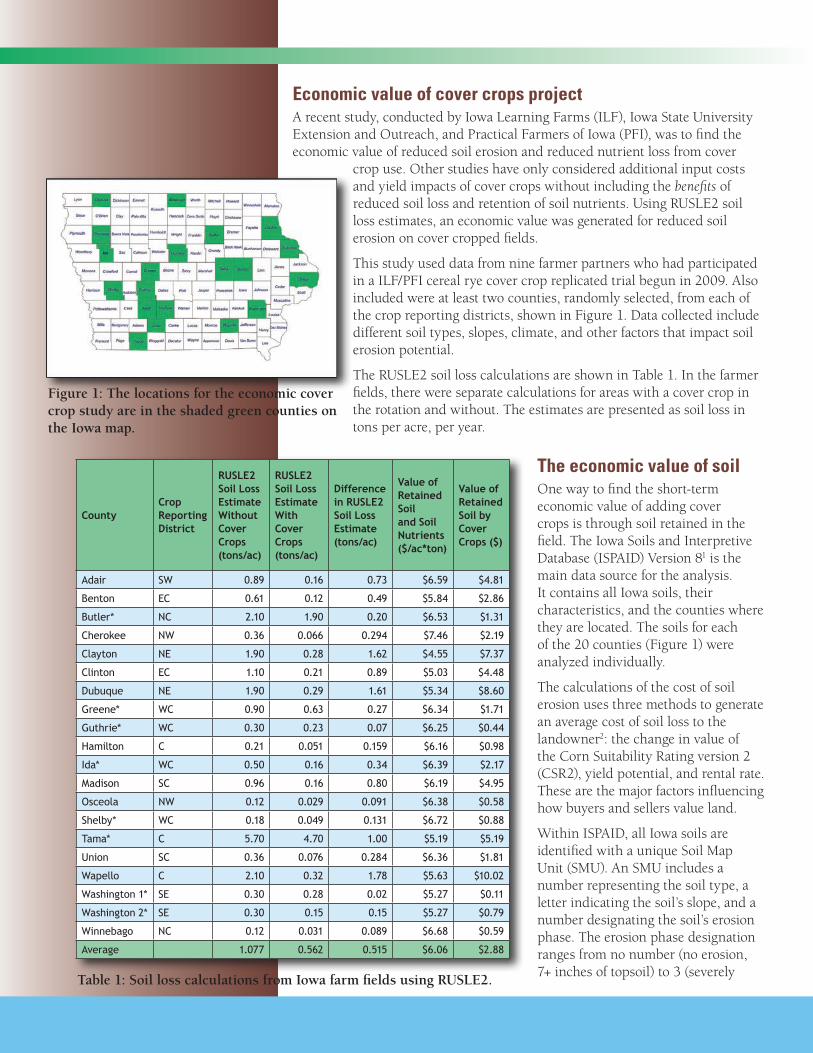
This study used data from nine farmer partners who had participated in a ILF/PFI cereal rye cover crop replicated trial begun in 2009. Also included were at least two counties, randomly selected, from each of the crop reporting districts, shown in Figure 1. Data collected include different soil types, slopes, climate, and other factors that impact soil erosion potential.
The RUSLE2 soil loss calculations are shown in Table 1. In the farmer fields, there were separate calculations for areas with a cover crop in the rotation and without. The estimates are presented as soil loss in tons per acre, per year.
Table 1: Soil loss calculations from Iowa farm fields using RUSLE2.
Figure 1: The locations for the economic cover crop study are in the shaded green counties on the Iowa map.
CountyCrop Reporting District
RUSLE2 Soil Loss Estimate Without Cover Crops (tons/ac)
RUSLE2 Soil Loss Estimate With Cover Crops (tons/ac)
Difference in RUSLE2 Soil Loss Estimate (tons/ac)
Value of Retained Soil and Soil Nutrients ($/ac*ton)
Value of Retained Soil by Cover Crops ($)
Adair SW 0.89 0.16 0.73 $6.59 $4.81
Benton EC 0.61 0.12 0.49 $5.84 $2.86
Butler* NC 2.10 1.90 0.20 $6.53 $1.31
Cherokee NW 0.36 0.066 0.294 $7.46 $2.19
Clayton NE 1.90 0.28 1.62 $4.55 $7.37
Clinton EC 1.10 0.21 0.89 $5.03 $4.48
Dubuque NE 1.90 0.29 1.61 $5.34 $8.60
Greene* WC 0.90 0.63 0.27 $6.34 $1.71
Guthrie* WC 0.30 0.23 0.07 $6.25 $0.44
Hamilton C 0.21 0.051 0.159 $6.16 $0.98
Ida* WC 0.50 0.16 0.34 $6.39 $2.17
Madison SC 0.96 0.16 0.80 $6.19 $4.95
Osceola NW 0.12 0.029 0.091 $6.38 $0.58
Shelby* WC 0.18 0.049 0.131 $6.72 $0.88
Tama* C 5.70 4.70 1.00 $5.19 $5.19
Union SC 0.36 0.076 0.284 $6.36 $1.81
Wapello C 2.10 0.32 1.78 $5.63 $10.02
Washington 1* SE 0.30 0.28 0.02 $5.27 $0.11
Washington 2* SE 0.30 0.15 0.15 $5.27 $0.79
Winnebago NC 0.12 0.031 0.089 $6.68 $0.59
Average 1.077 0.562 0.515 $6.06 $2.88
The economic value of soilOne way to find the short-term economic value of adding cover crops is through soil retained in the field. The Iowa Soils and Interpretive Database (ISPAID) Version 81 is the main data source for the analysis. It contains all Iowa soils, their characteristics, and the counties where they are located. The soils for each of the 20 counties (Figure 1) were analyzed individually.
The calculations of the cost of soil erosion uses three methods to generate an average cost of soil loss to the landowner2: the change in value of the Corn Suitability Rating version 2 (CSR2), yield potential, and rental rate. These are the major factors influencing how buyers and sellers value land.
Within ISPAID, all Iowa soils are identified with a unique Soil Map Unit (SMU). An SMU includes a number representing the soil type, a letter indicating the soil’s slope, and a number designating the soil’s erosion phase. The erosion phase designation ranges from no number (no erosion, 7+ inches of topsoil) to 3 (severely
eroded, less than 3 inches of topsoil). The soil loss values assume that a change in erosion phase equals 4 inches of eroded soil, or 616 tons of soil lost per acre.
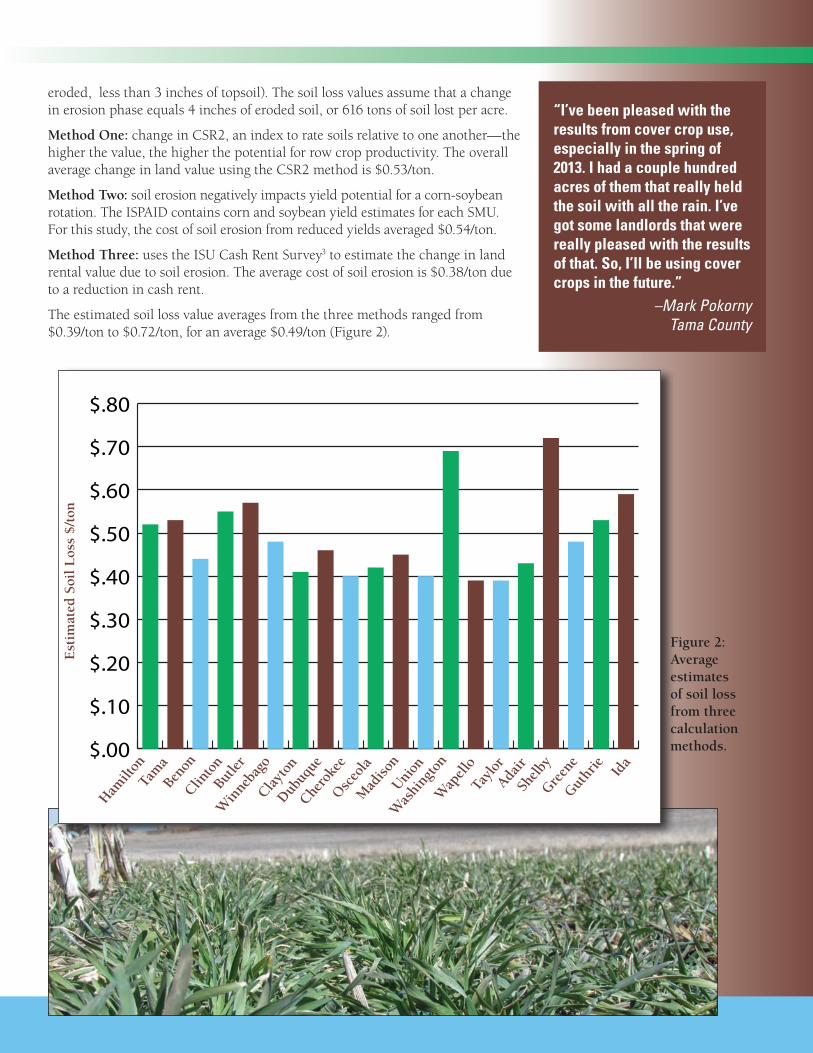
Method One: change in CSR2, an index to rate soils relative to one another—the higher the value, the higher the potential for row crop productivity. The overall average change in land value using the CSR2 method is $0.53/ton.
Method Two: soil erosion negatively impacts yield potential for a corn-soybean rotation. The ISPAID contains corn and soybean yield estimates for each SMU. For this study, the cost of soil erosion from reduced yields averaged $0.54/ton.
Method Three: uses the ISU Cash Rent Survey3 to estimate the change in land rental value due to soil erosion. The average cost of soil erosion is $0.38/ton due to a reduction in cash rent.
The estimated soil loss value averages from the three methods ranged from $0.39/ton to $0.72/ton, for an average $0.49/ton (Figure 2).
Figure 2: Average estimates of soil loss from three calculation methods.
“I’ve been pleased with the results from cover crop use, especially in the spring of 2013. I had a couple hundred acres of them that really held the soil with all the rain. I’ve got some landlords that were really pleased with the results of that. So, I’ll be using cover crops in the future.”
–Mark Pokorny Tama County
$.00
$.10
$.20
$.30
$.40
$.50
$.60
$.70
$.80$0.0
Hamilt
onTa
ma
Benon
Clinto
nBu
tler
Win
neba
goClay
ton
Dubuq
ueChe
roke
eOsc
eola
Mad
ison
Union
Was
hing
ton
Wap
ello
Taylo
rAda
irSh
elby
Green
eGut
hrie Ida
Est
imat
ed S
oil
Los
s $/
ton
For more informationContact your area Iowa State University Extension and Outreach Field Agronomist or Iowa Learning Farms for more information.
Iowa Learning Farms4329 Elings HallIowa State UniversityAmes, Iowa 50011-3080515-294-5429
www.extension.iastate.edu/ilf
Iowa Learning Farms is funded by the Iowa Department of Agriculture and Land Stewardship through the Integrated Farm and Livestock Demonstration Program, in collaboration with Iowa Department of Natural Resources (USEPA Section 319), Natural Resources Conservation Service, Conservation Districts of Iowa, Iowa State University Extension and Outreach, Leopold Center for Sustainable Agriculture, Iowa Farm Bureau Federation and Iowa Water Center.
October 2015
Resources & footnotes
1. Iowa Soil Properties and Interpretations Database (ISPAID): (http://extension.agron.iastate.edu/soils/SSDS_maps.html)
2. ISU Extension Ag Decision Maker Publication A1-75 “Value of Soil Erosion to the Land Owner” (August 2012); Mike Duffy.
3. ISU Extension Ag Decision Maker Publication C2-10 “ISU Cash Rental Rate Survey” (https://www.extension.iastate.edu/agdm/wholefarm/html/c2-10.html)
4. ISU Integrated Crop Management News “What is the Nutrient Value of Lost Organic Matter by Erosion” (March 2015); Mahdi Al-Kaisi.
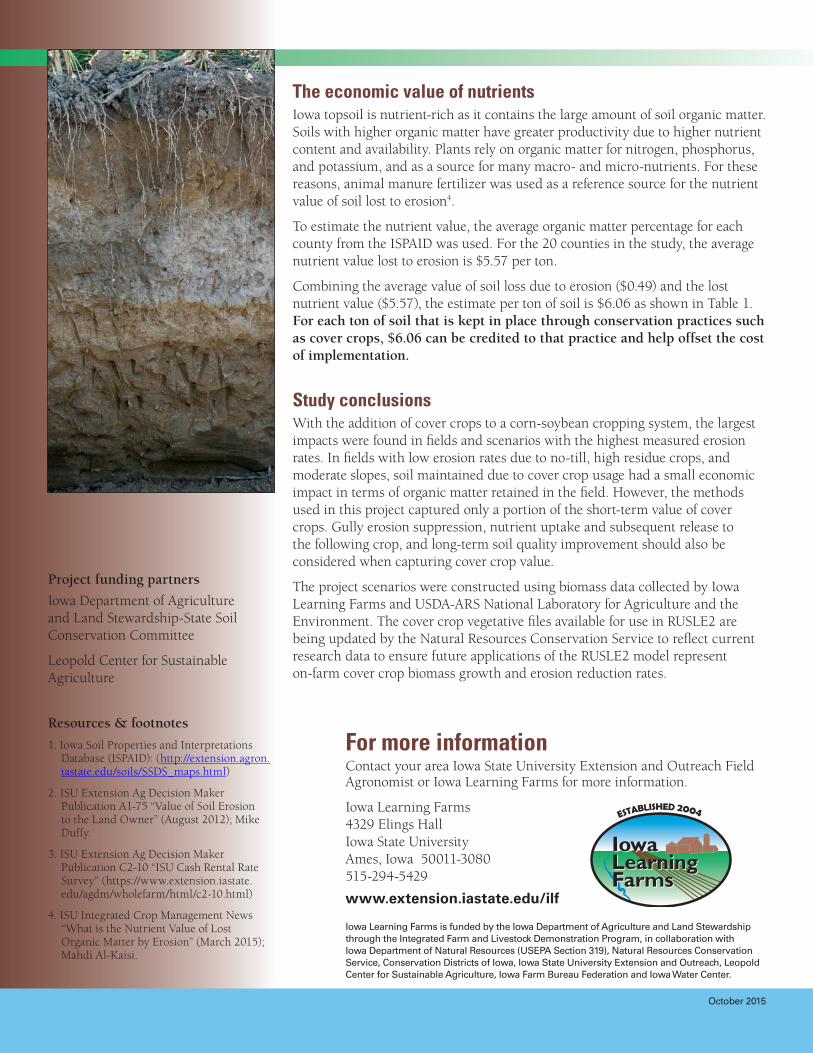
The economic value of nutrientsIowa topsoil is nutrient-rich as it contains the large amount of soil organic matter. Soils with higher organic matter have greater productivity due to higher nutrient content and availability. Plants rely on organic matter for nitrogen, phosphorus, and potassium, and as a source for many macro- and micro-nutrients. For these reasons, animal manure fertilizer was used as a reference source for the nutrient value of soil lost to erosion4.
To estimate the nutrient value, the average organic matter percentage for each county from the ISPAID was used. For the 20 counties in the study, the average nutrient value lost to erosion is $5.57 per ton.
Combining the average value of soil loss due to erosion ($0.49) and the lost nutrient value ($5.57), the estimate per ton of soil is $6.06 as shown in Table 1. For each ton of soil that is kept in place through conservation practices such as cover crops, $6.06 can be credited to that practice and help offset the cost of implementation.
Study conclusionsWith the addition of cover crops to a corn-soybean cropping system, the largest impacts were found in fields and scenarios with the highest measured erosion rates. In fields with low erosion rates due to no-till, high residue crops, and moderate slopes, soil maintained due to cover crop usage had a small economic impact in terms of organic matter retained in the field. However, the methods used in this project captured only a portion of the short-term value of cover crops. Gully erosion suppression, nutrient uptake and subsequent release to the following crop, and long-term soil quality improvement should also be considered when capturing cover crop value.
The project scenarios were constructed using biomass data collected by Iowa Learning Farms and USDA-ARS National Laboratory for Agriculture and the Environment. The cover crop vegetative files available for use in RUSLE2 are being updated by the Natural Resources Conservation Service to reflect current research data to ensure future applications of the RUSLE2 model represent on-farm cover crop biomass growth and erosion reduction rates.
IowaLearningFarms
IowaLearningFarms
ESTABLISHED 2004
Project funding partners
Iowa Department of Agriculture and Land Stewardship-State Soil Conservation Committee
Leopold Center for Sustainable Agriculture