the economic value of biochar in crop production and carbon sequestration
TRANSCRIPT

Energy Policy 39 (2011) 6344–6350
Contents lists available at ScienceDirect
Energy Policy
0301-42
doi:10.1
n Corr
E-m
journal homepage: www.elsevier.com/locate/enpol
The economic value of biochar in crop production and carbon sequestration
Suzette P. Galinato a,n, Jonathan K. Yoder b, David Granatstein c
a IMPACT Center, School of Economic Sciences, Washington State University, Pullman, WA 99164, USAb School of Economic Sciences, Washington State University, Pullman, WA 99164, USAc Center for Sustaining Agriculture and Natural Resources, Washington State University, 1100N. Western Ave., Wenatchee, WA 98801, USA
a r t i c l e i n f o
Article history:
Received 22 November 2010
Accepted 15 July 2011Available online 5 August 2011
Keywords:
Biochar
Carbon sequestration
Farm profitability
15/$ - see front matter & 2011 Elsevier Ltd. A
016/j.enpol.2011.07.035
esponding author. Tel.: þ1509 335 1408; fax
ail address: [email protected] (S.P. Galinato
a b s t r a c t
This paper estimates the economic value of biochar application on agricultural cropland for carbon
sequestration and its soil amendment properties. In particular, we consider the carbon emissions
avoided when biochar is applied to agricultural soil, instead of agricultural lime, the amount of carbon
sequestered, and the value of carbon offsets, assuming there is an established carbon trading
mechanism for biochar soil application. We use winter wheat production in Eastern Whitman County,
Washington as a case study, and consider different carbon offset price scenarios and different prices of
biochar to estimate a farm profit. Our findings suggest that it may be profitable to apply biochar as a
soil amendment under some conditions if the biochar market price is low enough and/or a carbon offset
market exists.
& 2011 Elsevier Ltd. All rights reserved.
1. Introduction
Biochar is a charcoal-like material produced by the thermo-chemical pyrolysis of biomass materials. It is being considered as apotentially significant means of storing carbon for long periods tomitigate greenhouse gases (Laird, 2008). Much of the interest inbiochar comes from studies of Amazonian soils that appear to havebeen amended with biochar, with significant improvements in soilquality and positive effects on crop yields (Lehmann et al., 2004).These changes have persisted for hundreds, if not thousands, ofyears. It is not yet known how long it takes for biochar to integratewith the soil and express its benefits. However, biochar representsa stable form of carbon and thus provides an intriguing potentialcarbon storage strategy as a soil amendment (Mathews, 2008).
This study assesses the potential value of the use of biochar asa soil amendment from potential dual benefits of increased cropyields and returns from carbon sequestration, under a set ofassumed conditions. We consider the effect of biochar in improv-ing crop productivity by ameliorating the soil acidity. Next, weevaluate and aggregate emissions avoided and carbon seques-tered when biochar replaces lime usage in the field. We thencalculate the value of carbon offsets using a low and high pricerange of $1 and $31/MT CO2, assuming a carbon trading mechan-ism exists for biochar soil application. As a case study, we focuson wheat production in Washington State and examine farmprofitability with and without the application of biochar. Our
ll rights reserved.
: þ1509 335 3958.
).
findings suggest that it may be profitable to apply biochar as a soilamendment under some conditions if the biochar market price islow enough and/or a carbon offset market exists.
The existing literature will be reviewed in detail below. As willbe discussed, some of these studies focus on the properties andapplication rates of biochar and their impacts on agriculturalproductivity, and some examine biochar’s potential in sequester-ing carbon. However, this is the first study to our knowledge thatlinks farm profitability with the economic value of biochar as asoil additive and as a source of carbon offset credits.
The following two sections provide a review of existing studies ofthe impacts of biochar soil application to crop productivity and tocarbon (C) sequestration. We rely on the results of these studies inour analysis of the economic value of biochar as a soil amendment.Section 4 describes our methodology, and Section 5 presentsestimated costs and returns in crop production for the case of wheat,with and without the application of biochar. Section 6 concludes.
2. Impacts of biochar on crop productivity—related studies
A number of studies have investigated the response of crops tobiochar application. Table 1 presents summaries of a limitedsample of these studies showing the impacts of biochar on cropresponse in terms of yield or plant biomass. Observed impactsvary depending on interactions between the types of biocharused, crop studied, soil type, local conditions, among others. Somestudies have observed increased crop productivity from usingbiochar alone (Baum and Weitner, 2006; Chan et al., 2008). Otherstudies found a more positive crop response when biochar is
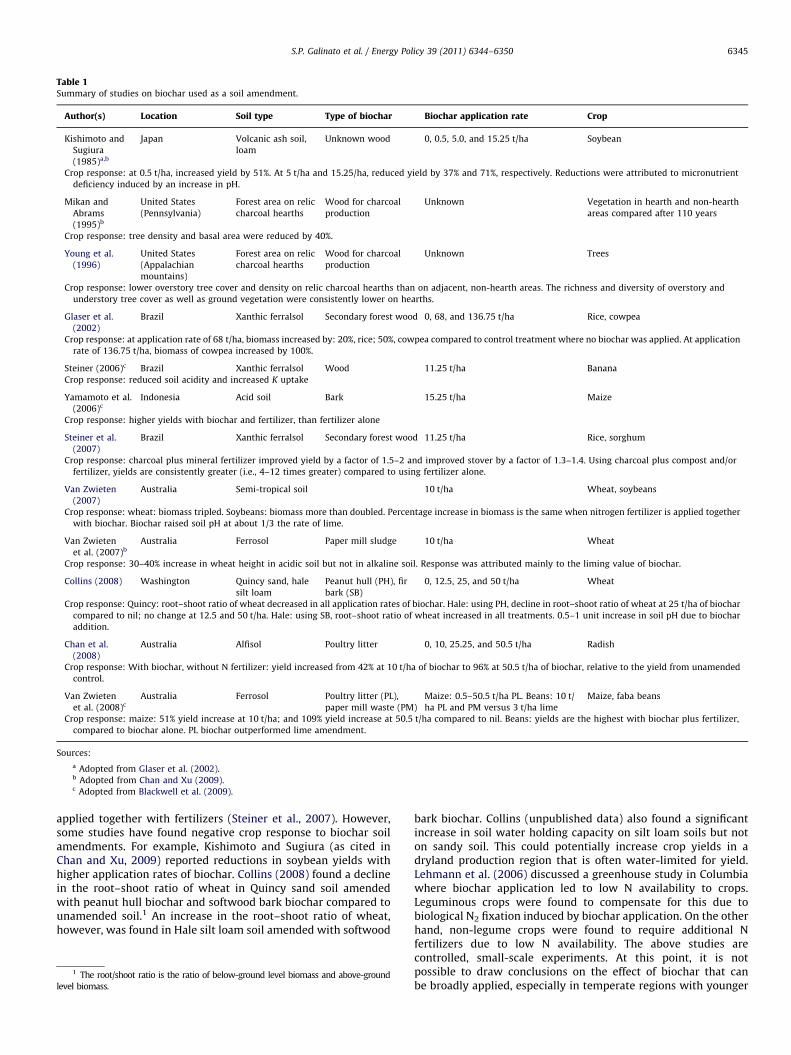
Table 1Summary of studies on biochar used as a soil amendment.
Author(s) Location Soil type Type of biochar Biochar application rate Crop
Kishimoto and
Sugiura
(1985)a,b
Japan Volcanic ash soil,
loam
Unknown wood 0, 0.5, 5.0, and 15.25 t/ha Soybean
Crop response: at 0.5 t/ha, increased yield by 51%. At 5 t/ha and 15.25/ha, reduced yield by 37% and 71%, respectively. Reductions were attributed to micronutrient
deficiency induced by an increase in pH.
Mikan and
Abrams
(1995)b
United States
(Pennsylvania)
Forest area on relic
charcoal hearths
Wood for charcoal
production
Unknown Vegetation in hearth and non-hearth
areas compared after 110 years
Crop response: tree density and basal area were reduced by 40%.
Young et al.
(1996)
United States
(Appalachian
mountains)
Forest area on relic
charcoal hearths
Wood for charcoal
production
Unknown Trees
Crop response: lower overstory tree cover and density on relic charcoal hearths than on adjacent, non-hearth areas. The richness and diversity of overstory and
understory tree cover as well as ground vegetation were consistently lower on hearths.
Glaser et al.
(2002)
Brazil Xanthic ferralsol Secondary forest wood 0, 68, and 136.75 t/ha Rice, cowpea
Crop response: at application rate of 68 t/ha, biomass increased by: 20%, rice; 50%, cowpea compared to control treatment where no biochar was applied. At application
rate of 136.75 t/ha, biomass of cowpea increased by 100%.
Steiner (2006)c Brazil Xanthic ferralsol Wood 11.25 t/ha Banana
Crop response: reduced soil acidity and increased K uptake
Yamamoto et al.
(2006)c
Indonesia Acid soil Bark 15.25 t/ha Maize
Crop response: higher yields with biochar and fertilizer, than fertilizer alone
Steiner et al.
(2007)
Brazil Xanthic ferralsol Secondary forest wood 11.25 t/ha Rice, sorghum
Crop response: charcoal plus mineral fertilizer improved yield by a factor of 1.5–2 and improved stover by a factor of 1.3–1.4. Using charcoal plus compost and/or
fertilizer, yields are consistently greater (i.e., 4–12 times greater) compared to using fertilizer alone.
Van Zwieten
(2007)
Australia Semi-tropical soil 10 t/ha Wheat, soybeans
Crop response: wheat: biomass tripled. Soybeans: biomass more than doubled. Percentage increase in biomass is the same when nitrogen fertilizer is applied together
with biochar. Biochar raised soil pH at about 1/3 the rate of lime.
Van Zwieten
et al. (2007)b
Australia Ferrosol Paper mill sludge 10 t/ha Wheat
Crop response: 30–40% increase in wheat height in acidic soil but not in alkaline soil. Response was attributed mainly to the liming value of biochar.
Collins (2008) Washington Quincy sand, hale
silt loam
Peanut hull (PH), fir
bark (SB)
0, 12.5, 25, and 50 t/ha Wheat
Crop response: Quincy: root–shoot ratio of wheat decreased in all application rates of biochar. Hale: using PH, decline in root–shoot ratio of wheat at 25 t/ha of biochar
compared to nil; no change at 12.5 and 50 t/ha. Hale: using SB, root–shoot ratio of wheat increased in all treatments. 0.5–1 unit increase in soil pH due to biochar
addition.
Chan et al.
(2008)
Australia Alfisol Poultry litter 0, 10, 25.25, and 50.5 t/ha Radish
Crop response: With biochar, without N fertilizer: yield increased from 42% at 10 t/ha of biochar to 96% at 50.5 t/ha of biochar, relative to the yield from unamended
control.
Van Zwieten
et al. (2008)c
Australia Ferrosol Poultry litter (PL),
paper mill waste (PM)
Maize: 0.5–50.5 t/ha PL. Beans: 10 t/
ha PL and PM versus 3 t/ha lime
Maize, faba beans
Crop response: maize: 51% yield increase at 10 t/ha; and 109% yield increase at 50.5 t/ha compared to nil. Beans: yields are the highest with biochar plus fertilizer,
compared to biochar alone. PL biochar outperformed lime amendment.
Sources:
a Adopted from Glaser et al. (2002).b Adopted from Chan and Xu (2009).c Adopted from Blackwell et al. (2009).
S.P. Galinato et al. / Energy Policy 39 (2011) 6344–6350 6345
applied together with fertilizers (Steiner et al., 2007). However,some studies have found negative crop response to biochar soilamendments. For example, Kishimoto and Sugiura (as cited inChan and Xu, 2009) reported reductions in soybean yields withhigher application rates of biochar. Collins (2008) found a declinein the root–shoot ratio of wheat in Quincy sand soil amendedwith peanut hull biochar and softwood bark biochar compared tounamended soil.1 An increase in the root–shoot ratio of wheat,however, was found in Hale silt loam soil amended with softwood
1 The root/shoot ratio is the ratio of below-ground level biomass and above-ground
level biomass.
bark biochar. Collins (unpublished data) also found a significantincrease in soil water holding capacity on silt loam soils but noton sandy soil. This could potentially increase crop yields in adryland production region that is often water-limited for yield.Lehmann et al. (2006) discussed a greenhouse study in Columbiawhere biochar application led to low N availability to crops.Leguminous crops were found to compensate for this due tobiological N2 fixation induced by biochar application. On the otherhand, non-legume crops were found to require additional Nfertilizers due to low N availability. The above studies arecontrolled, small-scale experiments. At this point, it is notpossible to draw conclusions on the effect of biochar that canbe broadly applied, especially in temperate regions with younger
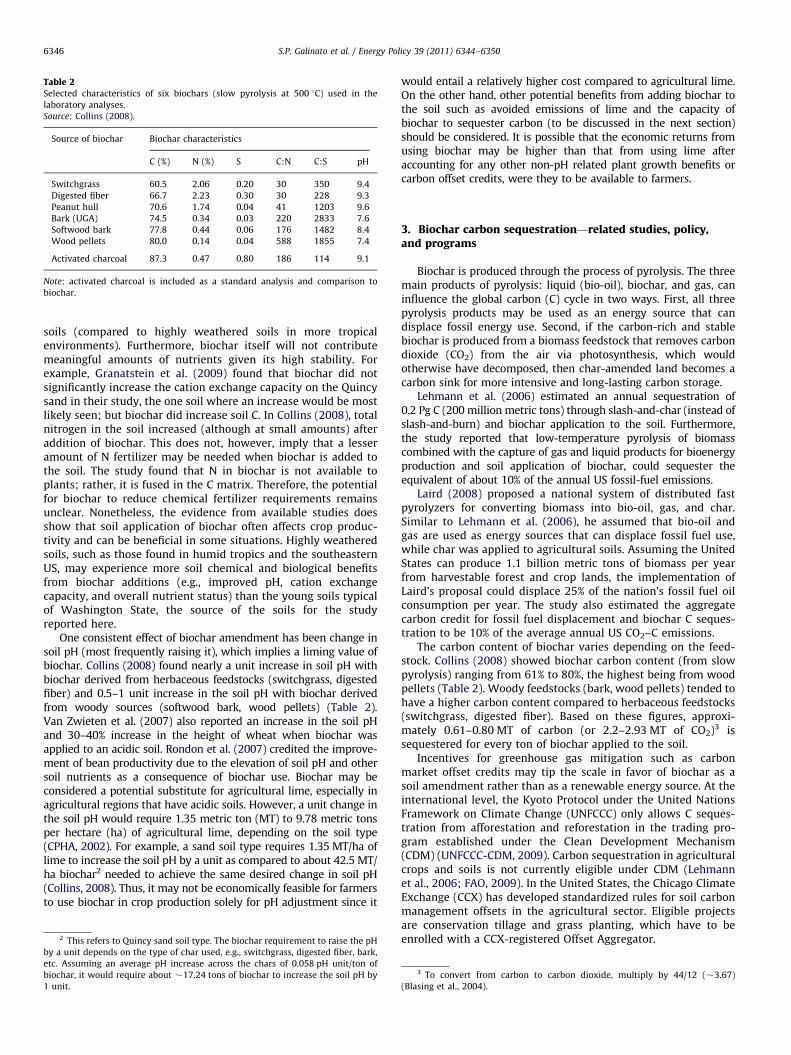
Table 2Selected characteristics of six biochars (slow pyrolysis at 500 1C) used in the
laboratory analyses.
Source: Collins (2008).
Source of biochar Biochar characteristics
C (%) N (%) S C:N C:S pH
Switchgrass 60.5 2.06 0.20 30 350 9.4
Digested fiber 66.7 2.23 0.30 30 228 9.3
Peanut hull 70.6 1.74 0.04 41 1203 9.6
Bark (UGA) 74.5 0.34 0.03 220 2833 7.6
Softwood bark 77.8 0.44 0.06 176 1482 8.4
Wood pellets 80.0 0.14 0.04 588 1855 7.4
Activated charcoal 87.3 0.47 0.80 186 114 9.1
Note: activated charcoal is included as a standard analysis and comparison to
biochar.
S.P. Galinato et al. / Energy Policy 39 (2011) 6344–63506346
soils (compared to highly weathered soils in more tropicalenvironments). Furthermore, biochar itself will not contributemeaningful amounts of nutrients given its high stability. Forexample, Granatstein et al. (2009) found that biochar did notsignificantly increase the cation exchange capacity on the Quincysand in their study, the one soil where an increase would be mostlikely seen; but biochar did increase soil C. In Collins (2008), totalnitrogen in the soil increased (although at small amounts) afteraddition of biochar. This does not, however, imply that a lesseramount of N fertilizer may be needed when biochar is added tothe soil. The study found that N in biochar is not available toplants; rather, it is fused in the C matrix. Therefore, the potentialfor biochar to reduce chemical fertilizer requirements remainsunclear. Nonetheless, the evidence from available studies doesshow that soil application of biochar often affects crop produc-tivity and can be beneficial in some situations. Highly weatheredsoils, such as those found in humid tropics and the southeasternUS, may experience more soil chemical and biological benefitsfrom biochar additions (e.g., improved pH, cation exchangecapacity, and overall nutrient status) than the young soils typicalof Washington State, the source of the soils for the studyreported here.
One consistent effect of biochar amendment has been change insoil pH (most frequently raising it), which implies a liming value ofbiochar. Collins (2008) found nearly a unit increase in soil pH withbiochar derived from herbaceous feedstocks (switchgrass, digestedfiber) and 0.5–1 unit increase in the soil pH with biochar derivedfrom woody sources (softwood bark, wood pellets) (Table 2).Van Zwieten et al. (2007) also reported an increase in the soil pHand 30–40% increase in the height of wheat when biochar wasapplied to an acidic soil. Rondon et al. (2007) credited the improve-ment of bean productivity due to the elevation of soil pH and othersoil nutrients as a consequence of biochar use. Biochar may beconsidered a potential substitute for agricultural lime, especially inagricultural regions that have acidic soils. However, a unit change inthe soil pH would require 1.35 metric ton (MT) to 9.78 metric tonsper hectare (ha) of agricultural lime, depending on the soil type(CPHA, 2002). For example, a sand soil type requires 1.35 MT/ha oflime to increase the soil pH by a unit as compared to about 42.5 MT/ha biochar2 needed to achieve the same desired change in soil pH(Collins, 2008). Thus, it may not be economically feasible for farmersto use biochar in crop production solely for pH adjustment since it
2 This refers to Quincy sand soil type. The biochar requirement to raise the pH
by a unit depends on the type of char used, e.g., switchgrass, digested fiber, bark,
etc. Assuming an average pH increase across the chars of 0.058 pH unit/ton of
biochar, it would require about �17.24 tons of biochar to increase the soil pH by
1 unit.
would entail a relatively higher cost compared to agricultural lime.On the other hand, other potential benefits from adding biochar tothe soil such as avoided emissions of lime and the capacity ofbiochar to sequester carbon (to be discussed in the next section)should be considered. It is possible that the economic returns fromusing biochar may be higher than that from using lime afteraccounting for any other non-pH related plant growth benefits orcarbon offset credits, were they to be available to farmers.
3. Biochar carbon sequestration—related studies, policy,and programs
Biochar is produced through the process of pyrolysis. The threemain products of pyrolysis: liquid (bio-oil), biochar, and gas, caninfluence the global carbon (C) cycle in two ways. First, all threepyrolysis products may be used as an energy source that candisplace fossil energy use. Second, if the carbon-rich and stablebiochar is produced from a biomass feedstock that removes carbondioxide (CO2) from the air via photosynthesis, which wouldotherwise have decomposed, then char-amended land becomes acarbon sink for more intensive and long-lasting carbon storage.
Lehmann et al. (2006) estimated an annual sequestration of0.2 Pg C (200 million metric tons) through slash-and-char (instead ofslash-and-burn) and biochar application to the soil. Furthermore,the study reported that low-temperature pyrolysis of biomasscombined with the capture of gas and liquid products for bioenergyproduction and soil application of biochar, could sequester theequivalent of about 10% of the annual US fossil-fuel emissions.
Laird (2008) proposed a national system of distributed fastpyrolyzers for converting biomass into bio-oil, gas, and char.Similar to Lehmann et al. (2006), he assumed that bio-oil andgas are used as energy sources that can displace fossil fuel use,while char was applied to agricultural soils. Assuming the UnitedStates can produce 1.1 billion metric tons of biomass per yearfrom harvestable forest and crop lands, the implementation ofLaird’s proposal could displace 25% of the nation’s fossil fuel oilconsumption per year. The study also estimated the aggregatecarbon credit for fossil fuel displacement and biochar C seques-tration to be 10% of the average annual US CO2–C emissions.
The carbon content of biochar varies depending on the feed-stock. Collins (2008) showed biochar carbon content (from slowpyrolysis) ranging from 61% to 80%, the highest being from woodpellets (Table 2). Woody feedstocks (bark, wood pellets) tended tohave a higher carbon content compared to herbaceous feedstocks(switchgrass, digested fiber). Based on these figures, approxi-mately 0.61–0.80 MT of carbon (or 2.2–2.93 MT of CO2)3 issequestered for every ton of biochar applied to the soil.
Incentives for greenhouse gas mitigation such as carbonmarket offset credits may tip the scale in favor of biochar as asoil amendment rather than as a renewable energy source. At theinternational level, the Kyoto Protocol under the United NationsFramework on Climate Change (UNFCCC) only allows C seques-tration from afforestation and reforestation in the trading pro-gram established under the Clean Development Mechanism(CDM) (UNFCCC-CDM, 2009). Carbon sequestration in agriculturalcrops and soils is not currently eligible under CDM (Lehmannet al., 2006; FAO, 2009). In the United States, the Chicago ClimateExchange (CCX) has developed standardized rules for soil carbonmanagement offsets in the agricultural sector. Eligible projectsare conservation tillage and grass planting, which have to beenrolled with a CCX-registered Offset Aggregator.
3 To convert from carbon to carbon dioxide, multiply by 44/12 (�3.67)
(Blasing et al., 2004).
S.P. Galinato et al. / Energy Policy 39 (2011) 6344–6350 6347
In 2008, prices of traded CO2 offsets on the Chicago ClimateExchange were volatile, ranging from $1 to $7.40/MT CO2 (CCX,2008). During the same year, the market prices of CO2 offsets inthe European Climate Exchange varied between $17 and $31/MTCO2 (ECX, 2008). The differences in price across markets are inpart due to the fact that participation in the CCX is currentlyoptional; no entity is legally required to participate in thisexchange. However, recent policy discussions at the national levelsuggest increased momentum toward a binding national carbonmarket. In the following section, we estimate the value of biocharas an input in crop production and as an instrument in Csequestration. We assume that a carbon market exists for avoidedemissions and C sequestration due to use of biochar as soilamendment. Also, for the value of potential CO2 offset, we use alow and high value of $1 and $31/MT CO2.
4. Estimated costs and returns for using biochar as a soilamendment
In this section, we estimate the value of biochar as a soilamendment and the economic returns to farmers under a set ofassumed conditions. The calculation is done in two stages. First,we assess: (a) the avoided emissions from the soil application ofbiochar instead of agricultural lime, excluding the energy andemissions from transporting and spreading the material; and(b) the amount of carbon sequestered from biochar application.Combined, the emissions avoidance and sequestration effects arecounted as CO2 offsets that can be sold under an assumed set ofcarbon offset prices. Second, we calculate the profit of cropproduction given two scenarios—without biochar but with limeapplication to the soil, and with biochar application as a sub-stitute for lime. We focus on dryland wheat production in thestate of Washington as a case study.
4.1. Estimates of avoided emissions
Gaunt and Lehmann (2008) and McCarl et al. (2009) estimatedthe avoided greenhouse gas emissions of applying biochar toagricultural land in terms of reduced agricultural input require-ments due to a crop’s improved use of nutrients. This translates toreductions in both fertilizer use and nitrous oxide emissions infertilized fields. However, the dynamics of the relationship betweenfertilizers and biochar are not included in our analysis since theeffects of biochar on the utilization intensity of fertilizers depend onvarious factors like the type of crop studied, soil type, soil quality,and biochar type. On the other hand, there is strong consensusabout biochar’s positive effects on soil pH that is similar to limingeffects, as exemplified by studies discussed in Section 2.
Agricultural lime is commonly applied to soils to amelioratethe soil pH. The recommended rates of lime application inwestern Washington range from 2.28 to 11.35 MT/ha every 3–5years, roughly.4 Less or no lime is needed in Washington east ofthe Cascades because the native soil pH is high.5 However, somesoils in eastern Washington with a long history of urea orammonium-based nitrogen fertilizers have experienced a reduc-tion in pH to a low enough level to justify the need for lime. Whenthere is a soil acidity problem, lime applications range from 2.28to 6.8 MT/ha.6
4 Data from personal communication with Craig Cogger, Washington State
University, 2009.5 Data from personal communications with Richard Koenig, Craig Cogger and
Joan Davenport, Washington State University, 2009.6 Data from personal communication with Joan Davenport, Washington State
University, 2009.
West and McBride (2005) estimated the net CO2 emission fromapplication of agricultural lime at about 0.059 MT C (or 0.22 MTCO2) per ton of limestone, based on the chemical reaction of limein the soil and transportation of lime-derived bicarbonates to theocean (via leaching and precipitation). This is the amount ofemissions that can potentially be avoided by replacing lime withbiochar. Using the CO2 offset price range of $1 to $31/MT CO2, thevalue of avoided emissions amounts to $0.22–$6.82/MT lime.
4.2. Estimates of biochar carbon sequestration
Biochar from herbaceous and woody feedstock sources arefound to have a carbon content of 60.5–66.7% and 74.5–80%,respectively. We can assume from these figures that for every tonof biochar applied to the soil, 0.61–0.80 ton of carbon (equivalentto 2.2–2.93 ton of CO2) can be sequestered (Collins, 2008). Usingthe highest carbon content of the wood-based biochar (i.e., 80%)and the CO2 offset price range, the approximate value of biochar Csequestration is $2.93–$90.83/MT biochar.
4.3. Costs and returns of crop production
We examine the potential economic returns to farmers if theyutilize biochar as a substitute for agricultural lime under threeprice scenarios: (a) $114.05/MT based on the energy content of awood-based biochar; (b) $87/MT; and (c) $350.74/MT. The firstvalue represents the opportunity cost of the foregone use ofbiochar as energy source. A wood-based biochar has an averageenergy content of 12,500–12,500 BTU/lb (Dynamotive EnergySystems, 2007). The energy content of Central Appalachiancoal is 12,500 BTU/lb and its price is $116.38/MT as of 2008(EIA, 2009). Using the energy content as basis, the combustionvalue of biochar is 98% that of Central Appalachian coal, or$114.05/MT. The latter two prices are adopted from the estimatedbreak-even prices of biochar in Granatstein et al. (2009).
Wheat, a key economic crop in Washington that covers about930,000 hectares of land (NASS, 2010), belongs to a group ofcrops that can tolerate slightly acidic (i.e., 6.0–6.5) soil pH (CPHA,2002). In general, wheat tends to favor soil pH between 6 and 7(Beegle and Lingenfelter, 2005). Eastern Washington has experi-enced a decline in soil pH due to the use of ammonium-basedfertilizers. We focus on changes in winter wheat yield in easternWashington given changes in the soil pH as a case study,hypothesizing that if biochar could be used to address the pHproblem and to sequester carbon, these combined values mightjustify its use on a large agricultural area. The crop yieldis estimated through the following equation adopted fromMahler (1986):
Winter Wheat Yield¼�2960:56þ1530 SOILPH ð1Þ
where winter wheat yield is in kg/ha, and SOILPH refers to thevalue of the soil pH of Palouse silt loam. Assuming the base soilpH of 4.5 for this soil type from Collins (2008), increasing the soilpH to 6 would require 6.48 MT of limestone per hectare (CPHA,2002) or 76.53 MT of biochar per hectare (Collins, unpublisheddata).7
Using Eq. (1) with soil pH of 4.5, wheat yield is estimated atabout 3924.44 kg/ha. On the other hand, with a soil pH of 6, theestimated wheat yield is about 6219.44 kg/ha. Profits from winter
7 Note that the impact of char on soil pH depends on the soil type and the type
of char. For the Palouse silt loam soil type, an average pH increase across the chars
is �0.0196 pH unit/ton of biochar per hectare. Based on this, it would require
about 76.53 tons/ha to increase the soil pH from 4.5 to 6 (i.e., increase by
1.5 units).
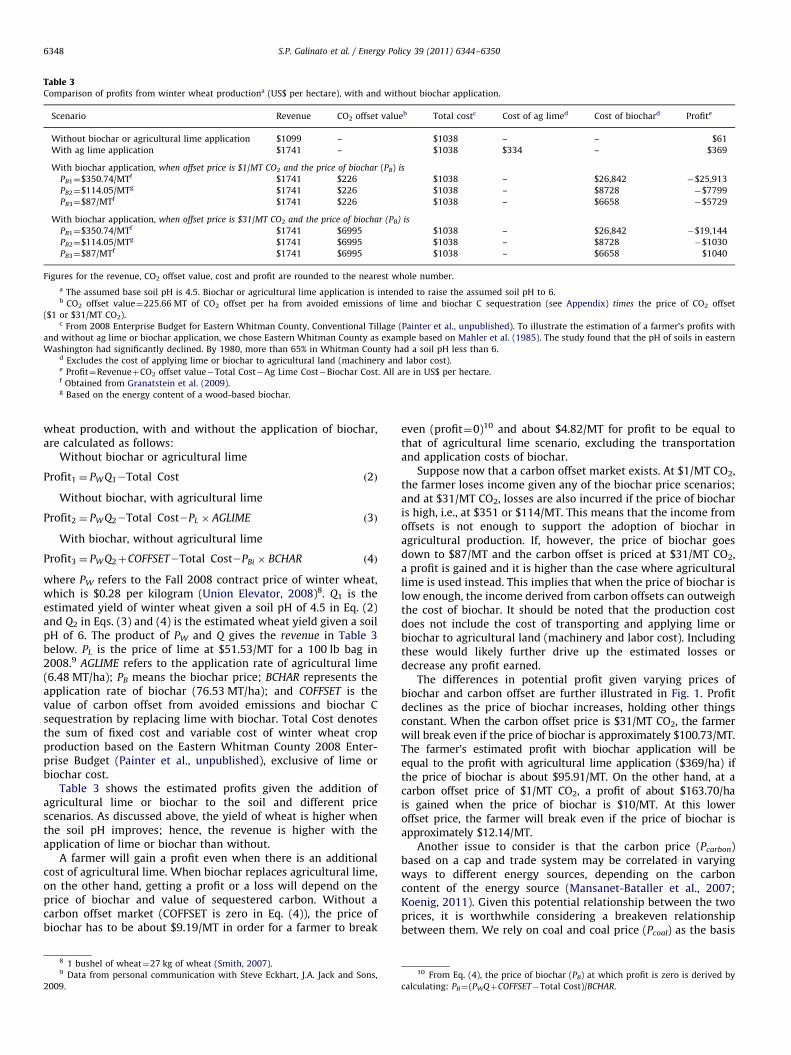
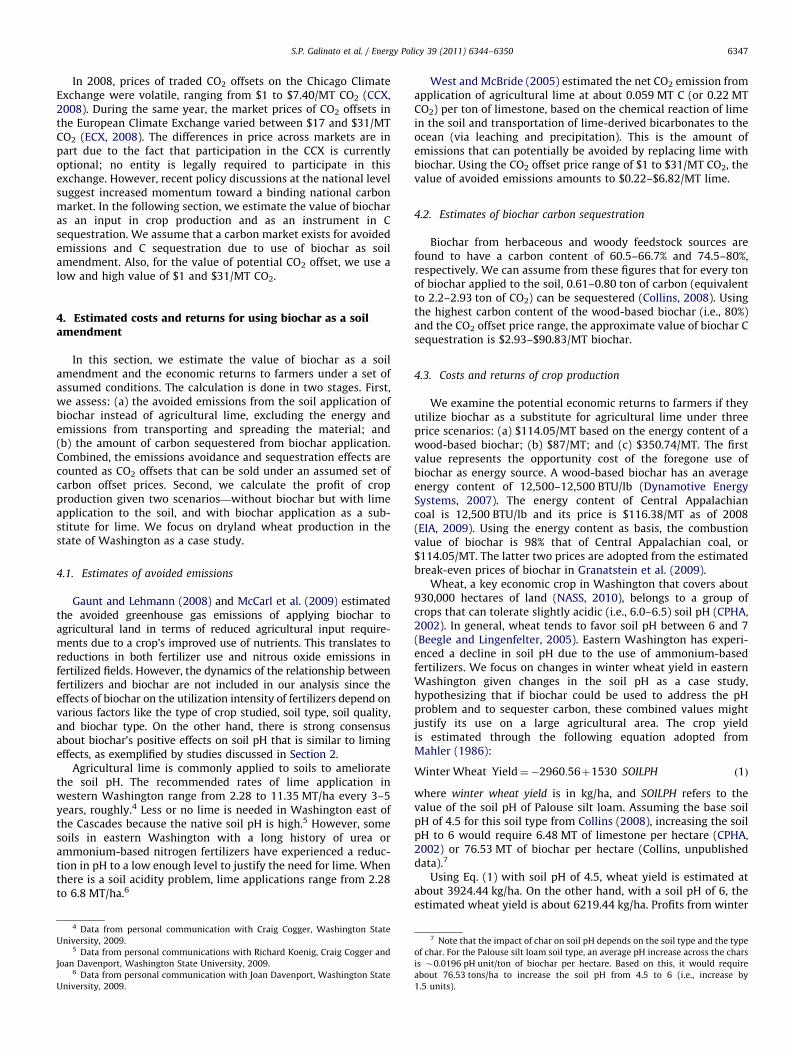
Table 3Comparison of profits from winter wheat productiona (US$ per hectare), with and without biochar application.
Scenario Revenue CO2 offset valueb Total costc Cost of ag limed Cost of biochard Profite
Without biochar or agricultural lime application $1099 – $1038 – – $61
With ag lime application $1741 – $1038 $334 – $369
With biochar application, when offset price is $1/MT CO2 and the price of biochar (PB) is
PB1¼$350.74/MTf $1741 $226 $1038 – $26,842 �$25,913
PB2¼$114.05/MTg $1741 $226 $1038 – $8728 �$7799
PB3¼$87/MTf $1741 $226 $1038 – $6658 �$5729
With biochar application, when offset price is $31/MT CO2 and the price of biochar (PB) is
PB1¼$350.74/MTf $1741 $6995 $1038 – $26,842 �$19,144
PB2¼$114.05/MTg $1741 $6995 $1038 – $8728 �$1030
PB3¼$87/MTf $1741 $6995 $1038 – $6658 $1040
Figures for the revenue, CO2 offset value, cost and profit are rounded to the nearest whole number.
a The assumed base soil pH is 4.5. Biochar or agricultural lime application is intended to raise the assumed soil pH to 6.b CO2 offset value¼225.66 MT of CO2 offset per ha from avoided emissions of lime and biochar C sequestration (see Appendix) times the price of CO2 offset
($1 or $31/MT CO2).c From 2008 Enterprise Budget for Eastern Whitman County, Conventional Tillage (Painter et al., unpublished). To illustrate the estimation of a farmer’s profits with
and without ag lime or biochar application, we chose Eastern Whitman County as example based on Mahler et al. (1985). The study found that the pH of soils in eastern
Washington had significantly declined. By 1980, more than 65% in Whitman County had a soil pH less than 6.d Excludes the cost of applying lime or biochar to agricultural land (machinery and labor cost).e Profit¼RevenueþCO2 offset value�Total Cost�Ag Lime Cost�Biochar Cost. All are in US$ per hectare.f Obtained from Granatstein et al. (2009).g Based on the energy content of a wood-based biochar.
S.P. Galinato et al. / Energy Policy 39 (2011) 6344–63506348
wheat production, with and without the application of biochar,are calculated as follows:
Without biochar or agricultural lime
Profit1 ¼ PW Q12Total Cost ð2Þ
Without biochar, with agricultural lime
Profit2 ¼ PW Q22Total Cost2PL � AGLIME ð3Þ
With biochar, without agricultural lime
Profit3 ¼ PW Q2þCOFFSET2Total Cost2PBi � BCHAR ð4Þ
where PW refers to the Fall 2008 contract price of winter wheat,which is $0.28 per kilogram (Union Elevator, 2008)8. Q1 is theestimated yield of winter wheat given a soil pH of 4.5 in Eq. (2)and Q2 in Eqs. (3) and (4) is the estimated wheat yield given a soilpH of 6. The product of PW and Q gives the revenue in Table 3below. PL is the price of lime at $51.53/MT for a 100 lb bag in2008.9 AGLIME refers to the application rate of agricultural lime(6.48 MT/ha); PB means the biochar price; BCHAR represents theapplication rate of biochar (76.53 MT/ha); and COFFSET is thevalue of carbon offset from avoided emissions and biochar Csequestration by replacing lime with biochar. Total Cost denotesthe sum of fixed cost and variable cost of winter wheat cropproduction based on the Eastern Whitman County 2008 Enter-prise Budget (Painter et al., unpublished), exclusive of lime orbiochar cost.
Table 3 shows the estimated profits given the addition ofagricultural lime or biochar to the soil and different pricescenarios. As discussed above, the yield of wheat is higher whenthe soil pH improves; hence, the revenue is higher with theapplication of lime or biochar than without.
A farmer will gain a profit even when there is an additionalcost of agricultural lime. When biochar replaces agricultural lime,on the other hand, getting a profit or a loss will depend on theprice of biochar and value of sequestered carbon. Without acarbon offset market (COFFSET is zero in Eq. (4)), the price ofbiochar has to be about $9.19/MT in order for a farmer to break
8 1 bushel of wheat¼27 kg of wheat (Smith, 2007).9 Data from personal communication with Steve Eckhart, J.A. Jack and Sons,
2009.
even (profit¼0)10 and about $4.82/MT for profit to be equal tothat of agricultural lime scenario, excluding the transportationand application costs of biochar.
Suppose now that a carbon offset market exists. At $1/MT CO2,the farmer loses income given any of the biochar price scenarios;and at $31/MT CO2, losses are also incurred if the price of biocharis high, i.e., at $351 or $114/MT. This means that the income fromoffsets is not enough to support the adoption of biochar inagricultural production. If, however, the price of biochar goesdown to $87/MT and the carbon offset is priced at $31/MT CO2,a profit is gained and it is higher than the case where agriculturallime is used instead. This implies that when the price of biochar islow enough, the income derived from carbon offsets can outweighthe cost of biochar. It should be noted that the production costdoes not include the cost of transporting and applying lime orbiochar to agricultural land (machinery and labor cost). Includingthese would likely further drive up the estimated losses ordecrease any profit earned.
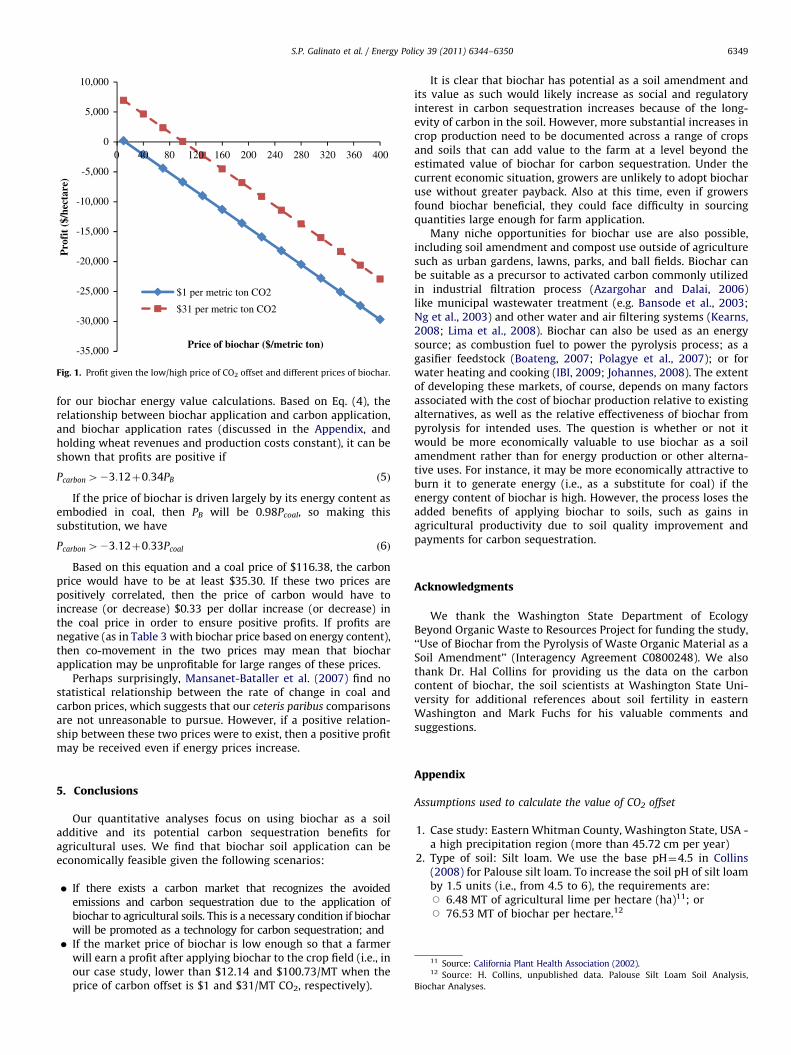
The differences in potential profit given varying prices ofbiochar and carbon offset are further illustrated in Fig. 1. Profitdeclines as the price of biochar increases, holding other thingsconstant. When the carbon offset price is $31/MT CO2, the farmerwill break even if the price of biochar is approximately $100.73/MT.The farmer’s estimated profit with biochar application will beequal to the profit with agricultural lime application ($369/ha) ifthe price of biochar is about $95.91/MT. On the other hand, at acarbon offset price of $1/MT CO2, a profit of about $163.70/hais gained when the price of biochar is $10/MT. At this loweroffset price, the farmer will break even if the price of biochar isapproximately $12.14/MT.
Another issue to consider is that the carbon price (Pcarbon)based on a cap and trade system may be correlated in varyingways to different energy sources, depending on the carboncontent of the energy source (Mansanet-Bataller et al., 2007;Koenig, 2011). Given this potential relationship between the twoprices, it is worthwhile considering a breakeven relationshipbetween them. We rely on coal and coal price (Pcoal) as the basis
10 From Eq. (4), the price of biochar (PB) at which profit is zero is derived by
calculating: PB¼(PWQþCOFFSET�Total Cost)/BCHAR.
-35,000
-30,000
-25,000
-20,000
-15,000
-10,000
-5,000
0
5,000
10,000
0
Pro
fit
($/h
ecta
re)
Price of biochar ($/metric ton)
$1 per metric ton CO2
$31 per metric ton CO2
40 80 120 160 200 240 280 320 360 400
Fig. 1. Profit given the low/high price of CO2 offset and different prices of biochar.
S.P. Galinato et al. / Energy Policy 39 (2011) 6344–6350 6349
for our biochar energy value calculations. Based on Eq. (4), therelationship between biochar application and carbon application,and biochar application rates (discussed in the Appendix, andholding wheat revenues and production costs constant), it can beshown that profits are positive if
Pcarbon423:12þ0:34PB ð5Þ
If the price of biochar is driven largely by its energy content asembodied in coal, then PB will be 0.98Pcoal, so making thissubstitution, we have
Pcarbon423:12þ0:33Pcoal ð6Þ
Based on this equation and a coal price of $116.38, the carbonprice would have to be at least $35.30. If these two prices arepositively correlated, then the price of carbon would have toincrease (or decrease) $0.33 per dollar increase (or decrease) inthe coal price in order to ensure positive profits. If profits arenegative (as in Table 3 with biochar price based on energy content),then co-movement in the two prices may mean that biocharapplication may be unprofitable for large ranges of these prices.
Perhaps surprisingly, Mansanet-Bataller et al. (2007) find nostatistical relationship between the rate of change in coal andcarbon prices, which suggests that our ceteris paribus comparisonsare not unreasonable to pursue. However, if a positive relation-ship between these two prices were to exist, then a positive profitmay be received even if energy prices increase.
5. Conclusions
Our quantitative analyses focus on using biochar as a soiladditive and its potential carbon sequestration benefits foragricultural uses. We find that biochar soil application can beeconomically feasible given the following scenarios:
�
If there exists a carbon market that recognizes the avoidedemissions and carbon sequestration due to the application ofbiochar to agricultural soils. This is a necessary condition if biocharwill be promoted as a technology for carbon sequestration; and �11 Source: California Plant Health Association (2002).12 Source: H. Collins, unpublished data. Palouse Silt Loam Soil Analysis,
Biochar Analyses.
If the market price of biochar is low enough so that a farmerwill earn a profit after applying biochar to the crop field (i.e., inour case study, lower than $12.14 and $100.73/MT when theprice of carbon offset is $1 and $31/MT CO2, respectively).
It is clear that biochar has potential as a soil amendment and
its value as such would likely increase as social and regulatoryinterest in carbon sequestration increases because of the long-evity of carbon in the soil. However, more substantial increases incrop production need to be documented across a range of cropsand soils that can add value to the farm at a level beyond theestimated value of biochar for carbon sequestration. Under thecurrent economic situation, growers are unlikely to adopt biocharuse without greater payback. Also at this time, even if growersfound biochar beneficial, they could face difficulty in sourcingquantities large enough for farm application.Many niche opportunities for biochar use are also possible,including soil amendment and compost use outside of agriculturesuch as urban gardens, lawns, parks, and ball fields. Biochar canbe suitable as a precursor to activated carbon commonly utilizedin industrial filtration process (Azargohar and Dalai, 2006)like municipal wastewater treatment (e.g. Bansode et al., 2003;Ng et al., 2003) and other water and air filtering systems (Kearns,2008; Lima et al., 2008). Biochar can also be used as an energysource; as combustion fuel to power the pyrolysis process; as agasifier feedstock (Boateng, 2007; Polagye et al., 2007); or forwater heating and cooking (IBI, 2009; Johannes, 2008). The extentof developing these markets, of course, depends on many factorsassociated with the cost of biochar production relative to existingalternatives, as well as the relative effectiveness of biochar frompyrolysis for intended uses. The question is whether or not itwould be more economically valuable to use biochar as a soilamendment rather than for energy production or other alterna-tive uses. For instance, it may be more economically attractive toburn it to generate energy (i.e., as a substitute for coal) if theenergy content of biochar is high. However, the process loses theadded benefits of applying biochar to soils, such as gains inagricultural productivity due to soil quality improvement andpayments for carbon sequestration.
Acknowledgments
We thank the Washington State Department of EcologyBeyond Organic Waste to Resources Project for funding the study,‘‘Use of Biochar from the Pyrolysis of Waste Organic Material as aSoil Amendment’’ (Interagency Agreement C0800248). We alsothank Dr. Hal Collins for providing us the data on the carboncontent of biochar, the soil scientists at Washington State Uni-versity for additional references about soil fertility in easternWashington and Mark Fuchs for his valuable comments andsuggestions.
Appendix
Assumptions used to calculate the value of CO2 offset
1.
Case study: Eastern Whitman County, Washington State, USA -a high precipitation region (more than 45.72 cm per year)2.
Type of soil: Silt loam. We use the base pH¼4.5 in Collins(2008) for Palouse silt loam. To increase the soil pH of silt loamby 1.5 units (i.e., from 4.5 to 6), the requirements are:J 6.48 MT of agricultural lime per hectare (ha)11; orJ 76.53 MT of biochar per hectare.12
S.P. Galinato et al. / Energy Policy 39 (2011) 6344–63506350
3.
(Bla
Emissions avoidance and carbon sequestration from usingbiochar as soil amendment:J Avoided emissions for not using lime¼0.22 MT CO2 per
metric ton of limestone.13
J Biochar C sequestration¼0.8 ton/MT of carbon or 2.93 MTCO2
14 per metric ton of biochar applied to the soil.15
13 S14 T
sing15 B
4.
Estimated carbon sequestration per hectare (CO2 offset perhectare) given application of biochar to cropland:J Avoided emissions for not using lime¼6.48 MT lime perha� (0.22 MT CO2/MT of lime)E1.43 MT CO2/ha.J Biochar C sequestration¼76.53 MT biochar per ha�
(2.93 MT CO2/MT of biochar)E224.23 MT CO2/haJ Total value of CO2 offsetE225.66 MT CO2/ha
References
Azargohar, R., Dalai, A.K., 2006. Biochar as a precursor of activated carbon. AppliedBiochemistry and Biotechnology 129–132, 762–773.
Bansode, R., Losso, J., Marshall, W., Rao, R., Portier, R., 2003. Pecan shell-basedgranular activated carbon for treatment of chemical oxygen demand (COD) inmunicipal wastewater. Bioresource Technology 94, 129–135.
Baum, E., Weitner, S., 2006. Biochar Application on Soils and Cellulosic EthanolProduction. Clean Air Task Force, Boston, MA, USA.
Beegle, D.B., Lingenfelter, D.D., 2005. Soil Acidity and Aglime. Agrifacts 3. Collegeof Agricultural Sciences, Cooperative Extension, Pennsylvania State University./http://cropsoil.psu.edu/Extension/Facts/AgFact3.pdfS.
Blackwell, P., Riethmuller, G., Collins, M., 2009. Biochar application to the soil. In:Lehmann, J., Joseph, S. (Eds.), Biochar for Environmental Management: Scienceand Technology. Earthscan Publications Ltd., United Kingdom, pp. 207–222.
Blasing, T.J., Broniak, C.T., Marland, G., 2004. Estimates of monthly CO2 emissionsand associated 13C/12C values from fossil-fuel consumption in the USA. In:Trends: A Compendium of Data on Global Change, Carbon Dioxide InformationAnalysis Center. Oak Ridge National Laboratory, US Department of Energy, OakRidge, TN, USA. /http://cdiac.ornl.gov/trends/emis_mon/emis_mon_co2.htmlS.
Boateng, A.A., 2007. Characterization and thermal conversion of charcoal derivedfrom fluidized-bed fast pyrolysis oil production of switchgrass. Industrial andEngineering Chemistry Research 46 (26), 8857–8862.
California Plant Health Association (CPHA), 2002. Western Fertilizer Handbook,ninth ed. Interstate Publishers, Inc., Danville, IL, USA.
Chan, K.Y., Van Zwieten, L., Meszaros, I., Downie, A., Joseph, S., 2008. Using poultrylitter biochars as soil amendments. Australian Journal of Soil Research 46 (5),437–444.
Chan, K.Y., Xu, Z., 2009. Biochar: nutrient properties and their enhancement. In:Lehmann, J., Joseph, S. (Eds.), Biochar for Environmental Management: Scienceand Technology. Earthscan Publications Ltd., United Kingdom, pp. 67–81.
Chicago Climate Exchange (CCX), 2008. December 2008 market summary. CCSMarket Report 5(12), pp. 1–4. /http://www.chicagoclimatex.com/docs/publications/CCX_carbonmkt_V5_i12_dec2008.pdfS.
Collins, H., December 2008. Use of biochar from the pyrolysis of waste organicmaterial as a soil amendment: laboratory and greenhouse analyses.A Quarterly Progress Report Prepared for the Biochar Project.
Dynamotive Energy Systems, 2007. Table 1: Comparison of Fuel Properties-woodBased Pyrolysis Fuel.
Energy Information Administration (EIA), 2009. Coal News and Market Reports,Average Weekly Coal Commodity Spot Prices. January to December 2008./http://www.eia.doe.gov/cneaf/coal/page/coalnews/cnmarchive.htmlS.
European Climate Exchange (ECX), 2008. Certified Emission Reduction FuturesContracts—2008 Historic Data. /http://www.ecx.eu/CER-FuturesS.
Food and Agriculture Organization (FAO), Forest Resources Division, 2009. Afforesta-tion and Reforestation Projects Under the Clean Development Mechanism of theKyoto Protocol. Fact Sheet. /http://www.fao.org/forestry/media/8953/1/0/S.
Gaunt, J.L., Lehmann, J., 2008. Energy balance and emissions associated withbiochar sequestration and pyrolysis bioenergy production. EnvironmentalScience and Technology 42 (11), 4152–4158.
Glaser, B., Lehmann, J., Zech, W., 2002. Ameliorating physical and chemicalproperties of highly weathered soils in the tropics with charcoal—a review.Biology and Fertility of Soil 35, 219–230.
Granatstein, D., Kruger, C.E., Collins, H., Galinato, S., Garcia-Perez, M., Yoder, J.,2009. Use of Biochar from the Pyrolysis of Waste Organic Material as a Soil
ource: West and McBride (2005).
o convert from carbon to carbon dioxide, multiply by 44/12 (�3.67)
et al., 2004).
ased on biochar content of pine pellets. Source: Collins, 2008.
Amendment. Final Project Report. Center for Sustaining Agriculture andNatural Resources, Washington State University, Wenatchee, WA. 181 pp./http://www.ecy.wa.gov/biblio/0907062.htmlS.
International Biochar Initiative (IBI), 2009. Biochar Kiln Designs for Small Farms./http://www.biochar-international.org/projectsandprograms/memberprojects.htmlS.
Johannes, H., 2008. Energy Efficient Stoves that Burn Biochar and Biosmoke Onlyand Can Save the World’s Forests. /http://www.hedon.info/BP20:BiocharBriquettingAndBurningS.
Kearns, J., 2008. NGOs Team Up to Offer Climate Solutions, Enhanced SustainableAgriculture, and Clean Drinking Water. /http://globalclimatesolutions.org/2008/10/25/ngos-team-up-to-offer-climate-solutions-enhanced-sustainable-agriculture-and-clean-drinking-water/S.
Koenig, P., 2011. Modelling Correlation in Carbon and Energy Markets. EPRGWorking Paper 1107. Electricity Policy Research Group, University of Cam-bridge, United Kingdom. /http://www.eprg.group.cam.ac.uk/wp-content/uploads/2011/02/1107_main-text.pdfS.
Laird, D.A., 2008. The charcoal vision: a win–win–win scenario for simultaneouslyproducing bioenergy, permanently sequestering carbon, while improving soiland water quality. Agronomy Journal 100 (1), 178–181.
Lehmann, J., Kern, D.C., Glaser, B., Woods, W.I. (Eds.), 2004. Management. KluwerAcademic Publishers, New York.
Lehmann, J., Gaunt, J., Rondon, M., 2006. Bio-char sequestration in terrestrialecosystems—a review. Mitigation and Adaptation Strategies for Global Change11, 403–427.
Lima, I.M., McAloon, A., Boateng, A.A., 2008. Activated carbon from broiler litter:process description and cost of production. Biomass and Bioenergy 32, 568–572.
Mahler, R.L., 1986. Evaluation of soil pH manipulation on crop production innorthern Idaho. Communications in Soil Science and Plant Analysis 17 (9),905–919.
Mahler, R.L., Halvorson, A.R., Koehler, F.E., 1985. Long-term acidification of farm-land in northern Idaho and eastern Washington. Communications in SoilScience and Plant Analysis 16 (1), 83–95.
Mansanet-Bataller, M., Pardo, A., Valor, E., 2007. CO2 prices, energy and weather.The Energy Journal 28 (3), 73–92.
Mathews, J.A., 2008. Carbon-negative biofuels. Energy Policy 36, 940–945.McCarl, B.A., Peacocke, C., Chrisman, R., Kung, C.-C., Sands, R.D., 2009. Economics of
biochar production, utilisation and GHG offsets. In: Lehmann, J., Joseph, S.(Eds.), Biochar for Environmental Management: Science and Technology.Earthscan Publications Ltd., United Kingdom, pp. 341–356.
National Agricultural Statistics Service (NASS), 2010. 2008/2009 Wheat AcresPlanted, Washington. Census of Agriculture Database. Washington DC. USDepartment of Agriculture. /http://quickstats.nass.usda.gov/S.
Ng, C., Marshall, W.E., Rao, R.M., Bansode, R.R., Losso, J.N., 2003. Activated carbonfrom pecan shells: process description and economic analysis. Industrial Cropsand Products 17, 209–217.
Painter, K.. 2008 Crop Rotation Budgets, over 1800 Precipitation Zone UnderConventional Tillage. Whitman County, Washington, unpublished.
Polagye, B.L., Hodgson, K.T., Maltea, P.C., 2007. An economic analysis of bio-energyoptions using thinnings from overstocked forests. Biomass and Bioenergy 31,105–125.
Rondon, M.A., Lehmann, J., Ramırez, J., Hurtado, M., 2007. Biological nitrogenfixation by common beans (Phaseolus vulgaris L.) increases with bio-charadditions. Biology and Fertility of Soils 43 (6), 699–708.
Smith, D., 2007. Metric Conversions. /http://www.extension.iastate.edu/agdm/wholefarm/html/c6-80.htmlS.
Steiner, C., Teixeira, W.G., Lehmann, J., Nehls, T., Vasconcelos de Macedo, J.L., Blum,W.E.H., Zech, W., 2007. Long term effects of manure, charcoal and mineralfertilization on crop production and fertility on a highly weathered CentralAmazonian upland soil. Plant Soil 291, 275–290.
Union Elevator and Warehouse Co., 2008. Cash Prices: FOB Lind—August 2008price posted on July 15, 2008. /http://www.unionelevator.com/S.
United Nations Framework Convention on Climate Change, Clean DevelopmentMechanism (UNFCCC-CDM), 2009. Methodologies for Afforestation and Refor-estation CDM Project Activities. /http://cdm.unfccc.int/methodologies/ARmethodologies/index.htmlS.
Van Zwieten, L., 2007. Research Confirms Biochar in Soils Boosts Crop Yields./http://biopact.com/2007/06/research-confirms-biochar-in-soils.htmlS.
West, T.O., McBride, A.C., 2005. The contribution of agricultural lime to carbondioxide emissions in the United States: dissolution, transport and net emis-sions. Agriculture, Ecosystems and Environment 108, 145–154.
Young, M.J., Johnson, J.E., Abrams, M.D., 1996. Vegetative and edaphic character-istics on relic charcoal hearths in the Appalachian Mountains. Plant Ecology125 (1), 43–50.