the economic rationale for social cohesion the … economic rationale for social ... cohesion and...
TRANSCRIPT

1
The Economic Rationale for Social Cohesion –The Cross-Country Evidence
Roberto Foa, Harvard University1
While it is intuitive that conflict and poor social cohesion have great economic and social
costs, it has been difficult to quantify such costs until recently. This paper estimates the
economic benefits of greater social cohesion as well as the correlation between social
cohesion and other aspects of development, using a set of social institutional measures
covering over 200 indicators from 25 different data sources. The paper also uses these
measures to identify case studies in building social cohesion, to which political and social
leaders might refer when considering how to tackle social tensions.
In recent decades, there has been a steady current of country-specific studies examining the
effects of social institutions - the informal norms that pattern human interaction - upon
economic and political outcomes. Among the myriad issues that have been addressed within the
‘social capital’ literature, notable examples include the finding by political scientists that
countries and regions with greater associational life, trust and inter-group cohesion tend to have
better public service delivery, financial accountability, and adherence to democratic norms
(Putnam et al. 1993, Knack 2002, Coffe and Geys 2005); the finding by psychologists that
engagement in community activities has a significant association with measures of health and
educational attainment (Berkman and Syme 1979, Coleman 1988, Helliwell 2003); and the
finding by economists of a robust association between social institutions and economic
wellbeing in the form of both household income and aggregate economic growth (Knack and
1 [email protected]. Department of Government, 1737 Cambridge St, Cambridge, MA 02138. All rights
reserved. Please do not copy or cite without author permission.
2
Keefer 1997, Zak and Knack 2001, Narayan and Pritchett 1999, Grootaert 2001, Tabellini 2005,
Knowles and Weatherston 2007).
However despite the positive results found in successive regional and local studies, there have
been relatively few attempts to test the impact of social institutions at the country comparative
level. Few reliable, globally representative data sources exist that would serve as a basis for
comparing social norms and practices, while survey data for social trust and community
engagement are often fragmented across disparate regional samples (Global Barometer 2000-
10). Commonly used proxy and instrumental variables, such as ethnic fractionalization or the
proportion belonging to a hierarchical religious tradition, may be only weakly reliable or valid as
measures of social institutions, whereas direct behavioral items taken from representative
national surveys, such as social trust or civic norms, often cover only a limited sample of
countries (Eurobarometer 1970-, Afrobarometer 1997-, Asian Barometer 2000-, International
Social Survey Program 1988-).
In order to advance systematic cross-country investigation of the effects of social cohesion upon
economic development, this paper presents the initial results of a method for combining
indicators from multiple sources, in order to generate better aggregate measures of social
institutions, and maximize efficient use of data in country-comparative testing. By generating
composite indices it is possible to estimate scores for a much wider number of countries than
otherwise possible, and minimize the level of error in the estimates as the addition of successive
indicators reduces random variation (Kaufman, Kraay and Loido-Zobaton 1999). The index that is
presented in this paper provides an estimate of the level of social cohesion in 155 societies, a far
greater number than previously the case, and are reported together with margins of error,
reporting the level of confidence in a particular country score. The utility of the new
measurement is then demonstrated by conducting several empirical tests which highlight the
economic rationale for social cohesion, including the estimate of the “social cohesion dividend”
that is delivered when economies are able to fully utilize the resources of their members,
without discrimination based on caste, creed, or ethnicity, and without the costs of containing
violent conflict between groups. Section I of this paper outlines the empirical basis of the index
of social cohesion used throughout the paper, and section II discusses the results. Section III
applies the new data to develop concrete estimates of the economic payoff of having greater
3
social cohesion, using a combination of time-series models, deep determinants (2SLS) and
standard growth regressions. Finally, section IV concludes.
I. Forms of Social Cohesion
In order to organize our data selection, it has been necessary to adopt a working definition of
social cohesion. We understand a socially cohesive society to be one in which institutions exist
that foster norms of cooperation between distinct ethnic, religious, and other identity groups,
including non-discrimination, such as in the labour or capital market; and non-violence, whether
it be via low-level, spontaneous communal conflict such as riots, assassinations and progroms
(Varshney 2003, Brass 2006, Wilkinson 2004), or more institutionalized forms of intergroup
struggle such as terrorist activities or civil war.
Institutions, meanwhile, we define as the norms and conventions that pattern social behavior,
‘the rules of the game in a society *or+ the humanly devised constraints that shape human
interaction’ (North 1990). Formal institutions cover rules that are enforced by third-party
mechanisms, such as a police corps, judiciary, or constitutional council, and social institutions
generally rely upon tacit norms and expectations. Examples of relevant formal institutions might
include discrimination against minorities by police, judiciary, or public service authorities in
access to justice or other public goods; examples of relevant informal institutions include the
formation of civic ties that bridge members of conflicting communities (Varshney 2003) or
simply the willingness to do business with a member of a different religion or ethnic group. We
are thus interested in the indicators that demonstrate whether ethnic, religious and other
minorities are institutionally enabled to participate in the economy, in education, and in civic
and political life.
The Economic Rationale for Social Cohesion
Why might economic theory lead us to expect an economic payoff to greater social cohesion? In
the broad literature on institutions and social capital, a range of explanations have been offered
(Putnam 1993), though we can subdivide these into four general areas: i) the reduction of

4
transaction costs, ii) facilitating collective action, iii) prevention of capital disacumulation; and iv)
improvement of allocative efficiency.
The first mechanism by which social cohesion can enhance growth is via reducing transaction
costs, that is, the costs incurred in making economic exchanges, such as information gathering,
communications, and contract enforcement (Coase 1960). Since Williamson (1981, 1985, 1996)
the concept of transaction cost has also been applied to the effects of informal institutions,
including trust and non-discrimination. In societies where norms of trust or cooperation
between differing ethnic, sectarian, or other identity groups are low, the costs of economic
cooperation will be higher, thereby inhibiting economic activity. In addition, where societies are
riven by violent conflict between identity groups, the transaction cost of economic enterprise
will include the costs of policing, crime prevention, and private security services. Because these
costs may be such as to render unprofitable economic transactions at the margin, some
deadweight loss will inevitably occur. Generalised social trust is one of the most widespread
ways in which ‘social capital’ has been defined and studied (Fukuyama 1995, Arrow 1974, Knack
and Keefer 1997), for, as Fukuyama (1995) argues, where ‘people who have to work together in
an enterprise trust one another because they are all operating according to a common set of
ethical norms, doing business costs less’. Empirical studies have also shown generalized social
trust to be a predictor of future rates of economic growth (Knack and Keefer 1997).
A second mechanism via which social cohesion enhances growth is by facilitating collective
action, that is cooperation among individuals in pursuit of shared objectives, and specifically (in
public choice economics) the demand for and provision of public goods (Olson 1965). While a
strand of early theory in public choice laid emphasis upon the potential deadweight losses
arising from distributive coalitions targeting rents and transfers (Olson 1965), a more recent
current of literature has highlighted the potential positive externalities arising from collective
action in the form of providing, monitoring, and enforcing the provision of necessary public
goods such as infrastructure, schooling or health (Ostrom 1990). Meanwhile the contribution of
social cohesion to collective action has been underlined in much recent social capital literature,
as the presence of divisive social cleavages inhibits willingness to contribute to collective funds
and public investments. Experimental studies, for example, have shown that groups composed
of heterogeneous identities lead to lower participation in voluntary contribution mechanisms

5
(VCMs), even in the presence of potential positive-sum gains (Alesina and La Ferrara, 2000),
while real-world empirical studies have also shown lower levels of public goods provision such
as education, roads, sewers and waste removal is weaker in the context of ethnic and religious
fractionalisation - both within countries (Alesina et al., 1999, Keefer and Khemani 2004), as well
as at a cross-county level (Alesina et al. 2004). Empirical studies have also helped contribute an
important refinement to the debate within public choice economics on whether collective
action is fundamentally beneficial or detrimental to economic growth, by showing that in
regions with strong collective identities based on ethnic or linguistic homogeneity, collective
action tends to support universal public goods centred on public investments such as
infrastructure, health and education, whereas in the presence of intergroup heterogeneity
collective actions favours pursuit of targeted distributive transfers, such as jobs or subsidies
(Keefer and Khemani 2004). Thus where social cohesion is greater, public choice is likely to focus
on the productive, positive-sum allocation of fiscal resources, whereas in the absence of such
ties zero-sum transfers are more likely to prevail.
A third mechanism linking social cohesion and growth is the argument that its absence hinders
economic growth via capital disaccumulation. The explanation goes as follows. In one of its
definitions, long-run economic growth is defined as sustained capital accumulation; the size of
the economy being the sum of goods and services that can be produced within it, and this
quantity, in turn, being defined as the productivity of the factors of production land, labour,
enterprise and capital. Because, furthermore, all improvements in the productivity in land,
labour and enterprise are considered due to some form of capital (e.g. ‘human capital’) it is only
capital accumulation (whether physical or intangible) which enables supply-side economic
growth. While any of the mechanisms outlined in this section regarding the relationship
between social cohesion and growth entail a de facto reduction the rate of capital accumulation,
one argument that is particularly salient is the economic cost of intergroup violence: which
frequently prompts capital disaccumulation as a result of the destruction of physical
infrastructure, and the ‘brain drain’ (loss of human capital). While the argument is fairly
straightforward, empirical studies suggest the economic costs of civil war are phenomenal, with
the annual growth rate during war reduced by 2.2% and a 15-year civil war reducing per capita
GDP by around 30% (Collier 1999). Time-series analysis often brings such costs into stark focus,

6
with a number of medium income economies which have been reduced to developing economy
status as a result of a deep civil conflict, such as Bosnia, Lebanon, or Algeria.
Finally, social cohesion may enhance or hinder economic growth by its relationship to allocative
and productive efficiency. Under its strong definition, allocative efficiency (also known as social
efficiency) can be defined as a condition under which resources are assigned so as to maximise
total economic welfare, in other words where each unit where the marginal benefit of
production exceeds marginal cost leads to the provision of that same good or service (Varian
2003). The absence of social cohesion, however, may lead to allocatively suboptimal outcomes,
as a result of social institutions such as group-based discrimination or exclusion. For example,
where economic actors refuse to engage in economic transactions with other agents of different
ethnic, religious, caste or other identifying groups, then both allocative and productive
efficiency will not be attained: if employers refuse to hire qualified members of minority groups
based on non-salient attributes such as their social background, a welfare loss will occur to both
parties, and a productive loss to the economy as a whole. Similarly, if members of minority
groups are prevented from gaining equal access to education, or their communities to vital
infrastructure such as transport and communication, then these members will not be able to
attain their full human and productive potential, leading to an economic loss for the economy as
a whole. While studies that have attempted to estimate the economic losses arising from norms
of discrimination encounter obvious accounting problems and are subject to a wide margin of
error, all such studies attempted agree that the costs are substantial (Patrinos 2004, Lundahl, M.
1992, Birdsall and Sabot 1991).
II. New Cross-Country Data for Measuring Socially Cohesive Institutions In recent years, a wide range of new cross-country sources have become available with which to
measure the extent of social cohesion in a society. The most widely used quantitative dataset in
the cross-country study of social institutions, the World Values Survey, has included questions
on ethnic and religious trust for a cumulative total of 90 societies over a period of 28 years. It
has recently been complemented by a broad array of regional survey projects: Latinobarometer,
founded in 1996, has included items on crime and ethnic discrimination for 18 Latin American

7
societies; while Afrobarometer, founded in 1999, has asked about such issues in 18 sub-Saharan
African societies. Moreover, comparative survey projects are increasingly complemented by
numerical ratings based on qualitative assessments of social practices. These include the
International Country Risk Guide, which includes ratings of ethnic and religious tensions for 140
countries, and the Minorities at Risk project, which since 1986 has provided comparative
measures of discrimination and exclusion of minority groups in 118 societies across the world.
While expert assessment ratings have long been available in the study of formal institutions of
governance, their extension to social institutions is a recent addition that provides a valuable
additional source of data.
Building on the conceptual schema developed by Woolcock et al. (2004), the social development
indicators project at the World Bank has outlined a series of indices, including measures of
intergroup cohesion, and a cross-country measure of interpersonal safety and trust, that cover a
cumulative total of 165 societies around the globe (Foa 2010). These indices, hosted at the
Institute for Social Studies at the Hague, are due to be publicly launched in early 2011 together
with their underlying data, and constitute a rich source of cross-country data on social cohesion
and exclusion (ISS 2011). The underlying data for the indices span a range of almost 200
indicators, derived from 25 sources, which cover areas ranging from survey data on intergroup
discrimination, to the frequency of newspaper reported incidents such as intergroup riots, to
expert assessment ratings of ethnic and religious tensions.
For the purpose of the analysis in this paper, we have constructed a modified index of social
cohesion based on a selection of the underlying data published on the ISS website,
complemented by additional proprietary data from the Gallup World Poll that has been donated
for the purpose of this project. In selecting indicators, we have chosen measures reflective of
two key aspects of social cohesion, namely, whether there are norms of intergroup
discrimination, and whether there are is intergroup violence. By intergroup discrimination, we
refer to evidence that norms exist which prevent optimal allocation of labour market and other
opportunities based on group membership such as ethnic, racial or religious identification.
Examples of such indicators include survey items where respondents express objection to
cooperation with members of such groups (for example, ethnic minorities), as well as ratings by
organisations such as Minorities at Risk which estimate the level of economic discrimination

8
faced by defined minority groups. Second, by inter-group violence we mean the extent of
routinized conflict between ethnic, religious, or other social identity groups, including reprisals,
terrorism, and riots. In total, 30 items are selected from 8 different sources. A full list of
indicators used is provided in Appendix I.
III. Methodology
The method used to combine the indicators is an unobserved components approach, as adopted
in the generation of the Worldwide Governance Indicators and Transparency International’s
Corruptions Perceptions Index (Kaufmann, Kraay, and Zoido-Lobatόn 1999a, 2006; Lambsdorff
2006). The intuition behind this procedure is that each of a set of indicators represents some
latent value of the underlying phenomenon in each society, but on differing scales, with
differing country samples, and with varying degrees of measurement error. Assuming that errors
are uncorrelated across sources, indicators can be combined to reduce the aggregate level of
error level, with the rankings of countries each indicator used to reassign scores across cases.
Further documentation on the method, as well as diagnostics and sensitivity analysis showing
comparison with other aggregation techniques, can be found in Foa and Tanner (2011) and
therefore we provide only an abridged description here.
The method assumes that for each of the 5 dimensions of social development there is some
latent value (Li) representing the objective level of that dimension in country i. Each of the
available indicators yi represents, on a different functional transformation (f) and with varying
degrees of measurement error εi, level Li such that:
(yi) = f (Li ) + εi
Because we are unable to estimate the functional form f, the aggregation methodology is
nonparametric, with no assumptions regarding the linearity or otherwise of the distribution of

9
the values in y. We merely assume that the relative position of countries on y reflects a better or
worse underlying condition with respect to L. The ranks of successive indicators used in the
index are then utilized in order to assign values to countries, based on the values assigned to the
same sample of countries already in the measure. Thus if a new indicator is added to the index
that has a sample of five countries, Botswana (6.8), Nigeria (5.5), Sudan (2.4), Burundi (3.1) and
Tanzania (7.2), and the equivalent scores for these countries in the index thus far are 0.55, 0.40,
0.10, 0.11, and 0.35, then Tanzania will be assigned the maximum equivalent value of 0.55,
Botswana the second value of 0.40, Nigeria, 0.35, Benin 0.32, Burundi 0.11 and Sudan 0.10. In
addition, for the purpose of this index we weight results by the level of ethnic, religious and
linguistic fractionalisation (reported in Alesina et al. 2003), so as to reward countries that have
achieved a high level of social cohesion in the face of high social heterogeneity.
The matching percentiles method used in this exercise is iterative, such that the indicators to be
compiled are first sorted in order of their reliability, relevance, and representativeness, S1, S2 …
Sn for each of n different sources. As successive indicators are added, the standard deviation of
the estimate is held constant among affected countries, to prevent their scores from tending
toward the mean. The matching percentiles method has several advantages for creating a set of
indices of this nature, in that firstly it overcomes the problem of sampling bias, whereby a new
source only covers a limited and unrepresentative sample of countries, and second it allows us
to keep adding successive waves of indicators, even with very small samples, that can be used to
continually ‘refine’ the country scores simply by using information on relative rankings. Scores
are estimated in four waves from 1990 to 2005, using the most timely data for all countries, this
yields one or more social institutional scores for a total of 164 countries, from which we filter
only the 155 cases where more than 3 independent sources could be used to estimate a country
score. The average number of indicator per country estimated ranged from 7.7 to 17.3 items,
depending on the institutional cluster, and scores are rescaled from 0-1, whereby higher scores
represent greater advancement on that dimension of social development.
IV. Results

10
Results of the aggregation procedure are shown in Table 1.0. Also reported the number of
distinct sources used in the calculation of each country score, based on the sources detailed in
Appendix I.
Table 1.0 Index of Social Cohesion, Country Scores
rank country index items rank country index items rank Country index items
1 Canada 9.42 11 53 Niger 5.28 6 105 Macedonia, FYR 4.46 8 2 New Zealand 8.73 11 54 Estonia 5.24 8 106 Morocco 4.43 8 3 Sweden 8.51 10 55 Cuba 5.18 6 107 Philippines 4.43 8 4 United States 8.34 11 56 Jamaica 5.18 5 108 Russian Federation 4.42 12 5 Switzerland 7.93 7 57 Croatia 5.11 9 109 Azerbaijan 4.40 7 6 Australia 7.83 11 58 Guinea 5.10 6 110 Sierra Leone 4.33 6 7 Ireland 7.77 7 59 Kazakhstan 5.08 7 111 Zimbabwe 4.33 9 8 Hong Kong, China 7.75 6 60 Mali 5.07 10 112 Guatemala 4.33 10 9 Finland 7.50 10 61 Albania 5.07 7 113 Uganda 4.31 12
10 Netherlands 7.15 10 62 Togo 5.06 7 114 Israel 4.29 8 11 Denmark 7.08 7 63 Nicaragua 5.06 10 115 Liberia 4.28 6 12 United Kingdom 7.06 12 64 Slovak Republic 5.06 8 116 Jordan 4.17 8 13 Germany 7.00 12 65 Cyprus 5.04 11 117 Ecuador 4.16 11 14 Luxembourg 6.91 6 66 Zambia 4.97 11 118 Bangladesh 4.16 8 15 Norway 6.86 6 67 Kenya 4.92 9 119 Algeria 4.15 8 16 Iceland 6.85 6 68 Panama 4.91 10 120 Turkey 4.13 9 17 Spain 6.82 10 69 Madagascar 4.90 6 121 Georgia 4.06 6 18 Singapore 6.77 8 70 Latvia 4.90 8 122 Djibouti 4.05 5 19 Belgium 6.71 7 71 Dominican Republic 4.90 10 123 Comoros 4.02 4 20 Taiwan, China 6.69 6 72 Paraguay 4.89 10 124 Suriname 4.00 4 21 Japan 6.60 11 73 Nepal 4.88 5 125 Lesotho 4.00 5 22 Italy 6.55 12 74 Cape Verde 4.86 5 126 Syrian Arab Republic 4.00 7 23 Austria 6.35 7 75 Mongolia 4.84 6 127 Moldova 3.99 7 24 Uruguay 6.29 10 76 Egypt, Arab Rep. 4.84 9 128 Uzbekistan 3.98 8 25 Korea, Rep. 6.07 12 77 Cameroon 4.82 7 129 Tajikistan 3.93 5 26 France 6.01 11 78 Bahrain 4.77 7 130 Lebanon 3.91 8 27 Argentina 6.01 13 79 Malaysia 4.76 9 131 Cambodia 3.89 6 28 Chile 5.87 13 80 Honduras 4.74 11 132 Burundi 3.89 5 29 Senegal 5.85 9 81 Gabon 4.73 5 133 Mauritania 3.88 5 30 Czech Republic 5.81 9 82 Tunisia 4.71 6 134 Eritrea 3.84 4 31 South Africa 5.74 11 83 Papua New Guinea 4.70 6 135 India 3.83 9 32 Botswana 5.73 10 84 Indonesia 4.70 9 136 Thailand 3.81 9 33 Portugal 5.67 8 85 Tanzania 4.69 8 137 Angola 3.77 7 34 Slovenia 5.67 11 86 Serbia and Montenegro 4.68 8 138 Ethiopia 3.73 9 35 Vietnam 5.64 10 87 Mexico 4.67 12 139 Malawi 3.72 8 36 Ghana 5.61 13 88 Rwanda 4.66 7 140 Turkmenistan 3.64 4 37 Poland 5.56 10 89 Guyana 4.64 6 141 Congo, Rep. 3.58 6 38 Costa Rica 5.55 9 90 Brazil 4.63 10 142 Yemen, Rep. 3.58 6 39 Mozambique 5.54 8 91 Libya 4.63 6 143 Haiti 3.56 5 40 Romania 5.53 12 92 Gambia, The 4.62 4 144 Bhutan 3.56 5 41 Burkina Faso 5.53 7 93 Iran, Islamic Rep. 4.61 8 145 Chad 3.46 5 42 China 5.52 10 94 Kuwait 4.59 6 146 Solomon Islands 3.36 3 43 United Arab Emirates 5.49 6 95 Fiji 4.58 4 147 Guinea-Bissau 3.34 4 44 Bulgaria 5.45 9 96 Colombia 4.58 12 148 Iraq 3.22 7 45 Malta 5.44 6 97 Namibia 4.58 9 149 Sri Lanka 3.20 9 46 Lithuania 5.43 7 98 Saudi Arabia 4.56 9 150 Myanmar 3.20 9 47 Greece 5.39 9 99 Armenia 4.55 5 151 Pakistan 3.13 8 48 Hungary 5.36 8 100 Central African Republic 4.54 4 152 Cote d'Ivoire 3.12 7 49 Qatar 5.34 6 101 Venezuela, RB 4.54 10 153 Nigeria 2.95 10 50 Ukraine 5.33 9 102 Trinidad and Tobago 4.53 6 154 Sudan 2.66 7 51 Belarus 5.31 7 103 Bolivia 4.49 11 155 Somalia 2.44 5 52 El Salvador 5.30 9 104 Peru 4.48 10
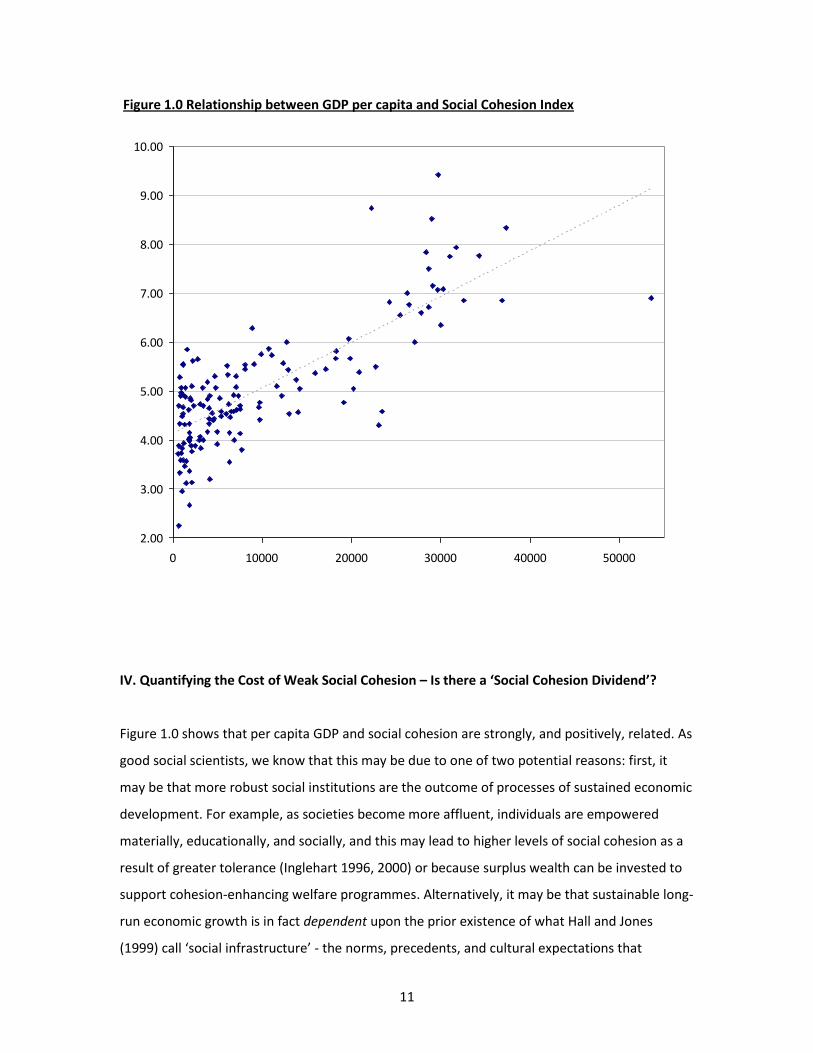
In addition to reporting raw scores, we can also report basic summary statistics, including
scatterplots against relevant variables. Figure 1.0 reports the relationship between GDP per
capita and the social cohesion index, with the inclusion of a bivariate line of fit.
11
Figure 1.0 Relationship between GDP per capita and Social Cohesion Index
2.00
3.00
4.00
5.00
6.00
7.00
8.00
9.00
10.00
0 10000 20000 30000 40000 50000
IV. Quantifying the Cost of Weak Social Cohesion – Is there a ‘Social Cohesion Dividend’?
Figure 1.0 shows that per capita GDP and social cohesion are strongly, and positively, related. As
good social scientists, we know that this may be due to one of two potential reasons: first, it
may be that more robust social institutions are the outcome of processes of sustained economic
development. For example, as societies become more affluent, individuals are empowered
materially, educationally, and socially, and this may lead to higher levels of social cohesion as a
result of greater tolerance (Inglehart 1996, 2000) or because surplus wealth can be invested to
support cohesion-enhancing welfare programmes. Alternatively, it may be that sustainable long-
run economic growth is in fact dependent upon the prior existence of what Hall and Jones
(1999) call ‘social infrastructure’ - the norms, precedents, and cultural expectations that
12
accumulate over the course of a country’s history and help sustain capital accumulation.
Institutions distort or protect the pattern of economic incentives, depending upon whether they
protect property rights, encourage work, and reduce transaction costs. Such a view is the
cornerstone of the new institutional economics (NIE), according to which formal institutions
(courts that protect property rights and enforce the rule of law) and informal institutions (social
trust, cohesion, and voluntary activity) constitute long-run determinants of sustained capital
accumulation, that is, economic growth (North 1991, Hall and Jones 1999). This relationship
between social institutions and growth has been empirically tested in a range of studies within
the econometric literature upon social capital (Helliwell and Putnam 1995, Zak and Knack 2001,
Beugelsdijk et al. 2004).
We are able to replicate such tests using the new social cohesion aggregate. Two forms of
econometric analysis are found within the study of economic growth: i) proximate and ii) deep-
determinants determinants models. Proximate determinants are variables that appear in the
aggregate production function, such as physical and human capital per worker, and can be
investigated through time-series models using the rate of economic growth as the dependent
variable, and such factors as average years of worker education as independent variables. Deep
determinants, by contrast, are the variables that explain differences in the proximate
determinants; they are the underlying, or deep determinants of development, for example
geography, trade, or institutional quality (Rodrik 2002). Because present income per capita is
simply the cumulative result of long-run average growth, this can be used as the dependent
variable in such regression equations.
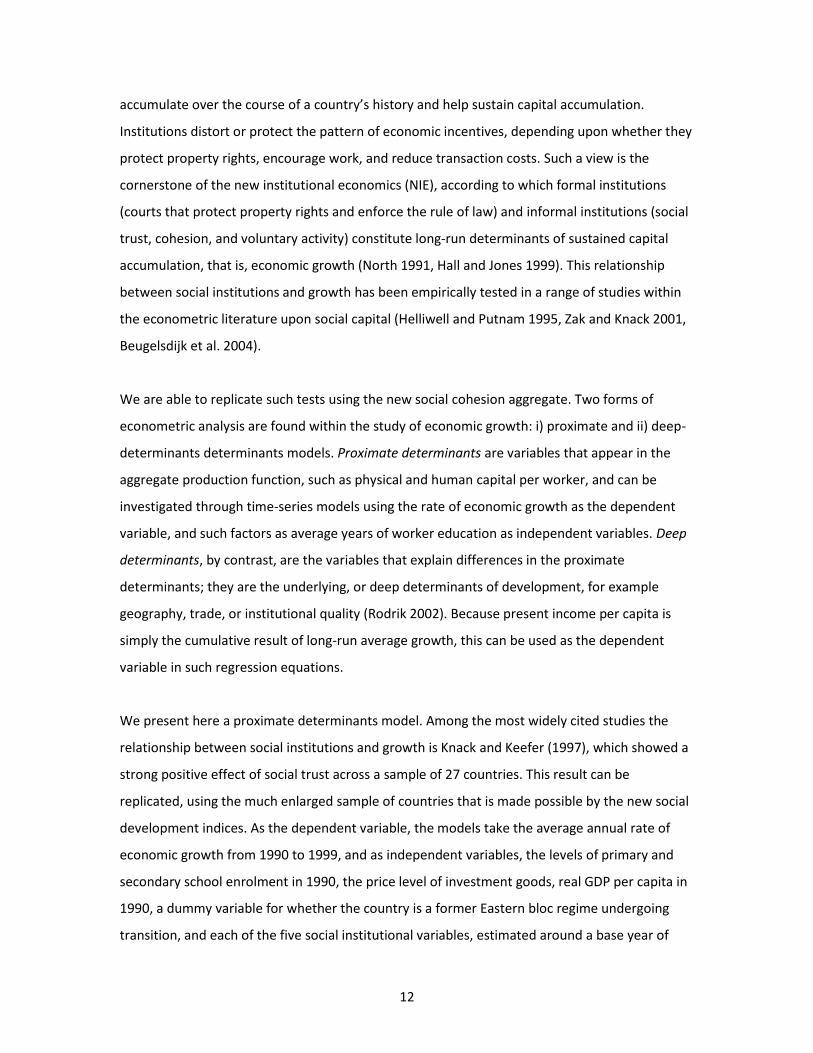
We present here a proximate determinants model. Among the most widely cited studies the
relationship between social institutions and growth is Knack and Keefer (1997), which showed a
strong positive effect of social trust across a sample of 27 countries. This result can be
replicated, using the much enlarged sample of countries that is made possible by the new social
development indices. As the dependent variable, the models take the average annual rate of
economic growth from 1990 to 1999, and as independent variables, the levels of primary and
secondary school enrolment in 1990, the price level of investment goods, real GDP per capita in
1990, a dummy variable for whether the country is a former Eastern bloc regime undergoing
transition, and each of the five social institutional variables, estimated around a base year of

13
1990. By including such controls, we fulfill the requirement, suggested by Levine and Renelt
(1992), that commonly identified determinants always be included in growth regressions to
ensure robust coefficients. The model specification is the same as that of Knack and Keefer
(1997), except that the dependent variable covers the decade of the 1990s rather than that of
the 1980s, and that a dummy variable has been included to take account of the transition
process in former Eastern bloc economies during this period.
Table 2.0 Regression Models, Economic Growth 1990-9
Model 1 Model 2
Price level of investment goods, 1990 0.005 (0.009)
-0.006 (0.005)
Real GDP per capita, 1990 -0.081 (0.066)
-0.037 (0.050)
Primary School Enrollment, 1990 0.042 (0.025)
0.025 (0.029)
Secondary School Enrollment, 1990 -0.032 (0.019)
0.003 (0.020)
Former Eastern Bloc Country, 0-1 -2.043 (1.016)*
-2.951 (0.922)***
Social Cohesion Index 7.104
(2.896)** 4.812
(2.305)*
Sub-Saharan Africa
-0.376 (1.235)
Latin America and Caribbean
-0.426 (0.783)
Constant -7.881 (3.861)
-1.645 (2.968)
N 45 64
adj. r2 0.42 0.23
Dependent Variable: Per Capita Economic Growth Rate, 1990-9 * significant at the 0.05 level; ** significant at the 0.01 level; *** significant at the 0.001 level
Results are shown in Table 2.0. Reassuringly, the models produce similar findings using the
1990s growth data as was found by Knack and Keefer (1997) using data from the 1980s, in
particular regarding the significant coefficient for the social cohesion variable. The finding that
social cohesion functions similarly to the social trust variable included in the Knack and Keefer
models can be subject to the same interpretation, namely, that security of property rights and

14
reduced transaction costs are essential and independent determinants of economic growth.
Using the new indicator series however allows us to estimate this effect for a much larger
sample of countries than was previously possible: whereas 29 countries are included in the
Knack and Keefer (1997) specification, model n here ranges from 45 to 65 cases. Given the
sensitivity of regression models to minor outliers where the sample size is low, the ability to
replicate similar findings across a more representative sample is reassuring evidence of the
validity of the initial claims.
It is also possible to see the relationship between absolute increase in GDP since 1990, and the
level of social cohesion at the outset of the time period. This bivariate relationship is reported in
Figure 2.0.
Figure 2.0 Increase in GDP from 1990-2010 and Level of Social Cohesion at the Outset
0
5000
10000
15000
20000
inc_gdp
2 4 6 8 10Standardized values of (eeerfrac * std_cohe)
These findings also help shed light on other aspects of the growth literature. For example, it is
commonplace in some growth regressions, such as those of Alesina et al. (2003) or Easterly and
Levine (1997), to include dummy variables for Latin America and Sub-Saharan Africa, on account
of their regionally weak growth performance. The need for such variables stems from the
endemically slow growth of the respective regions during the periods under consideration, yet a
convincing reason needs to be supplied for why these countries should experience a long-run
15
equilibrium growth rate that is inferior to others. The inclusion of variables which proxy for
security of property rights, such as the level of violence or trust, provides something in the way
of an answer. Both regions perform poorly on this indicator, and when dummy variables are
included for each of these respective regions (Models 3 and 4), neither are robust to the
presence of a social cohesion variable. Sub-Saharan African countries in the sample score on
average about two-thirds of a standard deviation below the global mean on interpersonal safety
and trust, while Latin American and Caribbean countries score a full standard deviation below
this mean. These results support the view that growth may be endogenous to the institutional
structure of a society, including the social institutions that ensure protection of property rights.
Because Sub-Saharan Africa as well as the Latin America and Caribbean region fare poorly in this
regard, it may constitute one factor that has restrained long-run equilibrium growth.
From Weak Social Cohesion to Violent Conflict
One of the most intuitive findings in the research on the economic costs and benefits of social
cohesion is that, where ethnic, sectarian and other tensions lead to the outbreak of civic
hostilities, this has a large and deleterious effect upon the absolute income and prospects for
income growth in a country. Estimates by Collier (1999), for example, suggest that the annual
growth rate during war reduced by 2.2% and a 15-year civil war reducing per capita GDP by
around 30%. One avenue to quantify the costs of ethnic and religious tensions is therefore to
first estimate the independent effect of social cohesion upon the likelihood of conflict outbreak,
and then separately calculate this cost upon growth.
Such an effort is timely, as a recent wave of theories predicting the outbreak of conflict have laid
emphasis upon short-term economic factors as the central determinant of inter-group warfare,
while de-emphasizing endemic group tensions and hatreds (Fearon and Laitin 2003, Collier and
Hoeffler 2004). However, researchers have failed to find a reliable and non-endogenous
measure of inter-group tensions, such that researchers have instead resorted to proxies such as
the ‘legacy of a previous conflict’ (Harff 2003). By using our measure of social cohesion, it is
possible to demonstrate that both economic shocks and group hatred matter, with the effect of

16
economic crisis upon political stability being more severe in countries where the existing state of
intergroup relations is frayed.
The intergroup cohesion index measures the extent or absence of routinised tensions and
conflicts between ethnic, religious, or other social identity groups. However, rather than focus
on macro-level conflict such as civil warfare, the social cohesion measure instead looks at
ongoing, everyday ‘social’ violence such as terrorism or riots, which typically occur in the
absence of open warfare, in addition to surveys of religious and ethnic tensions, and expert
assessments which examine the state of intergroup tensions. Essential to the definition of
cohesion deployed by the indices of social development are that the indicators track acts of
conflict that are i) conducted by non-state actors and ii) perpetrated by and directed against
individuals of specific identity groups, without, however, there necessarily being organised
armies opposing one another.
In econometric analysis, this measure of intergroup tensions provides a better predictor of the
duration and intensity of conflict than either economic variables such as income per capita, or
social-structural variables such as ethnic, linguistic, or religious fractionalization. The predictive
power of our cohesion variable is robust to the inclusion of a lagged variable for past conflict
duration and intensity. As the cohesion variable is based, in part, upon expert risk assessments
of the state of intergroup relations across various societies, it is perhaps unsurprising to find that
such assessments do, after all, reflect the likelihood of a future conflict breaking out, yet it is
nevertheless reassuring.
Table 3 shows the results of two multivariate models, in which the dependent variables are the
duration and intensity, respectively, of post-1990 conflicts. As our measure of the duration of
post-1990 conflict we take the number of years, from 1991-2008 inclusive, in which a civil
conflict was occurring in that country. For our measure of the intensity of conflict, we take the
log number of deaths in civil conflict occurring during the 1991-2008 period. Data on both
conflict deaths and duration are taken from the International Peace Research Institute (PRIO)
Armed Conflict Dataset (PRIO 2009). These estimates provide a high and low estimate for the
number of conflict deaths by year, and we use the sum of the mean of the high and low
estimate across all years from 1991 to 2008.
17
We take as our first independent variable the social cohesion index estimated for 1990, the first
year for which we have available data. Our intention is to see whether the social cohesion index
functions as a useful predictor of conflict outbreak. The social cohesion variable is based on
coded risk assessments of ethnic and religious tensions, newspaper coded social tension events
(e.g. riots or terrorism) and survey data on mistrust and resentment between ethnic and
religious groups. To minimize potential endogeneity, no data from future periods (1995, 2000,
2005) were used in the aggregation of this composite score.
As control variables in these regressions, we include variables which are more commonly used
to predict conflict outbreak. Extensive research has established a relationship between low
income and conflict outbreak, and therefore a variable is included for GDP per capita (Fearon
and Laitin 2003, Collier and Hoeffler 2004). This variable is taken from the World Development
Indicators, and lagged to 1990 to prevent endogeneity with conflict. Researchers have in recent
years also worked extensively on measures of ethnic, linguistic, and religious fractionalization,
and shown association between these indicators and measures of corruption, absence of the
rule of law, and state failure (Alesina et al. 2003, Fearon and Laitin 2003). The estimates
published by Alesina et al. (2003) for each of these three forms of fractionalization are
separately included in this regression, and reported below2. Finally, obviously a key predictor of
group violence in future is whether there is an existing, ongoing conflict, or has been an
unresolved conflict, in the recent past (Gurr and Harff 2003). In theory, it is difficult to separate
this from the measure of intergroup tensions - given that this is the means by which a previous
unresolved conflict gives rise to future violence - nonetheless, to guard against the accusation
that the coefficients report merely a spurious correlation, we include a ‘lagged dependent
variable’ in the form of the years of civil conflict and log civil conflict deaths, respectively, during
the prior decade (1980-1990 inclusive). These variables are also taken from the PRIO dataset
(PRIO 2009).
2 A combined variable (not reported) of ethnic, religious, and linguistic fractionalization, was
found not to be significant when included in place of the three separately.

18
Table 3. Cohesion and Conflict
Dependent Variables: Years of Civil Conflict (1991-2008), Civil Conflict Deaths (1991-2008)
Years in Conflict, 1991-2008
Log Civil Conflict Deaths, 1991-
2008
Social Cohesion, 1990 -4.42
(1.450)*** -3.727
(1.851)* Log Deaths in Conflict, 1980-1990
- 0.58
(0.156)***
Years of Conflict, 1980-1990
-80.242 (173.59)
-
Ethnic Fractionalization 2.498
(2.032) 0.708 (2.77)
Linguistic fractionalization
4.372 (1.68)*
5.411 (2.269)*
Religious fractionalization -4.325
(1.565)** -5.432
(2.064)*
GDP per capita -0.031 (0.054)
0.006 (0.072)
Constant
67.215 (16.623)***
56.681 (26.971)*
n 91 93
Model r2 0.49 0.53
* significant at the 0.05 level; ** significant at the 0.01 level; *** significant at the 0.001 level
The coefficients shown in Table 3 suggest that, whether it is predicting future conflict duration
or future conflict deaths, the measure of social cohesion proves a better predictor than either
income per capita or social fractionalisation. The relative weakness in predicting the rate of
conflict deaths is largely due to the fact a number of extraneous factors determine the rate of
deaths in conflict, such as terrain, population density, and urbanization; for this reason, the
most significant predictor of future conflict deaths turns out to be rate of deaths during the
previous period (Fearon and Laitin 1999). That social cohesion proves a more powerful predictor
of conflict duration than the duration of conflicts in the recent past suggests, a priori, that
group-based attributes such as the depth of intergroup resentments, may determine the ease or
difficulty with which political elites are able to negotiate an end to armed conflict. It may also be

19
because in situations where group-based resentments are particularly intense, this reduces the
cost of new recruits, as well as increasing the political payoff to ethnic or religious leaders that
take a ‘hard line’ refusal to compromise, and because where resentments are intense, politically
negotiated ceasefires may be violated by radicals on either side of a conflict who conduct
spontaneous attacks in defiance of more moderate leaders.
Figure 3.0: The Relationship between Social Cohesion (1990) and Future Conflict Deaths (1991-
2008), r = 0.57
Albania
AlgeriaAngola
ArgentinaAustraliaAustriaBahrain
Bangladesh
BelgiumBolivia BotswanaBrazilBulgaria
Cameroon
CanadaChile China
Colombia
Congo, Dem. Rep.
Congo, Rep.
Cote d'Ivoire
Czech Republic DenmarkDominican Republic
Ecuador
Egypt, Arab Rep.
Estonia
Ethiopia
FinlandFranceGermanyGhanaGreece
GuatemalaGuinea
GuyanaHonduras Hungary Iceland
India
Indonesia
Iran, Islamic Rep.
Iraq
Ireland
Israel
ItalyJapanJordanKenyaKorea, Rep. LatviaLebanon
Liberia
LithuaniaMadagascarMalaysia
Mali
Malta
Mexico
Morocco
Myanmar
Namibia New ZealandNicaragua
NigerNigeria
Norway
Pakistan
Panama
Papua New Guinea
Paraguay
PeruPhilippines
PolandPortugalRomania
Russian Federation
Saudi Arabia
Senegal
Sierra Leone
SingaporeSlovak Republic
Somalia
South Africa
Spain
Sri LankaSudan
SwedenSwitzerlandSyrian Arab RepublicTaiwan, China
Thailand
Togo
TurkeyUganda
United Kingdom
United States
Venezuela, RB
VietnamZambia05
10
15
.4 .42 .44 .46cohesion_1990
ln_totdeath Fitted values
Figure 4.0: The Relationship between Social Cohesion (1990) and Future Conflict Duration
(1991-2008), r = 0.62

20
Albania
AlgeriaAngola
ArgentinaAustraliaAustriaBahrain
Bangladesh
BelgiumBolivia BotswanaBrazilBulgaria
Cameroon
CanadaChile China
Colombia
Congo, Dem. Rep.
Congo, Rep.
Cote d'Ivoire
Czech Republic DenmarkDominican Republic
Ecuador
Egypt, Arab Rep.
Estonia
Ethiopia
FinlandFranceGermanyGhanaGreece
Guatemala
Guinea
GuyanaHonduras Hungary Iceland
India
Indonesia
Iran, Islamic Rep.
Iraq
Ireland
Israel
ItalyJapanJordanKenyaKorea, Rep. LatviaLebanon
Liberia
LithuaniaMadagascarMalaysia
Mali
Malta
Mexico
Morocco
Myanmar
Namibia New ZealandNicaragua
Niger
Nigeria
Norway
Pakistan
Panama
Papua New Guinea
Paraguay
Peru
Philippines
PolandPortugalRomania
Russian Federation
Saudi Arabia
Senegal
Sierra Leone
SingaporeSlovak Republic
Somalia
South Africa
Spain
Sri Lanka
Sudan
SwedenSwitzerlandSyrian Arab RepublicTaiwan, China
Thailand
Togo
Turkey Uganda
United Kingdom
United States
Venezuela, RB
VietnamZambia05
10
15
20
.4 .42 .44 .46cohesion_1990
years_cn Fitted values

21
What of the concomitant effect upon economic development? The estimates in Table 3 suggest
that a one-point increase in social cohesion reduces the number of war years by 6.62 over an
18-year period. If we follow Collier’s estimate of an average 2.2 per cent reduction in the rate of
economic growth during war, this implies a roughly 14 per cent (depending on the timing of
conflict and the compound effect during the period) reduction in potential GDP for each point
reduction in the index, or 28 per cent for a 2-point gap – equivalent to the distance between
Botswana and Angola, between Sweden and Italy, or between the United Arab Emirates and
Yemen. Compounded over a longer period of time, such as thirty or forty years, the disparity is
sufficient to cause a fifty to one-hundred per cent difference, potentially making the difference
whether a country achieves economic development or remains a medium or low income
economy.
III. Identifying Case Studies of Fostering Social Cohesion
In the social sciences, important lessons can often be learnt via case selection. For example, we
may wish to ask: which countries perform better or worse than we might expect, and what
policies have contributed to these outcomes? Likewise, when we examine changes in social
cohesion over time, where and why have countries succeeded in reducing tensions and building
stronger intergroup ties?
As argued by Rogowski and Collier (1991), in order to avoid bias, case selection is best pursued
via statistical identification, rather than ad hoc decision. Several basic tests can fulfill this
purpose. For example, at the most basic level, we are able to use the standard deviations of the
variables to identify cases that are clearly outside of the range of a normal distribution. Of
course, this approach, while satisfactory for an initial summary of the data, fails to highlight
whether the presence of such outliers has undue effect in the estimation of regression
coefficients. Second, therefore, social scientists typically supplement such an analysis with tests
of both leverage and influence. This enables us to better determine which values for each of the
indicators are outliers, due to either misreported data or measurement error, and therefore
constitute candidates for deletion.

22
A more rigorous approach to identify outliers is to use calculations of statistical leverage and
influence. Points which have high leverage are those with unusual x-values; more specifically
leverage for a point i is the distance of the ith observation from the center of the x-space, and
obtained using the principal diagonal of the “hat” matrix as hii = xi’(X’X)-1xi . The average of
distance from the center of the x-space is given as nph / where p is the number of
parameters in the regression including the intercept (here p is 2 for our bivariate regressions)
and n is the number of observations in the regression. A point with distance from the x center
greater than a cutoff hii > 2p/n is considered a leverage point. High leverage points mark a
potential for influencing regression coefficients but may not affect the coefficient at all (e.g. if it
lies directly on the regression line, even though isolated in x-space from the rest of the
data).Though points with high leverage alone do not affect the estimates of regression
coefficients, these may affect the values of model summary statistics such as goodness-of-fit
and standard errors of coefficients. For example, in figure 5.0 below showing the bivariate
relationship between GDP per capita and social cohesion, both Israel and New Zealand have
high leverage due to their outlier position, though neither case has much influence on the slope
due to their proximity to the mean of the dependent variable (here assumed to be income per
capita).
High influence, meanwhile, exists where a case has disproportionate effect upon measures of
statistical association such as correlation or the linear regression coefficient on one variable
upon another. It is typically measured by indicators such as Cook’s Distance, which takes into
account both leverage (distance from the estimated value of x) and the distance from the mean
of y. Leverage points are also easily identified by examination of the bivariate scatterplot of two
variables, or, in a multivariate context, the component-plus-residual plot following estimation of
regression coefficients. A simple bivariate scatterplot of income per capita and social cohesion is
shown in Figure 5.0.

23
Figure 5.0 – Identifying Outliers and Leverage Points
2.00
3.00
4.00
5.00
6.00
7.00
8.00
9.00
10.00
0 10000 20000 30000 40000 50000
Canada
New Zealand
ArgentinaSenegal
Uruguay
Israel
Congo, D.R.
Trinidad
Sweden
Figure 5.0 shows the bivariate relationship between GDP per capita and social cohesion (note with
cohesion on the x-axis, though we might consider it as the independent variable). Leverage points are
labeled: Canada, New Zealand, Sweden, Trinidad, Israel and Congo.
An alternative to using estimates of leverage and influence is to seek to identify changes over
time, and relate these to changing policy conditions in a country. In order to do this, we have
estimated the social cohesion scores into the past, and identified the countries with the largest
improvements in their cohesion score over the two decades from 1990 to the present date,
relative to their changes in GDP per capita.

24
Albania
Algeria Angola
ArgentinaAustralia
Austria
Azerbaijan
BahrainBangladesh
BelarusBelgiumBoliv ia
Botswana
BrazilBulgariaBurkina Faso
Burundi
Cameroon
Canada
Chad
Chile
Colombia
Congo, Dem. Rep.
Congo, Rep.
Costa Rica
Cote d'Iv oire
Croatia
Cy prusCzech Republic
Denmark
Djibouti
Dominican Republic
Ecuador
Egy pt, Arab Rep.El Salv ador
Estonia
Ethiopia
Fiji FinlandFrance
GabonGambia, The
Georgia
Germany
GhanaGreece
GuatemalaGuinea
Guinea-Bissau
Guy ana
Haiti
Honduras
HungaryIceland
India
IndonesiaIran, Islamic Rep.
Israel
Italy JamaicaJapan
JordanKazakhstan
Keny a
Korea, Rep.
Kuwait
Ky rgy z Republic
Lao PDR
Latv ia
Lebanon
Lithuania
Luxembourg
Madagascar
Malawi
Malay sia
Mali
Malta
Mauritania
Mexico
Moldov a
Mongolia
Morocco
Mozambique
NamibiaNetherlandsNew Zealand
Nicaragua
Niger
Nigeria
Norway
OmanPakistan
Panama
Papua New Guinea
Paraguay
Peru
Philippines
Poland
Portugal
Romania
Russian Federation
RwandaSaudi Arabia
Senegal
Sierra Leone
Singapore
Slov ak Republic
Slov enia
South Af rica
Spain
Sri LankaSudan
SurinameSweden
Switzerland
Sy rian Arab Republic
Tajikistan
Tanzania
Thailand
Togo
Trinidad and Tobago
Tunisia
Turkey
Uganda
Ukraine
United Arab Emirates
United KingdomUnited States
Uruguay
UzbekistanVenezuela, RB
Yemen, Rep.
Zambia
Zimbabwe
0.5
11.5
2
dgdp
-.035 -.03 -.025 -.02 -.015 -.01dcohe
Countries such as Mozambique, New Zealand and Slovenia were able to see am increase in both
cohesion and economic growth, while countries such as South Africa or Rwanda saw an increase
in cohesion despite weak growth over the period as a whole. A number of countries, including
the Netherlands, France and Thailand saw a deterioration in their level of social cohesion over
the period since 1990, despite steady economic growth; others, such as Russia or Cote d’Ivoire,
saw a deterioration in both cohesion and per capita incomes.
New Zealand
New Zealand scores very highly on our measure of social cohesion, and in particular relative to
country income per capita (Figure 5.0). In addition, data from New Zealand show a steady
improvement in social cohesion over the past two decades (Figure 6.0). In large part, this has
been due to the steady incorporation of the Maori population, which constitutes 14.6 per cent
of total population, into mainstream New Zealand life.
For a long time levels of social exclusion among the Maori community have been especially
elevated, with particularly high susceptibility to poverty, incarceration, unemployment, suicide
and poor educational attainment (New Zealand Department of Heath 2006, New Zealand

25
Department of Corrections 2007, Ferguson et al. 2004). However, since the mid-1970s, however,
ethnic relations have improved as the Government of New Zealand has taken pro-active
measures to incorporate Maori communities into a broader set of economic and social
opportunities. Most importantly, conflicts over land rights have been settled via the
establishment of the Waitangi Tribunal, which since the Treaty of Waitangi Act of 1975 has
investigated and made recommendations upon claims brought by Maori communities against
the British Crown and, de facto, the Government of New Zealand. While the Tribunal does not
have binding authority, its recommendations have largely been implemented and led to the
return of Maori land that was previously taken into the public realm. Through its inclusive
structure, the Tribunal offers a direct form of political representation to the Maori, as
approximately half of its 20 appointed members are from the indigenous population. The
chairperson is either a judge or a retired judge of the High Court or the chief judge of the Maori
Land Court, and the deputy chairperson is a judge of the Maori Land Court.
By creating the Waitangi Tribunal, the Government of New Zealand has been effective in dealing
with many outstanding land disputes. More significant, however, is that this mechanism has
been more effective than if redress had been sought through the judicial process, as members
of the indigenous community would have been unlikely to effectively press their claims via this
channel. In addition, at the outset Maori were weakly represented in mainstream political
institutions, making redress of claims unfeasible by direct policy interventions that did not
attempt to mobilise Maori voices into the fold.
Bosnia-Herzegovina
In Bosnia-Herzegovina, the level of social cohesion at the outset (1990) was extremely low, and
high levels of intergroup tensions were both reflected in and exacerbated by a brutal civil
conflict which was resolved by the Dayton Agreement of 1995. Today, levels of social tensions in
Bosnia remain at an elevated level, and the country continues to score poorly on social
cohesion. However, steady improvement has been registered as a result of the policies taken to
bring groups from the country's 3 major ethnic and religious communities - Bosniac Muslims,

26
Serbs and Croats - to form a coalition government within the context of consociational
institutions (Lijphart 1996).
Under the terms of the Constitution of Bosnia Herzegovina, which is a classic consociational
design (cf. Bose 2002, Belloni 2004), political representatives are elected on a proportional
representation basis, thereby making majority rule by any political party unlikely, and forcing
power-sharing and brokering between the representatives of different groups. The requirement
for power sharing is reinforced by the fact that the Chair of the Presidency of the country
rotates among members of the three groups every 8 months. This has resulted such that since
1995 no party has had a consistent working majority in parliament, and coalition deals involving
members from diverse ethnic and sectarian groups is the norm. While intergroup tensions
remain present in Bosnian society, regular interaction within the political system is helping to
foster functional ties between elites, and provides a basis to voice and settle intergroup disputes
and conflicts.
Canada
While Canada, like New Zealand, has an important indigenous population, the high degree of
social integration in the country largely reflects success in incorporating successive recent waves
of immigration - including not only immigration for economic reasons but also migrants who
have entered for reasons of political asylum. Since the early 1990s, Canada has received a large
flow of newcomers, with the total of new arrivals in 2009 alone equivalent to around 0.75 per
cent of Canada's total population. On a comparative basis, a similar rate of immigration to China
would entail almost 10 million newcomers each year, or to the European Union, almost 4 million
newcomers on an annual and repeat basis.
While the rate of immigration to Canada is high, empirical evidence suggests no tension or
resentment among existing Canadian citizens. In public opinion surveys the proportion of
Canadians saying that they would object to having neighbours who are 'immigrants' or who are
from a different ethnic or religious group are among the lowest in the world, and have remained
consistently so (World Values Surveys 1981-2007).

27
Why has the Canadian migration system been so successful at integrating newcomers? Most
commentators agree that it largely reflects the pragmatic nature of the Canadian immigration
system, which clearly demarcates three categories of application: for economic reasons, for
political asylum, and for family reasons. Because a clear avenue is offered for economic
migration, this discourages use of other channels for this purpose, as well as discouraging illegal
immigration. The widely acclaimed ‘points-system’ enables authorities to encourage
immigration of those individuals most likely to succeed to rapid integration: for example by
rewarding English or French language competency, of the possession of skills that make the
attainment of paid employment more likely. Finally, Canada has averted the problem of having a
large ‘floating’ population of unclear migration status by ensuring that progress from an
economic ‘working status’ to full citizenship is almost automatic, because under Canadian
Nationality Law all Canadian residents can apply for citizenship after living in Canada for 1095
days in any 4 year period (Government of Canada 2006).
As a result of the comprehensive design and facility of the legal avenues within the Canadian
immigration system, levels of illegal migration to Canada are exceptionally low. While few
reliable estimates exist for clandestine migration, available figures suggest that the total number
stands at just 35,000-120,000, a very low figure for a country of 33 million, less than comparable
estimates for a single city in the United States such as New York. Because illegal migration to
Canada has been largely averted via the establishment of formal channels of integration, many
of the associated problems of marginalisation and exclusion have been averted. Newcomers are
fully integrated into the tax and welfare system, and, as working age arrivals, typically form net
contributors to the Canadian social safety net. Moreover, as full citizens newcomers are also
encouraged to identify as Canadian, and as a part of Canadian society. As a result the integration
of both first and second generation migrants into the mainstream of Canadian society is typically
fairly rapid.
Case Study Conclusions

28
Evidence from these case studies suggests three principle conclusions. First, it is essential to
ensure universal access to public services, including justice and fair policing. Where lack of social
trust is the problem, demanding ‘more social trust’ is not the answer. The answer is to build the
institutional framework in which individuals feel comfortable trusting and interacting with
members of other groups. As examples of this policy in practice, we consider the comparative
success of Kerala over states such as Gujurat in India (Wilkinson 2004, Varshney 2001), as well as
the successful policies implemented in countries such as New Zealand, to integrate the
previously marginalised Maori community.
Second, it is critical to ensure the representation of minority groups, to the point of establishing
new institutional avenues where necessary. For example, though New Zealand is a
parliamentary democracy governed by the rule of law, nonetheless Maori communities felt at a
disadvantage in mainstream political parties and the court system; thus the establishment of a
new mechanism, in the form of the Waitangi Tribunal, allowed for the effective voicing of
communal concerns that might have otherwise emerged in less peaceful forms. In Bosnia-
Herzegovina, the establishment of consociational institutions has forced representatives from
across the major ethnic groups to negotiate with one another and reach agreement on key
issues, even while intergroup tensions persist among the population at large. In addition, it has
ensured that structural minorities such as the Serbs and Croats have remained involved in the
political process, rather than be systematically marginalised as might have occurred under a
more majoritarian framework.
Finally, in the long run it is important for countries to build encompassing identities into which
marginalised groups are able to identity. A growing body of research is now grappling with the
awkward finding that ethnic diversity negatively affects social cohesion. Chaim Fershtman and
Uri Gneezy (2001) and Edward L. Glaeser et al. (2000) present experimental evidence on a
negative relationship between ethnic heterogeneity and trust, while Robert Putnam (2007) finds
a negative association between ethnic diversity and elements of social capital, such as social
trust or voluntary activity. The conclusion is not that ethnic heterogeneity is to be avoided, but
rather that ethnic categories themselves have to be redefined in more encompassing terms.
Examples of such collective 'redefinition' in the world today include cases such as South Africa,
where the white minority is adjusting to find itself part of a new 'African' identity, and Rwanda,

29
where the 'One Rwanda' policy has since 1995 insisted that all ethnic groups, whether Hutu,
Tutsi or Twa, identify foremost as Kinyarwanda and attempt to forget their ethnic
categorisation. Within the developed world, the clear avenues within the Canadian system for
obtaining full citizenship, and the associated rights and responsibilities that this entails, has
clearly averted the problems of group-based marginalisation and exclusion that has occurred
among communities where newcomers have arrived under temporary work permit schemes,
such as the first generation of Turkish immigrants in the Federal Republic of Germany, or have
arrived as illegal immigrants, as remains the case for a substantial proportion of Hispanics in the
United States.
Conclusion
This paper has presented a quantitative, cross-country index of social cohesion using a set of
social institutional measures covering over 200 indicators from 25 different data sources, and
estimated its economic benefits across a global sample of countries. Based on the Collier
conflict estimates, we predict that a two-point increase on the index, equivalent the gap
between Botswana and Angola, between Sweden and Italy, or between the United Arab
Emirates and Yemen, is sufficient to produce a 28 per centage point different in cumulative
economic growth over a period of just under two decades. In this paper we have also used the
index to identify case studies in building social cohesion, to which political and social leaders
might refer when considering how to tackle social tensions. Based on the cases identified, we
suggest that the policy priorities for leaders wishing to enhance social cohesion should be to
ensure representation of marginalised groups, ensure universal access to public goods such as
policing and secure property rights, and to build collective identities into which marginal groups
are able to identify.

30
References Acemoglu, D., Johnson, S., and Robinson, J. (2001). “The Colonial Origins of Comparative
Development: An Empirical Investigation”. American Economic Review, December 2001. Acemoglu, D. and Robinson. J. (2006). Economic Origins of Dictatorship and Democracy. New
York: Cambridge University Press. Almond, G. and Verba, S. (1963). The Civic Culture: Political Attitudes and Democracy in Five
Nations. Princeton: Princeton University Press. Arrow, K. (1974). The Limits of Organization. Norton, New York. Bandura and Martin del Campo. ( 2006). ‘Indices of National Performance: A Survey’. New York:
UNDP. Barro, R. (1991). “Economic Growth in a Cross-Section of Countries”. Quarterly Journal of
Economics. 6, 407-444. Bebbington, A., Guugenheim, S., and Woolcock, M. (2006). “Concepts: Their Context and Their
Consequences”, In Anthony J. Bebbington, Michael Woolcock, Scott Guggenheim, and Elizabeth A. Olson, eds., The Search for Empowerment: Social Capital as Idea and Practise in the World Bank. Connecticut: Kumarian Press.
Berkman, L. and Syme, L. (1979). “Social Networks, Host Resistance, and Mortality: a Nine-Year
Follow-Up Study of Alameda County Residents.” American Journal of Epidemiology. 109, no. 2: 186-204.
Beugelsdijk, S., de Groot, H., and van Schaik, A. (2004). "Trust and economic growth: a
robustness analysis", Oxford Economic Papers, 56, 118-134. Bockstette, V., Chanda, A. and Putterman, L.. (2002). “States and Markets: The Advantage of an
Early Start,” Journal of Economic Growth 7, 347-369. Carmines. E. G. and R. Z. Zeller. (1979). Reliability and Validity Assessment. Series: Quantitative
Applications in the Social Sciences 07-017. Chu, Yun-han, Larry Diamond, Andrew J. Nathan, and Doh Chull Shin. (2008). “Comparative
Perspectives on Democratic Legitimacy in East Asia,” in Yun-han Chu, Larry Diamond, Andrew J. Nathan, and Doh Chull Shin, eds., How East Asians View Democracy. New York: Columbia University Press, 1-38.
De, P. (2010). Governance, Institutions, and Regional Infrastructure in Asia. Asian Development
Bank Institute Working Paper Series. Dempster, A., Rubin, D. (1983). "Incomplete data in sample surveys", in Madow, W.G., Olkin, I.,
Rubin, D. (Eds),Sample Surveys Vol. II: Theory and Annotated Bibliography, Academic Press, New York, NY, pp.3-10.

31
Doing Business. (2005). Doing Business Indicators, World Bank: Washington DC. Donsbach and Traugott (2007). ‘Editorial’ in International Journal of Public Opinion Research,
19(1):3-4. Durkheim, E. [1897] 1951. Suicide. New York: Free Press. Esteve-Volart, B. 2004. “Gender discrimination and growth: Theory and evidence from India.”
DEDPS Working Paper No. 42. London: London School of Economics and Political Science.
Etzioni, A. (1997). The New Golden Rule: Community and Morality in a Democratic Society.
London: Profile Books. Fearon, J. and Laitin, D. (1996) “Explaining Interethnic Cooperation”, American Journal of Political Science. Ferguson, S. Blakely, T, Bridget, A. and Collings, S. (2004). “Suicide Rates in New Zealand”. Wellington School o Medicine and Health Sciences, University of Otago. Otago: New Zealand. Fershtman, and Gneezy, U. (2001) “Discrimination in a Segmented Society: An Experimental Approach”. Foa, R. (2010). “Measuring Social Institutions”, Institute for Social Studies, The Hague. Fukuda-Parr and Kumar (eds.) 2004. Readings in Human Development. Oxford: Oxford
University Press. Fukuyama, F. (1995). Trust: Social Virtues and the Creation of Prosperity. NY: Free Press. Guggenheim, S. (2006). “Crises and Contradictions: Understanding the Origins of a Community
Development Project in Indonesia”. In Bebbington, Woolcock, Guggenheim and Olson (eds.), The Search for Empowerment. CT: Kumarian Press.
Hall, R. and Jones, C. (1999). “Why do Some Countries Produce so Much More Output Per
Worker Than Others?” Quarterly Journal of Economics 114, 83-116. Huntington, S. (1968). Political Order in Changing Societies. New Haven: Yale University Press. Kaufmann, D., Kraay, A., and Zoido-Lobatόn, P. (1999a). “Governance Matters.” World Bank
Policy research Working Paper No. 2195, Washington, D.C. Kaufmann, D., Kraay, A., and Zoido-Lobatόn, P. (1999b). “Aggregating Government Indicators.”
World Bank Policy research Working Paper No. 2195, Washington, D.C.

32
Kaufmann, D., Kraay, A., and Mastruzzi, M. (2007). “Governance Matters VI: Aggregate and Individual Governance Indicators 1996-2006”, World Bank Policy Research Working Paper No. 4280, Washington, D.C.
King, G. Honaker, J. Joseph, A. and K. Scheve. (2001). "Analyzing Incomplete Political Science
Data: An Alternative Algorithm for Multiple Imputation," American Political Science Review, Vol. 95, No. 1.
King, A. and E. Hill. (1993). "Women's Education in the Third World: An Overview," in E. M. King
and M. A. Hill (eds.) Women's Education in Developing Countries: Barriers, Benefits, and Policy. Baltimore, MD: Johns Hopkins University Press.
Knack, S. (2002). “Social Capital and the Quality of Government: Evidence from the States”,
American Journal of Political Science 46 (4): 772-785. Knack, S., and Keefer, P. (1997). “Does Social Capital have an Economic Payoff? A Cross-Country
Investigation”, The Quaterly Journal of Economics 112 (4):1251-1288. Inglehart, R. (1997). Modernization and Postmodernization. Princeton: Princeton University
Press. Inglehart, R. and Baker, W. (2000). “Modernization, Cultural Change, and the Persistence of
Traditional Values,” American Sociological Review 65, 19-51. Inglehart, R. and Welzel, C. (2005). Modernization, Cultural Change and Democracy. Cambridge
University Press. Lambsdorff, J. G. (2006). "The Methodology of the Corruptions Perceptions Index",
Transparency International and the University of Passau, permanent url: http://www.icgg.org/downloads/CPI_2006_Methodology.pdf
Levi, M. Karen S. Cook, Russell Hardin. (2007). Cooperation Without Trust? New York: Russell
Sage Foundation. Narayan, D. and Cassidy, M. (2001). "A Dimensional Approach to Measuring Social Capital:
Development and Validation of a Social Capital Inventory" in Current Sociology 49(2): 59-102.
Narayan, D. and Pritchett, L. (1999). “Cents and Sociability: Household Income and Social Capital
in Rural Tanzania”, Economic Development and Cultural Change 47(4): 871-97. Nardo, M., Saisana, M., Saltelli, A., Tarantola, S., Hoffman, A., Giovannini, E. (2005) Handbook on constructing composite indicators: methodology and users guide, OECD-JRC joint publication, OECD Statistics Working Paper, STD/DOC(2005)3, JT00188147. Norris, P. (ed). (1999). Critical Citizens: Global Support for Democratic Governance. Oxford:
Oxford University Press.

33
New Zealand Department of Corrections, 2007. “Over-representation of Māori in the criminal justice system”. Auckland: New Zealand. North, D. (1990). Institutions, Institutional Change and Economic Performance. Cambridge:
Cambridge University Press. North, D. (1991). "Institutions," Journal of Economic Perspectives, American Economic
Association, vol. 5(1), pages 97-112. Paldman, M. (2000): “Social Capital: One or Many? Definition and Measurement”, Journal of Economics Surveys, 14(5), pp. 29-653. Paxton, P. (2002). "Social Capital and Democracy: An Interdependent Relationship." American
Sociological Review, 67:254-277. Putnam, R., Leonardi, R. and Nanetti, R. (1993) Making Democracy Work: Civic Traditions in
Modern Italy. Princeton: Princeton University Press. Putnam, R. (2000). Bowling Alone: The Collapse and Revival of American Community. New York:
Simon and Schuster. Putnam, R. (2007). "E Pluribus Unum: Diversity and Community in the Twenty-first Century",
Scandinavian Political Studies, 30 (2), 137–174. Saltelli, A. 2007.’ Composite indicators between analysis and advocacy’ , Social Indicators
Research, 81 , 65-77.Social Watch. 2007. Social Watch Report. Montevideo: Social Watch.
Schultz, P. (2002). “Why governments should invest more to educate girls.” World Development,
30(2): 207-225. Seeman, T. et al. (1994). Social ties and support and neuroendocrine function. MacArthur
Studies of Successful Aging. Ann Behavioral Medicine, 16:95-106. Schuster T., Kessler R., and R. Aseltine. (1990). Supportive interactions, negative ineteractions
and depressed mood. Am J Community Psychology, 18:423-438. Stone, W. (2001). Measuring social capital: towards a theoretically informed measurement
framework for researching social capital in family and community life [Research Paper No. 24]. Australian Institute for Family Studies.
Tilly, C. (2003). The Politics of Collective Violence. Cambridge: Cambridge University Press. Thomas, D., Strauss, J. and Henriques, M. 1991. "How Does Mother's Education Affect Child
Height?" Journal of Human Resources, 26, no. 2:183-211. Tonnies, F. ([1887] 2001). Community and Civil Society. Cambridge: Cambridge University Press.

34
Veenhoven, R. 2005. World Database of Happiness: Continuous register of research on subjective enjoyment of life. Available at the website of Erasmus University Rotterdam in the Netherlands: http://worlddatabaseofhappiness.eur.nl
United Nations Development Program. 2007. Human Development Report. New York : United
Nations. Urra, F. J. (2007). Assessing Corruption - An analytical review of Corruption measurement and its
problems: Perception, Error and Utility. Available on the United Nations Public Administration Network, www.unpan.org.
Wilkinson, S. (2004). Votes and Violence: Electoral Competition and Communal Riots in India. Woolcock and Narayan. (2000). "Social Capital: Implications for Development Theory, Research,
and Policy", World Bank Research Observer, Vol. 15, 2, pp. 225-249. Woolcock, M, Grootaert, C., Narayan D. and Veronica Jones (2004) “Measuring Social Capital: An Integrated Questionnaire”, World Bank Working Paper No. 18, Washington DC. World Bank. 2001. Engendering development: Through Gender Equality in Rights, Resources, and
Voice. New York: Oxford University Press. Varshney, A. (2001). “Ethnic Conflict and Civil Society”, World Politics, April 2001, 362-98.
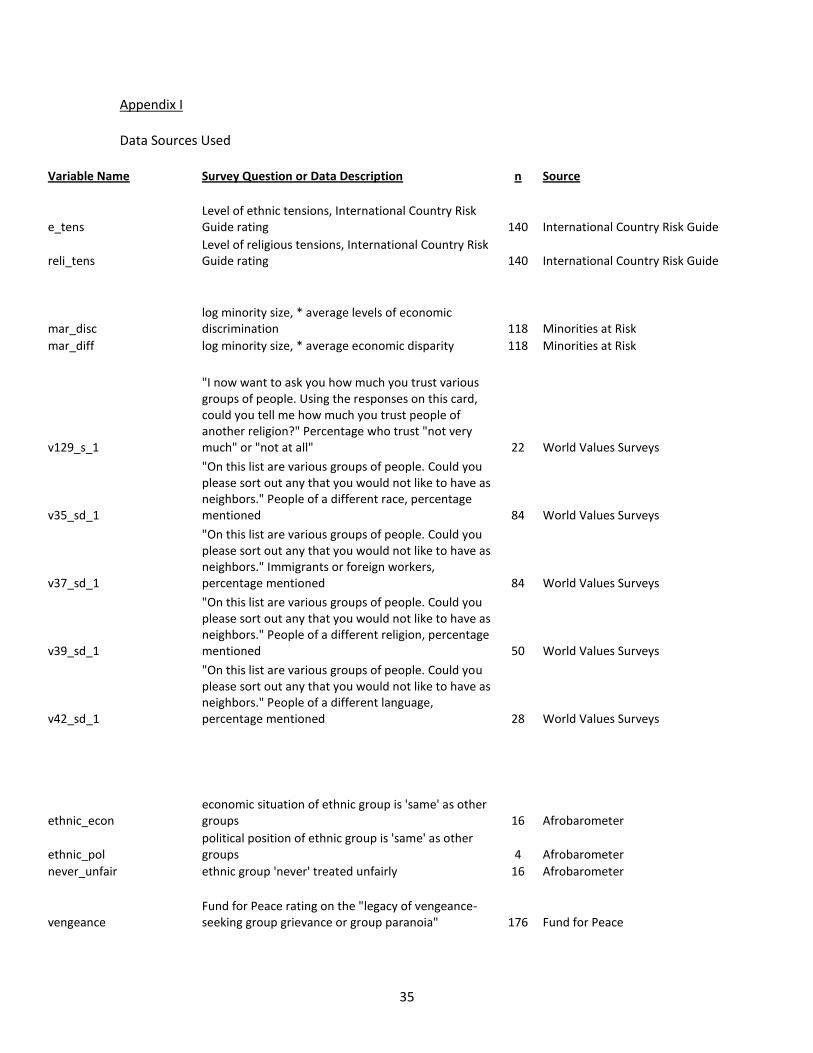
35
Appendix I Data Sources Used
Variable Name Survey Question or Data Description n Source
e_tens Level of ethnic tensions, International Country Risk Guide rating 140 International Country Risk Guide
reli_tens Level of religious tensions, International Country Risk Guide rating 140 International Country Risk Guide
mar_disc log minority size, * average levels of economic discrimination 118 Minorities at Risk
mar_diff log minority size, * average economic disparity 118 Minorities at Risk
v129_s_1
"I now want to ask you how much you trust various groups of people. Using the responses on this card, could you tell me how much you trust people of another religion?" Percentage who trust "not very much" or "not at all" 22 World Values Surveys
v35_sd_1
"On this list are various groups of people. Could you please sort out any that you would not like to have as neighbors." People of a different race, percentage mentioned 84 World Values Surveys
v37_sd_1
"On this list are various groups of people. Could you please sort out any that you would not like to have as neighbors." Immigrants or foreign workers, percentage mentioned 84 World Values Surveys
v39_sd_1
"On this list are various groups of people. Could you please sort out any that you would not like to have as neighbors." People of a different religion, percentage mentioned 50 World Values Surveys
v42_sd_1
"On this list are various groups of people. Could you please sort out any that you would not like to have as neighbors." People of a different language, percentage mentioned 28 World Values Surveys
ethnic_econ economic situation of ethnic group is 'same' as other groups 16 Afrobarometer
ethnic_pol political position of ethnic group is 'same' as other groups 4 Afrobarometer
never_unfair ethnic group 'never' treated unfairly 16 Afrobarometer
vengeance Fund for Peace rating on the "legacy of vengeance-seeking group grievance or group paranoia" 176 Fund for Peace
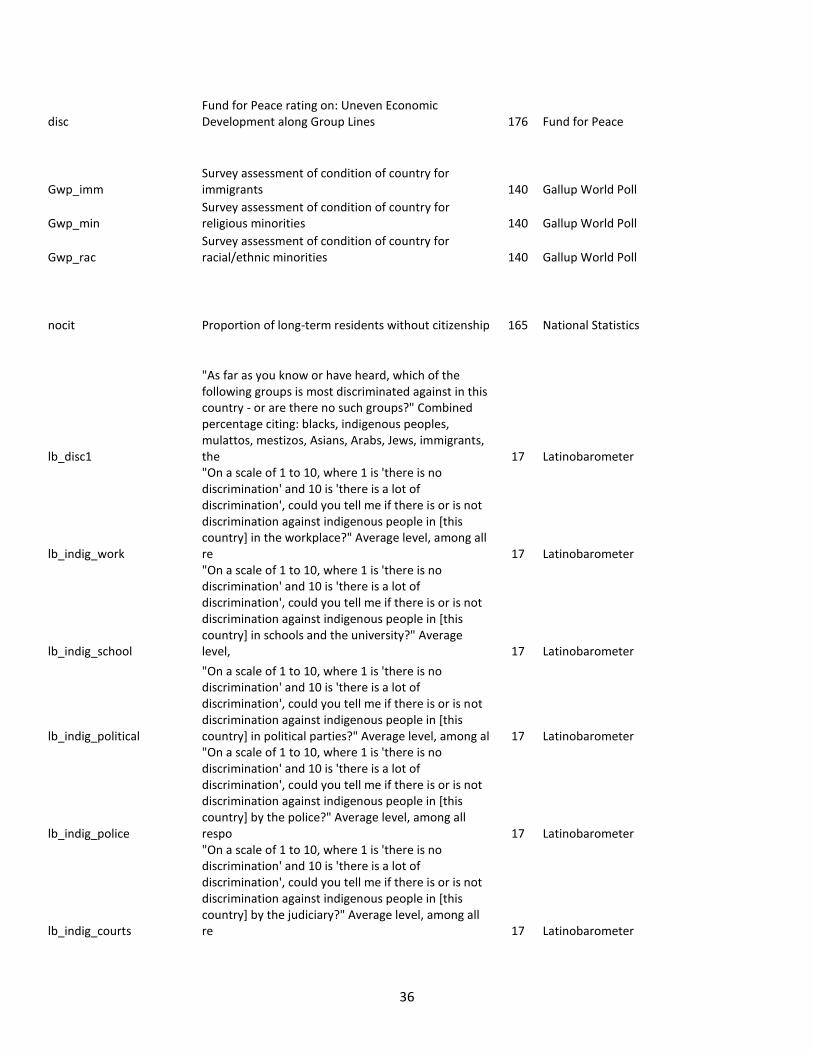
36
disc Fund for Peace rating on: Uneven Economic Development along Group Lines 176 Fund for Peace
Gwp_imm Survey assessment of condition of country for immigrants 140 Gallup World Poll
Gwp_min Survey assessment of condition of country for religious minorities 140 Gallup World Poll
Gwp_rac Survey assessment of condition of country for racial/ethnic minorities 140 Gallup World Poll
nocit Proportion of long-term residents without citizenship 165 National Statistics
lb_disc1
"As far as you know or have heard, which of the following groups is most discriminated against in this country - or are there no such groups?" Combined percentage citing: blacks, indigenous peoples, mulattos, mestizos, Asians, Arabs, Jews, immigrants, the 17 Latinobarometer
lb_indig_work
"On a scale of 1 to 10, where 1 is 'there is no discrimination' and 10 is 'there is a lot of discrimination', could you tell me if there is or is not discrimination against indigenous people in [this country] in the workplace?" Average level, among all re 17 Latinobarometer
lb_indig_school
"On a scale of 1 to 10, where 1 is 'there is no discrimination' and 10 is 'there is a lot of discrimination', could you tell me if there is or is not discrimination against indigenous people in [this country] in schools and the university?" Average level, 17 Latinobarometer
lb_indig_political
"On a scale of 1 to 10, where 1 is 'there is no discrimination' and 10 is 'there is a lot of discrimination', could you tell me if there is or is not discrimination against indigenous people in [this country] in political parties?" Average level, among al 17 Latinobarometer
lb_indig_police
"On a scale of 1 to 10, where 1 is 'there is no discrimination' and 10 is 'there is a lot of discrimination', could you tell me if there is or is not discrimination against indigenous people in [this country] by the police?" Average level, among all respo 17 Latinobarometer
lb_indig_courts
"On a scale of 1 to 10, where 1 is 'there is no discrimination' and 10 is 'there is a lot of discrimination', could you tell me if there is or is not discrimination against indigenous people in [this country] by the judiciary?" Average level, among all re 17 Latinobarometer

37
lb_black_work
"On a scale of 1 to 10, where 1 is 'there is no discrimination' and 10 is 'there is a lot of discrimination', could you tell me if there is or is not discrimination against blacks in [this country] in the workplace?" Average level, among all respondents i 17 Latinobarometer
lb_black_school
"On a scale of 1 to 10, where 1 is 'there is no discrimination' and 10 is 'there is a lot of discrimination', could you tell me if there is or is not discrimination against blacks in [this country] in schools and university?" Average level, among all resp 17 Latinobarometer
lb_black_political
"On a scale of 1 to 10, where 1 is 'there is no discrimination' and 10 is 'there is a lot of discrimination', could you tell me if there is or is not discrimination against blacks in [this country] in political parties?" Average level, among all responden 17 Latinobarometer
lb_black_police
"On a scale of 1 to 10, where 1 is 'there is no discrimination' and 10 is 'there is a lot of discrimination', could you tell me if there is or is not discrimination against blacks in [this country] by the police?" Average level, among all respondents in c 17 Latinobarometer
lb_black_courts
"On a scale of 1 to 10, where 1 is 'there is no discrimination' and 10 is 'there is a lot of discrimination', could you tell me if there is or is not discrimination against blacks in [this country] by the judiciary?" Average level, among all respondents i 17 Latinobarometer
lb_disc2
"Of all the reasons people are not treated equally, which of the following most affect you?" Percentage citing "discrimination due to skin color" and "discrimination against immigrants" 18 Latinobarometer
lpop_lassassinations Log assassinations per log capita 189 Cross-National Time-Series Data Archive
lpop_lguerrilla Log instances of guerrilla conflict per log capita 189 Cross-National Time-Series Data Archive
lpop_lriots Log riots per log capita 189 Cross-National Time-Series Data Archive
lpop_lterrorist Log terrorist acts per log capita 121 Cross-National Time-Series Data Archive
demonstrations Economist Intelligence Unit rating on likelihood of violent demonstrations 121 Economist Intelligence Unit
terrorist Economist Intelligence Unit rating on potential for terrorist acts 121 Economist Intelligence Unit
deathsinorganizedconflict Economist Intelligence Unit rating on deaths in organized conflict 121 Economist Intelligence Unit
distrust Economist Intelligence Unit rating on social distrust 121 Economist Intelligence Unit

38