the economic partnership agreements between the european
TRANSCRIPT

The Economic Partnership Agreements Between
the European Union and the African-Caribbean-
Pacific Countries
The Impact on Trade Flow Between EU-Ghana and EU-Ivory Coast
Enschede, October 28th
, 2011
Greta Sommer
s0171085
1st Supervisor: Prof. Dr. N.S. Groenendijk
Co-Supervisor (2nd
reader): Dr. L. Marin
Study: European Studies
Study year: 2010/2011

2

3
TABLE OF CONTENT
List of Acronyms ........................................................................................................................ 4
Abstract ...................................................................................................................................... 6
1. Introduction ............................................................................................................................ 8
2. Theoretical frame ................................................................................................................. 11
2.1 Potential implications of (I)EPAs ...................................................................................... 11
2.2 Aspired goals ...................................................................................................................... 14
3. Methodology ........................................................................................................................ 16
4. Analysis ................................................................................................................................ 19
4.1 Ivory Coast ......................................................................................................................... 19
4.1.1 Imports ..................................................................................................................... 20
4.1.2 Exports ..................................................................................................................... 22
4.2 Ghana ................................................................................................................................. 23
4.2.1 Imports ..................................................................................................................... 25
4.2.2 Exports ..................................................................................................................... 26
4.3 Hypothesis .......................................................................................................................... 27
5. Conclusion ............................................................................................................................ 31
6. References ............................................................................................................................ 33

4
LIST OF ACRONYMS
ACP African, Caribbean and Pacific [countries]
AEC African Economic Community
DFQF Duty-free, quota-free [access to EU markets]
EBA Everything But Arms [scheme]
EC European Community
ECOWAS Economic Community of Western African States
EDF European Development Fund
EPA Economic Partnership Agreement
EU European Union
EUR Euro
FTA Free Trade Area
GATT Generalized Agreement on Tariffs and Trade
GSP Generalized System of Preferences
IEPA Interim Economic Partnership Agreement
LDC Least Developed Country
SITC Standard International Trade Classification
UN United Nations
WTO World Trade Organization

5

6
ABSTRACT
Since the adoption of the Lomé Convention, the European Union (EU) has been negotiating
Economic Partnership Agreements (EPAs) with countries in the African, Caribbean and
Pacific (ACP) regions in order to obtain a new basis for future economic relations. However,
many of these countries have not signed the agreements yet; critique on possible negative
outcomes is the main reason. Yet, the European Commission insists that positive effects
prevail.
The Western African states Ivory Coast and Ghana have initialed/signed Interim Economic
Partnership Agreements (IEPAs) and hence, serve as adequate samples to state whether the
Economic Partnership Agreements have a significant impact on trade flow. Hence, this thesis
aims to answer the central question:
“To what extent does the introduction of Interim Economic Partnership Agreements have an
impact on trade flow between the European Union and Ivory Coast and Ghana, respectively,
as intended?”
In order to arrive at results to answer this question, I firstly state the initial aims of the
introduction of Economic Partnership Agreements. Secondly, I collect data and gather
nominal import and export values for the European Union, Ivory Coast and Ghana,
respectively, for the time period 2000–2011. Subsequently, I compute the average yearly
fluctuations in trade volume for the periods 2000–2007 and 2008–2010/2011, since the
Interim Economic Partnership Agreements were initialed/signed in 2008. Large differences in
average yearly fluctuations would indicate an impact of the Interim Economic Partnership
Agreements on trade flow between the two Western African countries and the European
Union.
It is expected to find that the introduction of the Economic Partnership Agreements has led to
average positive fluctuations, and hence, that the adoption of Interim Economic Partnership
Agreements (partially) caused an increase in trade flow.

7

8
1. INTRODUCTION
“The real measure of success for any political partnership is the extent to which substantive
outcomes can be measured against the aspirations of each party“ (Farrell, 2005, p. 265).
This thesis aims to measure the success of the introduction of Interim Economic Partnership
Agreements (IEPAs) between the European Union (EU) and two Western African countries:
Ivory Coast and Ghana, in light of the anticipated goals of this economic cooperation.
Economic ties between Europe and Africa date back to the times of the end of European
colonial power in many African countries. A major motivation for Europe was to secure
continued access to raw materials and natural resources.
This cooperation initially gained treaty status in 1963 with the adoption of the Yaoundé
Convention (Farrell, 2005). It was followed by the Lomé Convention in 1975 which unified
countries from Africa, the Caribbean and Pacific areas (ACP countries) and the EU (then:
European Communities [EC]) in economic trade relations. The Lomé Convention provided
for ACP countries to sell their products on the European market by means of privileged
access, meaning low or no tariff rates. Furthermore, the Convention held that this access for
products from the ACP countries was of ‘non-reciprocal’ character; the EU did not enjoy the
same benefits with regard to access of EU products to ACP markets. However, this approach
was opposing rules set out by the World Trade Organization (WTO) stating that it was not
legitimate to offer preferential market access to some countries, while not offering the same
conditions to others (‘Most-favored nation clause’). This incompatibility was acknowledged
by the European Commission in 1996, leading to the demand for a renewed trade agreement
which was set up in the Cotonou Agreement in 2000 (Farrell, 2005).
In addition, Article XXIV of the General Agreement on Tariff and Trade (GATT) provides an
exemption of the above-mentioned most-favored nation clause; specific economic agreements
between countries are legally accepted as long as the character of the relationship is
‘reciprocal’ which refers to an economic relationship in which one party has nonrestrictive
access to the other market, whereas the other party does not enjoy the same benefits
(Borrmann, Großmann, & Koopmann, 2006; Farrell, 2005). This aspect of reciprocity is
acknowledged in the Cotonou Agreement, facilitating barrier-free access of European
products to ACP markets (Farrell, 2005).
The Cotonou Agreement established the prerequisite to negotiations on Economic Partnership
Agreements (EPAs) between the EU and ACP states. This signaled a move towards an EU—

9
ACP Free Trade Area (FTA), defined as “a group of two or more customs territories in which
the duties and other restrictive regulation of commerce are eliminated on substantially all the
trade between the members in products originating between them” (Ukpe, 2010, p. 221).
Initially, EPAs were to be negotiated between the EU and seven groups of ACP countries
until 2008, five of which were African (Flint, 2009). However, by January 2008, the EU and
Africa had failed to agree on a set of EPAs; rather, single countries had started to negotiate
IEPAs with the EU. These IEPAs are merely temporary solutions until an actual EPA is
agreed upon; furthermore, WTO requirements state that IEPAs need to lead to the formation
of an FTA, including a time plan and a liberalization schedule (Ukpe, 2010).
Countries that choose not to negotiate IEPAs with the EU face two main alternative trading
options. Firstly, economic relations can be maintained on basis of the ‘Everything But Arms’
(EBA) scheme. However, this approach is only attainable for Least Developed Countries
(LDCs). It provides for continued non-reciprocal duty free and quota free access of all
products (except arms and munitions) to the EU (Ukpe, 2010). Secondly, for those countries
not belonging to the LDC group but decide against both an EPA as well as an IEPA with the
EU, trade will be regulated by the Generalized System of Preferences (GSP) (Stevens, 2005;
Stevens & Kennan, 2005). Consequently, the majority of countries chose neither to negotiate
EPAs nor IEPAs with the EU; especially for LDCs, there was and is no incentive to change
the trading scheme, since the EBA trading scheme offers them the best possible option and
does not contain the aspect of reciprocity (Flint, 2009; Stevens, 2006; Ukpe, 2010).
Two of only a few African countries, however, chose to initial or sign IEPAs with the EU:
Ivory Coast and Ghana, both non-LDCs. Ivory Coast signed an IEPA with the EU, whilst
Ghana initialed an IEPA. This thesis aims to detect the impact that these IEPAs have on the
economic relationship between the respective country and the EU. Hence, the central research
question is:
“To what extent does the introduction of Interim Economic Partnership Agreements have an
impact on trade flow between the European Union and Ivory Coast and Ghana, respectively,
as intended?”
In order to arrive at an answer for this question, the remainder of this thesis is organized as
follows. Chapter two presents the theoretical framework and will deal with the following two
sub-questions:

10
1. “What are the potential implications for African countries that come with the
introduction of Economic Partnership Agreements and Interim Economic Partnership
Agreements?”
2. “What are the goals to be fulfilled with the adoption of EPAs and IEPAs between the
EU and African states?”
After answering these questions on basis of a literature review, I will move on to the
methodological part, chapter three. In this section I will depict the units of observation, the
time period, concepts and the operationalization in more detail.
Chapter four is the analytical part of my thesis. In this section I will analyze nominal import
and export data of Ivory Coast and Ghana vis-à-vis the EU during the years 2000 and 2011,
and will answer the following two sub-questions:
1. “Did the import and export pattern and trend between the European Union and Ivory
Coast and Ghana, respectively, change after the Interim Economic Partnership
Agreements came into effect?”
2. If yes, to what extent and in which direction did the changes occur?”
In chapter five, I will conclude the thesis by summarizing the answers to the sub-questions in
order to be able to answer the overall research question:
“To what extent does the introduction of Interim Economic Partnership Agreements have an
impact on trade flow between the European Union and Ivory Coast and Ghana, respectively,
as intended”?

11
2. THEORETICAL FRAME
In this chapter, I analyze two main aspects of EPAs and IEPAs.
Firstly, I will give an overview on the possible effects of adopting (I)EPAs, both in the long
run as well as in the short run. I will then move to concentrate on a specific section of
repercussions of the (I)EPAs, namely the declared overall goals of introducing the new trade
agreements. This is a crucial point in order to answer the overall research question. As I aim
to find out whether trade data hint towards the fact that (I)EPAs did achieve the aspired goals,
such goals need to be established first.
Hence, in order to get a rather comprehensive view on the topic of EPAs, and to be able to
offer recommendations for further approaches in EPA negotiations between the EU and
African countries, I will list possible effects implied in the EPAs.
Therefore, the first question I pose here is:
What are potential implications for African countries that come with the introduction of EPAs
and IEPAs?
The influence of EPAs is connected to trade relationships between the EU and the particular
countries; however, implications are reaching further. The subject of this question is what
difference the introduction of EPAs has on EU—African trade relations and beyond.
Secondly, the goal of this thesis is to find out whether the trade flow between the EU and
Ivory Coast, as well as between the EU and Ghana has been influenced by the introduction of
the IEPAs between the respective states as intended. In order to find an answer to this
question, a theory with regard to the actual aims needs to be formulated. Hence, I pose the
following question:
What are the goals to be fulfilled with the adoption of EPAs and IEPAs between the EU and
African states?
By answering this question, I will be able to answer the above-mentioned overall question in
the conclusion, after having analyzed data of trade flow in the analytical part.
2.1 Potential implications of (I)EPAs
The introduction of the (I)EPAs brings along several far-reaching consequences for the
involved parties, both of positive and negative character. The following part begins to
describe possible negative ramifications on part of the involved West African countries. I will

12
then move on to concentrate on positive trade aspects induced by the introduction of the
(I)EPAs, a facet I will further analyze in the second part of the theory.
Since the independence of African states from their—mostly European—colonial powers, the
concept of regional integration has gained in importance (Farrell, 2005). In order to prevent a
fragmentation of inner-African economic relations, leaders of the African continent’s states
decided to strengthen regional economic integration; different regions were to set
arrangements on a sub-regional level in order to achieve wider and more coherent forms of
cooperation (Ukpe, 2010).
However, this regional integration approach, one of the most crucial aspects of the African
development strategy, is being threatened by the characteristics of the (I)EPAs (Ukpe, 2010).
Firstly, the EPAs were supposed to be negotiated with a number of regional sub-groups within
the ACP countries, five of which were in Africa. Yet, these regional groupings were not
coherent with the regional economic communities in Africa, which presented the first
problem. Secondly, several countries left EPA negotiations within their respective groups, and
started to negotiate bilateral interim agreements (Ukpe, 2010). Among these countries were
Ivory Coast and Ghana; these countries are among just a few non-LDCs in their regional sub-
group (Economic Community of Western African States [ECOWAS] member states and
Mauritania). Hence, they were in a better position to negotiate IEPAs with the EU which led
these two countries to being the only ones within their region to start negotiating IEPAs with
the EU, furthering the disruption of the regional integration process within their region.
Furthermore, the LDCs kept continuing non-reciprocal privileged access to the EU market
under the EBA scheme. Negotiating EPAs in collaboration with non-LDCs within their region
would rather have harmed than benefited them. Hence, a two-tiered regional grouping
developed (Flint, 2009).
The study cases of Ivory Coast and Ghana within the setting of the ECOWAS member states
illustrate the dilemma of the regional integration disruption. Firstly, it was possible for those
member states that did not sign an IEPA with the EU to erect new barriers against imports
from Ivory Coast or Ghana in order to prevent imports of EU goods through their borders.
However, barriers to trade within ECOWAS oppose regional trade integration objectives of
ECOWAS (as well as the African Economic Community [AEC]). Secondly, the liberalization
schedules between the EU and Ivory Coast and Ghana respectively did not represent the
common position of the ECOWAS member states. Additionally, transitional periods as agreed
on within these two interim agreements opposed the desires for a longer transitional period by

13
the rest of the ECOWAS states. Thirdly, the EU agreed on rules of origin with Ivory Coast
and Ghana. Again, these agreements opposed the common ECOWAS position and might have
led to new barriers to trade within the ECOWAS group (Ukpe, 2010).
Although one of the most damaging accompanying effects of the introduction of the (I)EPAs,
the regional integration problem is not the only one.
Another crucial aspect is the loss of customs revenue. With the opening of markets and the
reciprocal arrangement providing for tariff-free imports from the EU for many products, a
strong increase in imports, and a concurring decrease in customs revenue is to be expected
(Borrmann et al., 2006).
Additionally, ongoing liberalization and privatization provided for in the EPAs might
probably have led to problems within African countries. Most countries did not possess
private sectors with the ability to compete within the international market; consequently, the
rather immediate liberalization process might have hindered African countries to especially
protect domestic infant industries that would have had the opportunity to industrial
diversification strategies aiming for further economic development (Farrell, 2005). According
to Borrmann et al. (2006), the size of adjustment costs that are due to trade liberalization is
dependent on the quality of institutional characteristics of the labor market of the respective
country. They stated that successful trade liberalization is only possible when capable
institutions are present; however, in many African countries institutions are in poor
conditions, or sometimes effectively not existing (Borrmann, Busse, & Neuhaus, 2005). In
addition, Goodison (2007) claimed that adjustment costs are highly significant and
constricting for African countries. The loss of tariff revenues, the restructuring of domestic
sectors and the development of institutional capabilities need to be compensated (Flint, 2009).
It is estimated that these costs will amount to at least nine billion euros (EUR) (Bilal &
Rampa, 2006)—as a comparison, between 2001 and 2004, all states belonging to the ACP
group received trade-related assistance of 300 million EUR (Bilal, de Burgh, Rampa, & Van
Hove, 2006). ACP countries continue to receive support from the European Development
Fund (EDF); however, contrary to the claims of the European Commission (2006b), the
amount of support has not increased with regard to adjustment costs for the EPAs, and hence,
these would be covered at the expense of other sectors (e.g. health and education) (European
Parliament, 2008).
However, not all aspects covered with the adoption of (I)EPAs have negative consequences.
One of the major aspects, and strongly pronounced goals of the introduction of these newly
arranged free trade agreements, is the announced opening of markets (both on EU as well as

14
on African side), and the following increase in trade volume. In the following part, I will go
into further detail of this significant aspect.
2.2 Aspired goals
The introduction of EPAs as well as IEPAs is aimed to have a positive impact on trade aspects
for both the EU and partner countries within the ACP region, here focused on African
countries.
The EU’s motivation for promoting EPAs is rather self-serving; the aim is to secure continued
access to and a privileged position in Africa’s markets (Farrell, 2005). Busse, Borrmann, and
Großmann (2004) went further and claimed that the EU aims for an enhanced market access
by gradually liberalizing trade barriers with regard to imports from EU member states. Indeed,
the EPAs provide for a liberalization of African markets, albeit in a much slower speed than is
required by the EU (Dihm, 2007).
However, former EU Trade Commissioner Peter Mandelson alleged that the EU’s motivation
for negotiating EPAs was not of a ‘mercantilist’ character (Mandelson, 2006). He rather stated
the positive impact of the EPAs on developing countries, emphasizing the possible
development gains (Mandelson, 2005). This view was supported by the European
Commission (2006a), highlighting the main objective of furthering development in yet under-
developed countries.
In fact, EPAs are also designed to benefit African countries. The two major goals to be
fulfilled by the adoption of EPAs are: firstly, the integration into the world economy; and
secondly, the furthering of (sustainable) development within the countries.
According to Farrell (2005), the first aspect of integration into the global economy would be
facilitated by the EPAs; the marginalization of African economies would be averted. This
point is supported by Borrmann and Busse (2007) who claimed that one of the major aims of
the Cotonou Agreement that provides for EPA negotiations is the gradual and smooth entering
of ACP countries in general and African countries in particular.
The second goal to be achieved with help of the EPAs is to further (sustainable) development
within African countries (Borrmann & Busse, 2007; Grosse Ruse-Khan, 2010; Ukpe, 2010).
Sustainable development as defined in the ‘Brundtland’ Report of the World Commission on
Environment and Development is “development that meets the needs of the present without
compromising the ability of future generations to meet their own needs”; it therefore
implicates “development that can last over the long term, requiring the balanced reconciliation

15
and integration of economic, environmental and social priorities” (United Nations, 1987). One
crucial aspect with regard to attaining gradual development is increased market access to EU
markets which is provided for in the (I)EPAs by means of unconditional full tariff and quota
free access (Busse et al., 2004; Dihm, 2007). It is assumed that increased market access leads
to enhanced trade volumes, which in turn have a positive effect on economic growth and
heightened levels of income in African countries (Borrmann & Busse, 2007). This would then
lead to the aspired development, and the lowered trade barriers would have a beneficial effect
for the countries (Borrmann & Busse, 2007). The above-described ‘chain of development’
consequently looks like the following:
(I)EPAs Enhanced market access Enhanced trade (volume) Economic growth /
Increased income levels
(Sustainable) Development
Summed up, the anticipated effect stemming from the adoption of (I)EPAs is economic
liberalization, in turn leading to higher trade flow between the EU and the African countries.
Applied to the case at hand, the two hypotheses proclaimed are:
1. The adoption of (I)EPAs leads to increased exports from Ivory Coast / Ghana to the
EU.
2. The adoption of (I)EPAs leads to increased imports from the EU to Ivory Coast /
Ghana.
Finally, another goal to be fulfilled by introducing EPAs as mentioned throughout the
literature is the regional integration process within African countries, especially with regard to
the different economic communities (Busse et al., 2004; Stevens, 2006). However, this aim is
likely to be missed, as became rather obvious in the first part of the theoretical frame.

16
3. METHODOLOGY
In this chapter, I describe the methodology used in my thesis. I will identify units of
observation, time period, concepts and the operationalization, and depict possible threats to
validity.
The units of observation in this study are the Western African states Ghana and Ivory Coast. I
concentrate on these two countries for the following reason: I initially started to focus on the
member states of ECOWAS; the fifteen ECOWAS states plus Mauritania constitute one of the
seven groups within the EPA negotiation groups of ACP countries (European Commission,
n.d.a). Among these sixteen states, Ghana and Ivory Coast play a significant role, since only
Ivory Coast signed an IEPA, and Ghana initialed an IEPA (European Commission, n.d.b). For
reasons of accuracy it is important to mention here that in 2010, Ivory Coast was temporarily
suspended from the ECOWAS group (Anonymous, 2010). However, this fact does not
conflict with my study since the IEPA was arranged between the EU and Ivory Coast as an
autonomous actor.
Since this study will analyze only two countries (out of all seventy-seven EPA-negotiating
countries), a threat to validity is applicable here (Gavin, 2007). Since the sampling of
observed countries was not done on a random basis, a threat to external validity is present.
Another threat to validity is visible here, the ‘Interaction of the Causal Relationship with
Units’ threat is defined as a situation in which “an effect found with certain kinds of units
might not hold if other kinds of units had been studied” (Shadish, Cook & Campbell, 2002, p.
87).
This study concentrates on the question whether or not the signing of IEPAs (in the case of
Ivory Coast) and the initialization of IEPAs (in the case of Ghana) had an influence on the
trade flow between the EU and Ghana and the EU and Ivory Coast respectively, in terms of
the magnitude of their imports and exports. I will analyze the time period accordingly.
The IEPA between the EU and Ivory Coast was signed on July 10th
, 2008. In this document,
deadlines are set for Ivory Coast with regard to the liberalization of different product types
imported from the EU. These deadlines are July 1st, 2009, January 1
st, 2010 and January 1
st,
2011 (as well as further deadlines in the coming years); I will analyze the import and export
data accordingly (Bilal & Stevens, 2009). Hence, I will analyze the data of the years 2000
until 2010. I will analyze the data of the first quarter of 2011 as well, and draw a prognosis for
the entire year 2011 by quadrupling these data.
17
The approach to analyzing import and export data between the EU and Ghana is equal. I will
analyze the nominal import and export data of the time period 2000 until 2010; I will
conclude with an analysis of the import and export data of the first quarter of 2011 (January,
February, March), to be able to provide a prognosis for the data of the entire year 2011.
To see whether value fluctuations had been evident before 2008 and the deadlines set for
Ivory Coast in 2009, 2010 and 2011, I will analyze nominal import and export data from eight
years prior to 2008, i.e. from 2000 to 2007. It is useful to analyze the data of eight years
instead of less to prevent a further threat to internal validity. The threat ‘Maturation’ is
evident when “naturally occurring changes over time could be confused with treatment”, in
this case the introduction of the IEPAs (Shadish et al., 2002, p. 55). It is possible that I will
find trade fluctuations from before and after 2008 when analyzing the data; however,
contingent fluctuations are due to regular changing economic fluctuations, independent of the
introduction of IEPAs. Hence, I will evaluate data from several years before 2008 (2000–
2007) to see whether there is an obvious difference in trade fluctuations.
When analyzing data from a rather long period of time (in this case eleven years and three
months) there is another threat to internal validity that needs to be taken into account when
interpreting the findings. The threat ‘History’ refers to the fact that “events occurring
concurrently with the treatment could cause the observed effect” (Shadish et al., 2002, p. 55).
Another threat to validity, to external validity, is the ‘Interaction of the Causal Relationship
Over Treatment Variations’ threat, defined as a situation in which “an effect found with one
treatment is combined with other treatments, or when only partial treatment is used” (Shadish
et al., 2002, p. 87). Hence, when I analyze the results I need to be alert of other possible
reasons for the found results.
The concepts I use in this study can be summed up to the following:
Ivory Coast—EU imports and exports
Ghana—EU imports and exports
Economic performance
It is interesting to know whether the economic situation of Ghana and Ivory Coast has
changed since 2008, when the IEPA between the EU and Ivory Coast came into effect and the
EPA between the EU and Ghana was initialed. This study intends to contribute to find an
answer to this by identifying the progress of trade flow between the EU and Ivory Coast and
Ghana, respectively. I will do this by analyzing import and export data of both countries with

18
the EU over a time period of eleven years plus the first quarter of 2011, comparing them and
reaching a conclusion.
To find results, the operationalization of this study will be the following. As mentioned above,
I will compare import and export data of Ivory Coast and Ghana (before 2008, 2008, and after
2008). The data will be measured in EUR as a nominal value. I will be alert of a threat to
construct validity here, i.e. the ‘Mono-Operation Bias’: “Any one operationalization of a
construct both under-represents the construct of interest and measures irrelevant constructs,
complicating inference” (Shadish et al., 2002, p. 73). This is applicable here since merely a
single indicator is measured: EUR.
I will collect data from the Eurostat web site, using a rather inverted way to find import and
export data between the EU and the two African countries. I will retrieve the EU import and
export data of Ivory Coast and Ghana, analyze them and draw conclusions. Eurostat uses the
‘Standard International Trade Classification’ (SITC), which “is a product classification of the
United Nations (UN) used for external trade statistics (export and import values and volumes
of goods), allowing for international comparisons of commodities and manufactured goods”
(European Commission, n.d.c).

19
4. ANALYSIS
In this chapter, I compile, analyze and evaluate the data of imports and exports between the
EU and Ivory Coast and Ghana, respectively. As indicated in the previous chapter, the time
period ranges from 2000 to the first quarter of 2011. Beginning in 2000 with the adoption of
the Cotonou Agreement, ranging over 2008 when the IEPAs were signed or initialed, and
ending in the first quarter of 2011, the time period from which the most current data are
available. Imports and exports are measured in EUR as a nominal value.
I will evaluate the results as following: I analyze whether differences of import and export
data over the time period can be found by comparing the data of one country. I then look at
whether disparities can be noted comparing the results, or if they are similar in both countries.
4.1 Ivory Coast
The first country I analyze is Ivory Coast, the only member state of ECOWAS that did sign an
IEPA with the EU until today.
Table 1 below shows the values of imports from the EU and exports to the EU (in EUR).
Highlighted are the years and corresponding values between 2008 and 2011, hence, since the
year that the IEPA with Ivory Coast was signed.
Table 1: Import and export values between Ivory Coast and the EU, 2000–2011, in EUR
Year Imports from EU Exports to EU
2000 1.443.053.428 EUR 2.059.126.409 EUR
2001 1.339.477.559 EUR 2.176.754.832 EUR
2002 1.278.752.893 EUR 2.649.048.668 EUR
2003 1.112.136.606 EUR 2.677.059.047 EUR
2004 1.181.742.128 EUR 2.207.094.186 EUR
2005 1.127.060.924 EUR 1.978.433.731 EUR
2006 1.149.827.354 EUR 2.493.059.096 EUR
2007 1.346.371.003 EUR 2.733.679.237 EUR
2008 1.488.832.356 EUR 3.169.481.844 EUR
2009 1.503.234.459 EUR 3.053.522.561 EUR
2010 1.743.164.432 EUR 3.216.498.399 EUR
2011 (as expected) 890.728.952 EUR 3.583.789.192 EUR
Source: Eurostat, European Commission

20
Important are the fluctuations of the nominal values between the respective years, since the
goal is to find out whether the provisions made in the IEPA between Ivory Coast and the EU
had any impact on the trade flow, measured in EUR.
In order to give a complete and more comprehensible overview, Table 2 depicts the
fluctuations in EUR and percent.
Table 2:
Fluctuations of import and export values between Ivory Coast and the EU, 2000–2011, in
EUR and percent
Year Imports Exports
2001 - 103.575.869 EUR - 7.18% + 117.628.423 EUR + 5.71%
2002 - 60.724.666 EUR - 4.53% + 472.293.836 EUR + 21.70%
2003 - 166.616.287 EUR - 13.03% + 28.010.379 EUR + 1.06%
2004 + 69.605.522 EUR + 6.26% - 469.964.861 EUR - 17.56%
2005 - 54.681.204 EUR - 4.63% - 228.660.455 EUR - 10.36%
2006 + 22.766.430 EUR + 2.02% + 514.625.365 EUR + 26.01%
2007 + 196.543.649 EUR + 17.09% + 240.620.141 EUR + 9.65%
2008 + 142.461.353 EUR + 10.58% + 435.802.607 EUR + 15.94%
2009 + 14.402.103 EUR + 0.97% - 115.959.283 EUR - 3.66%
2010 + 239.929.973 EUR + 15.96% + 162.975.838 EUR + 5.34%
2011 (as expected) - 852.435.480 EUR - 48.90% + 367.290.793 EUR + 11.42%
4.1.1 Imports
Following from Table 2 above, I can try to draw conclusions. With the signing of the IEPA in
2008, Ivory Coast was obligated to liberalize a number of goods (56); the deadline for this
was July 1st, 2009 (Bilal & Stevens, 2009). Seeing the strong increase in import value in the
years 2008 and 2009, I can—carefully—claim that it is possibly linked to the liberalization of
goods as provided for in the 2008 IEPA.
The import value of the year 2010 stands out even more; between 2009 and 2010 the import
value of goods from the EU entering Ivory Coast increased by around 239.9 million EUR
(15.96%). Adding to this the fact that Ivory Coast was obliged to further liberalize a number
of 927 product lines by January 1st, 2010, I can draw the same possible hypothesis as above:
that the liberalization of goods is connected to the severe increase of import value.

21
However, these hypotheses need to be regarded with caution. As the data of the years 2000 to
2007 show, fluctuations have occurred before; especially the increase of import value between
2006 and 2007 by around 196.6 million EUR is peculiar. Hence, the assumption that the
overall increase of import value of nearly 396.8 million EUR between the years 2008 to 2010
has to be attributed to the adoption of the IEPA is by far not a definite hypothesis.
Furthermore, the expected import value for the year 2011 hints in a completely different
direction. The prediction was done by adding the import values of the first three months of
2011, January, February and March. The data of these three months represent the data of the
first quarter of 2011, and hence, I multiplied them by four in order to obtain a prognosis for
the whole year of 2011. According to this prognosis, the value of imports from the EU to
Ivory Coast will have decreased by around 852.4 million EUR (48.9%) by the end of 2011 as
compared to the year 2010. As of today, there is no explanation for this strong decline; it is
possible that the value of imports of the first three quarters was exceptionally low, and that the
value will rise in the course of the year.
In order to arrive at a more reliable hypothesis, it is a helpful measure to compare the yearly
average value fluctuation of import value between the years 2000 and 2007 with the values of
the years 2008 to 2011, as displayed in Table 3 below.
Table 3:
Average yearly value fluctuations of imports from EU to Ivory Coast, 2000–2011, in EUR and
percent
Year Average yearly value fluctuation
2000–2007 - 13.8 million EUR - 0.57%
2008–2010 + 132.3 million EUR + 9.17%
2008–2011 - 113.9 million EUR - 5.35%
Between 2000 and 2007, the overall import value decreased by a total of around 96.7 million
EUR, which makes it an average yearly decline of around 13.8 million EUR (0.57%).
Between 2008 and 2011, the overall import value decreased by around 455.6 million EUR,
adding up to a yearly decrease of around 113.9 million EUR (5.35%). I need to be very
careful with these data when drawing conclusions since the data for 2011 are merely an
extrapolation made on the basis of the data for the first quarter.

22
This calculation obviously contradicts the hypothesis that the adoption of the IEPAs had a
positive impact on the value of imports to Ivory Coast, as indicated above. The average yearly
decrease of around 113.9 million EUR between the years 2008 and 2011 is much higher than
the yearly decrease of 13.8 million EUR between 2000 and 2007. That result itself is
unreckoned; adding to this the fact that the import value was expected to rise due to the
adoption of the IEPA, this result is even more surprising.
In order to make the analysis more reliable, it is a suitable measure to further compare the
average yearly import value of the years 2000 to 2007 with the average yearly import value of
the years 2008 to 2010. Hence, I leave out the year 2011 for which there are predictions
instead of definite data. As discussed above, the average yearly value decrease of imports
from the EU between the years 2000 to 2007 amounts to 13.8 million EUR. Compared to that
is an average yearly value increase of imports of around 132.3 million EUR (9.17%) in the
years 2008 to 2010.
This result is insofar important for this study, since it is contrary to the result we obtained
above. When comparing the average yearly value fluctuation of the years 2000 to 2007 with
that of the years 2008 to 2011 (with a predicted value), one witnesses a strong difference:
From an average yearly decrease of 13.8 million EUR (0.57%) in the years 2000 to 2007, to
an average yearly decrease of 113.9 million EUR (5.35%) from 2008 to 2011.
However, when I compare the average yearly value fluctuation of the years 2000 to 2007 with
that of the years 2008 to 2010 (with complete and definite data), I arrive at a different result:
From an average yearly decrease of 13.8 million EUR (0.57%) in the years 2000 to 2007, to
an average yearly increase of import value of 132.3 million EUR (9.17%) in the years 2008 to
2010.
4.1.2 Exports
In this section I will not address the fluctuations of export value directly, but rather
concentrate on the average yearly value fluctuations since the EPAs do not comprise
deadlines for the liberalization of European markets for products from Ivory Coast that need
to be considered. Hence, as was done in the section on imports, I will compare the average
yearly value fluctuations of exports of the years 2000 to 2007 with those of the years 2008 to
2010 and 2011, respectively, as shown in Table 4 below.
23
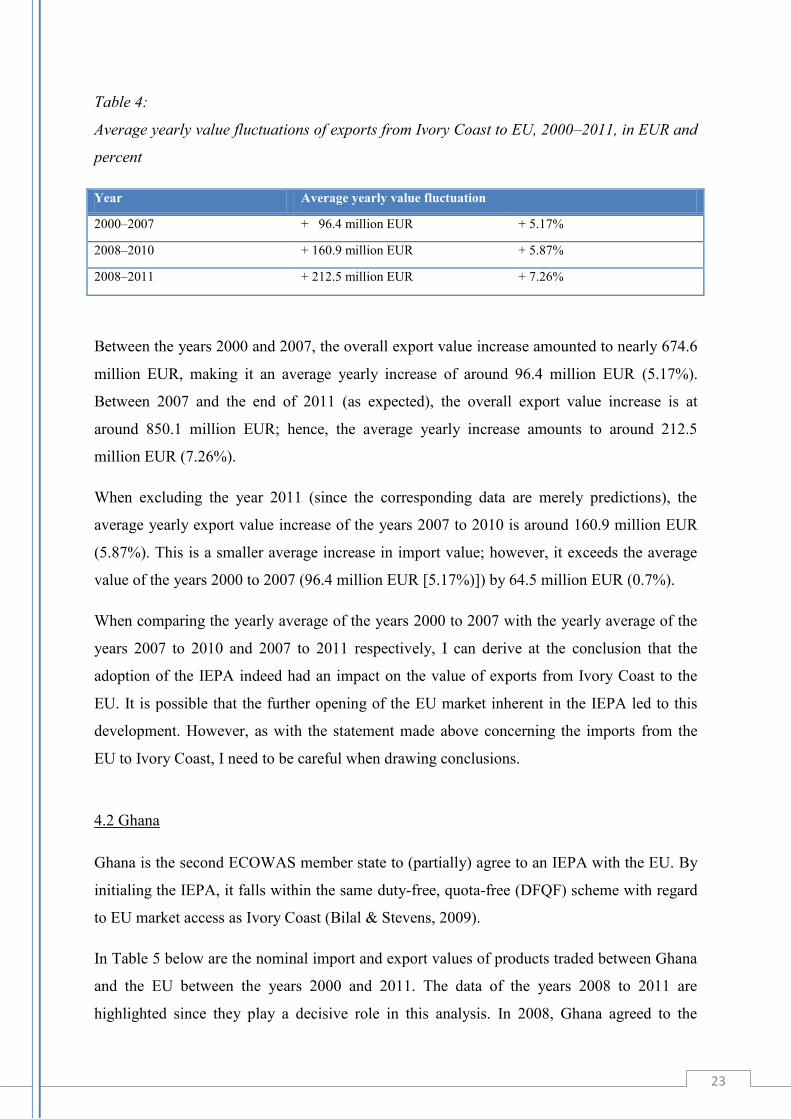
Table 4:
Average yearly value fluctuations of exports from Ivory Coast to EU, 2000–2011, in EUR and
percent
Year Average yearly value fluctuation
2000–2007 + 96.4 million EUR + 5.17%
2008–2010 + 160.9 million EUR + 5.87%
2008–2011 + 212.5 million EUR + 7.26%
Between the years 2000 and 2007, the overall export value increase amounted to nearly 674.6
million EUR, making it an average yearly increase of around 96.4 million EUR (5.17%).
Between 2007 and the end of 2011 (as expected), the overall export value increase is at
around 850.1 million EUR; hence, the average yearly increase amounts to around 212.5
million EUR (7.26%).
When excluding the year 2011 (since the corresponding data are merely predictions), the
average yearly export value increase of the years 2007 to 2010 is around 160.9 million EUR
(5.87%). This is a smaller average increase in import value; however, it exceeds the average
value of the years 2000 to 2007 (96.4 million EUR [5.17%)]) by 64.5 million EUR (0.7%).
When comparing the yearly average of the years 2000 to 2007 with the yearly average of the
years 2007 to 2010 and 2007 to 2011 respectively, I can derive at the conclusion that the
adoption of the IEPA indeed had an impact on the value of exports from Ivory Coast to the
EU. It is possible that the further opening of the EU market inherent in the IEPA led to this
development. However, as with the statement made above concerning the imports from the
EU to Ivory Coast, I need to be careful when drawing conclusions.
4.2 Ghana
Ghana is the second ECOWAS member state to (partially) agree to an IEPA with the EU. By
initialing the IEPA, it falls within the same duty-free, quota-free (DFQF) scheme with regard
to EU market access as Ivory Coast (Bilal & Stevens, 2009).
In Table 5 below are the nominal import and export values of products traded between Ghana
and the EU between the years 2000 and 2011. The data of the years 2008 to 2011 are
highlighted since they play a decisive role in this analysis. In 2008, Ghana agreed to the

24
initialization of an IEPA with the EU; hence, this analysis aims to find out whether there have
been (considerable) changes of import and export values since 2008.
Table 5: Import and export values between Ghana and the EU, 2000–2011, in EUR
Year Imports Exports
2000 1.281.391.328 EUR 1.172.702.195 EUR
2001 971.766.037 EUR 1.079.647.637 EUR
2002 1.050.059.139 EUR 1.130.466.864 EUR
2003 1.010.411.536 EUR 1.057.795.968 EUR
2004 1.194.851.845 EUR 1.037.905.950 EUR
2005 1.251.168.625 EUR 977.693.233 EUR
2006 1.459.283.359 EUR 1.114.121.017 EUR
2007 1.698.440.387 EUR 1.143.857.594 EUR
2008 1.926.685.940 EUR 1.250.844.908 EUR
2009 1.751.933.934 EUR 1.096.947.670 EUR
2010 2.180.981.517 EUR 1.458.954.828 EUR
2011 (as expected) 2.683.774.268 EUR 2.660.631.696 EUR
Source: Eurostat, European Commission
Table 6 identifies the fluctuations of import and export values between 2000 and 2011 in EUR
and percent.
Table 6:
Fluctuations of import and export values between Ghana and the EU, 2000–2011, in EUR
and percent
Year Imports Exports
2001 - 309.625.291 EUR - 24.16% - 93.054.558 EUR - 7.94%
2002 + 78.293.102 EUR + 8.06% + 50.819.227 EUR + 4.71%
2003 - 39.647.603 EUR - 3.78% - 72.670.896 EUR - 6.43%
2004 + 184.440.309 EUR + 18.25% -19.890.018 EUR - 1.88%
2005 + 56.316.780 EUR + 4.71% - 60.212.717 EUR - 5.80%
2006 + 208.114.734 EUR + 16.63% + 136.427.784 EUR + 13.95%
2007 + 239.157.028 EUR + 16.39% + 29.736.577 EUR + 2.67%
2008 + 228.245.553 EUR + 13.44% +106.987.314 EUR + 9.35%
2009 - 174.752.006 EUR - 9.07% - 153.897.238 EUR - 12.30%
2010 + 429.047.583 EUR + 24.49% + 362.007.158 EUR + 33.00%
2011 (as expected) + 502.792.751 EUR + 23.05% + 1.201.676.868 EUR + 82.37%

25
4.2.1 Imports
Ghana’s liberalization schedule provides for the first liberalization stage to have ended by
January 1st, 2013. By this time, an amount of roughly 800 products must be excluded from
tariffs (Bilal & Stevens, 2009). Hence, it is to be assumed that import values have risen
already by now since the deadline is approaching. However, this case is obviously different
from the analysis of import values of Ivory Coast, since the first liberalization deadline is still
in the future; hence, I will not concentrate on the actual fluctuations of import value, but
rather focus on the average yearly fluctuations of import value.
In order to be able to reach a rather distinctive conclusion, I compare the average yearly
fluctuations of import value between the years 2000 and 2007 with the average data between
2008 and 2011.
Table 7:
Average yearly value fluctuations of imports from EU to Ghana, 2000–2011, in EUR and
percent
Year Average yearly value fluctuation
2000–2007 + 59.6 million EUR + 5.16%
2008–2010 + 160.8 million EUR + 9.62%
2008–2011 + 246.3 million EUR + 12.98%
The overall increase of import value between the years 2000 and 2007 reaches around 417.0
million EUR, which makes it a yearly average of almost 59.6 million EUR (5.16%).
Compared to that is the overall increase of import value between the years 2008 and 2011
which amounts to around 985.3 million EUR. Consequently, the yearly average between 2008
and 2011 is at around 246.3 million EUR (12.98%). The difference of around 186.7 million
EUR in value increase between the years 2000 to 2007 and 2008 to 2011 seems rather large;
consequently I could argue that the newly adopted provisions as envisaged in the IEPA are a
crucial factor leading to the increase of import value. However, as mentioned above, it is
important to underline the fact that the import value for 2011 is based on a prognosis rather
than on factual data; therefore, I will further compare the average yearly increase of import
value of the years 2000 to 2007 with the average yearly increase of import value of the years
2008 to 2010, for which definite data are available.

26
The average yearly increase of import value between 2000 and 2007 is 59.6 million EUR
(5.16%) (see above). For comparison, the average yearly increase of import value between
2008 and 2010 is 160.8 million EUR (9.62%). Hence, it is visible that when leaving out the
year 2011 and merely taking the data that are definite, the impression above is supported. The
difference of the average yearly increase of import value between 2008 and 2010 is
significantly higher than that of the years 2000 to 2007, by around 101.2 million EUR
(4.46%).
Following from the analysis above, I could argue that the strong increase of nominal import
value is based on the IEPA between Ghana and the EU, and the consequent liberalization
process.
4.2.2 Exports
As mentioned above, Ghana falls within the DFQF scheme regarding market access to the EU
since the initialization of the IEPA. As in the section on exports from Ivory Coast to the EU,
there are no deadlines on the liberalization of EU markets for products from Ghana that need
to be considered further, so I will directly start analyzing the average yearly fluctuations of
exports from Ghana to the EU. Hence, in the following I will depict the fluctuations of the
nominal value of exports from Ghana to the EU between the years 2000 to 2011. As was done
in the sections above, I will place concentration on the differences of export value between
the years 2000 to 2007 compared to the years 2008 to 2010 and 2011, respectively.
Again, I will calculate the average yearly fluctuation between the years 2000 and 2007, and
compare it with the average yearly fluctuation between 2008 and 2010 and 2011, respectively.
Table 8:
Average yearly value fluctuations of exports from Ghana to EU, 2000–2011, in EUR and
percent
Year Average yearly value fluctuation
2000–2007 - 4.1 million EUR - 0.10%
2008–2010 + 105.0 million EUR + 10.02%
2008–2011 + 379.2 million EUR + 28.11%

27
Between 2000 and 2007, the overall export value decreased by around 28.8 million EUR;
consequently, the average yearly decrease within this time period amounts to around 4.1
million EUR (0.10%). On the contrary, between 2008 and 2011 the overall increase of export
value adds up to around 1.5 billion EUR, making it an average yearly increase of nearly 379.2
million EUR (28.11%). However, as mentioned above, the largest increase stems from the
prediction of export value increase of 2011; since the data for this year are based on
calculations rather than on definite numbers (as in the sections before), I will go on to
calculate the average yearly fluctuation for the years 2008 to 2010 for which all definite data
are available.
Between 2000 and 2007, the overall export value decreased by about 28.8 million EUR,
leading to an average yearly decrease of 4.1 million EUR (0.10%) (see above). Between 2008
and 2010, the overall export value shows an increase of nearly 315.1 million EUR, making it
an average yearly increase of around 105.0 million EUR (10.02%).
Compared to the average yearly increase calculated between the years 2008 and 2011
amounting to almost 379.2 million EUR (28.11%), the average yearly increase of 105.0
million EUR (10.02%) between 2008 and 2010 is obviously much smaller. However,
compared to a decrease of 4.1 million EUR (0.10%) yearly between 2000 and 2007, I can
draw the hypothesis that the acute change of fluctuation is possibly due to the initialed IEPA
and the following DFQF market access for products from Ghana to the EU.
4.3 Hypothesis
In the previous sections, I analyzed the import and export data between the EU and Ivory
Coast, and the EU and Ghana. I gathered and compared nominal values of imports and
exports throughout the years 2000 to 2011. In order to obtain a more solid analysis result, I
calculated the average yearly fluctuations between 2000 and 2007, 2008 and 2010, as well as
2008 and 2011. As mentioned throughout the analysis part, the reason to calculate the values
for the years 2008 to 2010 and 2008 to 2011 separately is the following: the import and export
values for the year 2011 are based on a calculation done by adding the values for the first
quarter of the year, and multiplying it by four. Although this is a conventional measure to
predict data, it is not definite, and outcomes may vary. Hence, in order to validate the results
found for the years between 2008 and 2011, I calculated value fluctuations between 2008 and
2010 (for which all data are definite).
Table 9 below depicts the found results in order to obtain a clear overview.

28
Table 9:
Average yearly fluctuations of imports and exports between Ivory Coast and EU, and Ghana
and EU, 2000–2011
Average yearly fluctuations
2000–2007 2008–2010 2008–2011
Ivory Coast
Imports - 13.8 million EUR/
- 0.57%
+ 132.3 million
EUR/ + 9.17%
- 113.9 million
EUR/ - 5.35%
Exports + 96.4 million
EUR/ + 5.17%
+ 160.9 million
EUR/ + 5.87%
+ 212.5 million
EUR/ + 7.26%
Ghana
Imports + 59.6 million
EUR/ + 5.16%
+ 160.8 million
EUR/ + 9.62%
+ 246.3 million
EUR/ + 12.98%
Exports - 4.1 million EUR/ -
0.10%
+ 105.0 million
EUR/ +10.02%
+ 379.2 million
EUR/ +28.11%
After comparing the nominal values for each country and each section (‘imports’/‘exports’)
separately, I make the following observations:
The average yearly value of imports to Ivory Coast from the EU between the years 2000 to
2007 shows a decrease of around 13.8 million EUR (0.57%); the value for the years 2008 to
2010 sees a strong average yearly increase of about 132.3 million EUR (9.17%). However,
when I analyzed the data from 2008 to 2011, the average yearly value decreased by 113.9
million EUR (5.35%). This significant difference is due to the very strong predicted decrease
for the year 2011 (approximately 852.4 million EUR).
The assumption that the adoption of the IEPA between Ivory Coast and the EU would lead to
an increase in imports due to the (partial) liberalization of the market of Ivory Coast is not
supported by this analysis. However, since the large decrease of the yearly import value of
2011 is based on prognosis, an effect of the IEPA cannot be completely negated.
The analysis of the other three sections—exports of Ivory Coast, and imports and exports of
Ghana—does support the hypothesis of a positive effect of the IEPAs on import and export
value dimensions.
Firstly, the average yearly value of exports from Ivory Coast to the EU increases steadily:
From a yearly average increase of 96.4 million EUR (5.17%) between the years 2000 and

29
2007, to an average yearly increase of 160.9 million EUR (5.87%) between the years 2008
and 2010. The analysis of the data of the years 2008 to 2011 support this trend with an
increase of 212.5 million EUR (7.26%) in average yearly export value.
Secondly, I see a steady increase of average yearly import value of products coming from the
EU to Ghana. Between 2000 and 2007, the average yearly value of imports increased by 59.6
million EUR (5.16%). Between 2008 and 2010, the value increased yearly by 160.8 million
EUR (9.62%) at an average. This trend is again supported by the value of 246.3 million EUR
(12.98%) by which the value increased yearly between 2008 and 2011 (with predicted data).
Finally, the section on exports from Ghana to the EU further supports the claim that the IEPA
had an impact on the magnitude of export values. Whereas between the years 2000 and 2007
the average yearly value decreased by 4.1 million EUR (0.10%), the value increased by an
average yearly value of 105.0 million EUR (10.02%) between 2008 and 2010. Again, this
trend is backed up by a yearly average increase of export value of 379.2 million EUR
(28.11%) between 2008 and 2011.
Before drawing a final hypothesis, it is important to note that I assume an increased import
and export volume when I find increased import and export values. However, it is also
possible that the price per kilogram or per piece (depending on the product group) has risen.
Furthermore, it is crucial to mention alternative explanations for fluctuations (increase or
decrease) of import and export volumes.
First of all, regular economic fluctuations lead to the obtaining of changing data; as was made
clear in the sections above, there have been fluctuations between 2000 and 2007, hence,
before the adoption or initialization of the IEPAs. However, the increase as well as the
decrease was not remotely as strong as those found between 2008 and 2010, and 2008 and
2011.
Additionally, it is possible that the world financial crisis did have an influence on the
development of trade between the EU and Ivory Coast and Ghana respectively. Fewer
investments, reduction of jobs, the consequential re-organization of companies are only a few
factors that could have influenced trade flow.
However, the largest part of my analysis detects strongly increased average yearly nominal
import as well as export values; only in the case of imports to Ivory Coast, this is not
supported. Yet, the data on which a contrary claim could be based are merely predictions for
30
the year 2011; if only working with data until 2010, equally strong increases in average yearly
import value are found.
Hence, all in all, I can make the careful hypothesis that the adoption of the IEPA between the
EU and Ivory Coast, as well as the initialization of the IEPA between the EU and Ghana
influences the trade between the respective countries insofar as both import as well as export
volumes have increased and continue to increase.

31
5. CONCLUSION
In the previous sections of my thesis, I have worked towards answering the overall research
question:
“To what extent does the introduction of Interim Economic Partnership Agreements have an
impact on trade flow between the European Union and Ivory Coast and Ghana, respectively,
as intended”?
The first step was to find out what the initial goals were inherent in the (I)EPAs. As discussed
in the theoretical framework, an integral aim of the EPAs is to provide for enhanced market
access, which in turn leads to enhanced trade volume. This again is likely to cause economic
growth, and ultimately, furthers development in rather poor countries.
In order to find out whether trade between the EU and Ivory Coast and Ghana respectively
changed, I analyzed import and export data in the time period between 2000 and 2011. The
questions to be answered in this part were twofold:
1. “Did the import and export pattern and trend between the European Union and Ivory
Coast and Ghana, respectively, change after the Interim Economic Partnership
Agreements came into effect?”
2. “If yes, to what extent and in which direction did the changes occur?”
I found that indeed import and export data between the EU and the two countries changed
considerably. Comparing the time periods of 2000 to 2007, and 2008 to 2010, I can observe
that the average yearly trade volume increased in both countries in both directions (imports
and exports). When comparing the time periods 2000 to 2007, and 2008 to 2011, I can reach a
similar hypothesis. With the exception of imports from the EU to Ivory Coast, all data show
considerable increases in average yearly trade volume. Since the data for 2011 are based on a
prognosis rather than on definite results, and the remaining results overwhelmingly support
my hypothesis, I can still draw a relatively safe conclusion.
With regard to the first sub-question above, I can state that overall import and export data
between the EU and Ivory Coast and Ghana, respectively, have changed. With regard to the
second sub-item, I can hypothesize that changes have occurred to a rather significant extent,
showing high increases in average yearly trade volume between the parties.
Coming back to the overall research question

32
“To what extent does the introduction of Interim Economic Partnership Agreements have an
impact on trade flow between the European Union and Ivory Coast and Ghana, respectively,
as intended”?,
I state the following: It can be carefully hypothesized that the IEPAs have a rather
considerable impact on trade flow between the EU and Ivory Coast and Ghana, respectively,
as intended. As discussed above, the major aims of the EPAs are described as trade
liberalization and consequential increased trade volume. The results of the analysis confirm
this goal in large parts. However, it is crucial to mention that further research needs to be
undertaken in a few years’ time in order to support this hypothesis (or contradict it).
Furthermore, the finding does not prove that the introduction of the (I)EPAs is generally
beneficial to trade in the concerned countries, developing countries in particular. As discussed
in the theoretical framework, the newly negotiated EPAs implicate further problems,
especially in the long run. The major problems here are crucial institutional incapabilities
inherent in most developing countries, the threatening of regional integration, as well as the
expectation to lose a considerable amount of tariff revenues due to trade liberalization.
Research needs to be carried out with regard to these consequences; data analysis of trade
volume between respective regional economic communities such as ECOWAS would help to
ensure a rather insightful answer to the question whether the EPAs are beneficial to trade, and
subsequently to the development of poor and under-developed countries, especially in Africa.

33
6. REFERENCES
Anonymous (2010, December 7). Cote d’Ivoire expelled from Ecowas. Aljazeera. Retrieved
July 13th
, 2011, from Aljazeera Web site,
http://english.aljazeera.net/news/africa/2010/12/20101272090983941.html
Bilal, S., de Burgh, M., Rampa, F., & Van Hove, K. (2006). EPA development support:
consequences of GAERC conclusions for EPAs. ECDPM InBrief, 16A. Maastricht, European
Centre for Development Policy.
Bilal, S., & Rampa, F. (2006). Alternatives (to) EPAs: possible scenarios for the future ACP
trade relations with the EU. ECDPM Policy Management Report 11. Maastricht, European
Centre for Development Policy Management.
Bilal, S., & Stevens, C. (2009). The Interim Economic Partnership Agreements between the
EU and African States – Contents, challenges and prospects. European Centre for
Development Policy Management / Overseas Development Institute, Policy Management
Report 17.
Borrmann, A., & Busse, M. (2007). The Institutional Challenge of the ACP/EU Economic
Partnership Agreements. Development Policy Review, 25 (4), 403–416.
Borrmann, A., Busse, M., & Neuhaus, S. (2005). EU/ACP Economic Partnership
Agreements: Impact, Options and Prerequisites. Intereconomics, 40 (3), 169–176.
Borrmann, A., Großmann, H., & Koopmann, G. (2006). The WTO Compatibility of the
Economic Partnership Agreements between the EU and the ACP Countries. Intereconomics,
41 (2), 115–120.
Busse, M., Borrmann, A., & Großmann, H. (2004). The Impact of ACP/EU Economic
Partnership Agreements on ECOWAS Countries: An Empirical Analysis of the Trade and
Budget Effects. Hamburg Institute of International Economics.
Dihm, M. (2007). Why We Need Economic Partnership Agreements. Entwicklung und
Ländlicher Raum, 6, 12–13.
European Commission (2006a). External Trade EU – ACP. Retrieved August 5th
, 2011, from
European Commission Web site,
http://ec.europa.eu/trade/creating-opportunities/bilateral-relations/regions/africa-caribbean-
pacific/index_en.htm
European Commission (2006b). European Union to commit €22 billion in aid to Africa, the
Caribbean and the Pacific Islands. Press Release, Reference IP/06/710. Brussels, European
Commission.

34
European Commission (n.d.a). Economic partnerships – Negotiations. Retrieved August 6th
,
2011, from European Commission, Trade Web site,
http://ec.europa.eu/trade/wideragenda/development/economicpartnerships/negotiations/index_
en.htm
European Commission (n.d.b). Economic partnerships – Negotiations and agreements – The
ACP regions – West Africa. Retrieved August 6th
, 2011, from European Commission, Trade
Web site,
http://ec.europa.eu/trade/wider-agenda/development/economic-partnerships/negotiations-and-
agreements/#west-africa
European Commission (n.d.c). EU27 Trade since 1995 By SITC. Retrieved July 23rd
, 2011,
from European Commission, Eurostat Web site,
http://epp.eurostat.ec.europa.eu/portal/page/portal/external_trade/data/database
European Commission (2009). Fact sheet on the interim Economic Partnership Agreements –
West Africa: Ivory Coast and Ghana. Retrieved August 7th
, 2011, from European
Commission, Trade Web site,
http://trade.ec.europa.eu/doclib/docs/2009/january/tradoc_142191.pdf
European Parliament (2008). Draft Report on the development impact of Economic
Partnership Agreements (EPAs). Committee on Development, 2008/2170(INI). Brussels,
European Parliament.
Farrell, M. (2005). A Triumph of Realism over Idealism? Cooperation Between the European
Union and Africa. European Integration, 27 (3), 263–283.
Flint, A. (2009). The End of a ‘Special Relationship’? The New EU-ACP Economic
Partnership Agreements. Review of African Political Economy, 36 (119), 79–92.
Gavin, B. (2007). The EU-ACP Economic Partnership Agreements – What Impact on
Development?. Institute for International Integration Studies, Discussion Paper No. 224.
Goodison, P. (2007). EU trade policy and the future of Africa’s trade relationship with the
EU. Review of African Political Economy, 34 (112), 247–266.
Grosse Ruse-Khan, H. (2010). A Real Partnership for Development? Sustainable
Development as Treaty Objective in European Economic Partnership Agreements and
Beyond. Journal of International Economic Law, 13 (1), 139–180.
Mandelson, P. (2005). Address to the ACP-EU Joint Parliamentary Assembly. Bamako, Mali.
Mandelson, P. (2006). Economic Partnership Agreements can move ACP from dependency to
opportunity. Luxembourg: European Commission.

35
Shadish, W. R., Cook, T. D., & Campbell, D. T. (2002). Experimental and quasi-
experimental designs for generalized causal inference. Boston: Houghton Mifflin.
Stevens, C. (2005). Creating a development friendly EU trade policy. IDS Briefing Paper.
Brighton, Institute of Development Studies.
Stevens, C. (2006). The EU, Africa and Economic Partnership Agreements: unintended
consequences of policy leverage. Journal of Modern African Studies, 44 (3), 441–458.
Stevens, C., & Kennan, J. (2005). Assessment of the Proposed Reform of the Generalised
System of Preferences. Report Prepared for the European Parliament. Brighton, Institute of
Development Studies.
Ukpe, A. I. (2010). Will EPAs Foster the Integration of Africa Into World Trade?. Journal of
African Law, 54 (2), 212–231.
United Nations. (1987). Our Common Future – Report of the World Commission on
Environment and Development (UN Doc. A/42/427 – Annex (4 August 1987), chapter 2, I.).
New York: United Nations.