the economic outlook and monetary policy · the path of this recovery has been below past deep...
TRANSCRIPT

The Economic Outlook and Monetary Policy
May 24, 2016Rosemont, IL
David OppedahlSenior Business [email protected]

The path of this recovery has been below past deep recession recovery cycles
average annualized growth: 2.4%
average annualized growth: 5.3%
average annualized growth: 5.4%
95
100
105
110
115
120
125
130
135
140
95
100
105
110
115
120
125
130
135
140
-8 -6 -4 -2 0 2 4 6 8 10 12 14 16 18 20 22 24 26
Business cycle recovery pathindex - business cycle trough = 100
1981-82
2008-09
1974-75
quarters before trough quarters after trough
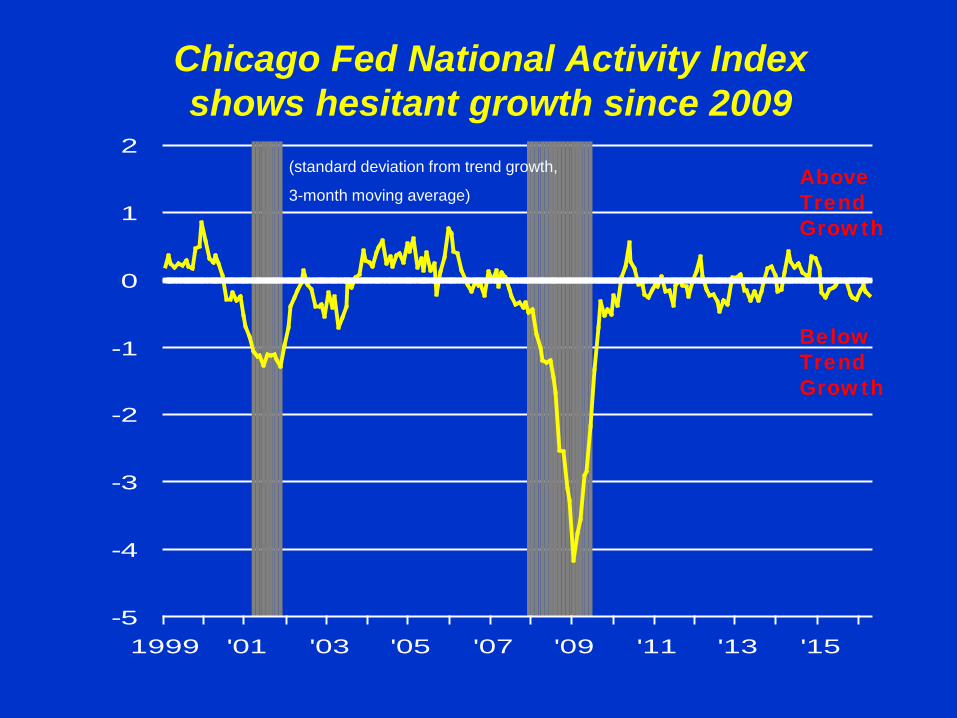
Chicago Fed National Activity Indexshows hesitant growth since 2009
-5
-4
-3
-2
-1
0
1
2
1999 '01 '03 '05 '07 '09 '11 '13 '15
AboveTrendGrowth
BelowTrendGrowth
(standard deviation from trend growth,
3-month moving average)
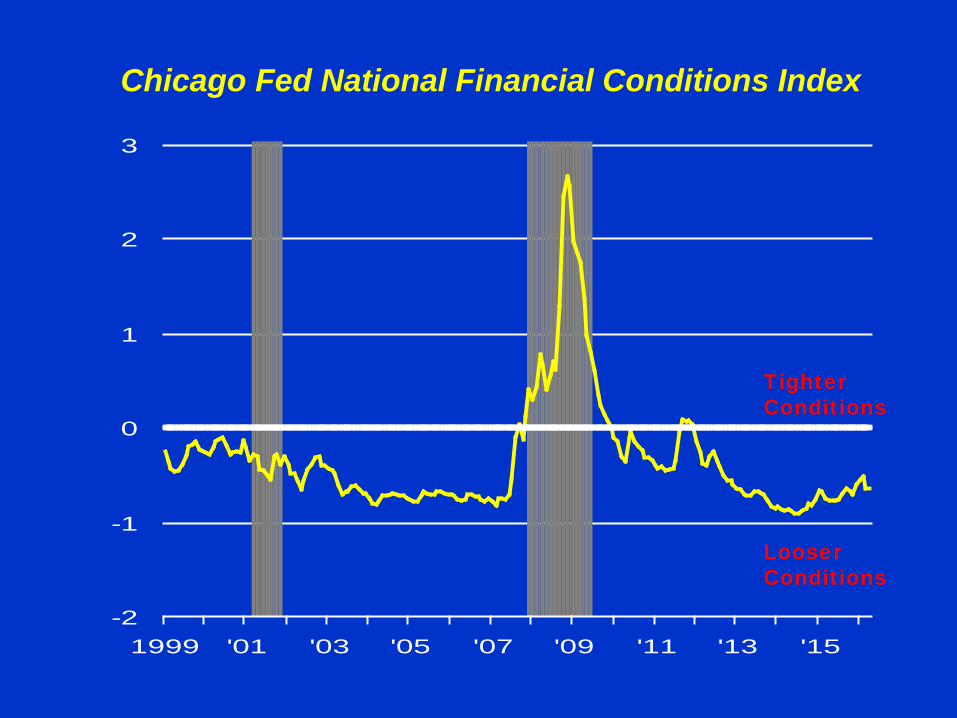
Chicago Fed National Financial Conditions Index
-2
-1
0
1
2
3
1999 '01 '03 '05 '07 '09 '11 '13 '15
TighterConditions
LooserConditions

In December 2015, the FOMC raised the Fed Funds rate target to a range from 0.25% to 0.50%
0
1
2
3
4
5
6
7
1999 '01 '03 '05 '07 '09 '11 '13 '15
Federal Funds Rate (effective),
Yields in percent per annum

Quantitative easing was necessary
0
500
1,000
1,500
2,000
2,500
3,000
3,500
4,000
4,500
Assets of the Federal ReserveBi l lions of dollars
Term Auction Credit
Securities Held Outright
Central Bank Swaps
Maiden Lane II & III
Commercial Paper Facility
2007 2008 2009
Term Asset-Backed SecuritiesLoan Facility
AIG Support
Maiden Lane
2010 2011 2012 2013 2014 2015
Recent Monetary Policy Actions
• Tapering of asset purchases began in December 2013
• No additional asset purchases after November 2014, while continuing to reinvest assets as they mature
• In December 2015, raised the range of the Fed Funds Rate by 0.25% points and indicated future increases would be gradual
• The FOMC will monitor economic conditions to tailor future actions to meet objectives of maximum employment and 2% inflation
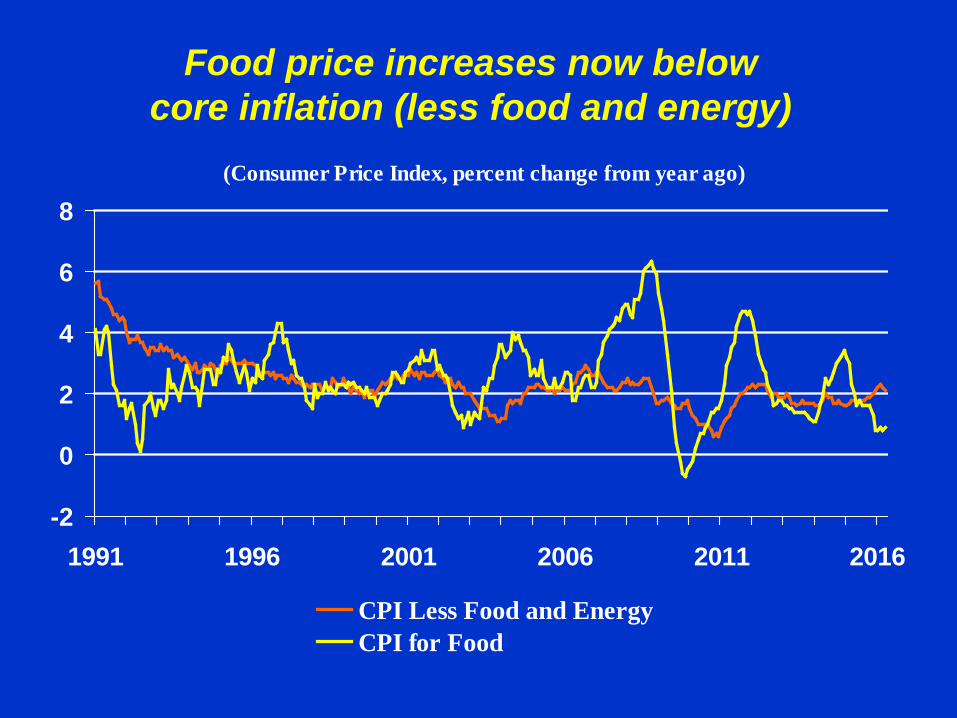
Food price increases now belowcore inflation (less food and energy)
(Consumer Price Index, percent change from year ago)
-2
0
2
4
6
8
1991 1996 2001 2006 2011 2016
CPI Less Food and EnergyCPI for Food

Oil prices plummeted and lowergas prices boosted consumer saving/spending
(2010 $/barrel)
0
50
100
150
1971 1976 1981 1986 1991 1996 2001 2006 2011 2016
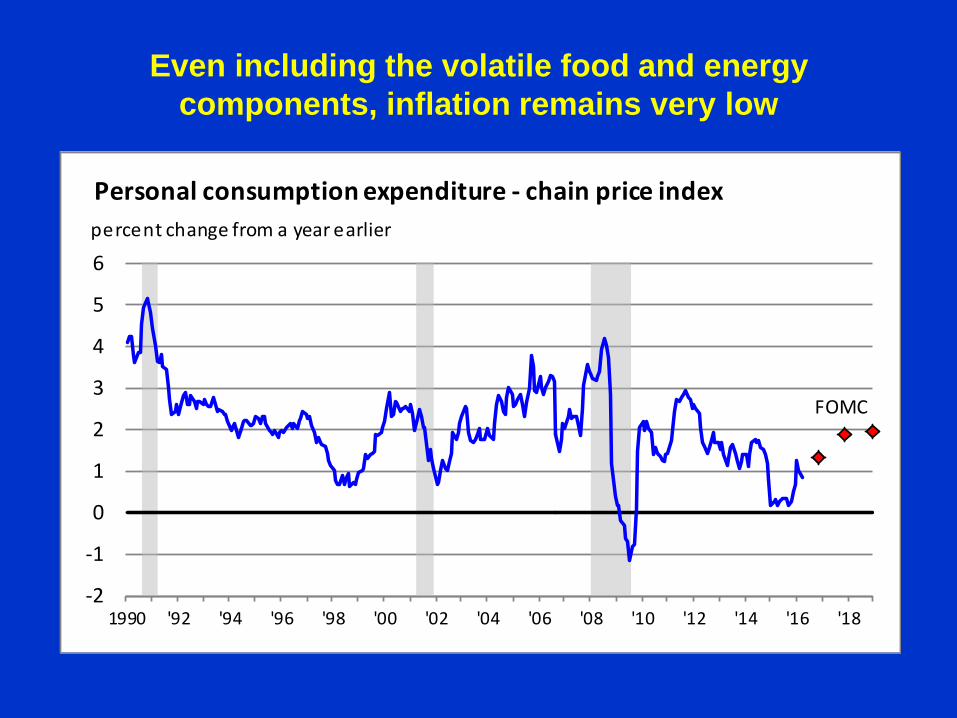
Even including the volatile food and energy components, inflation remains very low
-2
-1
0
1
2
3
4
5
6
1990 '92 '94 '96 '98 '00 '02 '04 '06 '08 '10 '12 '14 '16 '18
Personal consumption expenditure - chain price indexpercent change from a year earlier
FOMC

Employment grew by nearly 2.7 million jobsover the past year
-8
-6
-4
-2
0
2
4
6
1990'91 '92 '93 '94 '95 '96 '97 '98 '99 '00 '01 '02 '03 '04 '05 '06 '07 '08 '09 '10 '11 '12 '13 '14 '15 '16
Total employmentpercent
Monthly change (saar)
Percent change from a year earlier
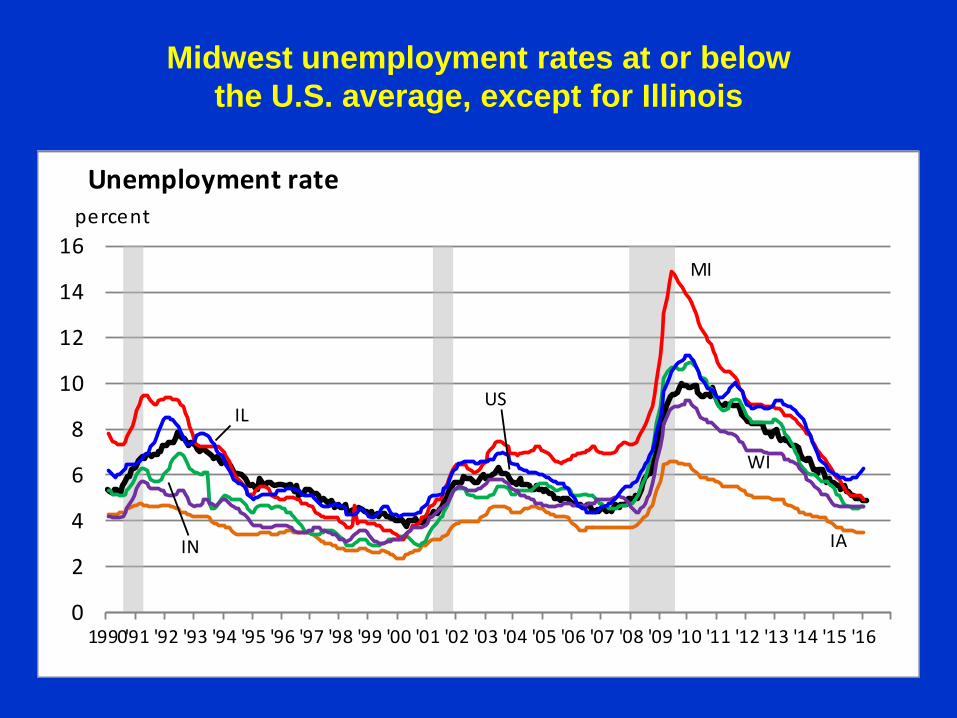
Midwest unemployment rates at or belowthe U.S. average, except for Illinois
0
2
4
6
8
10
12
14
16
1990'91 '92 '93 '94 '95 '96 '97 '98 '99 '00 '01 '02 '03 '04 '05 '06 '07 '08 '09 '10 '11 '12 '13 '14 '15 '16
MI
Unemployment ratepercent
USIL
IN IA
WI
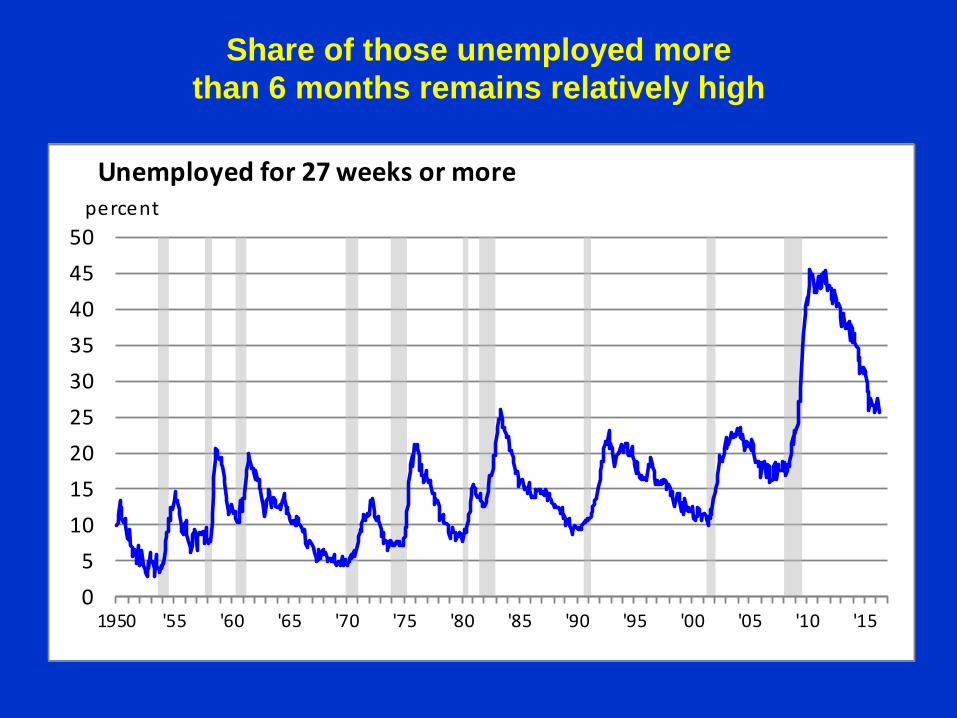
Share of those unemployed morethan 6 months remains relatively high
05
101520253035404550
1950 '55 '60 '65 '70 '75 '80 '85 '90 '95 '00 '05 '10 '15
Unemployed for 27 weeks or morepercent

Before edging up, the labor force participationrate fell to a level last seen in 1977
5859606162636465666768
1950 '55 '60 '65 '70 '75 '80 '85 '90 '95 '00 '05 '10 '15
Labor force participation ratepercent

Wages and benefit cost increases remain weak
0
1
2
3
4
5
6
7
8
1990'91 '92 '93 '94 '95 '96 '97 '98 '99 '00 '01 '02 '03 '04 '05 '06 '07 '08 '09 '10 '11 '12 '13 '14 '15 '16
Employment cost indexpercent change from year ago
benefit costs
wages and salaries
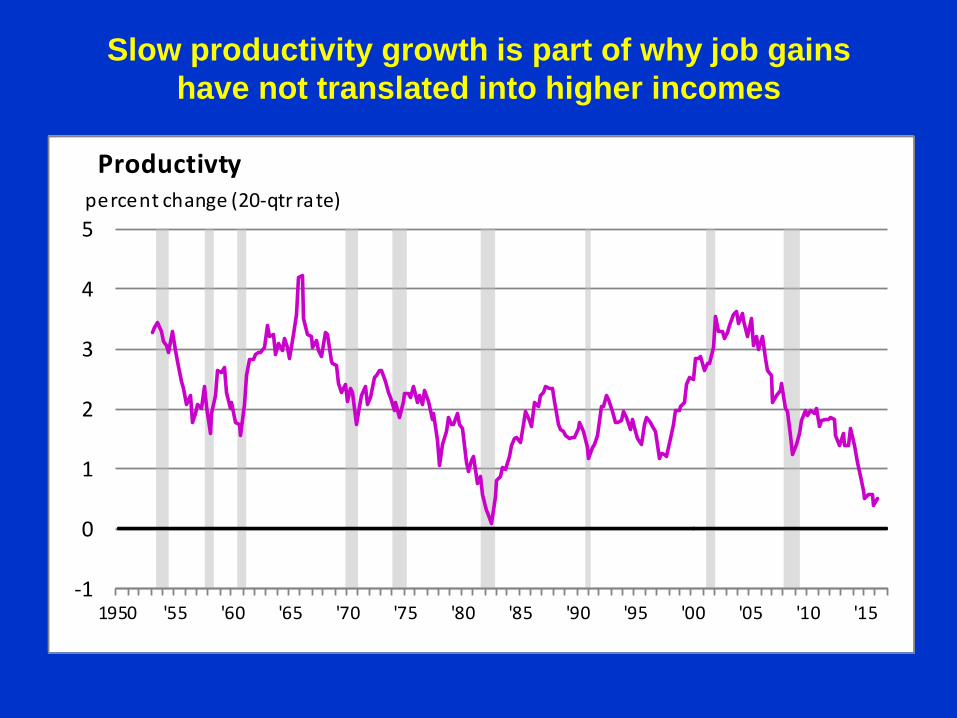
Slow productivity growth is part of why job gainshave not translated into higher incomes
-1
0
1
2
3
4
5
1950 '55 '60 '65 '70 '75 '80 '85 '90 '95 '00 '05 '10 '15
Productivtypercent change (20-qtr rate)
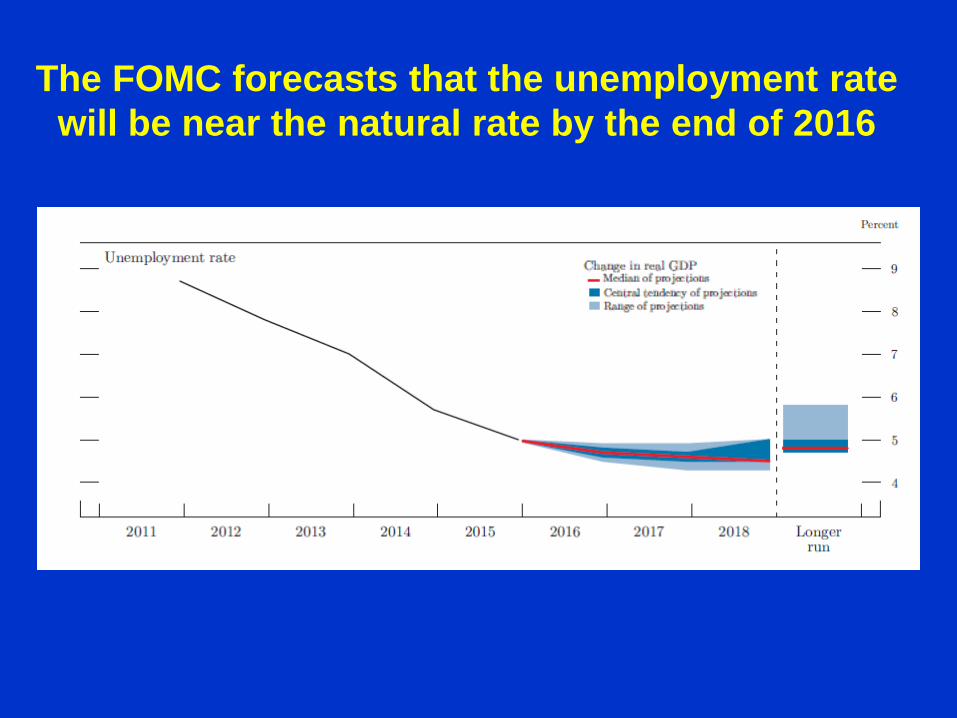
The FOMC forecasts that the unemployment ratewill be near the natural rate by the end of 2016
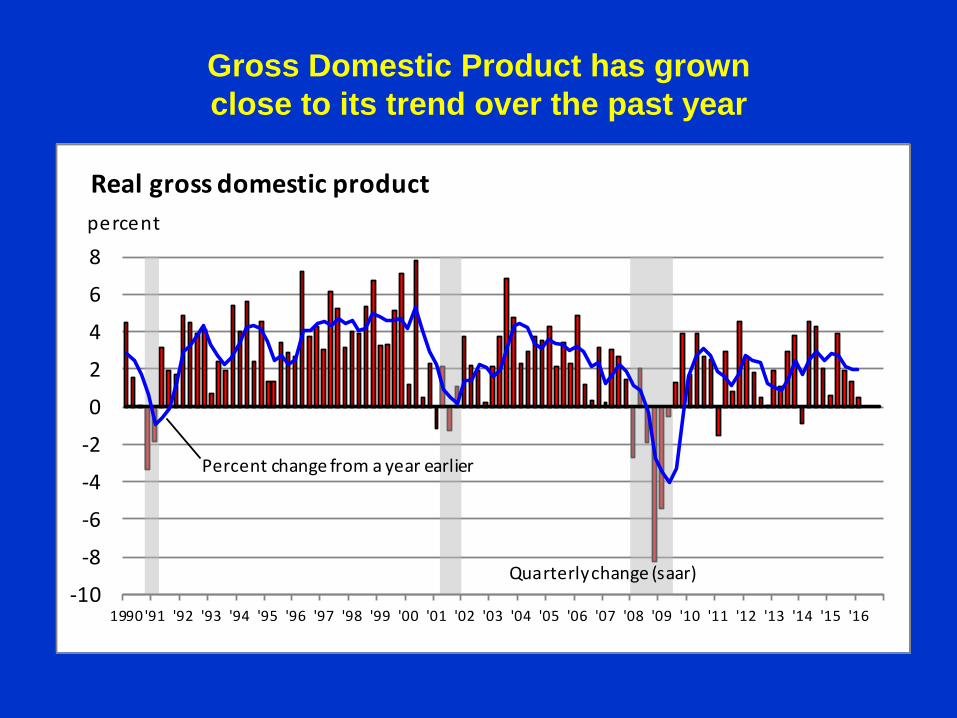
Gross Domestic Product has grownclose to its trend over the past year
-10
-8
-6
-4
-2
0
2
4
6
8
1990'91 '92 '93 '94 '95 '96 '97 '98 '99 '00 '01 '02 '03 '04 '05 '06 '07 '08 '09 '10 '11 '12 '13 '14 '15 '16
Real gross domestic productpercent
Quarterly change (saar)
Percent change from a year earlier
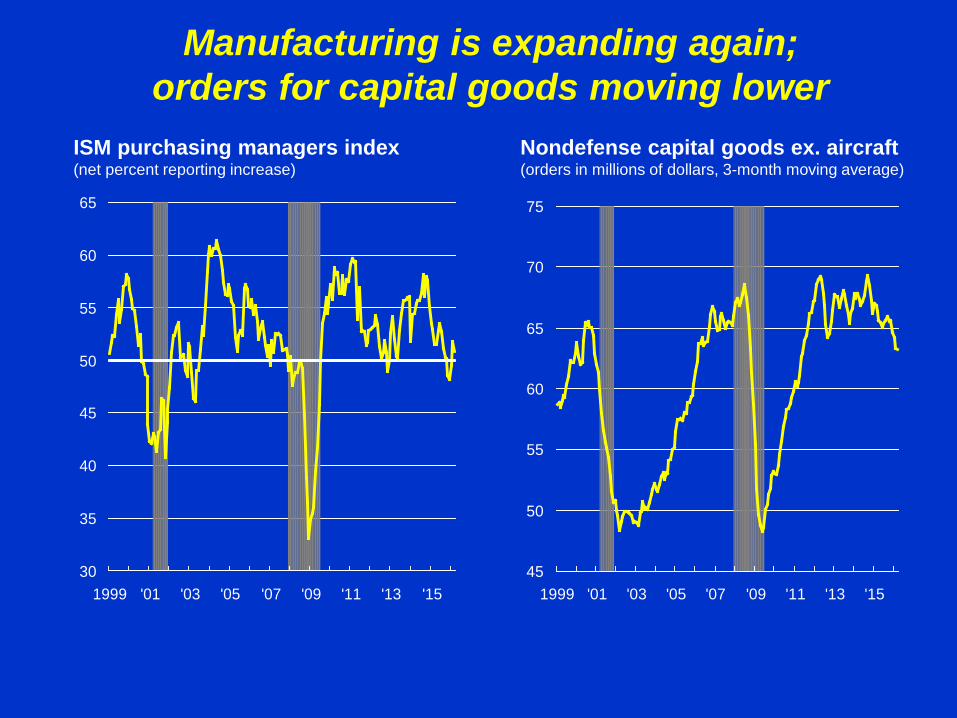
Manufacturing is expanding again;orders for capital goods moving lower
Nondefense capital goods ex. aircraft (orders in millions of dollars, 3-month moving average)
45
50
55
60
65
70
75
1999 '01 '03 '05 '07 '09 '11 '13 '1530
35
40
45
50
55
60
65
1999 '01 '03 '05 '07 '09 '11 '13 '15
ISM purchasing managers index(net percent reporting increase)
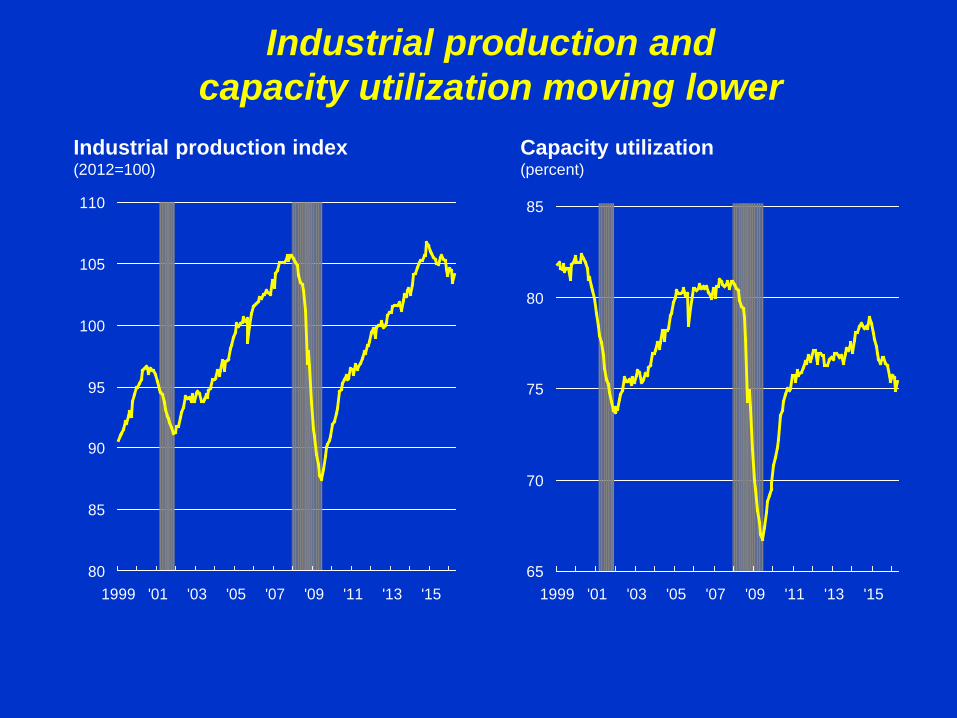
Industrial production andcapacity utilization moving lower
Capacity utilization (percent)
65
70
75
80
85
1999 '01 '03 '05 '07 '09 '11 '13 '1580
85
90
95
100
105
110
1999 '01 '03 '05 '07 '09 '11 '13 '15
Industrial production index(2012=100)

A broad-based recovery with vehicles, computers, primary metals, and machinery leading the way
-50 -25 0 25 50 75 100 125 150 175
ManufacturingDurable Goods
Wood ProductsNonmetallic Mineral Products
Primary MetalsFabricated Metal Products
MachineryComputer and Electronic Components
Electrical Eqpt, Appliances & ComponentsMotor Vehicles and Parts
Aerospace & Miscellaneous Transport EquipFurniture and Related Products
Miscellaneous Durable GoodsNondurable Manufacturing
Food, Beverages, and TobaccoTextile and Product Mills
Apparel and Leather GoodsPaper
Printing and Related Support ActivitiesChemicals
Petroleum and Coal ProductsPlastics and Rubber Products
Other Manufacturing
Industrial output: June 2009 - April 2016percent change
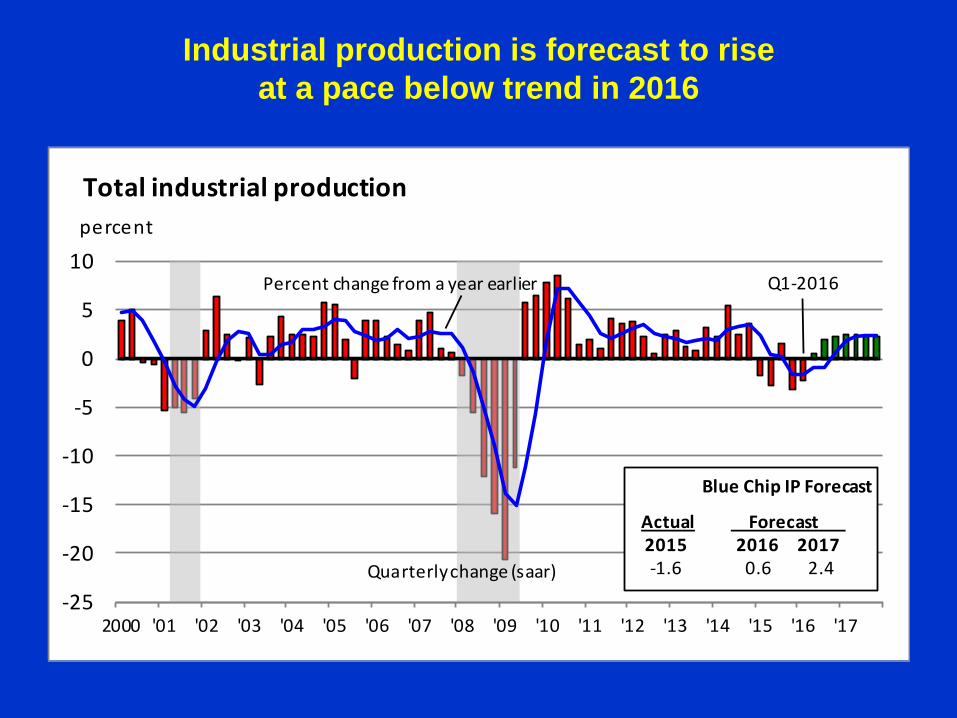
Industrial production is forecast to riseat a pace below trend in 2016
-25
-20
-15
-10
-5
0
5
10
2000 '01 '02 '03 '04 '05 '06 '07 '08 '09 '10 '11 '12 '13 '14 '15 '16 '17
Total industrial productionpercent
Quarterly change (saar)
Percent change from a year earlier Q1-2016
Blue Chip IP Forecast
Actual Forecast 2015 2016 2017-1.6 0.6 2.4
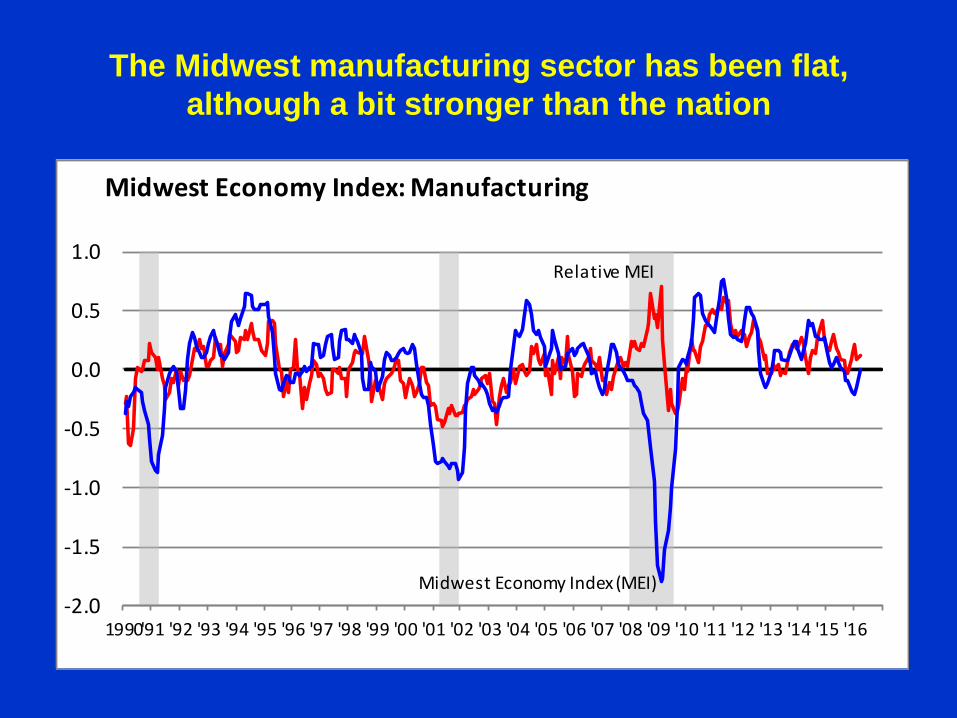
The Midwest manufacturing sector has been flat,although a bit stronger than the nation
-2.0
-1.5
-1.0
-0.5
0.0
0.5
1.0
1990'91 '92 '93 '94 '95 '96 '97 '98 '99 '00 '01 '02 '03 '04 '05 '06 '07 '08 '09 '10 '11 '12 '13 '14 '15 '16
Midwest Economy Index (MEI)
Midwest Economy Index: Manufacturing
Relative MEI

Housing market tanked and moving up from bottom
Housing starts (millions of units, 3-month moving average, SAAR)
0.5
1.0
1.5
2.0
2.5
1999 '01 '03 '05 '07 '09 '11 '13 '153
4
5
6
7
8
9
1999 '01 '03 '05 '07 '09 '11 '13 '15
Home mortgage rate(percent, effective rate for all loans closed)
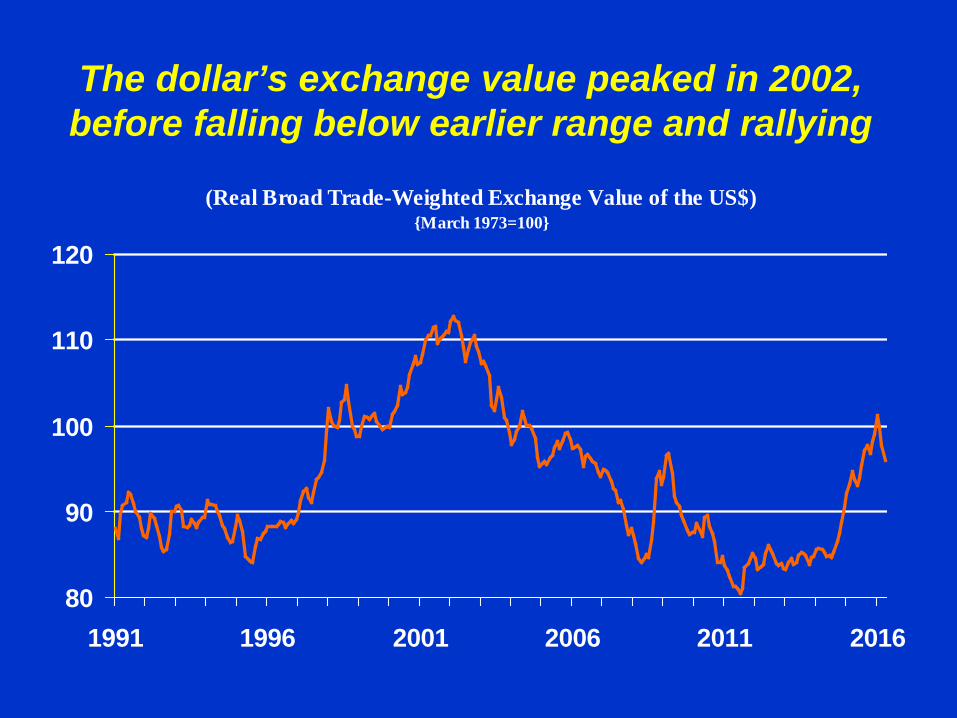
The dollar’s exchange value peaked in 2002, before falling below earlier range and rallying
(Real Broad Trade-Weighted Exchange Value of the US$){March 1973=100}
80
90
100
110
120
1991 1996 2001 2006 2011 2016

U.S. exports and imports decreased in 2015
0.0
0.5
1.0
1.5
2.0
2.5
3.0
1992 1995 1998 2001 2004 2007 2010 2013
trill
ion
$ Exports
Imports

The Federal Funds Rate is anticipated to remainbelow the neutral rate through the end of 2018

The FOMC expects GDP to grow nearits trend through 2018 and in the longer run
•The outlook is for the U.S. economy to expand at apace around trend through 2018
Summary
•Employment is expected to rise moderately with theunemployment rate edging lower
•Remaining slack in the economy keeps the inflation raterelatively low, rising toward 2%
•Growth in manufacturing output should resume•Housing turned the corner, but still has far to go•Net exports remain a wild card given world conditions

www.chicagofed.org