the economic impact of tourism on rotorua
TRANSCRIPT

The Economic Impact of Tourism on Rotorua
Geoff Butcher Butcher Partners Limited, PO Box 48 Tai Tapu, Canterbury
John R Fairweather Principal Research Officer in the
Agribusiness and Economics Research Unit, Lincoln University. [email protected]
David G Simmons Professor of Tourism, Human Sciences Division, Lincoln University.
February 2000
ISSN 1174-670X
Tourism Research and Education Centre (TREC) Report No. 17
Lincoln University


ii
Contents LIST OF TABLES vi ACKNOWLEDGEMENTS viii SUMMARY x CHAPTER 1 OVERVIEW OF THE ROTORUA ECONOMY AND THE IMPORTANCE OF TOURISM .................................................................. 1 1.1 Introduction ................................................................................................. 1 1.2 Report Structure........................................................................................... 2 1.3 Changes in Research Method During the Project........................................ 2 1.4 Employment in Rotorua District (1986-1998) ............................................ 3 1.5 Capital Growth and Infrastructure Demands............................................... 5 CHAPTER 2 THEORY AND RESEARCH METHOD ................................................... 7 2.1 Definitions ................................................................................................... 7 2.2 Principles of Multiplier Analysis ................................................................ 9 2.3 Generation of a Rotorua District Economic Model..................................... 9 2.4 Estimates of Multipliers for Tourism ........................................................ 11 2.5 Estimates of Direct and Total Impacts ...................................................... 11 2.6 Surveys ...................................................................................................... 12 2.7 Estimation of Employment : Output, Valued Added : Output and Household Income : Output Ratios..................................................... 14 CHAPTER 3 DIRECT TOURISM IMPACTS ............................................................... 15 3.1 Introduction ............................................................................................... 15 3.2 Direct Tourism Output .............................................................................. 15 3.3 Direct Employment in Tourism................................................................. 15 3.4 Direct Value Added in Tourism ................................................................ 18 3.5 Direct Household Income in Tourism ....................................................... 19 3.6 Conclusion................................................................................................. 19 CHAPTER 4 MULTIPLIERS AND TOTAL TOURISM IMPACTS ............................ 21 4.1 Survey Results ........................................................................................... 21 4.2 Estimates of Multipliers for Tourism ........................................................ 21 4.3 Comparison of Multipliers ........................................................................ 23 4.4 Changes in Multipliers Over Time ............................................................ 24 4.5 Trends in Multipliers Over Time............................................................... 26 CHAPTER 5 TOTAL IMPACTS OF TOURISM ON ROTORUA................................ 29 CHAPTER 6 CONCLUSIONS ....................................................................................... 31 REFERENCES .......................................................................................................... 35

iii

iv
APPENDIX 1 ANALYSIS OF VISITOR SURVEY EXPENDITURE DATA AND TOUR OPERATOR EXPENDITURE SURVEY .......................... 37 APPENDIX 2 ERROR MARGINS .................................................................................. 43


vi
List of Tables Table No. Page No. Summary of Economic Impacts of Tourism in Rotorua ...............................xi 1. Employment (Full-Time Equivalent)1 by Sector: 1998-1986........................4 2. Employment Changes by Sector: 1986-1998.................................................5 3. Business Survey Respondents by Sector .....................................................14 4. Tourism Industry Turnover/Output in Rotorua............................................16 5. Direct Employment, Value Added and Household Income in Rotorua
Tourism........................................................................................................18 6. Tourism Impacts and Multipliers in the Rotorua District............................22 7. Comparisons of Basic GRIT and Survey-Enhanced GRIT Impacts............23 8. Trends in Bay of Plenty Tourism Multipliers over Time ............................25 9. Trends in Other Bay of Plenty Employment and Output Multipliers
Over Time ....................................................................................................26 10. Summary of Economic Impacts of Tourism on Rotorua District ................30
A.1 Visitor Expenditure: $ per Person and Industry Distribution ......................38 A.2 Visitor origin and Expected Stay in Rotorua ............................................... 39 A.3 Time of Sampling for the Lake Front/City Survey ...................................... 40
A.4 Employment Error Margins .........................................................................45 A.5 Output Error Margins...................................................................................45 A.6 Value-Added Error Margins ........................................................................45

vii

viii
Acknowledgements The research project was multi-disciplinary and many relevant issues were raised and suggestions made by colleagues in other disciplines, particularly Chrys Horn, Kevin Moore and Vicky Johnston. This kind of research can only be carried out if those in the tourism industry, the general business sector, and the District Council provide comprehensive information, and we would like to thank those who assisted for their information and time. We hope that this report will lead to greater public understanding of the role of tourism in the District economy, and that this in turn will help the industry and thus in some measure repay respondents for their assistance. This research was funded by the Foundation for Research, Science and Technology; Output 8 Tourism. This report forms part of a series of seven constituent reports on Tourism in Rotorua, which in turn is one of four case studies in the programme ‘Improved Management of Tourist Flows and Effects’ (Contracts: LIN 504, 602, 803). The support of Air New Zealand with discounted air travel in this Rotorua case study is also acknowledged.

ix

x
Summary Approximately 3,500 persons (Full-Time Equivalent - FTE) are employed directly in tourism in the Rotorua District. While approximately 5,700 people in the District work in businesses which are wholly or partly tourism based, this figure is adjusted down to 3,500 FTE to reflect the part-time and seasonal nature of the work, and the fact that many businesses sell only part of their turnover to tourists. Every job in tourism leads, on average, to a further 0.39 jobs elsewhere in the District economy. This flow-on effect is moderate, and reflects both the limited manufacturing base of the District, but this is offset by the very low demand for external inputs in some businesses (particularly in the Visitor Attractions Sector)1. However, the flow-on effect is almost twice as great as was the case in Kaikoura, and this reflects the more diverse range of manufacturing and much more diverse range of business support services in Rotorua. The flow-on employment effects of 1400 FTE mean that in total some 4,900 FTE jobs are generated in the District by tourism. This excludes any jobs in social services (such as teaching) that might be lost if tourism (and hence employment) declined, and people emigrated from the District. Total employment in Rotorua District is believed to be around 27,000 Full-Time Equivalent jobs (FTEs). Hence almost 18 per cent of all jobs in the District depend either directly or indirectly on tourism. Total direct spending by tourists is estimated to be $310 million per year. Flow-on effects of visitor spending increase total visitor-dependent spending (sales) in the District to an estimated $463 million. The direct spending figure is based on the Statistics New Zealand census of output of accommodation businesses, and a survey of patterns of visitor expenditure (allowing us to estimate total expenditure in other sectors on the basis of expenditure on those goods and services relative to expenditure on accommodation). An alternative measure of direct visitor spend could be generated by surveying visitors to find out the level of spend per visitor-day, and rating this up by total number of visitors to the town centre. While two visitor expenditure surveys were undertaken at different sites within the District, the figures were inconsistent between the two surveys ($178 per person and $104 respectively), and were not used. In addition, there is considerable uncertainty as to the exact number of overnight and day visits to Rotorua by domestic visitors. Use of average visitor spending per day across New Zealand as proxies for spending in Rotorua, and use of existing estimates of visitor numbers to Rotorua are both likely to give rise to high error margins. Nonetheless, an estimate was made on this basis and gave a remarkably similar figure ($303 million) to the estimates described above.
1 ‘Attractions’ is a generic term which is used here to include visitor attractions (e.g., Rainbow Springs), and
visitor activities (e.g., fishing, guiding).
xi
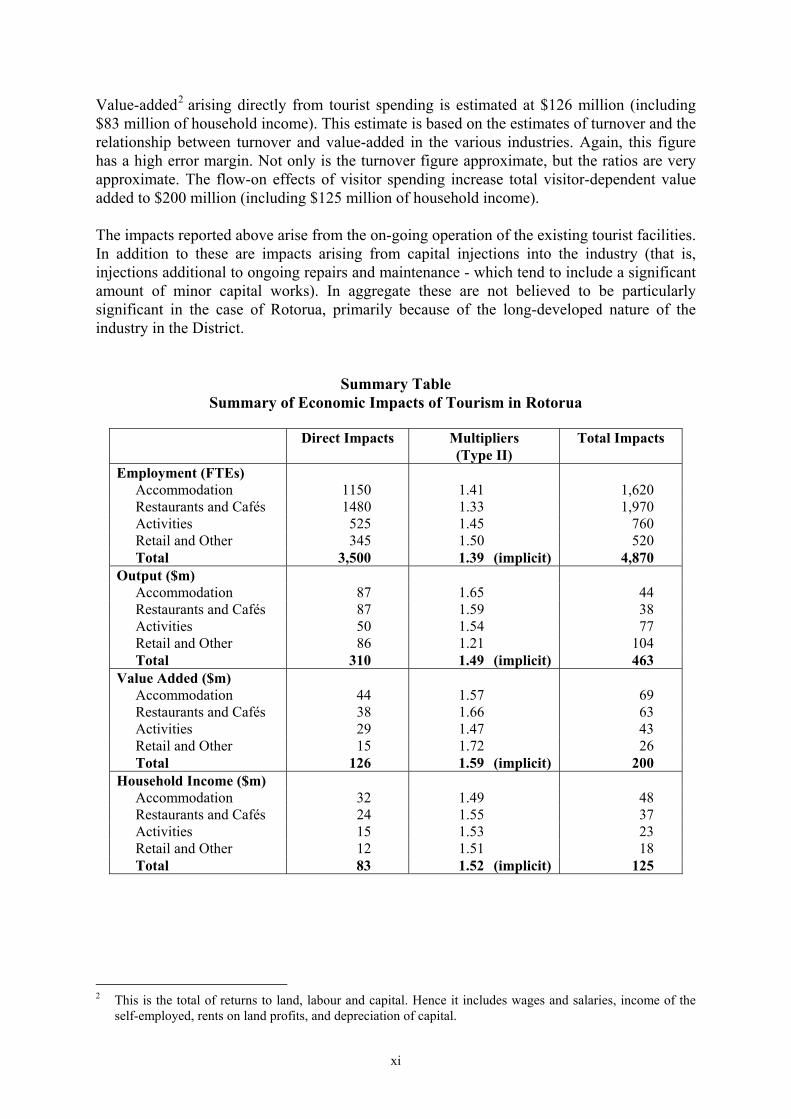
Value-added2 arising directly from tourist spending is estimated at $126 million (including $83 million of household income). This estimate is based on the estimates of turnover and the relationship between turnover and value-added in the various industries. Again, this figure has a high error margin. Not only is the turnover figure approximate, but the ratios are very approximate. The flow-on effects of visitor spending increase total visitor-dependent value added to $200 million (including $125 million of household income). The impacts reported above arise from the on-going operation of the existing tourist facilities. In addition to these are impacts arising from capital injections into the industry (that is, injections additional to ongoing repairs and maintenance - which tend to include a significant amount of minor capital works). In aggregate these are not believed to be particularly significant in the case of Rotorua, primarily because of the long-developed nature of the industry in the District.
Summary Table Summary of Economic Impacts of Tourism in Rotorua
Direct Impacts Multipliers
(Type II) Total Impacts
Employment (FTEs) Accommodation 1150 1.41 1,620 Restaurants and Cafés 1480 1.33 1,970 Activities 525 1.45 760 Retail and Other 345 1.50 520 Total 3,500 1.39 (implicit) 4,870 Output ($m) Accommodation 87 1.65 44 Restaurants and Cafés 87 1.59 38 Activities 50 1.54 77 Retail and Other 86 1.21 104 Total 310 1.49 (implicit) 463 Value Added ($m) Accommodation 44 1.57 69 Restaurants and Cafés 38 1.66 63 Activities 29 1.47 43 Retail and Other 15 1.72 26 Total 126 1.59 (implicit) 200 Household Income ($m) Accommodation 32 1.49 48 Restaurants and Cafés 24 1.55 37 Activities 15 1.53 23 Retail and Other 12 1.51 18 Total 83 1.52 (implicit) 125
2 This is the total of returns to land, labour and capital. Hence it includes wages and salaries, income of the
self-employed, rents on land profits, and depreciation of capital.

xii
Significant investments in the city centre by the Council have been appreciated by the visitors and tourism operators, and have led to an improved visitor perception. However, there is no way to establish how many additional visitors have been attracted to Rotorua as a result. Operators did not identify other areas where further physical investment by Council was needed, although a number believed that the Council's significant investment in tourism marketing was essential for the industry to grow in Rotorua. There was widespread acknowledgement of the "free-rider" problem associated with advertising, and the need for some kind of collective marketing. As reported above, tourism has significant linkages to the rest of the economy, and every direct job in tourism generates a further 0.39 jobs elsewhere in the District economy. However, the links are limited particularly by the lack of manufacturing activity in the District. Only 1.6 per cent of total District employment is in food manufacturing and 5.6 per cent in all other non-forestry manufacturing. Comparable figures for New Zealand are 3.8 per cent and 8.7 per cent. In total, tourism is responsible for around 5,000 jobs (Full-Time Equivalent). In spite of being the main source of employment in Rotorua District and of having flow-on effects which are almost twice as great as those of Kaikoura (where a direct job in tourism supported only 0.21 jobs elsewhere), only 20 per cent of the Rotorua economy depends directly or indirectly on tourism, whereas in Kaikoura the figure was 30 per cent. Clearly Rotorua is less vulnerable to tourism volatility than is Kaikoura. A very large proportion of those employed in tourism activities had been previously employed in other jobs in Rotorua. Hence in Rotorua tourism is very much a generator of jobs for local people. By contrast, a significant proportion of those employed in Kaikoura tourism had come from out of the District. The reason may lie partly in the fact that Rotorua has a long tourism history, whereas Kaikoura has had rapid tourism growth and had to get additional labour rapidly. In the Bay of Plenty, tourism multipliers appear to have been steadily declining over the last decade or more, reflecting the concentration of industry in fewer centres. The implication is that tourism is not the same "engine for growth" that it was, and also the justification for local government support for tourism because of the flow-on effects is slowly weakening.


1
Chapter 1
Overview of the Rotorua Economy and the Importance of Tourism
1.1 Introduction
In recent years tourism has been one of the fastest growing sectors of the New Zealand economy, and has become particularly important in some of the smaller communities. What is uncertain is just how important the industry is, both in terms of its direct impacts and also its indirect impacts3. The objective of this study was to estimate the relationship between such direct and indirect effects by surveying a sample of tourism businesses to find out their expenditure patterns, to incorporate this information into a model of the regional economy and calculate tourism multipliers (the ratio of direct impacts to total impacts for various types of visitor expenditure), and to see if this ratio is changing over time. A declining trend in the value of multipliers would suggest that in future, tourism is likely to have smaller flow-on effects than in the past, and this in turn suggests that tourism will be less of a panacea for declines in other industries. The current "multipliers" were to be applied to existing estimates of tourist direct expenditures to get total economic impacts of tourism. During the research it became apparent that the existing estimates of direct visitor expenditure were unreliable (particularly estimates broken down by type of expenditure) and a better measurement of the level of direct expenditure became a further objective of the research. Regional economic models can be generated using a national production function and modifying the input coefficients to reflect average regional self-sufficiency in the various input industries. This approach assumes that input structures for a given industry are the same in different regions. By contrast, survey-based analysis establishes the input structure of the industries in question (in this case, tourism industries) in the particular region. The final research method was to see whether the two approaches lead to significantly different multipliers, and hence to provide some information as to whether there are significant gains in reliability and understanding in undertaking the tourist industry survey work (which is time-consuming, expensive, and fraught with data-gathering problems because of confidentiality issues).
3 These indirect impacts arise from the spending by "tourist" businesses and their employees at other
businesses . For example, a boating company buys fuel, and hotel employees buy groceries for personal consumption

2
1.2 Report Structure
Chapter 1 of this report discusses the objectives of this study and outlines the place of tourism in the Rotorua District economy. Chapter 2 describes the research methods used to estimate the significance of tourism, and describes the various surveys undertaken in this research project. Chapter 3 reports our estimates of direct tourism impacts and Chapter 4 reports on the multipliers derived for Rotorua tourism and hence the indirect impacts of tourism on the Rotorua economy. The chapter also compares the value of multipliers estimated as part of this research project with multipliers generated by much simpler methods, and comments on changes in multipliers during the last ten years. Chapter 5 brings the earlier results together to estimate total impacts of tourism on the Rotorua economy, and reports our conclusions regarding the other research questions. 1.3 Changes in Research Method During the Project
It was originally expected that estimates of direct visitor expenditure would come from existing surveys of domestic and international visitor spending4, but as the research progressed it became apparent that the international visitor survey (IVS) data, representing only broad average per day expenditure across the country as it does, is not particularly accurate as regards any particular region. The number of respondents involved in the pilot survey for the domestic travel monitor (DTM) undertaken in 1998 was so small that the number of respondents who have actually been to the region being studied was very small5, and hence the behaviour of the sample is an unreliable guide to the behaviour of the visitor population as a whole. In the light of these data shortcomings, it became necessary to calculate the direct expenditure by a survey of visitors to Rotorua6 to establish relative rates of expenditure in different sectors, and to apply these ratios to existing data on output of the accommodation industry7. An estimate of direct employment in the visitor attractions industry was made on the basis of this project's census of businesses involved in visitor activities and attractions. This was used with this project's estimates of employment : output ratios to also calculate output for the attractions industry.
4 Statistics New Zealand (1999c), Simmons, D.G., Fairweather, J.R., and Forer, P. (1997) 5 A project currently underway ("Domestic Tourism Monitor 1999" - Undertaken by Forsyte Research for
Foundation for Research Science and Technology) includes surveys of 17,000 households over the course of one year. Results are expected in early 2000.
6 See Moore, K., Simmons, D.G., and Fairweather, J.R. (1998) 7 Statistics New Zealand (1999b)

3
1.4 Employment in Rotorua District (1986-1998)
The 1996 census reveals that in that year total employment in Rotorua District was around 24,800 people. A breakdown by sector (see Table 1, page ??) shows that the major sources of employment were agriculture, forestry, wood and paper products manufacturing, and various services industries (which incorporate the various aspects of tourism). During the last twelve years the structure of employment in Rotorua District has changed significantly. There was a huge (16%) decline in total employment from 1986 to 1991, but by 1998 employment numbers had recovered to around six per cent above 1986 levels. However, over the period there have been significant declines in numbers employed (see Table 2) in agriculture (-13%), wood and paper manufacturing (- 30%), all other manufacturing except food (-39%), utilities (- 40%), construction (- 31%) and communications (- 62%)8. The decline in these industries has been accompanied by rapid growth in forest planting, tending and management (+ 53%) and most industries associated with tourism including retail trade (+ 12%), restaurants (+ 40%) and recreational activities (+ 65%). Interestingly, there appears to have been a four per cent decline in the number of FTE jobs in accommodation (a 2% fall from 1986 - 1996). This is consistent with national figures where employment in accommodation declined by four per cent between 1986 and 1996. It has not been possible to determine accurately the number of people from the "declining" industries who have taken up jobs in tourism. However, in the employment survey of the activity sector, respondents were asked about where they had worked in their previous jobs, and the vast majority had come from Rotorua rather than from elsewhere in New Zealand. This suggests that tourism has been important in providing alternative employment for those displaced from other industries.
8 The percentages given overstate the actual case somewhat because of the rise in employment in
"unidentified" industries.

4
Table 1 Employment (Full-Time Equivalent)1 by Sector: 1998-1986
Business Survey2
Census Data and Census Base (1998) Sector 1996-1998
% Change 19983 1996 1991 1986
Agriculture - 1,659 4 1,659 1,680 1,917 Forestry + 25 2,070 1,092 783 1,350 Fishing, hunting and mining - 60 4 60 39 54 Food manufacture + 20 475 396 414 420 Wood and paper products + 3 1,250 1,221 1,098 1,779 All other manufacturing - 8 1,340 1,452 1,284 2,181 Electricity, gas and water + 19 140 117 189 234 Construction - 6 1,400 1,485 1,359 2,022 Wholesale and retail trade + 7 4,190 3,921 3,534 3,735 Restaurants + 5 905 864 615 648 Accommodation - 3 1,165 1,197 1,002 1,218 Transport + 15 910 789 666 918 Communications + 19 300 252 393 792 Business and professional services
- 4 1,930 2,019 2,022 1,731
Recreation and cultural services + 29 950 738 528 576 Health and education + 4 4,695 3,543 3,429 3,324 All other services + 11 2,740 2,463 2,202 2,073 Not identified - 1,527 4 1,527 0 198 Total FTEs 26,706 24,795 21,237 25,170 % change + 7.7% + 16% - 16%
Notes: 1. Measured as full-time plus half of part-time, as at the census date (march of the various years). The
number of persons employed in tourism at census date is between the seasonal maximum and minimum for tourism activities. Hence the census figures are likely to represent a reasonable annual average.
2. Statistics New Zealand (1998). 3. The 1998 figures apply the percentage change in the business survey figures from 1996 - 1998 to
the 1996 census figures. Hence all data are on a comparable base. Some of the business survey figures differ significantly from the census figures.
4. No data on percentage change available from business survey. Zero change assumed.

5
Table 2 Employment Changes by Sector: 1986-1998
Percentage of
Total Changes from 1986-1998
Sector 1998 1986 Number
(FTE) %
of base year1
% Share of Total District Employment2
Agriculture 6.2 7.6 -258 -13 -1.4 Forestry 7.8 5.4 720 53 2.4 Fishing, hunting and mining 0.2 0.2 6 11 0.0 Food manufacture 1.8 1.7 55 13 0.1 Wood and paper products 4.7 7.1 -529 -30 -2.4 All other manufacturing 5.0 8.7 -841 -39 -3.6 Electricity, gas and water 0.5 0.9 -94 -40 -0.4 Construction 5.2 8.0 -622 -31 -2.8 Wholesale and retail trade 15.7 14.8 455 12 0.9 Restaurants 3.4 2.6 257 40 0.8 Accommodation 4.4 4.8 -53 -4 -0.5 Transport 3.4 3.6 -8 -1 -0.2 Communications 1.1 3.1 -492 -62 -2.0 Business and professional services
7.2 6.9 199 11 0.3
Recreation and cultural services 3.6 2.3 374 65 1.3 Health and education 13.8 13.2 371 11 0.6 All other services 10.3 8.2 667 32 2.0 Not identified 5.7 0.8 - - - Total 100.0 100.0 1,536 +6
Notes: 1. Change a percentage of employment in industry in 1986 (refer Table 1) 2. Calculated as Column 1 minus Column 2 1.5 Capital Growth and Infrastructure Demands
Tourism has a long tradition in Rotorua, and one could expect there to be a lower level of annual investment in Rotorua than in places like Kaikoura where tourism is growing rapidly and the capital base is being expanded. While there is, in Rotorua, on-going development of accommodation (both upgrading and expansion), and an extensive city and lake front development programme by the Council, the activity is not of the same relative significance as that in a newly-developing centre like Kaikoura. Tourism operators were asked whether they perceived any limits to tourism industry growth, and whether there was any need for government (local or central) spending. There was a general belief that there was no physical impediment to the development of the tourism industry, and nobody mentioned deficiencies in civic infrastructure (sewage treatment and water for example) as a problem, although this perhaps reflected the major investment recently by the Council in redeveloping the city centre and the lake front. Many operators stated that this redevelopment had been much appreciated by visitors, many of whom commented favourably on the current feel of the city centre, or who compared the environment very favourably with previous visits.

6
7
Chapter 2
Theory and Research Method This chapter contains definitions of terms used in this report, a summary of the way in which regional economic tables were developed and multipliers were calculated, and details of the surveys undertaken to get the data necessary to build an improved tourism industry structure into the Rotorua District economic model, and to estimate direct expenditure by visitors. The section on the theory of economic impact models is brief, and assumes the reader has some prior understanding. Those who wish to know more should consult one of the numerous texts on the subject9. 2.1 Definitions
Employment Employment is work done by employees and self-employed persons, and is measured in Full-Time-Equivalent jobs (FTEs). A person working part-time all year is deemed to be equivalent to 0.5 FTEs. Where it was apparent that the part-time work was quite limited, and information was available on the approximate hours worked per week, the FTEs of a part-time job were based on 35 hours per week per FTE. Hence 10 hours per week is 0.3 FTEs. Where work is seasonal, the conversion to FTEs is based on 12 months work per year. So a seasonal worker working full-time for six months per year is 0.5 FTEs, and a part-time seasonal worker working ten hours per week for four months is 0.1 FTEs. Output Output is the value of sales by a business. In the case of wholesale and retail trade, it is the total value of turnover (and not simply gross margins)10. Value-Added Value added includes household income (wages and salaries and self-employed income), and returns to capital (including interest, depreciation and profits). It also includes all direct and indirect taxes . Household Income Household income is the gross income of households. It includes the income of self-employed persons. There is sometimes considerable uncertainty as to the proportion of business income which goes to households, especially for small businesses. In assessing this proportion, dividends and interest payments to local householders have been excluded.
9 For example, Richardson et al., (1972); Jensen & West (1982), Butcher (1985). 10 Care has to be taken in combining retail sales figures with employment per $million of output from input -
output tables. In these tables, output is generally defined as gross margin. By contrast, business statistics figures usually give employment per $million of turnover.

8
Conceptually they should be included, but it is difficult to be clear what proportions of these items have gone to local households. When estimating indirect economic impacts, one needs to know the increase in household income which occurs in the region and how it will be spent. Where owners of business capital live out of the District, dividends and interest do not form part of the District household income. Even where the owners do live in the District, profits which are not used for household spending do not lead to economic impacts11. Direct Economic Impacts The direct impact arises from the initial spending by visitors on the goods and services they want to consume. The direct employment is of people who produce and sell goods and services directly to tourists. The direct output is the value of purchases made by tourists. The direct value added is the value added in those businesses which sell directly to tourists. Indirect Economic Impacts Indirect impacts arise from increased spending by businesses as they buy additional inputs so that they can increase production to meet visitor demand. This indirect effect can be envisaged as an expanding ripple effect. A tourist buys food and drink at a cafe. The cafe has to employ more staff and buy more bread, so the bakery output expands. The bakery has to employ more staff and buy more electricity, so the power company increases its output. The power company has to increase its maintenance, so it employs another person and spends more on a vehicle for that person. All the increased employment, output and value added (apart from that at the cafe) is the indirect effect. Note that indirect effects only include "upstream" effects (via buying more inputs), but do not include any stimulated development downstream. So although an expansion of "tourism activities" may lead to more tourists and hence an expansion of accommodation, the extra accommodation is not included as a flow-on effect of the activity, and hence is not included in the multiplier. Induced Economic Impact The induced impact is the result of increased household income being spent, and leading to a further ripple effect of increased employment, output and income. Flow-on Effects/Upstream Impacts The sum of indirect and induced effects are sometimes termed the flow-on effects, or upstream impacts. Down Stream Impacts Impacts which are not driven by an activity's demand for extra inputs, but which might arise as a result of a particular activity, are sometimes called the "downstream impacts". An example in Rotorua tourism would be where the development of the gondola led to people staying longer and hence to an increased demand by visitors for accommodation and food. The accommodation and food is not an input into the gondola, and hence is not an indirect or induced effect of the gondola. It is a downstream effect.
11 Profits may be invested back into the District, but the impacts of this investment are excluded on the
grounds that the investment could be financed by borrowing and hence is not dependent on the earlier profits.

9
Total Economic Impacts The total Type I impact is the sum of the direct and indirect impacts, and a Type II impact is the sum of direct, indirect and induced impacts. Multipliers A Type I multiplier is the ratio of (direct + indirect) impacts to direct impacts, and a Type II multiplier is the ratio of (direct + indirect + induced) impacts to direct impacts. The Type II multipliers include the impact of household spending and hence will always be greater than a Type I multiplier. Both multipliers will always be greater than 1. Note that downstream effects (whether positive or negative) are not included in the multiplier, and must be calculated separately. 2.2 Principles of Multiplier Analysis
When visitors spend money on various services and goods, this generates direct employment, output, and value added. The businesses which sell to tourists use part of the money received to purchase goods and services from other local businesses, which as a result purchase more inputs than they otherwise would. These "business support" effects are generally termed "indirect" effects. To find out the scale of the indirect effects, one must examine the expenditure patterns of the tourism businesses. What do they buy, and from where do they buy it (in the Rotorua District or out of the Rotorua District)? This examination was undertaken through a survey of tourism businesses’ expenditure (see Section 2.6, Surveys). Businesses purchase not only goods and services, but also labour. The businesses pay for labour via either wages and salaries or drawings (by the owners of the business). The increase in household income arising from tourist spending leads to increased household expenditure, which further increases output, value added and employment in the Rotorua economy. These additional effects generated by household spending are termed "induced" effects, and their extent depends on the proportion of household spending which is done in the District economy. This proportion was estimated during the development of the GRIT model (see below) as being 80 per cent, and those interviewed during the business survey agreed that this was a realistic figure for their household. For these reasons, Type II multipliers give a better representation of the flow-on effect of business activity and are used in this study. 2.3 Generation of a Rotorua District Economic Model
While one can question businesses in tourism to find out what they purchase, this gives only the first round of indirect impacts. To estimate the further impacts caused by the spending of businesses further down the chain, one has the option of surveying all those businesses as well (which is prohibitively expensive), or estimating the probable pattern of their expenditure on the basis of information that already exists about national average expenditure patterns of businesses of this type, and the regional location of businesses that supply those inputs. For example, if we know that one per cent of all retail costs is spent on plastic bags and we know that Rotorua has no plastics factory, then we can assume that this one per cent

10
of costs is imported into the region. If we know that on average three per cent of retail costs is spent on uniforms, and if we know that there are sufficient clothing factories in Rotorua for the District to be 50 per cent self-sufficient in clothing, then we assume that 1.5 per cent of inputs are purchased from the local clothing industry, and a further 1.5 per cent of inputs are imported into the region. All the information and assumptions are incorporated into a separately-estimated District input-output model. This District model is generated using an existing national input-output model, information about the regional distribution of employment and output, and a relatively simply mathematical technique called GRIT12 (Generation of Regional Input-output Tables - which estimates the source of inputs into regional industries). This model is then enhanced by incorporating into it the survey data that has been gathered about the input structure of actual tourism businesses in Rotorua (see Expenditure Survey of Tourism Businesses, Section 2.6). The input-output model can be used to calculate the total effects on all sectors of an increase in output of any single sector. These total effects include the original effect and all the consequential rounds of indirect and induced effects. As noted previously, this calculation does not include any downstream impacts. The Rotorua District economic model generated for this study is based on the national inter-industry model for 1994/9513. Up-to-date District tourism industry survey data, gathered during this project, and 1996 census data are then been incorporated into the Rotorua District model to update it still further. The GRIT process uses District output by industry as its starting point. There is limited information currently available on regional output by industry, especially for a small region such as Rotorua. Statistics New Zealand will not release highly disaggregated data on the grounds that to do so would breach commercial confidentiality of businesses supplying the data. The most detailed data that are available relate to employment as measured by the census. The process for estimating Rotorua District output for each industry is as follows: 1. Take the best output distribution data that are available. In this case it is relatively old
(1986/87) data, and is for a larger region (Bay of Plenty); 2. Estimate the subsequent change in the Bay of Plenty region's share of national output
on the basis of the subsequent change in the region's share of national employment in that industry (comparing the 1986 and 1996 census data);
3. Estimate the Rotorua District's share of Bay of Plenty region output on the basis of
the District's share of regional employment (using 1996 census data).
12 Developed in Australia and widely used there and in New Zealand. See West et al., (1982), or Butcher
(1985). 13 It may seem that even a 1994/95 model is very dated, but it is quite up-to-date as far as inter-industry models
go, since a full model requires the collection of a great deal of detailed data, much of which does not become available until two years after the year to which it refers. A more accurate 1996/97 model is expected to become available in early 2000.

11
Once this has been done, the District inter-industry table is estimated using the standard GRIT procedure14. It should be noted that the District input-output table shows employment which differs from actual employment in the District. This is so that estimates of changes in regional employment which flow from the expansion of industries reflect national average employment : output ratios rather than existing District ratios.15 2.4 Estimates of Multipliers for Tourism
Once the survey information had been incorporated into the District model, employment, output, value added and household income multipliers can be estimated using matrix algebra16. Type II multipliers (which include induced effects) were calculated. It is clear that the increased direct household income from tourism stimulates household spending and hence economic activity in the District, and for this reason it seems appropriate that Type II multipliers be used to calculate total economic impacts of tourism. 2.5 Estimates of Direct and Total Impacts
Output The original expectation was that estimates of direct visitor spending would be made by surveying visitors to find out how much they spend per day, and by rating this up by estimates of total visitor days provided by the international visitor survey (IVS)and domestic travel monitor (DTM). Unfortunately, although the visitor expenditure survey was done and results from the IVS were available, results from the improved DTM were not available by September 1999. Moreover, the survey of visitor spending had a very high error margin. Hence we did not make an estimate of total direct expenditure from this source. Alternative estimates of visitor spending in accommodation and activities were obtained from the Statistics New Zealand accommodation monitor and from the project survey of the businesses within the attractions industry coupled with the project census of activities employment. The project’s survey of the attractions sector business accounts provided data on typical output per employee in this kind of business, and that figure was multiplied by the estimate of total employment in the sector to give total output for the activities sector. The visitor spending data provided estimated ratios of expenditure on accommodation to spending on activities, eating out, souvenirs, and other retail (including fuel). After accepting the Statistics New Zealand accommodation survey output data as providing the most reliable output data available (it purports to be an industry census and is available quarterly), we multiplied this figure by the respective ratios to estimate total expenditure in the other tourism groups (activities, eating out, souvenirs and other retail).
14 For a description of this, see Butcher (1984) or Jensen et al., (1979). 15 For details of the reasons, see Butcher (1985) pp 6-10. In short, it is believed that any under-employment in
a particular regional industry will not persist long-term, and it is likely that expansion will reflect national average technology rather than current local technology.
16 Readers who wish to know more should consult a text on input - output models. Customised software (e.g., IO7- available from the authors) which undertakes the matrix manipulation is readily available.

12
Employment We estimated total direct employment in activities by undertaking an employment census of businesses within the activity sector, and data on direct employment in accommodation was obtained from the Statistics New Zealand accommodation survey. Employment per $1 million of output in food and retailing was estimated from national average data17, and the resultant figures were multiplied by the output of these industries (see above) to give employment for the tourism component of each of these industries. Value Added We estimated the ratio of value added to output for accommodation and the activities sector by undertaking a survey of business expenditure. For other industries, national average value added : output ratios were obtained from Statistics New Zealand18. For each industry, value added was estimated by multiplying output by the appropriate ratio. Total Impacts The multipliers estimated from the District economic model were applied to the estimates of direct employment, output and value added to get estimates of total employment, output, and value added arising from tourism. By definition, the difference between total and direct effects is the indirect plus induced effect. 2.6 Surveys
A number of surveys were undertaken to gather the data necessary to estimate regional economic impacts of tourism. Survey of Visitor Spending Some 820 visitors were surveyed by other researchers in the programme to ascertain how much they had so far spent on their trip to Rotorua (broken down by type of expenditure), how long they had stayed so far, and how long they expected to stay (see Moore et. al., 2000). This information was combined to estimate total spending per person per day, and was then multiplied by the estimated total number of visitor-days (from the international visitor survey and the domestic tourism monitor) to get total annual visitor expenditure. The information also provided data on the ratios of different forms of expenditure (activities, accommodation, eating out, souvenirs, and other retail). The 820 total respondents came from two surveys, (around 400 in each survey) using different locations. One survey was based at the central City “lake front” area, while the other drew from a range of District attraction sites (e.g., lakes, volcanic attractions). The importance of this diversity of locations became apparent as the results were analysed (see Appendix 1). The two surveys had quite different mixes of
17 Statistics New Zealand (1998). 18 Statistics New Zealand (1998); Statistics New Zealand (1997).
13
visitors (domestic and international), similar average stays (1.7 days and 1.6 days respectively) and very different average expenditures ($178 and $104 respectively). However, the two surveys had reasonably similar results as regards the relationship between different types of spending, and this gave us some confidence in using these relationships to establish spending in different sectors. A further survey of tour operators provided further confirmation of a key expenditure ratio (that of accommodation to activities). Employment Census of Rotorua Tourism Businesses A total of 113 businesses which provide visitor ‘attractions’19 directly to tourists were identified, and all but six of them were visited or spoken to by telephone. The owner of each business was asked how many people worked at the business, whether the work was full-time or part-time, and for how many months per year the work lasted. This information was combined to estimate total Full-Time Equivalent (FTE) jobs in the business. Each business was then asked to estimate what proportion of sales were directly to visitors, and the numbers were combined to estimate direct tourism employment. Six businesses were not able to be contacted, and enquiries suggested that four of these had gone out of business, or were very short-term seasonal operators. Estimates of employment in the other two businesses was based on information from other people in Rotorua. Other small businesses may have recently started up and hence not been identified or interviewed. For this reason the survey may have underestimated direct employment, but the understatement is expected to be only one or two per cent. Expenditure Survey of Tourism Businesses To estimate the indirect effects of tourism spending, it is necessary to know what inputs (including labour) tourism businesses purchase. Detailed expenditure data were sought initially from 40 tourism operators (the population was stratified by activity and size, and the participants were randomly selected within each stratum). Unfortunately the refusal rate was very high, and it was necessary to approach an additional 21 operators to get an adequate number of interviews. Refusals were related to confidentiality issues, lack of time (although in an attempt to persuade interviewees to make time available, they were offered $100 plus results from the project for a 1 hour interview), and new ownership. Of the 28 businesses who refused or could not be contacted, three owners had left (presumably having sold the business) and a further five had not owned the business for long enough to generate a set of annual accounts. The balance seemed to refuse primarily because of their reluctance to provide financial data, in spite of the fact that the interview was being undertaken directly by the economist (rather than a market research company) and the respondents were assured that no other person would see the information relating to an individual company. All except two of those who did provide data made most or all of their financial data available, but in some cases it was not possible to distinguish between profit and household income. This was particularly true of smaller owner-operated businesses, which are common in the tourism ‘attractions’ industry.
19 Attractions included all those activities listed in the Tourism Rotorua Inventory (1998), and covers a diverse
range from passive tours, to golf, to shows, to bungy jumping. Accommodation, eating and shopping were excluded.

14
While the level of business co-operation was not as good as was the case in Kaikoura, the available data gives a reasonable representation of types of business in the tourism sector of the Rotorua District economy (see Table 3). The data should therefore give a good indication of typical expenditure patterns of those involved in the industry. The sample selection procedure meant that data were obtained from a range of large and small firms in all attraction sub-sectors (except that homestay accommodation providers were not surveyed). The sub-sector definition, the number in the sector and the number interviewed (both as a raw figure and as a proportion20 of the sub-sector) are also shown in Table 3.
Table 3 Business Survey Respondents by Sector
Sector No.
Interviewed No. in Sector
Sample as proportion of sector
Aerial activities 1 10 13% (based on employment) Ground-based 7 77 26% (based on employment) Water-based 3 26 7% (based on employment) Fishing guides 3 27 10% (based on employment) Sub Total 14 140 23% (based on employment) Hotels 2 13 12% (based on capacity) Exclusive Lodges 2 9 14% (based on capacity) Motels 6 87 9% (based on capacity) Backpackers 2 10 20% (based on capacity) Holiday Parks 2 15 38% (based on capacity) Sub-Total Accommodation (excluding homestays)
14 124 20% (based on capacity) 13% (based on turnover)
Souvenir Shops 3 - - Total 31
2.7 Estimation of Employment : Output, Valued Added : Output and
Household Income : Output Ratios
The original intention was that the relationships between output and employment as well as output and value added would be estimated on the basis of a detailed analysis of the accounts of a sample of tourism businesses (which included most of the larger operators). The large number of tourism-based businesses in Rotorua, and the need to restrict survey costs but get acceptable error margins led to a decision to survey primarily accommodation and visitor attraction businesses. These two sectors are jointly responsible for almost 50 per cent of visitor expenditure, and in any case other industries (particularly restaurants and retail) are only partially visitor-based and there is reasonable alternative information available (from the Statistics New Zealand Business Survey).
20 Estimated on the basis of share of sectoral employment or, in the case of accommodation, as a proportion of
the share of sectoral room capacity.

15
Chapter 3
Direct Tourism Impacts 3.1 Introduction
This chapter focuses only on direct tourism impacts while the next chapter focuses on multipliers and Chapter Five brings all these figures together to show total impacts of tourism. This chapter starts with direct tourism output and estimates total sales (as well as gross margins in the case of retailing). Then direct employment in tourism is considered, including comparison of data from different sources and a discussion of the discrepancies in estimates of FTEs. Finally, direct value added and household income are considered. The results of the chapter are brought together in a comprehensive table at the end of the chapter. 3.2 Direct Tourism Output
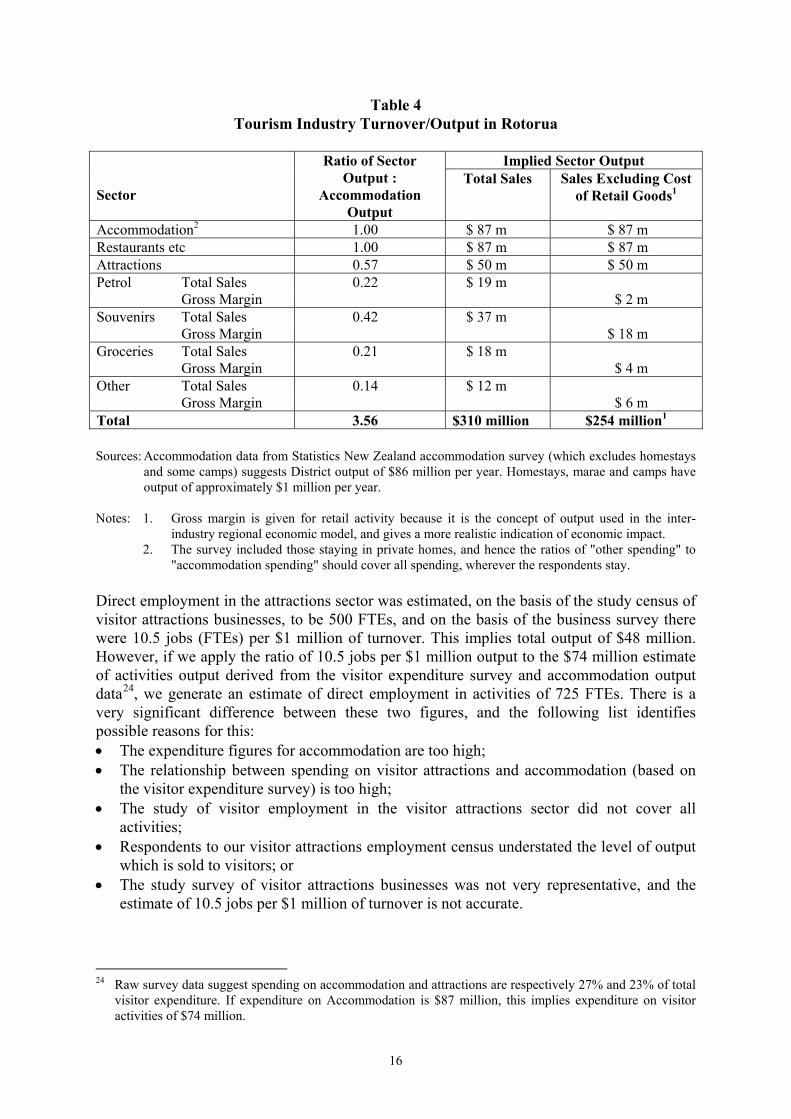
Direct output in accommodation was estimated by Statistics New Zealand21 to be $86 million in the year to March 1999, to which must be added around $1.0 million for homestays and school camps. The split of expenditure revealed by the survey of visitor expenditure was adjusted (see Section 3.3, Direct Employment in Tourism, for reasons) to provide consistency with other data, and the implied ratios of sector spend : accommodation spend (see Table A.4) were used to estimate sales to visitors by other sectors. On the basis of those data, we estimate that output of "tourism activities" was $50 million, output of "tourism restaurants and cafés" was $87 million, and output of "tourism retail" (souvenirs, groceries and "other") was $86 million including a gross margin of around $30 million. Hence total sales of the tourism industry in Rotorua were estimated to be $310 million per year in 1998/99. These results are summarised in Table 4. Use of average visitor spending per day across New Zealand as a proxy for spending in Rotorua, and use of existing estimates22 of visitor numbers to Rotorua are both likely to give rise to high error margins. Nonetheless, an estimate was made on this basis and gave a remarkably similar figure ($303 million) to the estimates described above. 3.3 Direct Employment in Tourism
Direct employment in the accommodation sector in Rotorua District in 1999 was estimated by Statistics New Zealand23 to be 1,105 FTEs, but we believe that once school camps and homestays are included, the true figure is probably closer to 1,150 FTEs. In the same report, Statistics New Zealand estimates employment : output ratios of 12.9 FTEs per $1 million, which is very close to the 13.4 FTEs per $1 million derived from the business survey.
21 Statistics New Zealand (1999b). 22 International Visitors Survey and Domestic Tourism Monitor (sample survey ; D Simmons - pers. comm ) 23 "Accommodation Survey", Statistics New Zealand (1999b).
16
Table 4 Tourism Industry Turnover/Output in Rotorua
Implied Sector Output
Sector
Ratio of Sector Output :
Accommodation Output
Total Sales Sales Excluding Cost of Retail Goods1
Accommodation2 1.00 $ 87 m $ 87 m Restaurants etc 1.00 $ 87 m $ 87 m Attractions 0.57 $ 50 m $ 50 m Petrol Total Sales 0.22 $ 19 m Gross Margin $ 2 m Souvenirs Total Sales 0.42 $ 37 m Gross Margin $ 18 m Groceries Total Sales 0.21 $ 18 m Gross Margin $ 4 m Other Total Sales 0.14 $ 12 m Gross Margin $ 6 m Total 3.56 $310 million $254 million1 Sources: Accommodation data from Statistics New Zealand accommodation survey (which excludes homestays
and some camps) suggests District output of $86 million per year. Homestays, marae and camps have output of approximately $1 million per year.
Notes: 1. Gross margin is given for retail activity because it is the concept of output used in the inter-
industry regional economic model, and gives a more realistic indication of economic impact. 2. The survey included those staying in private homes, and hence the ratios of "other spending" to
"accommodation spending" should cover all spending, wherever the respondents stay. Direct employment in the attractions sector was estimated, on the basis of the study census of visitor attractions businesses, to be 500 FTEs, and on the basis of the business survey there were 10.5 jobs (FTEs) per $1 million of turnover. This implies total output of $48 million. However, if we apply the ratio of 10.5 jobs per $1 million output to the $74 million estimate of activities output derived from the visitor expenditure survey and accommodation output data24, we generate an estimate of direct employment in activities of 725 FTEs. There is a very significant difference between these two figures, and the following list identifies possible reasons for this: • The expenditure figures for accommodation are too high; • The relationship between spending on visitor attractions and accommodation (based on
the visitor expenditure survey) is too high; • The study of visitor employment in the visitor attractions sector did not cover all
activities; • Respondents to our visitor attractions employment census understated the level of output
which is sold to visitors; or • The study survey of visitor attractions businesses was not very representative, and the
estimate of 10.5 jobs per $1 million of turnover is not accurate.
24 Raw survey data suggest spending on accommodation and attractions are respectively 27% and 23% of total
visitor expenditure. If expenditure on Accommodation is $87 million, this implies expenditure on visitor activities of $74 million.

17
Each of these sources of error is considered in turn. The expenditure on accommodation, which comes from a Statistics New Zealand census of accommodation, is one of the most robust figures we have. The study’s comprehensive survey census of the attraction industry will undoubtedly have missed some small activities, but some allowance has been made for this in arriving at a total of 500 FTEs, and any remaining understatement is most unlikely to be more than perhaps 25 jobs. It may be that operators understated the proportion of their sales which is to tourists, but given that on average they estimated figures in excess of 90 per cent, any understatement will have been small. The study survey of "attraction industry" employment : output ratios is likely to be reasonably accurate, given that it covered about one quarter of employment in the sector, including three of the largest operators. While there is a big range of ratios across operators (5.4-20 FTEs per $1 million), we believe that the true average is unlikely to differ by more than ten per cent from the implied average, and is as likely to be higher as it is to be lower. The most likely source of error is in the visitor expenditure survey. First, it is quite possible that visitors included as their expenditure on attractions, some expenditure on souvenirs and food at the attractions (whereas employment in these areas were excluded from our survey). Second, the survey was undertaken in summer and the proportion of visitors spending and associated visitation of attractions may be significantly less in winter. Third, it was notable that the survey result is highly dependent on the mix of visitors, and the two surveys have very different visitor mixes, implying a high error margin. Fourth, our visitor surveys were at times and locations which are likely to exclude most business people who we would expect to be responsible for a significant part of the accommodation and food expenditure but little of the “attractions” expenditure. Hence our survey ratio of “attractions” expenditure : accommodation expenditure will be biased upwards. In light of the above factors, we have decided to adjust up slightly our study census of activities employment to 525 FTEs, to reduce the proportion of spending on activities and to adjust the proportion of spending in other areas25, particularly retail and food. Appendix 2 provides a fuller discussion of potential error estimates. Data from retailing suggests that average employment is around 5.3 FTEs per $1 million of turnover, but this varies greatly according to the gross margins of the type of retailing (gross margins are of the order of 50 per cent for souvenirs and ten per cent for petrol). Because the ratio of employment : gross margin is expected to vary much less, the national average of 11.3 FTEs per $1 million of gross margin was used to estimate retail employment. Tourism retail employment hence totals 345 FTEs. In restaurants and cafes, employment nationally averages around 14 FTEs per $1 million of sales. This implies a total visitor-dependent employment in the restaurant industry of 1,480 FTEs. When all contributory industries are summed the tourism sector generates direct employment equivalent to around 3,500 FTEs.
25 Obviously the total proportion will still have to be 100 per cent. A decline in the activities proportion must
be offset by an increase in other proportions.
18
3.4 Direct Value Added in Tourism
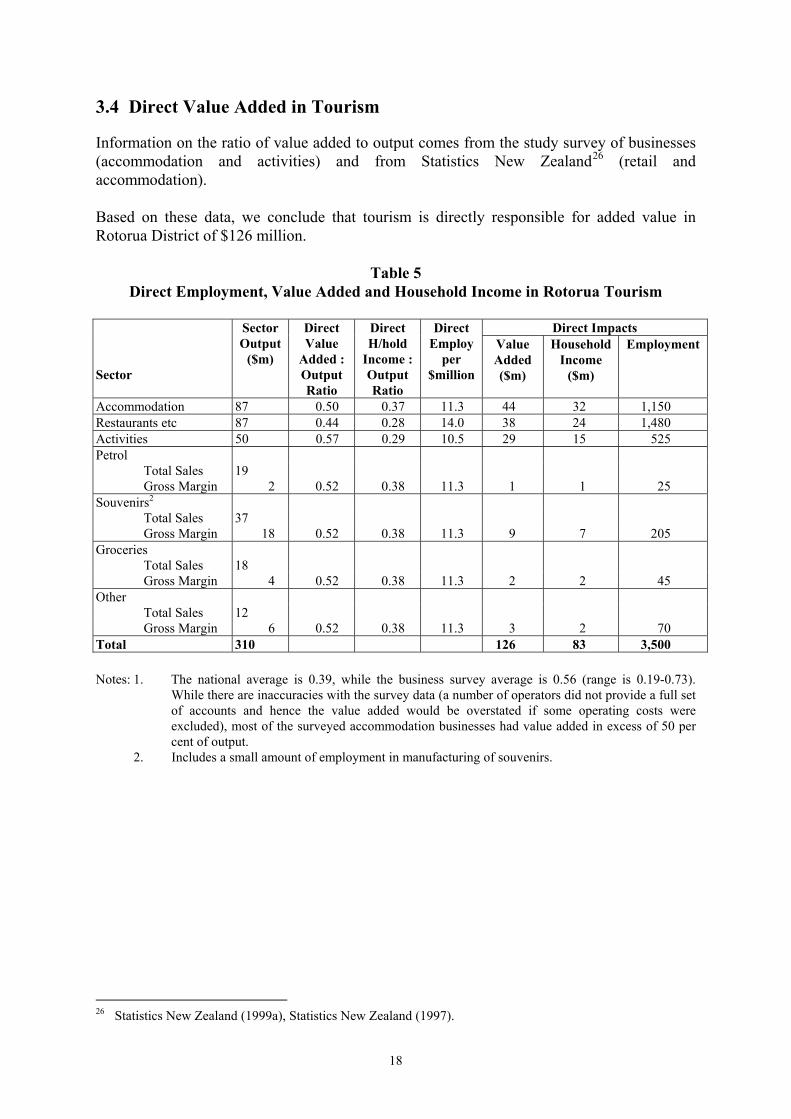
Information on the ratio of value added to output comes from the study survey of businesses (accommodation and activities) and from Statistics New Zealand26 (retail and accommodation). Based on these data, we conclude that tourism is directly responsible for added value in Rotorua District of $126 million.
Table 5 Direct Employment, Value Added and Household Income in Rotorua Tourism
Direct Impacts
Sector
Sector Output
($m)
Direct Value
Added : Output Ratio
Direct H/hold
Income : Output Ratio
Direct Employ
per $million
Value Added ($m)
Household Income
($m)
Employment
Accommodation 87 0.50 0.37 11.3 44 32 1,150 Restaurants etc 87 0.44 0.28 14.0 38 24 1,480 Activities 50 0.57 0.29 10.5 29 15 525 Petrol Total Sales 19 Gross Margin 2 0.52 0.38 11.3 1 1 25 Souvenirs2 Total Sales 37 Gross Margin 18 0.52 0.38 11.3 9 7 205 Groceries Total Sales 18 Gross Margin 4 0.52 0.38 11.3 2 2 45 Other Total Sales 12 Gross Margin 6 0.52 0.38 11.3 3 2 70 Total 310 126 83 3,500 Notes: 1. The national average is 0.39, while the business survey average is 0.56 (range is 0.19-0.73).
While there are inaccuracies with the survey data (a number of operators did not provide a full set of accounts and hence the value added would be overstated if some operating costs were excluded), most of the surveyed accommodation businesses had value added in excess of 50 per cent of output.
2. Includes a small amount of employment in manufacturing of souvenirs.
26 Statistics New Zealand (1999a), Statistics New Zealand (1997).

19
3.5 Direct Household Income in Tourism
Information of the ratio of household income to total output comes from the study surveys and also from national average data for retailing27. The survey data related to the visitor attraction sector is approximate because in small businesses the reported allocation of income between profits and drawings reflects accounting and tax advantages rather than actual financial flows. However, while the small businesses are large in number, they represent less than a third of the survey turnover, and we therefore estimate that in total, tourism leads directly to household income of $83 million in the Rotorua District. 3.6 Conclusion
Visitors to Rotorua spend approximately $310 million per year in the District. This expenditure leads directly to 3,500 jobs, $126 million of value added, and $83 million of household income. Table 5 brings together the key results of this and other chapters.
27 Statistics New Zealand (1997).


21
Chapter 4
Multipliers and Total Tourism Impacts 4.1 Survey Results
The limited range of manufacturing enterprises in Rotorua means that while most businesses buy from local retailers, many of the goods are produced out of the District (obvious exceptions include a number of food items and some souvenirs). A large proportion of services are purchased locally. 4.2 Estimates of Multipliers for Tourism
Once the basic GRIT-generated District model had been "enhanced" (by incorporating the accommodation and activity business expenditure survey data), multipliers were estimated for employment, output, value added and household income. Given the error margins associated with the estimates of direct value added and household income, the value added and household income multipliers are also subject to wide margins of error. Multipliers based on this enhanced model are given in Table 6 for the four major tourism sector industry groups of accommodation, activities, retailing, and restaurants and cafes. Employment multipliers range from 1.3 to 1.5 and total employment impacts range from 5.3-19.0 jobs per $million of direct visitor expenditure. Output multipliers range from 1.21 to 1.65. Value added multipliers range from 1.47 to 1.72 and total value added ranges from 0.28 to 0.88 of direct visitor expenditure. Household income multipliers range from 1.49-1.55, and total household income ranges from 0.18 to 0.54 of direct visitor expenditure. The interpretation of the figures in Table 5 (using accommodation as an example) is as follows: • Output: Every $1 m of visitor spending has flow-on effects of $0.65 million,
and the total increase in District output is $1.65 m. • Employment: Every $1 million of annual spending increases employment directly
by 13.4 FTEs, and flow-on effects generate a further 5.4 FTEs so that in total 18.9 FTEs are created. The ratio of total to direct employment effects is 1.39.
• Value Added: Every $1 million of direct expenditure increases value added directly by $0.56 m, and flow-on effects increase value added by a further $0.33 million so that in total valued added increases by $0.89 million. The ratio of total to direct value added effects is 1.57.

22
• Household Income: Every $1 million of direct expenditure increases household income
directly by $0.37 million, and flow-on effects increase household income by a further $0.17 million, so that in total household income increases by $0.54 million. The ratio of total to direct household income effects is 1.49.
Table 6
Tourism Impacts and Multipliers in the Rotorua District
Enhanced GRIT model adjusted to
reflect survey data1
Basic GRIT Model2
Retail3
Accomm- odation
Activities Margin Turnover
Restaur-ants
Accomm-odation
Recreation Activities
Output Multiplier Direct 1.00 1.00 1.00 1.00 1.00 1.00 1.00 Indirect 0.35 0.29 0.40 0.11 0.36 0.44 0.40 Induced 0.30 0.24 0.31 0.10 0.24 0.25 0.25 Multiplier (Type II) 1.65 1.54 1.71 1.21 1.59 1.69 1.65 Employment Impacts Direct (FTEs/$m) 13.40 10.50 11.30 3.50 14.30 10.60 12.60 Indirect 3.00 2.80 3.10 1.00 2.80 3.50 3.90 Induced 2.40 2.00 2.50 0.80 1.90 2.00 2.10 Total (FTEs/$m) 18.90 15.20 17.00 5.30 19.00 16.10 18.50 Multiplier (Type II) 1.41 1.45 1.50 1.50 1.33 1.52 1.47 Value Added Direct Output ratio 0.56 0.57 0.52 0.16 0.44 0.39 0.56 Indirect 0.16 0.13 0.20 0.06 0.15 0.21 0.20 Induced 0.17 0.13 0.17 0.05 0.13 0.14 0.14 Total Output ratio 0.88 0.83 0.90 0.28 0.73 0.74 0.90 Multiplier (Type II) 1.57 1.47 1.72 1.72 1.66 1.89 1.61 Household Income Direct Output Ratio 0.37 0.29 0.37 0.11 0.29 0.27 0.27 Indirect 0.10 0.09 0.11 0.03 0.09 0.13 0.11 Induced 0.07 0.06 0.09 0.03 0.06 0.06 0.06 Total Output ratio 0.54 0.44 0.57 0.18 0.44 0.46 0.46 Multiplier (Type II) 1.49 1.53 1.51 1.51 1.55 1.68 1.68
Notes: 1. The survey data were incorporated into the District table (generated by the GRIT process) and
multipliers were then calculated from this. 2. The multipliers were obtained directly from the GRIT-based District table, and do not take
account of the survey data. 3. Gross-margin figures are based on District GRIT-based table. These are converted to gross
turnover figures on the basis of the relationship between gross turnover and gross margin as shown in Table A4.

23
4.3 Comparison of Multipliers
The purpose of undertaking survey work is to ensure that the District economic model reflects the expenditure patterns of businesses more accurately than does the basic GRIT model. There has always been concern about the accuracy of multipliers from basic GRIT tables, especially where analysts assume that they can apply employment multipliers for an apparently similar industry directly to estimates of direct employment for the project they are reviewing. This study provides an opportunity to compare impacts and multipliers from a survey-enhanced GRIT table with multipliers for similar industries calculated from a basic GRIT table. Table 6 shows basic GRIT model multipliers for accommodation and for recreation and culture, and also show adjusted multipliers for the surveyed industries of accommodation (an industry directly comparable to that in the basic GRIT model) and activities (an industry similar to the recreation and culture industry in the basic GRIT model). The results of the comparison are shown in Table 7.
Table 7 Comparisons of Basic GRIT and Survey-Enhanced GRIT Impacts
Industry Survey-
Enhanced GRIT Basic GRIT Variation (%)
Basic : Enhanced Activities Recreation and
Culture
Direct Emp./$m1 10.50 12.60 + 20 Total Emp./$m1 15.20 18.50 + 21 Emp. Multiplier 1.45 1.47 + 2 2 Direct Value Added 0.57 0.56 - 2 Total value Added 0.83 0.90 + 8 Value Added Mult. 1.47 1.61 + 11 2 Output Multiplier 1.54 1.65 + 17 Accommodation Accommodation Direct Emp./$m1 13.40 10.60 - 21 Total Emp./$m1 18.90 16.10 - 15 Emp. Multiplier 1.41 1.52 + 8 2 Direct Value Added 0.56 0.39 - 31 Total value Added 0.88 0.74 - 16 Value Added Mult. 1.57 1.89 + 20 2 Output Multiplier 1.65 1.69 + 2
Notes: 1. Employment : Output ratios are at 1994/95 prices
2. This figure is equivalent to the error in total employment estimates resulting from multiplying surveyed employment (or value added) by the GRIT-based District multiplier.

24
A comparison of the impacts and multipliers derived from the Basic GRIT model with the impacts and multipliers from the Enhanced GRIT model suggests that using Basic GRIT direct ratios to estimate direct effects, or applying Basic GRIT multipliers to survey estimates of direct impacts to estimate total impacts, can give estimates of total impacts which are significantly 28 different (differences range from two to twenty-one per cent) from estimates of total impacts based on more detailed surveys and a survey-enhanced GRIT model. Applying Basic GRIT total ratios to surveyed direct expenditure gives results which are on average closer to results from a survey-enhanced GRIT model, but the differences can still be significant (differences range from eight to twenty one per cent and can be both positive and negative). Table 7 suggests that if one is not able to incorporate survey data into a regional model, then if one wants to estimate total employment or value added impacts, one is better to apply GRIT-based multipliers to survey-based direct employment or direct value-added figures than to apply GRIT-based total impact ratios. In the former case the error range is + 2 to + 20 per cent while in the latter case the error range is - 16 to + 21 per cent. It is interesting to note that this is the reverse conclusion to that which was drawn from by the Kaikoura study. The implication is that detailed surveying provides more accurate results, and is justified where this greater accuracy is necessary. Our judgement is that in the case of the two Districts we have studied so far in this project (Kaikoura and Rotorua) the surveying has been worthwhile both to establish the margins of multiplier error and also to establish more accurately the absolute level of economic effect. Given that results suggest the Basic GRIT tables are only accurate to plus or minus twenty percent, and given that the error sign is not consistent, then in our view surveying is justified in almost all cases where decision makers wish to know something about the local economic impacts of industry growth or decline. 4.4 Changes in Multipliers Over Time
Multipliers for specific industries can be expected to change over time, particularly in a small region where an industry is expanding rapidly. This is because industry growth makes it viable for support industries to establish. However, in an industry which has been long-established in a region, one might expect the multipliers to change according to national trends towards concentration in fewer centres because, for example, technology or transport changes reduce costs of external supply. Two lines of enquiry were pursued to see whether there has been an increase in Rotorua-based industry support during the last decade. The first was to ask the businesses who provided detailed financial data whether there had been a change in the location of their purchases during the last decade, and the second was to use information29 on changes in District self-sufficiency over the last decade to see whether the multipliers could be expected to change.
28 Significance is a term which depends on the context, but certainly there are cases where a difference of 20
per cent is significant. For example, surplus capacity in accommodation growth can cope with of a given margin, but not growth which is 20 per cent greater. In other cases, differences may not be significant, for example, where an attraction such as Waimunga can readily cope with increased visitation of at least 50 per cent.
29 Using a series of regional Basic GRIT models for 1986/87, 1990/91 and 1994/95. See Butcher 1985, 1994, 1996 and 1998.

25
Given the long-established nature of tourism in Rotorua, it was surprising to note how many of the operators were relatively new entrants to the industry. While a number of large visitor attraction enterprises are long-established (e.g. Rainbow Springs, Agrodome), a significant number of the smaller operators had been in business for three years or less. In the accommodation sector, many of the motel owners were relatively new, and one broker proffered the observation that "at least half of the motel owners would like to sell". While this suggests that owners do not find the business very satisfying (whether in terms of lifestyle or profitability is not known), the rapid change in ownership meant that we were not able to get useful data on long-term changes in the source of inputs.
Table 8 Trends in Bay of Plenty Tourism Multipliers over Time
Retail Accommodation Restaurants Recreation
and Culture Output Multipliers 1976/77 2.20 (joint) 2.20 (joint) 2.20 (joint) - 1986/87 1.91 2.11 2.05 2.06 1990/91 1.84 2.00 (joint) 2.00 (joint) 1.95 1994/95 1.75 1.85 1.89 1.68 % Change in flow-on effect from 1986/87 to 1994/951
- 18% - 23% - 15% - 36%
Employment Multipliers 1976/77 1.70 (joint) 1.70 (joint) 1.70 (joint) - 1986/87 1.73 1.71 1.94 2.00 1990/91 1.49 1.56 (joint) 1.56 (joint) 1.74 1994/95 1.54 1.46 1.65 1.49 % Change in flow-on effect from 1986/87 to 1994/951
- 26% - 35% - 31% - 51%
Value-Added Multipliers 1976/77 - - - - 1986/87 1.85 2.34 2.28 2.17 1990/91 1.79 2.24 (joint) 2.24 (joint) 2.03 1994/95 1.75 1.88 2.07 1.64 % Change in flow-on effect from 1986/87 to 1994/951
- 12% - 34% - 16% - 45%
Notes: 1. The decline in flow-on effects must exclude the direct effects in each case. Hence in the case of
retail output, the total output impacts have declined from 1.91-1.75, but the flow-on impacts have declined from 0.91-0.75, hence a decline of 18 per cent.
By looking at changes in GRIT-based multipliers over the last decade, we were able to form a view on likely trends in Rotorua tourism multipliers. As the above table shows, there has been a steady decline in Bay of Plenty regional tourism-related multipliers over the last decade or more. The decrease in flow-on effects across key tourism industry sectors is of the range -12 to 51 per cent. The implication of this decline is that expansion of driving industries such as tourism now have a smaller flow-on effect than in the past, which in turn means that growth in tourism is less of a panacea than it was for declines in other industries. The smaller flow-on effects also reduce (but do not annul) the argument for public support of the industry.

26
4.5 Trends in Multipliers Over Time
Butcher30 examined trends in national multipliers over the period 1976/77 - 1990/91, and he concluded that:
" The general trend has been an increase in output multipliers and a smaller increase in employment and income multipliers. In the case of agriculture (other than horticulture), the trend has been for a large decline in output multipliers (-16 to -36 per cent) and pastoral employment multipliers".
It is interesting then to note the similarity between agriculture (at a national level at least) and tourism at the regional level. Both are "driving" industries, and in both the multipliers are declining. Hence while tourism may not be the panacea for unemployment that it was31, neither is at least one of the other driving industries. Consideration of a range of employment and output multipliers suggests that the regional decline in tourism multipliers has been paralleled by a decline in many other multipliers. Hence while tourism may not be as effective a panacea for regional unemployment as it once was, it is probably still relatively as efficient as it was 20 years ago, compared with other industries. Moreover, it may be much easier to find additional markets for tourism than for farm products, and tourism does not have the very long lead times that forestry does.
Table 9
Trends in Other Bay of Plenty Employment and Output Multipliers Over Time
Employment Output 1976/77 1994/95 1976/77 1994/95
Dairy 2.0 1.7 2.6 1.9 Sheep 2.0 1.6 2.0 1.9 Forestry and logging 2.1 2.5 2.4 2.0 Pulp and paper 2.9 3.3 2.2 2.0 Construction 2.4 2.4 2.7 2.3 W & R trade, accommodation and restaurant
1.7 1.5 2.2 1.8
Transport 1.8 1.9 2.3 1.8 Communications 1.2 1.9 2.2 1.6 Financial, insurance and real estate services
1.9 1.6 2.2 1.7
30 “Impacts of Agriculture". Contract Research for the New Zealand Ministry of Agriculture and
Fisheries.(Unpublished) 31 In the sense that an inflation-given (adjusted) level of tourist expenditure now generates less employment
than it did.

27
As the above table shows, a quick analysis of other industries in the region shows a decline in employment multipliers for farming, but an increase in employment multipliers for forestry and pulp and paper. Changes in employment multipliers can reflect both changes in sources of inputs and also differences in relative growth of productivity in the driving and supplier industries. Hence the increased employment multipliers for forestry and pulp and paper may reflect rapid increases in labour productivity (possibly because of mechanisation). Output multipliers are not affected by change in relative growth of labour productivity, and hence changes in these multipliers give a better indication of changes in regional self-sufficiency. All output multipliers considered have fallen, which suggests that the region as a whole is becoming more dependent for its inputs on other centres.

28
29
Chapter 5
Total Impacts of Tourism on Rotorua This chapter brings together the data on direct impacts and multipliers to estimate total economic impacts of tourism in the Rotorua District. The direct impacts of tourism (Table 5) are combined with the tourism multipliers generated from the Survey-enhanced GRIT District model (Table 6) to generate estimates of total tourism employment, output and value added impacts in Rotorua District. These are summarised in Table 10. Employment On the basis of the information collected by our surveys and supplemented with data from other sources, it is estimated that direct employment in tourism (including a share of employment in businesses who sell only part of their output to tourists) is 3,500 FTEs. Many more people than this (of the order of 5,70032) work in industries with a significant tourism component, but in many cases only part of the sales are to tourists, and in other cases the work is only seasonal and/or part-time 33. On the basis of the estimated employment multipliers and direct employment, we conclude that tourism generates a total of 4,870 FTE jobs in Rotorua. On average, every direct tourism job generates approximately 0.39 other jobs elsewhere in the District. A comparison of indirect and induced impacts suggests that about 45 per cent of this additional activity arises as a result of increased household spending by those working in the industries which depend on tourism. Figures from the March 1996 census suggest that at the time there were some 25,000 jobs (FTE) in Rotorua District. Given that this date is between the seasonal peak and trough for tourism, this may be a reasonable estimate of average employment during the year. If this is so, then about 14 per cent of all jobs in the District depend directly on tourism, and almost 20 per cent depend directly or indirectly on tourist spending. Output It is estimated that visitors to Rotorua spend (increase District output by) approximately $310 million per year in the District. Flow-on effects increase the total tourism-dependent output in the District to $463 million per year.
32 The 1,675 FTEs employed in accommodation and attractions work almost exclusively with tourists, but
around one third of those FTEs are related to part-time work, and hence some 2,200 people are involved ([0.67 x 1675 x 1] + [0.33 x 1,675 x 2]). In addition are the 1,480 FTE in restaurants and hotels, many of which are part-time and many of which related only partly to tourists. Hence of the order of 2,500 people in this sector have jobs which are significantly dependent on tourism. Finally, there are the 345 FTEs in retail and other sectors whose income is generally even less dependent on tourism, but perhaps 1,000 people in this sector have a reasonable level of dependence on tourism. 2,200 + 2,500 + 1,000 = 5,700.
33 The Rotorua household survey undertaken as part of this case study (See Horn et. al.. 2000 for a description) suggests that of those employed in tourism, almost half are only part-time.

30
Value Added and Household Income Visitor spending generates directly $126 million of value added per year in Rotorua. We estimate that approximately $83 million of this is gross household income. The inclusion of flow-on effects means that total tourism-dependent value added is approximately $200 million per year, with almost $83 million of this being gross household income. Multipliers Multipliers for tourism in Rotorua are significantly larger than for Kaikoura because the regional economy is more diversified, and the flow-on effects of tourism seem proportionately to be about twice as great in Rotorua as in Kaikoura.
Table 10 Summary of Economic Impacts of Tourism on Rotorua District 1
Direct Impacts1 Multipliers
(Type II)2 Total Impacts
Employment (FTEs) Accommodation 1150 1.41 1,620 Restaurants and Cafés 1480 1.33 1,970 Activities 525 1.45 760 Retail and Other 345 1.50 520 Total 3,500 1.39 (implicit) 4,870 Output ($m) Accommodation 87 1.65 44 Restaurants and Cafés 87 1.59 38 Activities 50 1.54 77 Retail and Other 86 1.21 104 Total 310 1.49 (implicit) 463 Value Added ($m) Accommodation 44 1.57 69 Restaurants and Cafés 38 1.66 63 Activities 29 1.47 43 Retail and Other 15 1.72 26 Total 126 1.59 (implicit) 200 Household Income ($m) Accommodation 32 1.49 48 Restaurants and Cafés 24 1.55 37 Activities 15 1.53 23 Retail and Other 12 1.51 18 Total 83 1.52 (implicit) 125
Notes 1. Direct effects from Table 3. 2. Multipliers from Table 4.

31
Chapter 6
Conclusions Approximately 3,500 persons (Full-Time Equivalent - FTE) are employed directly in tourism in the Rotorua District. While approximately 5,700 people in the District work in businesses which are wholly or partly tourism based, this figure is adjusted down to 3,500 FTE to reflect the part-time and seasonal nature of the work, and the fact that many businesses sell only part of their turnover to tourists. Every job in tourism leads, on average, to a further 0.39 jobs elsewhere in the District economy. This flow-on effect is moderate, and reflects both the limited manufacturing base of the District, as well as the very low demand for external inputs in some businesses (particularly in the Visitor Attractions Sector)34. However, the flow-on effect is almost twice as great as was the case in Kaikoura, and this reflects the more diverse range of manufacturing and much more diverse range of business support services in Rotorua. The flow-on employment effects of 1400 FTE mean that in total some 4,900 FTE jobs are generated in the District by tourism. This excludes any jobs in social services (such as teaching) that might be lost if tourism (and hence employment) declined, and people emigrated from the District. Total employment in Rotorua District is believed to be around 27,000 Full-Time Equivalent jobs (FTEs). Hence almost 18 per cent of all jobs in the District depend either directly or indirectly on tourism. Total direct spending by tourists is estimated to be $310 million per year. Flow-on effects of visitor spending increase total visitor-dependent spending (sales) in the District to an estimated $463 million. The direct spending figure is based on the Statistics New Zealand census of output of accommodation businesses, and a survey of patterns of visitor expenditure (allowing us to estimate total expenditure in other sectors on the basis of expenditure on those goods and services relative to expenditure on accommodation). An alternative measure of direct visitor spend could be generated by surveying visitors to find out the level of spend per visitor-day, and rating this up by total number of visitors to the town centre. While two visitor expenditure surveys were undertaken at different sites within the District, the figures were inconsistent between the two surveys ($178 per person and $104 respectively), and were not used. In addition, there is considerable uncertainty as to the exact number of overnight and day visits to Rotorua by domestic visitors. Use of average visitor spending per day across New Zealand as proxies for spending in Rotorua, and use of existing estimates of visitor numbers to Rotorua are both likely to give rise to high error margins. Nonetheless, an estimate was made on this basis and gave a remarkably similar figure ($303 million) to the estimates described above.
34 ‘Attractions’ is a generic term which is used here to include visitor attractions (e.g., Rainbow Springs), and
visitor activities (e.g., fishing, guiding).

32
Value-added35 arising directly from tourist spending is estimated at $126 million (including $83 million of household income). This estimate is based on the estimates of turnover and the relationship between turnover and value added in the various industries. Again, this figure has a high error margin. Not only is the turnover figure approximate, but the ratios are very approximate. The flow-on effects of visitor spending increase total visitor-dependent value added to $200 million (including $125 million of household income). The impacts reported above arise from the on-going operation of the existing tourist facilities. In addition to these are impacts arising from capital injections into the industry (that is, injections additional to ongoing repairs and maintenance - which tend to include a significant amount of minor capital works). In aggregate these are not believed to be particularly significant in the case of Rotorua, primarily because of the long-developed nature of the industry in the District. Significant investments in the city centre by the Council have been appreciated by the visitors and tourism operators, and have led to an improved visitor perception. However, there is no way to establish how many additional visitors have been attracted to Rotorua as a result. Operators did not identify other areas where further physical investment by Council was needed, although a number believed that the Council's significant investment in tourism marketing was essential for the industry to grow in Rotorua. There was widespread acknowledgement of the "free-rider" problem associated with advertising, and the need for some kind of collective marketing. As reported above, tourism has significant linkages to the rest of the economy, and every direct job in tourism generates a further 0.39 jobs elsewhere in the District economy. However, the links are limited particularly by the lack of manufacturing activity in the District. Only 1.6 per cent of total District employment is in food manufacturing and 5.6 per cent in all other non-forestry manufacturing. Comparable figures for New Zealand are 3.8 per cent and 8.7 per cent. In total, tourism is responsible for around 5,000 jobs (Full-Time Equivalent). In spite of being the main source of employment in Rotorua District and of having flow-on effects which are almost twice as great as those of Kaikoura (where a direct job in tourism supported only 0.21 jobs elsewhere), only 20 per cent of the Rotorua economy depends directly or indirectly on tourism, whereas in Kaikoura the figure was 30 per cent. Clearly Rotorua is less vulnerable to tourism volatility than is Kaikoura. A very large proportion of those employed in tourism activities had been previously employed in other jobs in Rotorua. Hence in Rotorua tourism is very much a generator of jobs for local people. By contrast, a significant proportion of those employed in Kaikoura tourism had come from out of the District. The reason may lie partly in the fact that Rotorua has a long tourism history, whereas Kaikoura has had rapid tourism growth and had to get additional labour rapidly.
35 This is the total of returns to land, labour and capital. Hence it includes wages and salaries, income of the
self-employed, rents on land profits, and depreciation of capital.

33
In the Bay of Plenty, tourism multipliers appear to have been steadily declining over the last decade or more, reflecting the concentration of industry in fewer centres. The implication is that tourism is not the same "engine for growth" that it was, and also the justification for local government support for tourism because of the flow-on effects is slowly weakening. Tourism in Rotorua is a significant industry. It generates 19 per cent of employment and $310m direct ($463m total direct, indirect and induced) expenditure. In the wider context, Rotorua also has major forestry and agricultural industries. This diversity gives the local economy more resilience than economies such as Kaikoura which are far more dependent on tourism. In spite of the fact that multipliers are decreasing, tourism is still a significant source of economic activity, employment, and hence welfare for the Rotorua community. The challenge is to maintain the District’s attractiveness to both domestic and international tourists.


35
References
Butcher, G.V. (1985). Regional Income, Output and Employment Multipliers: Their uses and estimates of them. Ministry of Agriculture and Fisheries, Wellington, New Zealand.
Butcher, G.V. (1992). Regional Inter-Industry Transactions Tables: (Base 1981-82). MAF
Policy Technical Paper 92/11; Ministry of Agriculture and Fisheries, Wellington, New Zealand.
Butcher, G.V. (1994). Regional Inter-Industry Transactions Tables: (Base 1986-87). Unpublished monograph. Butcher, G.V. (1996). Regional Inter-Industry Transactions Tables: (Base 1990-91). Unpublished monograph. Butcher, G.V. (1998). Regional Inter-Industry Transactions Tables: (Base 1994-95). Unpublished monograph. Horn, C., Simmons, D.G. and Fairweather, J.R.. (2000). Evolving community response to
tourism and change in Rotorua. Tourism, Research and Education Centre, Report No. 14, Lincoln University, Canterbury, New Zealand.
Jensen, R.C. and West, G.R. (1982). On The Nature of Regional Multipliers. Paper presented
to North American Meeting, Regional Science Association, Pittsburgh. Moore, K., Simmons, D.G. and Fairweather, J.R. (1998). Visitors decision-making, on-site
spatial behaviours, cognitive maps and destination perceptions: A case study of Kaikoura. Tourism, Research and Education Centre, Report No. 14, Lincoln University, Canterbury, New Zealand.
Moore, K., Fairweather, J.R. and Simmons.D.G. (2000). Visitors to Rotorua: characteristics,
activities and decision-making. Tourism, Research and Education Centre, Report No. 12, Lincoln University, Canterbury, New Zealand.
Richardson, H.W. (1972). Input - Output and Regional Economics. London, Weidenfeld and
Nicholson. Simmons, D.G., Fairweather, J.F., and Forer, P. (1997). Domestic Tourism in New Zealand
– making data accessible. AustralianTtourism and Hospitality Research Conference, Manley, Sydney, (July).
Statistics New Zealand (1997). New Zealand Inter-Indsutry Study 1994/5. Wellington, New
Zealand. Statistics New Zealand (1998). Business Frame. Wellington, New Zealand. Statistics New Zealand. (1999. a). Business Activity 97. Wellington, New Zealand.

36
Statistics New Zealand. (1999. b) Accommodation Survey (customised tables for Rotorua District). Wellington, New Zealand. Statistics New Zealand (1999c). New Zealand International Visitor Arrivals. Monthly
Publication. Tourism Rotorua Marketing. (1998). Tourism Rotorua Inventory. West, G.R., Wilkinson, J.T., and Jensen, R.C. (1980). Generation of Regional Input - Output
Tables for the Northern Territory. St Lucian: Department of Economics, University of Queensland.
37
Appendix 1
Analysis of Visitor Survey Expenditure Data and Tour Operator Expenditure Survey
Two visitor expenditure surveys were carried out, each asking the same questions. However the sites were different and the second survey included many reports of "intended expenditure" during the respondent's visit whereas the first survey generally reported expenditure to date (with this being rated up to total stay). Results, measured as total dollars spent per person, were different, with the average expenditure in Survey 1 (Lake Front/City) being $160 compared to the average of only $78 in Survey 2 (Regional Attractions). This variation is even more unexpected given the variation in the mix of visitors (international visitors were 38% of survey 1 and 65% of survey 2), yet international visitors generally spend between 50 per cent and 100 per cent more than domestic visitors. However, the two surveys did give reasonably similar results as regards expenditure mix, and this figure was crucial for our estimates of economic impacts. On the basis of the surveys we believe that accommodation is 27 per cent of total expenditure, food and drink is 25 per cent, activities are 23 per cent and retail spending is 26 per cent (including petrol 6%, souvenirs 10%, groceries 6% and other 4% ). Given that good data are available on visitor expenditure on accommodation, we have expressed expenditure in each sector as a ratio of expenditure in accommodation. However, the implied total expenditure on attractions and activities was not consistent with data from other sources (see Section 3.3), and for this reason the expenditure mix was adjusted. The only independent data we have on domestic visitors (Domestic Travel Monitor) suggests that 41 per cent of all domestic visitors are day trippers, which is consistent with Survey 1 (also 41%). A survey of tour operators produced expenditure data of poor quality, since it did not generally include the personal expenditure of the visitors. However, most “attractions” and all accommodation expenditure was covered, and the results suggested that expenditure on attractions is typically around 30 per cent of visitors’ expenditure on accommodation and meals. This is consistent with information gathered from the other expenditure surveys.

38
Table A.1 Visitor Expenditure: $ per Person and Industry Distribution
Lake Front/City Regional
Attractions Average
Mix 1 Mix 2 Mix 1 Mix 2 Survey Adjusted1 Ratio to Accommo-
dation Mix of Visitors Domestic 56% 32% 56% 32% International 44% 68% 44% 68% Accommodation $/person International $66 $32 Domestic $39 $16 Average $51 $57 $23 $27 % of all exp. 28% 28% 25% 26% 27% 28% 1.0 Petrol $/person International $11 $6 Domestic $10 $10 Average $10 $10 $8 % of all exp. 6% 5% 9% 7% 7% 6% 0.22 Food and drink $/person International $71 $27 Domestic $24 $18 Average $45 $56 $22 $24 % of all exp. 25% 27% 24% 23% 25% 28% 1.00 Souvenirs $/person International $21 $18 Domestic $4 $7 Average $12 $16 $12 $15 % of all exp. 7% 8% 12% 14% 11% 12% 0.42 Groceries $/person International $12 $5 Domestic $12 $5 Average $12 $12 $5 $5 % of all exp. 7% 6% 4% 5% 6% 6% 0.21 Activities $/person International $62 $29 Domestic $18 $15 Average $37 $48 $21 $25 % of all exp. 21% 23% 23% 23% 22% 16% 0.57 Others $/person International $5 $4 Domestic $18 $0 Average $12 $9 $2 $3 % of all exp. 7% 4% 2% 2% 4% 4% 0.14 Total $/person International $246 $120 Domestic $123 $71 Average $178 $207 $92 $104 100% % of all exp. 100% 100% 100% 100%
Notes: 1. Adjustment was made on the basis of detailed survey of activities businesses.

39
Table A.2 Visitor Origin and Expected Stay in Rotorua
Survey 1
Lake Front/City Survey 2
Regional Attractions Domestic International Domestic International
Visitor mix All people 62.0% 38.0% 35.0% 65.0% No. of nights 52.0% 48.0% 26.0% 74.0%
Day visit 33.7% 10.8% 19.4% 20.3% 1 night 8.5% 13.5^ 3.5% 18.1% 2 nights 7.2% 13.9% 5.3% 20.8% 3 nights 3.2% 3.2% 2.2% 6.2% 4 nights 1.1% 1.5% 1.1% 1.2% 5 nights 0.8% 0.2% 0.3% 0.4% >5 nights 1.2% 0.1% 0.4% 0.8% (Ave) (11.1 nights) (13.8 nights) (7.4 nights) (11.9 nights) Ave stay all visitors (days)1
1.6 1.9 1.5 1.7
Ave Nights (excluding day trippers)
2.4 2.2 2.3 2.0
Note: 1. Day trippers have a one day stay. A1.1 Technical Note
Respondents were broken into categories according to expected length of stay and domestic/ international. Expenditure patterns were then calculated for each category (on the basis of actual responses, although response rates varied across categories), and these patterns were then weighted according to the proportion of respondents in each category. The proportion was based on total interviews, and was adjusted to reflect the fact that long stayers are more likely to be interviewed than are short stayers If respondents are selected randomly, then a person staying for three days is three times as likely to be interviewed as one staying for only one day. This is the case no matter how long the survey period, unless the intensity of surveying is such that long stay people get interviewed more than once (and are dropped from the sample the second time). Interviewers reported very few instances of a person refusing because they had previously been interviewed. The implication of this is that in estimating the proportion of visitors who are in each stay category, one must adjust the survey data to reflect this probability of being surveyed. This has been done, except that people staying less than one day have been assumed to be as likely to be interviewed as those staying for a whole day (on the basis that most of them would have been in Rotorua during the survey period - which was generally from 11:00am to 5:00pm.
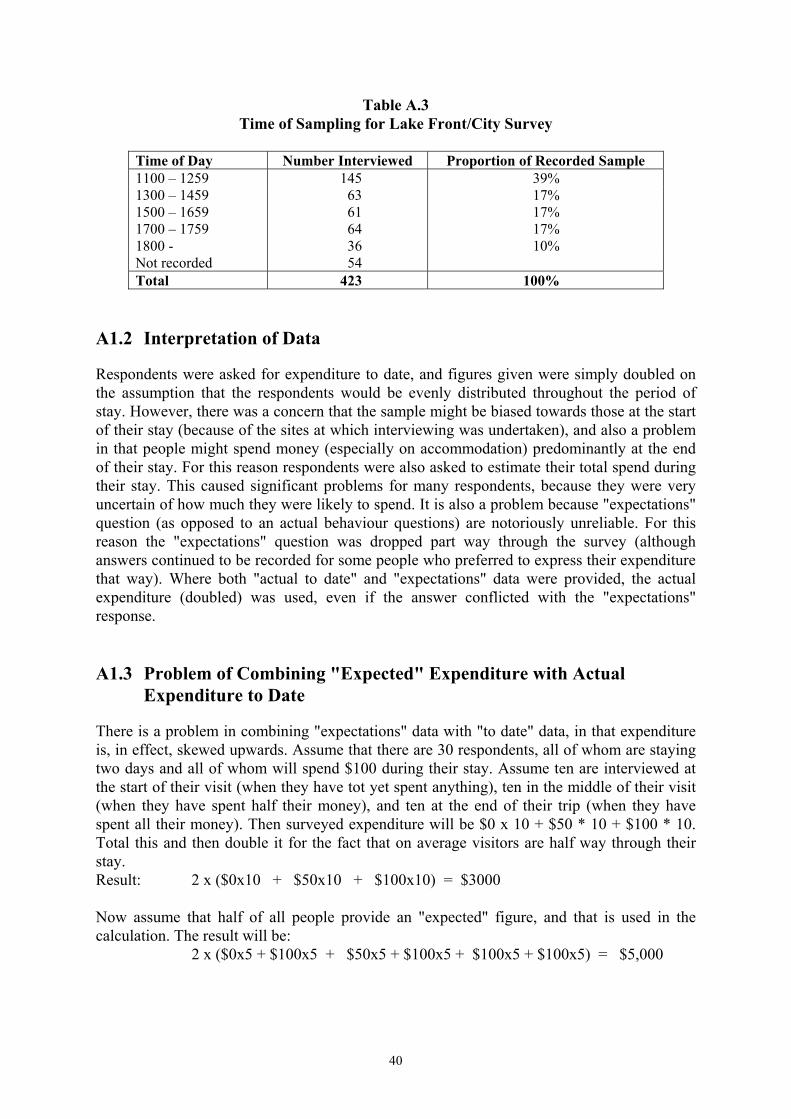
40
Table A.3 Time of Sampling for Lake Front/City Survey
Time of Day Number Interviewed Proportion of Recorded Sample 1100 – 1259 145 39% 1300 – 1459 63 17% 1500 – 1659 61 17% 1700 – 1759 64 17% 1800 - 36 10% Not recorded 54 Total 423 100%
A1.2 Interpretation of Data
Respondents were asked for expenditure to date, and figures given were simply doubled on the assumption that the respondents would be evenly distributed throughout the period of stay. However, there was a concern that the sample might be biased towards those at the start of their stay (because of the sites at which interviewing was undertaken), and also a problem in that people might spend money (especially on accommodation) predominantly at the end of their stay. For this reason respondents were also asked to estimate their total spend during their stay. This caused significant problems for many respondents, because they were very uncertain of how much they were likely to spend. It is also a problem because "expectations" question (as opposed to an actual behaviour questions) are notoriously unreliable. For this reason the "expectations" question was dropped part way through the survey (although answers continued to be recorded for some people who preferred to express their expenditure that way). Where both "actual to date" and "expectations" data were provided, the actual expenditure (doubled) was used, even if the answer conflicted with the "expectations" response. A1.3 Problem of Combining "Expected" Expenditure with Actual
Expenditure to Date
There is a problem in combining "expectations" data with "to date" data, in that expenditure is, in effect, skewed upwards. Assume that there are 30 respondents, all of whom are staying two days and all of whom will spend $100 during their stay. Assume ten are interviewed at the start of their visit (when they have tot yet spent anything), ten in the middle of their visit (when they have spent half their money), and ten at the end of their trip (when they have spent all their money). Then surveyed expenditure will be $0 x 10 + $50 * 10 + $100 * 10. Total this and then double it for the fact that on average visitors are half way through their stay. Result: 2 x ($0x10 + $50x10 + $100x10) = $3000 Now assume that half of all people provide an "expected" figure, and that is used in the calculation. The result will be:
2 x ($0x5 + $100x5 + $50x5 + $100x5 + $100x5 + $100x5) = $5,000

41
To avoid this problem, we simply double each individual expenditure-to date figure and leaves as-is each estimated figure. There is still a problem in that an "estimated" figure is more likely to come from a person at the start of the stay than one at the end (a person at the end knows and does not need to estimate), and hence the sample is effectively biased in terms of proportion-of- way-through-stay. There is no obvious way to cope with that problem. Even omitting the data from the data set would not solve the problem since the sample would then under-represent those at the start of their stay. To get some indication of the significance of the potential error, survey one figures were recalculated after excluding all the "estimated" figures. The result was that average expenditure per person declined by $13 per person, or seven per cent. In the case of accommodation for those only staying one night, those who had not yet paid (much less than half of the sample) were excluded since clearly those who had paid had paid for the entire stay. Where people indicated that they had not yet spent but expected to do so, the spend to date was set to $0 and used in the analysis. Where the recorded response (generally in activities - expected expenditure) was "$50 + ?", this was taken to mean $50 to date. Where groups sizes were above 10, it was assumed that it is possible for the person being interviewed to know about the expenditure pattern of the balance (presumably a bus load). Accordingly, their answers were excluded (with the exception of petrol - although they probably did not know the expense, it would be very small per person, and to set it at zero was probably much more accurate than to exclude it).


43
Appendix 2
Error Margins The survey of businesses has several potential sources of error, which are discussed below. Errors in any particular sector are likely to be greater than errors in the combined tourism sector since some errors will be off-setting. A.1 Source of Errors A1.1 Direct Impacts Employment There was a census of accommodation and “attractions” businesses to get employment figures, and hence there were no sampling errors. Some “attractions” businesses had multiple outputs (e.g., retail and activities) and there may have been some error in the allocation of FTEs between the two outputs. The ongoing entry and exit of small businesses from the “attractions” industry means that we may have missed some new small operators and hence there may have been a coverage error, although an allowance was made for this. “Attractions” proprietors were often making informed guesses about the proportion of turnover that was purchased by visitors and their estimates could have been wrong. However, any errors here are probably quite small. We believe that on balance the “attractions” employment is accurate to within ten per cent, and the accommodation employment is accurate to within five per cent. Employment in retail and restaurants was based on estimated output and national average employment : output ratios. There could have been significant errors in the measurement of output (see below), and it is possible that the ratios were not appropriate to the Rotorua situation. On balance, we believe that errors in retail and restaurant employment could be as high as 30 per cent. Output There are sampling errors for direct “attractions” output since only 23 per cent of activities were surveyed and there were significant sample variations in employment : output ratios. Accordingly we believe the likely margin of error is around 20 per cent. Output in accommodation was based on Statistics New Zealand censuses (all accommodation businesses have to provide quarterly data on sales), so there is no sampling error and perhaps a five per cent reporting and coverage error. Levels of expenditure on food and other retail expenditure compared with accommodation are based on the visitor expenditure survey. Two separate surveys gave quite similar results, and although both were undertaken in summer (which may differ from winter) the two survey populations varied significantly in terms of origin and average duration of stay. The similarity of results indicates that these factors do not significantly affect relative expenditure patterns. There may have been misallocation of spending (reported spending on “attractions” may have included spending on retail and food at activities sites). We believe that the probable margin of error is around 20 per cent.

44
Value-Added Data was collected for only 23 per cent by value of activities and about 13 per cent by value of accommodation. In addition, a number of businesses did not give us full access to accounts, so there may have been some errors in our assessment of value added. Margins of error (from sampling and data inaccuracy) could be of the order of 30 per cent. Down-Stream Impacts The error in down-stream output impacts arises from errors in estimating direct impacts and from errors in the basic GRIT table for the District. Also, any inaccuracy in employment : output or value-added : output ratios in the downstream industries will flow directly into employment and value-added estimates. We would expect errors in the tables to lead to up to a 30 per cent error in the flow-on effects in any particular industry. These errors will be on top of the direct output errors. Hence in the case of retail value added, there could be a 20 per cent error in direct output and a 30 per cent error in flow-on value added which combine to give a total error of 50 per cent in flow-on value added. Total Impacts Previous experience has shown that errors in ratios tend to be offsetting, and hence it is uncommon for total errors in any industry to exceed 20 per cent over and above the individual output errors. Moreover, errors in a combination of industries are also likely to be offsetting, and it is unlikely that combined errors for all of tourism will exceed 20 per cent for output and employment, and 30 per cent for value added. A.2 Size of Errors Direct Impacts Employment: Accommodation 5 per cent (data inaccuracy) Attractions 10 per cent (data inaccuracy) Food and retail 30 per cent (inaccurate output estimates, inaccurate ratios of
value added : output) Output: Accommodation 5 per cent (data inaccuracy) Attractions 20 per cent (sampling errors) Food and retail 20 per cent (sampling errors) Value-Added: Accommodation 20 per cent (sampling and poor data) Attractions 20 per cent (sampling and poor data) Food and retail 50 per cent (inaccurate output estimates, inaccurate ratios of
value added : output)

45
Flow-On Impacts Variable, but generally likely to be equivalent to direct output errors plus multiplier errors equivalent to 30 per cent for any given industry. Total Impacts for All Tourism Employment: Sampling errors plus estimation errors - 22 per cent Output: Sampling errors plus estimation errors - 25 per cent Value added: Sampling errors plus estimation errors - 45 per cent
Table A.4 Employment Error Margins
Error Error Error Direct
($m) % $m Indirect
($m) % $m Total
$m % Accommodation 1,150 5 60 470 35 120 1,620 180 11.1 Food and beverages 1,480 30 440 490 60 120 1,970 660 33.5 Attractions 525 10 50 235 40 60 760 110 14.5 Other 345 30 100 185 60 50 530 150 28.3 Total 3,500 20 650 1,380 25 350 4,900 1,100 22.4
Table A.5 Output Error Margins
Error Error Error Direct
($m) % $m Indirect
($m) % $m Total
$m % Accommodation 87 5 4 57 35 20 144 24 16.6 Food and beverages 87 20 17 51 50 25 138 42 30.4 Attractions 50 20 10 27 50 13 77 23 29.9 Other 86 20 16 18 50 9 104 25 24.0 Total 310 15 47 153 43 67 463 114 24.6
Table A.6 Value-Added Error Margins
Error Error Error Direct
($m) % $m Indirect
($m) % $m Total
$m % Accommodation 44 35 15 25 35 9 69 24 34.8 Food and beverages 38 50 19 25 50 13 63 32 50.8 Attractions 29 50 15 14 50 7 43 22 51.6 Other 15 50 7 11 50 6 26 13 50.0 Total 126 44 56 75 47 35 201 91 45.2