the economic impact of telecommunications on rural ... · d. souter et al., the economic impact of...
TRANSCRIPT

The Economic Impact of Telecommunications on
Rural Livelihoods and Poverty Reduction: A study of rural communities in
India (Gujarat), Mozambique and Tanzania
Report of DFID KaR Project 8347
Report by: Professor David Souter (Research Coordinator and Report Editor) with
Dr Nigel Scott Professor Christopher Garforth
Professor Rekha Jain Professor Ophelia Mascarenhas
Dr Kevin McKemey
Project managed for DFID by: Commonwealth Telecommunications Organisation
Project research partnership:
Commission for Science and Technology, Tanzania Gamos Ltd
ict Development Associated Ltd Indian Institute of Management (Ahmedabad)
Mozambique Information and Communication Technology Institute (at Eduardo Mondlane University)
This document is an output from a project funded by the UK Department for International Development (DFID) for the benefit of developing countries. The views expressed are not necessarily
those of the DFID.

2
The Economic Impact of Telecommunications on Rural Livelihoods and Poverty Reduction:
a study of rural communities in India (Gujarat), Mozambique and Tanzania
Report of DFID KaR Project 8347
Report by: Professor David Souter (Research Coordinator and Report Editor)
with Dr Nigel Scott
Professor Christopher Garforth Professor Rekha Jain
Professor Ophelia Mascarenhas Dr Kevin McKemey
Project managed for DFID by:
Commonwealth Telecommunications Organisation
Project research partnership: Commission for Science and Technology, Tanzania
Gamos Ltd ict Development Associated ltd
Indian Institute of Management (Ahmedabad) Mozambique Information and Communication Technology Institute,
Eduardo Mondlane University, Mozambique This report should be cited as:
D. Souter et al., The Economic Impact of Telecommunications on and Rural Livelihoods and Poverty Reduction (CTO for DFID, 2005)
or as Souter D., Scott, N., Garforth C., Jain R., Mascarenhas O., and McKemey, K., The
Economic Impact of Telecommunications on Rural Livelihoods and Poverty Reduction: a study of rural communities in India (Gujarat), Mozambique and
Tanzania (Commonwealth Telecommunications Organisation for UK Department for International Development, 2005)
This document is an output from a project funded by the UK Department for International
Development (DFID) for the benefit of developing countries. The views expressed are not necessarily those of the DFID. The report was completed in June 2005.

3
The Economic Impact of Telecommunications on Rural Livelihoods and Poverty Reduction:
a study of rural communities in India (Gujarat), Mozambique and Tanzania
Report of DFID KaR Project 8347
Contents:
Contact list 4Summary report 6Main research report 19
• Part 1: Introduction 19• Part 2: Project purpose, background and
methodology 26
• Part 3: Research findings and analysis 51• Part 4: Recommendations and further research 112
Annexes • Annex A: India (Gujarat) Research Report 128• Annex B: Mozambique Research Report 195• Annex C: Tanzania Research Report 268
Appendices • Appendix 1: India Questionnaire 336• Appendix 2: Mozambique Questionnaire 359• Appendix 3: Tanzania Questionnaire 387• Appendix 4: Initial Research Framework Document 415• Appendix 5: National Stakeholder Workshops 440

4
Research partnership contact details
Partnership
role Partner Contact Address Telephone, fax and
Internet contacts: Funding agency
Department for International Development
Shirley Capstick
Abercrombie House, Eaglesham Road, East Kilbride, Glasgow G75 8EA, United Kingdom
Telephone: +44 1355 844000 Fax: +44 1355 844099 Email: [email protected] Website: www.dfid.gov.uk
Project management
Commonwealth Telecommunications Organisation
Isabel del Arbol Stewart or Kojo Baokye
Clareville House, 26-27 Oxendon Street, London SW1Y 4EL, United Kingdom
Telephone: +44 20 7930 5511 +44 20 7024 7609 Fax: +44 20 7930 4248 Email: [email protected] [email protected] Website: www.cto.int
Research coordinator
Ict Development Associates ltd
Professor David Souter
145 Lower Camden, Chislehurst, Kent, BR7 5JD, United Kingdom
Telephone: +44 20 8467 1148 Fax: +44 20 8249 0891 Email: [email protected] Website: www.ictdevelopment.co.uk
Data analysis Gamos Ltd Dr Nigel Scott
Crown House, 231 Kings Road, Reading, Berkshire, RG1 4LS, United Kingdom
Telephone: +44 118 9267039 Email: [email protected] Website: www.gamos.org

5
National research partner (India)
Centre for Telecom Policy Studies, Indian Institute of Management (Ahmedabad)
Professor Rekha Jain
Ahmedabad – 380015, Gujarat, India
Telephone: +91 79 2632 4822 Fax: +91 79 2630 6896 Email: [email protected] Website: www.iimahd.ernet.in
National research partner (Mozambique)
Mozambique Information and Communication Technology Institute
Dr Américo Muchanga
MICTI, c/o Centro de Informatico, Universidade Eduardo Mondlane, Campus Universitario Principal, Avenida Julius Nyerere No. 257, Maputo, Mozambique
Telephone: +258 1 486697 Fax: +258 1 486969 Email: [email protected]: www.micti.co.mz
National research partner (Tanzania)
Commission on Science and Technology
Dr Theophilus Mlaki
PO Box 4302, Ali Hassan Mwinyi Road, Kijitonyama (Sayansi), Dar es Salaam, Tanzania
Telephone: +255 22 775313 Fax: +255 22 700745 Email: [email protected] Website: www.costech.or.tz

6
The Economic Impact of Telecommunications on Rural Livelihoods and Poverty Reduction:
a study of rural communities in India (Gujarat), Mozambique and Tanzania
Report of DFID KaR Project 8347
Report by:
Professor David Souter (Research Coordinator and Report Editor) with
Professor Christopher Garforth Professor Rekha Jain
Professor Ophelia Mascarenhas Dr Kevin McKemey
Dr Nigel Scott
Summary Report
This summary report is based on a short report of the research which has been published as a separate document by Panos London1
This document is an output from a project funded by the UK Department for International
Development (DFID) for the benefit of developing countries. The views expressed are not necessarily those of the DFID. The report was completed in June 2005.
TELEPHONES AND LIVELIHOODS : how the telephone impacts on the lives of the rural poor in developing countries
The last five years have seen tremendous growth in telephone ownership and use in developing countries. Until the mid-1990s, telephones were only available in the urban centres of poor countries. Some African countries had telephone densities as low as one per thousand people. Since then, mobile telephone
1 Copies are available from Panos London, 9 White Lion Street, London N1 9PD, United Kingdom (telephone
+44 20 7278 1111; fax +44 20 7278 0345; email [email protected]; or from the Panos website, www.panos.org.uk

7
networks have spread rapidly in most low income countries. Many people, even in low income communities, now own telephones; and most adults make some use of them, wherever they are available, usually relying on public kiosks, phone shops or airtime bought from individual phone owners. The mobile phone has become a symbol of the use of new information and communication technologies (or ICTs) in the developing world. But what impact has the telephone had on livelihoods – on how people live their lives, protect themselves against vulnerability and take opportunities for a more prosperous future? Do people use the telephone for social or business purposes? How important is it to them in emergencies? Does it make a difference to how they obtain the information they need to run their lives? And how does it fit into the pattern of other communication channels they have available? Very little substantial or detailed research has been done so far on these questions. The research reported in this document assesses the impact of the telephone on the lives of the rural poor in three developing countries – in the state of Gujarat in India; in Mozambique; and in Tanzania. The research was funded by the British Department for International Development’s Knowledge and Research programme, and coordinated by Professor David Souter of ict Development Associates ltd and the University of Strathclyde. Fieldwork for the project was undertaken by the Indian Institute of Management (Ahmedabad), Eduardo Mondlane University in Mozambique and the Commission on Science and Technology in Tanzania. Data analysis was undertaken by Gamos Ltd. The project was managed for DFID by the Commonwealth Telecommunications Organisation. How the research was done? The research was undertaken in three different developing countries. In India, the research was undertaken in the western state of Gujarat. In Mozambique and Tanzania, it was undertaken at different locations around the country. The survey was carried out in the second half of 2004. In each country, three research locations were chosen, and the research was undertaken in around thirty villages clustered around these locations – to ensure a wide variety of characteristics such as distance from markets and telephone facilities. In each location, about 250 adults – mostly heads of households – were interviewed at length about their household circumstances, communications requirements and behaviour, their use of telephones and their attitudes towards them. They were also asked about their use of Internet.

8
Taken together, the sample includes about 2300 interviews across the three countries. This is one of the largest surveys of telephone behaviour and attitudes to be undertaken in the developing world. The research findings in brief Findings from research of this kind are especially significant when they are consistent across different societies. Key findings from this study of the use of telephony were strongly consistent in all three research countries (India, Mozambique and Tanzania). The research showed that there was a consistent pattern of telephone behaviour in the three countries. Telephones were:
• considered very important for use in emergencies • extensively used to maintain social networks, especially contact within the
family • valued more for saving money than for earning money • valued more by richer and better educated people than by the poorer, less
educated or more marginal members of society – especially where financial value was concerned
• considered unimportant for information gathering. Telephone use fell into a pattern of communication flows and communications behaviour which was also consistent in all three countries. Telephone use was most important for emergencies and social networking. Broadcasting was most used and most valued for obtaining general information. Face-to-face communications was much the most important communications medium for specific information on issues such as farming, business and education. Hardly anyone in the sample populations had yet used the Internet. Telephone ownership and use The aim of the survey was to find out more about the impact which telephone use is having on the livelihoods of telephone users. Samples taken for the survey therefore concentrated on areas in which telephone networks are available and on the experience of people who are currently making some use of telephones. Previous research has shown that about 75% of adults make significant use of telephones in rural areas of developing countries where networks are available.2
2 See, e.g., the report of an earlier KaR study coordinated by Gamos Ltd: McKemey K., Scott N., Souter D.,
Afullo T., Kibombo R. and Sakyi-Dawson O., Innovative Demand Models for Telecommunications Services (Gamos Ltd for DFID, 2003)

9
There were some important differences in telephone use between the three countries:
• Fixed telephones are widely available in India. As a result, most telephone use in the Indian sample was of private fixed lines and telephone kiosks. (However, the mobile market is growing rapidly in India.)
• In Africa, by contrast, the fixed telephone network is much less widespread. Mobile phones were much more widely used than fixed phones in Mozambique and Tanzania.
Telephone ownership is growing rapidly and is highly valued. In all three countries, at least 45% of phone owners had acquired their phones within the past year – and at least 33% of those without a telephone said that they wanted to acquire one within the next year. Many of those who owned their own phones nevertheless also made considerable use of public access services such as kiosks or phone shops. Not everyone in rural areas can afford a phone, of course. In all three countries, it was clear that there was a distinct group of high intensity users – people who owned their own phone and used it more than once a day. These people tended to be high status individuals – in the highest income and educational groups. The poorest and least educated made least use of the telephone.
India 0% 10% 20% 30% 40% 50% 60% 70% 80% 90% 100%
Phone kiosk
Private f ixed line phone
Mobile phones
Short message service(SMS)
Fax
Email / internet
1 or more times per day
1 or more times per w eek
1 or more times per month
less than once a month
Not used
Mozambique
0% 20% 40% 60% 80% 100%
Public phone
Mobile phone
SMS
Private f ixedphone
Email/Internet
once or more p.d.
once or more p.w k
>once a month
<once a month
not at all

10
Tanzania
0%20%40%60%80%100%
Mobile
SMS
kiosk
private fixed
email/internet
Fax
% sample
1 or more times a day1 or more times a weekmore than once a monthless than once a monthNot used
Where telephones are valuable in improving livelihoods, this suggests that they are benefiting higher status groups most and the most marginalised groups least. The rapid growth in telephone ownership is likely to increase the number of beneficiaries considerably over the next few years, but the most marginalised could well be left behind. Nevertheless, public phone facilities are significantly used by the poor. In all three countries, the study found that low income groups spent a higher proportion of their income on telephony than high income groups. A good deal of spending on telephone use by the poor is likely to be on more important issues (such as emergencies) and in ways that save money (for example, by replacing the need to travel) – but the poorest groups also said that the telephone had a negative financial value for them (unlike the richest groups, who thought it positively beneficial). Communications priorities Why do people in rural communities want to communicate? What are their most important communication needs? The survey asked people to identify the importance of different types of communication to them. The chart on the following page shows the order of priorities identified by people in the Indian sample. This is very similar to the order found in the other two countries. Emergencies and social networking are the communications priorities for all three groups.

11
0% 20% 40% 60% 80% 100%
Emergencies
Social information
News (local andinternational)
Education
Farming and businessinformation
Weather information
Government/politicalinformation
Very importantImportantNo opinionNot very importantUnimportantNot applicable
Information and communication sources Different communications methods – and different information sources – are valued for meeting these different needs, as the following chart (also from India) shows.
0% 20% 40% 60% 80% 100%
Emergencies
Social information
News (local andinternational)
Education
Farming and businessinformation
Weather information
Government/politicalinformation
PhoneSMSInternetLettersRadioTVNewspaperAdvertsVillage Information CentreLocal leadersFace-to-faceNot applicable
These findings, too, are very consistent across the three research countries:
• Telephones are the preferred means of communications for emergencies and family networking – though they are less dominant in Africa than in India.
• Mass media are the preferred ICTs for general information such as news and weather – the television and newspapers being preferred in India, and broadcast radio in Africa.
• Face-to-face communications is overwhelmingly the main method of communications for specific information in all three countries, including information about education, farming, business and government services.
The research found that people had high levels of confidence in the mass media (and, to a lesser degree, in local officials, leaders and opinion-formers).

12
Taken overall, and weighting the importance of issues alongside declared preference for different methods of communication, face-to-face communication was about twice as important to people interviewed in the African samples as broadcast radio, with the telephone coming third. The telephone had, however, become the most important medium of communication when the Indian sample was similarly weighted. One other point worth noting is the preference for television over radio in India. About two-thirds of households in the Indian sample owned a television, while only about a quarter owned a radio. Broadcast radio, by contrast, was almost overwhelmingly available in the African communities. The difference is probably mostly due to two factors: the much better availability of power in India, and the lack of community and local radio there which is comparable to that available in Mozambique and Tanzania. The value of the telephone Much of the survey in all three countries was taken up with questions about people’s attitudes towards the telephone – and the value it has for them in their daily lives. Here, too, the findings were strongly consistent across all three countries, suggesting that they are representative of circumstances in rural areas of developing countries in general. Asked about their primary, secondary and subsidiary uses of telephony, people in all three countries strongly identified emergencies and social networking as their key uses of telephony. The importance of emergency use of telephony is not surprising, given respondents’ identification of emergencies as their primary communications need and the fact that the telephone offers something that no other communications medium can provide – immediate help, especially if it has to come from a distance. This is just as true of urgent needs (for money) as of immediate emergencies (such as those related to health or injury). Communication within the family is the second key use of the telephone identified by the respondents. This is much more important than communication with non-family members, particularly in Mozambique (which has a substantial proportion of migrant workers). Only about 5% of users identified business as their primary use of the telephone, while the proportion that described “gaining new knowledge” as their first, second or third most significant use was very low, under 2.5%. Responses were equally clear and equally consistent across the three countries when interviewees were asked to say how helpful their use of the telephone

13
(whether private or public) had been for social, economic and knowledge-gathering purposes.
India 0% 20% 40% 60% 80% 100%
Socialcommunications(social capital)
Economic activities(financial capital)
Knowledge (humancapital)
Very helpfulHelpfulNo opinionUnhelpfulVery unhelpful
Mozambique
0% 20% 40% 60% 80% 100%
Socialcommunications(social capital)
Economicactivities (f inancial
capital)
Know ledge andeducation (human
capital)
very helpful
helpful
no opinion
unhelpful
very unhelpful
Tanzania
0% 20% 40% 60% 80% 100%
Socialcommunications(social capital)
Economicactivities
(f inancial capital)
Know ledge(human capital)
Very helpfulHelpfulNo opinionUnhelpfulVery unhelpful
In all three countries, respondents gave:
• very high value to the telephone as an instrument for social networking • mixed value to the telephone as an instrument for economic activities • and very low or negative value to the telephone as an instrument for
knowledge-gathering. The findings on the social and knowledge-gathering values of the telephone were also consistent across all significant socio-economic groups – including economic and educational status groups – as well as by gender and other demographic criteria. The following charts illustrate this for economic status groups in the three countries.

14
Social networking
-1 -0.5 0 0.5 1 1.5 2
poorest
poor
medium
rich
attitude (mean)
Tanzania
Mozambique
India
Information-gathering
-1 -0.5 0 0.5 1 1.5 2
poorest
poor
medium
rich
attitude (mean)
Tanzania
Mozambique
India
It is a very different story for economic activities, however, as shown by the third in this series of charts. Here, it can be seen that the telephone is considered to have economic value by higher income groups, but to have negative economic value by lower income groups.
Economic actitivies
-1 -0.5 0 0.5 1 1.5 2
poorest
poor
medium
rich
attitude (mean)
Tanzania
Mozambique
India
This finding is repeated in other status categories – such as educational status, telephone ownership and frequency of telephone use - suggesting that the telephone is having a positive economic impact on the more prosperous members of society but not on those who are more marginalised. For these more marginalised groups, the value of the telephone lies overwhelmingly in its availability for emergencies and its contribution to family networks. More detailed questioning on particular livelihoods issues – reported in the full research report – further emphasises these findings. In particular, it emphasises once again the overwhelming importance of emergency use for all social and

15
economic groups, and the very low rating attached to telephony for information-gathering. It also emphasises the importance of certain functional characteristics of telephony in establishing its value: notably, its immediacy (speed of communications), its interactivity, and the ability to get things done at a distance (its value in reducing remoteness). Gender issues Household data of the kind generated by the survey have limited value for gender analysis because they are collected on a household rather than an individual basis. It is clear, however, that on average women tend to fall into more marginalised groups within the sample than men, and are therefore – for example - less likely to make frequent use of telephony or to perceive economic benefit arising from it. The research team hopes to complement the work done for this survey with further work that will more clearly identify differences which the impact of telephony is having on individuals by gender, age and other demographic categories. Use of the Internet It was hoped that this research would provide information about use of and attitudes towards the Internet as well as telephony in the populations surveyed. In practice, however, in spite of the availability of Internet facilities in local towns, less than 2% of those surveyed had ever made any use of these. There are therefore insufficient data to make any assessment of Internet use, other than to say that the Internet has not to date had any significant impact on the communications resources used by these rural populations. Impact on other communications media There is some evidence in the survey that use of the telephone is having a significant impact on social behaviour. A high proportion of respondents said that there had been a reduction in their use of social visits, face-to-face communication and travel since the telephone became available. This is not, however, necessarily very significant. The availability of the telephone is certain to lead to some substitution of these other activities, particularly where less important visits and discussions are concerned. It seems likely that these responses are reporting this substitution effect for such less important activities rather than for more significant visits and meetings. Much more important is the impact which the telephone is having on postal services. The large majority of respondents in all three countries reported a very large reduction in their use of postal services since the telephone became

16
available, and this is sure to have a lasting impact on the economic viability of national postal services. Telephony and livelihoods The main purpose of the study was to look at the impact of telephones on the livelihoods of low-income rural communities. Sustainable livelihoods analysis looks at people’s livelihoods in terms of five different types of assets:
As expected, the results showed that the telephone has little impact on natural capital (land, water etc.) or on physical capital (resources such as housing, farm equipment and so forth). More important is the impact revealed on the three areas of livelihood capital which are often discussed in relation to telecommunications – social, financial and human capital. The impact of the telephone on social capital revealed by the survey is considerable. The telephone is important and considered to have high value in all three countries for social networking, particularly within the family. It is providing significant added value in this area, especially where family members live remotely (as migrant workers or in the diaspora), as well as substituting for some face-to-face communications. The impact of the telephone on economic activities is mixed. The telephone is considered to have value by a high proportion of users when it comes to saving money (for example, by substituting for transport or postal costs), but it is not considered to have value by most users when it comes to earning income. Only the more prosperous, educated and successful are finding it valuable in this area. Lower income and lower education status groups, by contrast, find it unhelpful. The telephone may well, therefore, tend to increase the differential in financial capital between the more prosperous and the more marginalised within society.
17
The telephone is having no impact on information-gathering, the primary component of human capital in this context, in any of the three sample populations. For all groups, face-to-face communications remains the overwhelming medium of communications for information-gathering. The Internet has also failed to achieve any significant degree of usage in this area. This clear rejection of the telephone, in particular, for knowledge-gathering has significant implications for policymakers designing public information and other development strategies. The most substantial value of the telephone in terms of livelihoods is in its impact on overall vulnerability, particularly in emergencies. The telephone here has exceptional added value compared with other communications media, in particular because of its immediacy, interactivity and ability to secure assistance from afar. Recommendations to policymakers The findings of this study provide the first detailed evidence of the impact of telephony on communications behaviour and livelihoods in rural communities in developing countries. The strong consistency of many of the findings across the three research countries suggests that they are likely to be relevant in many other similar contexts. Communications flows are much slower to change than communications technologies. Policymakers in government, business, development agencies and other stakeholder groups would do well to focus on the established and trusted communications patterns within beneficiary communities and build upon these when seeking to influence behaviour or achieve development or business goals. The overwhelming importance of social communications needs within telephony and the high degree of preference attached to mass media and face-to-face communications are particularly important in this context. New media and new technologies are most readily adopted within populations when they meet established needs or offer substantial added value – and ease of access – in comparison with existing media and technologies. Telephony offers a much better way of meeting high value priorities such as emergency support and family networking, but is seen as less effective than face-to-face communications in providing information. Broadcasting is highly valued for its general information provision and its entertainment value. In the surveyed populations, the Internet faces considerable barriers to use, including cost, skill requirements and lack of valued content as well as difficulty of access and lack of experience in use. Take-up is also likely to be slower with more complex technologies.
18
Telecommunications access is highly valued by all sections of the community, particularly because of its potential role in emergencies. This implies that universal access has substantial social value, irrespective of revenue that may be derived from it by telecommunications operators – reinforcing the value of universal access strategies and funds from a public policy perspective. However, the high level of use of the telephone for social networking implies that subsidised access should not be required in most rural locations – a finding corroborated by experience in Uganda, where unsubsidised wireless access now covers over 85% of the population of a low-income rural country. The high value attached to broadcasting and to face-to-face communications suggests that policymakers should pay particular attention to the role of these information intermediaries in applying ICTs to development. Broadcasting – radio in Africa, but television in India – is particularly useful for disseminating information of general value, both where urgent action is required and in gradual transformation of behaviour patterns (for example, health promotion). Information intermediaries such as local opinion-leaders and agricultural extension officers can give much more detailed and specific advice. The telephone, SMS, fax machine and (when and where available) Internet can be effectively deployed to support their work even where they are of limited value in providing information directly to target beneficiaries. The survey’s findings concerning the economic value of telephony are also of significance. It would appear from the findings that higher status groups are finding the telephone of positive economic value, but that this experience is not shared by lower status groups. This suggests that the telephone may be increasing the differential between rich and poor, prosperous and marginalised at this stage of its adoption and distribution. Governments, development agencies and NGOs should keep a close eye on this issue to mitigate any tendency for ICTs to contribute to the growth of inequality. Further research along the lines of this study would be appropriate, especially in building a broader range of experience and assessing the impact of telephony and other ICTs over time. Telephony, in particular, is being adopted at a very rapid rate and it is vital to understand trends over time in the impact this is having on livelihoods, as well as taking occasional snapshots of the current picture. More attention should also be paid to the value which people attach to different forms of broadcasting and broadcasting content, to differences between women and men in the adoption of telephony, and to the changing impact of telephony and Internet on business and other income-generating activities.
19
The Economic Impact of Telecommunications on Rural Livelihoods and Poverty Reduction:
a study of rural communities in India (Gujarat), Mozambique and Tanzania
Report of DFID KaR Project 8347
Report by:
Professor David Souter (Research Coordinator and Report Editor) with
Professor Christopher Garforth Professor Rekha Jain
Professor Ophelia Mascarenhas Dr Kevin McKemey
Dr Nigel Scott
Main research report
PART 1:
INTRODUCTION This report describes the findings of a study of the impact of telephony and related information and communications technologies (ICTs) on the livelihoods of low-income communities in three developing countries. The research from which these findings are derived was conducted by an international research team in India (State of Gujarat), Mozambique and Tanzania during the middle months of 2004. It was made possible by a Knowledge and Research programme grant funded by the UK Department for International Development (DFID) and managed on behalf of DFID by the Commonwealth Telecommunications Organisation (CTO). The findings of the study offer new evidence of the interaction between low-income communities and new information and communication technology,

20
particularly telephony, which has significant value for understanding the dynamics of ICT use and deployment and for future development and ICT sector planning. The significance of telecommunications and other ICTs in contributing to social and economic development has received increasing emphasis in development discourse over the past decade. Access to telephony has become much more widespread in developing countries, including Least Developed Countries (LDCs), as a result of the spread of mobile wireless networks, which now cover the majority of inhabited locations in most countries. This has made telephony available for the first time to hundreds of millions of people in millions of settlements, either as private subscribers or as users of public access points. The expansion of telecommunications connectivity has also enabled wider access to Internet services, although to date these are much less widespread and used by a very much smaller proportion of developing countries’ populations. Governments, private sector businesses and civil society organisations have paid increasing attention to the potential of these new information and communications resources to deliver social and economic development goals, alongside older ICTs such as broadcast radio - to such an extent that the role of ICTs in development has merited a global summit process, the World Summit on the Information Society (first session, December 2003; second and final session scheduled for November 2005). The speed with which access to telephony and related ICTs has expanded in the past decade has not been matched by a corresponding increase in research into their impact in low-income communities. Although a large number of pilot ICT projects have been undertaken and evaluated, there is little researched evidence concerning the impact of new ICTs (including telephony) outside such projects, i.e. in a normal market environment, or in larger territorial areas. The emphasis of most research which has been undertaken has been on discontinuities rather than continuities – i.e. on the potential use of new ICTs to change prevailing circumstances rather than on the relationship between them and established information and communication flows or patterns of behaviour. Furthermore, in spite of the emphasis placed by many development specialists on the concept of a ‘digital divide’, little attention has been paid to the impact telephony and other ICTs have on the distribution of assets, resources and opportunities between different communities and social groups, or between women and men. The research whose findings are described in this report was designed to provide more substantial evidence that would contribute towards addressing these deficits, particularly where telephony is concerned. Field research, based on questionnaires and interviews, was undertaken in several locations in each of three developing countries. Within the selected locations, interviews were conducted with a random sample of households and (in two countries) with a supplementary group of small-scale business people (such as small traders). This sample data
21
has been analysed – and findings are reported – both for individual countries and for the three-country sample as a whole. Data analysis was conducted within the framework of the sustainable livelihoods approach, with particular attention being paid to vulnerability in general and to three of the asset types significant to household livelihoods – financial assets (such as income), social assets (such as networking) and human assets (in particular, access to and use of information and knowledge resources). The methodology for this analysis is described in Part 2 of this report. It is important to understand that the populations selected for field research do not represent a random sample of the populations of their countries. Data on usage levels, therefore, cannot be generalised from these data to national populations as a whole: 20% mobile telephone ownership within a national sample would not, for example, imply that 20% of rural citizens within the country concerned own mobile telephones. Establishing a snapshot of the level of telephone usage at a particular moment in time was not, however, the purpose of the study. That purpose was to look at the impact of telephony on sample populations of a specific type – in particular, rural or semi-rural communities with recent new experience of telephony access and, within them, actual telephone users including small businesses. Findings relate to the experience and behaviour of groups within rural society that are making use of telephony, and so illustrate the impact of that use of telephony on those groups. Such impacts are likely to be repeated as use of telephony extends further and deeper into rural society, and it is at this level that the findings can be generalised across each research country. Findings which are consistent across all three countries are particularly robust, and provide important evidence for likely behaviour and impact during the transition to telephone access and use in a wide range of developing countries. The scale and scope of the research in this study are more substantial than those in almost any other published work to date in this field, and they therefore add substantially to the quality, quantity and robustness of data available for analysis. The shortage of comparable research to date has, regrettably, encouraged exaggeration and misrepresentation of the findings of much smaller studies than that reported here; and the research team for this project is concerned that the findings of this study should be used with more rigour and accuracy than has befallen these smaller studies. This report only includes findings which the research team considers sufficiently robust and reliable to provide input and indicators for policymaking in the research countries and elsewhere. The research team believes they make a significant and valuable contribution to existing knowledge in this field. However, as with all research of this kind, care should be taken when generalising from these findings and interpretation for other countries should pay full attention to the different circumstances involved. The research team for this study (ictDA, Gamos Ltd, Professor Christopher Garforth and the national research partners) does not endorse the conclusions drawn in any

22
publication or study that makes use of the project research data unless its endorsement is explicitly expressed in such a publication or study. Fieldwork for the study was undertaken during the summer and autumn of 2004 in India (State of Gujarat), Mozambique and Tanzania by researchers from three national research centres – the Indian Institute of Management (Ahmedabad) (IIM(A)) (India), the Mozambique Information and Communication Technology Institute at Eduardo Mondlane University (Mozambique) and the Commission on Science and Technology (COSTECH) (Tanzania). The research teams in the three countries were led by Professor Rekha Jain (India), Professor Venancio Massingue (Mozambique) and Dr Theophilus Mlaki (Tanzania). Data analysis was undertaken by the UK consultancy Gamos Ltd, led by Dr Nigel Scott and Dr Kevin McKemey, with additional input from Professor David Souter of the UK consultancy ict Development Associates ltd and the University of Strathclyde, Professor Christopher Garforth of the University of Reading, Professor Rekha Jain of IIM(A) and Professor Ophelia Mascarenhas of the University of Dar es Salaam. The research project as a whole was coordinated by Professor David Souter, who also interfaced with the project manager at the Commonwealth Telecommunications Organisation. This report was coordinated and edited by Professor David Souter, with written contributions from Professor Christopher Garforth, Professor Rekha Jain, Professor Ophelia Mascarenhas and members of the national research teams, together with data tables and analysis by Dr Nigel Scott. The study was funded through a grant from the Knowledge and Research (KaR) programme of the UK Department for International Development (DFID). Additional research and analysis time was contributed, on a pro bono basis, by ictDA and Gamos Ltd. The project was managed for DFID by the Commonwealth Telecommunications Organisation (CTO) under the management oversight of the International Institute for Communications and Development (IICD). The research team would like to express their thanks to the project manager at the CTO, Ms Isabel Stewart, for her support during the project. This remaining parts of this report are as follows: Part 2 includes a general discussion of the project as it was undertaken, including an outline of the research questions addressed and a description of the research methodology used. Part 3 summarises the research findings in each research country and compares findings across the three countries. It includes a discussion of information and
23
communication patterns and requirements; of actual ICT and telephony use; of real and perceived impact on livelihoods; and of other findings resulting from the data analysis. Part 4 draws conclusions from the research overall, identifies a number of suggestions and recommendations for policymakers in governments, international organisations, the private sector and civil society, and outlines areas for further research. Annexes A, B and C include full reports of the data and findings in each of the three research countries. Annex A reports on the research in India (State of Gujarat), Annex B on that in Mozambique and Annex C on that in Tanzania. These annexes are written in closely comparable style and format in order to facilitate cross-country comparison, and can be used as stand-alone documents in individual research countries. Appendices contains copies of the survey questionnaires used in each research country and list participants in national stakeholder fora that formed part of research design and validation processes. As required by the terms of DFID’s KaR programme, full data sets of the field research are freely available to researchers. Like the research and findings contained in this report, these data sets may be freely used, subject to inclusion of the following acknowledgement:
These findings are drawn from the results of a Knowledge and Research project funded by the UK Department for International Development (DFID) for the benefit of developing countries. The views expressed in this article are not necessarily those of the DFID, nor those of the researchers who compiled the original KaR study.
This report should be cited (in short form) as D. Souter et al., The Economic Impact of Telecommunications on and Rural Livelihoods and Poverty Reduction (CTO for DFID, 2005), or (in full) as Souter D., Scott, N., Garforth C., Jain R., Mascarenhas O., and McKemey, K., The Economic Impact of Telecommunications on Rural Livelihoods and Poverty Reduction: a study of rural communities in India (Gujarat), Mozambique and Tanzania (Commonwealth Telecommunications Organisation for UK Department for International Development, 2005) A separate, short report on the findings of this study is available from Panos London. Acknowledgements This study is the result of work undertaken by a large group of researchers in four countries, supported by administrative personnel.

24
The project was initially developed and proposed to DFID by Professor David Souter, then Chief Executive Officer of the Commonwealth Telecommunications Organisation, and Dr Nigel Scott of Gamos Ltd in 2002. Research design, coordination and report-writing were led by Professor David Souter of ict Development Associates ltd and the University of Strathclyde. Dr Nigel Scott and Dr Kevin McKemey of Gamos Ltd led the research methodology and data analysis phase of work. They also played a major part in research design and contributed to research implementation, particularly concerning field research. Further analysis of findings was undertaken by Professor Christopher Garforth of the University of Reading, Professor Rekha Jain of the Indian Institute of Management (Ahmedabad) and Professor Ophelia Mascarenhas of the University of Dar es Salaam. Additional research and analysis work were contributed, on a pro bono basis, by Professor David Souter of ictDA and Dr Nigel Scott of Gamos Ltd. The research work in India was led by Professor Rekha Jain of the Indian Institute of Management (Ahmedabad), who was assisted by Ms Payal Gupta of the Centre for Telecom Policy Studies at IIM(A). The research work in Mozambique was led by Professor Venancio Massingue, then Vice-Rector of Eduardo Mondlane University, now Minister of Science and Technology in the Government of Mozambique. Professor Massingue was assisted by Dr Arao Balate, Américo Muchanga, Dr Arao Balate, Dr Polly Gaster, Eng. Jamo Makanze, Eng. Constantino Sotomane and Ms Deolinda Salamao. The research work in Tanzania was led by Dr Theophilus Mlaki of the Commission on Science and Technology (COSTECH), Professor Ophelia Mascarenhas of the University of Dar es Salaam and Professor Ntengua Mdoe of Sokoine University of Agriculture. They were assisted by Mr Simbo Ntiro of eThinkTank Tanzania, Mr Peter Ulanga of the Tanzania Communications Regulatory Authority, Eng. Philemon Kilassa of COSTECH and Ms Christine Mwase of the University of Dar es Salaam. Additional research input in the UK was contributed by Mr Kojo Boakye of the Commonwealth Telecommunications Organisation and by Mr Paul Hamilton. Valuable discussions were also held during the project with Mr James Deane of the Communication for Social Change Consortium (formerly of Panos London), Mr Dylan Winder and Mr David Woolnough of DFID.

25
The project was discussed in detail with a wide range of expert stakeholders in each research country before the field research was undertaken, and the findings were also discussed in stakeholder fora held shortly before publication. The value of the contributions made in these discussions was considerable, and the input of all participants is hereby duly acknowledged. Lists of participants in these meetings are included in appendices at the end of this report. The project was managed for DFID by Ms Isabel Stewart of the Commonwealth Telecommunications Organisation (CTO), with assistance from Mr Kojo Boakye. Financial arrangements were managed at the CTO successively by Mr John Ryan and Mr Rakesh Luchmun. Overall oversight of the Knowledge and Research programme was undertaken for DFID by Mr Ivan Kulis of the International Institute for Communications and Development (IICD). Administrative support to ict Development Associates ltd was provided by Miss Barbara Fowlds and technical support to Gamos Ltd was provided by Mr Simon Hearn. A separate short report on the findings of the study has been published by Panos London. This short report was written by Professor David Souter with Ms Kitty Warnock of Panos London.
26
PART 2:
PROJECT BACKGROUND, PURPOSE AND METHODOLOGY This section of the report sets out the background to KaR research project 8347, outlines the main research questions addressed by the research and describes research methodology.
A. Background Telecommunications, ICTs and Development Both policy and literature on telecommunications, ICTs and their role in social and economic life have developed greatly in the past ten years. With the exception of occasional international reports, such as that of the Maitland Commission (1985), the prevailing view within development agencies up to the mid-1990s was that telecommunications and ICTs had relatively little role to play in social and economic development. Telecoms services tended to be viewed as luxury goods, unavailable in rural areas and unaffordable to poorer urban citizens, with little potential impact on the delivery of public services or the capacity of the poor to improve their incomes or quality of life. This perception has changed dramatically since the mid-1990s. A number of multilateral agencies, including the World Bank and the United Nations Development Programme, have given substantial emphasis to ICTs in their development strategies, in particular to the perceived potential for creating ‘Knowledge Societies’ or ‘Information Societies’ in which access to information resources through ICT services (including Internet), electronic commerce and electronic government combine to transform individuals’ and communities’ capacity for self-empowerment and economic growth. Bilateral agencies, including DFID, have associated themselves to greater or lesser degrees with this approach, many developing their own ‘ICT4D’ or ‘ICD’ (information and communications for development) strategies. This new interest in ICD has intensified as a result of the work of the G8 DOT Force and the United Nations ICT Task Force and of dialogue surrounding the World Summit on the Information Society (WSIS) which was scheduled to be held in two sessions in December 2003 and November 2005. The debate around information and communications for development continues, however, and many development specialists and agencies remain wary of over-committing resources to a sector whose contribution to core development

27
objectives they still consider uncertain or unproven. Most leading development agencies have adopted an approach of ‘mainstreaming’ ICTs in development, i.e. of focusing not on the ICT sector itself but on ICTs’ capacity to add value or contribute to the implementation of ‘mainstream’ development goals in areas such as health, education and agricultural production. The Millennium Development Goals (MDGs), adopted by the United Nations, its agencies and most other development organisations, have become central to this ‘mainstreaming’ approach and many agencies stress the importance they attach to identifying ways in which ICTs might contribute to the achievement of the MDGs. A principal problem for policymakers in this area is the shortage of published research on the impact of ICTs in overall economic development and in particular mainstream development contexts, at both macro and micro levels. A strong evidence base for policy development is essential if the expensive investments required for ICT networks and ICD applications are to be most effective in achieving MDG and other goals. Evidence is needed in particular about the impact of ICTs on economic growth and the role of ICTs within the wider context of information and communication resources available to communities and individuals. In spite of assertions to the contrary, it has proved difficult to demonstrate a conclusive correlation between IT investment and productivity or economic growth at a macro level, even in industrial countries (the so-called ‘Solow paradox’3). Recent research by the OECD suggests that such a correlation can be established in industrial countries, but requires complementary factors such as regulatory reform and organisational changes within the firm, takes considerable time to flow through to national economic outcomes, and is highly dependent on network externalities (i.e. the added value derived from a high degree of network interaction within economies). There is no reason to suggest that the importance of these factors will be any less in developing countries and this is therefore likely to impact on the pace there, too, at which IT investment contributes to economic growth.4 There are also serious gaps in research about the impact of ICTs at the micro level, resulting partly from the very recent nature of extensive ICT deployment in development contexts (individual firms, projects and programmes) and partly from weaknesses in the nature of the research conducted. Most general studies of this subject rely heavily on anecdotal evidence from a small number of instances of ICT applications, usually undertaken within development-oriented pilot projects. While valuable, these studies cannot provide sufficient body of evidence to justify 3 so-called after the American economist Robert Solow’s remark that ‘you can find computers everywhere except in the productivity statistics.’ 4 See Organisation for Economic Cooperation and Development, ICT and Economic Growth: Evidence from OECD Countries, Industries and Firms (Paris, 2003) and D. Souter, ‘ICTs and Economic Growth in Developing Countries’ in OECD Development Assistance Committee Journal, Vol. 5 No. 4 (2004).

28
substantial conclusions about the impact of ICTs on any general level unless and until they are complemented by impact studies addressing wider communities and contexts other than specific development projects. In particular, in this context, very little research has been conducted into the distributional effects of ICTs in low-income communities (e.g. assessing the impact of ICT initiatives on non-users as well as users); into the scalability, replicability and representativeness of ICT initiatives; or into the impact of ICT initiatives on standard measures of the lives and livelihoods of poor individuals, households and communities. Such evidence is particularly important if policy is to be based on a sound understanding of the distribution of ICTs’ benefits, and particularly of the “digital divide” between rich and poor within societies. The third major deficiency in existing research concerns information and communication flows and patterns. Assessments of the impact of ICTs often focus on the discontinuities that are perceived between pre- and post-connectivity periods. They therefore emphasise the way in which technological potential can be exploited to provide new benefits and opportunities. However, uptake of ICTs depends on human behaviour at least as much it does on technological potential. Human behaviour changes more slowly, and the impact of ICTs on it is a product of interaction between them and older, established information and communication channels and resources. A more accurate understanding of the impact of ICTs on communities requires two things: a) more emphasis on the continuity of information and communication flows (alongside the discontinuities of technology); and b) more assessment of the process of change over a period (of trends, as well as snapshot views of impact at a particular point in time). KaR project 8347 aims to make a contribution to understanding of these crucial aspects of the impact of ICTs on communities in developing countries today, focusing on the most widely used and most rapidly growing ICT, i.e. telephony, particularly mobile telephony. Research was deliberately focused on locations which had not benefited from specific ICD interventions, in order clearly to distinguish the impact of telephony from that of such specific development-oriented interventions. The research samples used for the study are among the largest yet taken in this field, and offer findings which are consequently more substantive and more robust than studies undertaken in fewer locations, with fewer respondents or in order to assess the impact of specific development projects.
Telecommunications and other ICTs One key issue in this area of policy debate is the definition of ICTs. DFID has used the definition:

29
technologies that facilitate communication and the processing and transmission of information by electronic means.5
Another definition, developed by researchers at the University of Manchester’s Institute for Development Policy and Management, is:
electronic means of capturing, processing, storing and disseminating information.6
These definitions need to be understood in two different contexts. One context is that of the information and communications sector. In this context, ICTs are often regarded as having evolved from telecommunications, computing and information technology, as being largely dependent on these and therefore essentially ‘digital’ in character. They therefore include telephony and its derivatives including data communications, the Internet, computer applications such as those used for e-commerce and e-government, and products and services derived from these (for example, those made available in multipurpose telecentres). The other context is that of information and communication processes. In this context, ICTs are seen within the context of historic and established information and communication flows, and of the other information and communication resources available and used by citizens and consumers – including interpersonal networks and traditional sources of knowledge within the community as well as broadcast radio, television and the print media. Broadcast radio and television are sometimes referred to here as ‘old ICTs’ to distinguish them from ‘new’ or digital ICTs, such as computing and modern telecommunications, which depend on bit transmission technologies7. It is increasingly understood that, to be effective, any analysis of or strategy for ICT deployment must be grounded in a sound understanding of this latter ‘information process’ context, not just in an assessment of technological potential. The relationship between telecommunications and other ICTs is complex. On the one hand, the telecommunications industry provides the basic infrastructure for most of the new ICTs now widely discussed – not just for telephony itself but also for the data communications which enables the networking of computers and information technology services, and so enables the applications that run on them. On the other, telephony provides an essentially individual service, enabling people to communicate directly with one another. This is distinct from both broadcasting 5 P. Marker, K. McNamara and L. Wallace. 2002. The Significance of Information and Communication Technologies for Poverty Reduction. DIFD. London. p4. 6 Duncombe R. and R. Heeks (1999) ‘Information, ICTs and Small Enterprise: Findings from Botswana’, IDPM Manchester Working Paper No. 7, November 1999. 7 i.e. on the transmission of data in the form of the digits 0 and 1, the language understood by computers.

30
(which primarily allows generalised communication from one source to many users) and most applications of computing and information technology (which are primarily used for administrative and managerial functions). (Internet use is more hybrid – including email, which is most similar to telephony in use; web browsing, which is most similar to broadcasting where other ICTs are concerned; and specialist applications, file-sharing etc., which are most closely related to information technology). This report focuses primarily on telephony, which is a service provided over telecommunications networks by telecommunications service providers and (in the case of public access facilities) retail outlets offering access to telecoms facilities. The following paragraphs describe recent changes in the structure of the telecommunications sector in developing countries in recent years. The telecommunications sector has changed enormously during the past twenty years, in both industrial and developing countries. The main processes in this transformation have been: • technological change, including the very rapid development of new
technologies enabling much faster transmission of voice and data communications at much cheaper rates and with much lower deployment costs;
• the evolution, through new technology, from one major product (voice telephony) to four major products (fixed telephony, mobile telephony, data communications and Internet services);
• the increasing technological and business convergence of telecommunications services with computing applications, broadcasting, publishing and financial services;
• the transition of telecommunications businesses from a primarily national to a primarily international character;
• the privatisation of many, probably most, previously state-owned telecommunications operators;
• the liberalisation of most previously monopoly telecommunications markets and the establishment of most new markets (including mobile telephony and Internet markets) on a competitive basis;
• and the introduction of independent regulation of telecommunications markets, focused on the promotion and maintenance of market competition.
This transformation of the structure of telecommunications has had profound implications for the delivery of telecoms services and for the relationship between government, the private sector and civil society in the delivery of these services. Mobile telephony has become very widely used within all societies in which access is now available, and is an important addition to the range of information and communication channels available at all income levels, including the very poor.

31
The establishment of the Internet has also had profound implications for the availability - to enabled users - of information and communication resources, and on the relationship between telecoms services and these wider information resources. The Internet offers two core services to users today: • electronic mail, which both substitutes for postal services, fax and voice
telephony and provides additional functionality in inter-personal, inter-business and other communications;
• and web browsing, which provides access to an enormous range of information and entertainment resources worldwide to any user with an Internet connection of sufficient quality and the requisite skills to make full use of it (literacy in relevant language, search skills etc.).
The relative importance and impact of the Internet compared with other information and communications channels in developing countries is controversial.8 Information services based on Internet do not substitute for more traditional information sources such as broadcasting, which remains the primary source of information in many areas of rural Africa and Asia as in other parts of the world. Prior research to this study undertaken with DFID KaR funding indicated that levels of Internet use in communities such as those studied in this research were then too low to offer scope for meaningful analysis.9 This indication was confirmed by the research undertaken for this study, and analysis of the data has therefore focused on the information and communication resources actually and currently used by significant numbers of individuals questioned in the field research. Telephony is the primary ICT reviewed in this analysis, but its value and role in contributing to livelihoods is compared with other information sources such as broadcast radio and television.
Telephony and ICT demand, usage and impact There has been considerable debate about the extent of demand and use of ICTs, particularly telephony, in rural areas of Africa and South Asia in recent years. 8 See, for example, Charles Kenny, ‘Should We Try to Bridge the Global Digital Divide?’ info, Vol. 4, No. 3
(2002) . He suggests that investment in Internet connectivity may increase digital, economic and social divides within society, since it will primarily be used by socially and economically advantaged groups, while slowing the pace of investment in network infrastructure for basic telephony, which offers significant benefits to citizens in all social and economic categories.
9 See McKemey K., Scott N., Souter D., Afullo T., Kibombo R. and Sakyi-Dawson O., Innovative Demand Models for Telecommunications Services (Gamos Ltd., 2002).
32
It is important in understanding this debate to place ‘new ICTs’ such as telephony and Internet firmly in the broader context of information and communications resources available in rural areas. Broadcast radio is by far the most widely available information resource in many rural areas, particularly in lower-income communities, and, although not interactive, provides a highly effective means of transmitting information to a large proportion of the population. (In some developing country contexts – notably, as revealed by this research, in Gujarat – television has now usurped broadcast radio’s role in this respect, as it has largely done in the industrial world.) Information can also be delivered by broadcast services to people irrespective of whether they know that information would be useful to them, whereas more interactive sources of information (such as telephony and Internet) are more likely to inform those with the interest and skills to seek information from them. Where radio ownership is near-universal, this is particularly relevant in ensuring that information resources are available to all. In telecommunications, an important distinction needs to be made between access to telephony and ownership of telephones. Access is available when a citizen can use a public telephone facility within a reasonably convenient distance at a price which is affordable in comparison with the real and opportunity cost of alternatives (such as transport and postal services). Public facilities may include public payphones, intermediated payphones and teleshops or telecentres, telephone services provided within retail outlets, and the use of privately owned facilities (either on a franchise basis – best known in the case of Grameen Telecom’s Village Phone programme10 – or through casual ‘borrowing’). Private ownership of telephony, by contrast, occurs when individuals/households with sufficient income subscribe to telephone service at home or to a mobile phone service provider. Evidence compiled by the International Telecommunication Union suggests that households in most contexts tend to spend, on average, between 2% and 4% of household income on telecommunications, where it is available. The form which this expenditure takes varies according to income, with those who can afford it at this level of expenditure taking private subscription service, while those that cannot afford private service make use of public access facilities. These figures appear to be reasonably robust across international boundaries and income levels.11 A wide variety of methods has been used in recent years to promote universal access to telephony, i.e. provision of affordable public telephone access within reasonable distance of all potential users within a national territory. These 10 For an assessment, see Don Richardson et al., Grameen Telecom's Village Phone Programme:A Multi-Media Case Study, Telecommons Development Group for Canadian International Development Agency (CIDA), 2000 11 International Telecommunication Union, World Telecommunication Development Report, 1998 Universal Access Geneva, 1998),

33
methods include the imposition of teledensity targets (i.e. number of lines per 100 households or inhabitants) and network expansion targets (number of new lines deployed) in telecommunications operators’ licenses; the imposition of proximity targets for public access facilities; and the introduction of universal access funds subsidised by levies on telecommunications operators. The variety of such approaches is illustrated in the International Telecommunication Union’s 2003 Trends in Telecommunication Reform report.12 Two particularly successful approaches in recent years have been: • the franchising of public payphone service by telecoms operators to private
entrepreneurs (as, for example, in Senegal and The Gambia); and • the use of reverse auctions (also known as minimum subsidy auctions) to
allocate universal access funds. (This approach - pioneered in Chile, used elsewhere in Latin America and now being implemented in Uganda – involves government setting a maximum subsidy level for a particular unserved area, inviting competitive tenders to provide service at a lower subsidy, and awarding licenses to the bidding company requiring the lowest subsidy.)
An understanding of levels of demand for telephony is crucial to both governments and telecommunications businesses assessing the potential to provide commercial service in rural areas. It is now generally believed that demand for telecoms services in rural areas was underestimated by former monopoly telecommunications operators. Reasons for this include: • underestimation of rural incomes, based on measurement of visible monetary
incomes; • underestimation of demand for public access telephony in addition to private
subscription to telephone service; • underestimation of the role which telephony can play in substituting for
expensive or unreliable alternatives (e.g. transport and postal services); • underestimation of the level of incoming traffic that can be attracted by
provision of rural telephony; and • lack of market research into demand in unserved areas and into actual usage
in areas considered marginal. In addition, developments in wireless (GSM, Wireless Local Loop, CorDECT, etc.) and satellite (e.g. VSAT) technologies in recent years have substantially reduced the capital expenditure required to roll out rural infrastructure. Evidence from many countries shows very rapid expansion of mobile telephony networks to meet hitherto unserved demand, and the three research countries are no exceptions.
12 International Telecommunication Union, Trends in Telecommunication Reform, 2003, Promoting Universal Access to ICTs – practical tools for regulators (Geneva, 2003).

34
An earlier KaR study conducted by Gamos Ltd for DFID assessed demand for and use of telephony in rural locations in three African countries (Botswana, Ghana and Uganda).13 That study confirmed higher levels of demand than hitherto anticipated by telecoms operators. Findings of particular interest for such areas include the following: • that approximately 70% of adults in the low-income rural areas studied made
use of telephony five or six times each year; • that adults in areas outside telephone service coverage also made significant
use of telephony when in served areas; • that a relatively high level of incoming traffic could be generated by the use of
outgoing calls as, in effect, a paging service, and by shopkeepers and teleshop owners providing a local messaging service;
• that about 25% of rural telephone users made use of public telephone service to organise financial transfers (remittances) from urban areas;
• and that rural public access users strongly preferred intermediated services such as teleshops to unstaffed payphones.
While caution needs to be exercised in generalising from such studies, these findings are consistent with an increasing body of research indicating significantly higher demand for telephony in low-income communities than previously anticipated. An important conceptual distinction can be drawn when assessing the impact of telecommunications-based ICTs between ‘connectivity’ and ‘networking’. ‘Connectivity’ refers to the availability of access to telephony and/or other telecommunications-based services (including Internet) to potential users. ‘Networking’ refers to the use of those services, in particular to their use to facilitate interactions between different users. A community can be connected without having yet developed significant networking. This distinction may be particularly relevant in assessment of Internet access and use. Internet access and use are very much less extensive than telephony in developing countries, particularly in rural areas. Internet access in rural Africa, for example, is largely confined to commercial centres in which Internet cafés are commercially viable (although these can, of course, be used by rural residents who visit such centres). Use of Internet requires a wider range of skills than telephony, including literacy (often in non-local languages) and (for web browsing) search skills. The lack of local content of relevance to potential rural users is often also cited as a reason for limited use of Internet services. Surveys of Internet users in developing countries tend to show that they are predominantly young and better educated,
13 McKemey K., Scott N., Souter D., Afullo T., Kibombo R. and Sakyi-Dawson O., Innovative Demand Models for Telecommunications Services (Gamos Ltd., 2002).
35
and that use among socially excluded and marginal groups is particularly low. This has led to some debate in development agencies about the relative merits of promoting Internet as compared with telephony access.14 Researched evidence about the impact of ICTs on households and communities is even scarcer than that on ICT usage. Most of what is available focuses on households and communities that have made use of ICTs for particular purposes, often as a result of specific development initiatives such as the provision of telecentres, Internet-based information resources etc. Very little research has been done to date on the impact of ICTs on communities in response to its becoming available outside specific development initiatives (e.g. on the impact of telephony access on livelihoods), in particular on the distributional impact (the extent to which it is more or less used by different social groups, such as women and men; landless and landowner; farmer, trader and labourer; etc.). The findings of this study make a significant contribution to this under-researched field.
Sustainable livelihoods and rural development The core approach of this study focuses on rural development and sustainable livelihoods. The analytical framework for this research derives from the approaches and literature concerned with sustainable livelihoods, in whose development DFID has played a significant part in recent years.15
Sustainable livelihoods analysis is concerned with the range of assets which individuals, households and communities access and use in order to sustain themselves. This is illustrated in the diagram below.
14 See, e.g., Kenny, op.cit. 15 see in particular, the Sustainable Livelihoods Guidance Notes published by DFID at www.livelihoods.org

36
Figure 2.1: The Sustainable Livelihoods Framework
Source: DFID, Sustainable Livelihoods Guidance Sheets
Its starting point is the ‘Vulnerability Context’ within which individuals and households live. People’s lives, particularly those of the poor, are strongly affected by three groups of factors which make them (and their assets) vulnerable and which are outside their control. These are:
• trends (such as population change, national and international economic trends and technological change);
• shocks (such as natural disasters, epidemics, civil conflict and economic crises);
• and seasonality (variations in prices, costs, production, food supply, economic opportunity, etc.).
Together or individually, these factors can drastically affect (though not necessarily reduce) people’s assets and options. Within this ‘Vulnerability Context’, people access and use a variety of assets to achieve positive livelihoods outcomes. The sustainable livelihoods approach organises these assets into five categories, usually illustrated as a pentagram (below).

37
Figure 2.2: The Sustainable Livelihoods Pentagram
Source: DFID, Sustainable Livelihoods Guidance Sheets
These five categories are:
• human capital, i.e. skills, knowledge and the ability to work/produce; • social capital, i.e. networks, participation in social/productive groups and
mutually-beneficial relationships; • natural capital, i.e. natural resources; • physical capital, i.e. buildings, infrastructure (including power and water),
productive tools etc.; and • financial capital, i.e. funds available for investment, production and
consumption. People’s access to these assets, and their freedom of choice in how they can deploy them, are strongly influenced by a third main component of the livelihoods analytical framework: the policy and institutional environment. Government policy on health and education, for example, significantly determines opportunity to enhance human capital; institutions such as the market, land tenure and the judicial system can either constrain or facilitate acquisition, enhancement and productive use of the various capital assets. Policies and institutions also interact with the vulnerability context: ineffective markets contribute to the risk rural households face in investing in cash crop production, while lack of transparency and accountability within local government can leave people vulnerable to arbitrary decisions which favour the politically well-connected. Livelihood strategies are the approaches people adopt using the assets they have available to secure sufficient income and welfare to protect themselves against vulnerabilities and achieve other goals (such as sufficient food, education for their children, adequate shelter, medicine and other improvements in their quality of life). The options that are available to them are again influenced by the vulnerability context, by the extent and quality of the assets at their disposal, and by the policy and institutional environment. Successful livelihood strategies can lead to further improvement or increase in assets or reduced vulnerability.
38
The research reported in this document focuses in particular on three of the five categories of livelihood capital, access to which seems most likely to be susceptible to the characteristics of ICTs and telephony in particular, as well as on the overall vulnerability context. The three livelihoods assets on which the research focuses are social capital (particularly networking), financial capital (such as income generation and financial savings made as a result of substituting ICT/telephony use for other activities required to achieve certain ends) and human capital (in particular, the knowledge base and information resources available to households).
Telephony and sustainable livelihoods While information, knowledge and communication are not explicitly acknowledged in livelihood frameworks, they are crucial to people’s ability to develop appropriate and sustainable livelihoods strategies. Their influence is seen in all the main building blocks of the framework outlined above. By introducing new modes of communication, information acquisition and knowledge-sharing, telecommunications adds to the pattern of communication flows available for managing and enhancing these frameworks. The impact of telephony on these flows is a key concern of this research. Capital assets: Much attention is paid to financial capital in assessments of the vulnerability of low-income households. However, financial capital should be viewed in relation to other capital assets. Knowledge, for example, is the major component of human capital - knowledge derived from informal and formal education, from personal experience, exposure to information from mass media, exchange of ideas among friends and acquaintances, and interchange with local leaders and opinion-formers. Knowledge of principles, processes and practical skills is essential to people's ability to make effective use of (and to increase) their natural, financial and physical assets. Social capital provides structures and networks through which information is accessed and experience is shared, and through which support can be derived in times of difficulty or prosperity. Through communication networks based on social capital, people enhance their knowledge, gain access to information and cooperative resources. Vulnerability context: Much of the vulnerability that people face comes from lack of knowledge or information. Farmers can be vulnerable to the market power of intermediaries and large companies if they have less information than they do about trends or short-term changes in market prices in other places, particularly where there is limited

39
competition to purchase their produce. They may have limited ways of assessing the accuracy of information they are given, or the credibility of people who sell to them and buy from them (though information networks among farmers can be much stronger and more established than is sometimes assumed). Kydd has highlighted the high transaction costs involved in overcoming these information constraints, which make it more difficult for small-scale producers to benefit from international trade and globalisation.16 Although trade liberalisation potentially offers new opportunities to sell into world markets, the information and knowledge barriers are immense. One of the potential benefits of the spread of telecommunications which is frequently cited in the literature is farmers' and local traders' improved access to market information, which can adjust relationships between producers, intermediaries and consumers, and may therefore enable producers them to increase returns from their sales17 (though it may, equally, benefit intermediaries rather than producers, depending on the nature of the market involved). Policies and institutions: The literature on governance recognises the importance of information in making the processes of government transparent and accessible. In the four cases of "good government" analysed by Tendler in Brazil, for example, the availability of information to the general public through mass media and other channels was a significant factor.18 In policy reforms, informing citizens of their rights and the ways in which they can exercise those rights is an important step in implementation. In Uganda, as in other places where increasing responsibility and authority have been vested in elected local governments, the provision of information about budgetary allocations and the disbursement of money for local projects and services is essential to people's ability to scrutinise local government and hold it accountable. The ways in which mass media and telecommunications are regulated have an impact on people's access to information. Livelihood strategies: People need information about livelihood options and opportunities in order to make decisions about how they will combine their assets to secure their own livelihoods. Strategies are often diverse and flexible, reinforcing the need for up-to-date information on which to base choices.
16 Kydd, J. (2002). ‘Agriculture and rural livelihoods: is globalisation opening or blocking paths out of rural
poverty?’, Agricultural Research and Extension Network Paper no. 121. London, Overseas Development Institute.
17 Kenny, C. (2002). ‘Information and Communication Technologies for Direct Poverty Alleviation: Costs and Benefits’, Development Policy Review 20(2): 141-157.
18 Tendler, J. (1997). Good government in the tropics. Baltimore and London, The Johns Hopkins University Press.

40
Key features of telephony which suggest it might have livelihoods impacts which are different in nature from those of other channels of communication available in rural areas are its immediacy; its interactivity; and the capability of offers to communicate remotely. It allows the personalised seeking of information in contrast to the delivery and reception of pre-packaged information available through the mass media. In principle, telephony should enable people to interact more effectively with the institutions which affect their livelihoods – for example local government, lawyers, health services and financial services. They can potentially use it to reduce their vulnerability to market fluctuations, or to being cheated by human agency or inefficient systems; to enhance their social capital by keeping in contact with distant relatives and friends; to respond quickly to crises within the family; to call for assistance and support. In all these areas, telephony can potentially allow people to do existing things more efficiently, thereby saving time and money and gaining advantage from making decisions more quickly; and also to do new things. This research looks at whether this is taking place in representative rural communities in developing countries, at the balance between these different usage options, and at the relationship between telephony and other communication modes and flows in these livelihoods contexts overall.
Research methodology
Introduction DFID Knowledge and Research (KaR) projects are intended to address ‘the generation, dissemination, adoption and impact of knowledge in order to help eliminate poverty.’19 KaR project 8347 was implemented by a research team including the UK development research and analysis consultancies Gamos Ltd and ict Development Associates ltd (ictDA) and three national research partners (the Indian Institute of Management, (Ahmedabad), the Mozambique Information and Communication Technology Institute at Eduardo Mondlane University (Mozambique) and the Commission on Science and Technology (Tanzania). The research programme as a whole was coordinated, and this report prepared, by Professor David Souter of ictDA and Strathclyde Business School at the University of Strathclyde. The project was managed on behalf of DFID by the Commonwealth Telecommunications Organisation (CTO). This partnership reflects the international cooperation dimension of the KaR programme.
19 http://www.dfid.gov.uk/research/engineering.asp

41
Research problem The research problem to be addressed by the project was identified in the original project proposal as follows:
Information and communication technologies are now widely believed to have a significant part to play in promoting social and economic development, including the improvement of individual livelihoods, community prosperity and the achievement of national development goals related to the UN Millennium Development Goals. National ICT strategies and the programmes of international donors are incorporating ICT components on this basis, with specific objectives in reaching poor rural and peri-urban as well as urban communities. There is, however. little scientific evidence - in particular, evidence from detailed field research in specific poor communities - about the ways in which individuals and communities exploit access to ICTs, particularly telephony but also radio and (where available) Internet, and the impact they have on livelihoods in rural and peri-urban communities. This is particularly true where - as in the vast majority of relevant communities - ICT access development has not been accompanied by specific development initiatives. The lack of hard evidence on the relationship between ICT access and rural livelihoods inhibits effective decision-making on both ICT and livelihoods initiatives and programmes by development planners and the ICT sector, and means that scarce development resources may be ineffectively deployed or opportunities for effective pro-poor initiatives are being missed.
The project aimed to address this problem through a substantial and extensive questionnaire survey of rural communities in three developing countries, focusing on information and communication flows, telephone and Internet usage and attitudes towards telephone and Internet services.
Selection of research countries The project requirement, in addressing these questions, was for field research to be undertaken in three low-income developing countries, which shared a number of common characteristics as well as significant social, economic, administrative and cultural differences. This balance between similarities and differences was desired for two reasons: a) in order to assess whether such differences between research contexts appeared to have any marked impact on the use of ICTs; and b) in order to identify areas in which consistency of findings across different research countries suggested a high degree of reliability, implying that findings were likely to be robust in other developing country contexts.

42
These criteria informed the selection process of research countries which was undertaken by the ictDA, Gamos Ltd and the CTO before and during the inception of the project. Selection was also informed by the availability of appropriate research partners with available capacity to undertake the field research required during the project timescale. The three countries selected were India (State of Gujarat), Mozambique and Tanzania. All three are low-income countries with predominantly rural populations and historically low levels of telephone and ICT penetration. However, there are significant variations between the three countries, with Mozambique having significantly lower levels of GDP per head and less extensive telephone penetration than either Tanzania or Gujarat. The fixed telephone network is also much more extensive in Gujarat than in either of the African countries. The telecommunications sectors in all three research countries had been substantially liberalised before inception of the project, and significant attention was being paid by all three governments to ICT strategies oriented towards social and economic development. Although there had been intercommunal unrest in recent years in Gujarat, there was currently broad political and economic stability in all three countries, providing a favourable environment for research to be undertaken by national research partners. The following brief notes indicate particular factors influencing the selection of these three countries during the project inception phase. Further information about national telecommunications sectors is included in the country reports (Annexes A, B and C).
India Telecommunications liberalisation in India has been complex, with several different regulatory frameworks adopted over the past ten years. The regulatory environment is currently being remodelled around unified licenses which give telecommunications operators the opportunity to provide fixed and mobile services without technological constraint. A number of different telecoms operators are active in Gujarat, one of India’s more prosperous states, including some which have made efforts to promote development services through telecentres. The state government in Gujarat takes a positive approach towards the use of ICTs in rural areas and has promoted a pilot scheme to provide non-networked government services through gram panchayats, the village tier of local government. However, it has not been as active in promoting the use of ICTs in development as those of some other Indian states, notably Andhra Pradesh.

43
Mozambique The most recent data available at the time of the survey suggested that Mozambique's national telephone network included around 85,000 connected lines, with a telephone density of only 0.44 lines per hundred population. There was a high disparity in telecommunications access between urban and rural areas, with 64% of all lines concentrated in the capital city, Maputo, and the second and third largest cities in the country having 11% and 7% of all lines, respectively. Mobile telephony was beginning to address the lack of telecommunications access within rural areas in the country, but wireless penetration was still relatively limited compared to that in neighbouring countries. Mozambique has a well-articulated telecommunications development plan, including a strategy for universal access to be implemented following privatisation of the national fixed line operator. This will be an important initiative in a country which still has very limited infrastructure in rural areas. Mozambique’s government has also placed a great deal of emphasis on the potential of ICTs in meeting social and economic development objectives for the country, and has developed an ambitious national strategy for the application of ICTs in development.
Tanzania Telecommunications liberalisation has also been implemented in Tanzania. Mobile telecoms operators have extended their network coverage considerably in the last few years, though these are not yet as extensive as those in neighbouring Uganda. Legislation includes provision for the establishment of a universal access fund similar to that being implemented in Uganda, but this has not yet been implemented. Internet service is available in a substantial number of district headquarters, and some studies of telecentres have been undertaken, including analysis of user profiles. Tanzania has an established Poverty Reduction Strategy Plan which was under review at the time of the study. This is backed by a variety of statistical sources on poverty and studies of poverty-related issues commissioned by or from international development agencies. A national Information Technology Strategy has also been developed, with substantial stakeholder involvement. However, this has relatively little coverage of issues directly concerned with poverty reduction or rural development. Debate within the country on the role of ICTs and development is supported by the independent eThinkTank and by initiatives undertaken by, among others, the national research partner for this project (Costech), the Economic and Social Research Foundation and the University of Dar es Salaam.

44
Project methodology The research methodology for the project was built around field research using questionnaires seeking information from adult household heads and other senior household members in selected rural communities about their use of telephony and other ICTs. Field research methodology and content were developed though a series of national consultations involving members of the research team (the national research centre concerned, Gamos and ictDA) and members of the ICT and development communities in the research countries. Questionnaires were designed in the light of this input and of focus groups held in selected research locations. Once field research was completed, results were fed into a sophisticated process of data analysis and reviewed by specialists in ICTs, development issues and rural livelihoods. Findings from this analysis were discussed and validated in national stakeholder meetings in each of the three research countries before publication. The following paragraphs describe the project methodology in greater detail.
Timetable The project was originally scheduled for implementation between 1 October 2003 and 31 March 2005, with field research being undertaken in the summer/autumn of 2004. This timetable was later extended to 30 June 2005. The project was divided into a preliminary phase and six main phases.
Table 2.1 : Project timetable Phase Activities Lead responsibility Preliminary phase
Contract and sub-contract negotiation; project set-up
CTO
Phase 1 (a) Desk research and (b) initial research design
(a) ictDA with support from CTO and Paul Hamilton; (b) ictDA in dialogue with all research partners
Phase 2 Initial country meetings: one three-day meeting in each research country
National research partners with ictDA and Gamos
Phase 3 Field research: a) detailed design; b) implementation
(a) national research partners with Gamos; (b) national research partners

45
Phase 4 Data analysis Gamos with ictDA, with support from national research partners, and from support from Professor Christopher Garforth, Professor Rekha Jain and Professor Ophelia Mascarenhas
Phase 5 (a) Report production, including (b) country feedback meetings
(a) ictDA with support from Gamos and national research partners; (b) national research partners with ictDA and Gamos
Phase 6 Dissemination of research findings CTO (main report) and Panos London (short report)
The preliminary phase of the project was completed with the signature of sub-contracts between the CTO and national research centres in April 2004. In practice, this overlapped to some degree with phase 1 of the project research. The main field research was undertaken between July and October 2004, with final results being reported for data analysis between October 2004 and January 2005. Data analysis was undertaken from December 2004, and the project report drafted and validated in the period from April to June 2005. Although there were significant delays at two points during the project schedule, in the preliminary phase and in the compilation of research findings before data analysis, the research team was able to overcome these and complete the project by the scheduled end date of June 2005. Phase 1: Desk research and initial project design The first phase of the project consisted of two main activities: desk research into ICT and livelihoods issues and into the national ICT environments of research countries, undertaken by the research coordinator with assistance from Gamos Ltd and from individual researchers; and the preparation of an initial research framework document by the research coordinator for discussion with other members of the project team and in particular with national research partners. This initial research framework document is attached as Appendix 4. This research framework document established an approach to field research implementation which was subsequently refined in national consultation meetings held during Phase 2 of the project, and a conceptual framework for data analysis based on the sustainable livelihoods model described in DFID’s Sustainable
46
Livelihoods Guidance Notes and used in a number of other research initiatives concerned with low-income communities. This conceptual framework is described above. Phase 2: Initial country meetings The second phase of the project consisted of national consultation meetings in the three research countries, which were held in India (Ahmedabad and New Delhi, 22-24 March 2004), Tanzania (Dar es Salaam, 27-29 April 2004) and Mozambique (Maputo, 5-7 May 2004). The research team for these meetings consisted of the research coordinator (Professor David Souter), one of the members of the Gamos team working on the project (Dr Kevin McKemey in India and Tanzania; Dr Nigel Scott in Mozambique) and up to six members of the national research team. Each national consultation process consisted of three separate activities. The first (day-long) activity was a consultation meeting with a group of about twenty national experts in the ICT sector and in rural development issues, invited by the national research centre. The purpose of these meetings was to elicit the views of national experts on the existing framework for ICTs and development within their countries, and to enable them to raise issues which they felt it would be useful to explore through field research. These were lively and valuable encounters, and they contributed significantly to the detailed research design. Lists of participants in these meetings are included in appendices to this report. The second activity was a series of half- to one-hour meetings with individual experts and senior officials who were not able to participate in the day-long consultation meeting. The purpose of these was very similar to that of the consultation meetings and, while they lacked the opportunity for experts to comment on one another’s contributions, they did allow members of the research team to solicit views on particular facets of the research or of the national communications environment – for example, plans for universal access strategies. In India, the second activity consisted of a series of meetings with small groups of experts, held in the national capital New Delhi (while the first activity was held in Ahmedabad, the main city of Gujarat). The third activity was an intensive (day-long) meeting of the research team to undertake detailed planning for the field research to be undertaken in that research country. This enabled the members of the research team to incorporate the views of those consulted during the other two activities within the design of a national field research strategy based on the existing research framework document. By the end of each of these meetings, the research team had a clear idea of key issues that needed to be considered during field research (including

47
issues that were specific to individual research countries), specific issues related to questionnaire design for each country (for example, the most appropriate proxies to use in assessing income) and appropriate locations for field research. Phase 3: Field research Phase 3 of the work again consisted of two activities: finalisation of the sampling strategy and research questionnaires, and delivery of questionnaires in the field. Phase 3a: Sampling strategy and finalisation of research questionnaires A number of decisions were taken about the sampling strategy for the field research as a result of the consultation meetings held in phase 2. The most important of these were as follows:
a) It was agreed that a main sample of between 650 and 750 individuals should be interviewed in each research country. These individuals would be randomly selected from households in three separate research locations within the country – approximately 200 to 300 from each location.
b) In addition, it was agreed that a separate purposive sample of between 100 and 150 small-scale business people (for example, small traders) would be interviewed in each country. This would provide a check for socio-economic disaggregation of results if the random sample did not include sufficient respondents in this category. Findings related to this sample could also be compared with the main random sample if this were found to be useful. (In the event, this purposive sampling was not included in the Tanzania research.)
c) It was agreed that the research locations chosen in each country should be diverse, in order to minimise the impact on national samples of location-specific factors – for example, the proximity of a telecentre, or the predominance of a particular type of economic activity. In order to reduce the impact of settlement type, it was also agreed to adopt a clustering approach to random sampling, i.e. to select individuals for interview in clusters at sub-locations at different distances from the centre of the research location (typically a medium-sized rural town). The clustering approach is illustrated in the introduction to Part 3 of this main report.
National research centres took responsibility for identifying suitable locations on the basis of this agreed approach. The locations selected are described in the national annexes to this report – Annex A (India (Gujarat)), Annex B (Mozambique) and Annex C (Tanzania).

48
It was agreed from the outset that the questionnaires used in all three countries should be sufficiently comparable to allow comparisons to be made between the countries as well as for data to be amalgamated where this might seem useful. The core structure of the questionnaires therefore had to be closely similar in all three countries. Nevertheless, it was important to allow for some differences between the questionnaires used in different countries. This was primarily because of the need to make them culturally specific in order to produce comparable data – in respect, for example, of different measures of ownership of goods which could be used as proxies for levels of prosperity. In addition, some questions were varied or added in individual countries in order to enable the research to collect data in a way that was considered more valuable by national research partners and experts, or to include data that would be useful to them in other research.
A number of decisions were taken through this process in respect of overall questionnaire design. The most important of these were as follows:
a) It was agreed that each questionnaire should take around 45 to 60
minutes to deliver. It was believed that this would be sufficiently substantial to allow for the collection of the necessary detail without being so long as to alienate interviewees. On balance, this assessment proved to be correct.
b) It was agreed that questionnaires should be structured around five
main themes, designed to elicit information about individuals’ livelihoods and attitudes/perceptions before directly addressing ICT issues. It was felt that this approach would reduce the likelihood of interviewees responding on the basis of what they thought interviewers wanted to hear. The five main themes adopted were:
i. personal identifiers (such as age, gender, income characteristics, etc.;
ii. perceptions of change in personal circumstances and social indicators;
iii. usage of telephony and other ICT services; iv. perceptions of the value and impact of telephony and other ICT
services; v. questions concerning Internet services.
Gamos Ltd took responsibility for the design of a model questionnaire based upon these principles. This questionnaire was tested during a series of site visits in each of the research countries, undertaken by members of the national research team plus a representative of Gamos Ltd, during the spring and early summer of 2004. These site visits included some of the research locations selected by the national research centres, and provided an opportunity for the pilot testing of

49
questionnaires as well as for the final definition of research locations and (cluster) sub-locations. The completion of these visits marked the end of the preparatory stages of the project. Phase 3b: Implementation of field research Field research was undertaken by the national research centres between July and October 2004. In each country, the national research centre assembled a team of interviewers for each research location. Interviewers received initial training during the site visits undertaken in phase 3a, and further training before the main field research took place. Details of the field research in each country are described in the national research reports included as Annexes to this main research report. The compilation of questionnaire returns was undertaken by the national research centres before these were transmitted to Gamos Ltd for analysis in October to December 2004. Phase 4: Data analysis Data analysis was undertaken by Gamos Ltd between December 2004 and March 2005, with input from the national research partners and ict Development Associates ltd. This included extensive frequency and correlation analysis. Full details of the analysis, including frequency and correlation tables, are available on application from Gamos Ltd and other research partners. The statistical analysis undertaken for the study used non-parametric statistical tests to look for the influence of various social groupings on behaviour. When looking at the influence of such social groupings, the analysis employed the Mann-Whitney U test to test for differences between two independent groups, and the Kruskal-Wallace H test to test for differences between three or more groups. Where such analysis is relevant to their presentation, tables in this paper present the probability (p value) that differences between the groupings have occurred by chance. Generally, only differences with a probability of less than 0.05 have been taken to indicate a relationship, i.e. statistical significance is taken to be represented by p =<0.05. Similarly, when considering correlations between two variables, it has only been assumed that a valid relationship exists where the p value associated with a Spearman Rank Order Correlation Coefficient is less than 0.05, and the correlation coefficient itself is greater than or equal to 0.2.

50
Phase 5: Report writing and country stakeholder meetings Assessment of the implications of the findings in individual research countries was undertaken by ict Development Associates ltd and Gamos Ltd in conjunction with national research partners. Draft reports of the national findings, as set out in the country annexes included in this document, were reviewed and discussed at individual country stakeholder meetings held in the three research countries as follows:
• India – stakeholder meeting held in New Delhi on 18 May 2005. • Mozambique – stakeholder meeting held in Maputo on 6 June 2005 • Tanzania – stakeholder meeting held in Dar es Salaam on 8 June 2005.
These meetings paralleled those held in phase 3 of the project (see above). Outcomes of stakeholder meetings are incorporated in the country annexes published with this report. Lists of participants in these meetings are included as appendices to this report. Analysis of the social and economic implications of the findings on a cross-country basis was undertaken by members of the research team led by Professor David Souter (communications impacts and cross-country analysis) with support from Professor Christopher Garforth (livelihoods impacts), Professor Rekha Jain and Professor Ophelia Mascarenhas (gender impact and cross-country analysis), and Dr Kevin McKemey and Dr Nigel Scott (statistical analysis and impact assessment). The outcomes of this analysis are included in the main text of this report, which was drafted and edited on behalf of the research team by Professor David Souter. Phase 6: Dissemination This report was presented to DFID in June 2005 and subsequently published on behalf of DFID by the Commonwealth Telecommunications Organisation. A separate short report on the findings was published by Panos London, also in June 2005. Members of the research team will publish summaries of the findings of the study in academic and other publications during 2005, and may publish further analysis of research data, building on that in this report, later in 2005 and 2006.

51
PART 3:
RESEARCH FINDINGS AND ANALYSIS
Introduction The research reported in this study examined the use of telephony, and to a lesser extent other ICTs, in rural areas of three low-income developing countries – India (State of Gujarat), Mozambique and Tanzania. The research was undertaken primarily through questionnaire surveys, conducted during the middle months of 2004. These surveys were made up of approximately 700 household heads and other senior household members, sampled from villages clustered around three research locations in each of the three research countries, making a total sample size of 2062 (2292 including supporting purposive samples). Questionnaires for the study were designed by the national and UK research teams following focus group discussions in research locations, and included five main areas of questioning:
• household demographics; • information and communication flows; • use of telephony; • perceptions of the value of telephony; • and use of Internet.
The format and content of questionnaire surveys in the three countries were broadly similar, in order to allow for cross-country comparison and analysis. The questionnaires used in each country are reprinted in full as appendices to this report. This Part of the main research report summarises and analyses the findings of the study on a cross-country basis and draws some conclusions and recommendations from cross-country analysis and comparisons. Detailed accounts of the findings in each country are given in annexes to this report (Annex A – India (Gujarat); Annex B – Mozambique; Annex C – Tanzania). These have been drawn up in each case by the UK and national research teams, and have been validated through in-country stakeholder review meetings held in May and June 2005. The main report has been prepared by the research coordinator, Professor David Souter, with input from other members of the UK research team and members of the three national research teams.

52
This study is one of the largest studies yet undertaken to assess the impact of new information and communication technologies on the livelihoods and communications patterns of rural communities in developing countries. Many of its findings are consistent across the three different research environments assessed, suggesting that they are likely to be robust in other developing country contexts. Nevertheless, it must always be remembered that research of this kind, focused on behaviour patterns and intervention impacts, is always affected by local and national circumstances in the research locations, selection of interviewees and developmental characteristics of individual research countries. In the case of this study, the primary objective of the research was to identify usage patterns and impacts of telephony and other ICTs on those who currently make some use of telephony. It is the behaviour of these users, rather than non-users, that offers potential indicators of the likely behaviour of future users of telephony. However, the demographic and economic characteristics of current users vary between countries, for example because of the extent to which telephone networks have penetrated rural areas or the relative levels of wealth and poverty within a sample population. While every effort has been made to ensure that national samples are as broadly consistent as possible, therefore, they are in practice more representative of local rural users of telephony than they are of local rural populations as such; and there are significant variations in the socio-economic characteristics of national samples. (The Mozambican sample, in particular, appears to be significantly wealthier and to include a higher proportion of occupational “professionals” than the other two samples.) While this does not affect the reliability of results concerning the impact of telephony on the livelihoods and communication patterns of telephone users, it does mean that raw data on telephone usage levels (for example) cannot be generalised to broader national populations. The findings reported in the three country annexes include some findings and analysis which are specific to the countries concerned. This section of the main report does not reiterate these individual country findings unless they are relevant to the cross-country analysis, but assesses findings from the three countries on a collective and comparative basis. It is an important corollary to the context-specificity of data findings described in the last paragraph that, where there is consistency across diverse countries, in spite of differences in context, this increases the robustness of findings and their likely applicability to a wider range of contexts (in this case, low-income countries and rural locations in which telephony use is relatively new and rapidly increasing). In brief, if the behaviour of interviewees in all three countries in a particular context is similar or identical, in spite of the differences in socio-economic characteristics between them, this implies that the behavoural pattern identified is more likely to be typical of the common factor concerned (e.g. telephone use in an area where telephony is relatively new), and that the findings offer a strong indicator of likely behaviour
53
among similar populations elsewhere (e.g. telephone users in areas where telephony is relatively new in other countries; or future telephone users in areas where the telephone is already in significant use). This point is discussed further below. This Part of the main report therefore focuses on identifying and analysing points of comparison and commonality between findings in the three research countries. It also describes and assesses some points of difference between them where these seem to be of particular relevance. The analysis is divided into four sections: Section 1 focuses on the findings themselves, juxtaposing data, charts and tables from the three countries in order to identify commonalities and differences. Section 2 separately reviews the findings from the three countries in order to compare results from the three countries, and in particular between the Indian and African samples in the study. Section 3 reviews the findings from the perspective of communications policy, both in terms of information and communication flows and in terms of telecommunications and ICT technology. Section 4 reviews the findings from the perspective of livelihoods policy and its relationship with other literature and research on livelihoods and rural development.
A note on generalisation of research findings The overall sample size used in each of the three country research studies in this project is appropriate and sufficient to indicate patterns of behaviour, usage and impact which apply to the target socio-economic group, i.e. individual adults in rural areas who have access to telephony (which constitutes a large majority of those in the sample areas) and who make some use of telephony (which also constitutes a majority in sample areas). The sample is also appropriate and sufficient to indicate the likely behaviour, usage patterns and potential impact of telephony on comparable groups of rural adults in areas which do not yet have telephone access, but where telephone access is likely to become available in the near future. However, as the sample was chosen in order to provide sufficient data for rural adults who currently use telephony, the resulting data must be interpreted with caution in respect of national populations or broader socio-economic groups. In particular:
1. All research data are to some degree country- and location-specific. There are very large differences between the social, economic and political

54
characteristics of the populations of developing countries, including the three countries in this research project. However, as noted above, as a result of this national diversity, findings that are robust across the three research countries are much likelier to represent general rather than country-specific experience, and can be regarded as having considerable significance.
2. As the survey included only rural environments, its findings cannot be
generalised to urban populations or to national populations including substantial urban groups.
3. As the survey focused on those currently using telephony, data concerning
usage levels, as opposed to usage patterns, cannot be generalised to any wider population group, and should not be used to imply any particular level of ICT use country- or region-wide. The study’s purpose was to review the pattern and impact of ICT usage, not its level, and no checks were undertaken to compare usage levels within the sample with those of the population as a whole, either locally or nationally. The samples are therefore more representative of phone users in rural areas than they are of general populations in rural areas. For the same reason, usage levels of national samples differ significantly between research countries, and cross-country comparisons that might be affected by usage levels are not appropriate.
4. The household basis of the survey also means that economic and
occupational categories within the survey are concerned with households rather than individuals. As accurate data for individual and household income in rural areas of developing countries are very difficult to establish, economic comparisons have been made between broad-brush economic categories (approximately quartile divisions) built around a multiple indicator index of relative prosperity, including, for example, asset ownership as well as declared income. This provides a more robust basis for economic comparisons. Occupational categorisation is also defined at a household level. Most rural households are dependent on income from a variety of occupations. The primary, secondary and tertiary occupations declared in the data are those of the household, not necessarily of the interviewee. A test for differences between results on an individual and household basis suggests that, in fact, these would not be significant, but the household occupational categorisation has been preferred as the research team believes it is more appropriate for this analysis. It should be noted that the Mozambican sample (and only that sample) includes a significant proportion of households with absent migrant workers.

55
5. The findings represent a snapshot of behaviour at a particular point in time. Access to telephony and other ICTs is changing rapidly in the three research countries, particularly in rural locations, and a snapshot can give only limited information about trends in behavioural change. Considerable attention has been paid in the study to maximising understanding of behaviour and impact trends through the use of questions concerned with perceptions of change, but data on actual behavioural trends over a significant timescale could only be obtained through repeat surveys of the same interviewees. The research team considers such repeat surveys would be valuable and should be considered by research funders.
Section 1: Comparative analysis of research findings A. Research locations and samples Descriptions of the research locations in the three research countries are included in the three country annexes. Location selection was undertaken on the basis of desk research, the experience of national research partners and focus group discussions held in possible locations prior to final selection. In each country, three locations were selected for questionnaire surveys with the aim of securing a reasonably high level of representativeness of the national (or, in India, state) rural population and in particular of rural telephone users. As the research was primarily concerned with the behaviour and impact characteristics of those currently able to use telephony, care was also taken to ensure that all research locations had at least public access to telephony. Although the availability of Internet facilities was not a prerequisite for location selection, care was also taken to ensure that the Internet was reasonably accessible to interviewees in at least one of the research locations in each country. In each country, a total of approximately 750 interviews was conducted, divided approximately equally between the three research locations. Precise figures are set out in Table 3.1 below. Households included in the main samples in all countries – and the single sample in Tanzania – were selected randomly from amongst household heads and senior household members. These samples are referred to below and in the country annexes as the random samples. In two countries – India and Mozambique – the random sample was complemented by a purposive sample selected from among tradespeople. These samples are referred to below and in the country annexes as the purposive samples. The primary aim of these purposive samples was to provide additional information in the event that random sampling within the population produced only a small number of respondents whose primary income
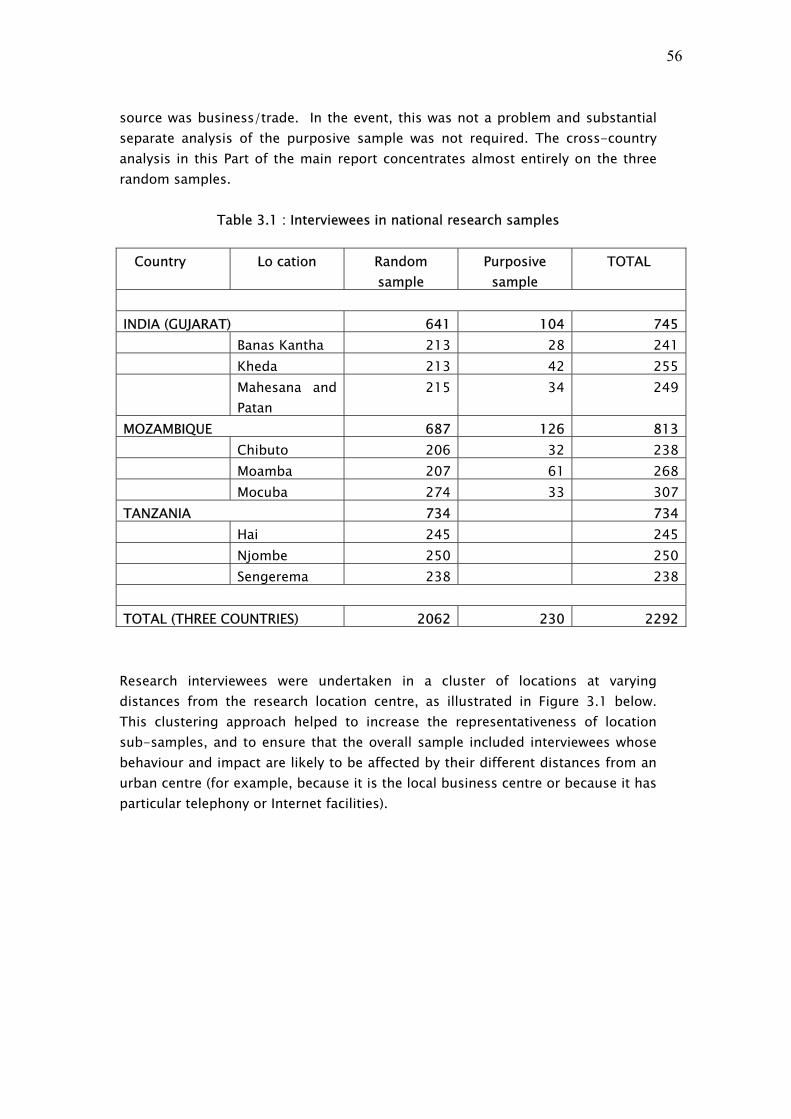
56
source was business/trade. In the event, this was not a problem and substantial separate analysis of the purposive sample was not required. The cross-country analysis in this Part of the main report concentrates almost entirely on the three random samples.
Table 3.1 : Interviewees in national research samples
Country Lo cation Random sample
Purposive sample
TOTAL
INDIA (GUJARAT) 641 104 745 Banas Kantha 213 28 241 Kheda 213 42 255 Mahesana and
Patan 215 34 249
MOZAMBIQUE 687 126 813 Chibuto 206 32 238 Moamba 207 61 268 Mocuba 274 33 307TANZANIA 734 734 Hai 245 245 Njombe 250 250 Sengerema 238 238
TOTAL (THREE COUNTRIES) 2062 230 2292 Research interviewees were undertaken in a cluster of locations at varying distances from the research location centre, as illustrated in Figure 3.1 below. This clustering approach helped to increase the representativeness of location sub-samples, and to ensure that the overall sample included interviewees whose behaviour and impact are likely to be affected by their different distances from an urban centre (for example, because it is the local business centre or because it has particular telephony or Internet facilities).

57
Figure 3.1: Illustration of interview cluster pattern
B. Demographic characteristics All three national samples focused on household heads and other senior household members who had some experience of using telephony. Concentration on these characteristics, in countries with significant socio-economic differences, means that there are some significant differences in the social and economic composition of the samples in the three countries. These are described below. In addition, the need to focus on those with experience of telephony means that all samples are to some extent likely to be wealthier, on average, than the general population from which they are drawn. This is most marked in the case of the Mozambique sample. Once again, however, it should be noted that generalisations from results which are found to be true in all three research locations, in spite of this diversity, are likely to prove at least as robust, if not actually more robust, than data derived from more homogeneous sample populations. Questionnaires were mostly delivered to household heads because of the importance to the study of assessing livelihoods assets (for example household income and expenditure, and ownership of capital assets), which are more readily addressed through household rather than individual data. Unfortunately, this means that the data are less susceptible to gender disaggregation than would have been the case with a random sample of adults within the general population. Gender disaggregation of the data has been undertaken, however, and some findings are reported in section F below and in the country annexes. It is hoped that further gender disaggregation of the data will be undertaken and published in future reports.
Interview cluster (e.g. 20 interviews)
Local town

58
Basic demographic means for the three sample populations are set out in the following tables:
Table 3.2 : Demographic characteristics – national random samples
INDIA (GUJARAT)
MOZAMBIQUE TANZANIA
Mean age 36 32 42 Male/female ratio
72% - 28% 52% - 48% 62% - 38%
Head of household
69% 37% 73%
Mean household size
5.5 6.1 5.8
Close relatives living elsewhere in country
44% 88% 80%
Close relatives living overseas
2% 59% 12%
Table 3.3 : Educational attainment – national random samples
%ages INDIA
(GUJARAT) MOZAMBIQUE TANZANIA
No formal school 9.4 12.3 12.8 Primary only 11.7 45.5 77.7 Lower secondary 23.6 28.7Upper secondary 42.0 7.0Tertiary 13.3 6.6*
9.5
* includes adult education
Table 3.4 : Ownership of household assets – national random samples
%ages INDIA (GUJARAT)
MOZAMBIQUE TANZANIA
Protected water
98 29 37
Electricity 97 38 15
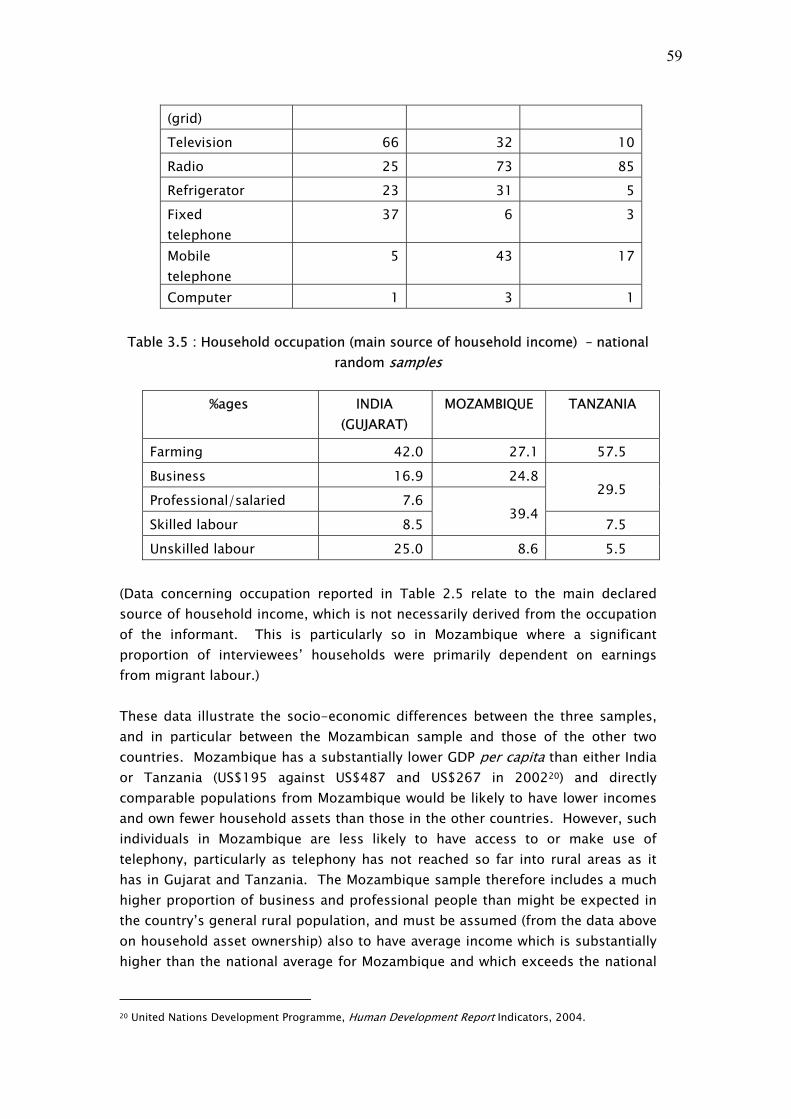
59
(grid)
Television 66 32 10
Radio 25 73 85
Refrigerator 23 31 5
Fixed telephone
37 6 3
Mobile telephone
5 43 17
Computer 1 3 1
Table 3.5 : Household occupation (main source of household income) – national
random samples
%ages INDIA (GUJARAT)
MOZAMBIQUE TANZANIA
Farming 42.0 27.1 57.5
Business 16.9 24.8
Professional/salaried 7.6 29.5
Skilled labour 8.5 39.4
7.5
Unskilled labour 25.0 8.6 5.5
(Data concerning occupation reported in Table 2.5 relate to the main declared source of household income, which is not necessarily derived from the occupation of the informant. This is particularly so in Mozambique where a significant proportion of interviewees’ households were primarily dependent on earnings from migrant labour.) These data illustrate the socio-economic differences between the three samples, and in particular between the Mozambican sample and those of the other two countries. Mozambique has a substantially lower GDP per capita than either India or Tanzania (US$195 against US$487 and US$267 in 200220) and directly comparable populations from Mozambique would be likely to have lower incomes and own fewer household assets than those in the other countries. However, such individuals in Mozambique are less likely to have access to or make use of telephony, particularly as telephony has not reached so far into rural areas as it has in Gujarat and Tanzania. The Mozambique sample therefore includes a much higher proportion of business and professional people than might be expected in the country’s general rural population, and must be assumed (from the data above on household asset ownership) also to have average income which is substantially higher than the national average for Mozambique and which exceeds the national
20 United Nations Development Programme, Human Development Report Indicators, 2004.
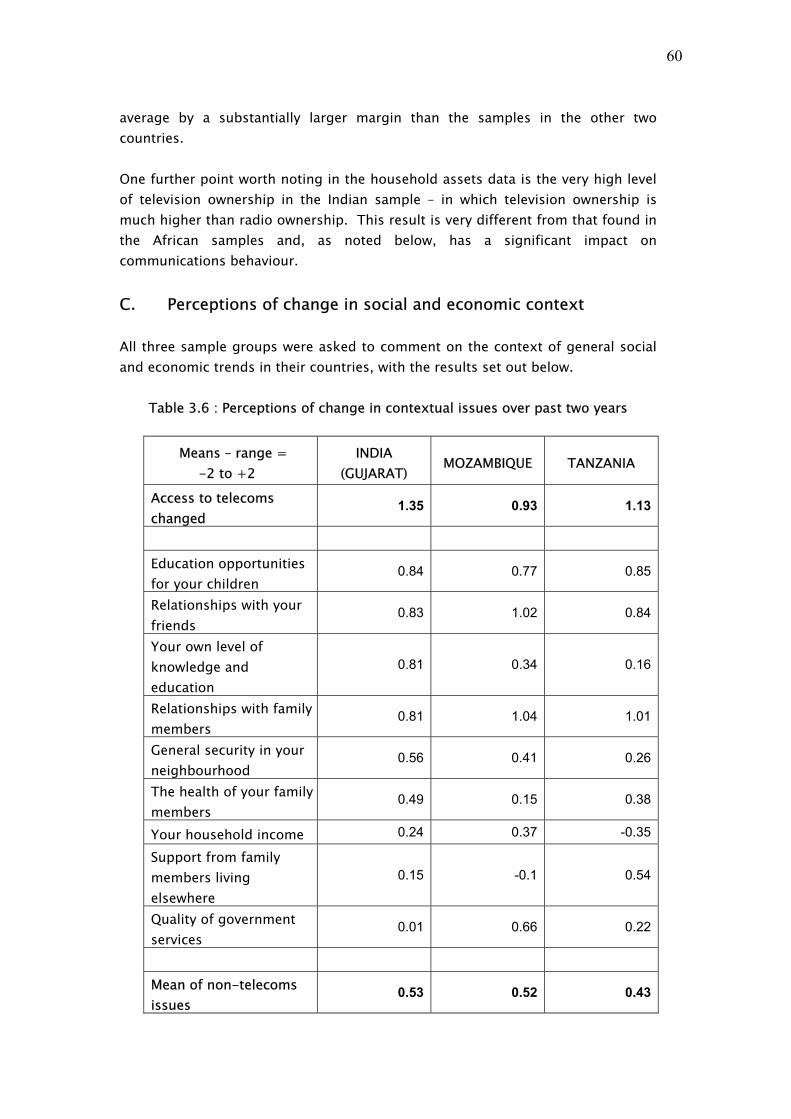
60
average by a substantially larger margin than the samples in the other two countries. One further point worth noting in the household assets data is the very high level of television ownership in the Indian sample – in which television ownership is much higher than radio ownership. This result is very different from that found in the African samples and, as noted below, has a significant impact on communications behaviour.
C. Perceptions of change in social and economic context All three sample groups were asked to comment on the context of general social and economic trends in their countries, with the results set out below.
Table 3.6 : Perceptions of change in contextual issues over past two years
Means – range = -2 to +2
INDIA (GUJARAT)
MOZAMBIQUE TANZANIA
Access to telecoms changed
1.35 0.93 1.13
Education opportunities for your children
0.84 0.77 0.85
Relationships with your friends
0.83 1.02 0.84
Your own level of knowledge and education
0.81 0.34 0.16
Relationships with family members
0.81 1.04 1.01
General security in your neighbourhood
0.56 0.41 0.26
The health of your family members
0.49 0.15 0.38
Your household income 0.24 0.37 -0.35
Support from family members living elsewhere
0.15 -0.1 0.54
Quality of government services
0.01 0.66 0.22
Mean of non-telecoms issues
0.53 0.52 0.43

61
As can be seen from these data, all three samples expressed a positive view of change taking place in their societies, and all three recognised that access to telecommunications was changing particularly rapidly. Respondents in Mozambique were also asked to rank the importance of different potential areas of investment, with the following results. Unfortunately, this question was not asked of the Indian and Tanzanian samples.
Figure 3.2 : Expressed investment preferences – Mozambican sample
0% 20% 40% 60% 80% 100%
Build more health clinics
Build more schools
Improve roads
Extend electricity network
Extend mobile network coverage
Improve access to agriculturalinformation
Most important SecondThirdNone of these
Correlations have been undertaken between the general attitudes set out in table 2.6 above and both perceived access to and reported intensity of use of telecommunications. These suggest that there are some significant correlations between perceived access to telecommunications and perceptions of a number of other indicators of socio-economic development, but that there are fewer significant correlations between these perceptions of socio-economic change and reported frequency of telephone use. While interesting, it should be noted that such correlations do not imply any causal effect.
D. Ownership, access and use of means of communication The survey investigated levels of telephone and other ICT ownership, access and use in the three research samples, with the following results. In assessing these, it should be remembered that the samples were not chosen to secure an equal socio-economic representation between the three research countries, and so the level of ownership in one national sample compared with another does not imply

62
that the national level of ownership in those countries is proportional to that in the sample. (Indeed, given the higher relative socio-economic status of the Mozambique sample, this is definitely not the case.) However, the data are useful for comparing the relationships between ownership of different types of communication device within individual countries and the ratios between ownership of different types of device across countries.
D.1 Use and frequency of use of ICTs The principal differences between the three samples lies in the relative importance of different modes of access to broadcasting and telephony:
Table 3.7 : Ownership and use (past year or two years) of different communications devices in research samples
%ages INDIA (GUJARAT) MOZAMBIQUE TANZANIA
Ownership Use Ownership Use Ownership Use
Television 66.5 84.7 32.2 57.9 9.7 45.6
Radio 25.4 35.5 73.6 92.4 85.3 95.6
Telephone kiosk
83.2 68.9 21.3
Private fixed phone
37.3 56.7 6.0 9.6 3.4 9.8
Mobile phone
8.7 22.2 41.1 56.0 17.3 61.2
Fax 3.6 3.9 0.8
SMS 6.2 37.6 33.5Email / Internet
2.0 1.5 2.0
Personal computer
1.2 0.9 3.1 1.3 1.4 1.2
Variations from data in earlier tables result from variations in response rates
within samples.

63
Broadcast radio is the main broadcast medium in both Mozambique and Tanzania, where radio ownership is very high and use almost universal. In India, however, the radio is used by only one third of the sample population, just over half of the proportion resident in households with their own television. Television is therefore a much more important medium than broadcast radio for the Indian sample. (It is notable that radio in Gujarat is much less diverse and less local in character than it is in the two African countries.) Mobile telephones are the predominant mode of telephony in both Mozambique and Tanzania, as they are now throughout most of Africa. Widespread use of mobile phones – usually not owned by the user – is accompanied by extensive use of SMS (text messaging). Mobile phones are much more important than telephone kiosks for the Tanzanian sample. The Mozambican sample made much more use of phone kiosks than the Tanzanian sample, although the Mozambican sample (unlike the Mozambican population as a whole) had very high ownership of mobile phones. In India, however, at the time the survey was undertaken, fixed telephony was still much more important than mobile telephony. (It is likely that this predominance of fixed telephony results from the more extensive historic roll-out of fixed telephony in rural India than rural Africa. It is also probable that the gap between fixed and mobile telephone ownership and use is rapidly diminishing, but this could only be confirmed by repeat interviews.) Anomolously, a higher proportion of each sample claimed to have a computer in their households than claimed to have used one in the past year. However, the differences here are minute and are presumably explained by the identities of specific interviewees.
D.2 Telephone use and ownership Despite the variation in primary modes of telecommunications access in the three research countries, all demonstrated considerable overlap between use of different modes of access. The following diagrams illustrate these overlapping modes of access.

64
Figure 3.3 : Distribution of telephone use – India sample
Mobile
Kiosk
Private Fixed
5
30
238
83181
7524
Figure 3.4 : Distribution of telephone use – Mozambique sample
Mobile
Public
Fixed
73
265
144
48
3
3 6

65
Figure 3.5 : Distribution of telephone use – Tanzania sample
Mobile
Kiosk
Fixed
267
105
16
287
1126
Telephone ownership in all three countries is growing rapidly and is highly valued. At least 44% of those with a telephone in each country had acquired it within the last year and at least 33% without a telephone in each country expressed the intention to acquire one within the next year (though it is likely that the number fulfilling this aspiration will be lower.)
Table 3.8: Telephone ownership growth rates
%ages INDIA (GUJARAT) MOZAMBIQUE TANZANIA
Acquired in last year (%age of mobile owners)
59 44 50
Likelihood of acquiring in next year (%age of respondents not owning a mobile)
Highly likely 14 16 30
Likely 19 26 31
While not all of those expressing the intention to acquire a telephone will in fact do so, this evidence indicates the importance of assessing behavioural trends in data analysis of telecommunications behaviour and impacts, rather than relying solely on snapshot evidence.
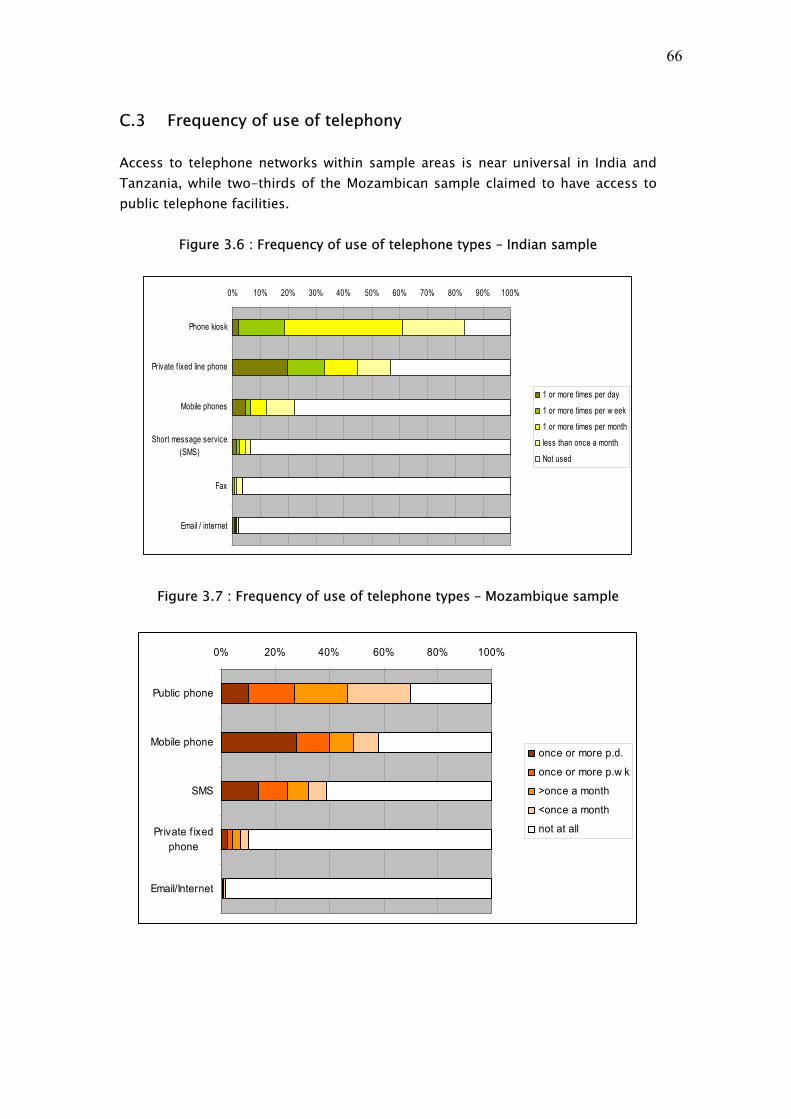
66
C.3 Frequency of use of telephony Access to telephone networks within sample areas is near universal in India and Tanzania, while two-thirds of the Mozambican sample claimed to have access to public telephone facilities.
Figure 3.6 : Frequency of use of telephone types – Indian sample
0% 10% 20% 30% 40% 50% 60% 70% 80% 90% 100%
Phone kiosk
Private f ixed line phone
Mobile phones
Short message service(SMS)
Fax
Email / internet
1 or more times per day
1 or more times per w eek
1 or more times per month
less than once a month
Not used
Figure 3.7 : Frequency of use of telephone types – Mozambique sample
0% 20% 40% 60% 80% 100%
Public phone
Mobile phone
SMS
Private f ixedphone
Email/Internet
once or more p.d.
once or more p.w k
>once a month
<once a month
not at all

67
Figure 3.8 : Frequency of use of telephone types – Tanzania sample
0%20%40%60%80%100%
Mobile
SMS
kiosk
private fixed
email/internet
Fax
% sample
1 or more times a day1 or more times a weekmore than once a monthless than once a monthNot used
These data illustrate once again the differences mentioned above concerning phone use between the African and Indian samples at the time of the survey – in particular the much higher use of mobile rather than fixed telephony in Mozambique and Tanzania, contrasted with the much higher use of fixed telephony in Gujarat. This also leads to much more extensive use of text messaging in the African countries than in India. (It should be noted, howver, that use of mobile phones is likely to have grown substantially in Gujarat since the survey was undertaken.) Telephone ownership and frequency of use are closely related to higher income and educational status and to particular occupational groups. The following charts present mean data for the frequency of use of telephones according to economic status in the three research countries.

68
Figure 3.9: Frequency of use of telephone kiosks according to economic status
0 0.5 1 1.5 2 2.5 3 3.5
Poorest
Poor
Average
Rich
mean
TanzaniaMozambiqueIndia
Figure 3.10: Frequency of use of mobile telephones according to economic status
0 0.5 1 1.5 2 2.5 3 3.5 4 4.5 5
Poorest
Poor
Average
Rich
mean
TanzaniaMozambiqueIndia

69
Figure 3.11: Frequency of use of private fixed telephones according to economic status
0 0.5 1 1.5 2 2.5 3 3.5 4 4.5
Poorest
Poor
Average
Rich
mean
TanzaniaMozambiqueIndia
These data also show significant differences between categories of phone user within each country. In all three countries, there is a significant group of telephone owners who make intensive use of telephony (one or more times per day). In India, where private access is usually by fixed line at home, this group also makes significant use of telephone kiosks, whereas in the African countries, where private access is usually mobile, this is less necessary. Kiosks are widely used in India – on average between once a week and once a month – by the majority of interviewees. In the African samples, on the other hand, particularly in Tanzania, borrowed mobile phones are also an important means of public access. The Mozambican data, incidentally, shows an overwhelming preference for teleshops (cabinas publicas) over other forms of public access. Finally, in this context, data were collected from the samples concerning their expenditure on telephony. These following table divides the sample population in each country into four approximate quartiles based on an index of a number of prosperity indicators (such as reported income, household assets, land and housing type). For each quartile, the table shows reported expenditure on telephony as a proportion of reported/estimated household income. Data for declared household income need to be treated with some caution, as poorer households rarely keep systematic records of income and incomes can vary substantially month by month; and this caution also applies to the specific percentage figures in the table. The division of the sample into quartiles according to a broader prosperity index, however, means that the variation between quartile groups is much more reliable than the absolute data from which it is derived.

70
Table 3.9 : Expenditure on telephony by income group
%age of total income INDIA (GUJARAT)
MOZAMBIQUE TANZANIA
Lowest income 5.6 4.2 13.9
Low income 5.2 2.8 9.5
Medium income 5.3 2.0 7.1
Higher income 4.3 1.0 5.7
These data show that, in all three countries, although cash expenditure on telephony is higher among high income groups, low income groups spend a larger proportion of their incomes on telephony costs than high income groups. Although this finding is consistent across all three countries, the expenditure ratio between high and low income groups found in the African countries is greater than that found in India. These figures need to be assessed in terms of the behaviour of those low-income individuals and households making the expenditure. Expenditure on telephone costs includes both:
• expenditure which substitutes for other expenditure (e.g. on transport or postal services), which may reduce total household expenditure; and
• additional expenditure which would not occur if telephones were not available, which may increase total household expenditure.
It is likely that poorer households tend to use the telephone more for substitution and for high priority uses such as emergencies (for which other communications channels are less highly suited), whereas those with higher economic status are more likely to incur additional expenditure, for example through casual (rather than priority) social calling. This interpretation is reinforced by the high association of telephone use with emergencies which is revealed in section D below. A relatively high proportion of household expenditure on telephone costs can represent a saving on overall household expenditure if telephone costs are primarily incurred in place of other costs. It is not possible to draw firm conclusions on this point from the data in the survey. Analysis to identify differences between priority uses between richest and poorest economic groups reveals that in fact priorities are remarkably consistent across these groupings. The following table presents mean values for priority use only where differences between richest and poorest economic groups are significant. In India, where mobiles are mostly used by higher status groups, the rich have a greater tendency to use mobiles for social and emergency use; the opposite can be
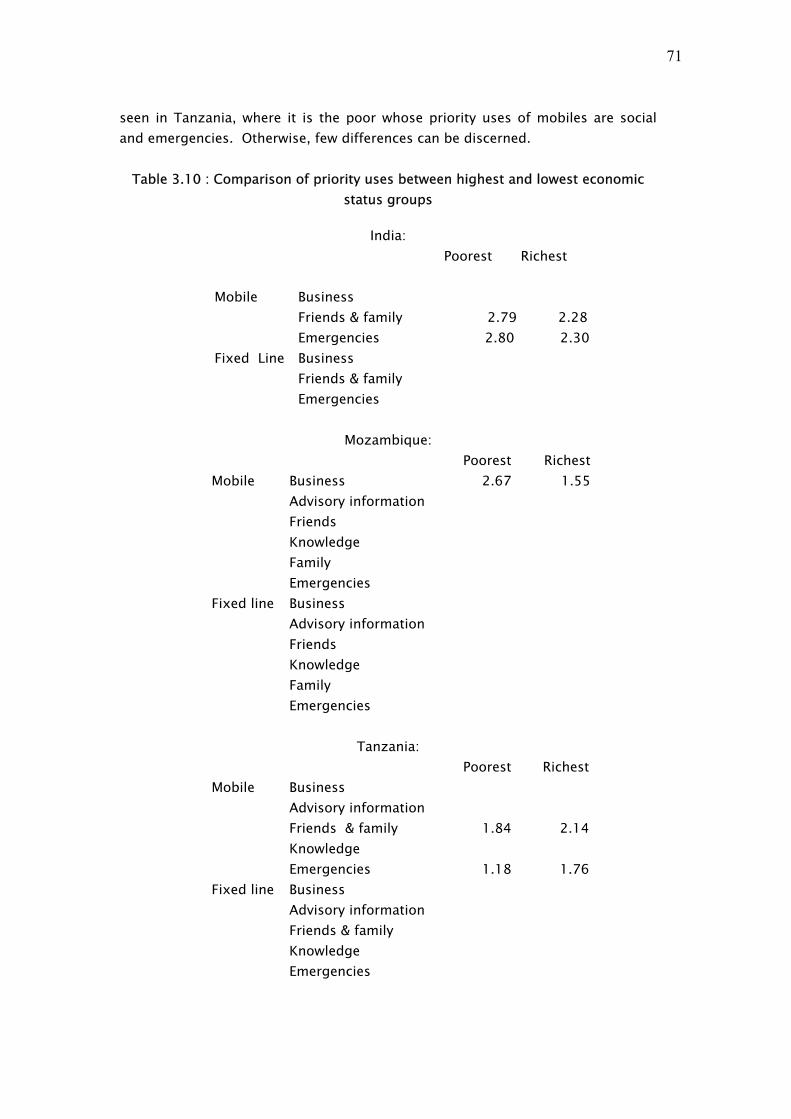
71
seen in Tanzania, where it is the poor whose priority uses of mobiles are social and emergencies. Otherwise, few differences can be discerned.
Table 3.10 : Comparison of priority uses between highest and lowest economic status groups
India:
Poorest Richest
Mobile Business Friends & family 2.79 2.28 Emergencies 2.80 2.30
Fixed Line Business Friends & family Emergencies
Mozambique:
Poorest Richest Mobile Business 2.67 1.55
Advisory information Friends Knowledge Family Emergencies
Fixed line Business Advisory information Friends Knowledge Family Emergencies
Tanzania:
Poorest Richest Mobile Business
Advisory information Friends & family 1.84 2.14 Knowledge Emergencies 1.18 1.76
Fixed line Business Advisory information Friends & family Knowledge Emergencies

72
It should be noted that about one third of respondents in Mozambique and Tanzania claimed to be in receipt of remittances, though the figures was under 5% in India. It is unclear how far the telephone is being used to facilitate remittances, though the data provides evidence that the value of the phone is more in managing the flow of remittances, rather than increasing the volume of remittances. . Very few respondents had been given telephones by relatives.
D. Information and communication flows ICTs, including telephony, are facilitating technologies which enable individuals and communities to interact more (or less) effectively with one another. Any new technology that is introduced – such as television, voice telephony or the Internet – enters into an established pattern of information and communication flows. While it may adapt to these flows or disrupt them, its impact will in either case be closely related to them. An understanding of established information and communication flows is therefore crucial to assessing the impact and implications of new ICTs as they are deployed. The following paragraphs consider the most important communication issues and channels reported by interviewees through their questionnaire responses. An extensive series of questions was asked during interviews to establish the priority information needs of interviewees and the channels used by them to satisfy those needs. These questions provide baseline evidence for an assessment of the impact which telephony is having or may have on information and communication flows and thereby on access to livelihoods assets.
D.1 Confidence in information channels Respondents in the two African samples – but not that in India – were asked to report on their confidence in different information sources. These data are reported in the table and charts below. The table illustrates the mean value derived from a five point scale in which 1 = no confidence, 3 = no opinion and 5 = high confidence. The charts illustrate the proportions in the two samples expressing different levels of confidence in different information sources.

73
Table 3.11 : Confidence in different sources of information – African samples
Means – range = 1 to 5
MOZAMBIQUE TANZANIA
Radio 4.32 4.52
Television 3.96 4.28
Newspapers 3.72 3.86
Government services 3.56 3.81
District staff 3.54 3.78
Local leaders 3.62 3.60
Private associations 3.72
Civil society organizations
3.07 3.42
Neighbours 3.19 3.25
Manufacturers 2.85 2.99
Traders who sell agricultural inputs /
livestock
3.07 2.77
Figure 3.12: Confidence in different sources of information : Mozambique sample
0% 20% 40% 60% 80%100%
Radio
Television
Newspapers
Government services
District staff
Local leaders
Neighbours
Traders who sell agriculturalinputs / livestock
Very confidentConfidentNo opinionLittle confidenceNo confidence

74
Figure 3.13 : Confidence in different sources of information : Tanzania sample
0% 20% 40% 60% 80%100%
Radio
Television
New spapers
Government services
District staf f
Private associations
Local leaders
Civil society organizations
Neighbours
Manufacturers
Traders w ho sell agricultural inputs / livestock
Very confidentConfidentNo opinionLittle confidenceNo confidence
In both countries, these data show high levels of confidence in broadcast media, followed by newspapers, and substantial levels of confidence in local officials and opinion leaders, indicating that – in these countries at least – these are likely to be trusted sources of information which can be used effectively for public information messages in areas such as health promotion. Separate data on changes in the use of different media showed that, in both countries, a very considerable increase was reported in the use of radio over the past two years – in Mozambique, 79.3% of the sample reported increased use of radio, and in Tanzania 71.4%. Although increases were reported in use of other information sources, notably television and government services, these increases were much less significant. This further emphasizes the importance of broadcast radio to low-income communities in Africa. However, similar questions in India showed that radio use had substantially declined there, while television use had increased. This is probably mostly a result of the much higher television ownership and much lower radio use within the Indian sample, although that in itself is probably at least partly accounted for by the fact that broadcast radio in India is much less diverse and local in character than that in the two African countries surveyed.
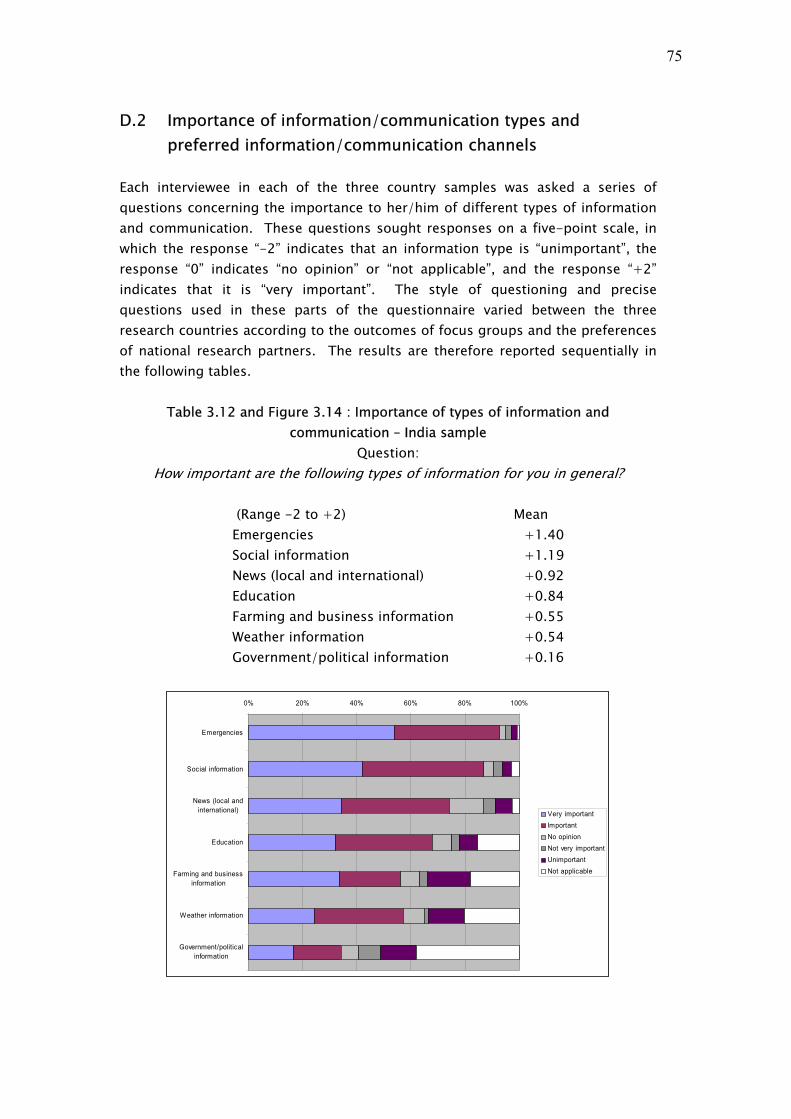
75
D.2 Importance of information/communication types and preferred information/communication channels
Each interviewee in each of the three country samples was asked a series of questions concerning the importance to her/him of different types of information and communication. These questions sought responses on a five-point scale, in which the response “-2” indicates that an information type is “unimportant”, the response “0” indicates “no opinion” or “not applicable”, and the response “+2” indicates that it is “very important”. The style of questioning and precise questions used in these parts of the questionnaire varied between the three research countries according to the outcomes of focus groups and the preferences of national research partners. The results are therefore reported sequentially in the following tables.
Table 3.12 and Figure 3.14 : Importance of types of information and communication – India sample
Question: How important are the following types of information for you in general?
(Range -2 to +2) Mean Emergencies +1.40 Social information +1.19 News (local and international) +0.92 Education +0.84 Farming and business information +0.55 Weather information +0.54 Government/political information +0.16
0% 20% 40% 60% 80% 100%
Emergencies
Social information
News (local andinternational)
Education
Farming and businessinformation
Weather information
Government/politicalinformation
Very importantImportantNo opinionNot very importantUnimportantNot applicable

76
Table 3.12 and Figure 3.15 : Importance of types of information and
communication –Mozambique sample
Range -2 to +2) Urgent e.g. emergencies, deaths, sickness - Importance +2.03News about relatives - Importance +1.98How to prevent and treat illness within the family - Importance +1.73News (local and international) - Importance +1.68News about friends - Importance +1.59Weather information - Importance +1.56Social and religious events e.g. marriages - Importance +1.50Job opportunities - Importance +1.06Remittances - Importance +0.96Crop management - Importance +0.96Availability and costs of inputs to purchase - Importance +0.95Education opportunities (schools and further education) - Importance +0.95Market prices (for selling) - Importance +0.93Marketing information e.g. new markets - Importance +0.92new products & activities e.g. pesticides, seeds - Importance +0.84Transport and driver schedules - Importance +0.84Livestock management & health - Importance +0.83Government and legal requirements (e.g. taxes, regulations) - Importance +0.81Entertainment - Importance +0.73Information on clients and debtors e.g. ability to pay - Importance +0.62Availability of credit, and subsidies, pensions, vulnerability assistance - Importance +0.61Business skills - Importance +0.61Romance - Importance +0.51Information on other producers (collaborators, competitors) - Importance +0.50Gossip - Importance -0.63

77
0% 20% 40% 60% 80% 100%
Urgent e.g. emergencies, deaths, sickness
News abo ut relatives
Ho w to prevent and treat illness within the family
News (lo cal and internatio nal)
News abo ut friends
Weather info rmatio n
So cial and religio us events e.g. marriages
Jo b o ppo rtunities
Remittances
Cro p management
A vailability and co sts o f inputs to purchase
Educatio n o ppo rtunities (scho o ls and further educatio n)
M arket prices (fo r selling)
M arketing info rmatio n e.g. new markets
new pro ducts & activ ities e.g. pestic ides, seeds
Transpo rt and driver schedules
Livesto ck management & health
Go vernment and legal requirements (e.g. taxes, regulatio ns)
Entertainment
Info rmatio n o n clients and debto rs e.g. ability to pay
A vailability o f credit, and subsidies, pensio ns, vulnerability assistance
B usiness skills
Ro mance
Info rmatio n o n o ther pro ducers (co llabo rato rs, co mpetito rs)
Go ssip
Very importantImportantNo opinionNot very importantUnimportantNo response
Table 3.13 and Figure 3.16 : Importance of types of information and communication –Tanzanian sample
(Range -2 to +2) Mean Urgent e.g. emergencies, deaths - Importance +1.88News about sick relatives - Importance +1.82How to prevent and treat illness within the family - Importance +1.58Information about friends and family members - Importance +1.56Market information - Importance +1.42Weather information - Importance +1.42Crop management - Importance +1.31News (local and international) - Importance +1.27Government and legal requirements (e.g. taxes, regulations) - Importance +1.22Availability and costs of inputs to purchase - Importance +1.21Education opportunities (schools and further education) - Importance +1.21Information on new products e.g. pesticides, seeds - +1.11

78
Importance Social and religious events e.g. marriages - Importance +1.11Livestock management & health - Importance +1.09Availability of credit and subsidies - Importance +1.03Information on clients and debtors e.g. ability to pay - Importance +1.02Business skills - Importance +1.02Information on other producers (collaborators, competitors) - Importance +0.75Job opportunities - Importance +0.65Remittances - Importance +0.55Romance - Importance +0.51Insurance - Importance +0.47Entertainment - Importance +0.34Gossip (intrigue) - Importance -0.92
0% 20% 40% 60% 80% 100%
Urgent e.g . emergencies, deaths - Importance
News about sick relatives - Importance
How to prevent and treat illness within the family - Importance
Information about friends and family members - Importance
Market information - Importance
Weather information - Importance
Crop management - Importance
News (local and international) - Importance
Government and legal requirements (e.g . taxes, regulations) - Importance
Availability and costs of inputs to purchase - Importance
Education opportunities (schools and further education) - Importance
Information on new products e.g. pesticides, seeds - Importance
Social and relig ious events e.g . marriages - Importance
Livestock management & health - Importance
Availability of credit and subsidies - Importance
Information on clients and debtors e.g . ability to pay - Importance
Business skills - Importance
Information on other producers (collaborators, competitors) - Importance
Job opportunities - Importance
Remittances - Importance
Romance - Importance
Insurance - Importance
Entertainment - Importance
Gossip (intrigue) - Importance
Very importantImportantNeitherNot very importantUnimportantNo opinion
These data establish a hierarchy of information and communication needs which is consistent across the three research countries and with many other findings in this study. In all three countries, people within the samples indicated that:
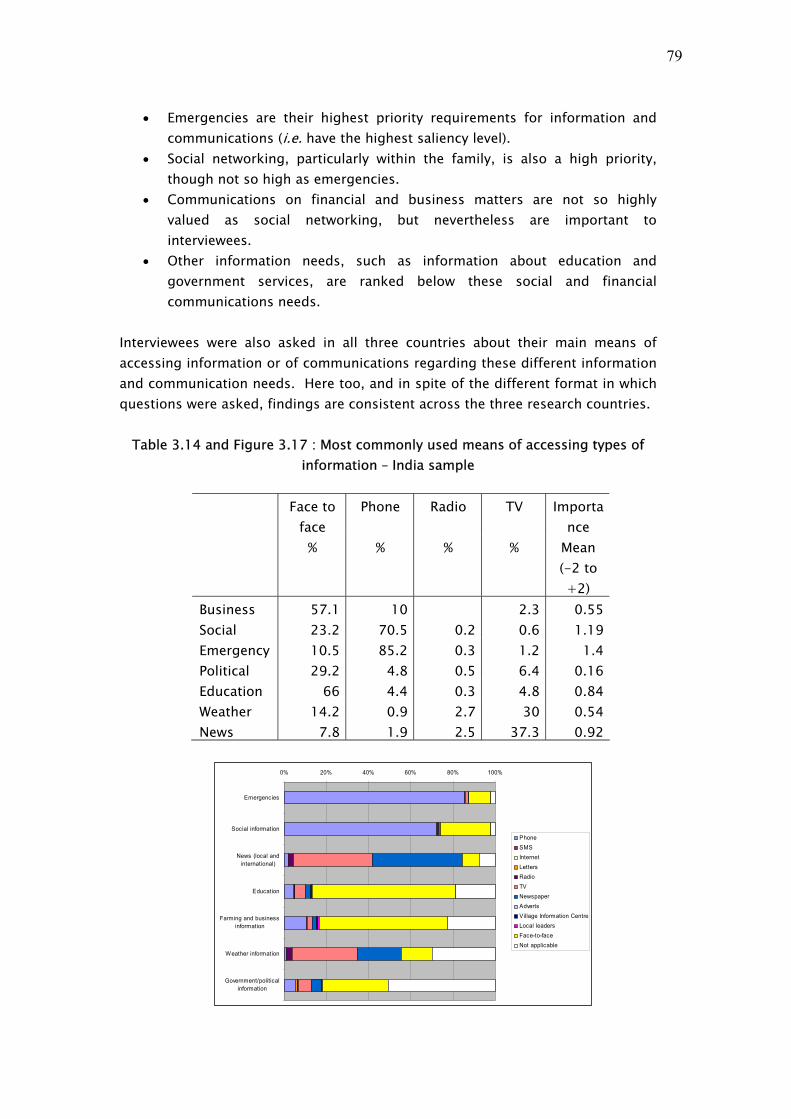
79
• Emergencies are their highest priority requirements for information and communications (i.e. have the highest saliency level).
• Social networking, particularly within the family, is also a high priority, though not so high as emergencies.
• Communications on financial and business matters are not so highly valued as social networking, but nevertheless are important to interviewees.
• Other information needs, such as information about education and government services, are ranked below these social and financial communications needs.
Interviewees were also asked in all three countries about their main means of accessing information or of communications regarding these different information and communication needs. Here too, and in spite of the different format in which questions were asked, findings are consistent across the three research countries.
Table 3.14 and Figure 3.17 : Most commonly used means of accessing types of information – India sample
Face to
face Phone Radio TV Importa
nce % % % % Mean
(-2 to +2)
Business 57.1 10 2.3 0.55 Social 23.2 70.5 0.2 0.6 1.19 Emergency 10.5 85.2 0.3 1.2 1.4 Political 29.2 4.8 0.5 6.4 0.16 Education 66 4.4 0.3 4.8 0.84 Weather 14.2 0.9 2.7 30 0.54 News 7.8 1.9 2.5 37.3 0.92
0% 20% 40% 60% 80% 100%
Emergencies
Social information
News (local andinternational)
Education
Farming and businessinformation
Weather information
Government/politicalinformation
PhoneSMSInternetLettersRadioTVNewspaperAdvertsVillage Information CentreLocal leadersFace-to-faceNot applicable

80
Figure 3.18 : Most commonly used means of accessing types of information –
Mozambique sample Question:
Which means do you most commonly use to access or share each type of information?
0% 20% 40% 60% 80% 100%
Urgent e.g . emergencies, deaths, sickness
News about relatives
How to prevent and treat illness within the family
News (local and international)
News about friends
Weather information
Social and relig ious events e.g . marriages
Job opportunities
Remittances
Crop management
Availability and costs of inputs to purchase
Education opportunities (schools and further education)
Market prices (for selling)
Marketing information e.g. new markets
new products & activities e.g . pesticides, seeds
Transport and driver schedules
Livestock management & health
Government and legal requirements (e.g . taxes, regulations)
Entertainment
Information on clients and debtors e.g . ability to pay
Availability of credit, and subsidies, pensions, vulnerability assistance
Business skills
Romance
Information on other producers (collaborators, competitors)
Gossip
PhoneSMSInternetMessengerLettersRadioTVNewspapersAdvertsNetworksVillage info centreLocal leadersFace-to-faceNo response (i.e. not relevant)
Figure 3.19 : Most commonly used means of accessing types of information – Tanzania sample
0% 20% 40% 60% 80% 100%
Urgent e.g. emergencies, deaths -
News about sick relat ives -
How to prevent and t reat illness wit hin the family -
Informat ion about f riends and family members -
M arket informat ion -
Weather informat ion -
Crop management -
News (local and internat ional) -
Government and legal requirements (e.g. taxes, regulat ions) -
Availab ilit y and costs of inputs to purchase -
Educat ion opportunit ies (schools and further educat ion) -
Informat ion on new products e.g. pest icides, seeds -
Social and relig ious events e.g. marriages -
Livestock management & health -
Availab ilit y of credit and subsid ies -
Informat ion on clients and debto rs e.g. abilit y to pay -
B usiness skills -
Informat ion on o ther producers (co llaborators, compet it ors) -
Job opportunit ies -
Remit tances -
Romance -
Insurance -
Entertainment -
Gossip (int rigue) -
PhoneSMSInternetLettersTVRadioNewspaperAdvertsVillage info centreLocal leadersFace to faceNot applicable

81
The overall values attached to different modes of communication can be most effectively judged through a weighted distribution of their importance, i.e. by weighting the importance of information channels according to the importance of the different information types for which they are used. The outcomes of this analysis are shown in the following figures.
Figure 3.20 : Weighted importance of means of communication – India sample
-0.5 0 0.5 1 1.5 2 2.5 3
ADVERTS
INTERNET
LETTERS
SMS
LEADERS
VILLAGE INFO CENTRE
RADIO
NEWSPAPERS
TV
FACE TO FACE
PHONE
weighted index
Figure 3.21 : Weighted importance of means of communication – Mozambique
sample
0 1 2 3 4 5 6 7
SUM IMPORTANCE - face to face
SUM IMPORTANCE - radio
SUM IMPORTANCE - phone
SUM IMPORTANCE - TV
SUM IMPORTANCE - newspapers
SUM IMPORTANCE - messengers
SUM IMPORTANCE - letters by post
SUM IMPORTANCE - local leaders
SUM IMPORTANCE - adverts
SUM IMPORTANCE - village information
SUM IMPORTANCE - SMS
SUM IMPORTANCE - internet
SUM IMPORTANCE - local networks
weighted index

82
Figure 3.22 : Weighted importance of means of communication – Tanzania sample
0 2 4 6 8 10 12
LETTERS
INTERNET
SM S
VILLAGE INFORM ATION CENTRE
TV
NEWSPAPER
ADVERTS
LOCAL LEADERS
PHONE
RADIO
FACE TO FACE CONTACT
weighted index
The data in this section of the survey show strong similarities across the three national samples, which can therefore be regarded as being robust indicators of likely findings in other similar contexts (i.e. rural areas in other developing countries). However, there are also a number of important distinctions between the Indian and African samples, which are relevant to possible patterns elsewhere. In summary, the data suggest that information sources and communication channels in such contexts can be divided into four broad categories for analysis and policy development.
• Overall, face-to-face communications remains the most important communications medium for people within the African research samples, particularly when communications behaviour is weighted according to the importance of issues addressed. Broadcast radio is the second most important channel in Africa, with the telephone third, while new media opportunities such as SMS and Internet have yet to register meaningfully in this weighted analysis (though use of SMS is widespread). The picture in India is somewhat different, however. Although face-to-face communications remain very important in India, the telephone is much more significant in a weighted distribution, while television usurps the role which is held by broadcast radio in Africa.
• The telephone is the most important channel for emergency information
and communications in all three countries, i.e. it is used by almost everyone to whom it is available to meet needs that are urgent or of high priority (i.e. that have high degrees of saliency). It is overwhelmingly important in relation to urgent information/communication needs within the Indian sample, and highly important in meeting those of the samples in Mozambique and Tanzania. A key reason for this is that one of telephony’s prime advantages over other communications channels is its ability to elicit
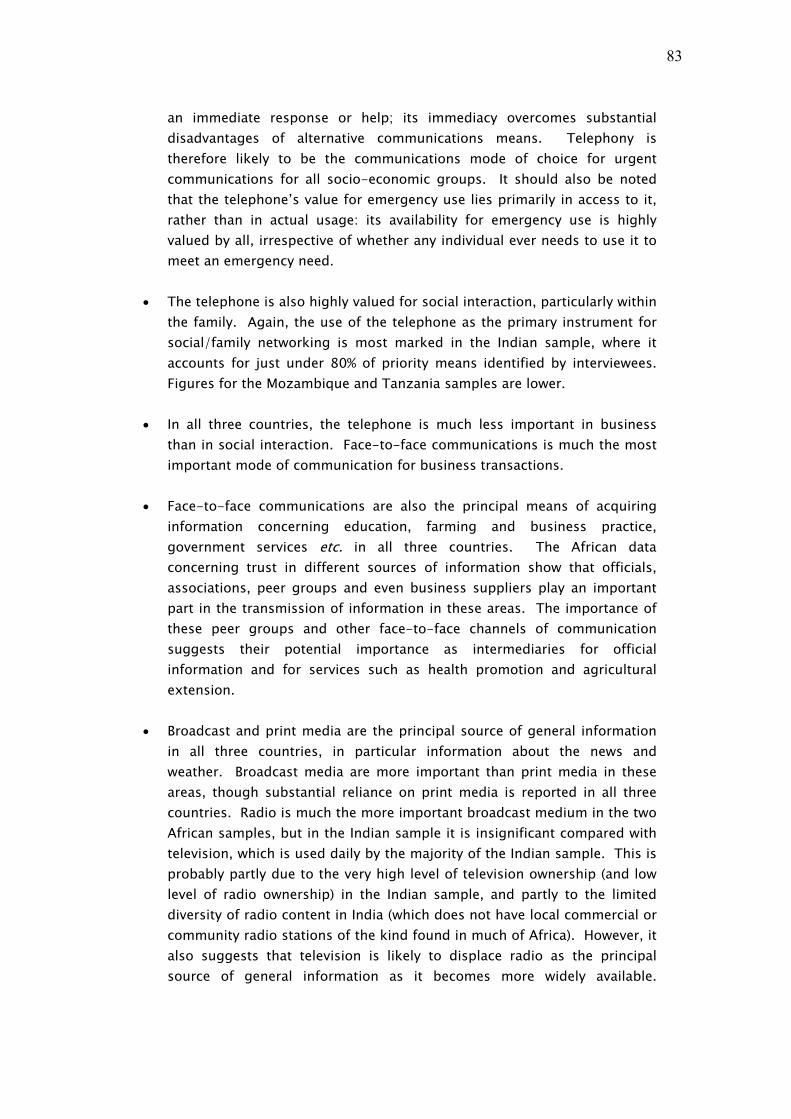
83
an immediate response or help; its immediacy overcomes substantial disadvantages of alternative communications means. Telephony is therefore likely to be the communications mode of choice for urgent communications for all socio-economic groups. It should also be noted that the telephone’s value for emergency use lies primarily in access to it, rather than in actual usage: its availability for emergency use is highly valued by all, irrespective of whether any individual ever needs to use it to meet an emergency need.
• The telephone is also highly valued for social interaction, particularly within
the family. Again, the use of the telephone as the primary instrument for social/family networking is most marked in the Indian sample, where it accounts for just under 80% of priority means identified by interviewees. Figures for the Mozambique and Tanzania samples are lower.
• In all three countries, the telephone is much less important in business
than in social interaction. Face-to-face communications is much the most important mode of communication for business transactions.
• Face-to-face communications are also the principal means of acquiring
information concerning education, farming and business practice, government services etc. in all three countries. The African data concerning trust in different sources of information show that officials, associations, peer groups and even business suppliers play an important part in the transmission of information in these areas. The importance of these peer groups and other face-to-face channels of communication suggests their potential importance as intermediaries for official information and for services such as health promotion and agricultural extension.
• Broadcast and print media are the principal source of general information
in all three countries, in particular information about the news and weather. Broadcast media are more important than print media in these areas, though substantial reliance on print media is reported in all three countries. Radio is much the more important broadcast medium in the two African samples, but in the Indian sample it is insignificant compared with television, which is used daily by the majority of the Indian sample. This is probably partly due to the very high level of television ownership (and low level of radio ownership) in the Indian sample, and partly to the limited diversity of radio content in India (which does not have local commercial or community radio stations of the kind found in much of Africa). However, it also suggests that television is likely to displace radio as the principal source of general information as it becomes more widely available.

84
(Availability of television depends on power infrastructure as well as television network coverage and affordability.)
• The telephone does not play any significant role in information gathering
by the surveyed communities, while the Internet has yet to achieve penetration levels which might enable it to make a contribution to this. The telephone is not well-suited to information gathering compared with established and trusted sources of information such as peer groups and relevant officials. The Internet is not currently sufficiently used within the samples to have had any impact on information gathering behaviour.
• Greater use is made of broadcast media and the phone (as a main means of
communication) by higher status groups. Conversely, the extent to which personal (or traditional) means are used does not differ significantly across status groupings (e.g. face-to-face, local leaders, village information centers). It is interesting to note that choice of communication channels appears to be relatively insensitive to age and to gender, although there is evidence that men tend to make greater use of broadcast media, particularly radio (and television in India). This probably reflects patterns of domestic decision-making (who decides what programmes are listened to) rather than any gender bias in the suitability of radio as a medium.
E. Telephony and livelihoods This section of the report summarises evidence derived from the survey of the impact which telephony has on livelihoods, particularly on vulnerability and on three of the five key livelihoods assets – financial, social and human capital (in this context, primarily income and savings, networking and the acquisition of information and knowledge).
E.1 Perceptions of the overall use and value of telephony A substantial section of the questionnaire research in all three research countries focused specifically on the value attributed to telephony by interviewees. The data resulting from this area of questioning build on the findings concerning information and communication flows reported in D above, and link these communication flow issues specifically to telephony. Analysis of the findings, both here and in the three country annexes, concentrates on the impact which telephony has on livelihoods (or is perceived to have on livelihoods by interviewees). It concentrates particularly on vulnerability as such and on three of the five key livelihoods assets – financial, social and human capital (in this context, primarily income and savings; networking; and the acquisition of information and knowledge).

85
The first area of questioning in this context concerned the principal uses of telephony identified by respondents. Members of the samples in the two African countries were asked to indicate their primary, second and third most important uses of a telephone. (These questions were not included in the India survey.) The findings were as follows:
Table 3.15: Primary, secondary and tertiary uses of telephony – Mozambique sample
Mobile phone Fixed phone Communication with family
29.7 12.4 4.1 33.3 22.1 3.9
Emergencies 11.8 22.1 8.6 19.9 22.6 11.4 Communication with friends
2.5 7.7 18.3 6.6 10.6 24.5
Business 5.2 1.7 2.3 3.2 1.9 3.5 Advisory information
1.2 1.2 4.8 2.3 2.9 6.8
Gaining new knowledge
0.6 1.2 0.7 0.7 0.9 1.0
Table 3.16 : Primary, secondary and tertiary uses of telephony – Tanzania sample
Mobile phone Fixed phone Primary Secondary Tertiary Primary Secondary Tertiary Emergencies 37.7 14.6 5.0 8.2 3.0 0.5Social (friends and family
12.0 29.6 10.8 2.9 6.1 1.2
Business 12.7 7.8 4.4 2.0 1.0 1.2Advisory information
0.4 2.0 4.9 0.1 0.4 0.8
Gaining new knowledge
0.3 0.5 0.8 0.0 0.0 0.1
These data confirm again that, in these sample populations, the primary uses of a telephone, of whatever kind, are for emergencies and social communication, especially within the family. They also confirm, once again, that business use of the telephone is very much less extensive than social use, but that it has high priority for a small but significant percentage of users. Finally, they reconfirm the very low valuation of the telephone as an information-gathering resource which was identified in section D.

86
A second series of questions asked respondents to evaluate their investment in using a telephone in respect of three broad types of activity - social, economic and knowledge-gathering activities - which equate with the livelihoods assets under investigation. The results of these questions further reinforce the findings described above. Once again, the findings are consistent across the three research countries. They show that the telephone is highly valued for social networking, substantially less valued for economic activities, and negatively valued as an instrument for acquiring knowledge. Figure 3.23 : Perceived benefits of telephony for economic livelihoods categories –
India sample Question:
How helpful has your investment in the use of a phone been regarding …?
0% 20% 40% 60% 80% 100%
Socialcommunications(social capital)
Economic activities(financial capital)
Knowledge (humancapital)
Very helpfulHelpfulNo opinionUnhelpfulVery unhelpful

87
Figure 3.24 : Perceived benefits of telephony for economic livelihoods categories – Mozambique sample
0% 20% 40% 60% 80% 100%
Socialcommunications(social capital)
Economicactivities (f inancial
capital)
Know ledge andeducation (human
capital)
very helpful
helpful
no opinion
unhelpful
very unhelpful
Figure 3.25 : Perceived benefits of telephony for economic livelihoods categories – Tanzania sample
0% 20% 40% 60% 80% 100%
Socialcommunications(social capital)
Economicactivities
(f inancial capital)
Know ledge(human capital)
Very helpfulHelpfulNo opinionUnhelpfulVery unhelpful
These findings show a strongly consistent pattern across all three countries. In particular, they show that:

88
• the large majority of respondents in all three countries attributed high or very high value to social uses of the telephone (including emergencies), i.e. to use of the telephone for networking and social capital;
• attitudes were mixed on the economic value of telephony, i.e. in relation to financial capital, with substantial minorities rating the telephone positively in this regard, but with significant minorities also rating it negatively;
• about 35% of respondents in each country rated the telephone negatively in terms of acquisition of knowledge (human capital), with only between 10% and 25% rating it positively. This negative valuation was particularly strongly expressed in India and Mozambique.
More detailed findings can be obtained by disaggregating these data into socio-economic categories. This shows, for example, that, while the high positive valuation of telephony for social networking and the strong negative valuation of telephony for knowledge acquisition are shared across occupational groups, there are very substantial differences in the attitude towards the economic benefits of telephony between different economic and occupational groups.
Figure 3.26 : Mean valuation of social benefits of telephony by economic group and country
-1 -0.5 0 0.5 1 1.5 2
poorest
poor
medium
rich
attitude (mean)
TanzaniaMozambiqueIndia

89
Figure 3.27 : Mean valuation of economic benefits of telephony by economic group and country
-1 -0.5 0 0.5 1 1.5 2
poorest
poor
medium
rich
att itude (mean)
TanzaniaMozambiqueIndia
Figure 3.28 : Mean valuation of human/knowledge benefits of telephony by
economic group and country
-1 -0.5 0 0.5 1 1.5 2
poorest
poor
medium
rich
attitude (mean)
TanzaniaMozambiqueIndia
In all three countries, the telephone is valued similarly by all economic status groups for social and knowledge uses, but is given a positive economic value by higher economic status groups and a negative economic value by the lowest status economic group. Similar findings result if the sample population is divided into other socio-economic status categories that overlap with economic status. All education

90
status groups, for example, give a high positive valuation to the telephone for social purposes; almost all give it a negative valuation for knowledge purposes (particularly those with no formal education; the only exceptions being the highest school educated group in both African countries); but educational status groups are divided about the economic value of telephony.
Figure 3.29: Mean valuation of economic benefits of telephony by educational group and country
-1 -0.5 0 0.5 1 1.5 2
No formal
Adult educ.
Primary
Lower sec.
Senior sec
Post sec.
att itude (mean)
TanzaniaMozambiqueIndia
Similarly, all “frequency of use” categories give a positive valuation to the telephone for social purposes and a negative valuation for knowledge purposes, but are divided on economic value.

91
Figure 3.30: Mean valuation of economic benefits of telephony by frequency of use and country
-1 -0.5 0 0.5 1 1.5 2
none
low
medium
high
attitude (mean)
TanzaniaMozambiqueIndia
The implication of this is that the telephone is valued significantly for economic purposes by the better-off within society. While everyone gains social value from the telephone, and almost no-one gains knowledge through it, economic value is disproportionately distributed in favour of those with higher status – the better educated and more prosperous, who use the telephone more frequently. If they do in fact gain significantly greater economic value than lower status groups, then the telephone is likely to be contributing towards an increase in economic disparity within communities, at least while telephone use is unevenly distributed across the population. This distributional diversity in the benefits of telephony is a significant issue for consideration by policymakers. These findings can also be disaggregated into household occupational groups, with the results set out in the following charts. In assessing these, it should be remembered that these household occupational groups are derived from data concerning the primary household income source, which is not necessarily the primary income source or occupation of the respondent. Findings should therefore refer, for example, to “farming households” (i.e. households in which farming is the main source of income), not to “farmers”. In addition, because of the variety of different open responses to sources of income in each country, there are some variations in the abridged household occupation categories used (for example, only four categories were created for the Tanzanian sample). However, it remains possible to make a number of overall observations from these data. The most interesting finding from this disaggregation is that it is business households that derive most perceived economic benefit from telephony.

92
Figure 3.31 : Valuation of social impact of telephony according to country and household occupational group
-1 -0.5 0 0.5 1 1.5 2
unskilled
skilled
Farmers
Business
prof/salaried
attitude (mean)
TanzaniaMozambiqueIndia
Figure 3.32: Valuation of economic impact of telephony according to country and
household occupational group
-1 -0.5 0 0.5 1 1.5 2
unskilled
skilled
Farmers
Business
prof/salaried
attitude (mean)
TanzaniaMozambiqueIndia
93
Figure 3.33: Valuation of knowledge impact of telephony according to country and household occupational group
-1.5 -1 -0.5 0 0.5 1 1.5 2
unskilled
skilled
Farmers
Business
prof/salaried
attitude (mean)
TanzaniaMozambiqueIndia
It is useful in this context to consider where the economic value of telephony lies for those who are gaining economic value from it. Evidence from Mozambique and Tanzania clearly shows that it lies primarily in financial savings rather than in income generation. Data from Tanzania concerning this are set out in Table 3.17 below.
Table 3.17 : Perceived impact of telephony on financial capital - Tanzania Question:
What proportional impact has using the phone had on …?
%age of user sample Large – over 10%
Medium –
6-10%
Small – 1-5%
No change
Net loss
Unable to
judge Income (earnings) 13.6 11.6 18.3 40.4 2.6 13.4
Savings (time) 44.2 28.9 21.4 4.1 0.6 0.8Savings (reduced costs)
39.7 28.7 25.5 4.5 0.8 0.8
Finally, in this context, interviewees were asked about how damaging they felt it would be to their economic activities if they were unable to use a telephone in future.

94
Table 3.18 : Perceived impact of loss of telephony on future economic activity Question:
If you were unable to use a phone any more, how would this impact your economic activities?
%ages India Mozambique Tanzania
Would not be able to continue
31.8 9.8 2.3
Would continue but with difficulty
40.8 52.5 36.7
No opinion 11.0 11.9 15.1Not much difference 6.7 11.3 23.1No difference 9.7 14.5 22.9Total 110.0 100.0 100.0
These responses show significant differences between the three countries, with the telephone considered substantially more valuable in the Indian sample than in those from Africa. This may be a result of longer experience of the telephone in the Indian context, amd may also be related to the prevalence of fixed rather than mobile phones in India (since they may be associated psychologically with place rather than person). In all three countries, however, the results are stronger in terms of the importance of telephony than might have been expected from the findings reported above. The telephone is certainly seen as a valuable business asset by a significant proportion of users who consider themselves to have business activities, though at present a majority of these do not think that its loss would have a substantial impact on their economic lives. This implies that they regard it at present as a valuable rather than an essential tool. This may be affected by habituation: use of the telephone is probably too recent for it yet to have become integral to the working methods of most small business people, but prolonged and increased use may make it more so. The higher number reporting the telephone as essential in India would also seem to suggest this. Additionally, the fact that the telephone is valued more for savings than for earnings (see following section) may mean that it is not regarded psychologically as a positive economic benefit. It would be useful to assess this further using trend data taken at a series of points in time.
E.2 Perceptions of the value of telephony for specific purposes The most detailed area of questioning in this context asked interviewees to indicate the extent to which they believe that use of the telephone has influenced a number of possible livelihoods benefits for them over the past two years. With

95
some variations, these questions are broadly consistent across the three research countries. Full presentation of the findings from these questions can be found in the country annexes. The charts below illustrate the degrees of valuation attributed, within different categories of information/communication, by the three samples.
Figure 3.34 : Perceived impact of telephony on aspects of life – India sample
0% 20% 40% 60% 80% 100%
Overall vulnerab ilit y ind icators
Help quickly in cases of emergencies
Social ind icators (networking and social capital)
Increased support f rom family
M ore f requent contact with f riends and relat ives
Improved info rmat ion regarding deaths, marriages and b irt hs
Bet ter coord inat ion with other g roup members
Financial indicat ors no t necessarily connect ed with business (f inancial capital)
Saving o f t ime spent t ravelling
Reduced cost of t ravel
Abilit y to check on availabilit y o f goods before t ravel
Increased speed o f communicat ion
B usiness indicat ors (f inancial cap itall)
New clients
B et ter market prices
Reduced costs
Increased sales
Quicker turnover
Less t ime needed t o make business arrangements
Informat ion regard ing subsidies
Informat ion and o ther resources (human capital)
Communicat ion with government departments
Info rmat ion about crop management
Info rmat ion about livestock management
Info rmat ion about new product s and t heir use and app licat ion
Availab ilit y of pro fessional staf f
Increased awareness of legal rights
Info rmat ion regard ing schoo ls and colleges
Legal requirements
Bet ter access to f amily health inf ormat ion
Large influenceMedium influenceSmall influenceNo influenceNot applicable
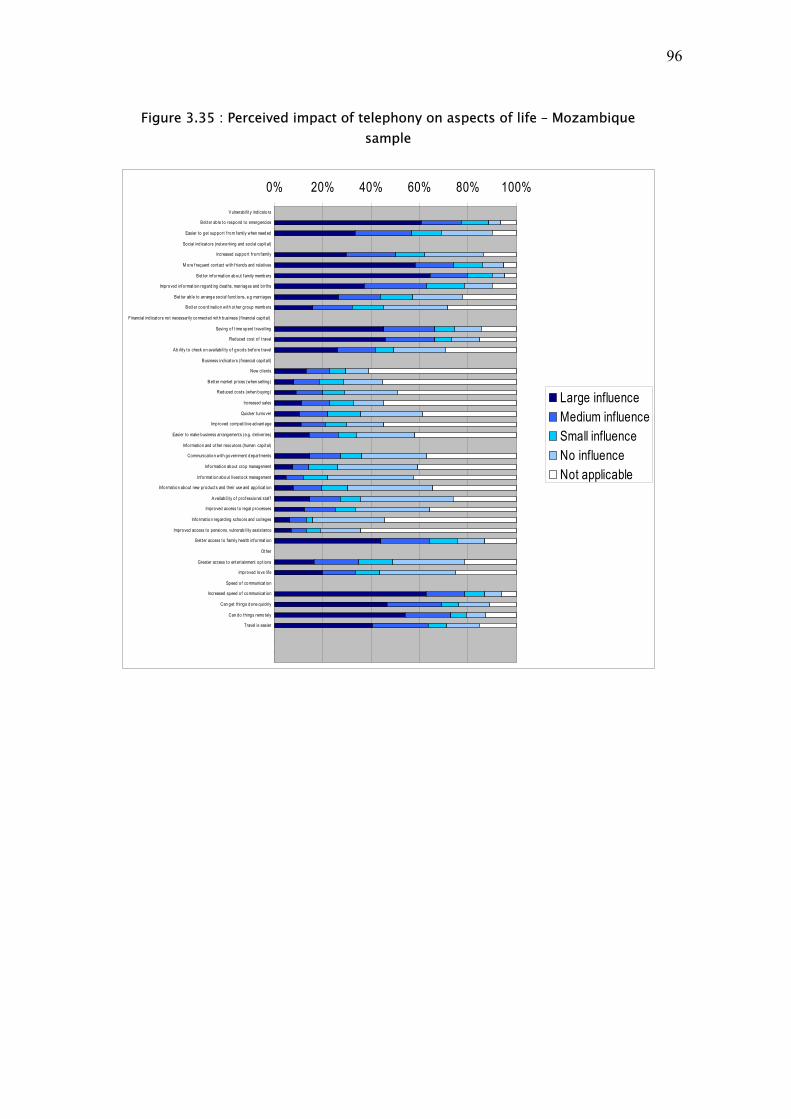
96
Figure 3.35 : Perceived impact of telephony on aspects of life – Mozambique sample
0% 20% 40% 60% 80% 100%V ulnerab ilit y indicators
Bet t er able t o respond t o emergencies
Easier t o get support f rom family when needed
Social indicators (networking and social capit al)
Increased support f rom family
M ore f requent contact wit h f riends and relat ives
B et ter informat ion about family members
Improved info rmat ion regarding deaths, marriages and births
Bet ter able to arrange social f unct ions, e.g marriages
Bet ter coord inat ion with other g roup members
Financial indicato rs no t necessarily connected wit h business (f inancial capit al)
Saving of t ime spent t ravelling
Reduced cost of t ravel
Ab ilit y t o check on availability of goods befo re t ravel
B usiness indicators (f inancial capit all)
New client s
B et ter market prices (when selling)
Reduced costs (when buying)
Increased sales
Quicker turnover
Improved compet it ive advantage
Easier to make business arrangements (e.g. deliveries)
Info rmat ion and o ther resources (human capit al)
Communicat ion with government departments
Informat ion about crop management
Informat ion about livestock management
Informat ion about new products and t heir use and applicat ion
A vailab ilit y o f pro fessional staf f
Improved access to legal processes
Informat ion regarding schoo ls and colleges
Improved access to pensions, vulnerability assistance
B et ter access to family health informat ion
Other
Greater access to entertainment op t ions
Improved love lif e
Speed o f communicat ion
Increased speed o f communicat ion
Can get things done quickly
Can do things remotely
Travel is easier
Large influenceMedium influenceSmall influenceNo influenceNot applicable

97
Figure 3.36 : Perceived impact of telephony on aspects of life – Tanzania sample
0% 20% 40% 60% 80% 100%
Vulnerability indicators
Help quickly in cases of emergencies
Greater ability to get family support when needed
Social indicators (networking and social capital)
Increased support from family
More frequent contact with friends and relatives
Receive information quickly about distant family members
Arrange social functions such as marriages
Improved information regarding deaths, marriages and births
Better coordination with other group members
Improved love life
Financial indicators not necessarily connected with business (financial capital)
Saving of time spent travelling
Reduced cost of travel
Ability to check on availability of goods before travel
Increased speed of communication
Business indicators (financial capitall)
New clients
Better market prices
Reduced costs
Increased sales
Quicker turnover
Less time needed to make business arrangements
Information regarding subsidies
Information and other resources (human capital)
Communication with government departments
Information about crop management
Information about livestock management
Information about new products and their use and application
Availability of professional staff
Increased awareness of legal rights
Information regarding schools and colleges
Legal requirements
Better access to family health information
Other
Greater access to entertainment
Large influenceMedium influenceSmall influenceNo influence
The questions and responses in this section can be brought together in categories which relate to livelihoods types, and this enables a cross-check to be made on the responses given by interviewees to the questions reported above on the overall social, economic and knowledge value of telephony. The findings from this analysis, reported in the following charts, confirm the evidence given in the earlier area of questioning.
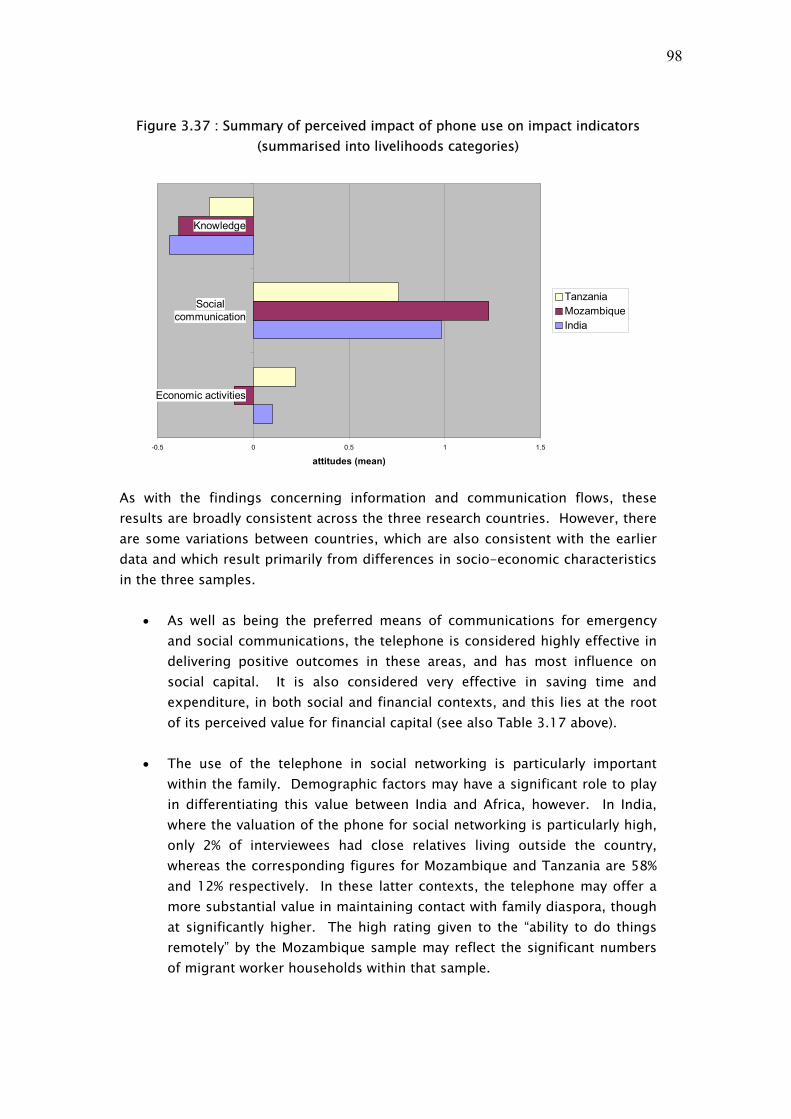
98
Figure 3.37 : Summary of perceived impact of phone use on impact indicators (summarised into livelihoods categories)
-0.5 0 0.5 1 1.5
Economic activities
Socialcommunication
Knowledge
attitudes (mean)
TanzaniaMozambiqueIndia
As with the findings concerning information and communication flows, these results are broadly consistent across the three research countries. However, there are some variations between countries, which are also consistent with the earlier data and which result primarily from differences in socio-economic characteristics in the three samples.
• As well as being the preferred means of communications for emergency and social communications, the telephone is considered highly effective in delivering positive outcomes in these areas, and has most influence on social capital. It is also considered very effective in saving time and expenditure, in both social and financial contexts, and this lies at the root of its perceived value for financial capital (see also Table 3.17 above).
• The use of the telephone in social networking is particularly important
within the family. Demographic factors may have a significant role to play in differentiating this value between India and Africa, however. In India, where the valuation of the phone for social networking is particularly high, only 2% of interviewees had close relatives living outside the country, whereas the corresponding figures for Mozambique and Tanzania are 58% and 12% respectively. In these latter contexts, the telephone may offer a more substantial value in maintaining contact with family diaspora, though at significantly higher. The high rating given to the “ability to do things remotely” by the Mozambique sample may reflect the significant numbers of migrant worker households within that sample.

99
• The telephone is thought to be much less useful as a tool of business or a means of seeking information. Where business is concerned, influence is much greater in saving time and money than in income generation. However, the telephone is an important business tool for a minority of respondents who make more intensive use of it, and is significantly more positively valued by households primarily dependent on trading/business occupations than by those who make their living through skilled or unskilled labour. This point is also considered further below.
• Health information is the only information area in which the telephone is
significantly used (and it is possible here that a proportion of respondents understood the question concerned to refer to information about the health of family members, rather than about the means to health improvement). According to these findings, telephony has very little impact and least influence on human capital.
The importance of financial savings is emphasised again in the following table, which sets out the highest value benefits identified by interviewees in the three research countries.
Table 3.19 : Highest valued benefits of telephony
INDIA (GUJARAT) MOZAMBIQUE TANZANIA HIGHEST VALUED BENEFITS
Reduced cost of travel
Can get better information about family members
Help quickly in cases of emergencies
Saving of time spent travelling
Increased speed of communication
Reduced cost of travel
Help quickly in cases of emergencies
Better able to respond to emergencies
Saving of time spent traveling
Increased speed of communication
More frequent contact with friends and relatives
Improved information regarding deaths, marriages and births
More frequent contact with friends and relatives
Able to do things remotely
Increased speed of communication
In summary, there is a high degree of similarity in the perceived value of telephony for livelihoods across the three research countries. This cross-country similarity, in spite of differences between the sample populations, gives a high level of

100
confidence that the findings are likely to be representative of other rural populations in developing countries where ownership and use of telephony is growing rapidly. In all three countries, all socio-economic groups have a strongly positive view of the value of telephony for social networking. In all three countries, all socio-economic groups see very little value in telephony as an instrument for information-gathering. In all three countries, those with higher economic status and those engaged in business activity believe that telephony has significantly positive economic value for them, while those with lower economic status and those who are not directly engaged in business activity accord it negative economic value. This economic value is focused on savings rather than income generation. The negative valuation of the economic benefit of telephony among lower income groups may suggest that, for some households, telephony can represent more of an economic burden than an advantage – an economic burden which is compensated for by the high value associated with the availability of telephony in times of emergency and its use for social networking, particularly within the family.
E.3 Impact of telephony use on other means of communications Finally, in this context, all three national surveys looked at the extent to which use of telephony has affected other behaviour and means of communication. The results from these questions are compared in the following table, which gives the mean valuations for increased or decreased use of other means of communication since respondents began to use a telephone, against a five point scale ranging from +2 = large increase to -2 = large decrease.
Table 3.20 : Impact of telephony use on other means of communications Question:
Has the use of … changed since you started using a phone?
Mean – range of -2 to +2
INDIA (GUJARAT)
MOZAMBIQUE TANZANIA
Letters and postal services
-1.88 -1.39 -1.57
Face to face communication
-1.44 -0.51 -1.04
Making social visits -1.10 -0.35 -1.00 Use of newspapers +0.10 -0.17 Referral to village council and local leaders
-0.22 -0.09 -0.23
messengers -0.49
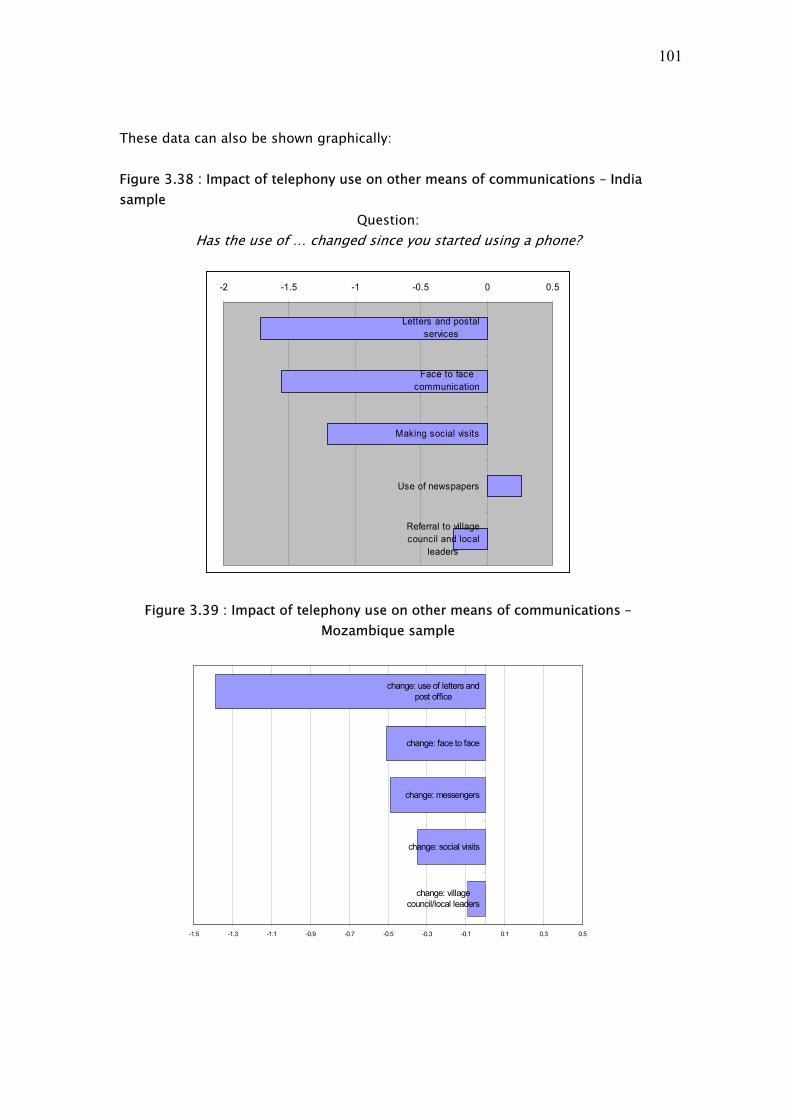
101
These data can also be shown graphically: Figure 3.38 : Impact of telephony use on other means of communications – India sample
Question: Has the use of … changed since you started using a phone?
-2 -1.5 -1 -0.5 0 0.5
Letters and postalservices
Face to facecommunication
Making social visits
Use of newspapers
Referral to villagecouncil and local
leaders
Figure 3.39 : Impact of telephony use on other means of communications – Mozambique sample
-1.5 -1.3 -1.1 -0.9 -0.7 -0.5 -0.3 -0.1 0.1 0.3 0.5
change: villagecouncil/local leaders
change: social visits
change: messengers
change: face to face
change: use of letters andpost office

102
Figure 3.40 : Impact of telephony use on other means of communications – Tanzania sample
-1.5 -1 -0.5 0 0.5 1 1.5
Radio
TV
Government services
Local leaders
District staff
Newspapers
Neighbours
Networks
Traders who sell inputs for agr. and livestock
village council/local leaders
social visits
Manufacturers
messengers
face to face
letters and post office
Reduced Increased
The most immediate impact seen from these data in all three countries is the strong negative impact of telephony on the use of postal services. A very high proportion of interviewees indicated a large reduction in their use of postal services, suggesting that traditional postal services will struggle to achieve viability as telephony use becomes more widespread. There was also a significant negative impact on the use of messengers in Mozambique, where these already significantly substituted for postal delivery. The impact of the reported decline in social visits and face-to-face communications in the three surveys is less clear-cut. The telephone has clearly had a substantial impact on social interaction, with the majority of respondents reporting at least a slight reduction in social visits and face-to-face communication. Amongst those with relatively high levels of telephone access and use, it is evident that the telephone has extensively substituted for some more direct forms of social interaction. However, these data need to be treated with caution. Interviewees’ responses indicate the extent to which social visits and face-to-face communication have been impacted but give no indication of the importance of the social interaction which have been displaced by telephony. The availability of telephony means that, for almost everyone, there will be some occasions on which it is used to replace trivial social contact that would previously have required a social visit. The sociological impact of behavioural change in this area will be more significant if use of the telephone impacts on more important social interaction. This cannot be assessed without further research. Interviewees were asked if their “need to travel” had changed in the previous two years (i.e. the question did not refer to telephony per se). Data from these livelihoods questions are summarised in the following table.

103
Table 3.21 and Figure 3.41 : Perceived need to travel
Question: Has your travel increased or reduced in the last 2 years?
%ages India Mozambique Tanzania
Greatly reduced 22.2 20.1 9.2reduced 49.3 36.5 36.2No change 12.6 13.9 35.9Increased 12.3 16.7 16.5Greatly increased 3.6 12.8 2.2Total 100.0 100.0 100.0
0% 20% 40% 60% 80% 100%
India
Mozambique
Tanzania
percent sample
Greatly reducedReducedNo changeIncreasedGreatly Increased
It is possible that the marked decline in “need to travel” indicated in these tables derives to a considerable extent from use of telephony, and, if so, this would tend to corroborate earlier evidence on the perceived impact of telephony which suggested that the telephone was highly valued for the reduction of travel costs achieved. However, the findings do not suggest that there are not still many areas of necessary travel which are not susceptible to substitution by telephony. Further research would be useful in this area.
F. Gender analysis21 The research undertaken in this study focused on household data, which is appropriate for livelihoods analysis – essentially based on household livelihood circumstances and strategies – but is less useful for gender analysis or for disaggregation according to demographic groupings such as age cohorts. In particular, two of the samples in the study substantially under-represent women, 21 This section is based on contributions by Professor Rekha Jain and Professor Ophelia Mascarenhas.

104
only that from Mozambique having a broadly equal gender balance. This is a regrettable consequence of the households livelihoods focus of the research, and the research team believes that similar analysis of communication flows on a gender disaggregated basis would be valuable. In spite of these difficulties, however, the research team took care to include a range of questions within questionnaires that would enable significant gender disaggregation to be undertaken. A comparative analysis has also been conducted of women respondents within the Sengerema district of Tanzania, in order to compare their responses with those of the sample as a whole. This evidence is briefly summarised in this section of the report, and members of the research team hope to publish further gender analysis of the findings in due course.
Education The overall country analysis found that men had a significantly higher level of education than women, particularly in India where the mean for education on a five-point scale was 3.60 for men as opposed to 2.84 for women. In India, too, men that had not received a formal education were significantly more likely to be able to read and write than women in the same position: only 39% of such men were illiterate compared with 71% of women. Women in Sengerema were also significantly less educated than their male counterparts, and female-headed households are likely to be particularly disadvantaged. Higher illiteracy levels among women will lead to differential take-up of ICTs that require literacy, including SMS.
Levels of prosperity Analysis in Tanzania suggests that female-headed households are, on average, significantly less prosperous than male-headed households, both in terms of income and household possessions. They also tended to have less ownership of ICTs such as radios, televisions and household telephones. The results of the study show that households with lower economic and educational status are likely to spend a higher proportion of their incomes on telephony, but also to gain less perceived economic advantage from this: indeed, that most of the poorest households saw the telephone as being economically negative from their point of view. The higher proportion of female headed households in these marginalised categories suggests that they will be disproportionately represented among those that feel negative about the economic value of telephony.

105
Changes in perceptions of livelihood context In both India and Tanzania, although women did perceive improvements in access to telecommunications, they were less positive about this than men. This may be because opportunities for access were less open to women than men, though it would require further research to establish this.
Information types and channels There were relatively few differences expressed by men and women when it came to identifying the most important types and channels of information. The priority attached to emergencies and social networking applied to both women and men, as did the relative distribution of valuation between the different channels available (mass media, telephony and face to face communications). However, men tended to regard a range of business and social information types as more important than women. This tends to reinforce the importance of ensuring that information dissemination programmes explicitly seek to include women in their delivery strategies.
Access to and use of ICTs A number of significant differences were evident in the use of ICTs between women and men. In India, for example:
• men use mobile phones more frequently than women (means of 1.53 and 1.25);
• men use kiosks more frequently than women; • men travel to access telephones more often than women.
Social norms and financial considerations are likely to play a part in these behavioural differences. In Tanzania, men within the sample made greater use of a range of communication channels, notably television and radio, while their use of face to face communications had declined more since the availability of telephony than that of women. Female-headed households in Sengerema used the telephone primarily for social communication (48%), emergencies (44%), business (16%) and advisory services (12%). Women in Tanzania spent less than men on telephone use.

106
Valuation of telephone use Evidence within the survey suggests that, on balance, men tend to value the telephone more highly than women, particularly where business/financial factors activities are concerned. This is likely to be associated with differences in economic status and frequency of use.
G. Use of the Internet The final section of the questionnaire posed a number of questions concerning use of the Internet. Internet use is often given a high profile in discussions of the role of ICTs in developing countries, and the relative value of telephony and Internet access is an important issue in the ICD debate. It had been hoped that the survey would provide evidence of how the Internet is being used by typical adults within rural communities which could help to inform these important discussions, particularly where policy towards Internet deployment is concerned. In practice, however, interviewees in this study had made almost no use of Internet facilities and had almost no experience of Internet use.
Table 3.22 : Experience of Internet use
INDIA (GUJARAT)
MOZAMBIQUE TANZANIA
Use of email 2% 2% 2% Use of WorldWide Web
2% 1% 1%
For almost all of those within the three samples, therefore, the Internet was simply not part of the visible spectrum of communications resources. The sample included insufficient numbers of Internet users to allow any meaningful analysis of Internet use other than to draw conclusions from its absence. The precise reasons for lack of Internet use are not entirely clear. Access to Internet facilities is, of course, much less readily available than access to telephony. Research locations were selected in order to include areas in which Internet facilities were available in local towns – the usual experience for rural populations in developing countries at present. The populations interviewed had higher average economic and educational status than the general populations from which they were derived, and evidence from surveys of Internet users in other countries suggests that they would therefore be more likely to make use of the Internet than those with lower incomes or educational attainment. (However, the focus on heads of households may have under-represented young people in

107
the sample.) Nevertheless, Internet availability had had no discernable impact on the populations surveyed, either on information flows or on livelihoods. There is also an important lesson here for future research. More research is needed to establish detailed Internet usage levels and patterns of use, barriers to Internet use and the potential impact of Internet services in rural communities of the kind surveyed in this research, particularly in view of the importance which is attached to this in many national ICT strategies and development initiatives. Trend data, indicating changes in patterns of use over time, are likely to be particularly valuable in this context. In addition, most Internet diffusion studies to date have focused on actual users of Internet facilities, for example by assessing the social-economic characteristics of cybercafé users. These studies should always be complemented by studies looking at Internet use from the perspective of the potential user community as a whole. Given the importance of face-to-face communications in information and communication flows revealed in section D above, it would also be useful to examine if and how usage and information derived from usage devolve from first movers in Internet use into the wider community.
Section 2 : Cross-country comparisons22
The following chapter supplements the analysis above with more direct comparison between findings for the Indian and African samples.
Household demographics There are a number of important differences in the household demographics of the three national samples. The sample in India had far fewer relatives living elsewhere (44%) than Tanzania with 80% and Mozambique with 88%. Similarly, Mozambique had a much high proportion of relatives living overseas (60%), notably in South Africa as migrant labour, than did the samples in Gujarat or Tanzania. In some cases, such relatives provided support for livelihood and communication needs. Being able to communicate with relatives living at a distance is therefore likely to be important in all three countries, but especially in Mozambique and Tanzania. Another noticeable difference in household demographics lies in the composition of the sample. Only 37% of the respondents in Mozambique were heads of households compared with 69% in India and 73% in Tanzania. Unlike in Tanzania and India, the respondents in Mozambique were not restricted to heads of households or their spouses but also included other resident adults. As a result, the male:female ratio for the respondents was more equitable in Mozambique than
22 This chapter is contributed by Professor Ophelia Mascarenhas
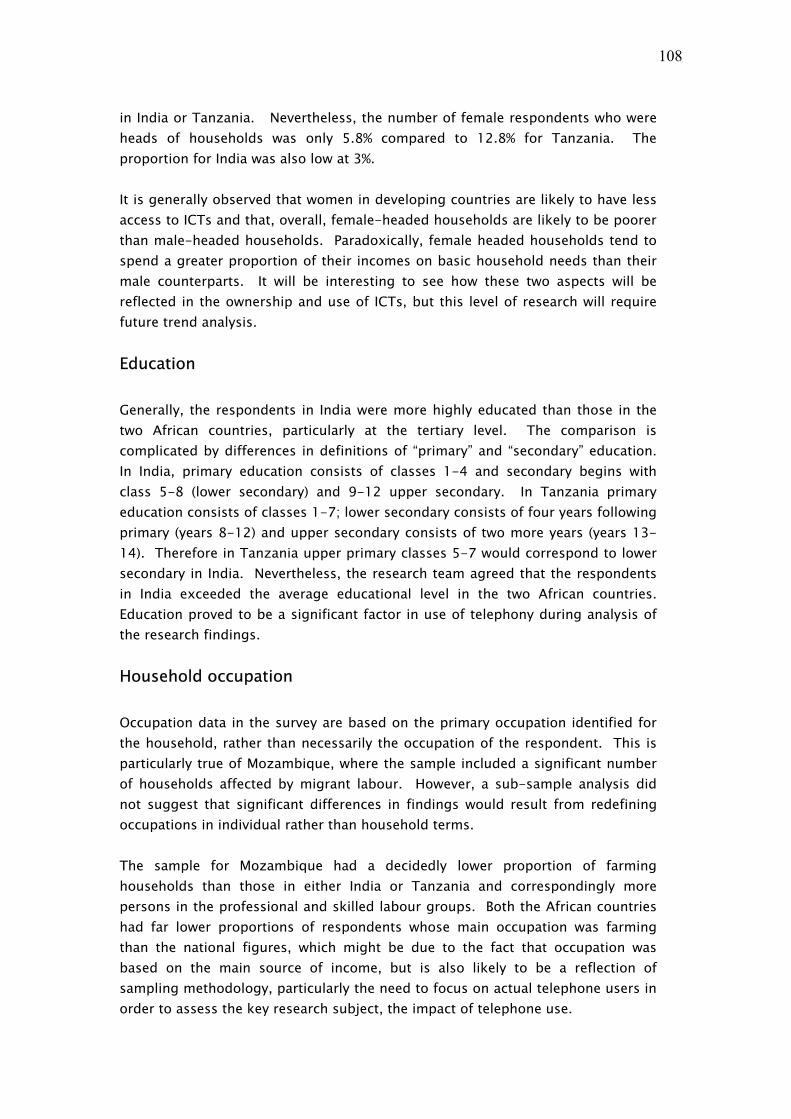
108
in India or Tanzania. Nevertheless, the number of female respondents who were heads of households was only 5.8% compared to 12.8% for Tanzania. The proportion for India was also low at 3%. It is generally observed that women in developing countries are likely to have less access to ICTs and that, overall, female-headed households are likely to be poorer than male-headed households. Paradoxically, female headed households tend to spend a greater proportion of their incomes on basic household needs than their male counterparts. It will be interesting to see how these two aspects will be reflected in the ownership and use of ICTs, but this level of research will require future trend analysis. Education Generally, the respondents in India were more highly educated than those in the two African countries, particularly at the tertiary level. The comparison is complicated by differences in definitions of “primary” and “secondary” education. In India, primary education consists of classes 1-4 and secondary begins with class 5-8 (lower secondary) and 9-12 upper secondary. In Tanzania primary education consists of classes 1-7; lower secondary consists of four years following primary (years 8-12) and upper secondary consists of two more years (years 13-14). Therefore in Tanzania upper primary classes 5-7 would correspond to lower secondary in India. Nevertheless, the research team agreed that the respondents in India exceeded the average educational level in the two African countries. Education proved to be a significant factor in use of telephony during analysis of the research findings. Household occupation Occupation data in the survey are based on the primary occupation identified for the household, rather than necessarily the occupation of the respondent. This is particularly true of Mozambique, where the sample included a significant number of households affected by migrant labour. However, a sub-sample analysis did not suggest that significant differences in findings would result from redefining occupations in individual rather than household terms. The sample for Mozambique had a decidedly lower proportion of farming households than those in either India or Tanzania and correspondingly more persons in the professional and skilled labour groups. Both the African countries had far lower proportions of respondents whose main occupation was farming than the national figures, which might be due to the fact that occupation was based on the main source of income, but is also likely to be a reflection of sampling methodology, particularly the need to focus on actual telephone users in order to assess the key research subject, the impact of telephone use.

109
In Tanzania, it was found that many rural households had more than one source of income. Diversifying subsistence farming is an established survival practice in rural Tanzania since subsistence farming has been found to be insufficient to meet basic household needs (HBS, 2000/01; Integrated Labour Force Survey (ILFS), 2000/01). It is quite possible that even those who identified themselves as farmers found that these additional activities eventually gave them more income (the basis for identifying occupations) than the original occupation of farming. Ownership of ICTs There were significant differences in the level of ownership of ICTs and other indicators of wealth between the three countries. The most notable difference was greater ownership of fixed telephones and televisions among the respondents from Gujarat, India – 37% and 66% respectively – than in Tanzania or Mozambique. The African countries relied more heavily on broadcast radio – 85% for the Tanzania sample and 73% for that from Mozambique. They also relied much more on mobile than fixed phones. The low reliance on television in the African countries is likely to result from four critical factors.
• In India, electricity is widely available and affordable (as can be seen from the fact that 97% of the sample respondents had electricity in their homes). This cannot be said for the African countries. In Tanzania, for instance, only 9% depend on electricity for lighting while 84% depend on paraffin and the remainder on a variety of sources including firewood. The cost of electricity is also high compared to the other East African countries and certainly compared to India.
• Secondly, African countries rely on imported televisions, which makes the
purchase of televisions expensive compared to India where locally produced televisions are far cheaper than imported ones.
• Thirdly, the television industry in India is well developed and programming
is more in tune with the local needs and circumstances of the population. In Tanzania most programmes are imported and focus mainly on the better off urban populations.
• Finally, lower income levels are likely to account for much of the difference
in television ownership in areas where power is equally available. The greater reliance on mobile telephones in the African samples again reflects differences in the availability of the necessary infrastructure. In India fixed lines

110
are available and affordable. On a recent visit to India, the writer of this section found that overseas calls from India to Tanzania were one-tenth of the cost of similar calls from Tanzania to India. In Tanzania and Mozambique, fixed lines are scarce and unreliable, particularly in the rural areas, and kiosks offering telephone services based on fixed lines are rare even in urban areas. The mobile telephone is therefore very popular both on a personal basis as well as for kiosks. Although access to ICTs goes beyond ownership, the pattern of ownership of ICTs does reflect the general reliance on different channels of information. The radio and mobile telephone, with their greater emphasis on oral communication, are similar in many ways to face-to-face communication, which is still a major channel for communication. The extent to which information is communicated by oral or by written means may have significant impact on the pace and nature of adoption of new ICTs. This is an area that would benefit from further research. Perceptions of contextual change There were a number of significant similarities and differences between the perceptions of contextual change recorded by the samples in the three countries. In all three countries, there was a strong perception of change in access to telecommunications, although this was significantly higher in India. Over the last two years there have been noticeable changes even in the rural areas. Restaurants and bars, for instance, are investing in the provision of television and videos as entertainment for their customers using diesel-operated generators even in places where there is no electricity, such as Chifunfu on the shores of Lake Victoria in Tanzania. Mobile telephones have penetrated rural areas and internet cafés are available beyond major cities. It is not surprising that people feel that telecommunications have improved. Generally, the Indian respondents seem to have a more positive perception of contextual changes than the respondents in the two African countries. The biggest difference lay in the perception of lack of improvement in household income in Tanzania compared to India and Mozambique. While the focus of this study is on how ICTs impact on livelihoods, it is also important to reflect on how aspects of livelihoods – including income and education – impact on the level of use of ICTs. Ownership, Access and Use of ICTs An analysis of the ownership and use of ICTs within the samples clearly illustrates the important distinction between access and ownership. The use of ICTs far exceeded ownership in all three countries. The differences were the greatest in Tanzania particularly for the use of television and mobile phones.

111
There were significant differences between India and the African countries in the degree of intention to own a phone. In the latter countries, many more people expressed interest in owning a mobile. (This may result partly from the relative distribution of fixed and mobile phones. Mobile phone use was not widespread in India at the time of the survey, and the acquisition of a phone in India may have been seen more as a household than an individual choice. This may have affected the nature of responses.) The main constraint in the ownership of ICTs such as the mobile telephone is likely to be cost – both the initial capital cost of handset purchase and the ongoing cost of airtime (assuming that usage increases in comparion with the use of publicly available phones, as seems likely). The importance of cost is emphasised by the fact that salaried and business people who also have higher economic status are the most intensive users of mobiles. Another significant difference was in the level of use of kiosks, where the level in Tanzania was much lower than that in the other two samples. In Tanzania, it is likely that many more respondents would have used kiosks if these were more widely available. Out of seven locations in the Sengerema District survey, for instance, only two had kiosks. The lack of electricity and fixed line telephones makes it difficult for business people in many rural areas to invest in kiosks, and there is scope for cooperation between public and private sectors to facilitate public access to ICTs where both power and connectivity are required. However, the availability of mobile alternatives – which offer greater flexibility and possibly greater privacy – also impacts on the likely levels of use of fixed network kiosks. A further notable fact was the difference in the use of text messages between India and the African countries, largely due to the much greater prevalence of mobile phones in the African samples. In addition, in Africa, SMS is widely used as a paging (‘beeping’) device, intended to stimulate a reverse call. In India, money can be saved by using the cheaper fixed phones in the kiosks while the mobiles are likely to be owned and used by the better off who can afford to call rather than save money using a text message. This is suggested by the fact that 62% of the mobile owners used it for business purposes although overall, face to face was the most important source of business information. In the absence of the cheaper fixed line, the respondents in the two African countries have found SMS and beeping to be a way to use mobiles more cost effectively. It was significant that the level of use of SMS was not affected by educational levels or by gender in Tanzania.

112
PART 4 :
SUMMARY AND CONCLUSIONS
A. Communications issues This section of the report summarises a number of conclusions concerning communications issues which can be drawn from the cross-country analysis above. Further conclusions concerning livelihoods issues are contained in section B of this part of the report. The commentary and conclusions in this section have been discussed in stakeholder meetings in the three research countries and incorporate comments and issues raised during these meetings.
Communication flows The evidence reported in this study emphasises the importance of understanding information and communication flows as the essential background context for the introduction, application and development of telephony and other ICTs. In particular, development applications of ICTs need to understand and build on the patterns of communication behaviour established within target beneficiary communities – offering new opportunities and supplementing communication choices where this is possible and appropriate, but also recognising the behavioural patterns and preferences of the communities within which new opportunities are made available. Successful initiatives in this area are likely to be “people-“ rather than “technology-centred”. The cross-country analysis of information and communication flows above shows clearly the high priority given by all three survey populations to emergency and social networking needs for communications. It also shows how these needs are currently met, and that the introduction of telephony has different degrees of value and importance for different purposes. (These valuations are summarised below.) The impact of telephony on any particular area of information or communication flow is clearly dependent on its perceived value in this area and the saliency of the information need involved. The same can be said of other ICTs.
The network deployment and service provision strategies of communications businesses would benefit from greater understanding and attention paid to the established information and communication flows within communities, and to the capacity of different communication channels to meet their information and communication needs. Government and donor strategies for information dissemination, communication with citizens and target beneficiaries, and the

113
application of ICTs to deliver government information and services (such as health promotion and agricultural extension), will also benefit from this.
Trends in information and communication flows are particularly important. Evidence in the surveys – particularly that concerning the importance of face-to-face communications – suggests that communications behaviour is relatively slow to change: people tend to stick with information sources and communication channels that they know and trust, rather than moving rapidly to alternatives unless those alternatives provide a substantially higher degree of reliable quality of information (for example, television over radio) or meet a need which has previously been very poorly met (the use of telephony for emergency requirements or for contact with family members in the diaspora). The process by which new communication channels become trusted and displace older channels of communication in circumstances other than these is likely to be gradual. It is as important, therefore, for policymakers to understand trends in information and communication flows as well as they understand current patterns of behaviour.
Perceptions of the value of telephony and other communication channels A variety of findings in the survey point to consistent perceptions of the value of telephony and other communication channels across all three countries. The cross-country consistency of these findings, in spite of the socio-economic differences between countries and survey populations, suggests that they are likely to prove robust in other comparable rural developing country environments. These findings therefore have considerable potential value for policymakers, communications businesses, development agencies and other stakeholders.
1. The telephone is very highly valued in all three research countries for
emergency use (i.e. for use when urgent help is required or urgent messages need to be conveyed) and for occasions of high importance. As well as being consistent across research countries, this finding is consistent across socio-economic groupings. In livelihoods terms, this represents a high valuation of telephony on occasions of high vulnerability.
The telephone offers a considerable advantage over other communications channels in emergencies because of its immediacy, particularly where communication in needed at a distance. Provided that the desired interlocutor can be reached through telephony, the telephone is likely to be much the quickest way in which s/he can be reached in high saliency situations. The speed of telecommunications is valued highly in perception responses in all three countries, particularly where urgency is involved.
114
This suggests that simple access to telephony is a priority requirement for all socio-economic groups, and has near to equal value in reducing vulnerability for all, irrespective of economic, educational or other socio-economic category. It also suggests that this value will increase as the telephone becomes widespread and more desired interlocutors are readily accessible by phone (a network externalities effect).
2. The telephone is highly valued in all three research countries for social networking, particularly within the family. This high valuation is especially marked in India and Mozambique. The telephone’s perceived value for social networking (social capital) is considerably higher than its perceived economic value (financial capital) and overwhelmingly greater than its perceived value for information gathering (human capital).
The telephone’s perceived value for social networking outside the family appears to be less than that within the family. This may well be a result of familiarity (as the word itself implies). Family members have typically interacted with one another for many years, and are likely to be more familiar with each other than they are with non-family members. Relationships within the family may therefore be more trusted, and it may be easier for new telephone users to infer the physical nuances of face-to-face communications (body language) from voice communications within more familiar and more trusted relationships.
The sociological implications of this will vary between countries. There is evidence in all three countries that telephone use is displacing some social visits and face-to-face communications within the family. This may have significant social consequences if it impacts on major family contact (such as celebrations or regular family gatherings), but may not have such significance if it only displaces minor family communications (such as making arrangements for future family gatherings or transmission of unimportant news). In Mozambique and Tanzania, where interviewees are more likely to have close family members living outside the country, it is likely that the telephone enables significantly greater interaction with migrant workers and diaspora family members than was possible before telephony became available.
3. The telephone is highly valued for achieving savings in time and money, for example in obtaining goods, replacing some need for travel, etc. As with emergencies, this reflects the immediacy of telephone communications, one of its most significant added values in comparison with other communication modes. Communications businesses and development organisations should pay attention to this high valuation of speed of

115
communications in their strategic thinking about how best to deploy telephony in their business and development strategies.
The evidence in the survey suggests that telephony significantly reduces need to travel, but that there remain many occasions of need to travel which are not displaced by telephony, for example because they still require face-to-face interaction or the acquisition and transport of physical goods. One implication of this is that, at present, the telephone is more likely to displace travel for social networking (where the telephone is more highly valued than face-to-face communications) than for business purposes (where face-to-face communications are common and appear to be more highly valued, and where the transport of goods is often also involved). Overall, it could be suggested that the telephone represents an additional resource, which will be used more where savings in time and money are high and where the added value of face-to-face contact is low, but that it will not readily displace travel where savings are less and the added value of face-to-contact is high.
4. The telephone is less highly valued for economic purposes, in all three countries, than for social purposes. Where economic purposes are concerned, the telephone is much more highly valued for reducing expenditure than it is for increasing income (for example, through marketing). Higher earners appear to benefit more, economically, from telephony than lower earners.
A number of reasons for these findings have been suggested in the preceding paragraphs. The financial savings potentially derived from telephony, whether in social or business interactions, are immediate, while potential benefits in terms of income generation are likely to be slower to materialise. The telephone can enable producers, intermediaries and consumers to increase information about the availability and price of goods, and so can enhance market performance (though the ways in which it does so are much more complex than the rather naïve suggestions which are sometimes made that it enables producers to “bypass intermediaries”). However, there are risks involved in changing communication channels used for business purposes, and both parties to a transaction need to trust the use of the telephone (or feel an absence of increased risk in using it) for this to become preferred to established communication modes. Disaggregation of the research data by economic status and household occupational groups, however, suggests that there are significant socio-economic differences within these findings. Positive valuations of the economic value of telephony were given by frequent users of telephony and by higher economic and educational status groups, while lower

116
economic and educational status groups and less frequent users of the telephone tended to give it negative economic valuations. (These socio-economic characteristics tend to be shared, so that different socio-economic disaggregations tend to measure the same distinction between more prosperous and more marginalised members of the community.) Business households, i.e. those involved in trade, tended to give higher economic value to telephony than farming households. This suggests that business people, particularly those that are more successful, do positively value telephony within their business activities, but that non-business people and those that are less economically successful have a much lower – and frequently negative – view of the impact of telephony on their economic lives. Within the business community, increased access to market information may help frequent telephone users (who tend to have higher economic and educational status) to gain business advantage and/or market share over non-users. (For this better-off minority, the telephone has become a valued and valuable, if not yet essential, tool.) If this distributional finding is correct, then use of the telephone, as it is currently distributed within the surveyed communities, may tend to increase rather than decrease income and other economic disparities between the more prosperous and the more marginalised within the community.
6. The negative valuation of the economic impact of telephony evident amongst lower status and lower income groups may suggest that, for them, telephony is as likely to be a financial burden as a source of financial benefit. The evidence in all three countries suggests that poorer groups spend a higher proportion of their income on telephone costs (in Mozambique and Tanzania, a significantly higher proportion) than those with higher economic status. At the same time, only a relatively small proportion of interviewees is using telephony to improve receipt of remittances.
As noted in the discussion of these points above, expenditure on telephone costs includes both:
• expenditure which substitutes for other expenditure (e.g. on transport
or postal services), in which case telephony use may reduce total household expenditure; and
• additional expenditure which would not occur if telephones were not available, which may increase total household expenditure.
It is likely that poorer households tend to use the telephone more for substitution and for high priority uses such as emergencies (for which

117
other communication channels are less highly suited), whereas those with higher economic status are more likely to incur additional expenditure, for example through casual (rather than priority) social calling. A relatively high proportion of household expenditure on telephone costs can represent a saving on overall household expenditure if telephone costs are primarily incurred in place of other costs. It is not possible to draw final conclusions on this point from the data in the survey.
7. The telephone is considered to have very little value for information-gathering by all three survey populations. Information needs in all three countries were primarily met through mass media and face-to-face communications.
In all three countries, mass media were the primary sources of general information on issues such as news and weather. In Africa, the primary mass medium was broadcast radio; in India, broadcast television. Newspapers are also highly valued in all three countries. Information of this general kind is ideally suited to mass media such as broadcasting, and very poorly communicated through telephony. The overwhelming importance of broadcasting confirms evidence from other studies, and reinforces the importance of the use of broadcasting as the primary medium for the dissemination of information in areas such as health promotion. The much greater importance of television than radio in the Indian sample is noteworthy. Television was much more widely owned within the Indian sample than radio, and overwhelmingly more important as a source of general information. There are a number of likely reasons for this: the relative prosperity of Gujarat in relation to the majority of India, and of the survey sample in relation to the general population; the relative lack of diversity and limitations in general news content in Indian broadcast radio; and the greater attractiveness of television over radio as a form of entertainment. Further research would be illuminating in this important area for public policy concerning the dissemination of public information messages. Face-to-face communications was by far the commonest mode of communications in all three countries for specific information such as that on business matters, educational opportunities and government programmes. Officials, business partners, opinion leaders within peer groups and other family members were key sources of information, and information derived from them was trusted to a relatively high degree. Telephony had had no significant substitution effect here: although such information could be obtained through telephone conversations, face-to-

118
face communication was still overwhelmingly preferred. This emphasises the importance of direct face-to-face contact in the delivery of information, especially with peer groups and particularly where changes in behaviour may be significant (for example, in HIV/AIDS prevention or in agricultural extension). Development strategies in these areas need to build on these established information and communication flows, and will be more effective if they make use of new technologies (such as telephony/fax and Internet/email) to reinforce them (for example, by taking advantage of the role of opinion leaders) rather than seeking to replace them (for example with direct information-gathering by end-users).
8. Data from the survey allow some analysis of the relationship between access and frequency or intensity of use in determining the value of telephony, particularly where different livelihoods areas are concerned. In all three countries, the telephone is highly valued for emergency use and social networking in all socio-economic groups. This suggests that access to telephony – which enables these types of use – is also highly valued, and offers significant livelihoods gains. For low income groups in particular, such access is likely to be made through public facilities such as telephone kiosks. In all three countries, the telephone is little valued as a tool for information-gathering. Higher status groups accord it higher value for these purposes than lower status groups, but almost all socio-economic groups in all three countries record negative values in this context, with the more marginalised groups expressing this negative valuation more strongly. This has important implications for governments, development agencies and other stakeholders which are seeking to use the telephone to disseminate information, especially to marginalised groups. In all three countries, the telephone is valued more for economic purposes by higher status groups and by business people than it is by lower status groups and non-business people. The data show that there is a significant group of high intensity users in all three countries, which is strongly correlated with higher economic and educational status and with business occupations. These high intensity users tend to be private phone owners – of fixed lines in the Indian sample or mobile lines in those in Mozambique and Tanzania. For these groups, the value of telephony is correlated more closely with frequency of use than with access per se.

119
Internet and postal services The Internet was not used by any significant number of interviewees in any of the three research countries. In total, less than 2% of interviewees in the three country samples had any experience of Internet. This was in spite of the accessibility of Internet facilities to interviewees in local towns in most sample areas. The populations interviewed also had higher average economic and educational status than the general populations from which they were derived, and evidence from surveys of Internet users in other countries suggests that they would therefore be more likely to make use of the Internet than those with lower incomes or educational attainment. There is a growing literature on barriers to use of the Internet which focuses on issues such as lack of required skills (literacy, keyboard skills and – where web browsing is concerned – research skills), lack of desired or usable content (according to language or local relevance, although the perceived value of entertainment should not be underestimated, as experience with the spread of television has shown in many countries), lack of intermediary support, and high costs of access. Unfortunately, the number of Internet users recorded is too low to make any assessment of these different barriers to use from the data available. The main conclusion to be drawn from the Internet use findings in the survey is that the Internet was not being used by the surveyed populations at the time of the survey. Further research is needed into the barriers to use involved and into the relationship between the Internet and established information and communication flows, particularly its relationship with information-gathering and with trusted sources of information such as extension workers and opinion leaders within peer groups. The effective deployment of Internet resources in development will clearly depend on positive integration of such resources into established information and communication patterns and the availability of content – whether didactic or entertainment – which meets the desires as well as the developmental needs of target beneficiaries. It is particularly important that research into Internet use in rural areas:
a. examines the impact of Internet facilities on the general population as well as surveying users of Internet facilities themselves; and
b. distinguishes between use by the general population and use by officials and opinion-formers who act as information intermediaries between information providers and the general population.
If the impact of Internet on the surveyed populations is currently minimal, that of telephony on postal services is substantial. In all three countries, interviewees
120
reported a very large reduction in their use of postal services since telephony became available. This substitution effect is a natural consequence of the immediacy and interactivity of telephony, which offers a higher quality of communication than postal services, and is likely to be particularly significant where a high proportion of the population is non-literate and/or where postal services are unreliable or of poor quality. As in industrial countries, it seems likely that postal services will need radically to reconsider their role and performance if they are to be commercially viable in future.
B : livelihoods issues
This part of the report presents some conclusions from a livelihoods perspective, exploring what the study suggests about the role and impact of ICTs, and particularly telephony, in relation to the various elements of the livelihoods framework described and illustrated in Part 1 above. The main effects of increased access to telephony, as suggested by the present study, are in the areas of enhancing and maintaining social capital and enabling people to deal more effectively with certain aspects of their vulnerability context.
1. Importance of information and the means of communication to livelihoods
The survey data from the three countries confirm the importance of many different kinds of information to people’s livelihoods and general well-being, ranging from information from and about family members, to information related to their livelihood strategies (crop management, remittances, market prices, government and legal requirements, etc.). They confirm also the importance of interactive communication – the ability to engage in dialogue with others, whether in social or business transactions. Particularly important are those interactions linked to social capital, conversations between members of a family or within a wider social network. However, for most respondents in the surveys, telephony is not the preferred means of communication or obtaining information relevant to livelihoods, with the exception of communication or information related to family emergencies and other family networking. For accessing most kinds of information, telephony is less important and less preferred than face to face communication and broadcast mass media. With interactive communication also, and particularly for most business transactions, dealing face to face with interlocutors is seen by most as preferable to using the telephone. Keeping in touch with distant family members is one area, however, where telephony seems to have become a preferred mode of interactive communication.
121
2. Livelihoods assets The analysis suggests that, of the five main categories of livelihoods assets (human, social, financial, natural and physical capital), telephony is most closely associated with social capital. This is seen clearly in the data reported earlier on the ranking of many potential benefits of telephony. Keeping in touch with family members, obtaining news about friends and being informed about and being able to respond to family emergencies are not only among the most highly valued types of information, they are also those for which telephony is the preferred means of obtaining and sharing information. This is not surprising, given three particular characteristics of telephony: its immediacy, point-to-point interactivity and (relative) privacy. There are occasions (e.g. funeral announcements) where a paid-for announcement on the radio is an efficient way of getting family and social information to those who need it; but in many other family and social situations, the ability to contact an individual friend or relative is one of the most highly valued benefits of telephony. For those who have invested in a telephone, the perceived benefits are overwhelmingly in the social capital area.
Information and communication relating to the other asset categories are seen as important, but respondents in the study are more likely to turn to other methods of communication for them than telephony. In respect of natural capital (soil, water, trees, growing crops, etc.), weather and market information are important to enable farmers to manage their resources in both the short and longer terms. However, the telephone is not (yet) seen as a means to access such information. It is likely (but not within the remit of the present study) that these attitudes towards the telephone as a means of obtaining farming and natural resource management information are matched by attitudes of those who provide such information, i.e. that they also perceive the telephone as not being an obvious way of interacting with their rural clients.
Although we have no survey data relating specifically to physical capital, it is reasonable to assume that findings would be similar to those for natural capital, particularly in regard to the acquisition and disposal of physical assets – i.e. a preference for face to face transactions. For financial assets, the earlier analysis shows a limited perceived relevance of telephony. There is little evidence in the survey data that telephony has helped respondents increase their financial capital, whether through improved access to financial services or through more efficient and profitable business operations. The evidence shows that, even among those who have invested in acquiring a telephone, only around one in three feels that it has benefited her/his financial activities. On the other hand, a large majority of the Indian respondents reported that access to telephony had saved them money in areas not related to their business operations or livelihoods activities, which has a direct impact on the level of financial capital available for other expenditures. More generally, the potential
122
for telephony to save money that would otherwise have been spent on travel is acknowledged. However, the telephone is an important business tool for a minority of respondents who make more intensive use of it. This is seen clearly in the India study, for example, where the impact on better market prices is not considered important by the sample as a whole but is highly valued by intensive users. Human capital was addressed in this study in terms of education and knowledge. Here too, telephony is not seen by many respondents to the questionnaires as a natural choice for supporting this aspect of human capital development. Although those who say their level of knowledge and education has increased in the past two years are more likely than others to say their access to telecommunications has improved, there is no such correlation with the frequency of use of telephones, suggesting that the two indicators are not causally related. Furthermore, of those who have invested in a telephone, less than one in four says that it has benefited her/him in terms of increased knowledge. On the other hand, telephony is seen as relevant to accessing informing to help keep family members healthy, which is another important aspect of human capital particularly in relation to the economic activities of the household.23 In India, hardly any of the respondents reported using the telephone to acquire knowledge, preferring to use the mass media to meet this need. Similarly low levels are seen in the other two country samples.
3. Vulnerability The potential impact of telephony on vulnerability lies in people’s ability to obtain information that allows them to deal with seasonal factors (e.g. weather information), reduce the imbalance between themselves and those they trade with (e.g. price information) and respond more quickly and effectively to shocks. It is in this latter area that respondents acknowledge the beneficial impact of telephony. Consistently across the three countries and in response to a range of questions, the biggest single benefit is the ability to deal with family emergencies. The Mozambique study concludes, for example, that the telephone is most used to address vulnerability at times of crisis, while for the Tanzania sample the telephone is the preferred means of communication in times of emergency. Although the immediate effect of this use of telephony will be felt in the human and social capital components of the assets pentagram, it can have an indirect and significant economic benefit, for example by reducing the length of time a family member is unable to work or by avoiding the need to travel in order to deal with a particular emergency involving a relative who lives at a distance (so reducing the
23 We should, however, be cautious in interpreting these responses as some respondents may have
interpreted the question as referring to seeking information about a sick relative rather than seeking information that would help lead to an early diagnosis or self-treatment.

123
need to be away from income-earning activities in addition to the cost involved in long distance travel).
4. Policies and institutions One of the arguments frequently made in favour of increased access to ICTs, including telephony, is that people can more easily access government services and information about policies and availability of services. Also, it is suggested, they can more easily assert their rights within the institutional framework (for example, in relation to land rights, education and access to financial services). In time, it is argued, this increased access and ability to put pressure on government and other services will lead to an improvement in the quality of those services. However, there is no significant correlation in the evidence in this study between respondents’ perception of improved access to telecommunications and their perception of improvements in the quality of government services. In both India and Tanzania, perceived improvements in education opportunities (which are primarily provided by government) correlated significantly with perceived improved access to telecommunications, but it seems unlikely that this reflects a direct causal relationship. Similarly, the country analyses show no correlation between reported frequency of telephone use and perceived change in quality of government services.
5. Livelihoods outcomes The analysis in earlier sections of this main report, and in the country annexes, shows that those who are engaged in business activity and those of higher economic status believe that the telephone has brought them significant economic benefit. Other categories of respondent, however, see no economic benefit. Specifically, there is no significant correlation in any of the three countries between changes in household income and frequency of telephone use or perceived change in access to telecommunications. In Mozambique, however, there was a positive correlation between frequency of use of telephones, particularly mobiles, and change in overall quality of life over the previous two years.
C : Implications and recommendations for policy-makers and other stakeholders
The findings of this study provide the first detailed evidence of the impact of telephony on communications behaviour and livelihoods in rural communities in developing countries. The strong consistency of many of the findings across the three research countries suggests that they are likely to be relevant in many other similar contexts.
124
Communication flows are much slower to change than communication technologies. Policymakers in government, business, development agencies and other stakeholder groups would do well to focus on the established and trusted communication patterns within beneficiary communities and build upon these when seeking to influence behaviour or achieve development or business goals. The overwhelming importance of social communications needs within telephony and the high degree of preference attached to mass media and face-to-face communications are particularly important in this context. New media and new technologies are most readily adopted within populations when they meet established needs or offer substantial added value – and ease of access – in comparison with existing media and technologies. Telephony, in particular mobile telephony, adds a new dimension to the communications environment in rural areas of developing countries. It is the first mediated means of communication which puts the initiative firmly with the person who has the means of communication in his or her own hand. With radio, television, newspapers, training activities and all other ICTs which are to varying degrees available in rural areas, people have access only to the information that someone else places in their way. Telephony, by contrast, is a tool which people can (at least potentially) use (at least partially) to overcome some of the information constraints that affect their livelihoods and to explore new opportunities. Telephony also offers a much better way of meeting high value priorities such as emergency support and family networking, but is seen as less effective than face-to-face communications in providing information. Broadcasting is highly valued for its general information provision and its entertainment value. In the surveyed populations, the Internet faces considerable barriers to use, including cost, skill requirements and lack of valued content as well as difficulty of access and lack of experience in use. Take-up is also likely to be slower with more complex technologies. Telecommunications access is highly valued by all sections of the community, particularly because of its potential role in emergencies. This implies that universal access has substantial social value, irrespective of revenue that may be derived from it by telecommunications operators – reinforcing the value of universal access strategies and funds from a public policy perspective. However, the high level of use of the telephone for social networking implies that subsidised access should not be required in most rural locations – a finding corroborated by experience in Uganda, where unsubsidised wireless access now covers over 85% of the population of a low-income rural country. Government investment in improved access to telephony in rural areas should be seen as part of an overall strategy of expanding access to the means of communication. Telephony will enable rural people to overcome some of their
125
information and communication constraints, but will be much more advantageous for those who are best equipped to use it. Other needs and opportunities can be met by improving access to and better content on other communication channels, and by enhancing access to and quality of face to face services (agricultural and small business development advice, information on financial services, community health and education). The high value attached to broadcasting and to face-to-face communications suggests that policymakers should pay particular attention to the role of these information intermediaries in applying ICTs to development. Broadcasting – radio in Africa, but television in India – is particularly useful for disseminating information of general value, both where urgent action is required and in gradual transformation of behaviour patterns (for example, health promotion). Information intermediaries such as local opinion-leaders and agricultural extension officers can give much more detailed and specific advice. The telephone, SMS, fax machine and (when and where available) Internet can be effectively deployed to support their work even where they are of limited value in providing information directly to target beneficiaries. The survey’s findings concerning the economic value of telephony are also of significance. It would appear from the findings that higher status groups are finding the telephone of positive economic value, but that this experience is not shared by lower status groups. This suggests that the telephone may be increasing the differential between rich and poor, prosperous and marginalised at this stage of its adoption and distribution. Governments, development agencies and NGOs should keep a close eye on this issue to mitigate any tendency for ICTs to contribute to the growth of inequality. Telephony undoubtedly has a role to play in improving access to government services and information. However, this will only be successful if those services are designed to respond to enquiries from the public, and if the prevailing public service ethos is responsive to the needs and concerns of members of the public. Telephone numbers of relevant government departments need to be widely available and systems need to be in place for dealing with telephone enquiries. The fact that almost no-one in the survey samples currently regards the phone as a worthwile means of contacting government services is likely to reflect the lack of these factors as well as intrinsic preference for face to face contact with someone from whom immediate support or guidance can be obtained. The availability of telephony should certainly not be taken, on the evidence of this research, as an opportunity to shift resources away from face to face delivery. Telephony will be an attractive alternative for some, but the survey data strongly suggest that the majority of respondents in all three countries will for some time feel more comfortable contacting and dealing with government services in person

126
rather than over the phone – and will certainly find this more convenient than new ICTs like the Internet. This is likely to be particularly true of more marginalised groups such as the poor, unskilled workers and the less educated. Similarly, the telephone will only become a natural choice for accessing information to help people make better, less risky and more timely decisions about using and managing their assets if reliable services are in place to provide that information. The phone can be an efficient way of obtaining a weather forecast, or market price information, but only if the service to provide it is there, known about and trusted. There are, in other words, important supply issues here which need to be addressed as part of any communication delivery strategy in these areas. Donors, too, should pay attention to these issues. Telecommunications operators could contribute positively in this context by encouraging governments to improve and reorientate their communication functions so that they actively respond to requests for information and the opportunity to engage in transactions by telephony. They may find it commercially worthwhile themselves to invest in, or facilitate the emergence of commercial services for the provision of information which is currently obtained (if at all) through face to face or mass media means, where there is evidence that this can increase efficiency of access. Certainly, it would be worth operators’ while undertaking market research along the lines of the research conducted for this study.
Further research The study reported in this document is one of the first to address in detail the impact of telephony on the behaviour of rural communities in low-income countries. As such, unsurprisingly, it has generated many questions as well as providing extensive new evidence about information and communication flows, preferences and usage. Further research into a number of issues would help to elucidate these and add considerably to the value of this analysis for policymakers and others concerned to maximize the impact of ICTs on social and economic development. Further research along the lines of this study would be especially appropriate in building a broader range of experience and assessing the impact of telephony and other ICTs over time. Telephony, in particular, is being adopted at a very rapid rate and it is vital to understand trends over time in the impact this is having on livelihoods, as well as taking occasional snapshots of the current picture. Further exploration of a number of specific issues would also be valuable. These include findings which would benefit from analysis in greater depth (such as the differences in perceptions of economic benefit between business people and
127
others) and findings for which larger or more diverse sampling might bring greater clarity (such as the relationship between use of radio and television). Specific areas for further research include the following:
• Gender differences in information and communication behaviour • Differences in the behaviour of business and non-business users of
telephony and other ICT resources • Differences in perceptions of radio and television as sources of information • The relationship between telephony and (need to) travel • The relationship between telephony and face-to-face communications,
particularly the role of opinion leaders in influencing behaviour. Above all, the study reinforces the importance of establishing a sound evidential basis for policy design where ICTs are used to implement development objectives. The success of development initiatives of this kind using ICTs depends on a number of factors, including the management context, power and communication resources, personal skills for maintenance and delivery of services, etc. The attitudes of target beneficiaries, current patterns of information flow and the role of established information intermediaries are all critical to the effectiveness of programme and project delivery. Research along the lines of that undertaken for this study can play a major part in improving the chances of success.
128
THE ECONOMIC IMPACT OF TELECOMMUNICATIONS ON RURAL LIVELIHOODS AND POVERTY REDUCTION:
Report of DFID KaR Project 8347
ANNEX A: INDIA (GUJARAT) RESEARCH REPORT
Report by:
Professor David Souter (Research Coordinator and Report Editor) with
Professor Rekha Jain Dr Kevin McKemey
Dr Nigel Scott
Introduction This annex summarises the findings of research undertaken in India (State of Gujarat) as part of a research programme on The Economic Impact of Telecommunications Access on Rural Livelihoods and Poverty Reduction financed through the UK Department for International Development’s Knowledge and Research (KaR) programme. Research for this programme was undertaken in three countries – India (State of Gujarat), Mozambique and Tanzania – and findings relating to all three countries are included in the main research report to which this document forms an annex. The primary concern of the research project was to assess the impact and implications of ICTs, particularly telephony, on and for the livelihoods of low-income households in representative rural communities in the three research countries. It should be noted throughout that the concern of the study is with the impact of telephony on those that are making some use of it, not with penetration rates for telephony or other ICTs. The overall methodological approach to the study was based on the sustainable livelihoods approach outlined in DFID’s Sustainable Livelihoods Guidance Sheets,24 focusing in particular on vulnerability and on the key livelihoods assets described as financial, social and human capital. Data was collected through field research, including both focus groups and detailed questionnaire research in three different
24 These can be found at http://www.livelihoods.org/info/info_guidancesheets.html.

129
locations in each country, the total national sample in each country being around 750 adult individuals (mostly heads of households). A note on the selection of locations and on the extent to which findings can be generalised will be found at the end of this Introduction. The field research undertaken in India (Gujarat) was designed in partnership between the research coordinator, Professor David Souter of ict Development Associates ltd (ictDA) and the University of Strathclyde; the national research partner, the Indian Institute of Management (Ahmedabad) (IIM(A)); and the project data analysis team from the UK development consultancy Gamos Ltd. Field research in India was undertaken during August, September and October 2004 by the Indian Institute of Management (Ahmedabad), under the coordination of Professor Rekha Jain. Data analysis was undertaken by Gamos Ltd in conjunction with IIM(A) and ictDA. This country report was drafted by Professor David Souter of ictDA in conjunction with Dr Nigel Scott and Dr Kevin McKemey of Gamos Ltd and Professor Rekha Jain of IIM(A), and was completed following a multistakeholder review meeting in India in May 2005. Overall project management was undertaken on behalf of DFID by the Commonwealth Telecommunications Organisation. This annex is divided into seven sections. Section A reviews the research methodology, briefly summarising the description of this included in the main research report; describes the locations selected for research in Gujarat; and draws attention to issues arising from research methodology that are specific to India or to these locations. Section B describes the overall sample used for the research, focusing on its demographic characteristics, and discusses its representativeness and reliability. Section C describes the sample’s access to, ownership and use of telephony. Section D outlines findings from the research concerning information and communication flows of importance to interviewees and their communities. Section E reports on interviewees’ attitudes and perceptions concerning telephony, and relates these to key aspects of livelihoods analysis, particularly concerning financial, social and human capital (income and financial savings, networking and access to information and knowledge). It includes comments on socio-economic and gender disaggregation of these findings. Section F comments on issues concerning the Internet.

130
Section G summarises the findings from the country study, and draws attention to findings of interest which are outside the remit of this research project. It concludes with country-level conclusions and recommendations drawn up after discussion during a country-level stakeholder meeting held in New Delhi on 17 May 2005. A copy of the India (Gujarat) research questionnaire is included as an appendix to the overall research document, alongside copies of the questionnaires used in Mozambique and Tanzania. To facilitate comparison by readers, the structure of this chapter closely resembles that used in the comparable analysis of findings for the other two research countries, set out in Annex B (Mozambique) and Annex C (Tanzania). Some duplication of material is included so that the annexes can also be used as stand-alone documents in the individual research countries. The findings of all three country studies are compared and analysed together in Part 3 of the main research report. It is important to note both the significance and the limitations of the data and findings included in this study. In the last five years, telephony has become much more widely available and extensively used in rural areas of developing countries, while there has been considerable debate about the role and value of other information and communication technologies (ICTs) in low-income rural communities. As discussed in the introductory sections of the main research report, however, very little detailed research has been undertaken to date into the impact of telephony and other ICTs on actual behaviour, on information and communication flows, and on livelihoods impacts in such communities. Extensive debate about impacts has therefore taken place in what is substantially an information vacuum. This study is one of the first in this field to examine substantial samples in a range of developing countries in sufficient detail to enable significant conclusions to be drawn for the communities that are assessed. It therefore adds considerably to the quality of information available for evidence-based policy formulation and implementation by policymakers in national governments, business organisations, civil society and the international donor community. A critical issue for any research of this kind is the extent to which its findings can be generalised from particular research locations and countries to the wider world. The shortage of substantive research in this field to date has led to some exaggeration and misinterpretation of the findings of such studies as have been undertaken, often disregarding the small size and unrepresentativeness of data samples used and/or country- or location-specific factors.

131
A principal aim of this project has been to provide more substantial evidence for behaviour and so increase understanding of what is actually taking place within low-income communities in developing countries. The sample sizes and methodological approach in this study provide significantly more substantial indications of what may be happening on a wider scale in comparable low-income and rural communities in other countries than previous research in this field. Findings that are consistent across all three research countries should be regarded as particularly significant, and these are reported in Part 3 of the main research report. The research team hopes that the research findings as a whole will contribute significantly to the serious analysis of policy approaches which is needed if the value of ICTs in rural and low-income developing country communities, including but not exclusively telephony, is to be maximised. However, it is crucial to understand the limits of these and comparable data when interpreting findings. In particular:
1. All research data are to some degree country- and location-specific. There are large differences between the social, economic and political characteristics of the populations of developing countries, including the three countries in this research project. The impact of telephony on different societies varies as a result of these country- and location-specific factors. Findings concerning India (Gujarat) offer evidence about Gujarat, to a lesser extent about India, and provide indicators about likely circumstances in comparable countries, but they need to be interpreted against these country-specific factors. However, as a result of this national diversity, findings that are robust across the three research countries are much likelier to represent general rather than country-specific experience, and can be treated as having considerable significance. These cross-country findings are discussed in Part 3 of the main report.
2. While research locations within each country were chosen in order to
provide a reasonable cross-section of low-income communities, all selected locations had to have sufficient telecommunications access to provide sufficient data for analysis. The research, therefore, did not include rural areas which do not have telecommunications access or in which access is very limited. Equally, all interviewees came from rural areas, and the sample does not include population groups from major urban centres. The locations are not, therefore, representative of telephone access levels across the State of Gujarat or in India as a whole, and data concerning usage levels (as opposed to usage patterns or to the behaviour of those with and without telephony) cannot be generalised state- or country-wide. Usage levels are, of course, changing rapidly, and a snapshot picture of usage levels would rapidly become outdated.
132
3. Because the survey focused on livelihoods analysis, the results of field research are primarily household data, collected almost exclusively from adults and primarily from self-identified heads of households and their spouses. As the purpose of the research was to assess the behaviour of and impact of telephony on those who use telecommunications, it also focuses on population segments that do make use of telephony. The household basis of the survey and focus on self-identified household heads means that the sample under-represents women and has limited value for gender disaggregation. (There is, however, some discussion of the data from a gender perspective in Part 3 of the main report). It also includes fewer young adults than the general population. The focus on telephone users also means that the sample is on average wealthier than the general rural population. This further reinforces point 2 above that results on usage levels cannot necessarily be generalised to the population as a whole (a 20% level of ownership of fixed telephones in the sample would not imply an equivalent level of ownership in the population as a whole), but this does not affect the viability of analysis of behaviour by those in a position to make use of telephony.
4. The household basis of the survey also means that economic and
occupational categories within the survey are concerned with households rather than individuals. As accurate data for individual and household income in rural areas of developing countries are very difficult to establish, economic comparisons have been made between broad-brush economic categories (approximately quartile divisions) built around a multiple indicator index of relative prosperity, including, for example, asset ownership as well as declared income. This provides a more robust basis for economic comparisons. Occupational categorisation is also defined at a household level. Most rural households are dependent on income from a variety of occupations. The primary, secondary and tertiary occupations declared in the data are those of the household, not necessarily of the interviewee. A test for differences between results on an individual and household basis suggests that, in fact, these would not be significant, but the household occupational categorisation has been preferred as the research team believes it is more appropriate for this analysis. It should be noted that the Mozambican sample (and only that sample) includes a significant proportion of households with absent migrant workers.
5. The findings represent a snapshot of behaviour at a particular point in
time. Access to telephony and other ICTs is changing rapidly in the three research countries, particularly in rural locations, and a snapshot can give only limited information about trends in behavioural change. An understanding of trends in behavioural change is particularly important in assessing information and communications because of a) the rapid pace of

133
change in available media and b) the slower pace of behavioural change. Considerable attention has been paid to maximising understanding of behaviour and impact trends in this study through the use of questions about perceptions of change, but data on actual behavioural trends could only be obtained through a repeat survey of the same interviewees. Repeat surveys along these lines would be valuable.
In summary, therefore, the findings set out in this annex and in the main research report provide a considerably more substantial picture of how individuals behave, how livelihoods are affected and how low-income communities in the three research countries may be impacted by telephony (and, to a lesser extent, other ICTs) than is available in earlier research. The findings offer valuable indicators which may be relevant in other countries, and which merit serious consideration by policymakers. However, like all such data, they should be interpreted with caution. Nothing can substitute for country-specific research in developing countries, and the research team hopes that this project will encourage similar research to be undertaken in other countries. Findings which the research team considers robust across all three research countries – and therefore highly likely to be representative of behaviour in comparable developing countries - are set out in Part 3 of the main report. This annex report includes analysis of both frequencies and correlations within the survey data. Most of the illustrative tables and charts represent data frequencies, while, to conserve space, correlations are largely reported within the text. All frequency and correlation tables used in the analysis are available on application from DFID, the CTO and the research team (Gamos Ltd, ictDA and IIM(A)). Data sets compiled during the research are freely available for use by any individual researcher or research organisation. They provide rich information on many issues which go well beyond the initial remit of the research study. Further analysis of aspects of the data not included in this document or the main report will be undertaken and published by various members of the research team following presentation of this report to DFID. However, the research team for this study (ictDA, Gamos, IIM(A) and Professor Christopher Garforth) does not endorse the conclusions drawn in any publication or study that makes use of the project research data unless its endorsement is explicitly expressed in such a publication or study.
Section A: Research methodology and research locations The research methodology adopted for this study is described in Part 2 of the main research report.

134
In summary, a sample of some 750 adults was questioned, through field interviews, about their livelihoods, use of and attitudes towards telephony and other ICTs and other relevant issues, in each of three research countries (India (State of Gujarat), Mozambique and Tanzania). Questionnaires were drawn up following focus group discussions in research regions and, although broadly consistent across the research countries, included some national variations. In order to reduce distortions due to socio-economic circumstances in particular research locations, interviews were undertaken in three separate locations in each country/state, and respondents drawn from clusters resident at different distances from the centres of the three research locations (which were usually rural towns).
A.1 Telecommunications infrastructure and policy Telecommunications liberalisation in India has been complex, with several different regulatory frameworks adopted over the past ten years. The regulatory environment has recently been remodelled around unified licenses which give telecommunications operators the opportunity to provide fixed and mobile services without technological constraint. (A similar model is now being implemented in Tanzania.)
The National Telecom Policy approved in 1999 had the objective of achieving a rural teledensity of 4% by the year 2010, with reliable transmission in all rural areas. Rural tariffs for registrations, rentals and call charges were regulated and were below those in urban areas. This, together with subsequent reductions in rates, has led to greater ownership of fixed phones in rural areas. While the rate of growth of telecommunications services to rural areas has increased since 1999, it has grown far more slowly than in urban areas. As of September 2004, while the national fixed line teledensity was around 8. 68%, and urban teledensity was 23.3%, rural teledensity remained as low as 1.8%. The national government-owned telephone corporation, Bharat Sanchar Nigam Limited (BSNL) is the dominant fixed line service provider, with more than 90% market share nationally. It has been growing the number of direct exchange lines at 18-22% p.a. since 1994, increasing penetration beyond major cities and towns. The spread of the network has resulted in most places having close proximity (within 20-25km) to a fibre optic cable. Technically, this could enable linking of the sub-district (taluka) and remote locations with district headquarters and state capitals, including dial-up lines or wireless Internet access for data and applications. As a result of the opening of the mobile sector to private participation, by 2004 most states had four GSM, two CDMA, and two to three fixed line providers. In rural areas, however, private participation has been limited, with BSNL being often
135
the sole service provider. There is as yet limited mobile or wireless coverage in rural areas. The government of India had envisaged the provision of a public call office (public telephone) in all of the country’s nearly 600,000 villages by 2002. However, as of December 2004, nearly 60,000 villages remained unserved. On the recommendation of the regulatory authority, TRAI, a Universal Service Obligations Fund (USOF) was set up in April 2002, based on contributions from service providers. The USOF initially focused on funding the replacement of outdated village public phones, provision of a second phone in villages with a population above 2,000 and provision of rural private phones. While nearly 60% of old village public phones had been replaced by March 31, 2005, other deployments using the USOF had not yet been significant. While telecom policies are formulated and implemented at national level, a number of states have taken state-level initiatives to develop e-government applications aimed at reducing poverty and facilitating ICT access in remote locations. The government of Gujarat has not been as active in promoting the use of ICTs in development as some other state governments, such as that in Andhra Pradesh. However, it has set up a state-wide area network (SWAN), as a part of its state IT policy. The SWAN has linked the state capital with district and taluka headquarters for voice, data and videoconferencing applications. Besides supporting the ICT infrastructure, the Gujarat government has supported the use of ICTs in rural areas. For example, it has promoted a pilot scheme to provide non-networked government services through gram panchayats, the village tier of local government. In another pilot project initiative, the state government has partnered with private enterprises and civil society for wireless connectivity to villages – though this had not become operational in any significant way at the time of the survey undertaken for this study.
A. 2 Research locations The field research for the India case study was undertaken in Gujarat, a state in western India. Gujarat is a large state, including 5.96% of the total area of India and 4.93% of its population at the time of the most recent census (2001). It has a relatively high level of urbanisation (37.67% in comparison with 27.78% in India as a whole). The average village and town population at the 2001 census was 1,500 and 63,300 respectively, compared with 1,100 and 58,400 at the national level, indicating larger average village sizes in particular. In terms of rural and urban population densities, Gujarat has 142 and 2,773 persons per square kilometre, compared with average Indian values of 214 and 3,370 respectively. The rural per capita income in Gujarat in 2001 was Rs 14,574 which was nearly 48% above the national average.

136
Figure A.1: Map of India
Source: hulk.bu.edu/misc/India/places/indiamap.html
Gujarat’s literacy rate is 69%, which is 6.6% above the average for India as a whole, while the rural literacy rate is 44%, 18.8% above average. Rural teledensity in Gujarat as of 31st March, 2004 was 2.54%, 60% above the Indian national average of 1.58%. Its urban teledensity was 12.10% which was 10.5% above national average. The state as a whole is therefore more prosperous and less densely populated than India in general, and has higher levels of educational attainment. The fieldwork for the Gujarat survey was undertaken in a number of villages in three districts as defined in the 1991 census. The selection of these districts was based on their aggregate socio-economic profile. In particular, the survey aimed to cover both more and less prosperous districts. Within each district, the survey aimed to cover smaller and larger villages in equal proportion, Changes in census districts between 1991 and 2001 affect the tabular presentation but not the substance of this selection of locations. Two of the villages which were located in Mehsana district for the 1991 census were transferred into the newly formed district of Patan for that of 2001; and so data

137
for a small group of communities in one of the three research locations now fall within a fourth census district. The four districts from which interviewees were drawn were Banas Kantha, Kheda, Mehsana and Patan. The location of these districts is shown in Figure A.2. Focus group sessions within each research location were used to test and finalise the survey questionnaire and identify location-specific issues that might prove relevant to the results.
Figure A.2: Map of Gujarat State, showing research districts
Source: www.gmbports.org/gujportmap.htm According to the 2001 census, the four research districts have an average of 81% rural households, compared with a Gujarat state average of 61%. Banas Kantha has the highest rural percentage at 87.8%, while Mehsana has the lowest percentage at 77.5%. The research districts are therefore more rural than the state average. The rural literacy and work force profile of districts in relation to Gujarat as a whole is given in Table 1.A below. Banas Kantha has the lowest literacy rate of the four research locations, at 51.26%, and Mehsana the highest, at 75.5%. For Gujarat as a whole, the 2001 census found that the literacy rate is 69%, but only 44% in rural areas.
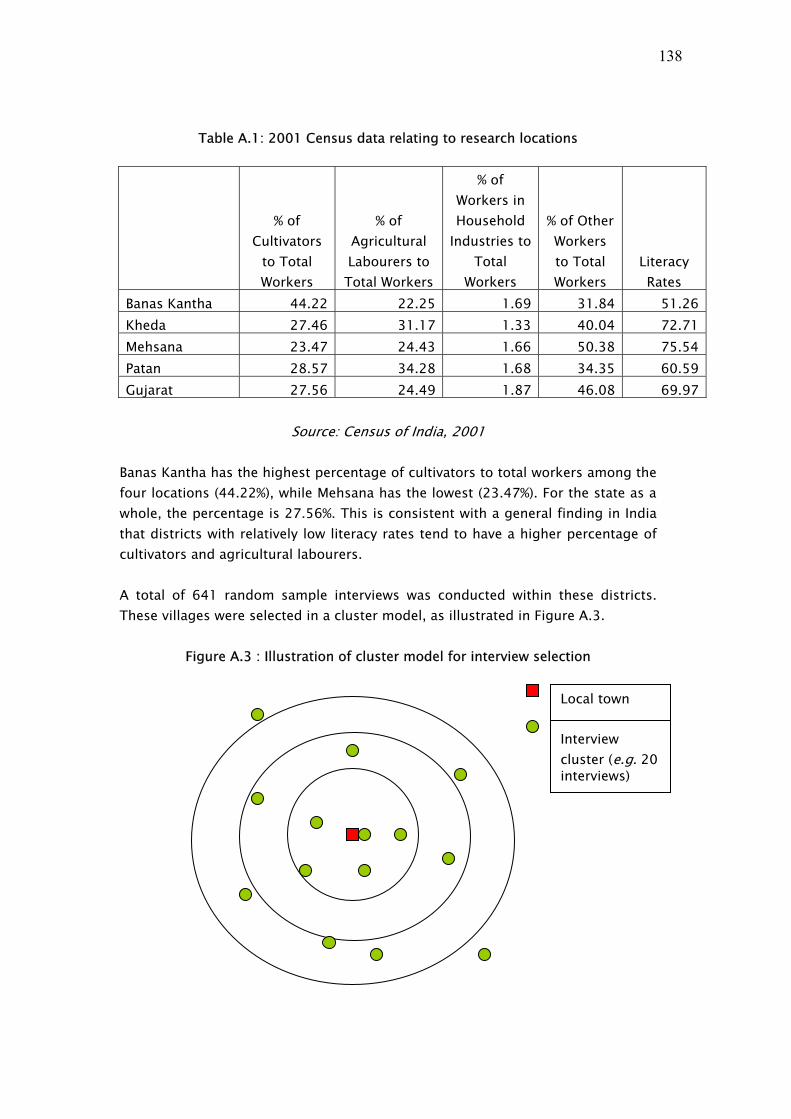
138
Table A.1: 2001 Census data relating to research locations
Source: Census of India, 2001
Banas Kantha has the highest percentage of cultivators to total workers among the four locations (44.22%), while Mehsana has the lowest (23.47%). For the state as a whole, the percentage is 27.56%. This is consistent with a general finding in India that districts with relatively low literacy rates tend to have a higher percentage of cultivators and agricultural labourers. A total of 641 random sample interviews was conducted within these districts. These villages were selected in a cluster model, as illustrated in Figure A.3.
Figure A.3 : Illustration of cluster model for interview selection
% of Cultivators
to Total Workers
% of Agricultural Labourers to Total Workers
% of Workers in Household
Industries to Total
Workers
% of Other Workers to Total Workers
Literacy Rates
Banas Kantha 44.22 22.25 1.69 31.84 51.26Kheda 27.46 31.17 1.33 40.04 72.71Mehsana 23.47 24.43 1.66 50.38 75.54Patan 28.57 34.28 1.68 34.35 60.59Gujarat 27.56 24.49 1.87 46.08 69.97
Interview cluster (e.g. 20 interviews)
Local town

139
Thirty villages were selected across the four districts for interviews. Of these thirty villages, fourteen had a population below 5000, fifteen had a population between 5,000 and 7,999 and one had a population between 8,000 and 12,000. In each village, 21 questionnaires were administered to heads of household or senior household members. This random sample was supplemented, for the Gujarat study, by a purposive sample of business people selected from the same research locations. A total of 104 additional interviews were conducted in this purposive sample, usually four per village. This sample was primarily intended to provide further data should there prove to be too few tradespeople within the random sample to allow for full statistical analysis. In practice, this did not prove necessary, and the majority of the analysis in the remainder of this report is based on the random sample. Relevant sample sources are included in headings to figures and tables in this report.
A.3 Telephone service coverage in research locations The main purpose of the study reported in this annex was to research the impact of telephony on livelihoods, rather than the distribution of telephony itself. As noted above, official teledensity data for rural Gujarat give a figure of 2.54 telephones per 100 inhabitants as of 31st March, 2004, compared with an Indian national average of 1.58% and with state urban teledensity in Gujarat of 12.10%. Research locations were therefore chosen from amongst those in which telephone service was available, and interviews were focused on individuals and households with some experience of telephony. (Telephone usage and experience rates are, of course, changing rapidly in Gujarat as in other developing countries.) This approach was necessary in order to ensure sufficient data for analysis of the behaviour and attitudes of telephone users, the key target group in the research. As a check on the availability of telephony, interviewees were asked about their perceptions of the availability, diversity and quality of telephone service coverage within the research locations. The responses of the random sample are reported in the following table:

140
Table A.2: Level of telephone service coverage: random sample
Frequency %age Low - fixed line 43 6.7 Medium - fixed line + 1 mobile service provider
126 19.7
High - fixed line plus 2 or more mobile service providers
469 73.5
Total
638 100.0
No interviewees therefore needed to travel significant distances – i.e. outside their own communities - to use a telephone, and very few had only one choice of telephone network provider.
A.4 Statistical analysis and significance This study aims to provide evidence of the behaviour of individual adults in rural areas of the research countries who currently make some use of ICTs, particularly telephony, in the course of their lives; and to assess evidence relating this usage to their livelihoods and livelihood strategies. The sample is appropriate and sufficient to indicate patterns and perceptions of behaviour, usage and impact which are relevant to this particular broad socio-economic group, i.e. individual adults in rural areas who have access to telephony (which constitutes a very large majority of those in the sample areas) and who make some use of telephony (which also constitutes a majority in sample areas). The sample is also appropriate and sufficient to indicate the likely future behaviour, usage by and impact on comparable groups of rural adults in areas which do not yet have telephone access, but where telephone access is likely to become available in the near future. As the sample was chosen in order to provide sufficient data for rural adults who currently use telephony, it should be emphasised, however, that the data must be interpreted with caution in respect of the state or national population as a whole. In particular:
1. As the survey included only rural environments, these findings cannot be generalised to urban populations or to national populations including substantial urban groups.

141
2. As the survey focused on those currently using telephony, data concerning usage levels, as opposed to usage patterns, cannot be generalised to any wider population group, and should not be used to imply any particular level of ICT use country- or region-wide. (The study’s purpose was to review the pattern and impact of ICT usage, not its level, and no checks were undertaken to compare usage levels within the sample with those of the population as a whole, either locally or nationally. For the same reason, usage levels of national samples differ significantly between research countries, and cross-country comparisons that might be affected by usage levels are not appropriate.) This caveat does not apply to interpretation of findings concerned with the behaviour and attitudes of users of telephony, the primary targets for research; merely to the level of their presence within comparable communities across the country.
It had been hoped, during the research design phase, that the study would generate sufficient data to assess Internet as well as telephony behaviour, usage and impact. In practice, levels of Internet usage among interviewees in the Gujarat sample, as in those in the other research countries, proved to be so low that no statistically significant analysis of that usage – beyond the low level of actual usage itself – is meaningful. The low level of Internet use within the sample is discussed further in section F of this annex and in the main report. In brief, it means that the analysis of findings contained in this document and the other country studies in this project is predominantly an analysis of telephony behaviour, usage and impact. A copy of the questionnaire used in the Gujarat study is attached as an appendix to the main report. It was a lengthy and detailed questionnaire, which produced a large, detailed and rich accumulation of data, only some of which can be reported here. This annex includes an account of key findings from the Gujarat research within the three-country study, many of which are presented in tabular and graphic form, and summarises findings from correlations and other statistical analysis undertaken as part of the research project. Members of the research team and other researchers are expected to publish further analysis on additional aspects of the findings in future publications. Internet users of this report should note that most of the charts contained in it need to be viewed (and, where appropriate, printed) in colour. The statistical analysis undertaken for the study used non-parametric statistical tests to look for the influence of various social groupings on behaviour. When looking at the influence of such social groupings, the analysis employed the Mann-Whitney U test to test for differences between two independent groups, and the Kruskal-Wallace H test to test for differences between three or more groups. Where such analysis is relevant to their presentation, tables in this paper present

142
the probability (p value) that differences between the groupings have occurred by chance. Generally, only differences with a probability of less than 0.05 have been taken to indicate a relationship, i.e. statistical significance is taken to be represented by p =<0.05. Similarly, when considering correlations between two variables, it has only been assumed that a valid relationship exists where the p value associated with a Spearman Rank Order Correlation Coefficient is less than 0.05, and the correlation coefficient itself is greater than 0.2. Unless otherwise indicated, percentage figures presented in data tables are valid percentage data, i.e. the percentage of respondents answering a particular question or relevant to the question asked, rather than percentages of the total sample. Numbers of actual respondents are given in these tables where appropriate.
Section B : The research sample This section summarises the research sample resulting from the selection process and methodology described above and in the main research report. Findings from samples of similar size and character in the other research countries are analysed in Annexes B (Mozambique) and C (Tanzania). The India research sample included a total of 745 interviewees, divided into two sample groups:
• a randomly selected sample of 641 individuals (referred to in the text below as the random sample),
• and a purposively selected sample of 104 business people, (referred to hereafter as the purposive sample).
Unless stated otherwise, tables in this annex indicate the number of actual respondents to particular questions and the valid percentage, i.e. the percentage of actual respondents to particular questions rather than the percentage of the total sample. (In table A.2 above, for example, they give percentages from the 638 respondents that answered the specific question concerned, rather than the 641 respondents in the total sample.) The purpose of interviewing two distinct samples was to assist in the analysis of business-oriented impacts and implications in the event that insufficient numbers of businesspeople were present in the random sample to allow for full analysis of their behaviour and attitudes. In the event, this did not prove to be a problem. The following analysis draws primarily on the random sample, and is supplemented with findings drawn from the purposive sample where appropriate. However, the majority of the comparative analysis for occupational groups which has been undertaken derives from within the random sample, not from the

143
purposive sample. Responses from these two samples have also not been combined for data analysis. Relevant sample sources are indicated in the headings for all charts and tables. Samples were drawn approximately equally from the three research locations.
Table A.3: Respondents by location: random and business samples
Sample Random Purposive
Total
Kheda 213 42 255 Mahesana 173 26 199 Banaskantha 213 28 241 Patan 42 8 50 Total 641 104 745
As noted earlier, the use of three research locations was intended to reduce the impact of variations in socio-economic circumstances within the State. No detailed analysis has therefore been undertaken of differences in findings between the three locations, and the need to adjust for variations in socio-economic circumstances before doing so means that this would have limited value and could not be undertaken for this report without disproportionate cost.
B.1 Demographic characteristics Interviews were conducted either with the adult self-identified as head of household (69.2%) or with the spouse of that person (30.8%). This resulted in a random sample that was 71.8% male, and 28.2% female. Only 3% of households sampled were headed by women. In the case of the purposive sample, 90% of interviewees were heads of household and the proportion of males to females was higher – 91% male to 9% female. The strategy of focusing interviews on heads of households resulted in a mean sample age of 36. (The mean age for male respondents was 37, that for female respondents 34.) These values are consistent with other studies that have gathered data on the age of household heads.
Table A.4a: Age of interviewees – random sample
Gender Age group
Male % Female %
28< 111 24.2 55 30.4 29 to 35 126 27.5 60 33.1

144
36 to 42 89 19.4 35 19.3 >43 133 29.0 31 17.1 Totals 459 181
Table A.4b : Age of interviewees – purposive sample
Gender Age group Male % Female % 28< 26 27.4 4 44.4 29 to 35 29 30.5 4 44.4 36 to 42 19 20.0 1 11.1 >43 21 22.1 0 0.0 Total 95 9
The majority of the random sample (55.3%) was educated to senior secondary school level or above.
Table A.5 : Educational attainment level of interviewees – random and business
samples
Random Sample Purposive Sample
Level of education Freq. Percent Freq. Percent
No formal schooling 60 9.4 3 2.9
Primary school (classes 1-4) 75 11.7 7 6.7
Lower secondary (classes 5-8) 151 23.6 24 23.1
Senior Secondary school (classes 9-12)
269 42.0 53 51.0
Post secondary e.g. diploma, degree
85 13.3 17 16.3
Total 640 100.0 104 100.0
Men were significantly more likely to have achieved higher educational status than women. Men who had not received a formal education were also much more likely to be literate (61% as against 29% of women in this category). Educational attainment in the business sample was higher, but this may largely reflect the higher proportion of men in this sample.
B.2 Household characteristics and prosperity
145
The mean household size of the sample is 5.55 persons, with a mean of 3.65 adults and a mean of 1.90 children aged 18 or under. 20% of sampled households had no resident children. In spite of this age profile, however, the majority of household members (mean = 3.86) were dependent on the household rather than being net contributors. Approximately half of households indicated that 70% or more of their members were dependents. (The household dependency rate was higher in the purposive sample, with a mean of 4.23). These data are consistent with those for the age of household head, suggesting that young adults stay at home, even while working and in the early years of marriage, partly due to social norms and partly to financial difficulties. Only 44% of the random sample (30% of the purposive sample) claimed to have close family members living in other areas, and only 2% had close relatives living abroad. A relatively low level of geographical mobility is likely to have a dampening effect on demand for (at least long-distance and international) telecommunications. (These diaspora figures are much lower than those in the African surveys undertaken for this study, and suggest that the sampled communities may be more insular. However, a significant proportion of the family members living “in other areas” may be living in other parts of India, which would be comparable to Mozambicans or Tanzanians living in other countries within the East and Southern African region. It is not possible to assess this further with available data.) A number of indicators were used to establish levels of prosperity in interviewees’ households. These included direct questions concerning income and indirect questions concerning land tenure and ownership of a variety of assets (such as housing, land, access to water and electricity and mobile phones). Mean declared income in the random sample was Rs47,100 p.a. (approximately US$1020); median declared income Rs35,000 p.a. (approximately US$760) (N=617). Income statements in questionnaires and interviews can be unreliable, either because interviewees are reluctant to reveal information or because they do not record this systematically. In spite of this caveat, questions relating to prosperity indicators revealed close correlations between reported income, type of house, household possessions and means of transport owned. Quartile divisions of these four indicators were therefore used to develop a broad prosperity index of households. (A reliability test on this four item scale produced a Cronbach Alpha coefficient of 0.67, indicating that it is reliable.) Land tenure and livestock ownership did not correlate with other income/wealth indicators, and so were not included in this index.
Table A.6 : Prosperity index – random sample
Frequency Percentage
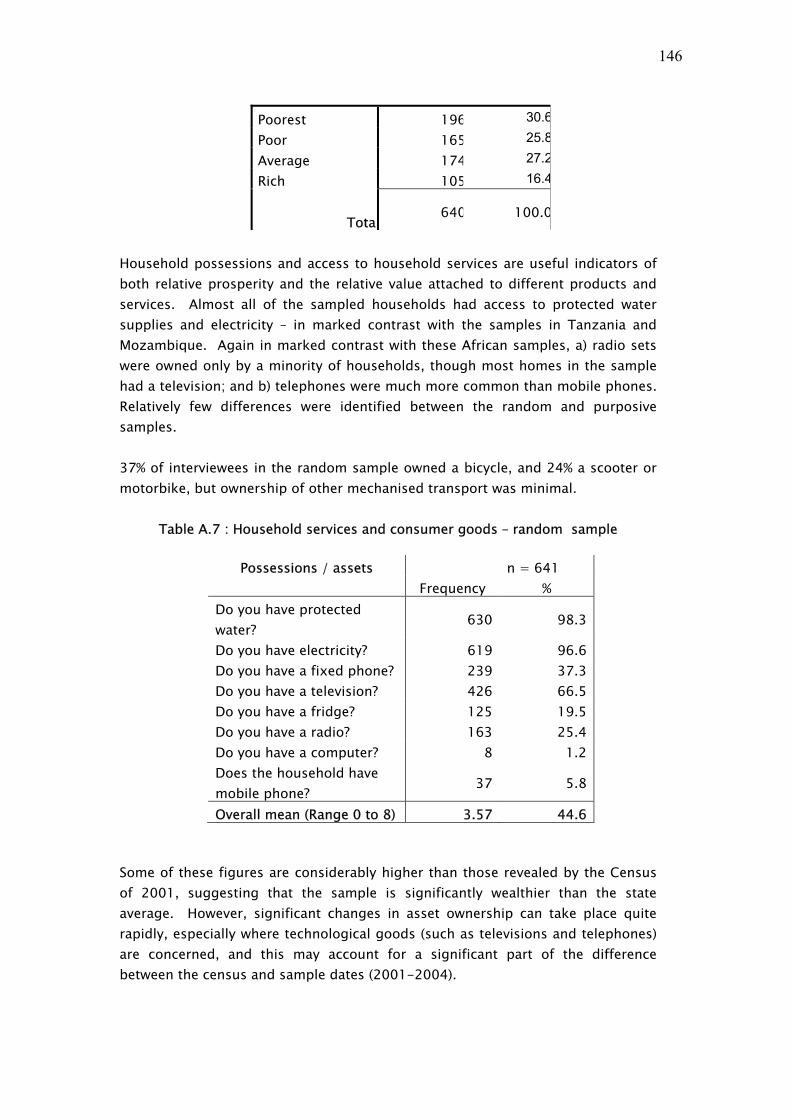
146
Poorest 196 30.6
Poor 165 25.8
Average 174 27.2
Rich 105 16.4
Tota640 100.0
Household possessions and access to household services are useful indicators of both relative prosperity and the relative value attached to different products and services. Almost all of the sampled households had access to protected water supplies and electricity – in marked contrast with the samples in Tanzania and Mozambique. Again in marked contrast with these African samples, a) radio sets were owned only by a minority of households, though most homes in the sample had a television; and b) telephones were much more common than mobile phones. Relatively few differences were identified between the random and purposive samples. 37% of interviewees in the random sample owned a bicycle, and 24% a scooter or motorbike, but ownership of other mechanised transport was minimal.
Table A.7 : Household services and consumer goods – random sample
Possessions / assets n = 641 Frequency %
Do you have protected water?
630 98.3
Do you have electricity? 619 96.6 Do you have a fixed phone? 239 37.3 Do you have a television? 426 66.5 Do you have a fridge? 125 19.5 Do you have a radio? 163 25.4 Do you have a computer? 8 1.2 Does the household have mobile phone?
37 5.8
Overall mean (Range 0 to 8) 3.57 44.6 Some of these figures are considerably higher than those revealed by the Census of 2001, suggesting that the sample is significantly wealthier than the state average. However, significant changes in asset ownership can take place quite rapidly, especially where technological goods (such as televisions and telephones) are concerned, and this may account for a significant part of the difference between the census and sample dates (2001-2004).
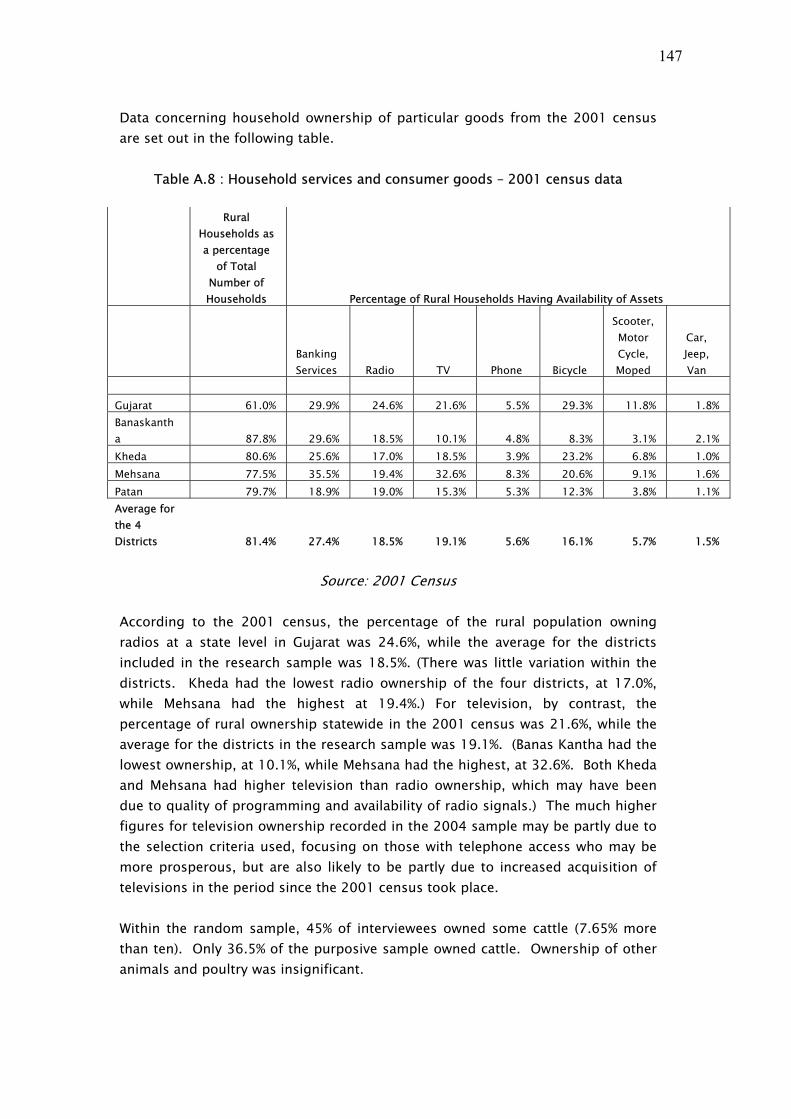
147
Data concerning household ownership of particular goods from the 2001 census are set out in the following table.
Table A.8 : Household services and consumer goods – 2001 census data
Rural Households as a percentage
of Total Number of Households Percentage of Rural Households Having Availability of Assets
Banking Services Radio TV Phone Bicycle
Scooter, Motor Cycle, Moped
Car, Jeep, Van
Gujarat 61.0% 29.9% 24.6% 21.6% 5.5% 29.3% 11.8% 1.8% Banaskantha 87.8% 29.6% 18.5% 10.1% 4.8% 8.3% 3.1% 2.1% Kheda 80.6% 25.6% 17.0% 18.5% 3.9% 23.2% 6.8% 1.0% Mehsana 77.5% 35.5% 19.4% 32.6% 8.3% 20.6% 9.1% 1.6% Patan 79.7% 18.9% 19.0% 15.3% 5.3% 12.3% 3.8% 1.1% Average for the 4 Districts 81.4% 27.4% 18.5% 19.1% 5.6% 16.1% 5.7% 1.5%
Source: 2001 Census
According to the 2001 census, the percentage of the rural population owning radios at a state level in Gujarat was 24.6%, while the average for the districts included in the research sample was 18.5%. (There was little variation within the districts. Kheda had the lowest radio ownership of the four districts, at 17.0%, while Mehsana had the highest at 19.4%.) For television, by contrast, the percentage of rural ownership statewide in the 2001 census was 21.6%, while the average for the districts in the research sample was 19.1%. (Banas Kantha had the lowest ownership, at 10.1%, while Mehsana had the highest, at 32.6%. Both Kheda and Mehsana had higher television than radio ownership, which may have been due to quality of programming and availability of radio signals.) The much higher figures for television ownership recorded in the 2004 sample may be partly due to the selection criteria used, focusing on those with telephone access who may be more prosperous, but are also likely to be partly due to increased acquisition of televisions in the period since the 2001 census took place. Within the random sample, 45% of interviewees owned some cattle (7.65% more than ten). Only 36.5% of the purposive sample owned cattle. Ownership of other animals and poultry was insignificant.

148
Only 4.8% of the random sample claimed to be receiving remittances from family members living elsewhere. Of the 31 households receiving remittances, just under half claimed to be highly dependent on these. The low level of remittances partly reflects the relatively low percentage of households with close relatives living outside the communities observed, especially overseas. Remittances are substantially more important in the African research communities.
B.3 Household occupation and sources of income Many households in rural areas of developing countries have several sources of income. Interviewees were asked to identify up to three significant sources of income for their households. 45% of the sample claimed to have two sources of income, and 11% cited three, with only 44% of households therefore claiming to be dependent on a single income source. (In assessing the following data, it should be remembered that these relate to household occupations and income sources, which are not necessarily the primary occupations and income sources of the individual respondent.) The largest group within the sample (40.7%) cited farming as their main source of household income, with a further 30.4% citing it as a secondary or tertiary income source. Just under a quarter (24.2%) cited (unskilled) labouring as their principal household income source, with business activity and craft production making up most of the remaining primary income generation activities.

149
Table A.9 : Sources of income – random sample
Occupations Main 2nd 3rd %ages of total sample % % %
Farmer 40.7 23.2 7.2 Labourer (unskilled) 24.2 10.9 1.7 Business 14.7 5.8 1.2 Skilled craftsmen 8.3 2.5 1.1 Teacher 2.5 0.9 0.2 Pensioner 2.2 0.5 Government service 2 0.8 Trader 1.7 0.2 Professional 0.6 0.5 Total (of whole sample) 96.9 45.2 11.4
There is a significant range of economic status – as assessed by the prosperity index described above - within these categories, particularly amongst farming households. However, professional households generally have the highest and unskilled labouring households the lowest degree of economic security. For correlation purposes, the range of household occupations was therefore simplified according to the following model. Table A.10 : Simplified household occupational categories – random and purposive
samples
Random sample Purposive sample Frequency %age Frequency %age
Unskilled labour 155 25.0 9 8.8 Skilled craftsman 53 8.5 6 5.9 Farmers 261 42.0 28 27.5 Business 105 16.9 55 53.9 Professional 47 7.6 4 3.9
Total 621 100.0 102 100.0
B.4 Perceptions of livelihood context Interviewees were asked a series of questions designed to indicate their perception of trends in overall livelihoods contexts, i.e. the social and economic environment for them and their families, over the previous two years. Each of these questions sought responses on a five-point scale, in which the response “-2” indicates that the situation is much worse than it had been two years previously, the response “0” that there has been no perceived change, and the response “+2” that the situation is much better.

150
Results from these questions indicated that interviewees feel that the overall circumstances of their lives have improved significantly during the previous two years, with all ten indicators showing significant positive returns. Mean outcomes are reported in the following table.
Table A.11 : Change in contextual issues over past two years – random and purposive samples
Contextual issues
Random sample n = 641; Business sample = 104 Random sample
Purposive sample
Range : (1 = much worse to 5 much better) Access to telecommunications changed (j) +1.35 +1.44Education opportunities for your children (b) +0.84 +0.91Relationships with your friends (h) +0.83 +0.99Your own level of knowledge and education (c) +0.81 +0.88Relationships with family members (g) +0.81 +0.95General security in your neighbourhood (d) +0.56 +0.65The health of your family members (a) +0.49 +0.55Your household income (e) +0.24 +0.27Support from family members living elsewhere (f) +0.15 +0.16Quality of government services (i) +0.01 -0.10Mean of all issues +0.57 +0.63Cronbach Alpha coefficient of scale reliability 0.704 0.697
There was no significant difference between the random and purposive samples in this context. Users of mobile and fixed telephones were more satisfied with improvements in access to telecommunications than users of kiosks (unsurprisingly reflecting their own acquisition of private access), and improvements in telephone access were cited more by men than women and by those with higher levels of educational attainment. One frequently-cited characteristic of increased availability of telephony is its capacity to reduce the requirement for travel in rural areas. Interviewees were also asked about changes in their need to travel during the previous two years.
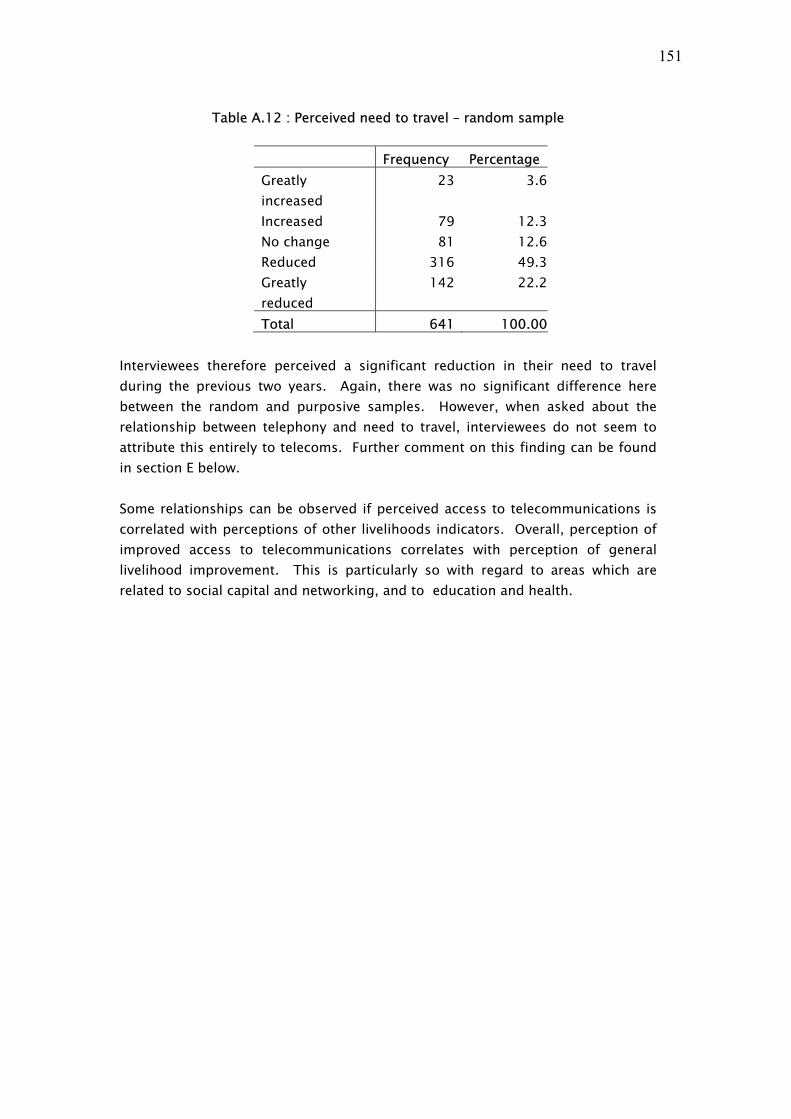
151
Table A.12 : Perceived need to travel – random sample
Frequency PercentageGreatly increased
23 3.6
Increased 79 12.3No change 81 12.6Reduced 316 49.3Greatly reduced
142 22.2
Total 641 100.00 Interviewees therefore perceived a significant reduction in their need to travel during the previous two years. Again, there was no significant difference here between the random and purposive samples. However, when asked about the relationship between telephony and need to travel, interviewees do not seem to attribute this entirely to telecoms. Further comment on this finding can be found in section E below. Some relationships can be observed if perceived access to telecommunications is correlated with perceptions of other livelihoods indicators. Overall, perception of improved access to telecommunications correlates with perception of general livelihood improvement. This is particularly so with regard to areas which are related to social capital and networking, and to education and health.

152
Table A.13 : Correlations between perceived change in access to telecommunications and perceived change in other contextual issues – random
sample
Livelihood indicators
N =641 Significance
Relationships with your friends (h) .456(**) Relationships with family members (g) .431(**) Your own level of knowledge and education (c) .401(**) Education opportunities for your children (0 if no children) (b) .311(**) The health of your family members (a) .291(**) The health of your family members (a) .291(**) Quality of government services (e.g. levels of corruption) (i) General security in your neighbourhood (d) Your household income (e) Support from family members living elsewhere (f) (Total) Livelihood issues improved .505(**) (SL) Financial (q21e + q21f)/2 (SL) Social (q21d + q21g + q21h + q21i)/4 .463(**) (SL) Human (q21a + q21b + q21c + q21j)/4 .354(**)
* Correlation is significant at the 0.05 level (2-tailed). ** Correlation is significant at the 0.01 level (2-tailed).
These correlations do not necessarily suggest any causal relationship. However, they indicate that the value of the telephone for social networking is consistent across all social groups, a finding confirmed by results reported in sections D and E. The relationship between perceived access to telecommunications and perceptions regarding education and health is less significant because, as shown in sections D and E, the telephone was little used or valued within the sample for obtaining access to information resources. There are, by contrast, no significant correlations between frequency of use and any of the livelihoods indicators included in these questions.

153
Section C: Ownership, access and use of means of communication This section of the annex summarises findings concerning the availability and use of telephony within the three research locations.
C.1 Use and frequency of use of ICTs It is important, first of all, to place the ownership and use of telephony within a context of other information and communication technologies.
• In contrast with the African communities assessed in this study, where broadcast radio is the most widely used information and communication technology, television is the most widely available ICT in the Gujarat sample, used by almost 85% of respondents within the past two years.
• The vast majority of interviewees made use of telephone kiosks, while
private fixed telephone lines had been used by a majority of interviewees in the previous two years. Mobile lines, however, had been used by just under a quarter of the sample at the time the survey was taken. The distribution of fixed and mobile use here is the reverse of that found in the two African samples. However, mobile use may be increasing rapidly as handsets become more widely dispersed within the community.
Table A.14 : Use of different ICTs within past two years – random sample
Ownership Use % %
TV 66.5 84.7 Phone kiosk 83.2 Private fixed line phone 37.3 56.7 Radio 25.4 35.5 Mobile phones 8.7 22.2 Short message service (SMS) 6.2 Fax 3.6 Email / internet 2.0 Personal computer 1.2 0.9
Respondents were also asked to indicate their frequency of use for these different ICTs, using a five point scale (1 = not used; 2 = less than once a month; 3 = more than once a month; 4 = once or more times each week; 5 = once or more times each day).

154
Table A.15 : Frequency of use of different ICTs – random and purposive samples
ICTs Random Sample
Purposive Sample
n 641 104 Range = 1 to 5 Mean Mean
TV 3.96 4.13 Phone kiosk 2.64 2.97 Private fixed line phone 2.54 2.68 Radio 1.85 2.02 Mobile phones 1.45 1.45 Short message service (SMS) 1.14 1.14 Fax 1.05 1.04 Email / internet 1.05 1.04 Personal computer 1.03 1.05 Telephone combined frequency of use (Kiosk + Mobile + Fixed) 2.21 2.36
These data can also be presented in graphical form.
Figure A.4 : Frequency of use of different ICTs – random sample
0% 10% 20% 30% 40% 50% 60% 70% 80% 90% 100%
TV
Phone kiosk
Private fixed line phone
Radio
Mobile phones
Short message service(SMS)
Fax
Email / internet
Personal computer
1 or more times per day1 or more times per week1 or more times per monthless than once a monthNot used

155
Figure A.4b : Frequency of use of different ICTs – business sample
0% 10% 20% 30% 40% 50% 60% 70% 80% 90% 100%
TV
Phone kiosk
Private fixed line phone
Radio
Mobile phones
SMS
Fax
Email/Internet
Personal computer
1 or more times per day1 or more times per week1 or more times per monthless than once a monthNot used
Within the sample, television ownership is significantly correlated with economic and educational status.
Table A.16 : Mean valuations of intensity of use of broadcasting according to
socio-economic criteria
Means (range 1 to 5)
Radio TV
Economic status Poorest 1.74 3.06 Poor 2.00 4.19 Average 1.80 4.33 Rich 1.92 4.68 Educational status No schooling 1.47 3.18 Primary school 1.60 3.29 Lower secondary 1.89 3.68 Senior Secondary 1.96 4.29 Post secondary 1.96 4.54
Once again, there is very close similarity in responses to these questions between the random and purposive samples – the only significant difference being slightly higher use of phone kiosks by the business users predominantly represented in
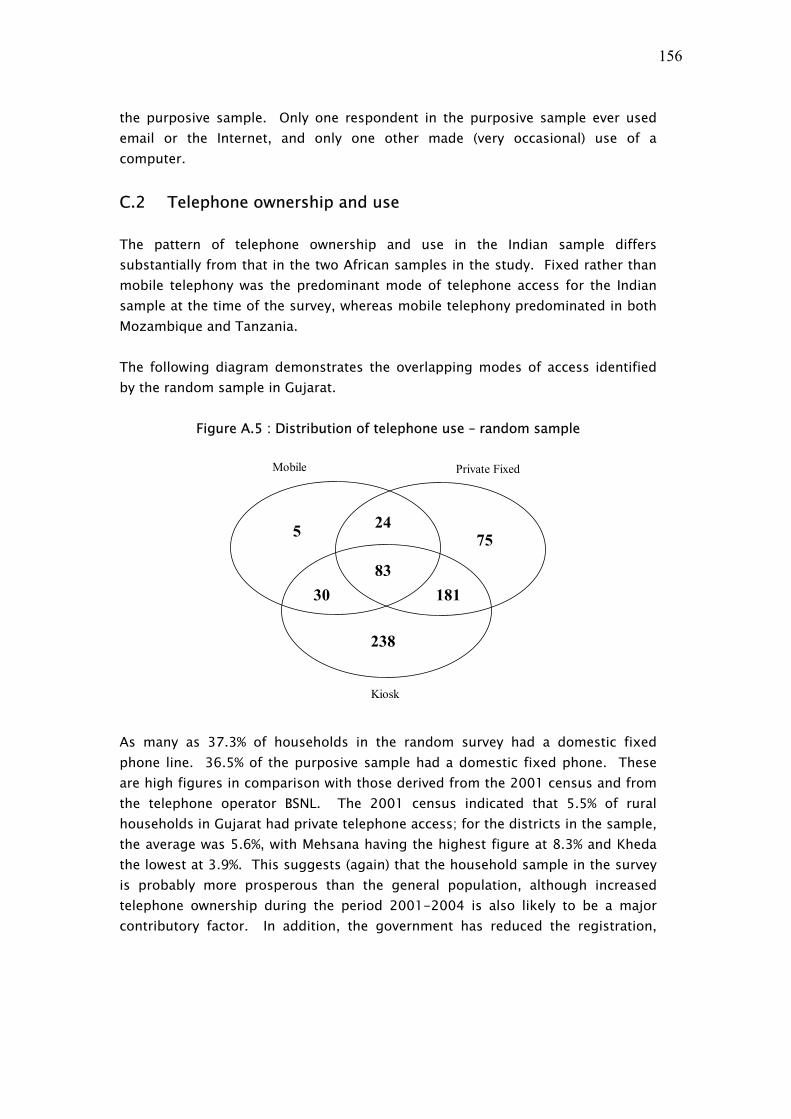
156
the purposive sample. Only one respondent in the purposive sample ever used email or the Internet, and only one other made (very occasional) use of a computer.
C.2 Telephone ownership and use The pattern of telephone ownership and use in the Indian sample differs substantially from that in the two African samples in the study. Fixed rather than mobile telephony was the predominant mode of telephone access for the Indian sample at the time of the survey, whereas mobile telephony predominated in both Mozambique and Tanzania. The following diagram demonstrates the overlapping modes of access identified by the random sample in Gujarat.
Figure A.5 : Distribution of telephone use – random sample
Mobile
Kiosk
Private Fixed
5
30
238
83181
7524
As many as 37.3% of households in the random survey had a domestic fixed phone line. 36.5% of the purposive sample had a domestic fixed phone. These are high figures in comparison with those derived from the 2001 census and from the telephone operator BSNL. The 2001 census indicated that 5.5% of rural households in Gujarat had private telephone access; for the districts in the sample, the average was 5.6%, with Mehsana having the highest figure at 8.3% and Kheda the lowest at 3.9%. This suggests (again) that the household sample in the survey is probably more prosperous than the general population, although increased telephone ownership during the period 2001-2004 is also likely to be a major contributory factor. In addition, the government has reduced the registration,

157
rental and call charges for fixed phones in rural areas during the past two years, which may have stimulated ownership.25 By contrast with fixed telephony, only 6.2% of respondents in the random sample (6.7% of the business sample) lived in households in which someone – in over half of households, the interviewee – owned a mobile phone at the time of the survey. No household in the samples had more than one mobile phone. Telephone ownership is clearly highly valued in itself. About 40% of those interviewed who did not currently have a phone expressed some degree of intention to acquire one within a year. While not all of these will, in practice, make such an acquisition within the year, this again indicates the importance of assessing behavioural trends in data analysis of telecommunications behaviour and impacts. (The figure was considerably lower in the purposive sample.) Table A.17 : Expressed intention to own a phone – random and business samples
Question: If you do not own a phone now, how likely are you to own one within the next
year?
Random sample Business sample
Frequency %age Frequency %age
Very unlikely 131 31.5 21 31.8Unlikely 74 17.8 16 24.2No opinion 44 10.6 11 16.7Likely 110 26.4 14 21.2Very likely 57 13.7 4 3.8Total 416 100.0 38 100.0
C.3 Frequency of use of telephony Access to telephone networks of some kind within the sampled areas is universal, though there is significant variation in the diversity of networks available (see section A above). Overall telephone use, according to the different types of telephony and telephone service available, is summarised in the following table.
25 The discrepancy is not a problem for data analysis since the objective of the survey is to establish the behaviour of telephone users and livelihoods impacts on them (and potential future telephone users), rather than the telephone ownership level of the population as a whole.

158
Table A.18 : Frequency of use of telephone services – random sample
one or more times
per day
one or more times per
week
one or more times per
month
less than
once a month not used
Phone kiosk 1.9 16.5 42.6 22.2 16.8Private fixed line phone 19.7 13.1 12.0 11.9 43.3Mobile phones 4.7 1.6 5.6 10.3 77.8Short message service (SMS) 1.1 1.4 1.9 1.9 93.8Fax 0.0 0.5 0.6 2.5 96.4Email / internet 0.5 0.5 0.5 0.6 98.0
These data, and comparable data for the purposive sample, are presented graphically in Figures A.4a and A.4b above.
As can be seen from these charts and data, phone kiosks are used occasionally by the vast majority of the respondent population, but private lines are the mode of telephony of choice for those that can afford them – a substantial proportion of whom make quite intensive use of telephony. Nevertheless, private fixed line owners do make significant use of kiosks as well as their private lines. (Private fixed lines are, of course, only available at home and so immediate phone use when away from home is likely to require a kiosk.) Mobile lines are much less widely used, and were not at the time of the survey nearly as commonly available as fixed lines (in contrast with most countries worldwide and in particular with the African research countries). SMS services (text messaging) were barely used at all, and the use of fax, email and Internet was insignificant. It is possible to combine the usage data from the three types of telephone access included in the above table (phone kiosk, private fixed phone and mobile phone) into a composite index, and to compare this measure across socio-economic categories. This shows that telephones are most used by those with post-secondary education, the most wealthy and by business people; least often by those without formal education, primary school leavers and unskilled labourers. (A recent report by the Indian Institute of Management (Ahmedabad) found that rural literacy is the major determinant of demand for rural telecoms.26) Different results can be identified for different modes of access. In the following paragraphs, a mean of 2.00 indicates an average frequency of use of less than once per month.
26 Rekha Jain and G. Raghuram, Accelerated Provision of Telecoms Services.
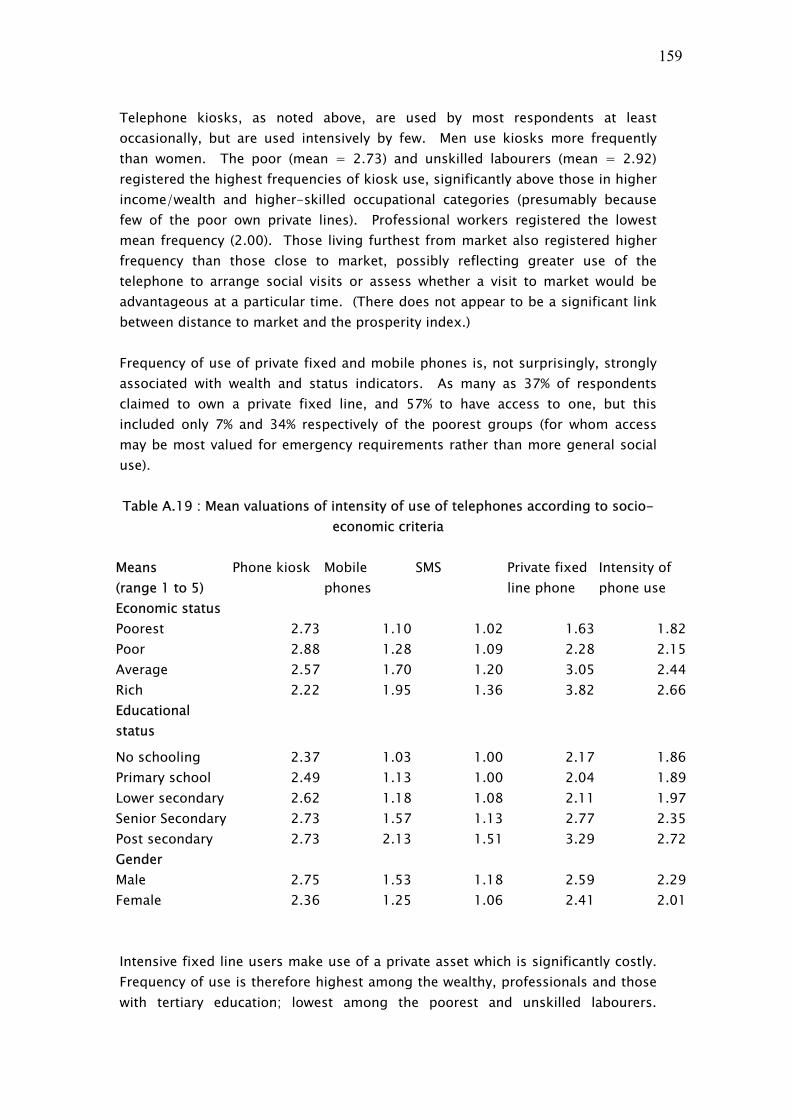
159
Telephone kiosks, as noted above, are used by most respondents at least occasionally, but are used intensively by few. Men use kiosks more frequently than women. The poor (mean = 2.73) and unskilled labourers (mean = 2.92) registered the highest frequencies of kiosk use, significantly above those in higher income/wealth and higher-skilled occupational categories (presumably because few of the poor own private lines). Professional workers registered the lowest mean frequency (2.00). Those living furthest from market also registered higher frequency than those close to market, possibly reflecting greater use of the telephone to arrange social visits or assess whether a visit to market would be advantageous at a particular time. (There does not appear to be a significant link between distance to market and the prosperity index.) Frequency of use of private fixed and mobile phones is, not surprisingly, strongly associated with wealth and status indicators. As many as 37% of respondents claimed to own a private fixed line, and 57% to have access to one, but this included only 7% and 34% respectively of the poorest groups (for whom access may be most valued for emergency requirements rather than more general social use). Table A.19 : Mean valuations of intensity of use of telephones according to socio-
economic criteria Means (range 1 to 5)
Phone kiosk Mobile phones
SMS Private fixed line phone
Intensity of phone use
Economic status Poorest 2.73 1.10 1.02 1.63 1.82Poor 2.88 1.28 1.09 2.28 2.15Average 2.57 1.70 1.20 3.05 2.44Rich 2.22 1.95 1.36 3.82 2.66Educational status
No schooling 2.37 1.03 1.00 2.17 1.86Primary school 2.49 1.13 1.00 2.04 1.89Lower secondary 2.62 1.18 1.08 2.11 1.97Senior Secondary 2.73 1.57 1.13 2.77 2.35Post secondary 2.73 2.13 1.51 3.29 2.72Gender Male 2.75 1.53 1.18 2.59 2.29Female 2.36 1.25 1.06 2.41 2.01 Intensive fixed line users make use of a private asset which is significantly costly. Frequency of use is therefore highest among the wealthy, professionals and those with tertiary education; lowest among the poorest and unskilled labourers.

160
Frequency of use also increases with age, the highest figure being for the over 40s. Mobile telephone use is relatively recent, and at the time of the survey mobile telephony was a minority mode of access (in contrast with the Mozambique and Tanzania samples in the study). Only 22% of those interviewed in Gujarat used a mobile phone, with only 6% of households owning one. However, 60% of handsets had been acquired within the past year, indicating rapid growth in ownership and use. Men used mobile phones more frequently than women (mean = 1.53 cf. 1.25), and the young more than the old (mean = 1.60 and 1.27 for the youngest and oldest age groups). Those with highest levels of prosperity (mean = 1.95) and educational attainment (mean = 2.13) had the highest levels of use, and those without formal education the lowest (mean = 1.03). Very few users made use of the cheaper forms of mobile telephone use such as paging/callback (8%) and SMS (texting) (5%). Use of different modes of access at the time of the survey can be summarised as follows:
• Telephone kiosks provide an important service to the less advantaged, who have less access to alternative modes of telephony. They are also significantly used by private line owners when they are not at home.
• Private fixed lines are the preferred mode of access for the more advantaged, but are not an important mode of access for the poor;
• Mobile phones are not yet a leading mode of access, but are significant for business use, and are becoming more available very quickly.
It should also be noted that the household basis of the surveys may mask some higher or differential levels of mobile telephone use among the young. Surveyed households contained a relatively high number of dependent adults, and these may prefer to use mobile phones than to make use of less private domestic fixed phones. However, the number of available mobile phones is low and this issue requires further research.
C.4 Expenditure on telephony Finally, in this section of the questionnaire, interviewees were asked to report their average monthly expenditure on telephone use. Figures for the different modes of access are as follows (US$=Rs46). (Separate figures are unfortunately not available for private fixed and kiosk access.)

161
Table A.20 : Reported expenditure on phones
Question: How much do you spend on phone use per month?
Mobile telephone fixed line (private
and public) TOTAL
N Rs/mth N Rs/mth N Rs/mth Random sample
143 160 635 150 637 190
Purposive sample
22 250 104 215 104 270
As noted earlier, data for declared household income need to be treated with some caution. Table A.21 below divides the population into the four prosperity categories described above (according to four prosperity indicators, only one of which is based on declared income), and indicates the percentage of declared income which each category spends on telecommunications. While the actual figures given for percentage expenditure should be treated with significant caution, therefore, the division into prosperity categories – and the pattern of differences between them – is more robust.
Table A.21 : Proportion of declared household income spent on telephones
Prosperity index
category
N Declared income
Telecoms expenditure
%age of income
spent on telephony
Rs/year Rs/month Poorest 196 23400 110 5.6 Poor 165 34500 150 5.2 Medium 174 52400 230 5.3 Rich 105 91600 330 4.3 Total 640 45400 190 5.0
(The proportion of household income apparently spent on phone use is slightly higher in the purposive sample, at 6.7%.) These figures suggest that the poorest sections of the sample spent a higher proportion of their income on telephone costs than the most prosperous – though this finding was not so marked in Gujarat as in the African samples. The implications of this for household expenditure as a whole, however, require some sophisticated analysis. Expenditure on telephone costs includes both:
162
• expenditure which substitutes for other expenditure (e.g. on transport or postal services), which may reduce total household expenditure; and
• additional expenditure which would not occur if telephones were not available, which may increase total household expenditure.
It is likely that poorer households tend to use the telephone more for substitution and for high priority uses such as emergencies (for which other communication channels are less highly suited), whereas those with higher economic status are more likely to incur additional expenditure, for example through casual (rather than priority) social calling. Further research is needed in this area.
Section D: Information and communication flows ICTs, including telephony, are facilitating technologies which enable individuals and communities to interact more or less effectively with one another. Any new technology that is introduced – such as television, voice telephony or the Internet – enters into an established pattern of information and communication flows. While it may adapt to or disrupt these flows, its impact will be closely related to them, and an understanding of established information and communication flows is critical to assessing the impact and implications of new ICTs as they are deployed. This section of the annex looks at the most important communication issues and channels reported by interviewees through their questionnaire responses.
D.1 Importance of information/communication types and preferred information/communication channels
An extensive series of questions was asked during interviews to establish the priority information needs of interviewees and the channels used by them to satisfy those needs. These questions provide baseline evidence for an assessment of the impact which telephony is having or may have on information and communication flows and thereby on access to livelihoods assets. Each interviewee was asked a series of questions concerning the importance to her/him of six different types of information and communication. These questions sought responses on a five-point scale, in which the response “-2” indicates that an information type is “unimportant”, the response “0” indicates “no opinion” or “not applicable”, and the response “+2” indicates that it is “very important”. Responses to these questions are reported in the following table. (The format for questions in this area differed significantly from that used in the two African samples, in which questioning was more detailed. The implications of this are considered in the main research report.)

163
Table A.22 : Importance of types of information/communication – random and purposive samples
Question:
How important are the following types of information for you in general?
(Range -2 to +2) Random sample
Business sample
Emergencies +1.40 +1.61 Social information +1.19 +1.43 News (local and international) +0.92 +1.14 Education +0.84 +0.84 Farming and business information +0.55 +1.07 Weather information +0.54 +0.69 Government/political information +0.16 +0.47
These data can also be presented graphically.
Figure A.6a: Importance of types of information/communication – random sample
Question: How important are the following types of information for you in general?
0% 20% 40% 60% 80% 100%
Emergencies
Social information
News (local andinternational)
Education
Farming and businessinformation
Weather information
Government/politicalinformation
Very importantImportantNo opinionNot very importantUnimportantNot applicable

164
Figure A.6b : Importance of types of information/communication – purposive sample
Question: How important are the following types of information for you in general?
0% 10% 20% 30% 40% 50% 60% 70% 80% 90% 100%
Emergencies
Social information
News (local andinternational)
Education
Farming and businessinformation
Weather information
Government/politicalinformation
Very importantImportantNo opinionNot very importantUnimportantNot applicable
It is noteworthy that the rank order of issues is identical for the random and purposive samples, but that the business users in the purposive sample tend to attach greater importance to information than the broader population within the random sample. (This finding is statistically significant for emergencies, social, news, farming and political information). As in the other research countries, emergencies stand out as substantially the most important issues of information and communication need. Insofar as farming and business information is concerned, there are significant differences in the evaluation of importance according to age, gender, education and economic status as well as household occupation, though these probably largely reflect the relative proportions of the population in different household occupation categories. The highest importance registered for farming and business information was, not surprisingly, among farming households (mean = +0.93) and the most wealthy economic category (mean = +0.89); while such information was least important for those with no formal schooling (mean = -2.0), unskilled labourering households (mean = -0.06) and women (mean = -0.04). Interviewees were also asked to identify the primary means of communication which they use or would use for each type of information or communication need.

165
Table A.23a : Most commonly used means of accessing different types of information/communication - random sample
Question: Which means do you most commonly use to access or share each type of
information?
Face to face
Phone Radio TV Importance
% % % % Mean (-2 to +2)
Business 57.1 10.0 0.0 2.3 +0.55 Social 23.2 70.5 0.2 0.6 +1.19 Emergency 10.5 85.2 0.3 1.2 +1.40 Political 29.2 4.8 0.5 6.4 +0.16 Education 66.0 4.4 0.3 4.8 +0.84 Weather 14.2 0.9 2.7 30.0 +0.54 News 7.8 1.9 2.5 37.3 +0.92
Table A.23b : Most commonly used means of accessing the different types of information/communication - purposive sample
Face to
face Phone Radio TV Importance
% % % % Mean (-2 to +2)
Business 58.7 15.4 0.0 5.8 +1.07 Social 21.2 76.9 0.0 0.0 +1.43 Emergency 11.5 85.6 0.0 1.0 +1.61 Political 39.4 4.8 0.0 8.7 +0.47 Education 55.8 6.7 0.0 2.9 +0.84 Weather 3.8 1.0 0.0 31.7 +0.69 News 2.9 1.0 2.9 34.6 +1.14
These data can also be presented in graphical form.
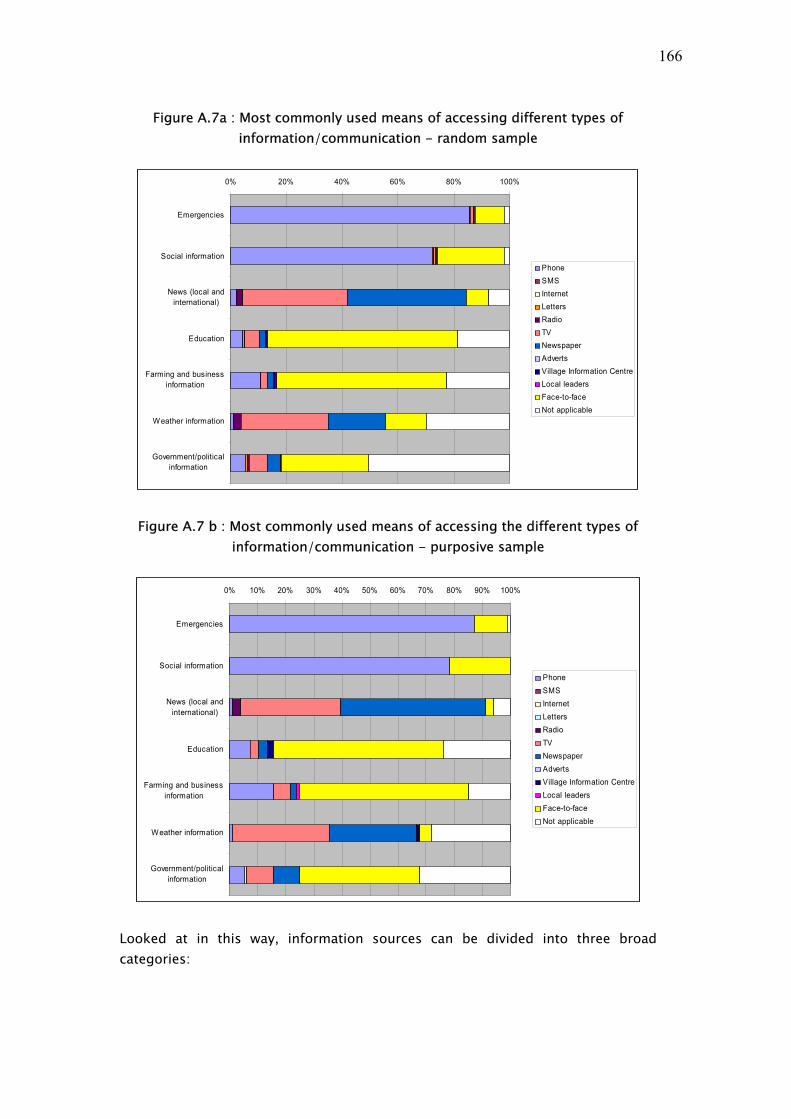
166
Figure A.7a : Most commonly used means of accessing different types of information/communication - random sample
0% 20% 40% 60% 80% 100%
Emergencies
Social information
News (local andinternational)
Education
Farming and businessinformation
Weather information
Government/politicalinformation
PhoneSMSInternetLettersRadioTVNewspaperAdvertsVillage Information CentreLocal leadersFace-to-faceNot applicable
Figure A.7 b : Most commonly used means of accessing the different types of information/communication - purposive sample
0% 10% 20% 30% 40% 50% 60% 70% 80% 90% 100%
Emergencies
Social information
News (local andinternational)
Education
Farming and businessinformation
Weather information
Government/politicalinformation
PhoneSMSInternetLettersRadioTVNewspaperAdvertsVillage Information CentreLocal leadersFace-to-faceNot applicable
Looked at in this way, information sources can be divided into three broad categories:

167
• The telephone is by far the most important information channel for emergencies and social information/communications, and is used for the very large majority of such communication needs. This contrasts with its relative unimportance in other areas of information flow.
• Broadcast and print media are the most important information channels for general information such as local and international news and weather.
• Face-to-face communications is by far the most important information channel for information concerning education and, critically, farming and business information.
The overall values attached to different modes of communication can be most effectively judged through a weighted distribution of their importance, i.e. by weighting the importance of information channels according to the importance of the different information types for which they are used. The outcome of this analysis is shown in the following figure.
Figure 2.8 : Weighted importance of means of communication – India sample
-0.5 0 0.5 1 1.5 2 2.5 3
ADVERTS
INTERNET
LETTERS
SMS
LEADERS
VILLAGE INFO CENTRE
RADIO
NEWSPAPERS
TV
FACE TO FACE
PHONE
weighted index
These findings differ somewhat from those in the other research countries, in that the telephone registers the highest weighted importance for the Indian sample, whereas in the two African samples it comes third, after face-to-face communications (overwhelmingly the most important) and radio. Taken together with the earlier results, they imply that the telephone is valued most for high priority and social/family interactions, but that it has not yet supplanted face-to-face communications in business activity, where the nuances of body language are more important, where interactions may be with people who are less trusted and where established patterns of business behaviour may be entrenched. However, it is likely that its relative importance for business use is continuing to increase. General media sources – newspapers and broadcasting – are highly valued for general information needs, in meeting which the telephone plays almost no part at present.

168
The significance of television in this context is worth emphasising. The importance of broadcast radio in disseminating information in many developing countries is well known, and is reflected in the findings of the Mozambique and Tanzania samples for this study. In the Gujarat sample, however, radio was relatively unimportant; indeed, as noted in section B above, many interviewees did not own or have access to a radio. This reflects the very high level of television ownership in the Gujarat sample. While relative affluence may be one factor leading to this finding, another may be a lack of local radio stations offering specifically local information which differs from that available on television. This issue requires further research.
D.2 Change in use of information/communication channels Interviewees were also asked to identify changes in their patterns of consultation/use of a number of information channels during the previous two years, using a five point scale ranging from “-2” = “much less”, through “0” = “no change, not applicable”. to “+2” = “much more use”. Mean figures for these results are shown in the following table. Table A.24 : Change in frequency of consultation of information sources – random
and purposive samples
Sources of information consulted Random Sample
Purposive Sample
N 641 104 Range of frequency means (1 to 6) Mean Mean Consult TV changed? +0.09 +0.13 Consult newspapers changed? +0.08 +0.14 Consulted traders? -0.10 -0.09 Frequency consulted with Government services -0.11 -0.12 Consulted (NGOs)? -0.11 -0.13 Consulted radio changed? -0.24 -0.48
Once again, there is no significant difference between the random and purposive samples, apart from a very slight difference where radio is concerned. Most information/communication channels show a decline in consultation, with the exception of television and newspapers, which show a modest increase. Radio shows the most significant decline in consultation. There were slight increases in the use of television among the youngest, most educated and wealthiest age groups and among those that placed most value on information overall. All but the young among these groups also showed a slight increase in consultation of

169
newspapers. Within the purposive sample, there is also a positive correlation between higher use of television and the frequency of telephone use, suggesting that educational and economic status are important determinants of both. Increases in rural literacy and the growth of regional newspaper publishing may well be other drivers.
Section E: Telephony and livelihoods This section of the annex summarises evidence of the impact which telephony has on livelihoods, particularly on vulnerability and on three of the five key livelihoods assets – financial, social and human capital (in this context, primarily income and savings, social networking and the acquisition of information and knowledge).
E.1 Correlations between perceptions of telecoms access and other contextual issues
The impact of improving access to telecommunications services on livelihoods has been tested using the correlations presented in Section B.4 above. This indicates that overall, perceived improvement in access to telecommunications correlates with perceived improvements in general livelihoods. It should be noted, however, that this does not suggest a causal link. It suggests merely that those who perceive improved access to telecommunications also perceive other improvements in their livelihoods, most likely because increased personal prosperity affects all such perceptions. When looking at social groupings within the sample as a whole, it can be seen that there is a widespread link between perceptions of improved access to telecommunications and perceptions of improvement in social capital. As has been shown in section D, the telephone is substantially used as a primary resource for social information/communication, and this finding corroborates the impression that telephony contributes significantly in this area. The relationship between perceptions of improved access to telecommunications and perceptions of improvements in indicators of human capital is also consistent across socio-economic groupings. However, the limited use of telephony for enhancing human capital identified in section D, and the negative attitude towards the value of telephony in this area reported below, suggest that this finding is either not significant or due to a third factor, such as relative prosperity. There are no significant correlations between perceptions of improved access to telecommunications and perceptions of change in household financial conditions in the data reported in section B.4. There are two exceptions to this: perception of improved access to telecommunications does correlate with perception of improved household income amongst the wealthiest group (those best able to put
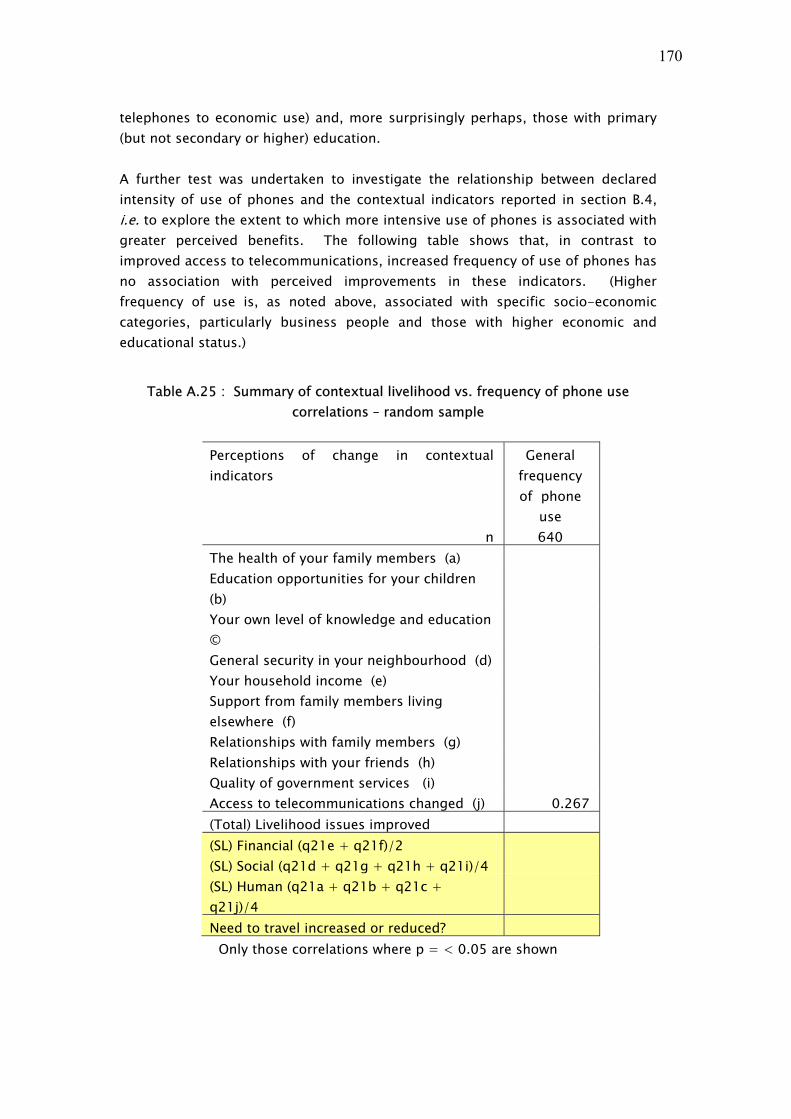
170
telephones to economic use) and, more surprisingly perhaps, those with primary (but not secondary or higher) education. A further test was undertaken to investigate the relationship between declared intensity of use of phones and the contextual indicators reported in section B.4, i.e. to explore the extent to which more intensive use of phones is associated with greater perceived benefits. The following table shows that, in contrast to improved access to telecommunications, increased frequency of use of phones has no association with perceived improvements in these indicators. (Higher frequency of use is, as noted above, associated with specific socio-economic categories, particularly business people and those with higher economic and educational status.)
Table A.25 : Summary of contextual livelihood vs. frequency of phone use correlations – random sample
Perceptions of change in contextual indicators
General frequency of phone
use n 640
The health of your family members (a) Education opportunities for your children (b) Your own level of knowledge and education © General security in your neighbourhood (d) Your household income (e) Support from family members living elsewhere (f) Relationships with family members (g) Relationships with your friends (h) Quality of government services (i) Access to telecommunications changed (j) 0.267 (Total) Livelihood issues improved (SL) Financial (q21e + q21f)/2 (SL) Social (q21d + q21g + q21h + q21i)/4 (SL) Human (q21a + q21b + q21c + q21j)/4 Need to travel increased or reduced?
Only those correlations where p = < 0.05 are shown

171
By comparing the socio-economic groupings where significant correlations are evident, the following table demonstrates that perception of improved access to telephony has a stronger relationship with household livelihoods than greater frequency of use of phones, particularly with regard to social and human capital. (It should be noted, again, that the valuation of telephony in relation to social capital is found in other data to be high; that in relation to human capital to be very low).
Table A.26 : Correlation of improved access to telecommunications vs. summary livelihood indicators by descriptive categories - random sample
Perception of improved Access General Frequency of use Descriptive Categories n Financial
Corr. Coef.
Social Corr. Coef.
Human Corr. Coef.
Financial Corr. Coef.
Social Corr. Coef.
Human Corr. Coef.
Coverage Low 43 0.539*** 0.55*** 0.321*
Medium 12
6 0.474*** 0.476*** 0.315***
High 46
9 0.452*** 0.311*** Age Youngest 16
6 0.419*** 0.354*** Young 18
6 0.522*** 0.397*** 0.301*** Middle 12
4 0.404*** 0.324*** Old 16
4 0.476*** 0.328*** 0.269*** 0.253*** Gender Male 45
6 0.434*** 0.353*** Female 18
1 0.474*** 0.316*** Education None 60 0.411*** 0.295*
Primary 75 0.295** 0.545*** 0.315** 0.293* L Second 15
0 0.504*** 0.326*** 0.226** S Second 26
9 0.434*** 0.355*** Post
second 85
0.358*** 0.356*** 0.312** 0.235* Econ index Poorest 19
6 0.543*** 0.445*** 0.236*** Poor 16
5 0.463*** 0.292*** 0.208** Average 17
3 0.396*** 0.317*** 0.248*** 0.207** Rich 10 0.31*** 0.486*** 0.347*** 0.332*** 0.379***

172
5 Occupation Unskilled 15
5 0.424*** 0.303*** 0.262*** 0.212** Skilled 53 0.497*** 0.364** Farmer 25
9 0.448*** 0.368*** 0.228*** Business 10
5 0.473*** 0.308*** 0.243* Professio
nal 47
0.643*** 0.546*** 0.346* 0.395** Phone category
User 43 0.46*** 0.359***
owner 469 0.473*** 0.357*** 0.231*** 0.38*** 0.277***
* Correlation is significant at the 0.05 level (2-tailed). ** Correlation is significant at the 0.01 level (2-tailed).
Overall, this suggests that social benefits of telecommunications are of value to all segments of the population, and so associated with telephony access, while financial benefits are associated with particular social groups that can achieve higher benefits from them, in particular higher status groups (in economic and occupational terms).
E.2 Perceptions of the overall value of telephony The data presented in section E.1 are concerned with broad attitudes towards the social and economic context in which respondents live, and offer only limited and indirect evidence concerning the impact of telephony on livelihoods. Much more valuable data are derived from two sections of the questionnaire which asked respondents to identify the value of telephony to them or to their households. Responses to the first of these sets of questions, concerning respondents’ assessment of social, financial and human capital (knowledge) benefits in general, as defined and understood by the respondents themselves, are reported in section E.2 of this annex. Responses to the second set of questions, related to much more detailed aspects of behaviour, are reported in sections E.3 and E.4. Findings from these questions build on the evidence concerning the relative importance of different information and communication needs and preferred channels of communications described in section D above. That analysis included, at Figures A.7 and A.8, a graphical summary of preferred channels of communication for different purposes, according to the degree of importance attached to the issues concerned. It suggested that the telephone was highly likely to be chosen as the most appropriate means of communication for emergencies and for social interaction; that it was relatively less used for business communications (where face-to-face communications were strongly preferred);

173
and that it was hardly used at all to secure information or knowledge (where television was the most important channel of information/communications available). The first of two further sets of questions asked respondents to evaluate their investment in using a telephone in respect of three broad types of activity, which equate to the main livelihoods assets under investigation. The results show clearly that the telephone is most highly valued for social communications, considered helpful to some degree in financial matters, but is considered largely irrelevant to knowledge acquisition (human capital). Table A.27a : Attitudes towards investment in the use of phones – random sample
Question: How helpful has your investment in the use of a phone been regarding …?
%age of user sample Very
helpful Helpful No
opinion Unhelpful Very
unhelpful Mean
responseSocial communications (social capital)
33.7 33.1 31.2 2.0 0.0 +0.98
Economic activities (financial capital)
17.3 16.7 39.9 10.9 15.1 +0.10
Knowledge (human capital)
5.2 6.3 53.9 8.9 25.7 -0.44
These data can usefully be presented graphically, as follows: Figure A.9a : Attitudes towards investment in the use of phones – random sample
0% 20% 40% 60% 80% 100%
Socialcommunications(social capital)
Economic activities(financial capital)
Knowledge (humancapital)
Very helpfulHelpfulNo opinionUnhelpfulVery unhelpful

174
The results for the purposive sample are broadly consistent but reflect a slightly more positive appreciation of the value of telephony both across the board and particularly in economic activities. This may reflect the greater value of telephony for the kind of business interests represented in that sample (primarily business people) than in the community at large – for example, that telephone use offers more to traders than it does to farmers.
Table A.27b : Attitudes towards investment in the use of phones – purposive
sample Question:
How helpful has your investment in the use of a phone been regarding …? %age of user sample
Very helpful
Helpful No opinion
Unhelpful Very unhelpful
Mean response
Social communications (social capital)
43.3 30.8 23.1 2.9 0.0 +1.14
Economic activities (financial capital)
30.8 22.1 29.8 5.8 11.5 +0.55
Knowledge (human capital)
12.7 7.8 60.8 3.9 14.7 0.0
Figure A.9b : Attitudes towards investment in the use of phones – purposive
samples
0% 20% 40% 60% 80% 100%
Socialcommunications(social capital)
Economic activities(financial capital)
Knowledge (humancapital)
Very helpfulHelpfulNo opinionUnhelpfulVery unhelpful

175
When these attitudes are compared across different socio-economic categories in the random sample, they reveal significant differences in a number of areas. The results of these correlations can be summarised as follows. In the case of social communication, it is clear that there are significant differences regarding gender, occupation, proximity to market and telephone coverage:
• Men expressed a significantly stronger positive attitude toward the social utility of telephones than women.
• Business people expressed stronger positive attitudes than other occupation groups.
• Those furthest from market centres tended to place greater value on the utility of the phone as a means of social communication.
• Those in areas of lowest telephone service coverage also expressed significantly more positive attitudes regarding the phone’s social utility.
The most significant differences in the perception of the phone’s helpfulness in supporting economic activity concerned gender, education, economic status, occupation and distance from market.
• Men indicated a strong positive attitude towards the economic value of telephony. Women were significantly more negative than men in this respect.
• Amongst educational categories, only those with a senior secondary or higher level of education expressed a positive attitude.
• The poorest group expressed a negative attitude toward the role of the phone in relation to economic activity. This implies that use of the phone may be seen as an economic liability by the very poor, although they appreciate its value with respect to social communication. It suggests a need for further research into the impact of the phone on lower income groups.
• Skilled and unskilled labourers both registered negative attitudes regarding economic utility compared to the positive attitudes expressed by other occupation groups.
• Those living at most distance from the local market registered a stronger positive attitude towards the economic utility of the phone. Interestingly those closest to the market expressed a slightly negative attitude. This may be due to an ability to communicate about economic activities with ease without the assistance of the phone.
Most respondents were indifferent to the telephone as an instrument of knowledge acquisition, and more actually referred to it as unhelpful than helpful. Significant

176
differences can be noted regarding gender, education, occupation and proximity to market.
• Women held significantly more negative attitudes regarding the phone’s utility for these purposes than men.
• Professional respondents were least negative. However, skilled craftsmen expressed one of the most negative attitudes regarding access to knowledge via the phone.
• Of education groupings, only the most educated expressed a positive attitude in this area.
Overall, these findings show that the telephone is highly valued for social networking by all socio-economic groups, very little valued for knowledge-acquisition by all socio-economic groups, but rated differently for economic activities according to prosperity and status. Those in higher status groups – the wealthier, more educated and more frequent users of telephony – tend to rate the telephone positively for economic purposes, while those in lower status groups – the poorer, less educated and less frequent users of telephony – rate it negatively. This is clearly illustrated from the following charts, which compare the quartile divisions within the prosperity indices in this area of questioning for the three research countries.
Figures A.10, A.11 and A.12 : Valuation of telephony for types of activity by prosperity indices and country
Social networking
-1 -0.5 0 0.5 1 1.5 2
poorest
poor
medium
rich
attitude (mean)
Tanzania
Mozambique
India
Economic actitivies
-1 -0.5 0 0.5 1 1.5 2
poorest
poor
medium
rich
attitude (mean)
Tanzania
Mozambique
India
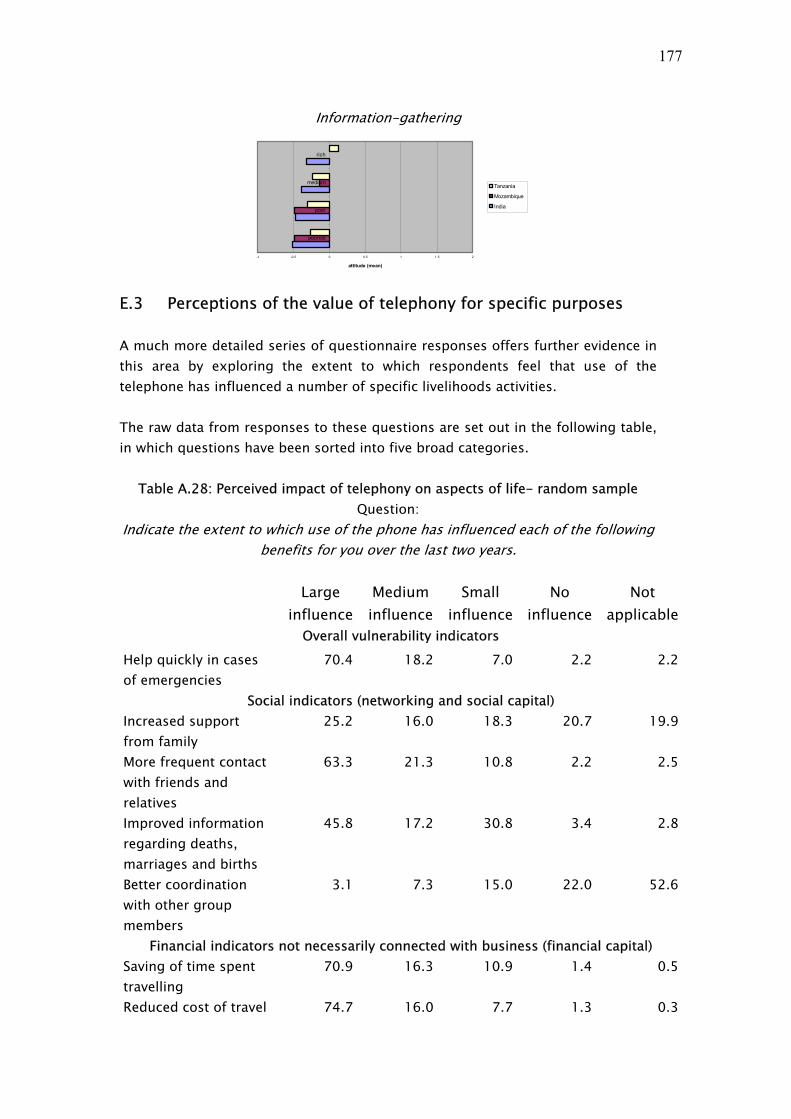
177
Information-gathering
-1 -0.5 0 0.5 1 1.5 2
poorest
poor
medium
rich
attitude (mean)
Tanzania
Mozambique
India
E.3 Perceptions of the value of telephony for specific purposes A much more detailed series of questionnaire responses offers further evidence in this area by exploring the extent to which respondents feel that use of the telephone has influenced a number of specific livelihoods activities. The raw data from responses to these questions are set out in the following table, in which questions have been sorted into five broad categories.
Table A.28: Perceived impact of telephony on aspects of life- random sample Question:
Indicate the extent to which use of the phone has influenced each of the following benefits for you over the last two years.
Large
influenceMedium influence
Small influence
No influence
Not applicable
Overall vulnerability indicators
Help quickly in cases of emergencies
70.4 18.2 7.0 2.2 2.2
Social indicators (networking and social capital) Increased support from family
25.2 16.0 18.3 20.7 19.9
More frequent contact with friends and relatives
63.3 21.3 10.8 2.2 2.5
Improved information regarding deaths, marriages and births
45.8 17.2 30.8 3.4 2.8
Better coordination with other group members
3.1 7.3 15.0 22.0 52.6
Financial indicators not necessarily connected with business (financial capital) Saving of time spent travelling
70.9 16.3 10.9 1.4 0.5
Reduced cost of travel 74.7 16.0 7.7 1.3 0.3

178
Ability to check on availability of goods before travel
46.1 13.6 8.2 6.9 25.2
Increased speed of communication
68.1 15.5 8.9 3.9 3.6
Business indicators (financial capitall) New clients 6.7 14.5 8.6 21.2 49.0Better market prices 7.2 12.5 10.8 19.5 50.1Reduced costs 4.4 7.8 12.9 20.1 54.8Increased sales 10.5 9.7 7.7 17.4 54.8Quicker turnover 11.5 9.0 7.9 16.8 54.9Less time needed to make business arrangements
30.0 18.0 9.2 5.9 36.9
Information regarding subsidies
1.9 3.6 12.7 17.5 64.3
Information and other resources (human capital) Communication with government departments
22.9 14.9 10.5 9.7 42.0
Information about crop management
6.6 10.0 16.1 25.6 41.7
Information about livestock management
4.7 10.9 18.9 20.0 45.6
Information about new products and their use and application
7.0 8.6 26.1 13.6 44.8
Availability of professional staff
17.8 10.3 11.7 18.6 41.7
Increased awareness of legal rights
2.2 5.6 13.6 21.1 57.5
Information regarding schools and colleges
3.4 7.0 22.6 25.0 42.0
Legal requirements 2.0 5.5 13.6 16.3 62.5Better access to family health information
21.4 21.9 34.5 15.3 6.9
These data can be presented graphically as follows:

179
Figure A.13a : Perceived impact of telephony on aspects of life – random sample
0% 20% 40% 60% 80% 100%
Overall vulnerability ind icators
Help quickly in cases of emergencies
Social ind icators (networking and social capital)
Increased support f rom family
M ore f requent contact with f riends and relat ives
Improved informat ion regard ing deaths, marriages and b irths
Bet ter coord inat ion with other group members
Financial ind icators not necessarily connected with business (f inancial capital)
Saving of t ime spent t ravelling
Reduced cost o f t ravel
A bilit y to check on availab ilit y o f goods before t ravel
Increased speed of communicat ion
Business ind icators (f inancial capitall)
New clients
B et ter market prices
Reduced costs
Increased sales
Quicker turnover
Less t ime needed to make business arrangements
Informat ion regard ing subsid ies
Informat ion and other resources (human capital)
Communicat ion with government departments
Informat ion about crop management
Informat ion about livestock management
Informat ion about new products and their use and applicat ion
A vailab ilit y o f professional staf f
Increased awareness of legal rights
Informat ion regard ing schools and co lleges
Legal requirements
B et ter access to family health informat ion
Large influenceMedium influenceSmall influenceNo influenceNot applicable
Taken overall, these data confirm and provide more detail concerning the hierarchy of valuations of information and communications priorities identified above, with the telephone being much more highly valued for use in emergencies and for social interaction, particularly within the family, than in other areas of activity. Where financial value is concerned, it is also clear that the telephone is much more highly valued for generating savings, in both time and money, than it is for generating income, for example through business applications such as increased sales. However, this is affected by the proportion of respondents who did not consider these questions applicable to them. A further test of these data for business users can be obtained from the purposive business sample. Purposive sample responses to perceived impact of telephony questions are presented in the following chart.

180
Figure 13b : Perceived impact of telephony on aspects of life – purposive sample
0% 20% 40% 60% 80% 100%
Vulnerab ilit y ind icators
Help quickly in cases of emergencies
Social indicators (networking and social capital)
Increased support f rom family
M ore f requent contact with f riends and relat ives
Improved info rmat ion regarding deaths, marriages and b irths
Bet ter coordinat ion with other g roup members
Financial ind icators not necessarily connected with business (f inancial cap ital)
Saving o f t ime spent t ravelling
Reduced cost o f t ravel
Ab ilit y to check on availab ilit y o f goods before t ravel
Increased speed o f communicat ion
Business ind icators (f inancial cap itall)
New clients
Bet ter market prices
Reduced costs
Increased sales
Quicker turnover
Less t ime needed to make business arrangements
Informat ion regarding subsid ies
Informat ion and o ther resources (human capital)
Communicat ion with government departments
Informat ion about crop management
Informat ion about livestock management
Informat ion about new products and their use and app licat ion
Availab ilit y of pro fessional staf f
Increased awareness o f legal rights
Informat ion regarding schools and colleges
Legal requirements
Bet ter access to family health informat ion
Large influenceMedium influenceSmall influenceNo influenceNot applicable
It is important, in assessing these data, to remember that the purposive sample is relatively small, and that it is made up specifically of business people (it has a much smaller proportion of farmers than the random sample, and few others outside these categories). Perceptions of the influence of telephony on emergencies and social issues correspond closely with those of the random sample, but respondents in the purposive sample do have a stronger perception of the influence of telephony on financial matters, including income generation issues, than the random sample. They also give a slightly higher valuation to the impact of telephony on information acquisition, though this remains low. The data presented in these charts can also be presented using a ranking order of importance. This is obtained by establishing, for each issue, a mean figure for the importance attributed by respondents based on a five point scale where “1” = “not

181
applicable” and “5” = “large influence”. Presented in this way, the data appear as follows. (The simplified division of questions into livelihoods categories in this table is used for the subsequent analysis in Table 32 and following).
Table A.29 : Identified benefits of telephone use - ranked impact statements – random and purposive samples
Beneficial indicators of phone use
(means) Range = 1 to 5
Livelihoods category
Random sample
Business sample
N 641 104 Reduced cost of travel F 4.64 4.70 Saving of time spent travelling F 4.56 4.64 Help quickly in cases of emergencies S 4.52 4.53 Increased speed of communication S 4.41 4.51 More frequent contact with friends and relatives
S 4.41 4.50
Improved information re deaths, marriages and births
S 4.00 3.86
Ability to check on availability before travel
F 3.48 4.05
Better access to family health information
H 3.36 3.45
Increased support from family S 3.06 2.95 Less time needed to make business arrangements
F 2.98 3.65
Communication with Government dept's.
H 2.67 3.13
Availability of professional staff F 2.44 2.87 Information about new products, their use / application
H 2.20 2.45
Information about crop management H 2.14 2.34 New clients F 2.09 2.82 Information about livestock management
H 2.09 2.30
Better market prices F 2.07 2.77 Quicker turnover F 2.05 2.88 Information regarding schools and colleges
H 2.05 2.03
Increased sales F 2.04 2.84 Reduced costs F 1.87 2.48 Better coordination with other group members
S 1.86 2.18

182
Increased awareness of legal rights H 1.74 1.87 Legal requirements H 1.68 1.92 Information regarding subsidies F 1.61 1.81
Livelihoods categories : F = financial; S = social; H = human (education and
knowledge) Men recorded a slightly higher degree of perceived influence of telephony across the board than women, but this difference was only slight. People with higher incomes and higher status also tended to attribute greater influence, while farmers tended to register significantly higher influence than other occupations in those areas which were most highly ranked by all. There is a significant difference in the perceived impact of the telephone resulting from frequency of use. Generally speaking, and not surprisingly, the higher the frequency of use, the greater the perceived impact/influence.
Table A.30 : Impact of frequency of phone use on perceived benefits – random sample
Impact indicators Frequency of phone use categories
Lowest Low Average High Highest n 75 278 173 76 38
Range (1 to 5) mean mean mean mean mean New clients 1.71 1.74 2.32 2.70 3.08Better market prices 1.77 1.65 2.37 2.79 2.97Reduced costs 1.68 1.55 2.04 2.43 2.63Increased sales 1.91 1.64 2.14 2.83 3.08Quicker turnover 1.95 1.70 2.16 2.83 2.84Increased support from family
2.91 3.10 3.08 2.87 3.38
Saving of time spent travelling
4.44 4.45 4.73 4.65 4.61
Reduced cost of travel 4.41 4.63 4.75 4.67 4.63Ability to check on availability before travel
3.08 3.21 3.68 4.18 3.97
Increased speed of communication
4.00 4.33 4.53 4.70 4.68
Less time needed to make business arrangements
2.68 2.63 3.19 3.73 3.74
Communication with Government dept's.
2.36 2.28 2.80 3.91 3.03
More frequent contact with friends and relatives
4.00 4.30 4.58 4.70 4.66
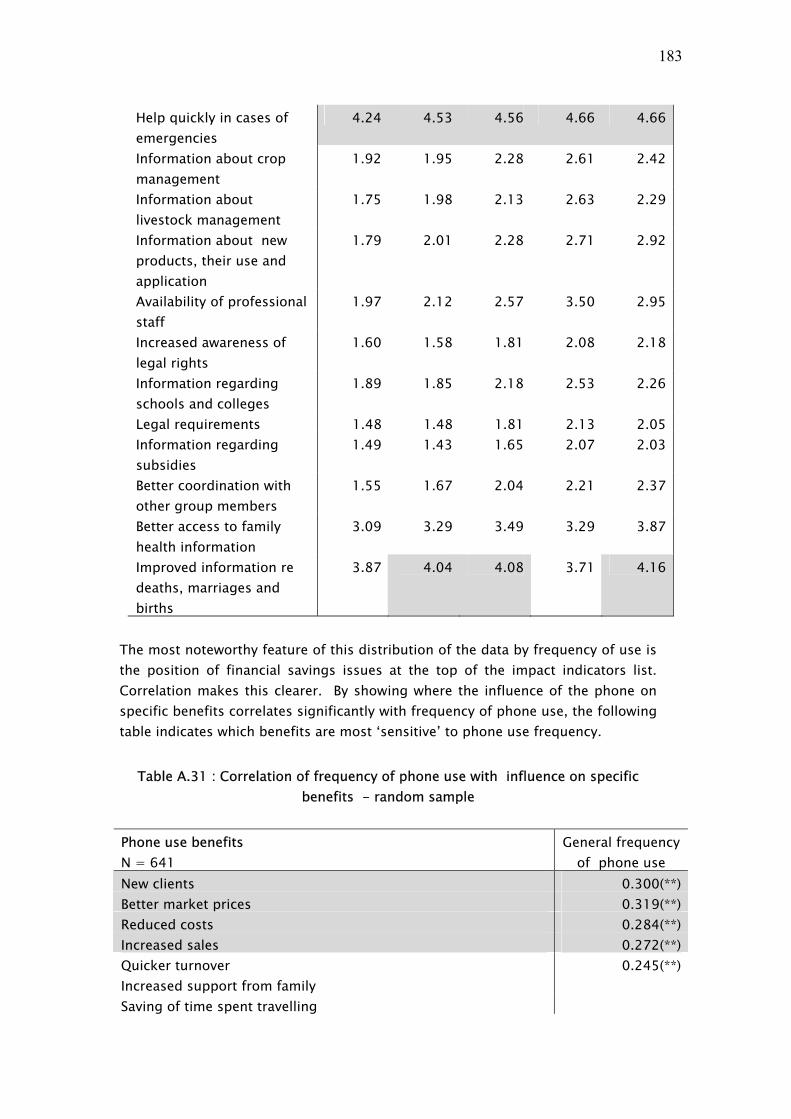
183
Help quickly in cases of emergencies
4.24 4.53 4.56 4.66 4.66
Information about crop management
1.92 1.95 2.28 2.61 2.42
Information about livestock management
1.75 1.98 2.13 2.63 2.29
Information about new products, their use and application
1.79 2.01 2.28 2.71 2.92
Availability of professional staff
1.97 2.12 2.57 3.50 2.95
Increased awareness of legal rights
1.60 1.58 1.81 2.08 2.18
Information regarding schools and colleges
1.89 1.85 2.18 2.53 2.26
Legal requirements 1.48 1.48 1.81 2.13 2.05Information regarding subsidies
1.49 1.43 1.65 2.07 2.03
Better coordination with other group members
1.55 1.67 2.04 2.21 2.37
Better access to family health information
3.09 3.29 3.49 3.29 3.87
Improved information re deaths, marriages and births
3.87 4.04 4.08 3.71 4.16
The most noteworthy feature of this distribution of the data by frequency of use is the position of financial savings issues at the top of the impact indicators list. Correlation makes this clearer. By showing where the influence of the phone on specific benefits correlates significantly with frequency of phone use, the following table indicates which benefits are most ‘sensitive’ to phone use frequency.
Table A.31 : Correlation of frequency of phone use with influence on specific benefits - random sample
Phone use benefits N = 641
General frequency of phone use
New clients 0.300(**)Better market prices 0.319(**)Reduced costs 0.284(**)Increased sales 0.272(**)Quicker turnover 0.245(**)Increased support from family Saving of time spent travelling
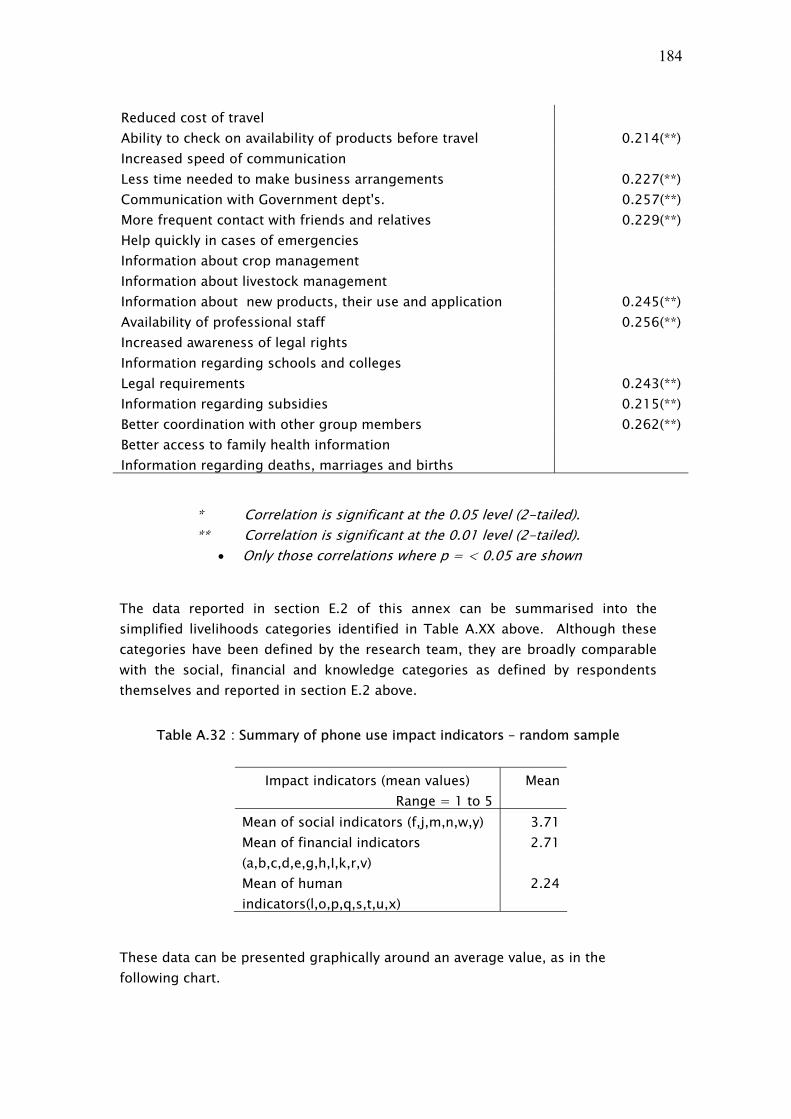
184
Reduced cost of travel Ability to check on availability of products before travel 0.214(**)Increased speed of communication Less time needed to make business arrangements 0.227(**)Communication with Government dept's. 0.257(**)More frequent contact with friends and relatives 0.229(**)Help quickly in cases of emergencies Information about crop management Information about livestock management Information about new products, their use and application 0.245(**)Availability of professional staff 0.256(**)Increased awareness of legal rights Information regarding schools and colleges Legal requirements 0.243(**)Information regarding subsidies 0.215(**)Better coordination with other group members 0.262(**)Better access to family health information Information regarding deaths, marriages and births
* Correlation is significant at the 0.05 level (2-tailed). ** Correlation is significant at the 0.01 level (2-tailed).
• Only those correlations where p = < 0.05 are shown
The data reported in section E.2 of this annex can be summarised into the simplified livelihoods categories identified in Table A.XX above. Although these categories have been defined by the research team, they are broadly comparable with the social, financial and knowledge categories as defined by respondents themselves and reported in section E.2 above.
Table A.32 : Summary of phone use impact indicators – random sample
Impact indicators (mean values)
Range = 1 to 5Mean
Mean of social indicators (f,j,m,n,w,y) 3.71 Mean of financial indicators (a,b,c,d,e,g,h,I,k,r,v)
2.71
Mean of human indicators(l,o,p,q,s,t,u,x)
2.24
These data can be presented graphically around an average value, as in the following chart.

185
Figure A.14 : Summary of phone use on impact indicators – random sample
1 2 3 4 5
Social capitalindicators
Financial capitalindicators
Human capitalindicators
Series1
Frequency of use has much the same impact on these summary indicators as it has on them when assessed individually.
Table A.33 : Impact of frequency of phone use on summary impact indicators – random sample
Impact indicators Frequency of phone use categories
Lowest Low Average High Highest n 75 278 173 76 38
Summaries of Impact indicators
Range 1 to 6
mean mean mean mean mean
Mean of social indicators (f,j,m,n,w,y)
3.42 3.66 3.82 3.81 3.98
Mean of financial indicators (a,b,c,d,e,g,h,i,k,r,v)
2.46 2.43 2.88 3.31 3.32
Mean of human indicators (l,o,p,q,s,t,u,x)
1.97 2.05 2.36 2.74 2.62

186
Table A.34 : Correlation of frequency of phone use against influence on specific benefits - random sample
Phone use benefits
N = 641 General
frequency of phone
use Mean of social indicators
(f,j,m,n,w,y)
Mean of financial indicators (a,b,c,d,e,g,h,i,k,r,v)
.336(**)
Mean of human indicators(l,o,p,q,s,t,u,x)
.307(**)
Presented graphically, these data show clearly how valuation of the telephone in relation to financial capital indicators varies according to intensity of use, while valuation for social purposes is broadly consistent across all levels of usage. As before, the relationship between intensity of use, business occupation and higher economic and educational status categories should be noted at this stage.
Figure A.15 : Impact of frequency of phone use on summary impact indicators – random sample
1 2 3 4 5
Social capitalindicators
Financial capitalindicators
Human capitalindicators
LowestLowAverageHighHighest
Finally, in this context, interviewees were asked about how damaging they felt it would be to their economic activity if they were unable to use a telephone in future.
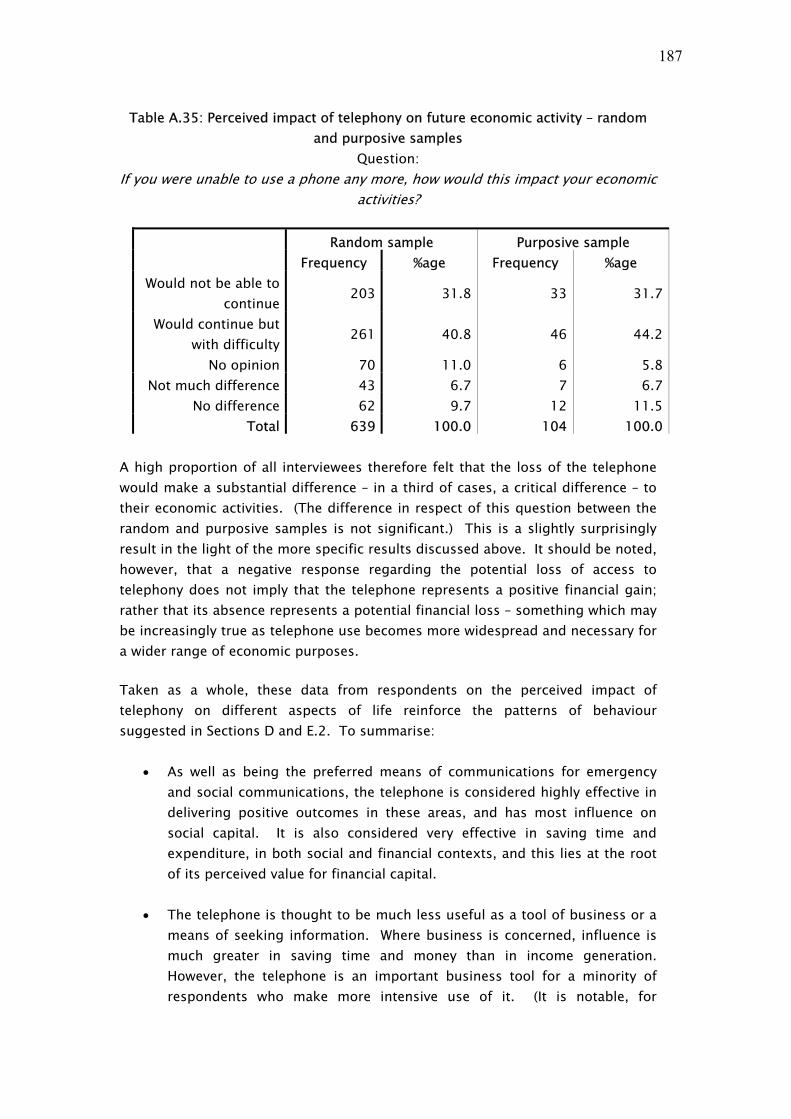
187
Table A.35: Perceived impact of telephony on future economic activity – random and purposive samples
Question: If you were unable to use a phone any more, how would this impact your economic
activities?
Random sample Purposive sample Frequency %age Frequency %age
Would not be able to continue
203 31.8 33 31.7
Would continue but with difficulty
261 40.8 46 44.2
No opinion 70 11.0 6 5.8Not much difference 43 6.7 7 6.7
No difference 62 9.7 12 11.5Total 639 100.0 104 100.0
A high proportion of all interviewees therefore felt that the loss of the telephone would make a substantial difference – in a third of cases, a critical difference – to their economic activities. (The difference in respect of this question between the random and purposive samples is not significant.) This is a slightly surprisingly result in the light of the more specific results discussed above. It should be noted, however, that a negative response regarding the potential loss of access to telephony does not imply that the telephone represents a positive financial gain; rather that its absence represents a potential financial loss – something which may be increasingly true as telephone use becomes more widespread and necessary for a wider range of economic purposes.
Taken as a whole, these data from respondents on the perceived impact of telephony on different aspects of life reinforce the patterns of behaviour suggested in Sections D and E.2. To summarise:
• As well as being the preferred means of communications for emergency and social communications, the telephone is considered highly effective in delivering positive outcomes in these areas, and has most influence on social capital. It is also considered very effective in saving time and expenditure, in both social and financial contexts, and this lies at the root of its perceived value for financial capital.
• The telephone is thought to be much less useful as a tool of business or a
means of seeking information. Where business is concerned, influence is much greater in saving time and money than in income generation. However, the telephone is an important business tool for a minority of respondents who make more intensive use of it. (It is notable, for

188
example, that the impact of the telephone on “better market prices” is not considered important by the sample as a whole but is highly valued by intensive users.)
• Health information is the only information area in which the telephone is
significantly used (and it is possible here that a proportion of respondents understood the question to refer to information about the health of family members, rather than about the means to health improvement). Telephony therefore has least impact and least influence on human capital.
When the influence of the telephone on specific benefits is correlated with the frequency of phone use, close correlations indicate which benefits are most sensitive to phone use frequency. As shown by the data presented above, the benefits that correlate most closely with frequency of phone use are not necessarily those that the respondents feel are most influenced by the telephone, but are those that are most sensitive to frequency of use. In fact, it is the less perceived benefits that are most sensitive to frequency of use – those concerned with business activity and information gathering. Although not so important to the general population, business users at least are important to a minority of people. Whether this minority is a niche group that will remain a minority or a group of ‘first-movers’ which will grow into the majority over time is a question that can only be answered by further research.
E.4 Impact of telephony use on other means of communications A further series of questions was asked in the survey about the impact which respondents believe telephone use has had on their use of other means of communication. Responses concerning these questions are summarised in the following table.
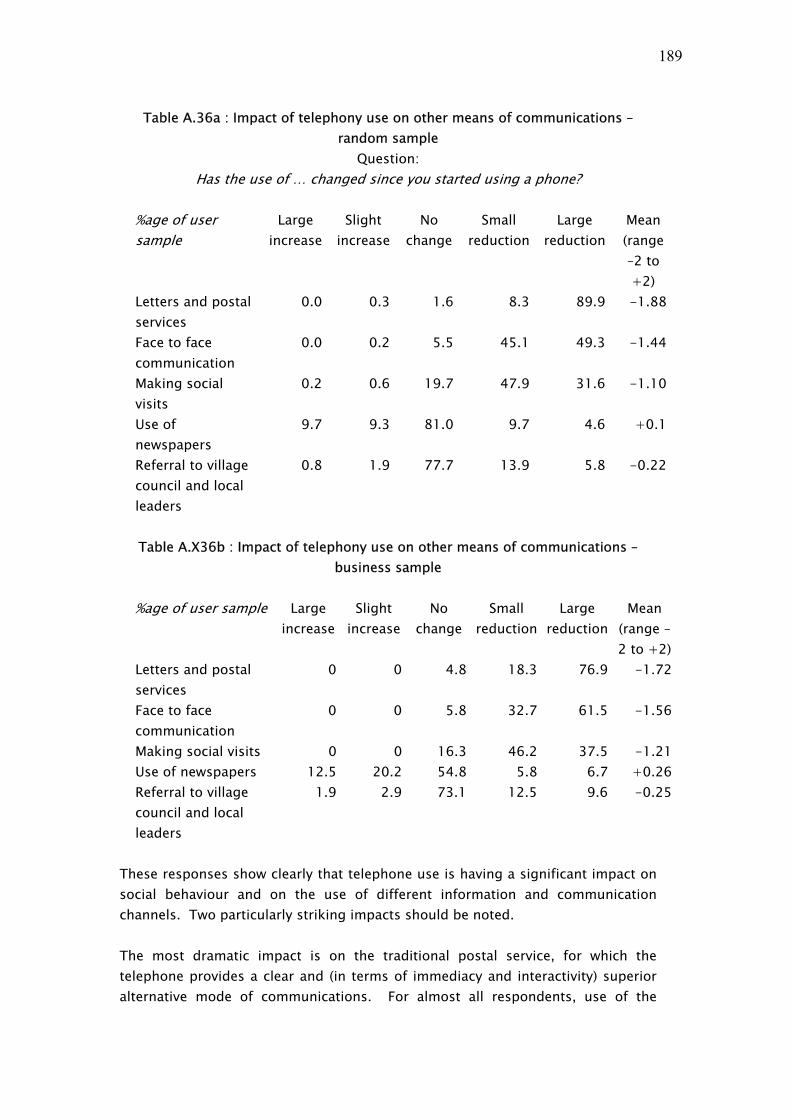
189
Table A.36a : Impact of telephony use on other means of communications – random sample
Question: Has the use of … changed since you started using a phone?
%age of user sample
Large increase
Slight increase
No change
Small reduction
Large reduction
Mean (range –2 to +2)
Letters and postal services
0.0 0.3 1.6 8.3 89.9 -1.88
Face to face communication
0.0 0.2 5.5 45.1 49.3 -1.44
Making social visits
0.2 0.6 19.7 47.9 31.6 -1.10
Use of newspapers
9.7 9.3 81.0 9.7 4.6 +0.1
Referral to village council and local leaders
0.8 1.9 77.7 13.9 5.8 -0.22
Table A.X36b : Impact of telephony use on other means of communications –
business sample
%age of user sample Large increase
Slight increase
No change
Small reduction
Large reduction
Mean (range –2 to +2)
Letters and postal services
0 0 4.8 18.3 76.9 -1.72
Face to face communication
0 0 5.8 32.7 61.5 -1.56
Making social visits 0 0 16.3 46.2 37.5 -1.21Use of newspapers 12.5 20.2 54.8 5.8 6.7 +0.26Referral to village council and local leaders
1.9 2.9 73.1 12.5 9.6 -0.25
These responses show clearly that telephone use is having a significant impact on social behaviour and on the use of different information and communication channels. Two particularly striking impacts should be noted. The most dramatic impact is on the traditional postal service, for which the telephone provides a clear and (in terms of immediacy and interactivity) superior alternative mode of communications. For almost all respondents, use of the
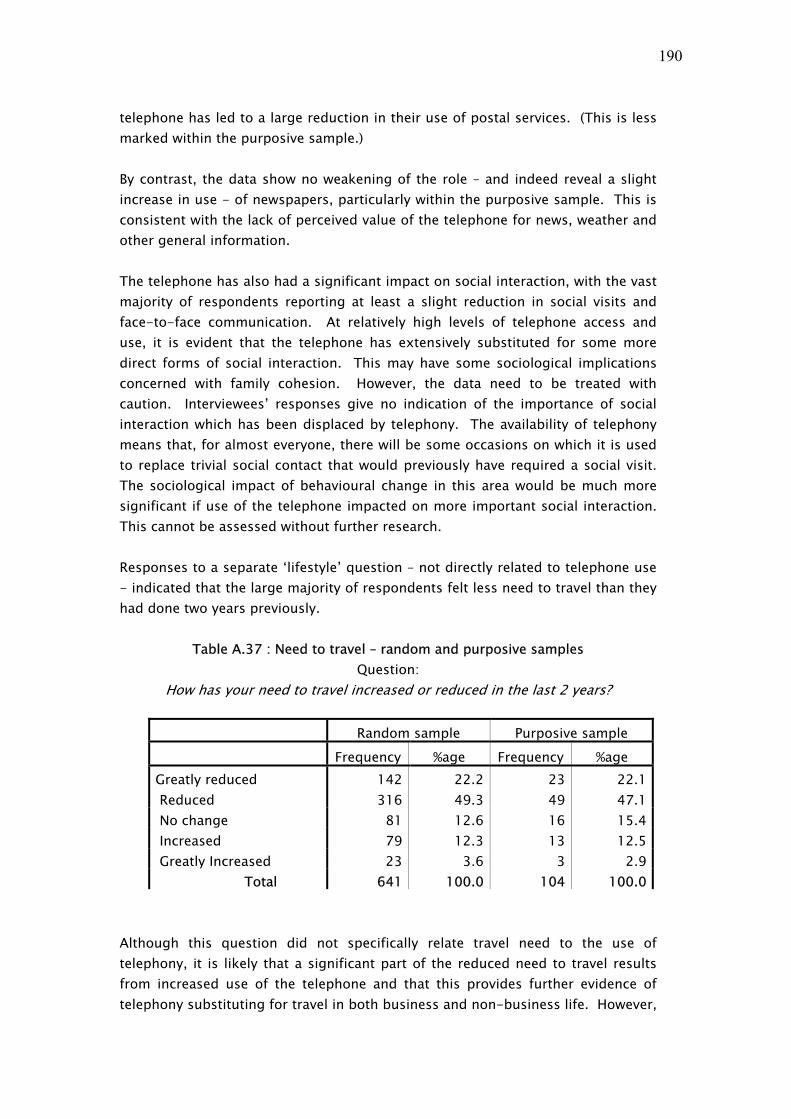
190
telephone has led to a large reduction in their use of postal services. (This is less marked within the purposive sample.) By contrast, the data show no weakening of the role – and indeed reveal a slight increase in use - of newspapers, particularly within the purposive sample. This is consistent with the lack of perceived value of the telephone for news, weather and other general information. The telephone has also had a significant impact on social interaction, with the vast majority of respondents reporting at least a slight reduction in social visits and face-to-face communication. At relatively high levels of telephone access and use, it is evident that the telephone has extensively substituted for some more direct forms of social interaction. This may have some sociological implications concerned with family cohesion. However, the data need to be treated with caution. Interviewees’ responses give no indication of the importance of social interaction which has been displaced by telephony. The availability of telephony means that, for almost everyone, there will be some occasions on which it is used to replace trivial social contact that would previously have required a social visit. The sociological impact of behavioural change in this area would be much more significant if use of the telephone impacted on more important social interaction. This cannot be assessed without further research. Responses to a separate ‘lifestyle’ question – not directly related to telephone use - indicated that the large majority of respondents felt less need to travel than they had done two years previously.
Table A.37 : Need to travel – random and purposive samples Question:
How has your need to travel increased or reduced in the last 2 years?
Random sample Purposive sample
Frequency %age Frequency %age Greatly reduced 142 22.2 23 22.1 Reduced 316 49.3 49 47.1 No change 81 12.6 16 15.4 Increased 79 12.3 13 12.5 Greatly Increased 23 3.6 3 2.9 Total 641 100.0 104 100.0
Although this question did not specifically relate travel need to the use of telephony, it is likely that a significant part of the reduced need to travel results from increased use of the telephone and that this provides further evidence of telephony substituting for travel in both business and non-business life. However,

191
this does not mean that there are not still many areas of necessary travel which are not susceptible to substitution by telephony. The relationship between telephony and travel is likely to be complex and would also benefit from further research.
Section F: Use of the Internet The final section of the questionnaire posed a number of questions concerning use of the Internet. Internet use is often given a high profile in discussions of the role of ICTs in developing countries, and the relative value of telephony and Internet access is an important issue in debates about infrastructure deployment. It had been hoped that the survey would provide evidence of how the Internet is being used by typical adults within rural communities which could help to inform these important discussions, particularly where policy towards Internet deployment is concerned. In practice, however, interviewees in this study had made almost no use of Internet facilities and had almost no experience of Internet use. Of the 641 interviewees taking part in the survey, only 14 reported using email and 12 reported that they had looked at websites. For almost all of this population, therefore, the Internet was simply not part of the visible spectrum of communication resources. The sample included insufficient numbers of Internet users to allow any meaningful analysis of Internet use other than to draw conclusions from its absence. This finding is closely similar in the related studies of Mozambique and Tanzania. The precise reasons for lack of Internet use are not entirely clear. Access to Internet facilities is, of course, much less readily available than access to telephony. The following table details the distribution of villages in terms of distance from the nearest Internet kiosk at the time the survey was undertaken.
Table A.38: Distance of research villages from Internet facilities
Distance to Internet kiosk (kilometers)
Number of villages %ge of villages
5< 9 30 6-10 2 7
11-15 6 20 16-20 8 27 21-25 2 7
>25 3 10 Total 30 100

192
Nearly 70% of villages were therefore more than five kilometers from the nearest Internet kiosk. However, it would be possible for many respondents to use Internet facilities when visiting the location of the nearest Internet kiosk for other reasons, and the very low level of Internet experience is noteworthy. Other factors that may affect Internet use include unreliable power supplies, lack of content which is perceived to be relevant, lack of skills to use Internet facilities and the non-availability of intermediaries to assist in Internet use. There is also an important lesson here for researchers. Further research is needed to establish detailed Internet usage levels and patterns of use, barriers to Internet use and the potential impact of Internet services in rural communities of the kind surveyed in this research. Trend data, indicating changes in patterns of use over time, are likely to be particularly valuable in this context. In addition, most Internet diffusion studies to date have focused on actual users of Internet facilities, for example by assessing the socio-economic characteristics of cybercafé users. These studies should always be complemented by studies looking at Internet use from the perspective of the potential user community as a whole. Given the importance of face-to-face communications in information and communication flows revealed in section D above, it would also be useful to examine if and how usage and information derived from usage devolve from first movers in Internet use into the wider community. It is not, however, possible to draw any further conclusions concerning Internet use from this study at this time.
Section G Conclusion and summary of findings This section briefly summarises some of the conclusions which can be drawn from the India (Gujarat) research questionnaire and analysis. A fuller conclusion to the study, including comparison of the Gujarat data with those from Tanzania and Mozambique, is included in the main research report. This also includes suggestions and recommendations to a variety of stakeholders - including governments and international donors - developed in discussions during stakeholder meetings held in the three research countries during May 2005, together with suggestions for further research. The Gujarat sample for this KaR study included 745 individuals, mostly heads of households, resident in rural communities clustered around four research locations. These included a main (random) sample of 641 interviewees and a purposive sample of 104 business people. Extensive questionnaire surveys sought five main types of information from respondents - concerning their personal circumstances, established information and communication flows, access to and use of telephony, value of telephony in meeting livelihoods requirements, and experience of the Internet. These surveys were supported by focus group discussions. The report in this document summarises major results from this

193
survey in a form which can be easily compared with those of the other two country studies in the project. Characteristics of interviewees are summarised in section B. These represent a broad cross-section of household heads and other adults within typical rural communities in Gujarat. Most interviewees were educated to senior secondary level or above. Most households had more than one income source, with farming cited as the main source of income overall. Most also had protected water and electricity supplies. The majority of interviewees felt positive about general social and economic trends within their communities, including their own livelihoods. The availability and use of telephony is described in section C of the annex. Telephone networks are available throughout the research communities, and most locations have a choice of fixed and mobile networks. Approximately 37% of interviewees had access to a private fixed telephone at home, and this was clearly the preferred choice of telephone access, particularly for those making frequent use of the telephone. Mobile phone ownership and access were still low, at 8.7% and 22.2% respectively. Most interviewees made occasional use of telephone kiosks, and about a third of non-owners expressed an intention to become telephone owners in the next year. Section D of the analysis discusses established information and communication flows. The most important types of information and communication identified by interviewees concerned emergency needs – regarded as very important by a majority of respondents – followed by social information and communications. Telephony was much the preferred channel of communication for emergencies and social interaction, with over three-quarters of respondents regarding it as their primary channel for these purposes. However, telephony was not the preferred mode for other types of information and communication need. Face-to-face communication was a much more important mode of information and communication about issues to do with farming, business and community life (for example, education and government information). Telephony had very little role as a communications channel for information and knowledge gathering, in which television was by far the most important channel. Contrary to experience in many other developing countries, broadcast radio played very little part in these respondents’ information access patterns. The survey provides evidence that a significant transition has taken place in family and social interaction from face-to-face communications to telephony. The vast majority of respondents reported a large decline in face-to-face communications since telephony became generally available. This may have significant sociological

194
implications within communities such as those in this research, though it is not clear how this is impacting on major social interactions. From a livelihoods perspective, these findings suggest that the telephone is most used to address vulnerability at times of crisis and for social networking, particularly within the family – both areas in which issues of security are particularly important. It is used significantly to save time and expenditure and in some business activities (financial capital), though more for saving money than for income generation. However, it is only used to a very limited degree in respect of human capital (information and knowledge acquisition). Section E presents evidence concerning respondents' perceptions of the impact which telephony has on livelihoods, and confirms the picture given by section D. As well as being the preferred mode of communications for emergencies and social networking, the telephone is considered highly efficacious in delivering positive outcomes in these areas. Telephone access appears to yield more value in terms of livelihoods (particularly social capital) than intensity of telephone use – i.e. the ability to make occasional use of the telephone can have a substantial impact on protection against vulnerability. The telephone is also considered valuable in financial terms, particularly in saving time and money, but is not significantly valued as a source of information. Most respondents felt that life, particularly economic life, would be significantly more difficult without the phone. Higher status groups appear to enjoy considerably more economic benefit from the use of telephones more than lower status groups. This suggests that telephony may contribute to widening the economic gap between more prosperous and more marginalised groups within rural communities. Use of the telephone may also add a potential cost burden to the poorest groups, but this needs to be weighed against potential financial savings from reduced transport and other costs. Further research is needed in this area. The final section of the document looks at experience of the Internet within the survey population. An extensive series of questions was included in the survey seeking information about Internet use. However, the proportion of respondents with any experience of the Internet was too small – under 4% - to allow for meaningful analysis. The Internet therefore had no significant impact on the behaviour of respondents. Given that the survey targeted heads of households and senior household members, this suggests that, as things stand, the Internet does not provide an effective channel for the transmission of information within rural communities, though it may be a worthwhile resource for supporting established information channels (for example through its use by broadcast radio and official intermediaries).
195
THE ECONOMIC IMPACT OF TELECOMMUNICATIONS ON RURAL LIVELIHOODS AND POVERTY REDUCTION:
Report of DFID KaR Project 8347
ANNEX B: MOZAMBIQUE RESEARCH REPORT
Report by:
Professor David Souter (Research Coordinator and Report Editor) with
Mozambique Information and Communication Technology Institute Dr Kevin McKemey
Dr Nigel Scott
Introduction This annex summarises the findings of research undertaken in Mozambique as part of a research programme on The Economic Impact of Telecommunications Access on Rural Livelihoods and Poverty Reduction financed through the UK Department for International Development’s Knowledge and Research (KaR) programme. Research for this programme was undertaken in three countries – India (State of Gujarat), Mozambique and Tanzania – and findings relating to all three countries are included in the main research report to which this document forms an annex. The primary concern of the research project was to assess the impact and implications of ICTs, particularly telephony, on and for the livelihoods of low-income households and communities in representative rural communities in the three research countries. It should be noted throughout that the concern of the study is with the impact of telephony on those that are making some use of it, not with penetration rates for telephony or other ICTs. The overall methodological approach to the study was based on the sustainable livelihoods approach outlined in DFID’s Sustainable Livelihoods Guidance Sheets27, focusing in particular on vulnerability and on the key livelihoods assets described
27 These can be found at http://www.livelihoods.org/info/info_guidancesheets.html.

196
as financial, social and human capital. Data was collected through field research, including both focus groups and detailed questionnaire research in three different locations in each country, the total national sample in each country being around 750 adult individuals (mostly heads of households). A note on the selection of locations and on the extent to which findings can be generalised will be found at the end of this Introduction. The field research undertaken in Mozambique was designed in partnership between the research coordinator, Professor David Souter of ict Development Associates ltd (ictDA) and the University of Strathclyde; the national research partner, the Mozambique Information and Communication Technology Institute (MICTI) at Eduardo Mondlane University; and the project data analysis team from the UK development consultancy Gamos Ltd. Field research in Mozambique was undertaken during the summer and autumn of 2004 by MICTI, under the leadership of Professor Venancio Massingue. Data analysis was undertaken by Gamos Ltd in conjunction with MICTI and ictDA. This country report was drafted on behalf of the research team by Professor David Souter, in conjunction with Dr Nigel Scott and Dr Kevin McKemey of Gamos Ltd, and personnel from the Mozambique research team; and was completed following a multistakeholder review meeting in Mozambique in June 2005. Overall project management was undertaken on behalf of DFID by the Commonwealth Telecommunications Organisation. This annex is divided into seven sections. Section A reviews the research methodology, briefly summarising the description of this included in the main research report; describes the locations selected for research in Mozambique; and draws attention to issues arising from research methodology that are specific to the country or to these locations. Section B describes the overall sample used for the research, in particular its demographic characteristics. Section C describes the sample’s access to, ownership and use of telephony. Section D outlines findings from the research concerning information and communication flows of importance to interviewees and their communities. Section E reports on interviewees’ attitudes and perceptions concerning telephony, and relates these to key aspects of livelihoods analysis, particularly concerning financial, social and human capital (income and financial savings, networking and access to information and knowledge). Section F briefly comments on issues concerning the Internet.
197
Section G summarises the findings from the country study and draws brief conclusions from the research at a national level. To facilitate comparison by readers, the structure of this chapter closely follows that used in the comparable analysis of findings for the other two research countries, which is included in annexes A (India – State of Gujarat) and C (Tanzania) to this report. Some duplication of material is included so that the chapters can also be used as stand-alone documents in the individual research countries. The findings of all three country studies are compared and analysed together in Part 3 of the main research report. It is important to note both the significance and the limitations of the data and findings included in this study. In the last five years, telephony has become much more widely available and extensively used in rural areas of developing countries, while there has been considerable debate about the role and value of other information and communication technologies (ICTs) in low-income rural communities. As discussed in the introductory sections of the main research report, however, very little detailed research has been undertaken to date into the impact of telephony and other ICTs on actual behaviour, on information and communication flows, and on livelihoods impacts in such communities. Extensive debate about impacts has therefore taken place in what is substantially an information vacuum. This study is one of the first in this field to examine substantial samples in a range of developing countries in sufficient detail to enable significant conclusions to be drawn for the communities that are assessed. It therefore adds considerably to the quality of information available for evidence-based policy formulation and implementation by policymakers in national governments, business organisations, civil society and the international donor community. A critical issue for any research of this kind is the extent to which its findings can be generalised from particular research locations and countries to the wider world. The shortage of substantive research in this field to date has led to some exaggeration and misinterpretation of the findings of such studies as have been undertaken, often disregarding the small size and unrepresentativeness of data samples used and/or country- or location-specific factors. A principal aim of this project has been to provide more substantial evidence for behaviour and so increase understanding of what is actually taking place within low-income communities in developing countries. The sample sizes and methodological approach in this study provide significantly more substantial indications of what may be happening on a wider scale in comparable low-income and rural communities in other countries than previous research in this field.

198
Findings that are consistent across all three research countries should be regarded as particularly significant, and these are reported in Part 3 of the main research report. The research team hopes that the research findings as a whole will contribute significantly to the serious analysis of policy approaches which is needed if the value of ICTs in rural and low-income developing country communities, including but not exclusively telephony, is to be maximised. However, it is still crucial to understand the limits of these and comparable data. In particular: 1. All research data are to some degree country- and location-specific.
There are very large differences between the social, economic and political characteristics of the populations of developing countries, including the three countries in this research project. The impact of telephony on different societies varies as a result of these country- and location-specific factors. Findings concerning Mozambique offer evidence about Mozambique, and provide indicators about likely circumstances in comparable countries, but they need to be interpreted against these country-specific factors. However, as a result of this national diversity, findings that are robust across the three research countries are much likelier to represent general rather than country-specific experience, and can be treated as having considerable significance. These cross-country findings are discussed in the main report.
2. While research locations within each country were chosen in order to
provide a reasonable cross-section of low-income communities, all selected locations had to have sufficient telecommunications access to provide sufficient data for analysis. The research, therefore, did not include rural areas which do not have telecommunications access or in which access is very limited. Equally, all interviewees came from rural areas, and the sample does not include population groups from major urban centres. The locations are not, therefore, representative of telephone access levels across Mozambique as a whole, and data concerning usage levels (as opposed to usage patterns or to the behaviour of those with and without telephony) cannot be generalised state- or country-wide. Usage levels are, of course, changing rapidly, and a snapshot picture of usage levels would rapidly become outdated.
3. Because the survey focused on livelihoods analysis, the results of field
research are primarily household data, collected almost exclusively from adults and primarily from self-identified heads of households and their spouses. As the purpose of the research was to assess the behaviour of and impact of telephony on those who use telecommunications, it also

199
focuses on population segments that make some use of telephony. The household basis of the survey and focus on self-identified household heads means that the sample under-represents women and has limited value for gender disaggregation (though some consideration of gender issues is included in the main research report). It also includes fewer young adults than the general population. The focus on telephone users means that the sample is on average wealthier than the general rural population. This reinforces the caveat in paragraph 2 above that results on usage levels cannot necessarily be generalised to the population as a whole (for example. a 20% level of ownership of fixed telephones in the sample would not imply an equivalent level of ownership in the population as a whole). However, this does not affect the viability of analysis of behaviour by those in a position to make use of telephony.
4. The household basis of the survey also means that economic and
occupational categories within the survey are concerned with households rather than individuals. As accurate data for individual and household income in rural areas of developing countries are very difficult to establish, economic comparisons have been made between broad-brush economic categories (approximately quartile divisions) built around a multiple indicator index of relative prosperity, including, for example, asset ownership as well as declared income. This provides a more robust basis for economic comparisons. Occupational categorisation is also defined at a household level. Most rural households are dependent on income from a variety of occupations. The primary, secondary and tertiary occupations declared in the data are those of the household, not necessarily of the interviewee. A test for differences between results on an individual and household basis suggests that, in fact, these would not be significant, but the household occupational categorisation has been preferred as the research team believes it is more appropriate for this analysis. It should be noted that the Mozambican sample (and only that sample) includes a significant proportion of households with absent migrant workers.
5. The findings represent a snapshot of behaviour at a particular point in
time. Access to telephony and other ICTs is changing rapidly in the three research countries, particularly in rural locations, and a snapshot can give only limited information about trends in behavioural change. An understanding of trends in behavioural change is particularly important in assessing information and communications because of a) the rapid pace of change in available media and b) the slower pace of behavioural change. Considerable attention has been paid to maximising understanding of behaviour and impact trends in this study through the use of questions about perceptions of change, but data on actual

200
behavioural trends could only be obtained through a repeat survey of the same interviewees. Repeat surveys along these lines would be valuable.
In summary, therefore, the findings set out in this annex and in the main project research report provide a considerably more substantial picture of how individuals may behave, how livelihoods may be affected and how low-income communities in the three research countries may be impacted by telephony (and, to a lesser extent, other ICTs) than is available in earlier research. The findings offer valuable indicators which may be relevant in other countries, and which merit serious consideration by policymakers. However, like all such data, they should be interpreted with caution. Nothing can substitute for country-specific research in developing countries, and the research team hopes that this project will encourage similar research to be undertaken elsewhere. Findings which the research team considers robust across all three research countries – and therefore highly likely to be representative of behaviour in comparable developing countries - are set out in Part 3 of the main report. This annex report includes analysis of both frequencies and correlations within the survey data. Most of the illustrative tables and charts represent data frequencies, while, to conserve space, correlations are largely reported within the text. Data sets compiled during the research are freely available for use by any individual researcher. They provide rich information on many issues which go well beyond the initial remit of the research study. Further analysis of aspects of the data not included in this document or the main report will be undertaken and published by various members of the research team following presentation of this report to DFID. However, the research team for this study (ictDA, Gamos, MICTI and Professor Christopher Garforth) does not endorse the conclusions drawn in any publication or study that makes use of the project research data unless its endorsement is explicitly expressed in such a publication or study.
Section A: Research methodology and research locations
The research methodology adopted for this study is described in Part 2 of the main research report. In summary, a sample of some 750 adults was questioned, through field interviews, about their livelihoods, use of and attitudes towards telephony and other ICTs and other relevant issues, in each of three research countries (India (State of Gujarat), Mozambique and Tanzania). Questionnaires were drawn up following focus group discussions in research regions and, although broadly consistent across the research countries, included some national variations. In order to reduce distortions due to socio-economic circumstances in particular research locations, interviews were undertaken in three separate locations in each

201
country, and interviewees drawn from clusters resident at different distances from the centres of the three research locations (which were usually rural towns).
A.1 Telecommunications infrastructure and policy The Mozambique telecommunications sector was restructured in 1992, when responsibilities in the sector were divided between the Ministry of Transport and Communications, the regulatory authority INCM and the operating company Telecomunicacoes de Mozambique (TDM). The most recent data available at the time of the survey suggested that Mozambique's national telephone network included around 85,000 connected lines, with a telephone density of only 0.44 line per hundred population. There was a high disparity in telecommunications access between the urban and the rural areas, with 64% of all lines concentrated in the capital city, Maputo, and the second and third largest cities in the country having 11% and 7% of all lines, respectively. Mobile telephony was beginning to address the lack of telecommunications access within rural areas in the country, but wireless penetration was still relatively limited compared to that in neighbouring countries.
Figure B.1 : Mozambique telecommunications backbone, 2003
Source: Telecomunicações de Moçambique (TDM)
The government of Mozambique adopted a national ICT policy document in 2000, setting as priorities for ICT development the sectors of education, human resource development, health, infrastructure and governance, as well as universal access to telecoms and ICTs. A national implementation stategy for the policy was approved in 2002. This strategy defines programmes through which it is envisaged that

202
new ICTs will support the implementation of the policy and of the national Action Plan for the Reduction of Absolute Poverty.
A.2 Research locations
The selection of provinces and districts for the Mozambique research was made according to the following criteria:
a) level of prosperity (provincial level); b) telecom Coverage (on the principle that each district selected should have
some access to mobile and fixed phone); c) public access (two of the districts should have access to TDM digital agency
and community radio); d) representation of major economic zones; e) promixity to Maputo (cost-saving).
The three districts selected for inclusion in the study were Chibuto in Gaza Province, Moamba in Maputo Province and Mocuba in Zambézia Province.

203
Figure B.2 : Map of Mozambique and research locations
Chibuto (Gaza Province)
Chibuto is located in the Southern region of Gaza Province. The district is one of wooded hills with sandy soils, and more fertile lowland marshes and flood plains along the Limpopo River and its tributaries. Chibuto district is divided in a number of main centres called Postos Administrativos, namely Maleice, Chibuto, alto Changane, Changanine and Godide. Chibuto, the district headquarters, is a municipality and is where most of the

204
business, telecommunications and power capacity are concentrated. Three of the centres, Chibuto city, Chaimite and Maleice, had access to MCel mobile lines at the time of the study but only Chibuto city had access to TDM fixed lines. The major crops in the district are vegetables, maize, beans, mexoeira and rice. Of these crops, maize and beans may be grown as cash crops for local sale. Produce is marketed in the district headquarters, at the market in the administrative post or along the principal access roads, where merchants from other districts occasionally arrive to make bulk purchases. Other livelihoods are livestock breeding, craftwork and migrant work. One of the biggest local business investments concerns mineral sands deposits that represent the world's largest known economic resource of titanium dioxide and associated minerals. The whole family is involved in agriculture and children from the age of 12 will be predominantly occupied in the fields. Most families posess two or three separate machambas, usually located near to their homesteads. A few families have cultivated fields much further away in an attempt to find more fertile land.
Moamba (Maputo Province)
Moamba district is located in the southern province of Maputo. Moamba is one of the main suppliers of maize, potatoes and vegetables to the city of Maputo. Rainfed/irrigated crop farming (Beans, maize, potatoes and vegetables), livestock breeding, craftwork, fishing, and petty trade are main sources of income, complemented by migrant labour in South Africa. Moamba is divided into three Postos Administrativos, namely Ressano Garcia, Moamba Sede, and Pessene and Sábie. Moamba Sede, the district headquarters, is a small town/village, half-way between Maputo and the South African frontier. Resano Garcia is more focused on business (informal trade), Pessene and Sabie on cattle farming and agricultural production and Moamba Sede on administration. All three centres have access to mobile and fixed lines. As in Chibuto, the whole family is involved in agriculture and children from the age of 12 will be predominantly occupied in the fields. Most families possess two or three separate machambas, usually located near to their homesteads. A few families have cultivated fields much further away in an attempt to find more fertile land.

205
Mocuba (Zambézia Province).
Mocuba is located in the northern part of the country in Zambézia Province, approximately 170 kilometres from Quelimane. The principal economic activities in Mocuba are agricultural but also include fishing and hunting, the artisanal production of baskets and pottery, carpentry and smallscale commerce. The major crops are maize, mandioca, beans, mexoeira and rice. Of these crops, maize, mandioca and beans cotton may be grown as cash crops for local sale. Produce is marketed in the district headquarters, at the market in the administrative post or along the principal access roads, where merchants from other districts occasionally arrive to make bulk purchases. The other main livelihood is livestock breeding. Mocuba district is divided into three “Postos Administrativos”, namely Mugeba, Mocuba city and Namanjavira. Only Mocuba has both mobile and fixed telecommunications networks. The pattern of landholding is similar to that in the other two districts selected for the study.
The following table sets out some characteristics of the selected districts.
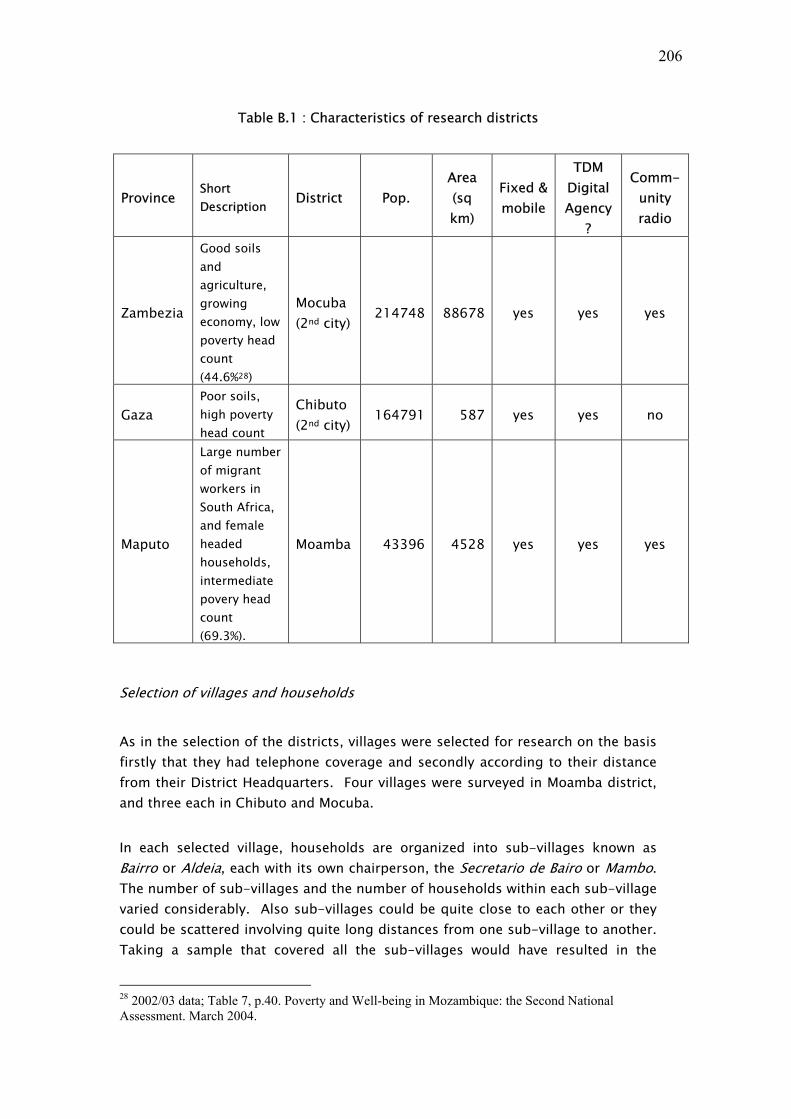
206
Table B.1 : Characteristics of research districts
Province Short Description District Pop.
Area (sq km)
Fixed & mobile
TDM Digital Agency
?
Comm-unity radio
Zambezia
Good soils and agriculture, growing economy, low poverty head count (44.6%28)
Mocuba (2nd city)
214748 88678 yes yes yes
Gaza Poor soils, high poverty head count
Chibuto (2nd city)
164791 587 yes yes no
Maputo
Large number of migrant workers in South Africa, and female headed households, intermediate povery head count (69.3%).
Moamba 43396 4528 yes yes yes
Selection of villages and households
As in the selection of the districts, villages were selected for research on the basis firstly that they had telephone coverage and secondly according to their distance from their District Headquarters. Four villages were surveyed in Moamba district, and three each in Chibuto and Mocuba.
In each selected village, households are organized into sub-villages known as Bairro or Aldeia, each with its own chairperson, the Secretario de Bairo or Mambo. The number of sub-villages and the number of households within each sub-village varied considerably. Also sub-villages could be quite close to each other or they could be scattered involving quite long distances from one sub-village to another. Taking a sample that covered all the sub-villages would have resulted in the
28 2002/03 data; Table 7, p.40. Poverty and Well-being in Mozambique: the Second National Assessment. March 2004.
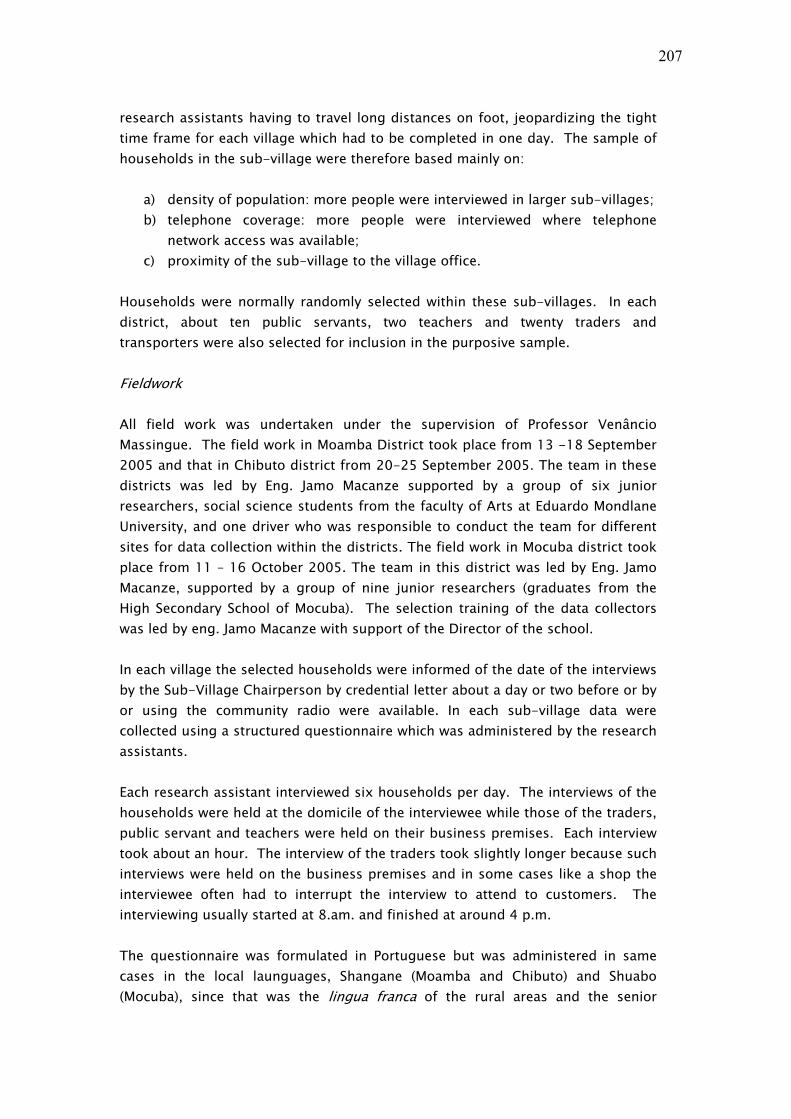
207
research assistants having to travel long distances on foot, jeopardizing the tight time frame for each village which had to be completed in one day. The sample of households in the sub-village were therefore based mainly on:
a) density of population: more people were interviewed in larger sub-villages; b) telephone coverage: more people were interviewed where telephone
network access was available; c) proximity of the sub-village to the village office.
Households were normally randomly selected within these sub-villages. In each district, about ten public servants, two teachers and twenty traders and transporters were also selected for inclusion in the purposive sample. Fieldwork All field work was undertaken under the supervision of Professor Venâncio Massingue. The field work in Moamba District took place from 13 -18 September 2005 and that in Chibuto district from 20-25 September 2005. The team in these districts was led by Eng. Jamo Macanze supported by a group of six junior researchers, social science students from the faculty of Arts at Eduardo Mondlane University, and one driver who was responsible to conduct the team for different sites for data collection within the districts. The field work in Mocuba district took place from 11 – 16 October 2005. The team in this district was led by Eng. Jamo Macanze, supported by a group of nine junior researchers (graduates from the High Secondary School of Mocuba). The selection training of the data collectors was led by eng. Jamo Macanze with support of the Director of the school. In each village the selected households were informed of the date of the interviews by the Sub-Village Chairperson by credential letter about a day or two before or by or using the community radio were available. In each sub-village data were collected using a structured questionnaire which was administered by the research assistants. Each research assistant interviewed six households per day. The interviews of the households were held at the domicile of the interviewee while those of the traders, public servant and teachers were held on their business premises. Each interview took about an hour. The interview of the traders took slightly longer because such interviews were held on the business premises and in some cases like a shop the interviewee often had to interrupt the interview to attend to customers. The interviewing usually started at 8.am. and finished at around 4 p.m. The questionnaire was formulated in Portuguese but was administered in same cases in the local launguages, Shangane (Moamba and Chibuto) and Shuabo (Mocuba), since that was the lingua franca of the rural areas and the senior

208
researchers wanted to ensure maximum understanding of the questions by the respondents. Consistency in translation was addressed during the pre-training phase, which included piloting of the questionnaire before the start of fieldwork.
A.3 Telephone service coverage in research locations The main purpose of the study reported in this annex was to establish the impact of telephony on livelihoods, rather than the distribution of telephony itself. Research locations were therefore chosen from amongst those in which telephone service was available, and interviews were focused on individuals and households with some experience of telephony. Telephone service was far from universally distributed in Mozambique at the time of the survey, and was not available in many remoter rural locations. While the locations chosen for the study may be representative of areas with telephone network availability, they are not, therefore, necessarily representative of rural Mozambique as a whole. In the districts chosen, fixed line service by the TDM is considered to be the dominant telephone service provision, but this was not true for most of the villages. Fixed lines were available only in the district headquarters towns. The remaining villages depended on cellular telephones, which clearly illustrates the importance of this ICT. The following types of coverage were found:
• High Network: access to TDM fixed line and MCel mobile service providers • Medium Network: reasonable access to mobile services but no access to
TDM fixed line reinforced with local antennas • Low Network: access only to rural public phones and local antennas • Poor Network: no local access of any kind (travel required for access).

209
Table B.2 : Telephone coverage by villages per district
* Villages not assessed because the access rods were poor and?or there was no access to phone networks
As a check on availability, interviewees were asked about their perceptions of the availability, diversity and quality of telephone service coverage within the research locations. Their responses are reported in the following table:
Table B.3: Level of telephone service coverage – random sample
Approximately 10% of the sample therefore needed to travel some distance in order to use a telephone (whether a public facility or their own mobile phone).
District Name
Village name High
Network Medium Network
Low Network
Poor Network
Ressano Garcia X Moamba Sede X Sabie X
Moamba
Pessene X Maleice X Chibuto City X Chaimite X Alto Changane* X Godide* X
Chibuto
Changanine* X Mugeba X Mocuba City X Mocuba Namanjavira X
Frequency %ge
No local access 74 11.0
Low – rural public access 197 29.2
Medium – good mobile coverage (no fixed)
382 56.6
High - fixed line plus mobile
22 3.3
Total 675 100.0

210
A.4 Statistical analysis and significance This study aims to provide evidence of the behaviour of individual adults and households in rural areas of the research countries who currently make some use of ICTs, particularly telephony, in the course of their regular lives; and to assess evidence relating this usage to their livelihoods and livelihoods strategies. The sample is appropriate and sufficient to indicate patterns and perceptions of behaviour, usage and impact which are relevant to this particular broad socio-economic group (i.e. individual adults and households in rural areas that have access to telephony (which constitutes a very large majority of those in the sample areas), and that make some use of telephony (which also constitutes a majority in sample areas). The sample is also appropriate and sufficient to indicate the likely behaviour, usage and impact of and on comparable groups of rural adults and households in areas which do not yet have telephone access, but where telephone access is likely to become available in the near future. As the sample was chosen in order to provide sufficient data for rural adults and households that currently use telephony, it should be emphasised, however, that the data must be interpreted with caution in respect of the national population or national rural population as a whole. In particular:
1. As the survey included only rural environments, these findings cannot be generalised to urban populations or to national populations including substantial urban groups. Indeed, the socio-economic characteristics of urban Mozambique are sufficiently different from those of rural Mozambique to make it likely that patterns of behaviour, usage and impact are significantly different between urban and rural areas.
2. As the survey focused on those currently using telephony and on areas in
which substantial telecommunications connectivity is available, data concerning usage levels, as opposed to usage patterns, cannot be generalised to any wider population group, and should not be used to imply any particular level of ICT use country- or region-wide. This is particularly true of the Mozambique sample, which includes a significantly higher proportion of respondents in higher income brackets and a substantially lower proportion of farmers and traders than the population as a whole. (The study’s purpose was to review the pattern and impact of ICT usage, not its level, and no detailed checks were undertaken to compare usage levels within the sample with the rural or national population as a whole. However, as will be seen in section B, it is clear that telephone ownership levels in the Mozambique sample are well above the national average.) This caveat does not apply to interpretation of findings concerned with the behaviour and attitudes of users of telephony, the

211
primary targets for research; merely to the level of their presence within comparable communities across the country.
It had been hoped, during the research design phase, that the study would generate sufficient data to assess Internet as well as telephony behaviour, usage and impact. In practice, levels of Internet usage among interviewees in the Mozambique sample, as in those in the other research countries, proved to be too low for any statistically significant analysis of that usage. The low level of Internet use within the sample is discussed further in sections F of this report and in the main research report. In brief, it means that the analysis of findings contained in this document and the other country studies in this project is predominantly an analysis of telephony behaviour, usage and impact. A copy of the questionnaire used in the Mozambique study is attached as an appendix to the main report. It was a lengthy and detailed questionnaire, which produced a large, detailed and rich accumulation of data, only some of which can be reported here. This annex includes an account of key findings from the Mozambique research, many of which are presented in tabular and graphic form, and summarises findings from correlations and other statistical analysis undertaken as part of the research project. Members of the research team and other researchers are expected to publish further analysis on additional aspects of the findings in future publications. Users of this report should note that most of the charts contained in it need to be viewed (and, where appropriate, printed) in colour. The statistical analysis undertaken for this study used non-parametric statistical tests to look for the influence of various social groupings on behaviour. When looking at the influence of such social groupings, the analysis employed the Mann-Whitney U test to test for differences between two independent groups, and the Kruskal-Wallace H test to test for differences between three or more groups. Where such analysis is relevant to their presentation, tables in this paper present the probability (p value) that differences between the groupings have occurred by chance. Generally, only differences with a probability of less than 0.05 have been taken to indicate a relationship: i.e. statistical significance is taken to be represented by p =<0.05. Similarly, when considering correlations between two variables, it has only been assumed that a valid relationship exists where the p value associated with a Spearman Rank Order Correlation Coefficient is less than 0.05, and the correlation coefficient itself is greater than 0.2.
Section B : The research sample
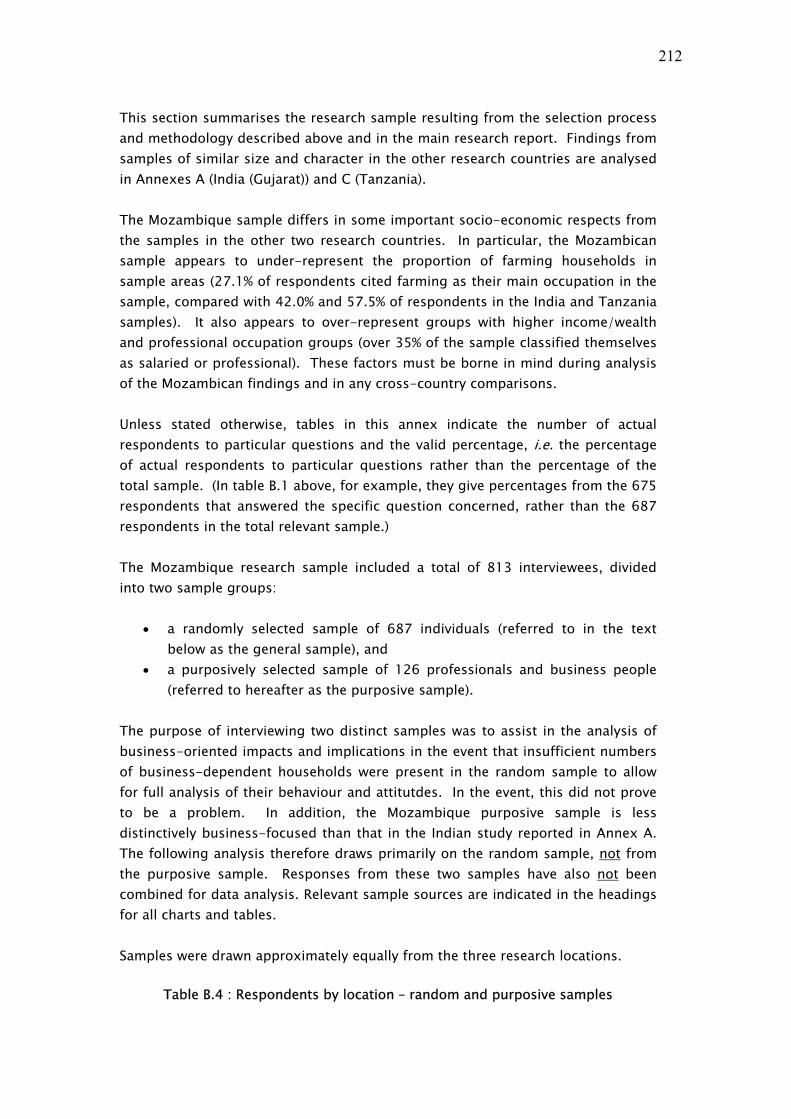
212
This section summarises the research sample resulting from the selection process and methodology described above and in the main research report. Findings from samples of similar size and character in the other research countries are analysed in Annexes A (India (Gujarat)) and C (Tanzania). The Mozambique sample differs in some important socio-economic respects from the samples in the other two research countries. In particular, the Mozambican sample appears to under-represent the proportion of farming households in sample areas (27.1% of respondents cited farming as their main occupation in the sample, compared with 42.0% and 57.5% of respondents in the India and Tanzania samples). It also appears to over-represent groups with higher income/wealth and professional occupation groups (over 35% of the sample classified themselves as salaried or professional). These factors must be borne in mind during analysis of the Mozambican findings and in any cross-country comparisons. Unless stated otherwise, tables in this annex indicate the number of actual respondents to particular questions and the valid percentage, i.e. the percentage of actual respondents to particular questions rather than the percentage of the total sample. (In table B.1 above, for example, they give percentages from the 675 respondents that answered the specific question concerned, rather than the 687 respondents in the total relevant sample.) The Mozambique research sample included a total of 813 interviewees, divided into two sample groups:
• a randomly selected sample of 687 individuals (referred to in the text below as the general sample), and
• a purposively selected sample of 126 professionals and business people (referred to hereafter as the purposive sample).
The purpose of interviewing two distinct samples was to assist in the analysis of business-oriented impacts and implications in the event that insufficient numbers of business-dependent households were present in the random sample to allow for full analysis of their behaviour and attitutdes. In the event, this did not prove to be a problem. In addition, the Mozambique purposive sample is less distinctively business-focused than that in the Indian study reported in Annex A. The following analysis therefore draws primarily on the random sample, not from the purposive sample. Responses from these two samples have also not been combined for data analysis. Relevant sample sources are indicated in the headings for all charts and tables. Samples were drawn approximately equally from the three research locations.
Table B.4 : Respondents by location – random and purposive samples

213
Random sample Business sample Frequency %age Frequency %age Chibuto 206 30.0 32 25.4 Moamba 207 30.1 61 48.4 Mocuba 274 39.9 33 26.2 Total 687 100.0 126 100.0
As noted above, the use of three research locations was intended to reduce the impact of variations in socio-economic circumstances within rural Mozambique. No detailed analysis has therefore been undertaken of differences in findings between the three locations, and the need to adjust for variations in socio-economic circumstances before doing so means that this would have limited value. It could also not be undertaken for this report without disproportionate cost.
B.1 Demographic characteristics Interviews were conducted either with the adult self-identified as head of household (37%) or with another adult household member (63%). This resulted in a sample that was 52% male, and 48% female.
Table B.5: Household status and gender of interviewees – random sample
Gender
Male Female Total
Head of household
209 39 248
Spouse 13 209 222
Relationship to the head of household Adult family
member 103 103 206
Total 325 351 676 This household status distribution differs somewhat from the samples in India and Tanzania, in both of which the vast majority of interviewees were either self-identified heads of household or their spouses, and the large majority were self-identified heads of household. This may result partly from the absence of a significant number of heads of households undertaking migrant labour in South Africa. The gender distribution is also significantly more even than in the other two research countries, whose samples were disproportionately male. (The gender distribution in the Mozambique purposive sample, however, was 64% male.) The mean age of respondents in the random sample was 32. The mean age of the purposive sample was 31.

214
Table B.6: Age of interviewees – random sample
AGE Male Female Total Frequency %age Frequency %age Frequency %age
>22 62 19 77 22 139 20.522 - 28 73 23 112 32 186 27.529 - 40 89 28 122 35 214 31.6>40 99 31 38 11 138 20.4Total 323 349 687
The majority of the sample had attended primary school, but few respondents had received higher education.
Table B.7: Educational attainment level of interviewees – random sample
Frequency %age No formal schooling 84 12.3 Adult education 41 6.0 Has attended Primary school 311 45.5 Basic level 196 28.7 Medium level 48 7.0 Higher education 4 0.6 Total 684 100.0
Members of the survey team felt that it was inappropriate to ask questions about literacy to the whole sample, and so no detailed breakdown is available of literacy levels.
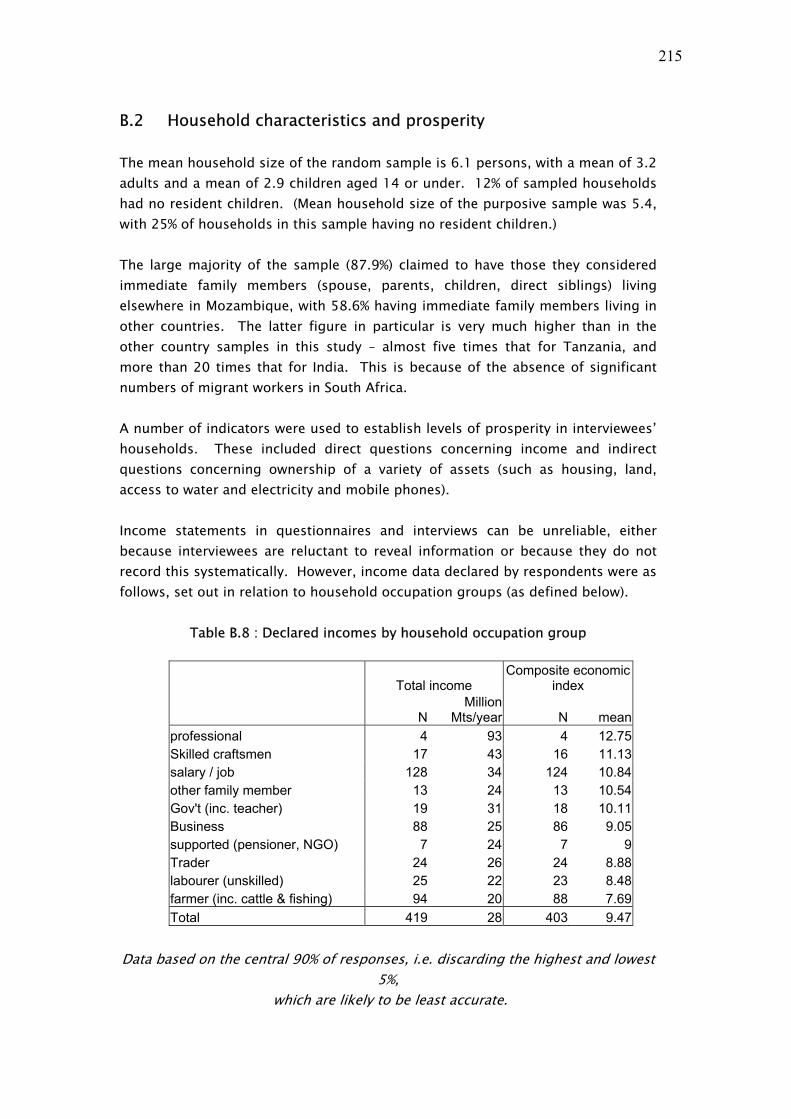
215
B.2 Household characteristics and prosperity The mean household size of the random sample is 6.1 persons, with a mean of 3.2 adults and a mean of 2.9 children aged 14 or under. 12% of sampled households had no resident children. (Mean household size of the purposive sample was 5.4, with 25% of households in this sample having no resident children.) The large majority of the sample (87.9%) claimed to have those they considered immediate family members (spouse, parents, children, direct siblings) living elsewhere in Mozambique, with 58.6% having immediate family members living in other countries. The latter figure in particular is very much higher than in the other country samples in this study – almost five times that for Tanzania, and more than 20 times that for India. This is because of the absence of significant numbers of migrant workers in South Africa. A number of indicators were used to establish levels of prosperity in interviewees’ households. These included direct questions concerning income and indirect questions concerning ownership of a variety of assets (such as housing, land, access to water and electricity and mobile phones). Income statements in questionnaires and interviews can be unreliable, either because interviewees are reluctant to reveal information or because they do not record this systematically. However, income data declared by respondents were as follows, set out in relation to household occupation groups (as defined below).
Table B.8 : Declared incomes by household occupation group
Total income Composite economic
index
NMillion
Mts/year N mean professional 4 93 4 12.75 Skilled craftsmen 17 43 16 11.13 salary / job 128 34 124 10.84 other family member 13 24 13 10.54 Gov't (inc. teacher) 19 31 18 10.11 Business 88 25 86 9.05 supported (pensioner, NGO) 7 24 7 9 Trader 24 26 24 8.88 labourer (unskilled) 25 22 23 8.48 farmer (inc. cattle & fishing) 94 20 88 7.69 Total 419 28 403 9.47
Data based on the central 90% of responses, i.e. discarding the highest and lowest
5%, which are likely to be least accurate.

216
In spite of the caution required when dealing with declared income data, questions relating to prosperity indicators revealed that there were close correlations between a number of indicators concerning levels of prosperity and social status – in particular household income, education, quality of housing and number of possessions. Quality of housing appears to be the single most reliable indicator of prosperity within the sample, as it correlates most strongly with the other indicators. (78.4% of the sample owned their homes (or lived in homes owned by the household), with 8.1% renting and 13.5% holding other forms of tenure.) Connection to utilities and possession of household goods such as refrigerators and televisions are also related to prosperity (as is mobile phone ownership), while total household income appears to be a stronger indicator of prosperity than per capita income. Land use and livestock ownership do not correlate with other prosperity indicators, in spite of the fact that 89% of interviewees had some land. Distribution of household services, consumer goods and means of transport are often useful indicators of relative prosperity and the relative value attached to different products and services. For reasons already noted above, however, it is evident from data relating to these that the random sample is more prosperous than the general population in rural communities in Mozambique.

217
Table B.9: Access to services, ownership of consumer goods and means of transport by household – general sample
Questions:
“Which of the following do you have in your household?” (Services and consumer goods)
“Which of the following does your household own?” (Means of transport)
Frequency %age Services Protected water (piped water or well)
203 29.9
Electricity (grid) 260 38.3Household generator
19 2.8
Consumer goodsRadio 500 73.6Television 218 32.2Refrigerator 213 31.4Fixed telephone 41 6.1Computer 21 3.1Means of transport Bicycle 294 43.3Car/pickup 71 10.5Scooter 68 10.0Truck 29 4.3Tractor 18 2.7
Figures for possession of a television and a refrigerator, for example, are three and six times those in the comparable Tanzania sample, while as many as 10% of the Mozambique sample households owned cars). These asset ownership and service access data should not, therefore, be taken as being representative of the general population of the communities from which the sample is drawn. The strong correlations apparent between different household prosperity indicators within the sample suggested to the research team that the best approach to analysing their relationship to telephone usage and impact would be through the development of a composite index. A composite prosperity index was therefore developed for correlation analysis, made up of the sum of four coded indices – total income, quality of housing, household possessions and means of transport – each coded into distributed in quartile divisions. The composite

218
proserity index correlates with most of the poverty indicators, confirming that this is a reasonable indicator of levels of prosperity/poverty. However, it can only be calculated for 67% of the respondents (it is restricted by the number of people responding to the questions on income).
Table B.10 : Mozambique composite prosperity index
Frequency %age Poorest 139 30.3Poor 107 23.3Average 129 28.1Richest 84 18.3Total 459 100.0
B.3 Household occupation and sources of income Most households in rural areas of developing countries have several sources of income. Interviewees were asked to identify up to three significant sources of income for their households. 24% of the Mozambique sample for this study claimed to have two sources of income, and 5% cited three, with 71% of households claiming to be dependent on a single income source. This last is a much higher figure than in the comparable questions for the other two research countries. The following data relate to the primary household income source (or household occupation) cited by interviewees. It should be noted that, as this is a household survey, this is not necessarily the occupation of the respondent. A majority of respondents in the Mozambique sample were not household heads and their responses frequently refer to the income of household heads (either resident or migrant workers) as the primary income source for the household. This should be borne in mind when reviewing data correlating household income with usage of telephony such as that which is reported later in this annex. The distribution of main household income sources reported by the random sample is as follows.

219
Table B.11: Primary source of household income – random sample
Frequency %age Supported (pensioner, NGO) 16 2.4 Labouring (unskilled) 41 6.2 Trading 43 6.5 Skilled craftsmen 25 3.8 Farming (inc. cattle & fishing) 179 27.1 Business 121 18.3 Government service (inc. teaching) 29 4.4 Professional 7 1.1 Salaried 185 28.0 Other family member 14 2.1 Total 660 100.0
These figures confirm that the respondent households do not constitute a representative sample of the rural adult population, as the proportion of the sample primarily dependent on farming is much lower than would be expected in the rural population as a whole, while the proportion of households primarily dependent on salaried income is higher. This means that some of the findings from the Mozambique sample must be treated with caution, especially where they may be disproportionately affected by income levels. However, comparisons between household occupational groups can be used to provide some comparison between different household occupational categories. As in the other research countries, an abbreviated occupational categorisation was adopted in order to facilitate appropriate correlations.
Table B.12: Simplified occupational categories – random sample
Frequency %age Skilled/professional 46 7.0 Salaried 214 32.4 Business 164 24.8 Farming 179 27.1 Unskilled/supported 57 8.6 Total 660 100.0
Finally, in this context, interviewees were asked a number of questions concerning financial dependence on family members living elsewhere in Tanzania or outside the country. The results indicated that about 35% of interviewees received support

220
of some kind from relatives living elsewhere, with approximately 9% expressing substantial dependence on such support. Migrant workers (rather than diaspora residents) are likely to be responsible for a substantial proportion of these remittances.
B.4 A note on the demographic characteristics of the Mozambique sample As noted above, considerable caution needs to be exercised when considering the representativeness of the sample within the overall Mozambican population, in terms of its level of prosperity, household occupation and other socio-economic criteria. This is particularly evident from two factors: the occupational distribution of the sample and the level of ownership of household assets. Only 27.1% of respondents that identified a primary household occupation in the random sample declared their main income to be derived from farming. This compares with very much higher figures in the Indian and Tanzanian samples. It is likely, therefore, that the sample under-represents farmers and over-represents other household occupational groups. The proportion of the population owning different assets – such as televisions, mobile telephones and motor vehicles - is also much higher than in the Tanzanian sample. This is particularly true, for example, of the figures concerning telephone ownership. While these figures will be affected by the different extensiveness of network availability, teledensity figures worldwide typically correlate closely with GDP per capita, in which Mozambique has a lower national figure than either of the other research countries. It seems almost certain, therefore, that the relative prosperity of the Mozambique sample was high compared with the relative prosperity of those in Tanzania and India, and it is very likely that figures for ownership of assets, including the level of telephone ownership, in the Mozambique sample are not generally representative of the communities in which interviewees live. This means that, even more than in the other research countries, it is not possible to generalise usage levels from the sample data countrywide. However, this does not affect the value of data concerning how those with telephone access make use of that access, which is the primary research target of the study. Indeed, the socio-economic differences between the Mozambique and other samples tend to strengthen rather than reduce the robustness of findings concerning telephony and livelihoods which are consistent in the three country samples. This point is elaborated in the main research report.
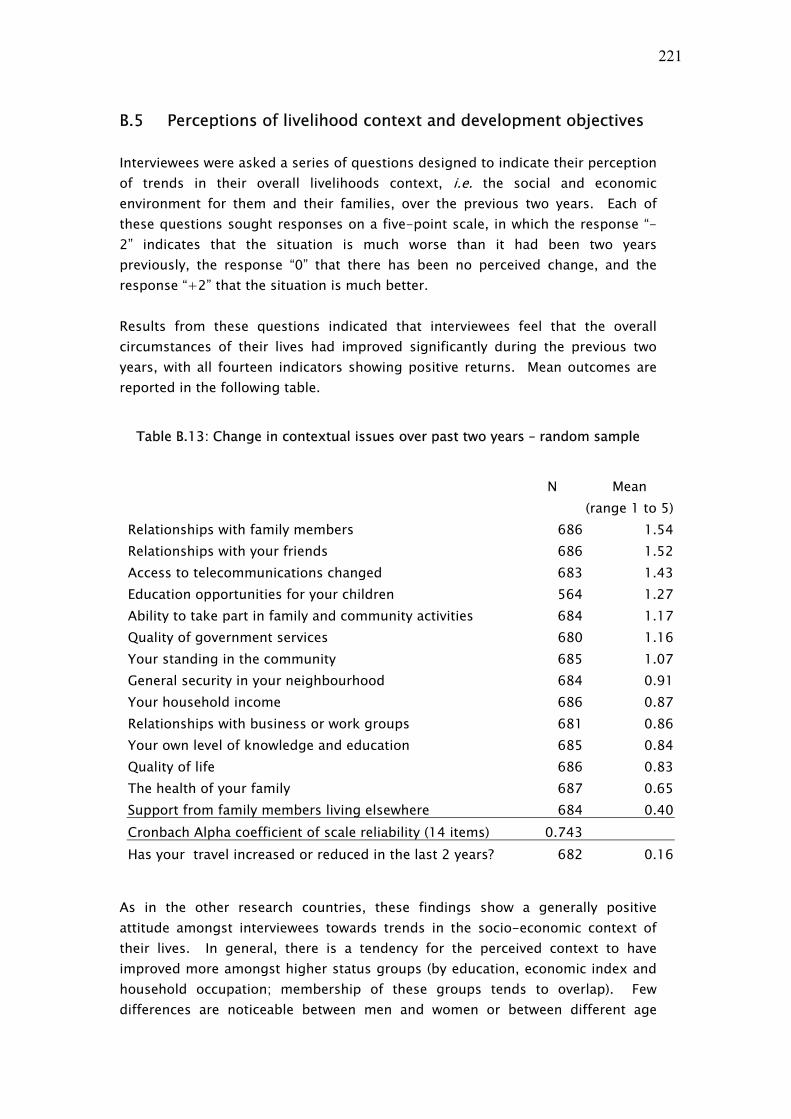
221
B.5 Perceptions of livelihood context and development objectives Interviewees were asked a series of questions designed to indicate their perception of trends in their overall livelihoods context, i.e. the social and economic environment for them and their families, over the previous two years. Each of these questions sought responses on a five-point scale, in which the response “-2” indicates that the situation is much worse than it had been two years previously, the response “0” that there has been no perceived change, and the response “+2” that the situation is much better. Results from these questions indicated that interviewees feel that the overall circumstances of their lives had improved significantly during the previous two years, with all fourteen indicators showing positive returns. Mean outcomes are reported in the following table.
Table B.13: Change in contextual issues over past two years – random sample
N Mean (range 1 to 5)Relationships with family members 686 1.54Relationships with your friends 686 1.52Access to telecommunications changed 683 1.43Education opportunities for your children 564 1.27Ability to take part in family and community activities 684 1.17Quality of government services 680 1.16Your standing in the community 685 1.07General security in your neighbourhood 684 0.91Your household income 686 0.87Relationships with business or work groups 681 0.86Your own level of knowledge and education 685 0.84Quality of life 686 0.83The health of your family 687 0.65Support from family members living elsewhere 684 0.40Cronbach Alpha coefficient of scale reliability (14 items) 0.743 Has your travel increased or reduced in the last 2 years? 682 0.16
As in the other research countries, these findings show a generally positive attitude amongst interviewees towards trends in the socio-economic context of their lives. In general, there is a tendency for the perceived context to have improved more amongst higher status groups (by education, economic index and household occupation; membership of these groups tends to overlap). Few differences are noticeable between men and women or between different age

222
cohorts. However, women perceive more improvement than men in their level of knowledge and education, while older age groups feel more positive about improvements in family interaction and reduced need to travel. (In fact, perceived need to travel decreased among lower status economic and educational groups but increased among higher status groups.) One frequently-cited characteristic of increased availability of telephony is its capacity to reduce the requirement for travel in rural areas. Interviewees were also asked about their reasons for travel and changes in their need to travel during the previous two years. As in the other research countries, interviewees reported a significant reduction in the need to travel during the previous two years.
Table B.14: Change in need to travel – random sample
Frequency %age Greatly reduced 137 20.1 Reduced 249 36.5 No change 95 13.9 Increased 114 16.7 Greatly increased 87 12.8 Total 682 100.0
The past two years broadly coincides with the period in which telephone access has become more widely available, and the two changes seem likely to be linked – with the telephone substituting for travel to make social visits such as visits to family members. Other data supporting this conjecture are reported in section E. Social visits to family and friends were the overwhelming reasons cited for travel, accounting for over 75% of responses in the random sample. Business activities accounted for just under 10% of responses.

223
Table B.15: Main reason for travel – random sample
Frequency %age Visit family and friends 519 77.2 Buy or sell products 65 9.7 Emergencies 31 4.6
Official e.g. apply for documents
8 1.2
Access a phone (fixed or mobile)
2 0.3
Other 47 7.0 Total 672 100.0
Travel to use a telephone was cited as their main reason for travel by only two of the 672 individuals who responded to this question, indicating that travel specifically to use the telephone is exceptional, even amongst those that do not have access locally. This does not mean that people do not have to travel in order to make use of a telephone, but that travel to use a telephone is not the primary reason for travel. In response to a separate question, 74% of the random sample said that they had to “travel” to use a telephone (e.g to use a public access facility or, in some cases, to obtain connectivity for their own mobile phone). Except in emergencies, the telephone seems likely to be used by such people when they are visiting a location with telephone access for other reasons, rather than telephone use being the primary reason for travel. Finally, in this contextual section of the survey, interviewees were asked to identify which of a number of potential development objectives they regarded as priorities for their communities. These data help to place the value of telephony within a context of broader social and economic desiderata. These findings can be presented graphically as follows.

224
Figure B.4: Priorities for development investment – random sample
0% 20% 40% 60% 80% 100%
Build more health clinics
Build more schools
Improve roads
Extend electricity network
Extend mobile network coverage
Improve access to agriculturalinformation
Most important SecondThirdNone of these
This suggests that health, education and transport are the overwhelming priorities for local residents when it comes to development investment within the sample communities. Transport and electricity infrastructure are considered more important than telecommunications network development, though approximately 20% placed this within their top three priorities. The low figure for agricultural information is likely to have been affected by the low proportion of farmers within the sample compared with the proportion of farmers within the overall rural population in Mozambique.
Section C: Ownership, access and use of means of communication This section of the report summarises findings concerning the availability and use of telephony within the research sample.
C.1 Use and frequency of use of ICTs It is important, first of all, to place the ownership and use of telephony within a context of other information and communication technologies.
• Not surprisingly for a low-income African country, broadcast radio is the most widely used information and communication technology available, with almost 100% access and close to universal usage rates. Just under 65% of the sample reported using the radio every day. Access to television is now also widely available, although ownership is still largely confined to the more prosperous. It is lowest, within the sample, among respondents whose household income is primarily dependent on farming and trading, and among low economic and educational status groups. Just under half the sample population reported using a television within the previous

225
twelve months, compared with over 95% reporting use of broadcast radio. Just over 27% of the sample reported using the television every day. (However, for reasons noted in section B, telephone ownership in the sample population is likely to be substantially above that for the population as a whole.)
• Most respondents had access to public telephone kiosks and to mobile
phones, though only a small percentage had access to private fixed lines. About half of those who claimed to have no access to mobiles claimed that they also have no access to public phone facilities. Figures for actual use approximated closely to figures for access. Perceived access to and actual use of email and Internet were very low.
Table B.16: Ownership, access and use of different ICTs – random sample
Ownership Access Use (within
past year) % % %
Radio 93.0 92.4 Television 55.8 57.9 Mobile telephone 41.1 57.8 56.0 SMS 41.1 37.6 Public telephone 67.8 68.9 Private fixed telephone 6.0 8.8 9.6 Email / Internet 2.2 1.5 Fax 2.5 3.9 Personal computer 1.5 1.3
Interviewees were also asked about frequency of use of different ICTs, with the following results. Figures in the table below represent means on the five point scale indicated in the following chart (in which 1 = “not used” and 5 = “one or more times each day”).

226
Table B.17 and Figure B.5 : Frequency of use of different ICTs
ICTs Random Sample
Purposive Sample
Significantly different
n 687 126 Range = 1 to 5 Mean Mean M-W sig
Radio 4.29 4.54 0.033 Television 2.74 2.89 Mobile phones 2.74 3.2 0.01 Public (fixed/cell) 2.54 2.53 SMS 2.09 2.56 0.005 Private fixed phone 1.24 1.21 Fax 1.08 1.12 Personal computer 1.05 1.21 0 Email/internet 1.02 1.07 Telephone combined frequency of use (Kiosk + Mobile + Fixed) 2.16 2.31
0% 20% 40% 60% 80% 100%
Radio
Public (f ixed/cell)
Television
Mobile phones
SMS
Private f ixed phone
Fax
Personal computer
Email/internet
percent of sample
1 or more times a day
1 or more times a w eek
> once a month
< once a month
not used
Television use is highly correlated with economic and educational status, while radio use is generally distributed within the population.

227
Table B.18 : Mean valuations of intensity of use of broadcasting according to socio-economic criteria
Means (range 1 to 5)
Radio TV
Economic status Poorest 4.35 2.00Poor 4.30 2.52Average 4.50 3.61Rich 4.45 4.18Educational status No schooling 3.93 1.32Adult education 4.54 1.84Primary school 4.28 2.60Basic level 4.35 3.35Medium / higher
4.48 4.12
C.2 Telephone ownership and use Mobile telephones are the primary mode of access to telephony, as they are elsewhere in Africa (but not in the Indian sample for this study). Reported access to mobile telephones is widely distributed, but far from universal, as shown in Table B.16 above, and mobile phones belonging to others are widely used by those who do not own telephones of their own, as well as telephone kiosks (which are also not universally accessible). The following chart illustrates the numbers of interviewees identifying different means of access used during the past twelve months by the Mozambique random sample.
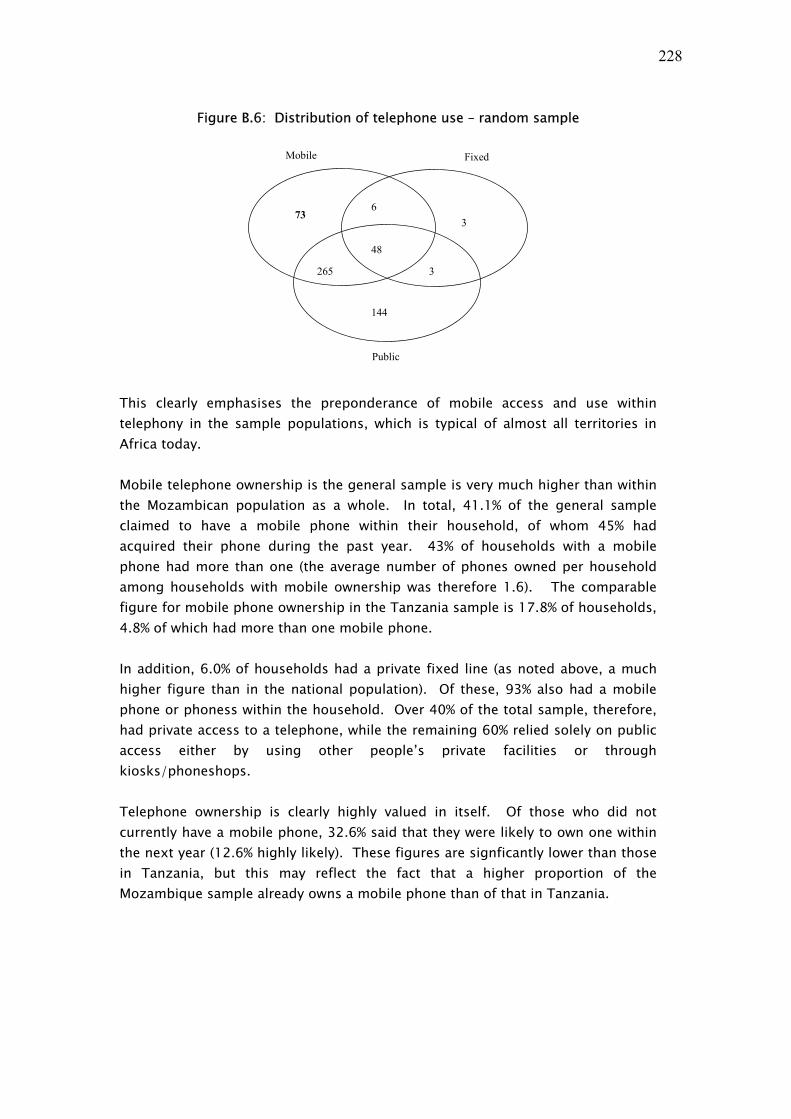
228
Figure B.6: Distribution of telephone use – random sample
Mobile
Public
Fixed
73
265
144
48
3
3 6
This clearly emphasises the preponderance of mobile access and use within telephony in the sample populations, which is typical of almost all territories in Africa today. Mobile telephone ownership is the general sample is very much higher than within the Mozambican population as a whole. In total, 41.1% of the general sample claimed to have a mobile phone within their household, of whom 45% had acquired their phone during the past year. 43% of households with a mobile phone had more than one (the average number of phones owned per household among households with mobile ownership was therefore 1.6). The comparable figure for mobile phone ownership in the Tanzania sample is 17.8% of households, 4.8% of which had more than one mobile phone. In addition, 6.0% of households had a private fixed line (as noted above, a much higher figure than in the national population). Of these, 93% also had a mobile phone or phoness within the household. Over 40% of the total sample, therefore, had private access to a telephone, while the remaining 60% relied solely on public access either by using other people’s private facilities or through kiosks/phoneshops. Telephone ownership is clearly highly valued in itself. Of those who did not currently have a mobile phone, 32.6% said that they were likely to own one within the next year (12.6% highly likely). These figures are signficantly lower than those in Tanzania, but this may reflect the fact that a higher proportion of the Mozambique sample already owns a mobile phone than of that in Tanzania.
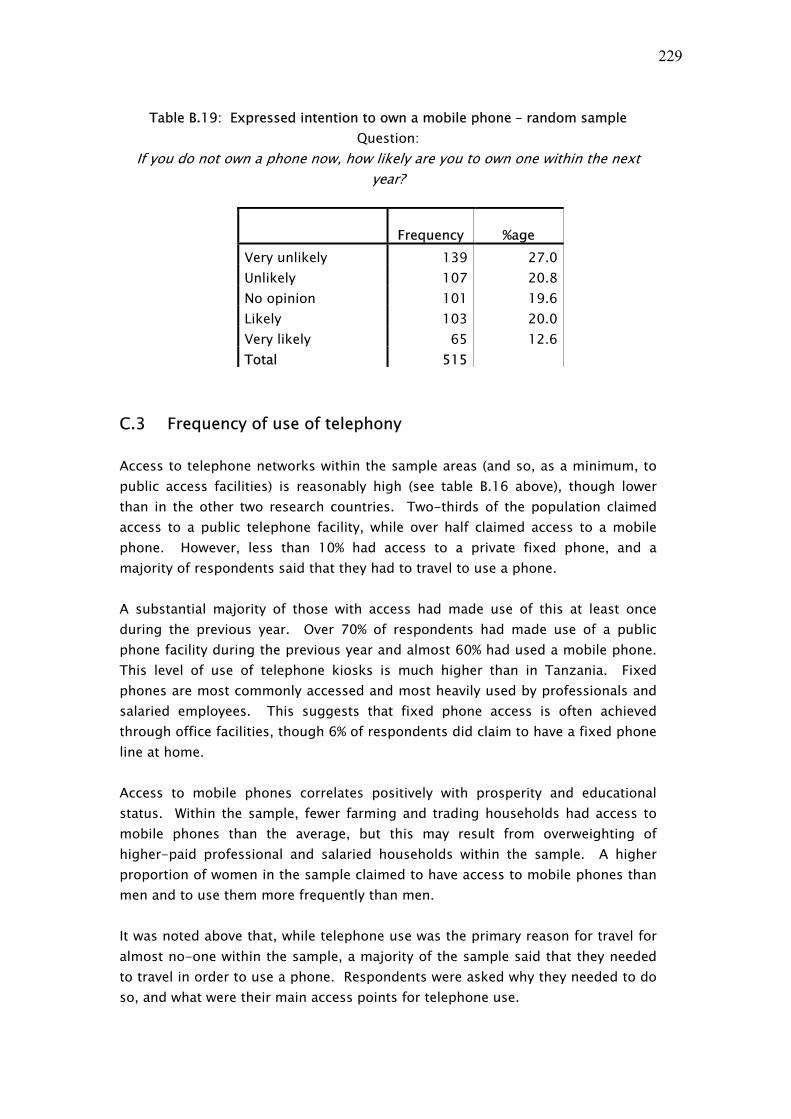
229
Table B.19: Expressed intention to own a mobile phone – random sample Question:
If you do not own a phone now, how likely are you to own one within the next year?
Frequency %age Very unlikely 139 27.0Unlikely 107 20.8No opinion 101 19.6Likely 103 20.0Very likely 65 12.6Total 515
C.3 Frequency of use of telephony Access to telephone networks within the sample areas (and so, as a minimum, to public access facilities) is reasonably high (see table B.16 above), though lower than in the other two research countries. Two-thirds of the population claimed access to a public telephone facility, while over half claimed access to a mobile phone. However, less than 10% had access to a private fixed phone, and a majority of respondents said that they had to travel to use a phone. A substantial majority of those with access had made use of this at least once during the previous year. Over 70% of respondents had made use of a public phone facility during the previous year and almost 60% had used a mobile phone. This level of use of telephone kiosks is much higher than in Tanzania. Fixed phones are most commonly accessed and most heavily used by professionals and salaried employees. This suggests that fixed phone access is often achieved through office facilities, though 6% of respondents did claim to have a fixed phone line at home. Access to mobile phones correlates positively with prosperity and educational status. Within the sample, fewer farming and trading households had access to mobile phones than the average, but this may result from overweighting of higher-paid professional and salaried households within the sample. A higher proportion of women in the sample claimed to have access to mobile phones than men and to use them more frequently than men. It was noted above that, while telephone use was the primary reason for travel for almost no-one within the sample, a majority of the sample said that they needed to travel in order to use a phone. Respondents were asked why they needed to do so, and what were their main access points for telephone use.
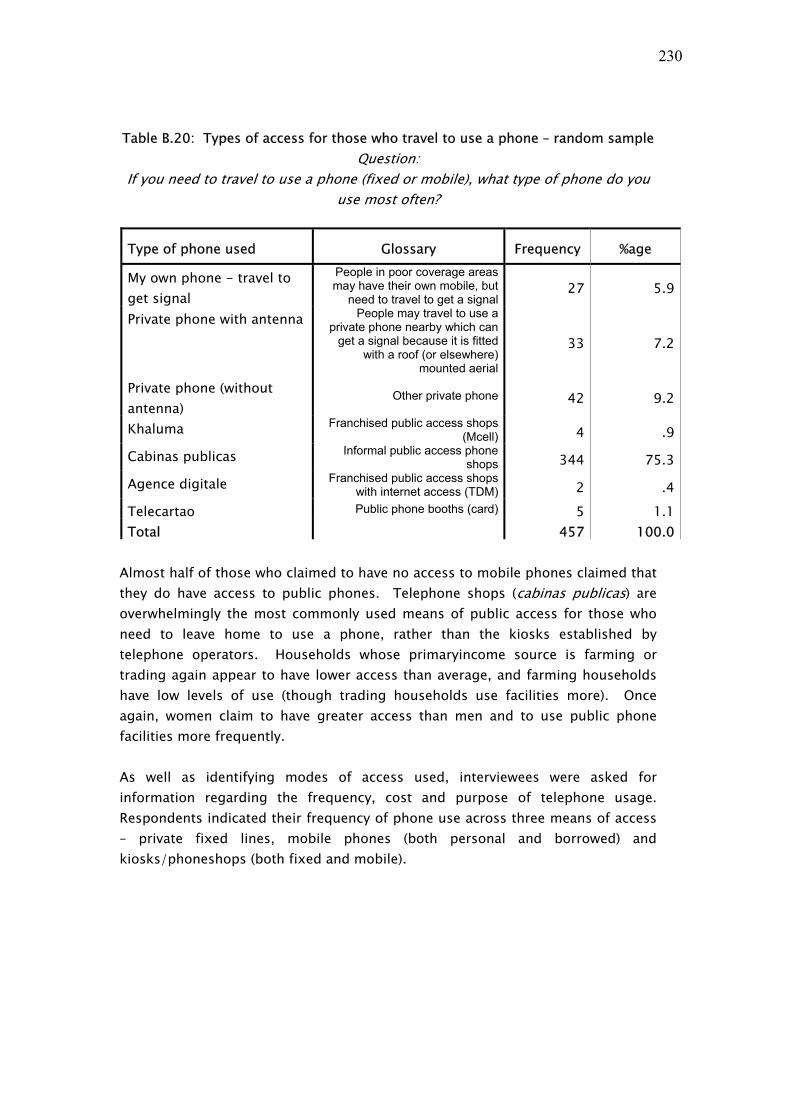
230
Table B.20: Types of access for those who travel to use a phone – random sample
Question: If you need to travel to use a phone (fixed or mobile), what type of phone do you
use most often?
Type of phone used Glossary Frequency %age
My own phone - travel to get signal
People in poor coverage areas may have their own mobile, but
need to travel to get a signal 27 5.9
Private phone with antenna People may travel to use a private phone nearby which can
get a signal because it is fitted with a roof (or elsewhere)
mounted aerial
33 7.2
Private phone (without antenna)
Other private phone 42 9.2
Khaluma Franchised public access shops (Mcell) 4 .9
Cabinas publicas Informal public access phone shops 344 75.3
Agence digitale Franchised public access shops with internet access (TDM) 2 .4
Telecartao Public phone booths (card) 5 1.1Total 457 100.0
Almost half of those who claimed to have no access to mobile phones claimed that they do have access to public phones. Telephone shops (cabinas publicas) are overwhelmingly the most commonly used means of public access for those who need to leave home to use a phone, rather than the kiosks established by telephone operators. Households whose primaryincome source is farming or trading again appear to have lower access than average, and farming households have low levels of use (though trading households use facilities more). Once again, women claim to have greater access than men and to use public phone facilities more frequently. As well as identifying modes of access used, interviewees were asked for information regarding the frequency, cost and purpose of telephone usage. Respondents indicated their frequency of phone use across three means of access – private fixed lines, mobile phones (both personal and borrowed) and kiosks/phoneshops (both fixed and mobile).

231
Table B.21: Frequency of use of telephony types – random sample
once or
more p.d. once or
more p.wk >once a month
<once a month not at all
Public phone 9.9 16.9 19.7 23.6 29.8Mobile phone 27.5 12.3 9.0 9.0 42.1SMS 13.6 10.8 7.8 6.6 61.1Private fixed phone 2.3 1.8 3.0 2.9 89.9Email/Internet 0.0 0.2 0.6 0.8 98.5
These figures can be represented graphically as follows.
Figure B.7: Frequency of use of telephony types – random sample
0% 20% 40% 60% 80% 100%
Public phone
Mobile phone
SMS
Private f ixedphone
Email/Internet
once or more p.d.
once or more p.w k
>once a month
<once a month
not at all
As these data show, mobile phones are not only used for voice telephony. Just over 40% of mobile phone users reported using phones to send SMS (text) messages. Correlations between frequency of use of various means of access and the composite economic index show a strong relationship between intensity of use of mobile phones (both voice and SMS) and wealth. Whilst correlations between economic status and intensity of use of public access (the most commonly used means of access) are also evident, they are weaker. This indicates that whilst there is an overall trend for the better off to make more intensive use of phones, this is particularly true of mobile phones.
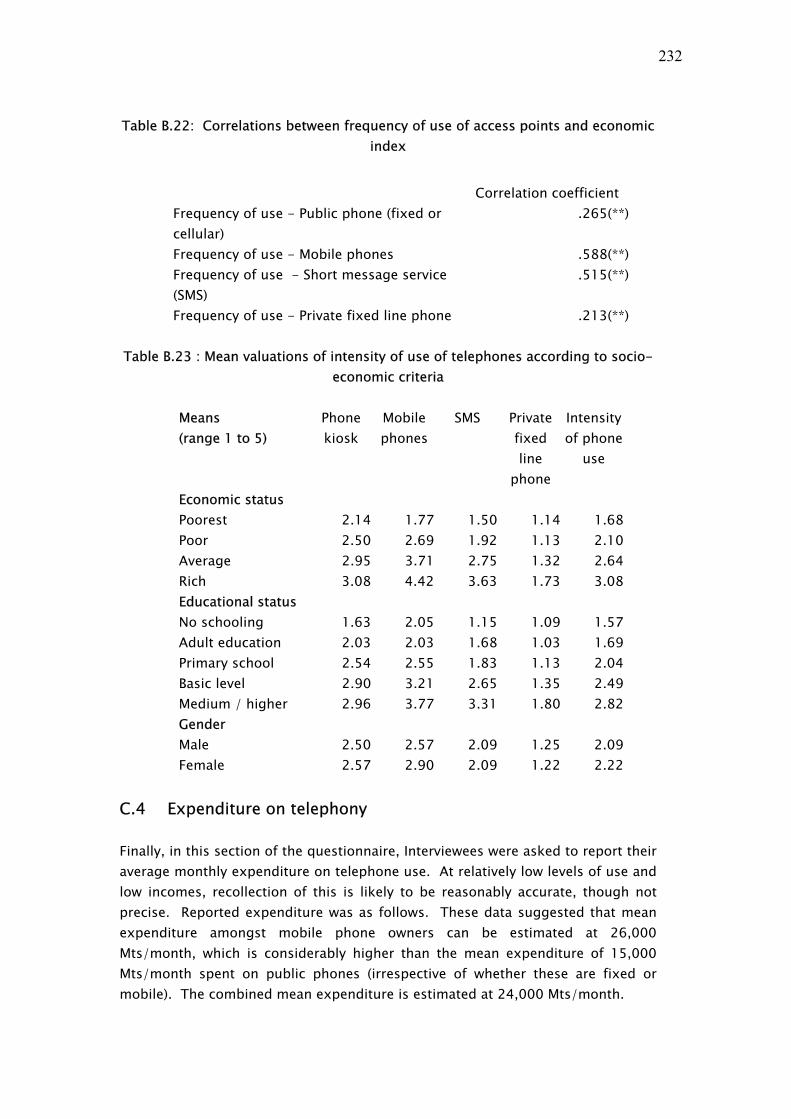
232
Table B.22: Correlations between frequency of use of access points and economic index
Correlation coefficient
Frequency of use - Public phone (fixed or cellular)
.265(**)
Frequency of use - Mobile phones .588(**) Frequency of use - Short message service (SMS)
.515(**)
Frequency of use - Private fixed line phone .213(**) Table B.23 : Mean valuations of intensity of use of telephones according to socio-
economic criteria
Means (range 1 to 5)
Phone kiosk
Mobile phones
SMS Private fixed line
phone
Intensity of phone
use
Economic status Poorest 2.14 1.77 1.50 1.14 1.68 Poor 2.50 2.69 1.92 1.13 2.10 Average 2.95 3.71 2.75 1.32 2.64 Rich 3.08 4.42 3.63 1.73 3.08 Educational status No schooling 1.63 2.05 1.15 1.09 1.57 Adult education 2.03 2.03 1.68 1.03 1.69 Primary school 2.54 2.55 1.83 1.13 2.04 Basic level 2.90 3.21 2.65 1.35 2.49 Medium / higher 2.96 3.77 3.31 1.80 2.82 Gender Male 2.50 2.57 2.09 1.25 2.09 Female 2.57 2.90 2.09 1.22 2.22
C.4 Expenditure on telephony Finally, in this section of the questionnaire, Interviewees were asked to report their average monthly expenditure on telephone use. At relatively low levels of use and low incomes, recollection of this is likely to be reasonably accurate, though not precise. Reported expenditure was as follows. These data suggested that mean expenditure amongst mobile phone owners can be estimated at 26,000 Mts/month, which is considerably higher than the mean expenditure of 15,000 Mts/month spent on public phones (irrespective of whether these are fixed or mobile). The combined mean expenditure is estimated at 24,000 Mts/month.

233
Significant variations in expenditure are evident in different social categories. In particular:
• Expenditure on telephony is greater amongst higher educational and economic status groups, but does not appear to be sensitive to age or gender.
• Average total expenditure is highest for households dependent on skilled/professional incomes and is much lower amongst households dependent on farming income than other household occupation groups.
• Households dependent on salaries are the only household occupational group to spend more on mobile phones than public access. Households dependent on farming spend the lowest proportion of total expenditure on mobiles.
• Telephone owners also make extensive use of public phones, on which they spend 44% their total expenditure on phones.
Not surprisingly, expenditure on mobile telephone use is much higher among the more prosperous than among the poor. However, this does not mean that telephone expenditure is less important as a proportion of disposable income for the poor. As noted earlier, data for declared household income need to be treated with some caution. Table B.24 below divides the population into four prosperity categories described in section B.2 above (according to four prosperity indicators, only one of which is based on declared income), and indicates the percentage of declared income which each category spends on telecommunications. The relatively low number of responses which can be included in the table should also be noted. While the actual figures given for percentage expenditure should be treated with significant caution, therefore, the division into prosperity categories – and the pattern of differences between them – is more robust.
Table B.24 : Proportion of declared household income spent on telephones
%
Poorest 4.2
Poor 2.8
Medium 2.0
Rich 1.0
Total

234
These figures need to be understood in terms of the behaviour of those low-income individuals and households making the expenditure. Expenditure on telephone costs includes both:
• expenditure which substitutes for other expenditure (e.g. on transport or postal services), which may reduce total household expenditure; and
• additional expenditure which would not occur if telephones were not available, which may increase total household expenditure.
It is likely that poorer households tend to use the telephone more for substitution and for high priority uses such as emergencies (for which other communications channels are less highly suited), whereas those with higher economic status are more likely to incur additional expenditure, for example through casual (rather than priority) social calling. This interpretation is reinforced by the high association of telephone use with emergencies which is revealed in section D. Further research is needed in this area. One implication for telephone operators is that significant levels of revenue are likely to be derived even from people on very low incomes – a finding which reinforces that in an earlier KaR study of telephony usage in Uganda, Ghana and Botswana.
Section D: Information and communication flows ICTs, including telephony, are facilitating technologies which enable individuals and communities to interact more or less effectively with one another. Any new technology that is introduced – such as television, voice telephony or the Internet – enters into an established pattern of information and communication flows. While it may adapt to or disrupt these flows, its impact will be closely related to them, and an understanding of established information and communication flows is critical to assessing the impact and implications of new ICTs as they are deployed. This section of the annex looks at the most important communication issues and channels reported by interviewees through their questionnaire responses. An extensive series of questions was asked during interviews to establish the priority information needs of interviewees and the channels used by them to satisfy those needs. These questions provide baseline evidence for an assessment of the impact which telephony is having or may have on information and communication flows and thereby on access to livelihoods assets. Their results are among the most significant findings of this study as a whole.
D.1 Confidence in information channels The first set of questions of this type sought information about the confidence placed by interviewees in different sources of information, i.e. the individuals or
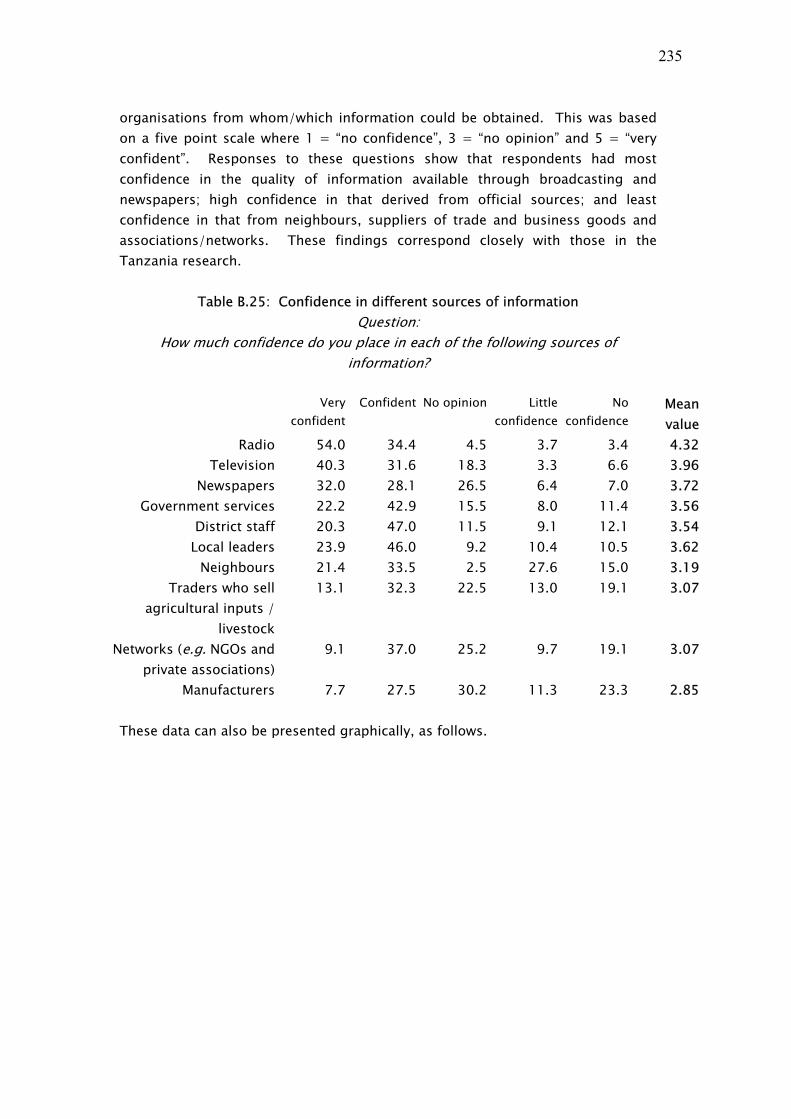
235
organisations from whom/which information could be obtained. This was based on a five point scale where 1 = “no confidence”, 3 = “no opinion” and 5 = “very confident”. Responses to these questions show that respondents had most confidence in the quality of information available through broadcasting and newspapers; high confidence in that derived from official sources; and least confidence in that from neighbours, suppliers of trade and business goods and associations/networks. These findings correspond closely with those in the Tanzania research.
Table B.25: Confidence in different sources of information Question:
How much confidence do you place in each of the following sources of information?
Very
confidentConfident No opinion Little
confidenceNo
confidence Mean value
Radio 54.0 34.4 4.5 3.7 3.4 4.32Television 40.3 31.6 18.3 3.3 6.6 3.96
Newspapers 32.0 28.1 26.5 6.4 7.0 3.72Government services 22.2 42.9 15.5 8.0 11.4 3.56
District staff 20.3 47.0 11.5 9.1 12.1 3.54Local leaders 23.9 46.0 9.2 10.4 10.5 3.62
Neighbours 21.4 33.5 2.5 27.6 15.0 3.19Traders who sell
agricultural inputs / livestock
13.1 32.3 22.5 13.0 19.1 3.07
Networks (e.g. NGOs and private associations)
9.1 37.0 25.2 9.7 19.1 3.07
Manufacturers 7.7 27.5 30.2 11.3 23.3 2.85 These data can also be presented graphically, as follows.

236
Figure B.8: Confidence in different sources of information
0% 20% 40% 60% 80%100%
Radio
Television
Newspapers
Government services
District staff
Local leaders
Neighbours
Traders who sell agriculturalinputs / livestock
Very confidentConfidentNo opinionLittle confidenceNo confidence
Interviewees were also asked about changes in the frequency of their consultation of these sources over the past two years (using a five point scale where -2 = “much less”, 0 = “no change” and +2 = “much more”).

237
Table B.26: Changes in frequency of consultation of different sources of information Question:
How has the frequency with which you consult … changed over the last 2 years? Much more
More No change
Less Much less
Radio 47.5 31.8 9.4 7.1 4.2Television 32.8 25.3 21.8 9.6 10.5
Newspapers 23.7 23.5 28.3 10.3 14.2Government services 21.6 29.0 27.4 11.6 10.3
District staff 14.7 34.5 29.1 12.7 8.9Local leaders 18.3 33.1 23.9 14.8 10.0
Neighbours 20.3 21.9 19.2 21.0 17.6Traders who sell agricultural inputs
/ livestock10.0 23.7 32.2 18.1 16.0
Networks 9.2 24.8 33.9 14.5 17.6Manufacturers 4.7 16.4 36.5 19.4 22.9
These data can also be presented graphically, as follows:
Figure B.9 : Changes in confidence in channels of information/communication
-0.5 -0.3 -0.1 0.1 0.3 0.5 0.7 0.9 1.1 1.3 1.5
Manufacturers
Traders
Networks
Neighbours
Newspapers
District staff
Local leaders
Government services
TV
Radio
Use of radio and television as an information source has clearly increased greatly in the past two years, and it would be worth exploring the reasons for this through further research (for example, any changes that may have occurred in the style, content or diversity of programming). Increased use is also reported of information from other media sources and government officials. Once again, there are few differences in behaviour according to gender in these data, with the exception of sourcing information from officials (whom women are

238
less likely to approach). Men also reported a stronger increase in the use of television and radio. Use of traditional sources of information such as local leaders and government officials has increased most among lower educational groups, older groups and non-phone users, while it is those with higher economic and educational status who are most likely to have increased their use of television and radio.
D.2 Importance of information/communication types and preferred information/communication channels
Each interviewee was asked a series of questions concerning the importance to her/him of different types of information and communication. These questions sought responses on a five-point scale, in which the response “-2” indicates that an information type is “unimportant”, the response “0” indicates “no opinion” or “not applicable” and the response “+2” indicates that it is “very important”. Responses to these questions are reported in the following tables and charts.
Table B.27 : Importance of types of information/communication
Question: How important are the following types of information for you in general?
Preferred means of communication
(%ages)
Mean of importan
ce (5 point scale)
Face-to-
face
Radio Telephone
Other No response (i.e.
not relevan
t)
Telephone
%age
Urgent e.g. emergencies, deaths, sickness - Importance 1.53 15 9 56 18 2 56News about relatives - Importance 1.47 16 4 56 23 2 56How to prevent and treat illness within the family - Importance 1.22 53 23 2 17 5 2News (local and international) - Importance 1.16 11 62 2 19 7 1News about friends - Importance 1.08 40 4 34 17 5 34Weather information - Importance 1.06 10 53 1 24 12 1Social and religious events e.g. marriages - Importance 0.99 48 4 14 29 6 14Job opportunities - Importance 0.56 35 25 2 18 20 1Remittances - Importance 0.46 30 5 15 28 22 15Crop management - Importance 0.45 45 16 1 18 21 2

239
Availability and costs of inputs to purchase - Importance 0.45 65 10 2 24 1Education opportunities (schools and further education) - Importance 0.45 48 12 1 19 20 1Market prices (for selling) - Importance 0.43 65 10 2 11 13 2Marketing information e.g. new markets - Importance 0.42 63 13 2 5 17 1new products & activities e.g. pesticides, seeds - Importance 0.34 46 16 0 15 23 0Transport and driver schedules - Importance 0.33 63 8 0 10 19 1Livestock management & health - Importance 0.32 40 15 1 18 27 0Government and legal requirements (e.g. taxes, regulations) - Importance 0.30 38 22 1 18 22 1Entertainment - Importance 0.23 50 9 9 16 16 9Information on clients and debtors e.g. ability to pay - Importance 0.12 39 11 3 13 34 2Availability of credit, and subsidies, pensions, vulnerability assistance - Importance 0.11 37 13 1 13 35 0Business skills - Importance 0.10 43 16 0 38 3 1Romance - Importance 0.01 54 2 12 11 22 12Information on other producers (collaborators, competitors) - Importance 0.00 39 12 0 17 32 0Gossip - Importance -1.12 52 2 4 12 30 4
These data can also be presented graphically, as in the following chart, in which responses are presented in order of declared importance.

240
Figure B.10: Importance of types of information/communication
0% 20% 40% 60% 80% 100%
Urgent e.g. emergencies, deaths, sickness
News abo ut relatives
Ho w to prevent and treat illness within the family
News (lo cal and internatio nal)
News abo ut friends
Weather info rmatio n
So cial and religio us events e.g. marriages
Jo b o ppo rtunities
Remittances
Cro p management
A vailability and co sts o f inputs to purchase
Educatio n o ppo rtunities (scho o ls and further educatio n)
M arket prices (fo r selling)
M arketing info rmatio n e.g. new markets
new pro ducts & activit ies e.g. pestic ides, seeds
Transpo rt and driver schedules
Livesto ck management & health
Go vernment and legal requirements (e.g. taxes, regulatio ns)
Entertainment
Info rmatio n o n clients and debto rs e.g. ability to pay
A vailability o f credit, and subsidies, pensio ns, vulnerability assistance
B usiness skills
Ro mance
Info rmatio n o n o ther pro ducers (co llabo rato rs, co mpetito rs)
Go ssip
Very importantImportantNo opinionNot very importantUnimportantNo response
These data show clearly the very high importance attached to urgent and emergency requirements for information and communication, and to social information and communication, particularly within the family. This finding is consistent with those in the other research countries. Lower importance is attached by the sample as a whole to other information and communication needs. When looking at differences between various groups, the following can be noted:
• There are fewest differences between age groups. The importance attributed to types of information is least sensitive to age and gender.
• Where gender differences do occur, men tend to place a higher value on information, with the exception of social and religious events.
• Many high saliency types of information/communication are regarded as equally important across education groups – for example, weather

241
information, news, social matters (urgent, news of friends and family, events).
• Information/communication is more highly valued in high economic status groups (composite index, phone ownership). Two exceptions to this are job opportunities and transport schedules.
• Business related information is of little value to those with low educational status.
• Social and religious events, government information and news tend to be more important amongst older groups.
• Information on crops and livestock is most highly regarded by the oldest age group.
Interviewees were also asked to identify the primary means of communication which they use or would use for each type of information. These data are presented graphically in the order of declared importance. In this chart:
• bars in variants of blue signify means of communication based on the telephone
• bars in variants of purple signify messenger or postal services • bars in variants of red signify means based on the broadcast media • bars in variants of yellow signify means based on the print media • and bars in variants of green signify means based on face-to-face
communication.

242
Figure B.11 : Preferred means of communication
0% 20% 40% 60% 80% 100%
Urgent e.g. emergencies, deaths, sickness
News about relatives
How to prevent and treat illness within the family
News (local and international)
News about friends
Weather information
Social and relig ious events e.g. marriages
Job opportunities
Remittances
Crop management
Availability and costs of inputs to purchase
Education opportunities (schools and further education)
Market prices (for selling)
Marketing information e.g. new markets
new products & activities e.g. pesticides, seeds
Transport and driver schedules
Livestock management & health
Government and legal requirements (e.g. taxes, regulations)
Entertainment
Information on clients and debtors e.g. ability to pay
Availability of credit, and subsidies, pensions, vulnerability assistance
Business skills
Romance
Information on other producers (collaborators, competitors)
Gossip
PhoneSMSInternetMessengerLettersRadioTVNewspapersAdvertsNetworksVillage info centreLocal leadersFace-to-faceNo response (i.e. not relevant)
Looked at in this way, information sources can be divided into three broad categories:
• The telephone is by far the most important information channel for emergency use and for important social communications within the family, and is used for a high proportion of such needs. This contrasts with its relative unimportance in other areas of information flow.
• Broadcast radio is overwhelmingly the most important channel for general information such as local and international news and weather.
• Face-to-face communications is by far the most important channel for information overall, and is overwhelmingly the most important channel for education, farming and business information.
These findings are consistent with those in the other research countries. They imply that the telephone is valued most for high priority and social/family interactions, but that it has not supplanted face-to-face communications in

243
business activity, where the nuances of body language are more important, where interactions may be with people who are less trusted and where established patterns of business behaviour may be entrenched. General media sources – in Africa, particularly broadcast radio – are highly valued for general information needs, in meeting which the telephone plays almost no part at present.
The predominance of face-to-face communications is especially evident from the following table, which presents a weighted importance index for each communication channel. This index is the sum of the importance rating given to each type of information for which the medium is the preferred means of communication. Therefore, it not only reflects how many types of information for which each medium is the preferred means of communication, but also takes account of the rated importance attributed to each type of information.
Figure B.12: Weighted importance of means of communication
0 1 2 3 4 5 6 7
SUM IMPORTANCE - face to face
SUM IMPORTANCE - radio
SUM IMPORTANCE - phone
SUM IMPORTANCE - TV
SUM IMPORTANCE - newspapers
SUM IMPORTANCE - messengers
SUM IMPORTANCE - letters by post
SUM IMPORTANCE - local leaders
SUM IMPORTANCE - adverts
SUM IMPORTANCE - village information
SUM IMPORTANCE - SMS
SUM IMPORTANCE - internet
SUM IMPORTANCE - local networks
weighted index
The following charts break down results for the most important communications media according to key socio-economic categories. A full statistical disaggregation of these data is available in the electronic datasets of project materials which can be obtained on application from the research partners.
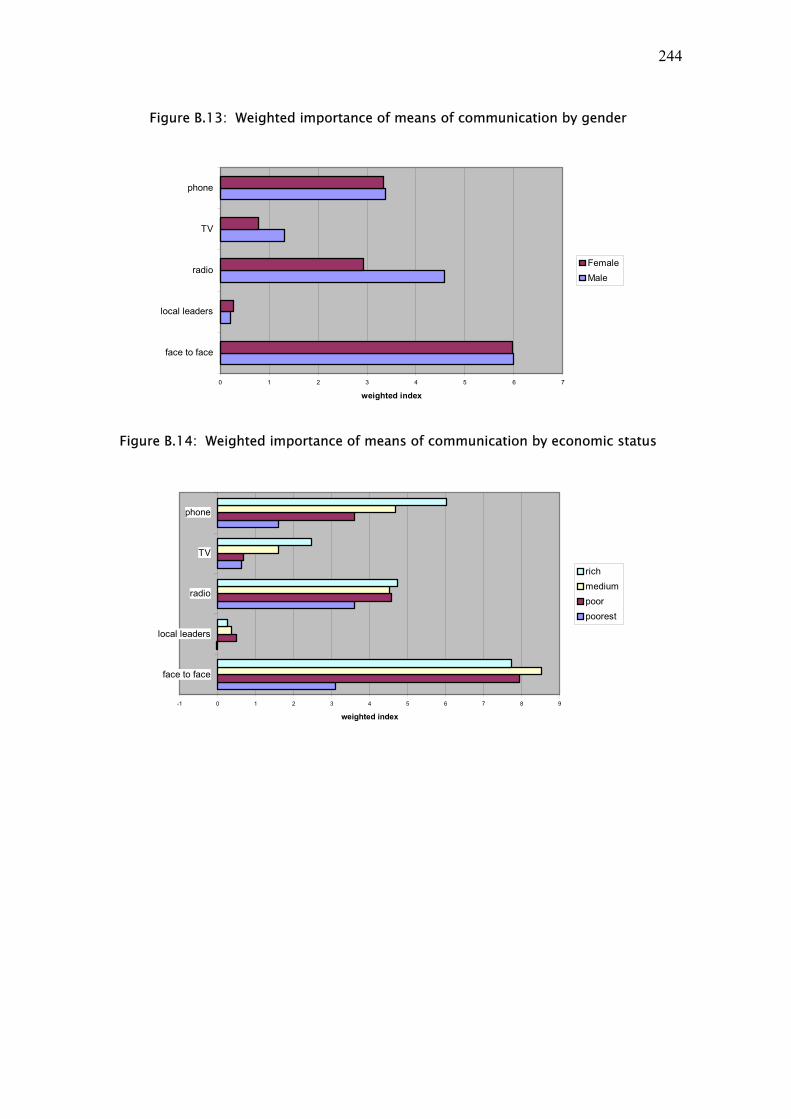
244
Figure B.13: Weighted importance of means of communication by gender
0 1 2 3 4 5 6 7
face to face
local leaders
radio
TV
phone
weighted index
FemaleMale
Figure B.14: Weighted importance of means of communication by economic status
-1 0 1 2 3 4 5 6 7 8 9
face to face
local leaders
radio
TV
phone
weighted index
richmediumpoorpoorest

245
Figure B.15: Weighted importance of means of communication by educational status
-1 0 1 2 3 4 5 6 7 8 9
face to face
local leaders
radio
TV
phone
weighted index
Medium BasicPrimaryAdult educNo formal
As with the previous data, these results are largely insensitive to age and gender, though men tend to rely more on broadcast radio than women. More educated groups tend to make more use of television and newspapers and of telephones and SMS, as do the higher economic status groups with which they substantially overlap. However, the use of personal communications means (face-to-face communications, conversations with local leaders etc.) does not vary according to educational status. Farmers place more value on the radio than other occupational groups, but less on face-to-face communications (although this remains for them the leading communications channel).
Section E: Telephony and livelihoods This section of the report summarises evidence derived from the survey of the impact which telephony has on livelihoods, particularly on vulnerability and on three of the five key livelihoods assets – financial, social and human capital (in this context, primarily income and savings, networking and the acquisition of information and knowledge).
E.1 Correlations between perceptions of telecoms access and other contextual issues
The impact of improving access to telecommunications services on livelihoods has been tested using the correlations presented in Section B.4. This indicates that overall, perceived improvement in access to telecommunications correlates with perceived improvements in livelihoods in general.

246
When looking at social groupings within the sample, there are widespread associations between perceived improved access to telecommunications and perceived improvement in human and financial capital, but less significant relationships with perceived improvement in social capital. This differs from the findings in the other countries. There are also widespread links between improvements in access to telecommunications and overall quality of life, and improvements in government services. However, it should be noted that these relationships are not evidence of any causal link. It is most likely that perceptions of improvements overall are related to particular socio-economic factors or to a general sense of socio-economic progress. Relationships should also be viewed in light of the perceived value of telephony for different livelihoods assets, which are discussed below - in particular the very low valuation of telephony for human capital (information and knowledge acquisition). A further test was undertaken to investigate the relationship between declared intensity of use of telephones and the contextual indicators reported in section B.4, i.e. to explore the extent to which more intensive use of phones is associated with greater perceived benefits. The following table shows that for the random sample as a whole, there are few relationships between frequency of use and perceived improvements in livelihoods. Such correlations as do exist suggest that more intensive users of mobile phones (higher status groups) perceive a greater improvement in quality of life, while a lack of correlations suggests that public phone users do not perceive any increased improvement in livelihoods with more intensive use.
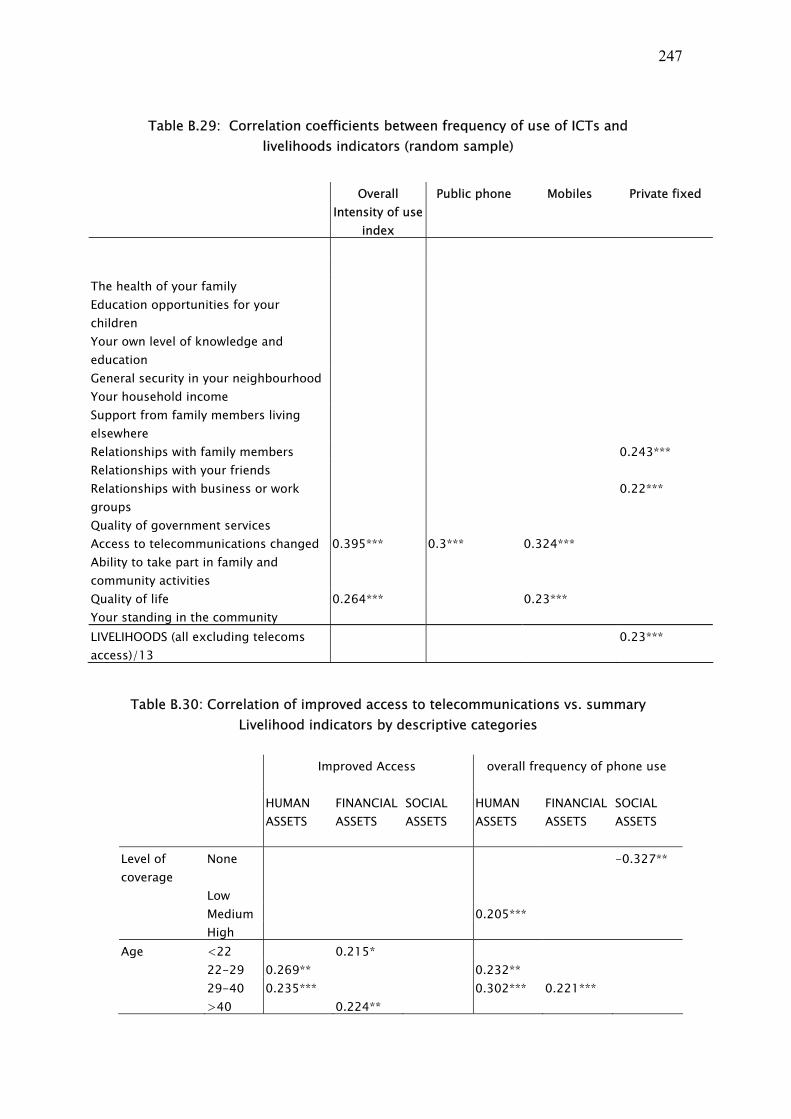
247
Table B.29: Correlation coefficients between frequency of use of ICTs and livelihoods indicators (random sample)
Overall
Intensity of use index
Public phone Mobiles Private fixed
The health of your family Education opportunities for your children
Your own level of knowledge and education
General security in your neighbourhood Your household income Support from family members living elsewhere
Relationships with family members 0.243*** Relationships with your friends Relationships with business or work groups
0.22***
Quality of government services Access to telecommunications changed 0.395*** 0.3*** 0.324*** Ability to take part in family and community activities
Quality of life 0.264*** 0.23*** Your standing in the community LIVELIHOODS (all excluding telecoms access)/13
0.23***
Table B.30: Correlation of improved access to telecommunications vs. summary Livelihood indicators by descriptive categories
Improved Access overall frequency of phone use
HUMAN
ASSETS FINANCIAL ASSETS
SOCIAL ASSETS
HUMAN ASSETS
FINANCIAL ASSETS
SOCIAL ASSETS
Level of coverage
None -0.327**
Low Medium 0.205*** High
Age <22 0.215* 22-29 0.269** 0.232** 29-40 0.235*** 0.302*** 0.221*** >40 0.224**

248
Gender Male 0.210*** 0.219*** 0.203*** Female
Education None 0.237* 0.275* 0.252* Adult 0.419** 0.389* 0.310* 0.341* Primary basic medium 0.342* 0.365**
Composite index
Poorest 0.292**
poor medium rich 0.497*** 0.325**
Occupation farmer 0.217** 0.339*** unskilled
business salaried skilled/prof
0.450** 0.395*
Phone cat non-user
0.231* 0.274**
user owner 0.246***
Intensity of use
lowest 0.217*
low medium high 0.260*** 0.241**
Together, these findings suggest that perceived access to telecommunications is more commonly associated with perceived improvements in livelihoods than is declared intensity of use of phones, though the difference between the two telephony factors is not as marked as in other countries within the survey. (It should, again, be borne in mind that associations in this context do not necessarily represent any causal link, but that both associated factors may result from a common third factor such as economic prosperity.)
E.2 Perceptions of the overall value of telephony The data presented in section E.1 are concerned with broad attitudes towards the social and economic context in which respondents live, and offer only limited and indirect evidence concerning the impact of telephony on livelihoods. Much more valuable data are derived from three sections of the questionnaire which asked respondents to identify the value of telephony to them or to their households. Responses to the first of these sets of questions, concerning respondents’ assessment of social, financial and human capital (knowledge) benefits in general, as defined and understood by the respondents themselves, are reported in section

249
E.2 of this annex. Responses to the second set of questions, related to much more detailed aspects of behaviour, are reported in sections E.3 and E.4. Findings from these questions build on the evidence concerning the relative importance of different information and communications needs and preferred channels of communications which is described in section D above. That analysis included a graphical summary of the preferred channels of communication for different purposes, according to the degree of importance attached to the issues concerned. It suggested that the telephone was highly likely to be chosen as the most appropriate means of communication for emergencies and social communications by those within the sample, but that it was relatively little used for business communications (where face-to-face communications were strongly preferred) and that it was hardly used at all to secure information or knowledge (where broadcast radio was overwhelmingly the most important channel available). From a livelihoods point of view, this suggests that the telephone is substantially used to protect individuals and households against sudden and urgent vulnerabilities, and for mainstream social interaction (particularly within the family); that its impact on financial capital derives from savings made rather than income earned; and that it makes almost no contribution to human capital (in the sense of information-gathering). The first of these three sets of questions asked respondents to indicate their primary, second and third most important uses of a telephone. The results of these questions (as proportions of the total sample, including non-users) are set out in the following table.
Table B.31: Primary, secondary and tertiary uses of mobile telephony – general sample
Mobile phone Fixed phone Communication with family
29.7 12.4 4.1 33.3 22.1 3.9
Emergencies 11.8 22.1 8.6 19.9 22.6 11.4Communication with friends
2.5 7.7 18.3 6.6 10.6 24.5
Business 5.2 1.7 2.3 3.2 1.9 3.5Advisory information
1.2 1.2 4.8 2.3 2.9 6.8
Gaining new knowledge
0.6 1.2 0.7 0.7 0.9 1.0
These data confirm that, for the sample population, the primary uses of a telephone, of whatever kind, are for emergencies and social communication within

250
the family. (Between these two main purposes, the Mozambique sample priorities family communications, where the Tanzania sample prioritises emergency use.) Social communication with non-family friends and business use are also significant, particularly – as third priority, the former - but very much less significant than communication within the family. From a livelihoods perspective, this suggests that the telephone’s key roles are in social networking and in reducing vulnerability at times of crisis, in particular through family support. Business use (the acquisition or management of financial assets) is significant for a relatively small proportion of the population, and more analysis of this is offered below. However, use of the telephone to develop knowledge (human assets) is minimal. Strategies to make use of the telephone as an instrument for social and economic development need to build on this pattern of use and are unlikely to be successful if they ignore it. The second series of questions asked respondents to evaluate their investment in using a telephone in respect of three broad types of activity, which equate to the livelihoods assets under investigation. The results of these questions further reinforce the findings described above. Table B.32: Perceived impact of telephony on livelihoods assets – general sample
Question: How helpful has your investment in the use of a phone been regarding …?
%age of user sample very
helpful helpful no
opinion unhelpful very
unhelpful Mean value
Social communications (social capital)
49.9 32.8 13.4 1.7 2.2 +1.26
Economic activities (financial capital)
15.1 24 31.1 6.1 23.7 +0.01
Knowledge and education (human capital)
6.3 18 42 4.7 29 -0.32
These data can usefully be presented graphically.
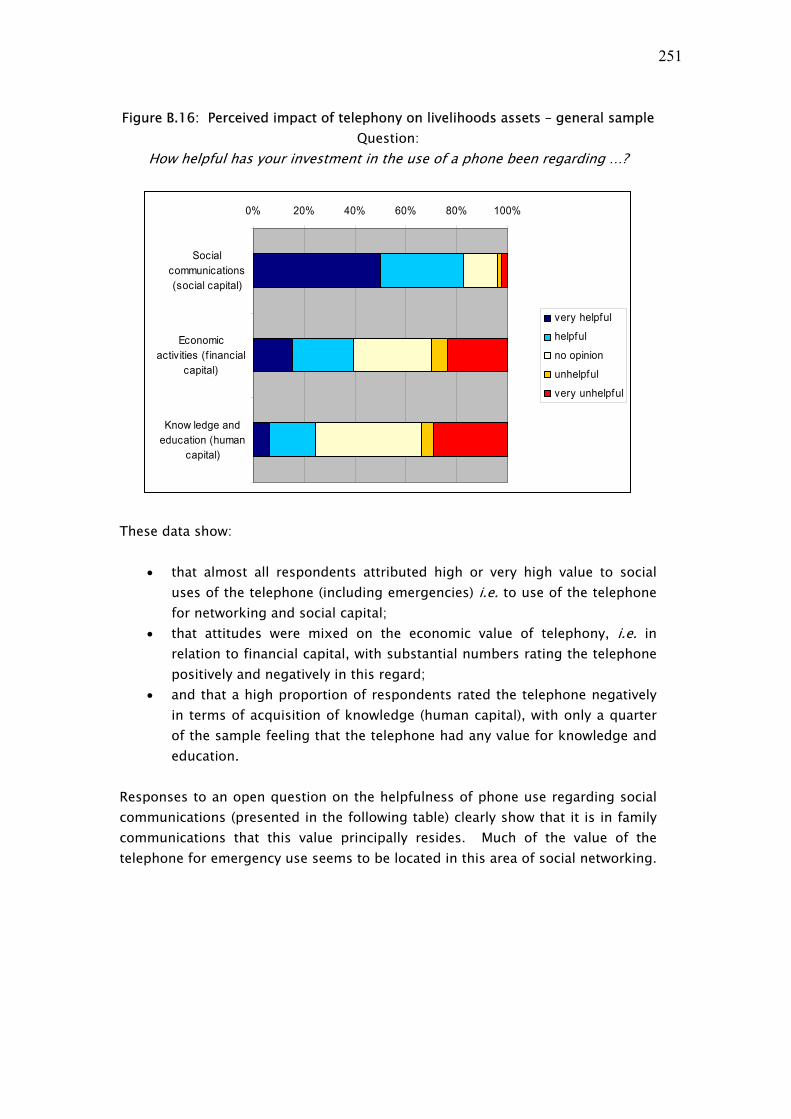
251
Figure B.16: Perceived impact of telephony on livelihoods assets – general sample Question:
How helpful has your investment in the use of a phone been regarding …?
0% 20% 40% 60% 80% 100%
Socialcommunications(social capital)
Economicactivities (f inancial
capital)
Know ledge andeducation (human
capital)
very helpful
helpful
no opinion
unhelpful
very unhelpful
These data show:
• that almost all respondents attributed high or very high value to social uses of the telephone (including emergencies) i.e. to use of the telephone for networking and social capital;
• that attitudes were mixed on the economic value of telephony, i.e. in relation to financial capital, with substantial numbers rating the telephone positively and negatively in this regard;
• and that a high proportion of respondents rated the telephone negatively in terms of acquisition of knowledge (human capital), with only a quarter of the sample feeling that the telephone had any value for knowledge and education.
Responses to an open question on the helpfulness of phone use regarding social communications (presented in the following table) clearly show that it is in family communications that this value principally resides. Much of the value of the telephone for emergency use seems to be located in this area of social networking.

252
Table B.33: Value of telephone: social communications – identified values – random sample
Frequency %age relatives information 232 33.8 ease of communication 62 9.0 speed of communication
59 8.6
health of relatives 59 8.6 saves transport 35 5.1 other 33 4.8 communicate with others
31 4.5
urgent / emergencies 18 2.6 not used 16 2.3 homesickness 16 2.3 friends information 9 1.3 no information / no benefit
4 .6
not important 1 .1 Total 575 83.7
Perceptions of the value of telephony for social networking and for knowledge acquisition are broadly similar in all socio-economic groups. All groups view the telephone as highly beneficial for social networking, and all but the highest status groups view it negatively as an instrument for knowledge gathering. There are, however, marked differences in perceptions of the economic value of the telephone according to economic status. The following chart shows that it is higher status economic groups that have a positive view of the value of phone use while the poor have a negative view of the value of phone use for economic benefits.

253
Figure B.17: Attitudes regarding helpfulness of phone use by economic status groups – random sample
-1 -0.5 0 0.5 1 1.5 2
poorest
poor
medium
rich
attitude (mean)
knowledge & educationsocial communicationsEconomic activities
The value of the telephone for social and economic use also correlates with intensity of use. This tends to confirm that perceived social and economic benefit are sensitive to frequency of use (i.e. that people who enjoy social and economic benefits from phone use are more intensive users - and tend to be from higher status groups).
Table B.34: Correlation of frequency of phone use with attitudes on value of phone use (random sample)
N = 654Overall
Frequency of phone
use Helpfulness re economic activities? 0.202** Helpfulness re social communications? 0.427** Helpfulness re knowledge? * Correlation is significant at the 0.05 level (2-tailed). ** Correlation is significant at the 0.01 level (2-tailed).
Finally, in this context, interviewees were asked about how damaging they felt it would be to their economic activity if they were unable to use a telephone in future.
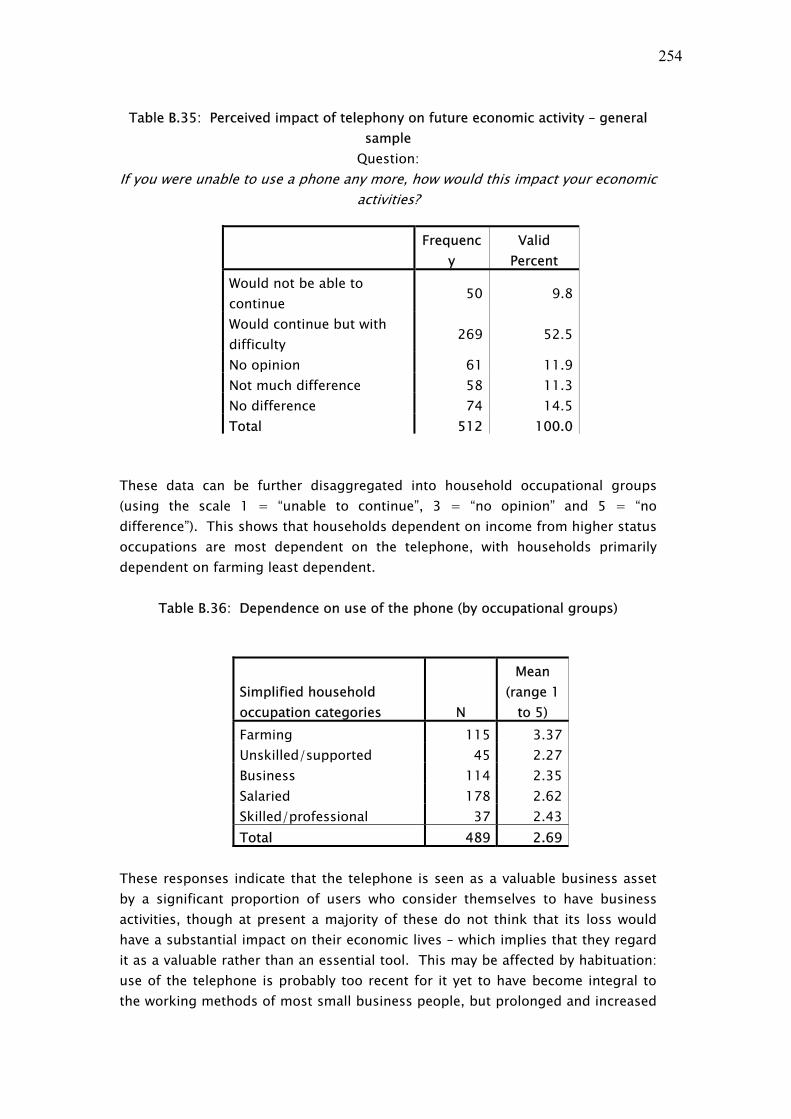
254
Table B.35: Perceived impact of telephony on future economic activity – general sample
Question: If you were unable to use a phone any more, how would this impact your economic
activities?
Frequenc
y Valid
Percent Would not be able to continue
50 9.8
Would continue but with difficulty
269 52.5
No opinion 61 11.9 Not much difference 58 11.3 No difference 74 14.5 Total 512 100.0
These data can be further disaggregated into household occupational groups (using the scale 1 = “unable to continue”, 3 = “no opinion” and 5 = “no difference”). This shows that households dependent on income from higher status occupations are most dependent on the telephone, with households primarily dependent on farming least dependent.
Table B.36: Dependence on use of the phone (by occupational groups)
Simplified household occupation categories N
Mean (range 1
to 5) Farming 115 3.37 Unskilled/supported 45 2.27 Business 114 2.35 Salaried 178 2.62 Skilled/professional 37 2.43 Total 489 2.69
These responses indicate that the telephone is seen as a valuable business asset by a significant proportion of users who consider themselves to have business activities, though at present a majority of these do not think that its loss would have a substantial impact on their economic lives – which implies that they regard it as a valuable rather than an essential tool. This may be affected by habituation: use of the telephone is probably too recent for it yet to have become integral to the working methods of most small business people, but prolonged and increased
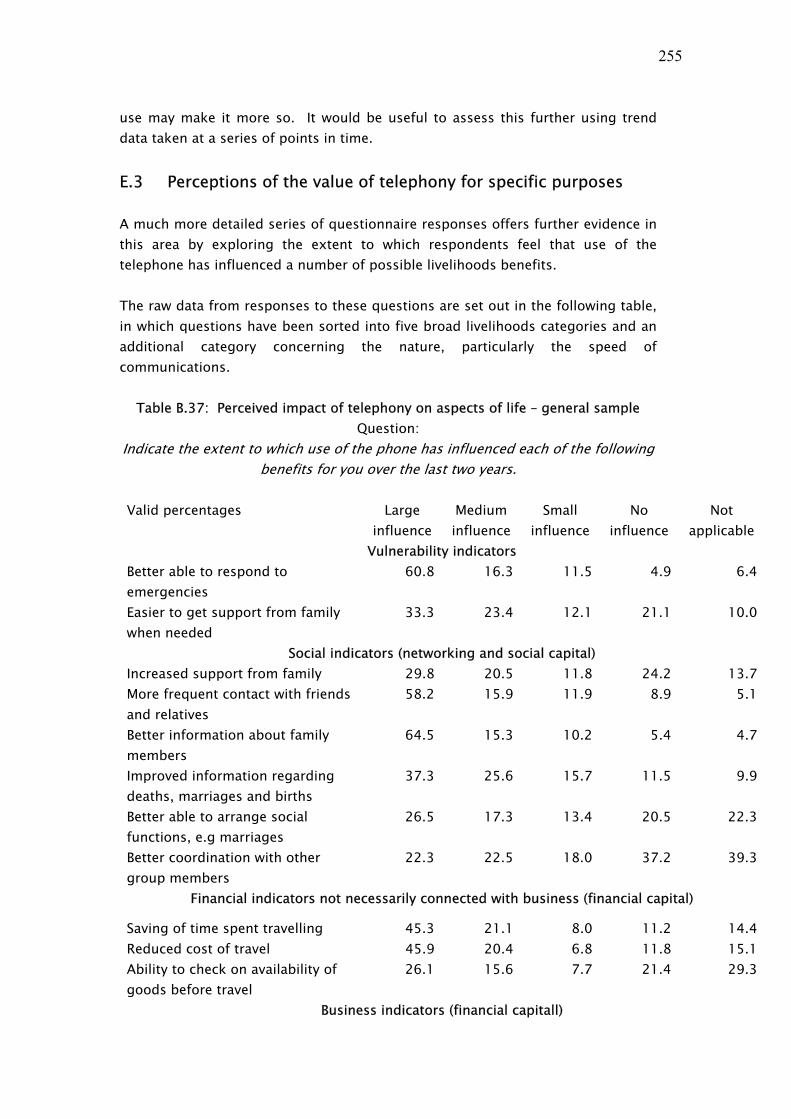
255
use may make it more so. It would be useful to assess this further using trend data taken at a series of points in time.
E.3 Perceptions of the value of telephony for specific purposes A much more detailed series of questionnaire responses offers further evidence in this area by exploring the extent to which respondents feel that use of the telephone has influenced a number of possible livelihoods benefits. The raw data from responses to these questions are set out in the following table, in which questions have been sorted into five broad livelihoods categories and an additional category concerning the nature, particularly the speed of communications.
Table B.37: Perceived impact of telephony on aspects of life – general sample Question:
Indicate the extent to which use of the phone has influenced each of the following benefits for you over the last two years.
Valid percentages Large
influence Medium influence
Small influence
No influence
Not applicable
Vulnerability indicators Better able to respond to emergencies
60.8 16.3 11.5 4.9 6.4
Easier to get support from family when needed
33.3 23.4 12.1 21.1 10.0
Social indicators (networking and social capital) Increased support from family 29.8 20.5 11.8 24.2 13.7More frequent contact with friends and relatives
58.2 15.9 11.9 8.9 5.1
Better information about family members
64.5 15.3 10.2 5.4 4.7
Improved information regarding deaths, marriages and births
37.3 25.6 15.7 11.5 9.9
Better able to arrange social functions, e.g marriages
26.5 17.3 13.4 20.5 22.3
Better coordination with other group members
22.3 22.5 18.0 37.2 39.3
Financial indicators not necessarily connected with business (financial capital)
Saving of time spent travelling 45.3 21.1 8.0 11.2 14.4Reduced cost of travel 45.9 20.4 6.8 11.8 15.1Ability to check on availability of goods before travel
26.1 15.6 7.7 21.4 29.3
Business indicators (financial capitall)

256
New clients 13.2 9.6 6.7 9.5 61.0Better market prices (when selling) 8.0 10.6 9.9 16.2 55.3Reduced costs (when buying) 8.9 11.1 8.9 22.0 49.2Increased sales 11.2 11.5 9.8 12.7 54.9Quicker turnover 17.0 19.0 22.5 41.5 63.2Improved competitive advantage 11.1 10.0 8.7 15.6 54.6Easier to make business arrangements (e.g. deliveries)
14.4 11.9 7.6 24.2 41.9
Information and other resources (human capital) Communication with government departments
14.7 12.7 8.7 26.9 37.0
Information about crop management
7.6 6.7 11.9 33.2 40.6
Information about livestock management
4.9 7.1 10.2 35.2 42.5
Information about new products and their use and application
7.9 11.6 10.9 35.1 34.5
Availability of professional staff 14.7 12.5 8.3 38.4 26.1Improved access to legal processes 12.5 12.7 8.2 30.9 35.8Information regarding schools and colleges
6.3 6.8 2.9 29.5 54.4
Improved access to pensions, vulnerability assistance
7.0 6.1 5.8 16.9 64.2
Better access to family health information
44.0 20.2 11.4 11.5 13.0
Other Greater access to entertainment options
16.3 18.5 14.1 29.7 21.4
Improved love life 19.9 13.5 10.2 31.3 25.0Speed of communication
Increased speed of communication 67.0 17.0 8.7 7.3 6.6Can get things done quickly 46.7 22.6 7.0 12.7 11.1Can do things remotely 54.1 18.9 6.3 8.0 12.7Travel is easier 40.6 23.0 7.6 13.4 15.4
These data can be presented graphically, excluding those indicating “Not applicable” (primarily non-users) as follows:

257
Figure B.18: Perceived impact of telephony on aspects of life – general sample
0% 20% 40% 60% 80% 100%Vulnerability ind icators
Bet ter ab le to respond to emergencies
Easier t o get support f rom family when needed
Social indicators (networking and social cap ital)
Increased support f rom family
M ore f requent contact with f riends and relat ives
Bet ter informat ion about family members
Improved informat ion regard ing deaths, marriages and b irt hs
B et ter able to arrange social funct ions, e.g marriages
Bet ter coordinat ion with o ther group members
Financial ind icators not necessarily connected with business (f inancial cap ital)
Saving o f t ime spent t ravelling
Reduced cost o f t ravel
Abilit y to check on availab ility o f goods before t ravel
Business ind icators (f inancial cap itall)
New clients
Bet ter market prices (when selling)
Reduced costs (when buying)
Increased sales
Quicker t urnover
Improved compet it ive advantage
Easier t o make business arrangements (e.g . deliveries)
Informat ion and other resources (human cap ital)
Communicat ion with government departments
Informat ion about crop management
Informat ion about livestock management
Informat ion about new products and their use and applicat ion
Availab ility o f professional staf f
Improved access to legal processes
Informat ion regard ing schools and co lleges
Improved access to pensions, vulnerab ilit y assistance
Bet ter access to family health informat ion
Other
Greater access to entertainment opt ions
Improved love lif e
Speed of communicat ion
Increased speed of communicat ion
Can get t hings done quickly
Can do things remotely
Travel is easier
Large influenceMedium influenceSmall influenceNo influenceNot applicable
Taken overall, these data confirm and provide more detail concerning the hierarchy of valuation of information and communication priorities identified above. As well as being preferred means of communications for emergency and other high saliency communications, the telephone is considered highly efficacious in delivering positive outcomes in these areas. It is also considered strongly positive in delivering benefits in social interaction, particularly within the family; and in enabling financial savings to be made. The only area of business activity, however, in which it is considered of substantial value is cost reduction; perceived outcomes in more proactive (or income-generating) business activity are much less positive, with most respondents indicating that it has no influence. The only area of information acquisition (human capital) in which the telephone is though significant concerns information on family health matters. The last four lines in the table and chart are particularly interesting as, rather than addressing livelihoods questions, they provide evidence about what it is about telephony that is valued by respondents. Increased speed of communications and the ability to do things remotely are both highly valued, and add further weight to

258
the evidence that the telephone is particularly used to address emergency issues and for its convenience in other areas of life. Where urgency and convenience are high priorities, then the telephone is undoubtedly the preferred mode of communications for respondents; where other factors such as the quality and reliability of information or the relationship with business partners are concerned, respondents at present seem to have less confidence in its ability to deliver the same quality of outcome as face-to-face communications. The data presented in this table and chart can also be presented using a ranking order of importance. This is obtained by establishing, for each issue, a mean figure for the importance attributed by respondents based on a five point scale for each benefit where “1” = “not applicable” to “5” = “large influence”. Presented in this way, the data appear as follows.
Table B.37: Identified benefits of telephone use - ranked impact statements – random sample
N = 687 Category
Mean (range 1 to 5)
Can get better information about family members S 4.30Increased speed of communication S 4.21Better able to respond to emergencies S 4.20More frequent contact with friends and relatives S 4.13Able to do things remotely (eg solve problems, place orders) 3.94Can get things done quickly 3.81Saving of time spent travelling F 3.72Better access to family health information H 3.71Reduced expenditure on travel F 3.70Improved information on deaths, marriages and births S 3.69Travel is easier S 3.60Easier to get support from family when needed F/S 3.49Increased support from family S 3.29Bbetter able to arrange social functions eg marriages S 3.05Aability to check on availability of products before travel F 2.88Greater access to entertainments options S 2.79Improved love life S 2.72Improved access to professional staff - vets, para-vets, doctor, nurse etc. F 2.51Easier communication with Government departments H 2.41Better coordination with other group members S 2.40
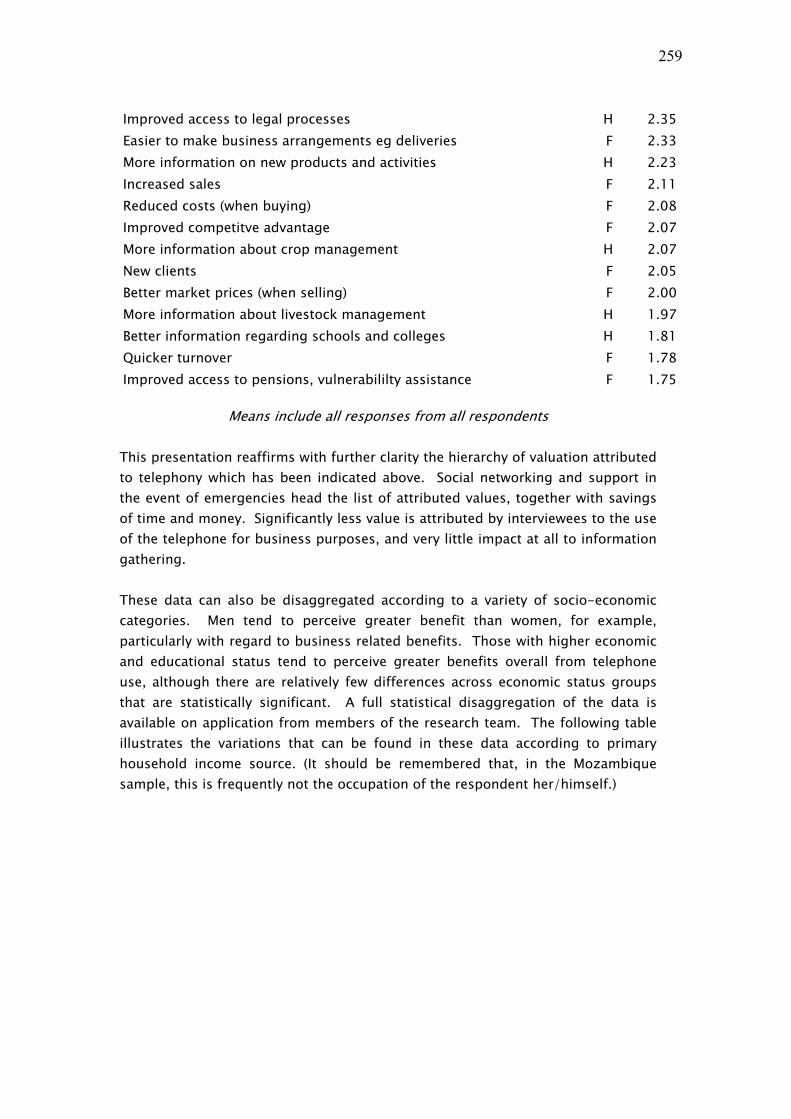
259
Improved access to legal processes H 2.35Easier to make business arrangements eg deliveries F 2.33More information on new products and activities H 2.23Increased sales F 2.11Reduced costs (when buying) F 2.08Improved competitve advantage F 2.07More information about crop management H 2.07New clients F 2.05Better market prices (when selling) F 2.00More information about livestock management H 1.97Better information regarding schools and colleges H 1.81Quicker turnover F 1.78Improved access to pensions, vulnerabililty assistance F 1.75
Means include all responses from all respondents
This presentation reaffirms with further clarity the hierarchy of valuation attributed to telephony which has been indicated above. Social networking and support in the event of emergencies head the list of attributed values, together with savings of time and money. Significantly less value is attributed by interviewees to the use of the telephone for business purposes, and very little impact at all to information gathering. These data can also be disaggregated according to a variety of socio-economic categories. Men tend to perceive greater benefit than women, for example, particularly with regard to business related benefits. Those with higher economic and educational status tend to perceive greater benefits overall from telephone use, although there are relatively few differences across economic status groups that are statistically significant. A full statistical disaggregation of the data is available on application from members of the research team. The following table illustrates the variations that can be found in these data according to primary household income source. (It should be remembered that, in the Mozambique sample, this is frequently not the occupation of the respondent her/himself.)

260
Table B.38: Identified benefits of telephone use – by occupational groupings (random sample)
farmer unskilled
/supported
business Salaried skilled/professional
N 179 57 164 214 46Can get better information about family members
3.92 4.53 4.45 4.39 4.57
Increased speed of communication 3.72 4.56 4.32 4.39 4.41Better able to respond to emergencies
3.64 4.26 4.34 4.28 4.46
More frequent contact with friends and relatives
3.60 4.37 4.52 4.32 4.54
Able to do things remotely (eg solve problems, place orders)
3.50 3.58 3.73 3.86 4.02
Can get things done quickly 3.38 4.05 4.15 4.16 4.22Saving of time spent travelling 3.26 3.89 3.96 3.91 3.41Better access to family health information
3.18 3.82 3.41 3.76 3.39
Reduced expenditure on travel 3.12 3.79 4.11 3.85 3.87Improved information on deaths, marriages and births
3.10 3.91 4.04 3.83 3.89
Travel is easier 3.09 4.05 4.09 4.02 4.28Easier to get support from family when needed
3.05 3.70 3.15 3.47 3.28
Increased support from family 3.03 4.09 3.88 3.72 3.61Bbetter able to arrange social functions eg marriages
2.84 3.02 3.16 3.25 3.15
Aability to check on availability of products before travel
2.47 2.14 3.27 3.11 3.20
Greater access to entertainments options
2.34 2.18 2.74 2.79 1.87
Improved love life 2.25 2.58 2.88 3.24 2.89Improved access to professional staff - vets, para-vets, doctor, nurse etc.
2.20 1.63 2.12 2.14 1.70
Easier communication with Government departments
2.18 2.68 2.76 3.19 2.67
Better corordination with other group members
2.18 1.53 2.51 2.39 1.87
Improved access to legal processes 2.16 2.07 2.55 2.57 1.93Easier to make business arrangements eg deliveries
2.08 1.67 2.63 2.86 1.93

261
More information on new products and activities
2.01 1.46 2.09 2.04 1.65
Increased sales 1.94 1.86 2.87 2.38 2.43Reduced costs (when buying) 1.92 1.89 2.55 2.09 2.00Improved competitve advantage 1.85 1.33 2.52 2.31 2.13More information about crop management
1.82 1.79 2.35 2.08 2.30
New clients 1.08 1.49 2.52 2.21 2.20Better market prices (when selling) 1.71 1.32 2.44 2.15 1.98More information about livestock management
1.69 2.16 1.82 1.85 1.74
Better information regarding schools and colleges
1.68 1.23 2.65 2.17 2.20
Quicker turnover 1.66 1.32 2.14 1.81 1.57Improved access to pensions, vulnerabililty assistance
1.58 1.32 1.88 2.02 1.26
SUMMARY FINANCIAL (a,b,c,d,e,f,h,i,j,k,m,v,y)/13
2.1732 2.1147 2.8419 2.6524 2.4833
SUMMARY SOCIAL (g,h,l,o,p,q,r,z,bb,cc,dd,ff)/12
3.0684 3.5906 3.5955 3.7313 3.5833
SUMMARY HUMAN (n,s,t,u,w,x,aa)/7 2.2243 2.0576 2.527 2.5381 2.0342
E.6 Impact of telephony use on other means of communications A further series of questions was asked in the survey about the impact which respondents believe telephone use has had on their use of other sources of information and means of communication. Responses concerning these questions are summarised in the following table.
Table B.39: Impact of telephony use on other means of communications Question:
Has the use of … changed since you started using a phone?
Valid %age of user sample
Large increase
Slight increase
No change
Small reduction
Large reduction
Letters and postal services
0.8 1.5 19.0 15.4 63.3
Face to face communication
4.7 2.7 39.3 43.4 9.8
Making social visits 3.8 6.5 45.2 40.3 4.2Use of messengers 4.4 4.1 51.8 17.8 22.0Referral to village council and local leaders
1.8 7.0 76.7 9.8 4.7

262
These findings can also be presented graphically. The following chart presents data derived from these questions concerning changes in sources of information using a five point scale in which -2 = “much less”, 0 = “no change” and +2 = “much more”.
Figure B:19 : Changes in sources and channels of information
-1.5 -1.3 -1.1 -0.9 -0.7 -0.5 -0.3 -0.1 0.1 0.3 0.5
change: villagecouncil/local leaders
change: social visits
change: messengers
change: face to face
change: use of letters andpost office
These responses show clearly that telephone use is having a significant impact on social behaviour and the use of other information and communication channels. Two particularly striking impacts should be noted. The most dramatic impact is on the traditional postal service, for which the telephone provides a clear and (in terms of immediacy and interactivity, if not necessarily cost) a superior alternative mode of communications. For the majority of respondents, use of the telephone has led to a substantial reduction in their use of postal services. There is a lesser but still marked reduction in the use of messengers, which can likewise be attributed to the growth of telephony. The telephone has also had a substantial impact on social interaction, with the vast majority of respondents reporting at least a slight reduction in social visits and face-to-face communication. At relatively high levels of telephone access and use, it is evident that the telephone has extensively substituted for some more direct forms of social interaction. The business sample was more emphatic about the degree to which face-to-face communications had diminished. This may have some sociological implications concerned with family cohesion. However, the data need to be treated with caution. Interviewees’ responses give no indication of the importance of social interaction which has been displaced by telephony. The

263
availability of telephony means that, for almost everyone, there will be some occasions on which it is used to replace trivial social contact that would previously have required a social visit. The sociological impact of behavioural change in this area would be much more significant if use of the telephone impacted on more important social interaction. This cannot be assessed without further research. Responses to a separate ‘lifestyle’ question – not directly related to telephone use - indicated that over half of respondents felt less need to travel than they had two years previously.
Table B.40 : Perceived need to travel
Question: Has your travel increased or reduced in the last 2 years?
Frequency %age Greatly reduced 137 20.1 reduced 249 36.5 No change 95 13.9 Increased 114 16.7 Greatly increased 87 12.8 Total 682 100.0
Whereas most groups registered a reduction in the need to travel, highest education and economic status groups registered a modest increase, along with the households primarily dependent on skilled / professional incomes. Similarly, although all phone ownership groups registered a decrease in the need to travel, the reduction is greatest amongst non-users. Furthermore, there is little evidence of a link between frequency of use of phones (i.e. current use) and changes in the need to travel; indeed, amongst those groups where a link exists (e.g. households primarily dependent on farming) it indicates that more intensive use of phones corresponds with increased need to travel.
Section F: Use of the Internet The final section of the questionnaire posed a number of questions concerning use of Internet. Internet use is often given a high profile in discussions of the role of ICTs in developing countries, and the relative value of telephony and Internet access is an important issue in the ICD debate. It had been hoped that the survey would provide evidence of how the Internet is being used by typical adults within rural communities which could help to inform these discussions, particularly where policy towards Internet deployment is concerned.
264
In practice, however, interviewees in this study had made almost no use of Internet facilities and had almost no experience of Internet use. Of the 687 interviewees in the general sample, only 15 reported that they had ever used email or Internet, of whom 10 said that they “can use” these services and 5 that had experimented with them. For the sample population, therefore, the Internet was simply not part of the visible spectrum of communications resources. It included insufficient numbers of Internet users to allow any meaningful analysis of Internet use. Further research is needed to establish detailed Internet usage levels and patterns of use, barriers to Internet use and the potential impact of Internet services in rural communities of the kind surveyed in this research. Most Internet diffusion studies to date have focused on actual users of Internet facilities, for example by assessing the socio-economic characteristics of cybercafé users. These studies should always be complemented by studies looking at Internet use from the perspective of the potential user community as a whole. Trend data, indicating changes in patterns of use over time, are likely to be particularly valuable in this context. In addition, given the importance of face-to-face communications in information and communication flows revealed in section D above, it would also be useful to examine if and how usage and information derived from usage devolve from first movers in Internet use into the wider community. It is not, however, possible to draw any further conclusions concerning Internet use from this study at this time.
Section G Conclusion This section briefly summarises some of the conclusions which can be drawn from the Mozambique research questionnaire and analysis. A fuller conclusion to the study, including comparison of the Mozambique data with those from India and Tanzania, is included in the main research report. In considering these data, it should be remembered that the evidence suggests that the sample has higher average economic status and resources than the community from which it is derived, and that its ownership of more expensive communications equipment appears to be significantly above the average. The data are therefore likely to exaggerate the extent of television and telephone use within the community as a whole, since the proportion of the sample with private access to these facilities is higher than the proportion of the overall population that has private access to them. With this cautionary note in mind, the key findings from this analysis can be summarised as follows. The Mozambique sample for this KaR study included 813 individuals resident in rural communities clustered around three research location centres, in Chibuto, Moamba and Mocuba districts. These were divided into a general sample of 687 individuals and a purposive sample of 126 tradespeople. Extensive questionnaire
265
surveys sought five main types of information from respondents - concerning their personal circumstances, established information and communication flows, access to and use of telephony, value of telephony in meeting livelihoods requirements, and experience of the Internet. These surveys were supported by focus group discussions. The report in this document summarises major results from this survey in a form which can be easily compared with those of the other two country studies in the project. Characteristics of interviewees are summarised in section B. These do not represent a typical rural population in Mozambique for two reasons. Firstly, the communities from which they are drawn are among the minority of rural communities in which telephony was substantially available at the time of the survey. These communities are likely to be more prosperous and more engaged with national economic life than more remote communities. Secondly, the sample itself over-represents higher income groups and under-represents those dependent on farming, both in relation to the Mozambican population as a whole and in comparison with the samples interviewed in India and Tanzania. A large majority of interviewees also had close relatives living elsewhere in Mozambique and in other countries. These characteristics have important implications for the analysis of findings. The majority of interviewees felt positive about general social and economic trends within Tanzania, including their own livelihoods. Developing communications infrastructure was significantly valued as an investment objective by a significant number of people within the sample but was not one among their top priority objectives for social and economic development. The availability and use of telephony is described in section C of the annex. Telephony is readily accessible to the majority of those living in the research communities. Over 40% of interviewees had private access to telephony, the vast majority through mobile lines which were owned by household members. (This figure is very much higher than mobile teledensity in Mozambique overall.) Most other interviewees made use of telephone facilities, either by using public telephone facilities or by borrowing mobile phones, and a substantial proportion of non-owners expressed an intention to become mobile phone owners in due course. Section D of the analysis discusses established information and communication flows. Respondents placed high confidence in information supplied by the media, particularly broadcast radio (which is almost universally available and in regular and consistent use) and television (which is accessible to a high proportion of those interviewed). Least confidence was placed in NGOs and private associations and in traders and manufacturers.

266
The most important types of information and communication identified by interviewees are concerned with high-priority family and social issues, particularly emergencies and information about family members. Telephony is much the preferred channel of communication to meet these requirements, which illustrates its value in addressing critical moments of vulnerability in respondents' lives and its value in supporting the closest personal relationships, particularly when these are disrupted by distance. However, telephony was not the preferred mode for other types of communication. Face-to-face communication was much preferred for business interactions. There are a number of possible explanations for this, but the relative novelty of telephony is likely to be important. Human behaviour changes much more slowly than technology, and it takes time for people to adopt new habits of interaction, particularly where relationships that require trust - such as business - are concerned. The value of the telephone for business use was felt by respondents to lie in savings rather than income generation. Telephony played no significant role as a communications channel for information and knowledge gathering, in which broadcasting and face-to-face communications were overwhelmingly more important. The survey provides evidence that a transition is taking place from face-to-face communications to telephony. Within the family, the telephone is clearly used to increase contact with family members living elsewhere in Mozambique or outside the country, while there may be some reduction in social interaction with local family members as the telephone substitutes for social visits. However, this may reflect a change in behaviour regarding unimportant rather than important social contacts. From a livelihoods perspective, the survey suggests that the telephone is particularly valued for its ability to address vulnerability at times of crisis; that it is used very significantly to maintain social contact with family members, particularly family members living away from the community; that its most significant value in relation to financial capital is in saving expenditure rather than income generation; and that telephony is not used at all to any significant degree in respect of human capital (information and knowledge). Section E presents evidence concerning respondents' perceptions of the impact which telephony has on livelihoods, and confirms the picture given in section D. As well as being the preferred means of communications for emergency and other high saliency social/family communications, the telephone is considered highly efficacious in delivering positive outcomes for these needs. The telephone is also considered valuable in delivering benefits in other social interaction and in enabling financial savings. The primary area of business activity in which it is

267
considered significantly worthwhile is cost reduction, however, and the telephone is not valued as a source of information. While all socio-economic groups felt that there was substantial positive value in use of the telephone for social purposes, attitudes towards its value for economic activities varied significantly according to economic status. Those with higher economic and educational status tend to value the telephone positively for economic activities, while those with lower economic and educational status tend to value it negatively. This finding is consistent with the other countries in the study. Section F briefly comments on survey questions concerning the Internet. However, Internet use within the sample was too low for it to have any impact as yet on the survey population, and too low for any meaningful disaggregation of responses. Overall, therefore, respondents felt that the telephone had most value for social purposes (including family emergencies), some value for economic activities, and little value in terms of knowledge acquisition. This - together with the findings on information and communications flows and the current low level of Internet use - has implications for the strategies adopted by governments and international donors to use telephony and other ICTs in delivering development outcomes, especially where information transmission is concerned. Programmes aimed at providing information to target beneficiaries, such as farmers, or to support changes in behaviour patterns, for example on health issues, may be most successful if they build on established information and communication flows and on trusted sources of information (opinion leaders).

268
THE ECONOMIC IMPACT OF TELECOMMUNICATIONS ON RURAL LIVELIHOODS AND POVERTY REDUCTION:
Report of DFID KaR Project 8347
ANNEX C: TANZANIA RESEARCH REPORT
Report by:
Professor David Souter (Research Coordinator and Report Editor) with
Tanzania Commission on Science and Technology Dr Kevin McKemey
Professor Ophelia Mascarenhas Professor Ntengua Mdoe
Dr Theophilus Mlaki Mr Simbo Ntiro Dr Nigel Scott
Mr Peter Ulanga Eng. Philemon Kilassa Ms Christine Mwasi
Introduction This annex summarises the findings of research undertaken in Tanzania as part of a research programme on The Economic Impact of Telecommunications Access on Rural Livelihoods and Poverty Reduction financed through the UK Department for International Development’s Knowledge and Research (KaR) programme. Research for this programme was undertaken in three countries – India (State of Gujarat), Mozambique and Tanzania – and findings relating to all three countries are included in the main research report to which this document forms an annex. The primary concern of the research project was to assess the impact and implications of ICTs, particularly telephony, on and for the livelihoods of low-income households and communities in representative rural communities in the three research countries. It should be noted throughout that the concern of the study is with the impact of telephony on those that are making some use of it, not with penetration rates for telephony or other ICTs.

269
The overall methodological approach to the study was based on the sustainable livelihoods approach outlined in DFID’s Sustainable Livelihoods Guidance Sheets29, focusing in particular on vulnerability and on the key livelihoods assets described as financial, social and human capital. Data was collected through field research, including both focus groups and detailed questionnaire research in three different locations in each country, the total national sample in each country being around 750 adult individuals (mostly heads of households). A note on the selection of locations and on the extent to which findings can be generalised will be found at the end of this Introduction. The field research undertaken in Tanzania was designed in partnership between the research coordinator, Professor David Souter of ict Development Associates ltd (ictDA) and the University of Strathclyde; the national research partnership led by the Tanzania Commission on Science and Technology (Costech); and the project data analysis team from the UK development consultancy Gamos Ltd. Field research in Tanzania was undertaken during the summer and autumn of 2004 by Costech, under the coordination of Dr Theophilus Mlaki, assisted by Professor Ophelia Mascarenhas, Professor Ntengua Mdoe, Mr Simbo Ntiro, Mr Peter Ulanga, Mr Philemon Kilassa and Ms Christine Mwasi. Data analysis was undertaken by Gamos Ltd in conjunction with Costech and ictDA. This country report was drafted on behalf of the research team by Professor David Souter, in conjunction with Dr Nigel Scott and Dr Kevin McKemey of Gamos Ltd, and personnel from the Tanzania research team, and was completed following a multistakeholder review meeting in Tanzania in June 2005. Overall project management was undertaken on behalf of DFID by the Commonwealth Telecommunications Organisation. This annex is divided into seven sections. Section A reviews the research methodology, briefly summarising the description of this included in the main research report; describes the locations selected for research in Tanzania; and draws attention to issues arising from research methodology that are specific to the country or to these locations. It also includes a note on the Tanzania telecommunications market. Section B describes the overall sample used for the research, in particular its demographic characteristics. Section C describes the sample’s access to, ownership and use of telephony. Section D outlines findings from the research concerning information and communication flows of importance to interviewees and their communities. 29 These can be found at http://www.livelihoods.org/info/info_guidancesheets.html.

270
Section E reports on interviewees’ attitudes and perceptions concerning telephony, and relates these to key aspects of livelihoods analysis, particularly concerning financial, social and human capital (income and financial savings, networking and access to information and knowledge). Section F briefly comments on issues concerning the Internet. Section G summarises the findings from the country study, and draws attention to findings of interest which are outside the remit of this research project. It concludes with country-level conclusions and recommendations drawn up after discussion during a country-level stakeholder meeting held in Dar es Salaam on 8 June 2005. It is important to note both the significance and the limitations of the data and findings included in this study. In the last five years, telephony has become much more widely available and extensively used in rural areas of developing countries, while there has been considerable debate about the role and value of other information and communication technologies (ICTs) in low-income rural communities. As discussed in the introductory sections of the main research report, however, very little detailed research has been undertaken to date into the impact of telephony and other ICTs on actual behaviour, on information and communication flows, and on livelihoods impacts in such communities. Extensive debate about impacts has therefore taken place in what is substantially an information vacuum. This study is one of the first in this field to examine substantial samples in a range of developing countries in sufficient detail to enable significant conclusions to be drawn for the communities that are assessed. It therefore adds considerably to the quality of information available for evidence-based policy formulation and implementation by policymakers in national governments, business organisations, civil society and the international donor community. A critical issue for any research of this kind is the extent to which its findings can be generalised from particular research locations and countries to the wider world. The shortage of substantive research in this field to date has led to some exaggeration and misinterpretation of the findings of such studies as have been undertaken, often disregarding the small size and unrepresentativeness of data samples used and/or country- or location-specific factors. A principal aim of this project has been to provide more substantial evidence for behaviour and so increase understanding of what is actually taking place within low-income communities in developing countries. The sample sizes and methodological approach in this study provide significantly more substantial indications of what may be happening on a wider scale in comparable low-income

271
and rural communities in other countries than previous research in this field. Findings that are consistent across all three research countries should be regarded as particularly significant, and these are reported in Part 3 of the main research report. The research team hopes that the research findings as a whole will contribute significantly to the serious analysis of policy approaches which is needed if the value of ICTs, including but not exclusively telephony, in rural and low-income developing country communities is to be maximised. However, it is still crucial to understand the limits of these and comparable data. In particular: 1. All research data are to some degree country- and location-specific.
There are very large differences between the social, economic and political characteristics of the populations of developing countries, including the three countries in this research project. The impact of telephony on different societies varies as a result of these country- and location-specific factors. Findings concerning Tanzania offer evidence about Tanzania, and provide indicators about likely circumstances in comparable countries, but they need to be interpreted against these country-specific factors. However, as a result of this national diversity, findings that are robust across the three research countries are much likelier to represent general rather than country-specific experience, and can be treated as having considerable significance. These cross-country findings are discussed in the main report.
2. While research locations within each country were chosen in order to
provide a reasonable cross-section of low-income communities, all selected locations had to have sufficient telecommunications access to provide sufficient data for analysis. The research, therefore, did not include rural areas which do not have telecommunications access or in which access is very limited. Equally, all interviewees came from rural areas, and the sample does not include population groups from major urban centres. The locations are not, therefore, representative of telephone access levels across Tanzania as a whole, and data concerning usage levels (as opposed to usage patterns or to the behaviour of those with and without telephony) cannot be extrapolated state- or country-wide. Usage levels are, of course, changing rapidly, and a snapshot picture of usage levels would rapidly become outdated.
3. Because the survey focused on livelihoods analysis, the results of field
research are primarily household data, collected almost exclusively from adults and primarily from self-identified heads of households and their spouses. As the purpose of the research was to assess the behaviour of and impact of telephony on those who use telecommunications, it also
272
focuses on population segments that do make use of telephony. The household basis of the survey and focus on self-identified household heads means that the sample under-represents women and has limited value for gender disaggregation (though this is covered in section G of the annex, below). It also includes fewer young adults than the general population. The focus on telephone users means that the sample is on average wealthier than the general rural population. This reaffirms that results concerning usage levels cannot necessarily be generalised to the population as a whole (for example, a 20% level of ownership of fixed telephones in the sample would not imply an equivalent level of ownership in the population as a whole), but this does not affect the viability of analysis of behaviour by those in a position to make use of telephony.
4. The household basis of the survey also means that economic and
occupational categories within the survey are concerned with households rather than individuals. As accurate data for individual and household income in rural areas of developing countries are very difficult to establish, economic comparisons have been made between broad-brush economic categories (approximately quartile divisions) built around a multiple indicator index of relative prosperity, including, for example, asset ownership as well as declared income. This provides a more robust basis for economic comparisons. Occupational categorisation is also defined at a household level. Most rural households are dependent on income from a variety of occupations. The primary, secondary and tertiary occupations declared in the data are those of the household, not necessarily of the interviewee. A test for differences between results on an individual and household basis suggests that, in fact, these would not be significant, but the household occupational categorisation has been preferred as the research team believes it is more appropriate for this analysis.
5. The findings represent a snapshot of behaviour at a particular point in
time. Access to telephony and other ICTs is changing rapidly in the three research countries, particularly in rural locations, and a snapshot can give only limited information about trends in behavioural change. An understanding of trends in behavioural change is particularly important in assessing information and communications because of a) the rapid pace of change in available media and b) the slower pace of behavioural change. Considerable attention has been paid to maximising understanding of behaviour and impact trends in this study through the use of questions about perceptions of change, but data on actual behavioural trends could only be obtained through a repeat survey of the same interviewees. Repeat surveys along these lines would be valuable.

273
In summary, therefore, the findings set out in this annex and in the main research report provide a considerably more substantial picture of how individuals may behave, how livelihoods may be affected and how low-income communities in the three research countries may be impacted by telephony (and, to a lesser extent, other ICTs) than is available in earlier research. The findings offer valuable indicators which may be relevant in other countries, and which merit serious consideration by policymakers. However, like all such data, they should be interpreted with caution. Nothing can substitute for country-specific research in developing countries, and the research team hopes that this project will encourage similar research to be undertaken in other countries. Findings which the research team considers robust across all three research countries – and therefore highly likely to be representative of behaviour in comparable developing countries - are set out in Part 3 of the main report. This annex report includes analysis of both frequencies and correlations within the survey data. Most of the illustrative tables and charts represent data frequencies, while, to conserve space, correlations are largely reported within the text. All frequency and correlation tables used in the analysis are available on application from DFID, the CTO and the research team (Gamos Ltd, ictDA and Costech). Data sets compiled during the research are freely available for use by any individual researcher or research organization. They provide rich information on many issues which go well beyond the initial remit of the research study. Further analysis of aspects of the data not included in this document or the main report will be undertaken and published by various members of the research team following presentation of this report to DFID. However, the research team for this study (ictDA, Gamos, Costech and its partners and Professor Christopher Garforth) does not endorse the conclusions drawn in any publication or study that makes use of the project research data unless its endorsement is explicitly expressed in such a publication or study.
Section A: Research methodology and research locations The research methodology adopted for this study is summarised in Part 2 of the main research report. In summary, a sample of some 750 adults was questioned, through field interviews, about their livelihoods, use of and attitudes towards telephony and other ICTs and other relevant issues, in each of three research countries (India (State of Gujarat), Mozambique and Tanzania). Questionnaires were drawn up following focus group discussions in research regions and, although broadly consistent across the research countries, included some national variations. In order to reduce distortions due to socio-economic circumstances in particular

274
research locations, interviews were undertaken in three separate locations in each country, and interviewees drawn from clusters resident at different distances from the centres of the three research locations (which were usually rural towns).
A.1 The Tanzania telecommunications market Until 1993, Tanzania had a telecommunications monopoly provided through the government-owned Tanzania Posts and Telecommunications Corporation (TP&TC). Sector reform began in 1994 with the restructuring of TP&TC to form Tanzania Telecommunications Company Limited (TTCL) and Tanzania Posts Corporation. The government formulated the National Telecommunication Policy (NTP) in October 1997. This aimed to liberalise the market, envisaging rapid expansion and improved service quality to be provided by private sector participation, a reduced role for the state in the delivery of services and the establishment of an independent regulatory regime. Specifically it led to: • increased private ownership and operation of the incumbent public telephone
company, TTCL; • a more liberal and competitive market for TTCL as well as for private owned
and operated cellular, payphone, paging services and data communication services;
• commercialisation and liberalisation of postal services; • and liberalisation of broadcasting services; • and oversight of the market as a whole by the Tanzania Communications
Commission (TCC).
The NTP set a target of six fixed telephone lines per 100 inhabitants by the year 2020. Tanzania today has a fixed teledensity of 0.5 fixed telephone lines per 100 inhabitants compared with 0.3 in 1993. However, mobile teledensity has risen from almost zero in 1993 to approximately four mobile telephone lines per 100 inhabitants. The government plans to establish a rural communication development fund to expedite the roll out of communication services to the least profitable areas of the country, with the aim of bridging the communications gap between rural and urban development.
Currently, two operators are licensed to provide fixed telecommunication services,
the national incumbent operator TTCL and Zanzibar Telecom Limited (ZANTEL), which provides services primarily in Zanzibar. There are four mobile cellular operators - Vodacom (T) Limited (1,100,000 customers), Celtel (T) Ltd (550,000 customers), Mobitel (320,000 customers) and Zantel (85,000 customers in Zanzibar).
275
In 2003 the Tanzania Communication Regulatory Authority (TCRA) was established to regulate telecommunications, broadcasting, postal services, management of radio spectrum, electronic technologies and other (internet and other) Information and Communication Technologies (ICT) applications. TCRA took over the functions of the Tanzania Communications Commission and Tanzania Broadcasting Commission. A new licensing framework, based on converged licences, was introduced in February 2005. This gives each licensed company the freedom to choose whatever technology it wishes to use to provide whatever services are most in demand within the area for which it is licensed (network facilities, network services, application services and/or content services). The Government of Tanzania has liberalised the licensing framework for Internet connectivity (formerly a monopoly of TTCL) and 23 Internet Service Providers (ISPs) have since been licensed. In addition, a number of organisations including government departments are also accessing internet/e-mail through LANs. However, the use of Internet is still low in comparison with other countries. Four ISPs are now connected to a new national IXP. In March 2003 the Government launched its National Information and Communications Technologies Policy. The National ICT Policy vision aims at making Tanzania ‘the hub of ICT Infrastructure and ICT solutions that enhance sustainable socio-economic development and accelerated poverty reduction both nationally and globally’. Its core objectives are: • provision of a national framework that will enable ICT to contribute towards
achieving national development goals; and • transforming Tanzania into a knowledge-based society through the application
of ICT.
A.2 Research locations The three research locations chosen for the Tanzania country case study were as follows:

276
Figure C.1: Map of Tanzania, indicating research locations
Within each location, sub-locations were selected for interviews on a cluster basis, as illustrated in Figure C.2 1. Hai District
Seven villages were selected in the district, with the assistance of local government officials, on the basis of distance from Hai District headquarters and on the different agro-ecological zones in the district. These villages were Shiri Njoro and Lyamungo Kati in Lyamungo division; Wari in Machame division; Rundugai and Roo in Masama division; and Orkolili and Mowo Njamu in Siha division.
2. Njombe District
Njombe District is located in Iringa Region in the southern highlands of Tanzania, with areas up to 2000 metres above sea level. More than 90% of the population of the district make their living from agriculture, primarily as employed or casual labourers. There is little commercial activity in Njombe town itself. It was originally intended to select villages for survey up to 50 kilometres from the district headquarters, but this had to be revised because of the lack of mobile telephone and other infrastructure in the remoter areas.

277
The villages finally chosen were selected on a basis of distance from the district headquarters up to a maximum distance of 15 kilometres. These villages were Nundu, Nyumbanitu, Nyombo, Stand Street [????????], Kibena, Luponde, Makoga and Ulembwe.
3. Sengerema District.
This district is located in Mwanza Region, along the southern shore of Lake Victoria. Main livelihood activities in this district are fisheries (almost entirely artisanal), agriculture, mining and livestock keeping.
Sengerema has a telecentre which was initiated and sponsored by COSTECH, the Tanzania national research partner. Although there was some risk that the presence of a telecentre might distort the overall findings, it was felt that there might also be benefits from including a location with this form of ICT access. In the event, the use of Internet throughout the Tanzania sample, including that in Sengerema, was so low that it had no distorting effect. Within Sengerema district, seven villages were selected for cluster sampling based on distance from Sengerema district headquarters. The list was selected by the district council to include three locations less than 10 kilometres from the district headquarters (Ibisabagemi, Tunyenye, Tabaruka), three between 10 and 20 kilometres (Sima, Nyamizege, Katunguru) and one more remote community (Chifungu, 33 kilometres from the district headquarters). In each village, a total of 30 households and 5 individual traders was interviewed, representing about 5% to 7% of households in their communities.
Further details of the sampling process and of research locations are available in a separate report by the Tanzania research coordinator, Professor Ophelia Mascarenhas, which is available on request from Costech or other members of the project team.
A.3 Telephone service coverage in research locations The main purpose of the study reported in this annex was to research the impact of telephony on livelihoods, rather than the distribution of telephony itself. Research locations were therefore chosen from amongst those in which telephone service was available, and interviews were focused on citizens with some experience of telephony. (Telephone usage and experience rates are, of course, changing rapidly in Tanzania as in other developing countries.) This approach was necessary in order to ensure sufficient data for analysis of the behaviour and attitudes of telephone users, the key target groups in the research.

278
As a check on the availability of telephony, interviewees were asked about their perceptions of the availability, diversity and quality of telephone service coverage within the research locations. Their responses are reported in the following table:
Table C.1 : Level of telephone service coverage
Frequen
cy %age No local access 1 0.1 Poor network access - available only in spots
157 22.0
Low mobile access - only 1 mobile service
35 4.9
High mobile access- no fixed line but 2 or more mobiles
164 23.0
High - fixed line plus 2 or more mobile service providers
357 50.0
Total 714 100.0 Only 2.2% of the interview sample indicated that they needed to travel in order to access a telephone, and most of these did so less than once a month.
A.4 Statistical analysis and significance This study aims to provide evidence of the behaviour of individual adults in rural areas of the research countries who currently make some use of ICTs, particularly telephony, in the course of their lives; and to assess evidence relating this usage to their livelihoods and livelihoods strategies. The sample is appropriate and sufficient to indicate patterns and perceptions of behaviour, usage and impact which are relevant to this particular broad socio-economic group, i.e. individual adults in rural areas who have access to telephony (which constitutes a very large majority of those in the sample areas) and who make some use of telephony (which also constitutes a majority in sample areas). The sample is also appropriate and sufficient to indicate the likely behaviour, usage and impact of and on comparable groups of rural adults in areas which do not yet have telephone access, but where telephone access is likely to become available in the near future.

279
As the sample was chosen in order to provide sufficient data for rural adults who currently use telephony, it should be emphasised, however, that the data must be interpreted with caution in respect of the national population or national rural population as a whole. In particular:
1. As the survey included only rural environments, these findings cannot be generalised to urban populations or to national populations including substantial urban groups. Indeed, the socio-economic characteristics of urban Tanzania are sufficiently different from those of rural Tanzania to make it likely that patterns of behaviour, usage and impact are significantly different between urban and rural areas.
2. As the survey focused on those currently using telephony, data concerning
usage levels, as opposed to usage patterns, cannot be generalised to any wider population group, and should not be used to imply any particular level of ICT use country- or region-wide. (The study’s purpose was to review the pattern and impact of ICT usage, not its level, and no checks were undertaken to compare usage levels within the sample with those of the population as a whole, either locally or nationally. For the same reason, usage levels of national samples differ significantly between research countries, and cross-country comparisons that might be affected by usage levels are not appropriate.) This caveat does not apply to interpretation of findings concerned with the behaviour and attitudes of users of telephony, the primary targets for research; merely to the level of their presence within comparable communities across the country.
It had been hoped, during the research design phase, that the study would generate sufficient data to assess Internet as well as telephony behaviour, usage and impact. In practice, in Tanzania as in the other research countries, levels of Internet usage among interviewees proved to be so low that no statistically significant analysis of that usage – beyond the low level of actual usage itself – is meaningful. The low level of Internet use within the sample is discussed further in section F of this report and in the main report. In brief, it means that the analysis of findings contained in this document and the other country studies in this project is predominantly an analysis of telephony behaviour, usage and impact. A copy of the questionnaire used in the Tanzania study is attached as an appendix to this document. This was a lengthy and detailed questionnaire, which produced a large, detailed and rich accumulation of data, only some of which can be reported here. This annex includes an account of some of the key findings from the Tanzania research within the three-country study, some of which are presented in tabular and graphic form, and summarises findings from correlations and other statistical analysis undertaken as part of the research project. Members

280
of the research team and other researchers are expected to publish further analysis on additional aspects of the findings in future publications. Internet users of this report should note that most of the charts contained in it need to be viewed (and, where appropriate, printed) in colour. The statistical analysis undertaken for this study used non-parametric statistical tests to look for the influence of various social groupings on behaviour. When looking at the influence of such social groupings, the analysis employed the Mann-Whitney U test to test for differences between two independent groups, and the Kruskal-Wallace H test to test for differences between three or more groups. Where such analysis is relevant to their presentation, tables in this paper present the probability (p value) that differences between the groupings have occurred by chance. Generally, only differences with a probability of less than 0.05 have been taken to indicate a relationship: i.e. statistical significance is taken to be represented by p =<0.05. Similarly, when considering correlations between two variables, it has only been assumed that a valid relationship exists where the p value associated with a Spearman Rank Order Correlation Coefficient is less than 0.05, and the correlation coefficient itself is greater than 0.2.
Section B : The research sample This section summarises the research sample resulting from the selection process and methodology described above and in the main research report. Findings from samples of similar size and character in the other research countries are analysed in separate Annexes A (India (Gujarat)) and B (Mozambique). Unless stated otherwise, tables in this annex indicate the number of actual respondents to particular questions and the valid percentage, i.e. the percentage of actual respondents to particular questions rather than the percentage of the total sample. (In table C.1 above, for example, they give percentages from the 714 respondents that answered the specific question concerned, rather than the 734 respondents in the total sample.) The Tanzania research sample included a total of 734 interviewees. These were drawn approximately equally from the three research locations. Sampling was designed to include a minimum of 15% of business people, to ensure that the sample would contain responses from individuals expected to be relatively high intensity users.
Table C.2 : Respondents by location
Location Frequency %age Hai 245 33.4
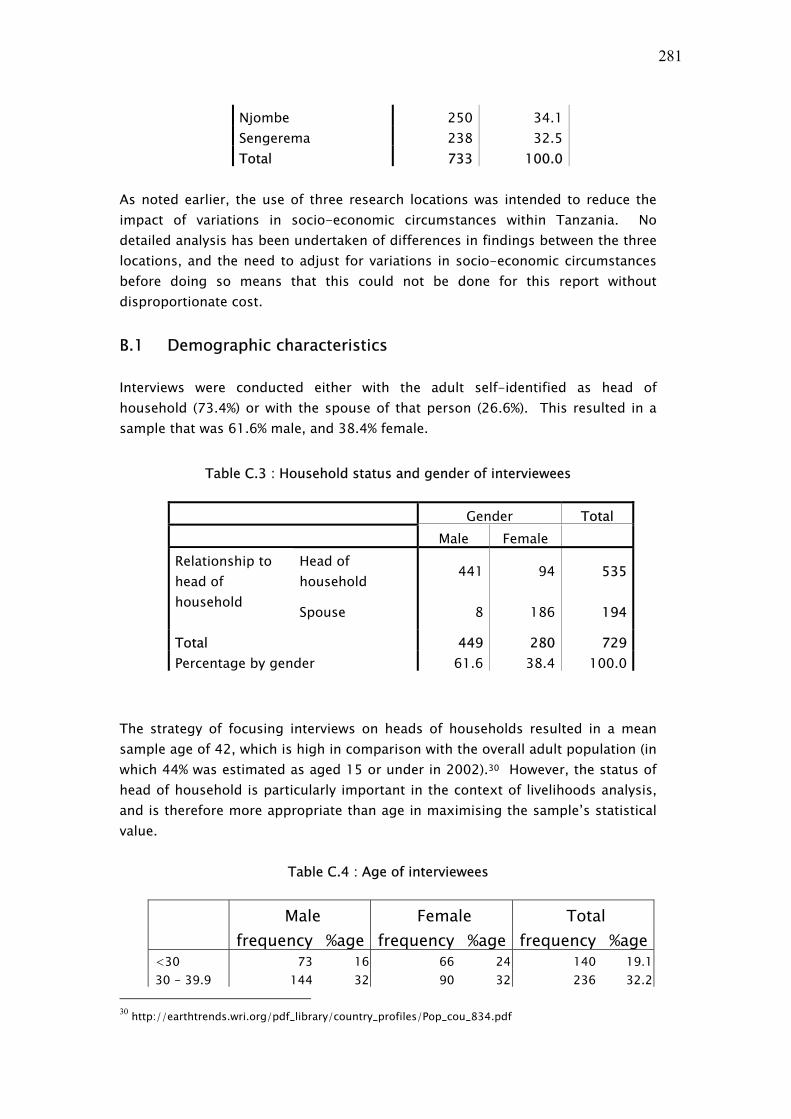
281
Njombe 250 34.1 Sengerema 238 32.5 Total 733 100.0
As noted earlier, the use of three research locations was intended to reduce the impact of variations in socio-economic circumstances within Tanzania. No detailed analysis has been undertaken of differences in findings between the three locations, and the need to adjust for variations in socio-economic circumstances before doing so means that this could not be done for this report without disproportionate cost.
B.1 Demographic characteristics Interviews were conducted either with the adult self-identified as head of household (73.4%) or with the spouse of that person (26.6%). This resulted in a sample that was 61.6% male, and 38.4% female.
Table C.3 : Household status and gender of interviewees
Gender Total Male Female
Head of household
441 94 535 Relationship to head of household
Spouse 8 186 194
Total 449 280 729 Percentage by gender 61.6 38.4 100.0
The strategy of focusing interviews on heads of households resulted in a mean sample age of 42, which is high in comparison with the overall adult population (in which 44% was estimated as aged 15 or under in 2002).30 However, the status of head of household is particularly important in the context of livelihoods analysis, and is therefore more appropriate than age in maximising the sample’s statistical value.
Table C.4 : Age of interviewees
Male Female Total frequency %age frequency %age frequency %age
<30 73 16 66 24 140 19.1 30 - 39.9 144 32 90 32 236 32.2
30 http://earthtrends.wri.org/pdf_library/country_profiles/Pop_cou_834.pdf

282
40 - 50 95 21 68 24 165 22.5 >50 136 30 54 19 190 25.9
448 278 731 99.6
The majority of the sample (77.7%) was educated to primary school level but not beyond, and a three-point education coding scale was therefore adopted for correlation analysis.
Table C.5 : Educational attainment level of interviewees
Frequency %age
No formal schooling 94 12.8Primary school 570 77.7Post primary 70 9.5Total 734 100.0
Almost all (96%) of those with no formal education responded to a question as to whether they could read and write. Over two thirds of this group is illiterate, representing approximately 9% of the total sample. This compares with estimated national adult illiteracy rates (2002) of 15% for men and 31% for women.31
B.2 Household characteristics and prosperity The mean household size of the sample is 5.8 persons, with a mean of 2.7 adults and a mean of 3.1 children aged 18 or under. 10% of sampled households had no resident children. The large majority of the sample (80%) claimed to have close family members (parents, children, direct siblings) living elsewhere in Tanzania, with 12% having immediate family members living in other countries. These diaspora figures were higher than those in the Indian sample, but lower than those in the Mozambican sample (which included a significant number of migrant workers). A number of indicators were used to establish levels of prosperity in interviewees’ households. These included direct questions concerning income and indirect questions concerning land tenure and ownership of a variety of assets (such as housing, land, access to water and electricity and mobile phones). Responses to these questions revealed that there was a close correlation between a number of
31 ibid.

283
indicators concerning levels of prosperity and social status – in particular, education, income, housing, ownership of key assets and land tenure. Income statements in questionnaires and interviews can be unreliable, either because interviewees are reluctant to reveal information or because they do not record this systematically. Mean declared income in the sample was TSh1.8million p.a. (approximately US$2250); median declared income TSh680,000 (approximately US$850). Distribution of income divided into four approximately equal groups: below TSh350,000 p.a., between TSh350,000 and TSh700,000, between TSh700,000 and TSh1.5million and above TSh1.5million. Distribution of household services, consumer goods and means of transport are often useful indicators of relative prosperity and the relative value attached to different products and services. Approximately 37% of interviewees’ households had access to protected water supplies and 15% to mains electric power, while only a small minority had personal means of transport other than a bicycle.

284
Table C.6: Access to services, ownership of consumer goods and means of transport by household
Questions:
“Which of the following do you have in your household?” (Services and consumer goods)
“Which of the following does your household own?” (Means of transport)
Frequency %age Services Protected water 271 36.9Electricity 110 15.0Consumer goodsRadio 627 85.5Television 72 9.8Refrigerator 33 4.5Fixed telephone 25 3.4Computer 10 1.4Means of transport Bicycle 472 85.7Car 23 4.4Motorbike 15 2.9Boat 12 2.3Truck 10 1.9Tractor 4 0.8
The strong correlations apparent between different household prosperity indicators suggested that the best approach to analysing their relationship to ICT usage and impact would be through the development of a composite prosperity index. A number of indicators were therefore used to establish levels of wealth and poverty in interviewees’ households. These included direct questions concerning income and indirect questions concerning land tenure and ownership of a variety of assets (such as housing, land, access to water and electricity and mobile phones). Questions relating to these indicators revealed close correlations between reported income, type of house, household possessions and means of transport owned. Quartile divisions of these four indicators were therefore used to develop a broad economic categorisation of households. (A reliability test on the four item scale produced a Cronbach Alpha coefficient of 0.6, indicating that it is reliable. However, the composite prosperity index can only be calculated for 70% of interviewees (those that responded to questions concerning transport assets.

285
This composite prosperity index correlated with most of the individual prosperity indicators, confirming that it is a reasonable indicator of poverty. Land tenure and livestock ownership, however, did not generally correlate with other income/wealth indicators, and so were not included in the composite index; though it is interesting to note that both correlate with the composite index.) The distribution of the composite prosperity index is set out in the following table.
Table C.7 :: Distribution of composite prosperity index
Frequency Percent Poorest 107 21.0Poor 154 30.3Medium 143 28.1Richest 105 20.6Total 509 100.0
Note that N = 509 as not all respondents provided income data.
B.3 Household occupation and sources of income Most households in rural areas of developing countries have several sources of income. Interviewees were asked to identify up to three significant sources of income for their households. 73% of the sample claimed to have two sources of income, and 11% cited three, with only 16% of households claiming to be dependent on a single income source. The majority of the sample (57.4%) cited “farming” (including crop and livestock farming and, for this purpose, fishing) as their main source of household income. Just under a quarter (23.8%) cited “business” activity: although this is relatively difficult to distinguish from “trading”, explicitly identified by only 3.7% of the sample as their main source of household income. The Tanzania research team suggests that businesses are probably characterised by their premises (e.g. shops and restaurants) while traders tend to sell only a single item (e.g. local beer, sorghum, rice or fish), not necessarily from fixed premises. No other identified occupational group accounted for more than 4% of the sample.

286
Table C.8 : Main source of income
Frequenc
y %age Business 175 23.9 Farmer (incl livestock & fishing)
421 57.5
Labourer 13 1.8 Trader 27 3.7 Salaried 28 3.8 Skilled craftsman (inc. builder)
27 3.7
Professional / self-employed
13 1.8
Other 28 3.8 Total 732 100.0
Farming and business activity also predominated in the second and third sources of household income identified by respondents. In practice, the large majority of interviewees cited farming as their first or second income source: overall, 93% of the sample claimed to generate some income from farming and/or fishing. Within farming, interviewees reported the following levels of livestock ownership.
Table C.9 : Livestock ownership
Livestock Frequenc
y %age Cattle 328 45.0
more than 10 cattle 40 5.4 Sheep 100 13.8 Goats 228 31.3 Poultry 490 67.7
There are clear differences in wealth between groups with different main sources of household income. The composite prosperity index described above suggests that business households – defined as those giving their primary source of household income as “business” – were the most prosperous group within the sample. Those declaring their primary household income source as “farming” were on average poorer than business people (with a composite wealth/poverty index figure of 8.99 as against 10.87), but income levels amongst these farming households varied widely.

287
Table C.10 : Composite poverty index by household occupational group (primary declared source of household income)
Main source of household income
Total income
Composite poverty index
N Mean N Mean Business 173 3367000 121 10.87 Salaried 28 2016000 16 10.81 Professional / self-employed 13 1576000 8 10.63 Other 28 2029000 15 9.47 Skilled craftsman (inc. builder) 27 1245000 14 9.21 Trader 27 1723000 20 9.20 Farmer (inc. livestock & fishing) 417 1187000 304 8.99 Labourer 13 658000 11 8.27 Total 726 1790000 509 9.53
The relatively small number of interviewees declaring a main source of income other than farming and business suggested that it would be appropriate to develop a shorter list of household occupational groups for correlation analysis. The following abbreviated household occupational categories were adopted.
Table C.11 : Abbreviated household occupational categories
Household occupational
category Frequenc
y Valid
Percent Unskilled 40 5.5 Skilled 55 7.5 Farming 421 57.5 Salaried and business 216 29.5 Total 732 100.0
Finally, in this context, interviewees were asked a number of questions concerning financial dependence on family members living elsewhere in Tanzania or outside the country. The results indicated that 32.2% of households received support of some kind from relatives, with approximately 28% receiving financial support (remittances). However, most recipients of such support regarded its importance as “slight” or “moderate”. Noticeably, hardly any interviewees received a mobile phone from relatives.

288
Table C.12 : Family support
Questions: “What, if any, type of support do you receive from family members living
elsewhere?” “To what extent is your household dependent on support from family members
living elsewhere?”
Type of support Frequency Percentage Money 204 29.2 Clothing 119 17.1 Mobile telephone 7 1.0 Other 52 7.5 None 486 67.9
Degree of dependence Frequency
%age of those
indicating some
support
%age of total
sample No dependence 23 8.8 3.1 Slight 140 53.4 19.1 Moderate 71 27.1 9.7 High 28 10.7 3.8 No dependence 472 64.3 Total 734 100.0
B.4 Perceptions of livelihood context Interviewees were asked a series of questions designed to indicate their perception of trends in overall livelihoods context, i.e. the social and economic environment for them and their families, over the previous two years. Each of these questions sought responses on a five-point scale, in which the response “-2” indicates that the situation was much worse than it had been two years previously, the response “0” that there has been no perceived change, and the response “+2” that the situation is much better. Results from these questions indicated that interviewees feel that the overall circumstances of their lives had improved significantly during the previous two years, with nine out of ten indicators showing significant positive returns. Mean outcomes are reported in the following table.

289
Table C.13 : Change in contextual issues over past two years
Contextual issues
Random sample n = 734 N Mean
Range : (1 = much worse to 5 much better) Access to telecommunications changed 711 1.63 Relationships with family members 733 1.51 Education opportunities for your children 640 1.35 Relationships with your friends 734 1.34 Support from family members living elsewhere 254 1.04 The health of your family members 734 0.88 General security in your neighbourhood 734 0.76 Quality of government services (e.g. levels of corruption) 734 0.72 Your own level of knowledge and education 709 0.66 Your household income 734 0.15 Mean of all issues Cronbach Alpha coefficient of scale reliability 208 0.497
There are few differences evident within these data between telephone owners, telephone users and non-users of telephony. Of these three categories, telephone owners report seeing greater improvement in knowledge and education (though there is no significant reported difference between telephone users and non-users). Similarly, perceived support from family members living elsewhere has increased more amongst telephone owners, but no significant difference is evident between users and non-users. One frequently-cited characteristic of increased availability of telephony is its capacity to reduce the requirement for travel in rural areas. Interviewees were also asked about changes in their need to travel during the previous two years. Telephone owners, users and non-users all registered a modest reduction in the need to travel during the past two years – with no significant differences between these groups. However, there is little evidence of a link between frequency of use and changes in need to travel. This issue is considered further in section D below, which considers information and communication flows. Perception of changed access to telecommunications over the past two years was correlated with perceived changes in the general livelihood indicators in order to test for any association between these data.

290
Table C.14: Correlations between perceived change in access to telecommunications and perceived change in other contextual issues
Correlation Coefficient
The health of your family members Education opportunities for your children (0 if no children) 0.217***Your own level of knowledge and educationGeneral security in your neighbourhood Your household income Support from family members living elsewhere Relationships with family members 0.234***Relationships with your friends Quality of government services (e.g. levels of corruption) Financial capital indicators (213+21f) Social capital indicators (21g+21h) 0.205***Human capital indicators (21a+21b+21c) 0.202***
For the sample as a whole, perception of improved access to telecommunications appears to be associated with perception of improvements in social indicators (notably relationships with family members) and human indicators (knowledge and information). These correlations do not necessarily suggest any causal relationship. However, they indicate that the value of the telephone for social networking is consistent across all social groups, a finding confirmed by results reported in sections D and E below. The relationship with human capital is less significant because, as shown in sections D and E, the telephone is little used or valued within the sample for obtaining access to information resources.
Section C: Ownership, access and use of means of communication This section of the annex summarises findings concerning the availability and use of telephony within the three research locations.
C.1 Use and frequency of use of ICTs It is important, first of all, to place the ownership and use of telephony within a context of other information and communication technologies.

291
Table C.15 : Ownership, access and use of different ICTs
Ownership Access Use (within
past year) Use of different ICTs % % %
Radio 85.3 99.5 95.6 Television 9.7 65.3 45.6 Mobile telephone 17.3 96.0 61.2 SMS 95.4 33.5 Telephone kiosk 43.7 21.3 Private fixed telephone 3.4 28.3 9.8 Email / Internet 5.6 2.0 Fax 5.6 0.8
Not surprisingly for a low-income African community, broadcast radio is the most widely used information and communication technology available, with almost 100% access and close to universal usage rates. Access to television is now also widely available, though ownership is still largely confined to the more prosperous. Just under half the sample population reported using a television within the previous twelve months, compared with over 95% reporting use of broadcast radio. Interviewees were also asked about frequency of use of different ICTs, with the following results. Figures in the table below represent means on the five point scale indicated in the following chart (in which 1 = “not used” and 5 = “one or more times each day”).
Table C.16 and Figure C.3 : Frequency of use of different ICTs
ICTs n 734
Range = 1 to 5 Mean Radio 4.51Mobile phones 2.32TV 2.06SMS 1.79Phone kiosk 1.37Private fixed line phone 1.17Email / internet 1.03Personal computer 1.03Fax 1.01Telephone combined frequency of use (Kiosk + Mobile + Fixed) 1.62

292
0% 20% 40% 60% 80% 100%
Radio
Mobile phones
TV
SMS
Phone kiosk
Private f ixed phone
Email / internet
Personal computer
Fax
percent of sample
1 or more times a day
1 or more times a w eek
more than once a month
less than once a month
Not used
Use of television is closely related to economic and educational status, while radio use is much more widely distributed throughout the population.
Table C.17 : Mean valuations of intensity of use of broadcasting according to socio-economic criteria
Means (range 1 to 5)
Radio TV
Economic status Poorest 3.87 1.52 Poor 4.6 1.56 Average 4.8 2.2 Rich 4.91 3.23 Educational status No schooling 3.71 1.36 Primary school 4.59 2.01 Post primary 4.94 3.47
C.2 Telephone ownership and use Mobile telephones are the primary mode of access to telephony, as they are elsewhere in Africa (but not in the Indian sample for this study). Access to mobile telephone networks is near to universal, and mobile phones belonging to others are widely used by those who do not own telephones of their own, as well as telephone kiosks (which are less accessible)

293
The following chart demonstrates the overlapping modes of access identified by the sample in Tanzania.
Figure C.4 : Distribution of telephone use
Mobile
Kiosk
Fixed
267
105
16
287
1126
Telephone ownership is somewhat more widespread than television ownership. Amongst the sample as a whole, respondents reported that 17.3% of households had one or more household members with private access to a mobile phone, while 4.6% of these households had more than one mobile phone available. (These figures are substantially higher than the mobile teledensity rate for Tanzania as a whole. This tends to confirm the suggestion that the sample is more prosperous than the average for rural Tanzania, and ownership rates in the above table should not be generalised to the national or rural population as a whole. However, this does not affect the value of the data for analysis of the behaviour of telephone users, which is the primary objective of this research.) The large majority of mobile phones were owned by heads of households. Mobile coverage has clearly been available for a while in the survey areas, as almost a third of owners have had their phones for over two years. However, half of owners have acquired theirs in the last year, suggesting a rapid rate of growth in mobile ownership which is consistent with experience elsewhere in Africa. Only seven respondents of those with mobile phones (under 1.0% of the total sample) had been provided with their phone by relatives living elsewhere. In addition, 3.4% of households had a private fixed line (a slightly higher figure than in the national population). Most of these also had mobile phones. A total of 18.5% of the total sample, therefore, had private access to a telephone, while the remaining 80% relied on public access either by using other people’s private facilities or through kiosks/phoneshops. Telephone ownership is clearly highly valued in itself. Of those who did not currently have a mobile phone, 59.9% said that they were likely to own one within

294
the next year (29.6% highly likely). While not all of these will, in practice, make such an acquisition within the year, this again indicates the importance of assessing behavioural trends in data analysis of telecommunications behaviour and impacts. If only half of aspiring purchasers do as they wish, the social impact of telephony could be very substantially increased.
Table C.18: Expressed intention to own a mobile phone
Question: If you do not own a phone now, how likely are you to own one within the next
year?
Frequency %age Very unlikely 97 15.6 Unlikely 95 15.3 No opinion 57 9.2 Likely 188 30.3 Very likely 184 29.6 Total 621 100.0
C.3 Frequency of use of telephony Access to telephone networks within the sample areas is almost universal (see section A above). The availability of access was clearly recognised by interviewees, all but 3.5% of whom claimed to have access to mobile telephony. Only some half of the sample population claimed access to a telephone kiosk, and a quarter access to a private fixed line. These data are reported in section C.1 above. A substantial majority of those with access to mobile phones had made use of this at least once during the previous year (61.3% of the total sample). However, it is notable that a much higher proportion of respondents had made use of a mobile telephone than of a telephone kiosk during the previous twelve months. Data on the frequency of use of kiosks and private fixed line phones indicate that both have seen a decline in use, though use of kiosks has remained roughly constant among high intensity users. However, the relatively low level of kiosk use suggests that it may be difficult to build a sustainable small business model around telephony services alone in rural Tanzania, and that mobile telephone access could be displacing use of fixed facilities. As well as identifying modes of access used, interviewees were asked for information regarding their frequency of telephone usage. Respondents indicated their frequency of phone use across three means of access – private fixed lines, mobile phones (both personal and borrowed) and kiosks/phoneshops.

295
Table C.19 and Figure C.5 : Frequency of use of telephone services
1 or more times per day
1 or more times per week
More than once a month
less than once a month
Not used
Mobile 9.5 12.4 16.8 22.5 38.6SMS 6.7 8 8.9 9.9 66.2kiosk 0.8 3.3 7.1 10.1 78.6private fixed 0.4 1.5 2.6 5.3 90.1email/internet 0.0 0.3 0.7 1.1 97.8Fax 0 0 0.5 0.3 98.4
0%20%40%60%80%100%
Mobile
SMS
kiosk
private f ixed
email/internet
Fax
% sample
1 or more times a day1 or more times a weekmore than once a monthless than once a monthNot used
These responses have been summed in order to create a combined single indicator representing overall intensity of phone use.
Table C.20 : Intensity of telephone use (all forms of telephony)
Frequency Valid
Percent none 249 34.0Low 140 19.1medium 198 27.0intense 145 19.8Total 732 100.0
The following differences in frequency of use of mobiles are worth noting:

296
• Mobile use is greater among men than among women; • Those with higher levels of education and economic status are more
intensive users; • Salaried and business people are the most intensive users, followed by
skilled workers; • Mobile phone use is lowest amongst unskilled workers and farmers.
The data on changes in telephone usage show that there has been a significant reduction in the number of people in the sample using kiosks and private fixed lines since the advent of mobile phones. Frequency of use of mobile telephones also correlates strongly with prosperity – both with total income and with the composite prosperity index. Use of kiosks is, however, only weakly correlated with these prosperity indicators. This suggests that intensity of use of mobile phones is particularly sensitive to wealth, i.e. that only the better-off make frequent use of mobiles.
Table C.21 : Mean valuations of intensity of use of telephony according to socio-
economic criteria Means (range 1 to 5)
Phone kiosk
Mobile phones
SMS Private fixed line
phone
Intensity of phone use
Economic status Poorest 1.17 1.54 1.34 1.05 1.25Poor 1.22 1.96 1.53 1.05 1.41Average 1.38 2.54 1.91 1.13 1.68Rich 1.73 3.54 2.75 1.38 2.22Educational status No schooling 1.17 1.52 1.16 1.01 1.23Primary school 1.36 2.29 1.74 1.15 1.60Post primary 1.72 3.64 3.06 1.51 2.29Gender Male 1.41 2.49 1.90 1.18 1.69Female 1.32 2.03 1.62 1.15 1.50

297
Table C.22 : Correlations between frequency of use of access points and wealth/poverty indicators
Frequency of use: Phone kiosk
Frequency of use: Mobile phones
Composite poverty index
Service coverage
Total income
Frequency of use: Phone kiosk
.302(**) .209(**) .203(**) .153(**)
Frequency of use: Mobile phones
.302(**) .504(**) .164(**) .437(**)
Composite prosperity index
.209(**) .504(**) -.083 .785(**)
Service coverage .203(**) .164(**) -.083 -.129(**)Total income .153(**) .437(**) .785(**) -.129(**)
** Correlation is significant at the 0.01 level (2-tailed).
Use of phone kiosks, however, is also greatest among the business occupational group. Farming and unskilled household members make less use of kiosks. Surprisingly, perhaps, there is no difference between phone owners and other users (non-owners) in their use of kiosks; while the better educated and wealthier groups (which tend to overlap with each other and with phone owners) also make frequent use of kiosks. Part of the explanation for this may lie in the fact that they use kiosks when out of airtime or cellphone battery life – but more investigation is needed before any firm conclusion can be drawn. Mobile phones are not only used for voice telephony. Over 50% of mobile phone users reported using phones to send SMS (text) messages, while almost 40% reported “beeping” or using the mobile telephone as a paging device (i.e. hanging up before completion of an outgoing call in the expectation that the recipient – for example, a wealthier urban relative – will return the call, or using an SMS to solicit a return call). A large majority of those making use of others’ mobile phones, incidentally, ask the phone owner to dial their call rather than doing so themselves.
C.4 Expenditure on telephony Finally, in this section of the questionnaire, interviewees were asked to report their average monthly expenditure on telephone use. At relatively low levels of use and low incomes, recollection of this is likely to be reasonably accurate, though not precise. Aggregate figures, combining mobile phone owners and users, are as follows. (Data disaggregating private phone lines and kiosks are not available.)

298
Table C.23 : Reported expenditure on mobile phones
Question: How much do you spend on mobile phone use per month?
Frequency %age of
total sample
%age of mobile phone users
Not used 276 38.7 n/a <5000/- 305 41.4 69.79 5001/- to 10000/- 84 11.8 19.22 10001/- to 20000/- 27 3.7 6.18 >20000/- 21 2.9 4.81 Total 713 100.0 100.0
Mean expenditure per month amongst mobile phone users was 5500 Shillings, about 20% higher than mean expenditure amongst users of public kiosks (4400 Shillings). (Some users will be included in both categories.) (At the time of the survey, one thousand Tanzania shillings were equivalent to approximately US$0.93.) Significant variations in expenditure are evident in different social categories. In particular:
• expenditure is highest among the 30-40 age group, and lowest among the elderly (over 50);
• expenditure is almost twice as high for men as for women; • expenditure is highest among salaried and business people, and lowest
among those whose main income is farming and unskilled workers. Not surprisingly, expenditure on mobile telephone use is much higher among the more prosperous than among the poor. However, this does not mean that telephone expenditure is less important as a proportion of disposable income for the poor. On the contrary, while total expenditure on telephone usage represents 3.0% of declared household income for the sample as a whole, poorer interviewees were spending a much greater proportion of their household income on phone use, with an average of over 11% in the poorest group. As noted earlier, data for declared household income need to be treated with some caution. Table C.24 below divides the population into four prosperity categories described in section B.2 above (according to four prosperity indicators, only one of which is based on declared income), and indicates the percentage of declared income which each category spends on telecommunications. The relatively low
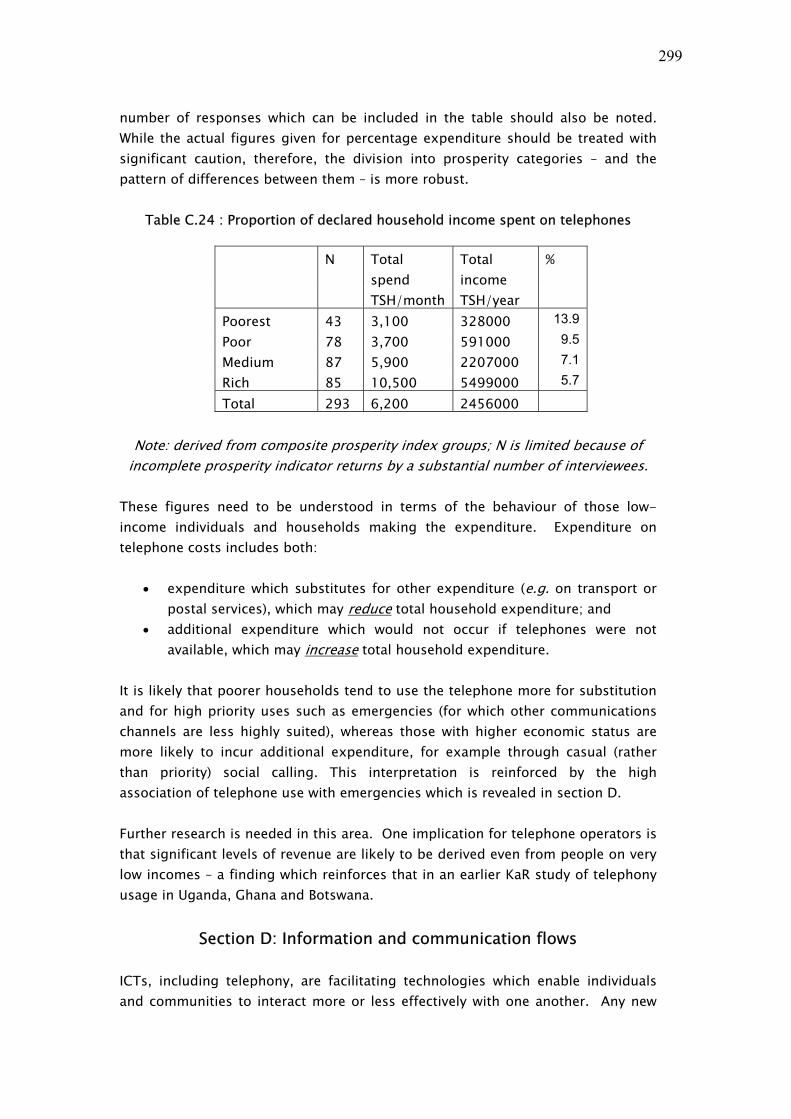
299
number of responses which can be included in the table should also be noted. While the actual figures given for percentage expenditure should be treated with significant caution, therefore, the division into prosperity categories – and the pattern of differences between them – is more robust.
Table C.24 : Proportion of declared household income spent on telephones
N Total spend
Total income
%
TSH/month TSH/year Poorest 43 3,100 328000 13.9
Poor 78 3,700 591000 9.5
Medium 87 5,900 2207000 7.1
Rich 85 10,500 5499000 5.7
Total 293 6,200 2456000
Note: derived from composite prosperity index groups; N is limited because of incomplete prosperity indicator returns by a substantial number of interviewees.
These figures need to be understood in terms of the behaviour of those low-income individuals and households making the expenditure. Expenditure on telephone costs includes both:
• expenditure which substitutes for other expenditure (e.g. on transport or postal services), which may reduce total household expenditure; and
• additional expenditure which would not occur if telephones were not available, which may increase total household expenditure.
It is likely that poorer households tend to use the telephone more for substitution and for high priority uses such as emergencies (for which other communications channels are less highly suited), whereas those with higher economic status are more likely to incur additional expenditure, for example through casual (rather than priority) social calling. This interpretation is reinforced by the high association of telephone use with emergencies which is revealed in section D. Further research is needed in this area. One implication for telephone operators is that significant levels of revenue are likely to be derived even from people on very low incomes – a finding which reinforces that in an earlier KaR study of telephony usage in Uganda, Ghana and Botswana.
Section D: Information and communication flows ICTs, including telephony, are facilitating technologies which enable individuals and communities to interact more or less effectively with one another. Any new
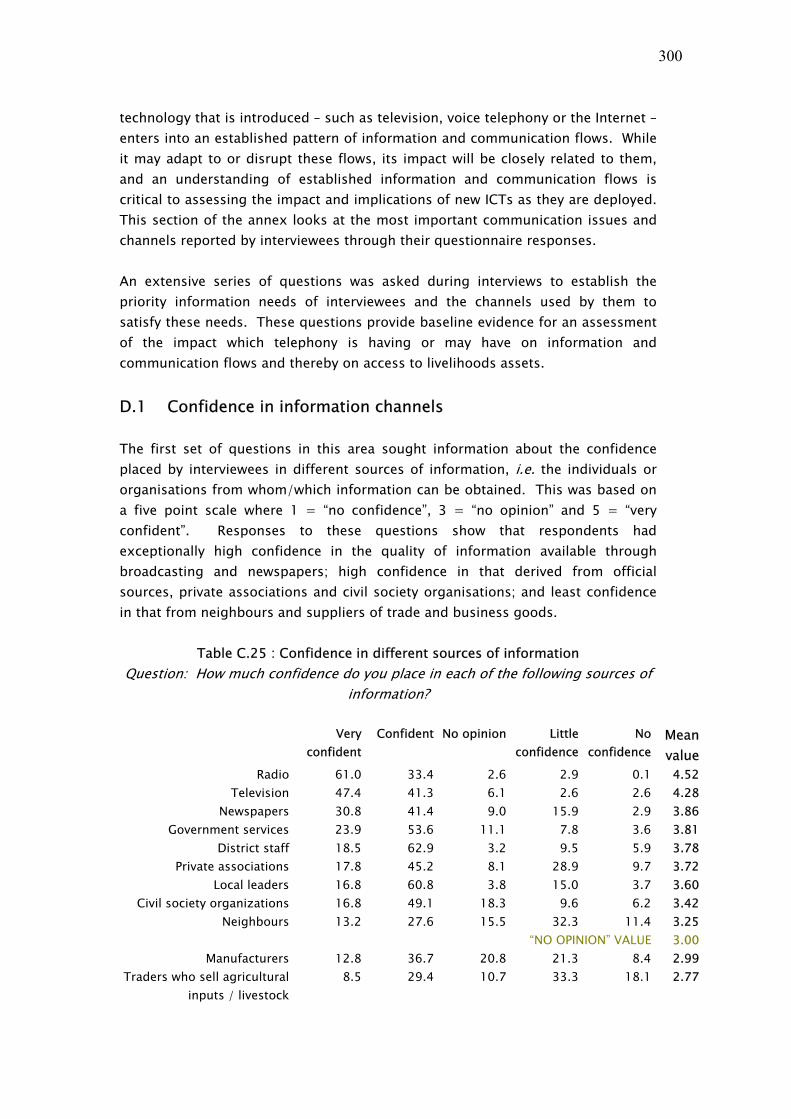
300
technology that is introduced – such as television, voice telephony or the Internet – enters into an established pattern of information and communication flows. While it may adapt to or disrupt these flows, its impact will be closely related to them, and an understanding of established information and communication flows is critical to assessing the impact and implications of new ICTs as they are deployed. This section of the annex looks at the most important communication issues and channels reported by interviewees through their questionnaire responses. An extensive series of questions was asked during interviews to establish the priority information needs of interviewees and the channels used by them to satisfy these needs. These questions provide baseline evidence for an assessment of the impact which telephony is having or may have on information and communication flows and thereby on access to livelihoods assets.
D.1 Confidence in information channels The first set of questions in this area sought information about the confidence placed by interviewees in different sources of information, i.e. the individuals or organisations from whom/which information can be obtained. This was based on a five point scale where 1 = “no confidence”, 3 = “no opinion” and 5 = “very confident”. Responses to these questions show that respondents had exceptionally high confidence in the quality of information available through broadcasting and newspapers; high confidence in that derived from official sources, private associations and civil society organisations; and least confidence in that from neighbours and suppliers of trade and business goods.
Table C.25 : Confidence in different sources of information Question: How much confidence do you place in each of the following sources of
information?
Very confident
Confident No opinion Little confidence
No confidence
Mean value
Radio 61.0 33.4 2.6 2.9 0.1 4.52Television 47.4 41.3 6.1 2.6 2.6 4.28
Newspapers 30.8 41.4 9.0 15.9 2.9 3.86Government services 23.9 53.6 11.1 7.8 3.6 3.81
District staff 18.5 62.9 3.2 9.5 5.9 3.78Private associations 17.8 45.2 8.1 28.9 9.7 3.72
Local leaders 16.8 60.8 3.8 15.0 3.7 3.60Civil society organizations 16.8 49.1 18.3 9.6 6.2 3.42
Neighbours 13.2 27.6 15.5 32.3 11.4 3.25“NO OPINION” VALUE 3.00
Manufacturers 12.8 36.7 20.8 21.3 8.4 2.99Traders who sell agricultural
inputs / livestock 8.5 29.4 10.7 33.3 18.1 2.77

301
These data can also be presented graphically, as follows.
Figure C.6 : Confidence in different sources of information
0% 20% 40% 60% 80%100%
Radio
Television
New spapers
Government services
District staf f
Private associations
Local leaders
Civil society organizations
Neighbours
Manufacturers
Traders w ho sell agricultural inputs / livestock
Very confidentConfidentNo opinionLittle confidenceNo confidence
Interviewees were also asked about changes in the frequency of their consultation of these sources over the past two years (using a five-point scale where -2 = “much less”, 0 = “no change” and +2 = “much more”).
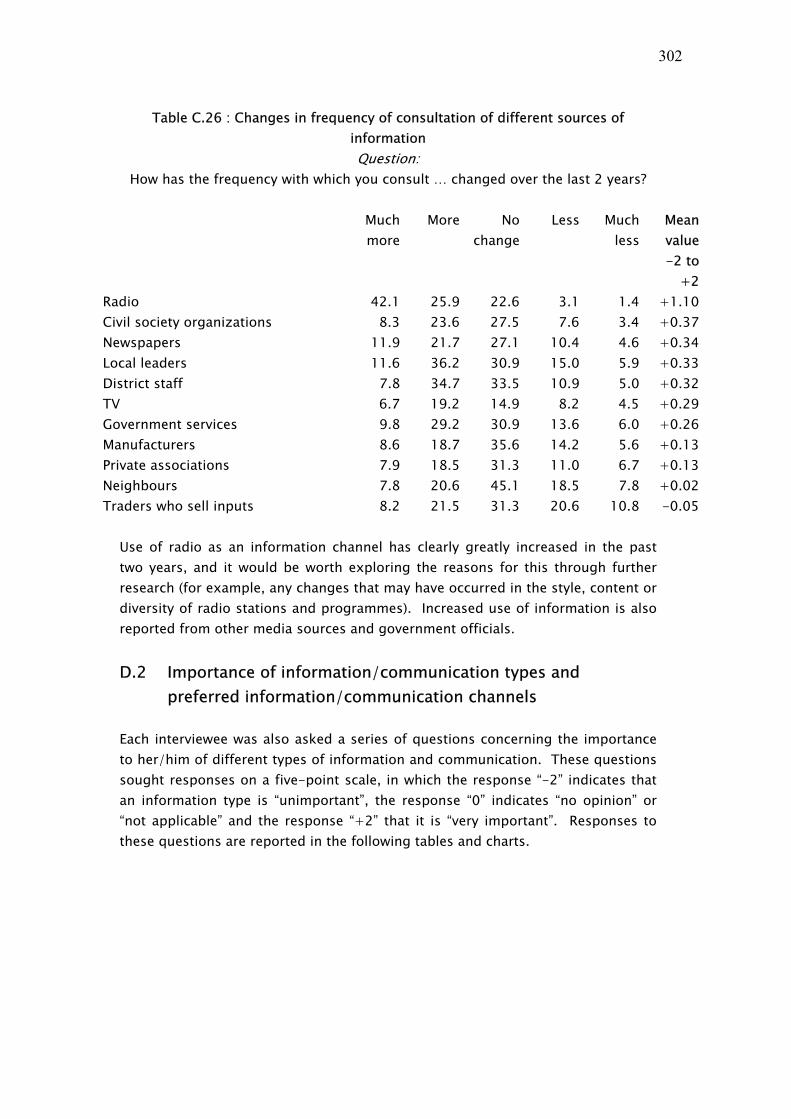
302
Table C.26 : Changes in frequency of consultation of different sources of information Question:
How has the frequency with which you consult … changed over the last 2 years?
Much more
More No change
Less Much less
Mean value-2 to
+2Radio 42.1 25.9 22.6 3.1 1.4 +1.10Civil society organizations 8.3 23.6 27.5 7.6 3.4 +0.37Newspapers 11.9 21.7 27.1 10.4 4.6 +0.34Local leaders 11.6 36.2 30.9 15.0 5.9 +0.33District staff 7.8 34.7 33.5 10.9 5.0 +0.32TV 6.7 19.2 14.9 8.2 4.5 +0.29Government services 9.8 29.2 30.9 13.6 6.0 +0.26Manufacturers 8.6 18.7 35.6 14.2 5.6 +0.13Private associations 7.9 18.5 31.3 11.0 6.7 +0.13Neighbours 7.8 20.6 45.1 18.5 7.8 +0.02Traders who sell inputs 8.2 21.5 31.3 20.6 10.8 -0.05
Use of radio as an information channel has clearly greatly increased in the past two years, and it would be worth exploring the reasons for this through further research (for example, any changes that may have occurred in the style, content or diversity of radio stations and programmes). Increased use of information is also reported from other media sources and government officials.
D.2 Importance of information/communication types and preferred information/communication channels
Each interviewee was also asked a series of questions concerning the importance to her/him of different types of information and communication. These questions sought responses on a five-point scale, in which the response “-2” indicates that an information type is “unimportant”, the response “0” indicates “no opinion” or “not applicable” and the response “+2” that it is “very important”. Responses to these questions are reported in the following tables and charts.

303
Table C.27 : Importance of types of information/communication
Question:
How important are the following types of information for you in general?
( Mean Preferred means of communication Range -2
to +2) Face-to-
faceRadio Phone Other
Urgent e.g. emergencies, deaths – Importance +1.88 26 7 55 12News about sick relatives - Importance +1.82 29 1 53 17How to prevent and treat illness within the family - Importance +1.58 51 26 0 23Information about friends and family members - Importance +1.56 29 0 35 36Market information - Importance +1.42 71 19 6 4Weather information - Importance +1.42 11 78 0 11Crop management - Importance +1.31 66 13 0 21News (local and international) - Importance +1.27 3 80 0 17Government and legal requirements (e.g. taxes, regulations) - Importance +1.22 16 43 0 41Availability and costs of inputs to purchase - Importance +1.21 78 13 5 4Education opportunities (schools and further education) - Importance +1.21 34 8 3 55Information on new products e.g. pesticides, seeds - Importance +1.11 55 28 1 16Social and religious events e.g. marriages - Importance +1.11 41 0 10 49Livestock management & health - Importance +1.09 55 13 0 32Availability of credit and subsidies - Importance +1.03 40 12 1 47Information on clients and debtors e.g. ability to pay - Importance +1.02 56 4 1 39
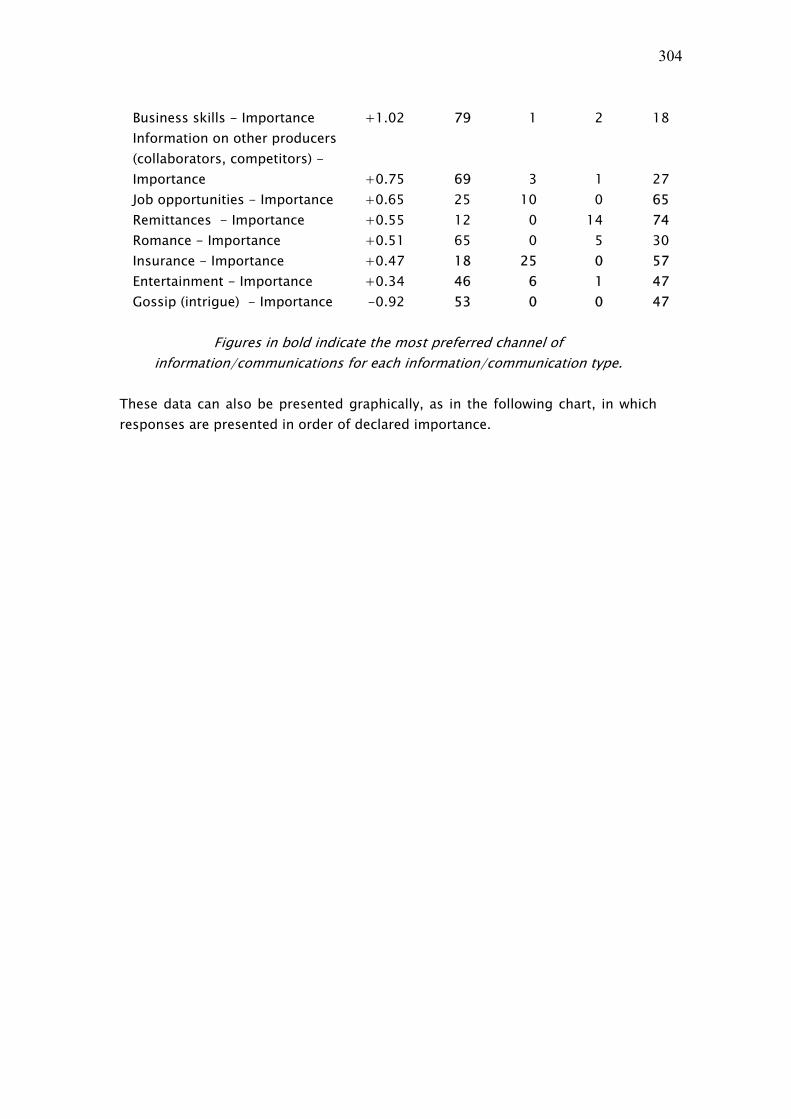
304
Business skills - Importance +1.02 79 1 2 18Information on other producers (collaborators, competitors) - Importance +0.75 69 3 1 27Job opportunities - Importance +0.65 25 10 0 65Remittances - Importance +0.55 12 0 14 74Romance - Importance +0.51 65 0 5 30Insurance - Importance +0.47 18 25 0 57Entertainment - Importance +0.34 46 6 1 47Gossip (intrigue) - Importance -0.92 53 0 0 47
Figures in bold indicate the most preferred channel of
information/communications for each information/communication type. These data can also be presented graphically, as in the following chart, in which responses are presented in order of declared importance.

305
Figure C.7 : Importance of types of information/communication
Question:
How important are the following types of information for you in general?
0% 20% 40% 60% 80% 100%
Urgent e.g. emergencies, deaths - Importance
News about sick relatives - Importance
How to prevent and treat illness within the family - Importance
Information about friends and family members - Importance
Market information - Importance
Weather information - Importance
Crop management - Importance
News (local and international) - Importance
Government and legal requirements (e.g. taxes, regulations) - Importance
Availability and costs of inputs to purchase - Importance
Education opportunities (schools and further education) - Importance
Information on new products e.g. pesticides, seeds - Importance
Social and relig ious events e.g . marriages - Importance
Livestock management & health - Importance
Availability of credit and subsidies - Importance
Information on clients and debtors e.g. ability to pay - Importance
Business skills - Importance
Information on other producers (collaborators, competitors) - Importance
Job opportunities - Importance
Remittances - Importance
Romance - Importance
Insurance - Importance
Entertainment - Importance
Gossip (intrigue) - Importance
Very importantImportantNeitherNot very importantUnimportantNo opinion
These data show clearly the very high importance attached to urgent and emergency requirements for information and communication, and to social information and communication, particularly within the family. This finding is consistent with those in the other two research countries. Lower importance is attached by the sample as a whole to other information and communication needs. In terms of social classification, all types of information described tend to be valued more highly by those with higher levels of educational attainment and higher economic status (as measured by the composite prosperity index). However, these differences disappear in issues of highest importance (such as urgency) and in some other areas (such as social and religious events), whose importance is evenly spread amongst socio-economic categories. The following table presents data concerning differences in the findings concerning information and communication needs that are clearly associated with

306
farming and business information according to the primary source of household income within the sample.
Table C.28: Importance of information/communication needs according to primary household income source
Overall sample
Farming households
Salaried and business
households Weather information 1.42 1.44 1.50Market information 1.42 1.43 1.44Crop management 1.31 1.39 1.42Availability and costs of inputs to purchase
1.21 1.24 1.38
Livestock management & health 1.09 1.17 1.34Government and legal requirements (e.g. taxes, regulations)
1.22 1.13 1.33
Information on new products e.g. pesticides, seeds
1.11 1.11 1.29
Availability of credit and subsidies 1.03 1.00 1.28Information on clients and debtors e.g. ability to pay
1.02 0.92 1.17
Business skills 1.02 0.85 1.13Information on other producers (collaborators, competitors)
0.75 0.64 1.12
Remittances 0.55 0.54 0.80Job opportunities 0.65 0.53 0.73Insurance 0.47 0.31 0.63 Surprisingly, perhaps, this does not indicate any strong differences in the perceptions of importance between these household occupational categories and the overall sample. Interviewees were also asked to identify the primary means of communication which they use or would use for each type of information. These data can also be presented graphically, again presented in the order of declared importance. In this figure:
• bars in variants of blue signify means of communication based on the telephone
• bars in variants of red signify means based on the media • and bars in variants of green signify means based on face-to-face
communication.

307
Figure C.8 : Most commonly used means of accessing different types of information/communication
Question:
Which means do you most commonly use to access or share each type of information?
0% 20% 40% 60% 80% 100%
Urgent e.g. emergencies, deaths -
News about sick relat ives -
How to prevent and t reat illness within the family -
Info rmat ion about f riends and family members -
M arket informat ion -
Weather informat ion -
Crop management -
News (local and internat ional) -
Government and legal requirements (e.g. taxes, regulat ions) -
Availab ilit y and costs of inputs to purchase -
Educat ion opportunit ies (schools and further educat ion) -
Info rmat ion on new products e.g . pest icides, seeds -
Social and relig ious events e.g. marriages -
Livestock management & health -
Availab ility of credit and subsid ies -
Informat ion on clients and deb tors e.g. ability to pay -
Business skills -
Informat ion on other producers (co llaborato rs, compet itors) -
Job opportunit ies -
Remit tances -
Romance -
Insurance -
Entertainment -
Gossip (int rigue) -
PhoneSMSInternetLettersTVRadioNewspaperAdvertsVillage info centreLocal leadersFace to faceNot applicable
Communications within formal social networks were also tested by a series of questions concerning group participation. Of the relatively small proportion who were group members (30%), 77.4% described the primary means of communication within the group as being face-to-face communications, with only 2.3% citing the telephone. Looked at through these data, information sources can be divided into three broad categories:
• The telephone is by far the most important information channel for emergency use and for important social communications within the family, and is used for a high proportion of such needs. This contrasts with its relative unimportance in other areas of information flow.
• Broadcast radio is overwhelmingly the most important channel for general information such as local and international news and weather.
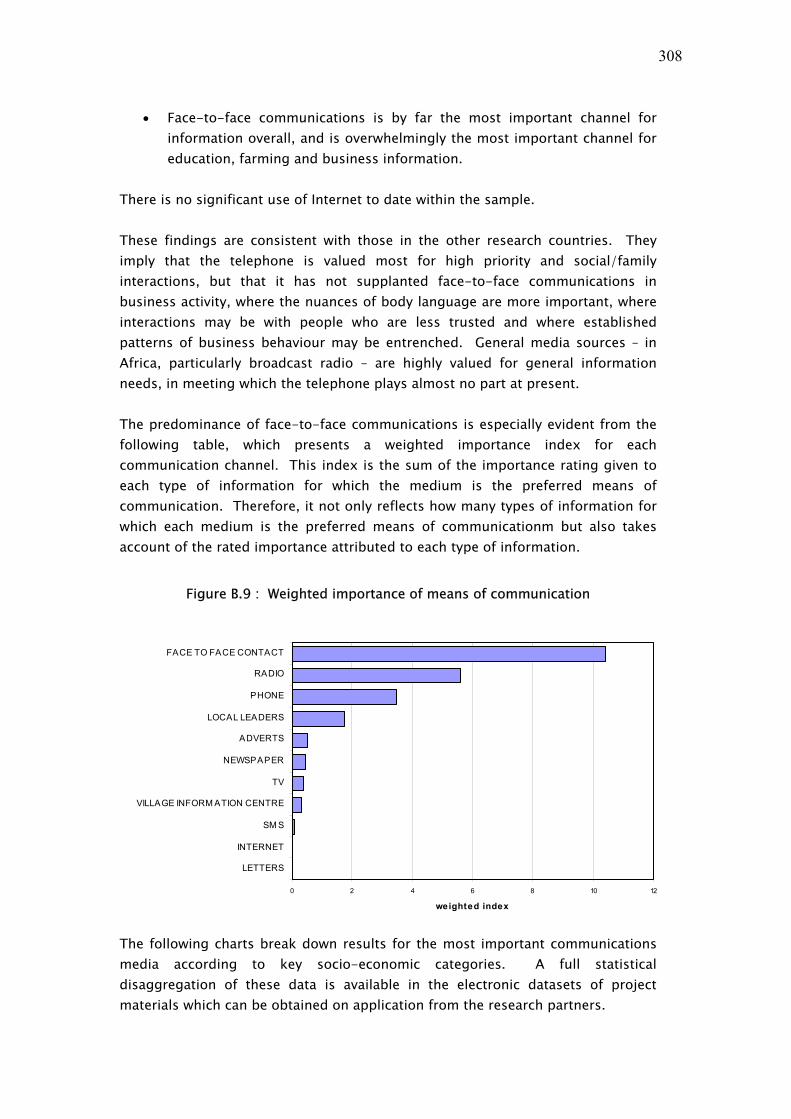
308
• Face-to-face communications is by far the most important channel for information overall, and is overwhelmingly the most important channel for education, farming and business information.
There is no significant use of Internet to date within the sample. These findings are consistent with those in the other research countries. They imply that the telephone is valued most for high priority and social/family interactions, but that it has not supplanted face-to-face communications in business activity, where the nuances of body language are more important, where interactions may be with people who are less trusted and where established patterns of business behaviour may be entrenched. General media sources – in Africa, particularly broadcast radio – are highly valued for general information needs, in meeting which the telephone plays almost no part at present. The predominance of face-to-face communications is especially evident from the following table, which presents a weighted importance index for each communication channel. This index is the sum of the importance rating given to each type of information for which the medium is the preferred means of communication. Therefore, it not only reflects how many types of information for which each medium is the preferred means of communicationm but also takes account of the rated importance attributed to each type of information.
Figure B.9 : Weighted importance of means of communication
0 2 4 6 8 10 12
LETTERS
INTERNET
SM S
VILLAGE INFORM ATION CENTRE
TV
NEWSPAPER
ADVERTS
LOCAL LEADERS
PHONE
RADIO
FACE TO FACE CONTACT
weighted index
The following charts break down results for the most important communications media according to key socio-economic categories. A full statistical disaggregation of these data is available in the electronic datasets of project materials which can be obtained on application from the research partners.

309
Figure B.10: Weighted importance of means of communication by gender
0 2 4 6 8 10 12
face to face
local leaders
radio
TV
phone
weighted index
FemaleMale
Figure B.11: Weighted importance of means of communication by economic status
0 2 4 6 8 10 12
face to face
local leaders
radio
TV
phone
weighted index
richmediumpoorpoorest
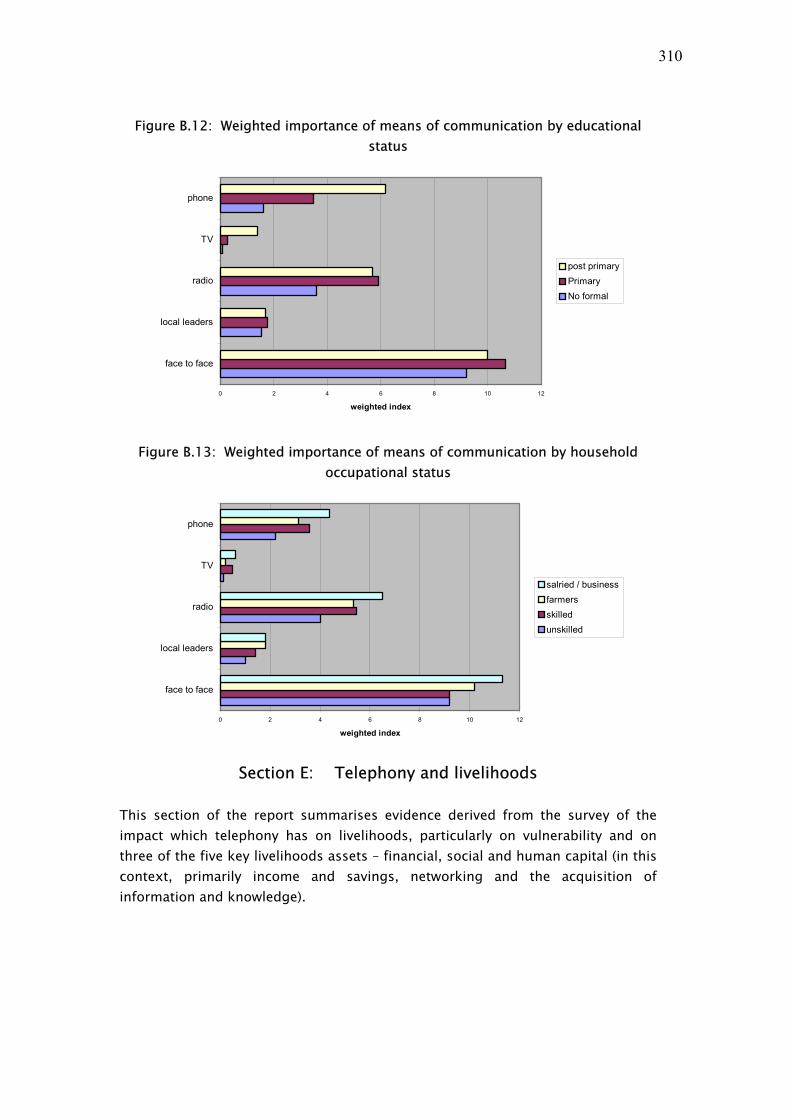
310
Figure B.12: Weighted importance of means of communication by educational status
0 2 4 6 8 10 12
face to face
local leaders
radio
TV
phone
weighted index
post primaryPrimaryNo formal
Figure B.13: Weighted importance of means of communication by household
occupational status
0 2 4 6 8 10 12
face to face
local leaders
radio
TV
phone
weighted index
salried / businessfarmersskilledunskilled
Section E: Telephony and livelihoods
This section of the report summarises evidence derived from the survey of the impact which telephony has on livelihoods, particularly on vulnerability and on three of the five key livelihoods assets – financial, social and human capital (in this context, primarily income and savings, networking and the acquisition of information and knowledge).

311
E.1 Correlations between perceptions of telecoms access and other contextual issues
The impact of improving access to telecommunications services on livelihoods has been tested using the correlations presented in Section B.4. This indicates that overall, perceived improvement in access to telecommunication correlates with perceived improvements in social and human aspects of livelihoods. It should be noted, however, that this does not suggest a causal link. It suggests merely that those groups which perceive improved access to telecommunications also perceive other improvements in livelihoods, most likely because increased personal prosperity affects all such perceptions. When looking at social groupings within the sample, there are widespread associations between perception of improved access to telecommunications and perceptions of improvements in social aspects of life. There is also an apparent association between perception of increased access to telecommunications and human capital indicators, but this is less strong (and also less significant because of the very low valuation placed on telephony as a means of acquiring information and knowledge revealed by other responses). There are almost no correlations between perceived improvements in access to telecommunications and household financial conditions in these data. One notable exception to this the correlations evident amongst younger age groups, perhaps reflecting improved support from family members. A further test was undertaken to investigate the relationship between intensity of use of phones and the contextual indicators reported in section B.4, i.e. to explore the extent to which more intensive use of phones is associated with greater perceived benefits. The following table shows that, in contrast to improved access to telecommunications, increased frequency of use of phones has no association with improvements in these indicators.

312
Table C.29: Correlation coefficients between frequency of use of ICTs and livelihoods indicators (whole sample)
Perceptions of change in contextual indicators
Overall frequency of phone use
Kiosk Mobiles Fixed phone
The health of your family members Education opportunities for your children (0 if no children)
Your own level of knowledge and education General security in your neighbourhood Your household income Support from family members living elsewhere
Relationships with family members Relationships with your friends Quality of government services (e.g. levels of corruption)
Access to telecommunications changed 0.229*** 0.218*** CHANGE IN FINANCES (213+21f) CHANGE IN SOCIAL (21g+21h) CHANGE IN HUMAN (21a+21b+21c) By comparing the socio-economic groupings where significant correlations are evident, the following table clearly demonstrates that improved access to phones has had a greater overall influence on household livelihoods than greater frequency of use of phones, particularly with regard to social and human capital.

313
Table C.30 : Correlation of improved access to telecommunications vs. summary Livelihood indicators by descriptive categories
Improved Access General Frequency of use
Descriptive Categories Financial Corr. Coef.
Social Corr. Coef.
Human Corr. Coef.
Financial Corr. Coef.
Social Corr. Coef.
Human Corr. Coef.
Coverage Low 0.239** Low Mob 0.424* High Mob 0.318* 0.314*** High 0.207*** 0.215*** Age Youngest 0.414* 0.33***
Young 0.357** 0.224*** Middle Old 0.216** 0.279***
Gender Male 0.256*** 0.218*** Female
Education None 0.27* Primary post
primary 0.462***
Econ index Poorest
Poor Average Rich 0.356*** 0.255*
Household unskilled 0.348* occupation skilled
farmers 0.232*** salaried &
business 0.229*** 0.341***
Phone user 0.24*** 0.237***
owner 0.346*** Overall, this suggests that social benefits of telecommunications are of value to all segments of the population, and so associated with telephone access, while financial benefits are associated with particular social groups that can achieve higher benefits from them, in particular higher status groups (in economic and educational terms).
E.2 Perceptions of the overall use and value of telephony The data presented in section E.1 are concerned with broad attitudes towards the social and economic context in which respondents live, and offer only limited and indirect evidence concerning the impact of telephony on livelihoods. Much more valuable data are derived from three sections of the questionnaire which asked respondents to identify the value of telephony to them or to their households.

314
Responses to the first of these sets of questions, concerning respondents’ assessment of social, financial and human capital (knowledge) benefits in general, as defined and understood by the respondents themselves, are reported in section E.2 of this annex. Responses to the second set of questions, related to much more detailed aspects of behaviour, are reported in sections E.3 and E.4. Findings from these questions build on the evidence concerning the relative importance of different information and communications needs and preferred channels of communications which is described in section D above. That analysis included a graphical summary of the preferred channels of communication for different purposes, according to the degree of importance attached to the issues concerned. It suggested that the telephone was highly likely to be chosen as the most appropriate means of communication for emergencies and other high priority needs, including those focused on social/family networks (e.g. news of sick relatives, and information about friends and family), but that it was relatively little used for business communications (where face-to-face communications were strongly preferred) and that it was hardly used at all to secure information or knowledge (where broadcast radio and face-to-face communications were overwhelmingly the most important channels used). From a livelihoods point of view, this suggests that the telephone is substantially used to protect individuals and households against sudden and urgent vulnerabilities, that it has already been incorporated into the culture of family networking, that its impact on financial capital derives from savings made rather than income earned, that it is currently making almost no contribution to human capital. The first of these three sets of questions asked respondents to indicate their primary, second and third most important uses of a telephone. The results of these questions (as proportions of the total sample, including non-users) are set out in the following table.
Table C.31 : Primary, secondary and tertiary uses of telephony
Mobile phone Fixed phone Primary Secondary Tertiary Primary Secondary Tertiary Emergencies 37.7 14.6 5.0 8.2 3.0 0.5Social (friends and family
12.0 29.6 10.8 2.9 6.1 1.2
Business 12.7 7.8 4.4 2.0 1.0 1.2Advisory information
0.4 2.0 4.9 0.1 0.4 0.8
Gaining new knowledge
0.3 0.5 0.8 0.0 0.0 0.1

315
As proportions of actual users, the results are as follows. Table C.32 : Primary, secondary and tertiary uses of telephony – telephone users
only
Mobile phone Fixed phone Primary Secondary Tertiary Primary Secondary Tertiary Emergencies 58.8 23.4 8 48.6 19.4 4.2
Social (friends and family
18.9 45.7 17.4 16.7 38.9 8.3
Business 19.6 12.5 6.9 12.5 6.9 8.3
Advisory information
0.4 3.1 7.6 0 1.4 5.6
Gaining new knowledge
0 0.4 0.9 0 0 1.4
These data reinforce the behavioural pattern of telephone use identified in section D. For most interviewees, the availability of the telephone in an emergency is by far its most important value and purpose. From a livelihoods perspective, this suggests that the telephone’s key role is in reducing vulnerability at times of crisis. The telephone’s secondary purpose is social contact (networking or social assets). Business use (the acquisition or management of financial assets) is significant, and more analysis is undertaken of this in the following section of this report. However, use of the telephone to seek information or gain knowledge (human assets) is minimal. Strategies to make use of the telephone as an instrument for social and economic development need to build on this pattern of use and are unlikely to be successful if they ignore it. The second series of questions asked respondents to evaluate their investment in using a telephone in respect of three broad types of activity, which equate to the main livelihoods assets under investigation. The results of these questions further reinforce the findings described above.
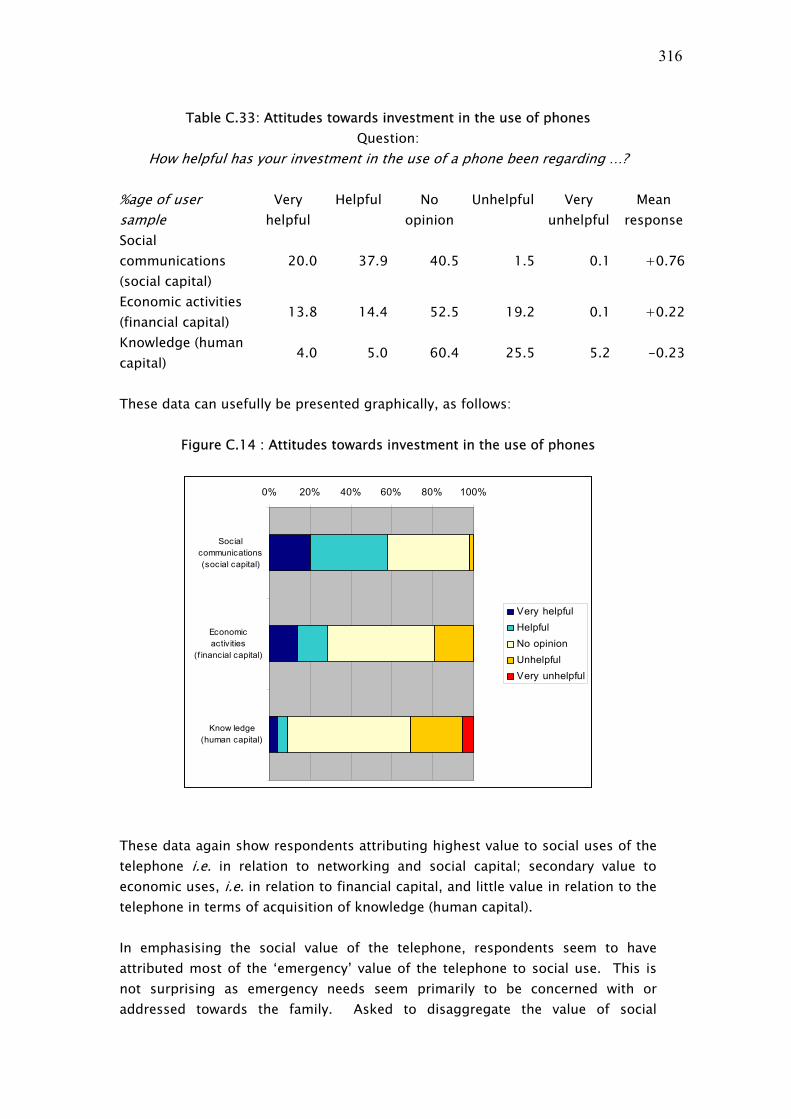
316
Table C.33: Attitudes towards investment in the use of phones Question:
How helpful has your investment in the use of a phone been regarding …? %age of user sample
Very helpful
Helpful No opinion
Unhelpful Very unhelpful
Mean response
Social communications (social capital)
20.0 37.9 40.5 1.5 0.1 +0.76
Economic activities (financial capital)
13.8 14.4 52.5 19.2 0.1 +0.22
Knowledge (human capital)
4.0 5.0 60.4 25.5 5.2 -0.23
These data can usefully be presented graphically, as follows:
Figure C.14 : Attitudes towards investment in the use of phones
0% 20% 40% 60% 80% 100%
Socialcommunications(social capital)
Economicactivities
(f inancial capital)
Know ledge(human capital)
Very helpfulHelpfulNo opinionUnhelpfulVery unhelpful
These data again show respondents attributing highest value to social uses of the telephone i.e. in relation to networking and social capital; secondary value to economic uses, i.e. in relation to financial capital, and little value in relation to the telephone in terms of acquisition of knowledge (human capital). In emphasising the social value of the telephone, respondents seem to have attributed most of the ‘emergency’ value of the telephone to social use. This is not surprising as emergency needs seem primarily to be concerned with or addressed towards the family. Asked to disaggregate the value of social

317
communications, telephone users amongst the respondents identified the following factors:
Table C.34 : Value of telephone: social communications
Frequency %ge Contact with family/friends 103 24.7 Help in emergencies 77 18.5 Speed/ease of communication 114 27.3 Saves time 31 7.4 Saves money/travel costs 19 4.6 News and information 61 14.6 Other 12 2.9 Total 417 100.0
Respondents were also asked to report on the type of economic value gained from the use of telephony.
Table C.35 : Perceived impact of telephony on financial capital Question:
What proportional impact has using the phone had on …?
%age of user sample Large – over 10%
Medium –
6-10%
Small – 1-5%
No change
Net loss
Unable to
judge Income (earnings) 13.6 11.6 18.3 40.4 2.6 13.4
Savings (time) 44.2 28.9 21.4 4.1 0.6 0.8Savings (reduced costs)
39.7 28.7 25.5 4.5 0.8 0.8
These data can be presented graphically as follows:
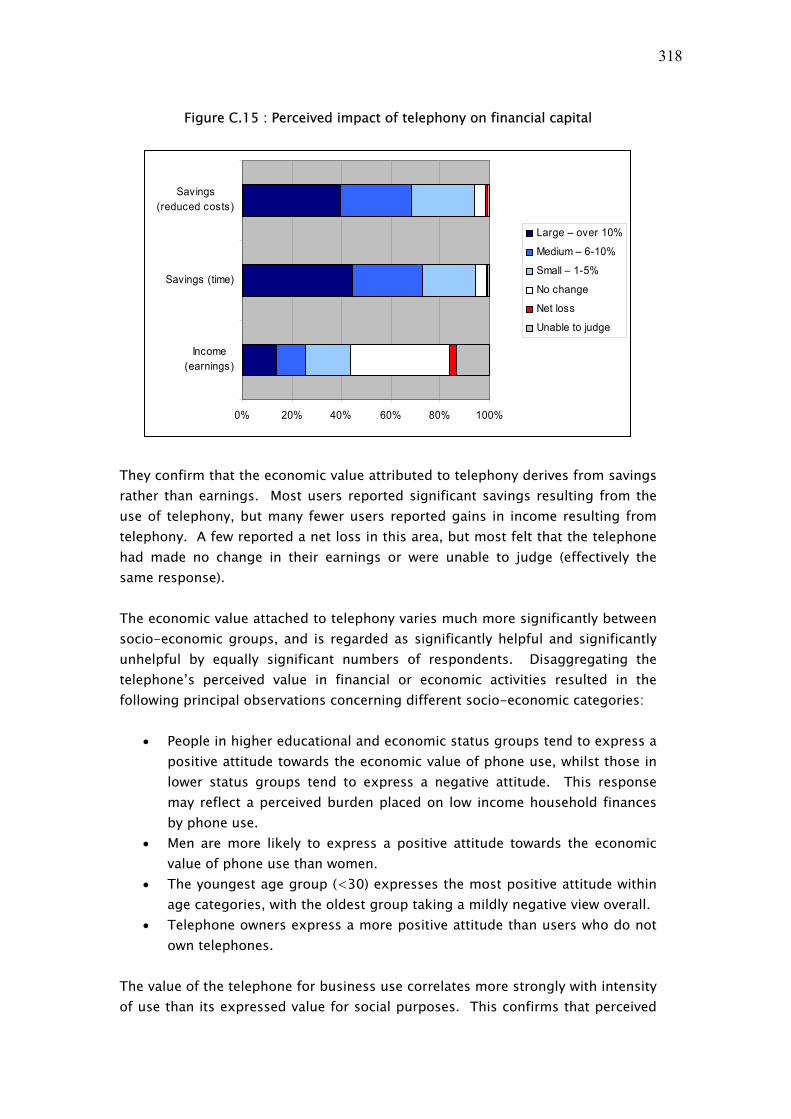
318
Figure C.15 : Perceived impact of telephony on financial capital
0% 20% 40% 60% 80% 100%
Income(earnings)
Savings (time)
Savings(reduced costs)
Large – over 10%
Medium – 6-10%
Small – 1-5%
No change
Net loss
Unable to judge
They confirm that the economic value attributed to telephony derives from savings rather than earnings. Most users reported significant savings resulting from the use of telephony, but many fewer users reported gains in income resulting from telephony. A few reported a net loss in this area, but most felt that the telephone had made no change in their earnings or were unable to judge (effectively the same response). The economic value attached to telephony varies much more significantly between socio-economic groups, and is regarded as significantly helpful and significantly unhelpful by equally significant numbers of respondents. Disaggregating the telephone’s perceived value in financial or economic activities resulted in the following principal observations concerning different socio-economic categories:
• People in higher educational and economic status groups tend to express a positive attitude towards the economic value of phone use, whilst those in lower status groups tend to express a negative attitude. This response may reflect a perceived burden placed on low income household finances by phone use.
• Men are more likely to express a positive attitude towards the economic value of phone use than women.
• The youngest age group (<30) expresses the most positive attitude within age categories, with the oldest group taking a mildly negative view overall.
• Telephone owners express a more positive attitude than users who do not own telephones.
The value of the telephone for business use correlates more strongly with intensity of use than its expressed value for social purposes. This confirms that perceived

319
economic benefit is sensitive to frequency of use (i.e. people who enjoy economic benefits from phone use are more intensive users and higher status groups).
Table C.36 : Correlation of frequency of phone use with attitudes on value of phone use (applicable responses)
N.B. Correlation based on applicable responses only - N = 641
General frequency of phone
use Helpfulness re social communications? 0.250*** Helpfulness re economic activities? 0.444*** Helpfulness re knowledge? 0.393*** * Correlation is significant at the
0.05 level (2-tailed). ** Correlation is significant at the
0.01 level (2-tailed).
The telephone was not significantly used for interactions between formal business groupings and external business partners. Of the 17.4% of respondents who reported membership of business networks/groupings such as farmers’ groups, over 70% said that the group’s relations with both customers and suppliers were conducted primarily through face-to-face communications, with letter post still being substantially more important than the telephone within the residual 30%.
Table C.37 : Group means of communication
%age of valid responses
Respondents Phone Face-to-face
Letters Leaders
with members 221 2.3 77.4 17.2 2.7
with customers 128 7.0 71.9 18.0 3.1 with suppliers 127 4.7 74.8 17.3 3.1
Finally, in this context, telephone users were asked about how damaging they felt it would be to their economic activity if they were unable to use a telephone in future.

320
Table C.38 : Perceived impact of telephony on future economic activity Question:
If you were unable to use a phone any more, how would this impact your economic activities?
Frequency %age Would not be able to continue
11 2.3
Would continue but with difficulty
178 36.7
No opinion 73 15.1 Not much difference 112 23.1 No difference 111 22.9 Total 485 100.0
These data can be disaggregated into household occupational groups (using the scale 1 = “unable to continue”, 3 = “no opinion” and 5 = “no difference”). It shows that business households are most dependent on the telephone, followed by those of skilled and unskilled labourers, with farming households least dependent. Table C.39: Perceived impact of telephony on future economic activity – household
occupational groups
Simplified household occupation group N
Mean (RANGE 1 T0 5)
Salaried and business 175 2.84 Skilled 42 3.14 Unskilled 22 3.32 Farming 245 3.60 Total 484 3.27
These responses indicate that the telephone is seen as a valuable business asset by a significant proportion of users who consider themselves to have business activities, though at present a majority of these do not think that its loss would have a substantial impact on their economic lives – which implies that they regard it as a valuable rather than an essential tool. This is likely to be affected by habituation: use of the telephone is probably too recent for it yet to have become integral to the working methods of most small business people, but prolonged and increased use will probably make it more so. It would be useful to assess this issue further using trend data taken at a series of points in time.

321
E.3 Perceptions of the value of telephony for specific purposes A much more detailed series of questionnaire responses offers further evidence in this area by exploring the extent to which respondents feel that use of the telephone has influenced a number of possible livelihoods benefits. The raw data from responses to these questions is set out in the following table, in which questions have been sorted into five broad livelihoods categories.
Table C.40 : Perceived impact of telephony on aspects of life Question:
Indicate the extent to which use of the phone has influenced each of the following benefits for you over the last two years.
Valid percentages Large
influenceMedium influence
Small influence
No influence
Not applicable
Overall vulnerability indicators
Help quickly in cases of emergencies
52.0 9.3 3.0 2.9 32.8
Greater ability to get family support when needed
18.8 14.0 11.2 12.7 43.3
Social indicators (networking and social capital) Increased support from family
10.8 13.0 11.3 20.7 44.2
More frequent contact with friends and relatives
24.0 18.0 14.7 8.9 34.5
Receive information quickly about distant family members
39.3 12.2 8.6 4.9 35.0
Arrange social functions such as marriages
9.7 7.6 6.8 34.8 41.1
Improved information regarding deaths, marriages and births
45.9 10.0 4.8 5.2 34.2
Better coordination with other group members
4.7 3.8 5.8 31.9 53.8
Improved love life 10.7 6.3 4.4 35.6 43.1Financial indicators not necessarily connected with business (financial capital)
Saving of time spent travelling
45.9 14.5 4.5 2.3 32.8
Reduced cost of travel 46.8 13.5 4.7 2.2 32.8Ability to check on 15.3 6.8 5.6 29.7 42.6
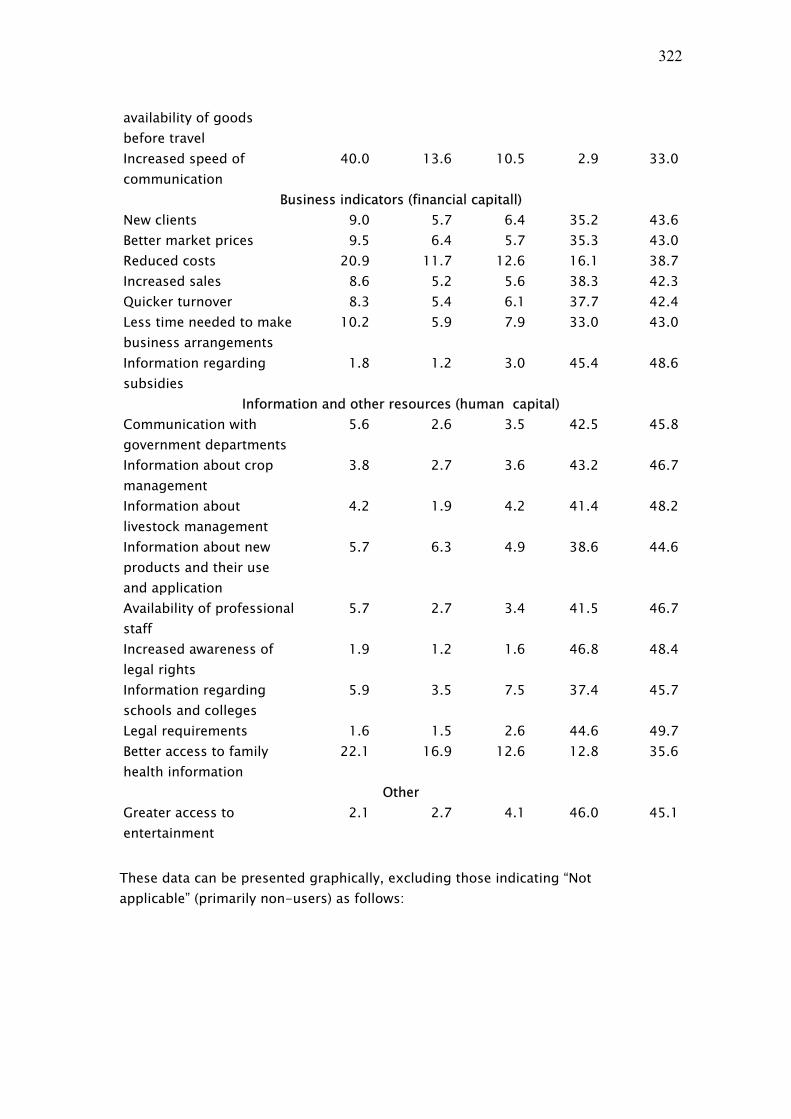
322
availability of goods before travel Increased speed of communication
40.0 13.6 10.5 2.9 33.0
Business indicators (financial capitall) New clients 9.0 5.7 6.4 35.2 43.6Better market prices 9.5 6.4 5.7 35.3 43.0Reduced costs 20.9 11.7 12.6 16.1 38.7Increased sales 8.6 5.2 5.6 38.3 42.3Quicker turnover 8.3 5.4 6.1 37.7 42.4Less time needed to make business arrangements
10.2 5.9 7.9 33.0 43.0
Information regarding subsidies
1.8 1.2 3.0 45.4 48.6
Information and other resources (human capital) Communication with government departments
5.6 2.6 3.5 42.5 45.8
Information about crop management
3.8 2.7 3.6 43.2 46.7
Information about livestock management
4.2 1.9 4.2 41.4 48.2
Information about new products and their use and application
5.7 6.3 4.9 38.6 44.6
Availability of professional staff
5.7 2.7 3.4 41.5 46.7
Increased awareness of legal rights
1.9 1.2 1.6 46.8 48.4
Information regarding schools and colleges
5.9 3.5 7.5 37.4 45.7
Legal requirements 1.6 1.5 2.6 44.6 49.7Better access to family health information
22.1 16.9 12.6 12.8 35.6
Other Greater access to entertainment
2.1 2.7 4.1 46.0 45.1
These data can be presented graphically, excluding those indicating “Not applicable” (primarily non-users) as follows:

323
Figure C.16 : Perceived impact of telephony on aspects of life
0% 20% 40% 60% 80% 100%
Vulnerability indicators
Help quickly in cases of emergencies
Greater ability to get family support when needed
Social indicators (networking and social capital)
Increased support from family
More frequent contact with friends and relatives
Receive information quickly about distant family members
Arrange social functions such as marriages
Improved information regarding deaths, marriages and births
Better coordination with other group members
Improved love life
Financial indicators not necessarily connected with business (financial capital)
Saving of time spent travelling
Reduced cost of travel
Ability to check on availability of goods before travel
Increased speed of communication
Business indicators (financial capitall)
New clients
Better market prices
Reduced costs
Increased sales
Quicker turnover
Less time needed to make business arrangements
Information regarding subsidies
Information and other resources (human capital)
Communication with government departments
Information about crop management
Information about livestock management
Information about new products and their use and application
Availability of professional staff
Increased awareness of legal rights
Information regarding schools and colleges
Legal requirements
Better access to family health information
Other
Greater access to entertainment
Large influenceMedium influenceSmall influenceNo influence
Taken overall, these data confirm and provide more detail concerning the hierarchy of valuations of information and communications priorities identified above. As well as being preferred means of communications for emergency and other high saliency communications, the telephone is considered highly efficacious in delivering positive outcomes in these areas. It is also considered strongly positive in delivering benefits in social interaction, particularly within the family; and in enabling financial savings to be made. The only area of business activity, however, in which it is considered of substantial value is cost reduction; perceived outcomes in more proactive (or income-generating) business activity are much less positive, with most respondents indicating that it has no influence. The only area of information acquisition (human capital) in which the telephone is thought significant concerns information on family health matters. The data presented in this table and chart can also be presented using a ranking order of importance. This is obtained by establishing, for each issue, a mean

324
figure for the importance attributed by respondents based on a five point scale for each benefit where “1” = “not applicable” to “5” = “large influence”. Presented in this way, the data appear as follows.
Table C.41 : Identified benefits of telephone use - ranked impact statements
Livelihood asset
Mean
Help quickly in cases of emergencies S 3.45Reduced cost of travel F 3.39Saving of time spent traveling F 3.38Improved information regarding deaths, marriages and births
S 3.28
Increased speed of communication S 3.25Have received information quickly about distant family members
S 3.16
More frequent contact with friends and relatives S 2.88Better access to family health information H 2.77Reduced costs F 2.6Greater ability to get support from family when it is needed
F/S 2.52
Increased support from family F/S 2.25Ability to check on availability of products before travel F 2.22Have been able to arrange social functions such as marriages
S 2.1
Less time needed to make business arrangements F 2.07Improved love life S 2.06Better market prices F 2.04New clients F 2.01Increased sales F 1.99Quicker turnover F 1.99Information about new products and their use and application
H 1.9
Information regarding schools and colleges H 1.87Communication with Government dept's. H 1.8Availability of professional staff F 1.79Information about crop management H 1.74Better coordination with other group members S 1.74Information about livestock management H 1.73Greater access to entertainment options S 1.71Information regarding subsidies F 1.62Increased awareness of legal rights, e.g. re water and land H 1.61Legal requirements H 1.61
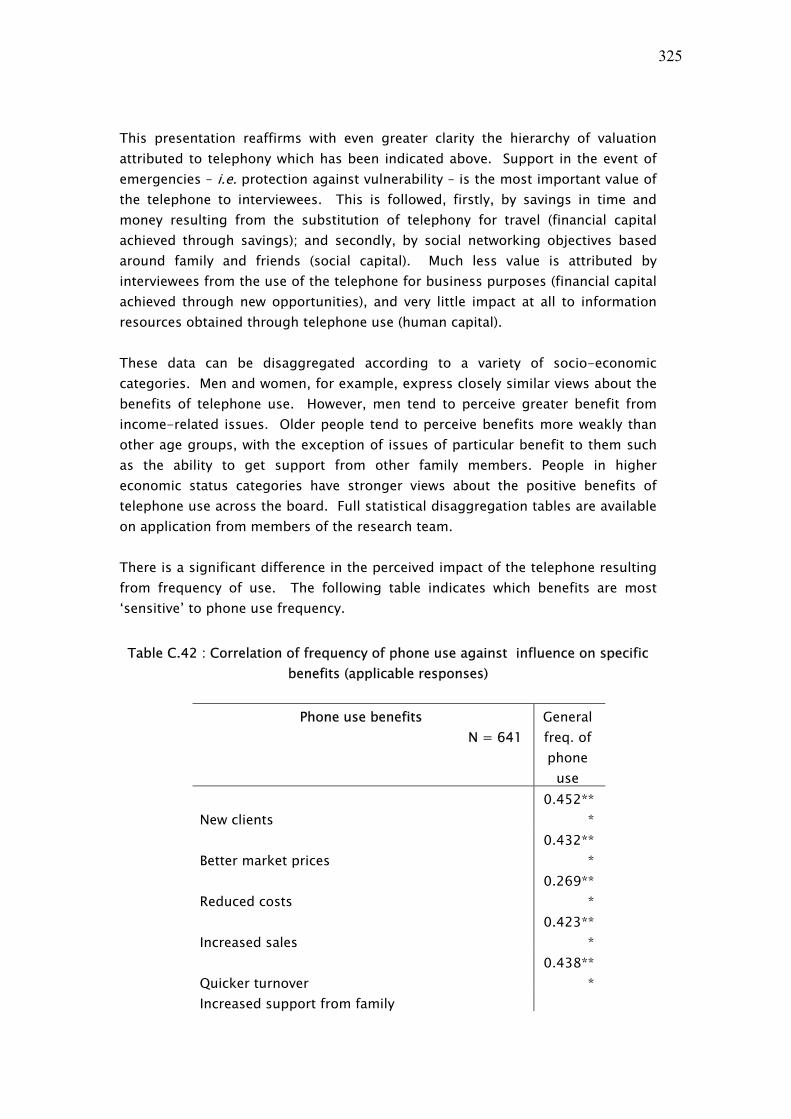
325
This presentation reaffirms with even greater clarity the hierarchy of valuation attributed to telephony which has been indicated above. Support in the event of emergencies – i.e. protection against vulnerability – is the most important value of the telephone to interviewees. This is followed, firstly, by savings in time and money resulting from the substitution of telephony for travel (financial capital achieved through savings); and secondly, by social networking objectives based around family and friends (social capital). Much less value is attributed by interviewees from the use of the telephone for business purposes (financial capital achieved through new opportunities), and very little impact at all to information resources obtained through telephone use (human capital). These data can be disaggregated according to a variety of socio-economic categories. Men and women, for example, express closely similar views about the benefits of telephone use. However, men tend to perceive greater benefit from income-related issues. Older people tend to perceive benefits more weakly than other age groups, with the exception of issues of particular benefit to them such as the ability to get support from other family members. People in higher economic status categories have stronger views about the positive benefits of telephone use across the board. Full statistical disaggregation tables are available on application from members of the research team. There is a significant difference in the perceived impact of the telephone resulting from frequency of use. The following table indicates which benefits are most ‘sensitive’ to phone use frequency.
Table C.42 : Correlation of frequency of phone use against influence on specific benefits (applicable responses)
Phone use benefits
N = 641 General freq. of phone
use
New clients 0.452**
*
Better market prices 0.432**
*
Reduced costs 0.269**
*
Increased sales 0.423**
*
Quicker turnover 0.438**
* Increased support from family

326
Greater ability to get support from family when it is needed 0.2*** Saving of time spent traveling 0.3*** Reduced cost of travel 0.27*** Ability to check on availability of products before travel
0.487***
Increased speed of communication 0.348**
* Less time needed to make business arrangements
0.452***
Communication with Government dept's. 0.321**
*
More frequent contact with friends and relatives 0.387**
* Help quickly in cases of emergencies Have received information quickly about distant family members 0.29*** Have been able to arrange social functions such as marriages
0.291***
Information about crop management 0.253**
* Information about livestock management 0.23*** Information about new products and their use and application
0.424***
Availability of professional staff 0.332**
* Increased awareness of legal rights, e.g. re water and land
Information regarding schools and colleges 0.404**
*
Legal requirements 0.202**
*
Information regarding subsidies 0.246**
*
Better coordination with other group members 0.341**
*
Better access to family health information 0.207**
* Improved information regarding deaths, marriages and births
Greater access to entertainment options 0.279**
*
Improved love life 0.334**
*

327
Mean of financial indicators 0.515***
Mean of social indicators 0.514***
Mean of human indicators 0.382***
* Correlation is significant at the 0.05 level (2-tailed).
** Correlation is significant at the 0.01 level (2-tailed).
N.B. Based only on applicable responses i.e. n/a responses omitted.
This table shows that perceived degree of influence is strongly correlated with intensity of use across most indicators: the more someone uses the telephone, the more likely s/he is to consider that it has a positive impact. However, this is not true of uses which have high priority - use in emergencies, family life events, and obtaining increased support from family members. The fact that the degree of perceived impact of these high saliency uses is not correlated with intensity of use tends to confirm evidence elsewhere in the survey that these uses have primary value for all socio-economic groups. The higher value attributed to telephone use among higher status groups is also evident if the data are presented according to household occupation categories.
Table C.43 : Identified benefits of telephone use according to household occupation categories
Household occupation category
Unskilled Skilled Farming
Salaried and
business Mean New clients 1.67 2.26 1.74 2.56Better market prices 1.78 2.02 1.74 2.69Reduced costs 1.75 2.95 2.37 3.14Increased sales 1.60 2.07 1.71 2.60Quicker turnover 1.63 2.11 1.70 2.61Increased support from family 1.83 2.58 2.22 2.32Greater ability to get support from family when it is needed 2.08 2.84 2.51 2.55Saving of time spent traveling 2.63 3.71 3.07 4.07Reduced cost of travel 2.78 3.71 3.10 4.00Ability to check on availability of products 1.88 2.31 1.91 2.87

328
before travel Increased speed of communication 2.45 3.56 2.92 3.97Less time needed to make business arrangements 1.83 2.02 1.79 2.68Communication with Government dept's. 1.58 1.85 1.64 2.13More frequent contact with friends and relatives 2.18 3.44 2.54 3.55Help quickly in cases of emergencies 2.78 3.98 3.16 4.01Have received information quickly about distant family members 2.35 3.61 2.93 3.65Have been able to arrange social functions such as marriages 1.65 2.38 1.84 2.64Information about crop management 1.60 1.67 1.58 2.09Information about livestock management 1.65 1.69 1.61 1.97Information about new products and their use and application 1.65 1.96 1.67 2.39Availability of professional staff 1.53 1.71 1.62 2.20Increased awareness of legal rights, e.g. re water and land 1.53 1.53 1.50 1.88Information regarding schools and colleges 1.58 1.84 1.72 2.21Legal requirements 1.53 1.55 1.50 1.86Information regarding subsidies 1.53 1.56 1.52 1.86Better coordination with other group members 1.80 1.80 1.59 2.00Better access to family health information 2.03 3.18 2.52 3.31Improved information regarding deaths, marriages and births 2.38 3.71 3.06 3.80Greater access to entertainment options 1.55 1.89 1.57 1.95Improved love life 1.63 2.48 1.87 2.41IMPACT OF PHONE USE - FINANCIAL (mean) 1.88 2.43 2.06 2.76IMPACT OF PHONE USE - SOCIAL (mean) 2.06 2.91 2.39 2.94IMPACT OF PHONE USE - HUMAN (mean) 1.64 1.91 1.71 2.23
E.6 Impact of telephony use on other means of communications A further series of questions was asked in the survey about the impact which respondents believe telephone use has had on their use of other sources of information and means of communication. Responses concerning these questions are summarised in the following table.

329
Table C.44 : Impact of telephony use on other means of communications Question:
Has the use of … changed since you started using a phone?
%age of user sample Large increase
Slight increase
No change
Small reduction
Large reduction
Letters and postal services
1.2 0.4 8.1 20.9 69.3
Face to face communication
0.2 1.2 20.7 50.4 27.4
Making social visits 0.2 1.6 23.6 46.6 27.9 Use of newspapers 0.2 0.8 84.8 10.0 4.3 Referral to village council and local leaders
0.4 1.0 81.7 9.4 7.5
These findings can also be presented graphically. The following chart presents data derived from these questions concerning changes in sources of information using a five-point scale in which -2 = “much less”, 0 = “no change” and +2 = “much more”.
Figure C.17 : Changes in sources and channels of information
Question: Has the use of other means of communication changed since you started using a
phone?
-1.5 -1 -0.5 0 0.5 1 1.5
Radio
TV
Government services
Local leaders
District staff
Newspapers
Neighbours
Networks
Traders who sell inputs for agr. and livestock
village council/local leaders
social visits
Manufacturers
messengers
face to face
letters and post office
Reduced Increased
These responses show clearly that telephone use is having a significant impact on social behaviour and the use of other information and communication channels. Two particularly striking impacts should be noted.

330
The most dramatic impact is on the traditional postal service, for which the telephone provides a clear and (in terms of immediacy and interactivity) a superior alternative mode of communications. For the majority of respondents, use of the telephone has led to a substantial reduction in their use of postal services. The telephone has also had a substantial impact on social interaction, with the vast majority of respondents reporting at least a slight reduction in social visits and face-to-face communication. At relatively high levels of telephone access and use, it is evident that the telephone has extensively substituted for some more direct forms of social interaction. The business sample was more emphatic about the degree to which face-to-face communications had diminished. This may have some sociological implications concerned with family cohesion. However, the data need to be treated with caution. Interviewees’ responses give no indication of the importance of social interaction which has been displaced by telephony. The availability of telephony means that, for almost everyone, there will be some occasions on which it is used to replace trivial social contact that would previously have required a social visit. The sociological impact of behavioural change in this area would be much more significant if use of the telephone impacted on more important social interaction. This cannot be assessed without further research. By contrast, the survey shows an increase in the use of radio, television and newspapers as sources of information, most particularly in the use of radio. The reasons for this, and the potential value which it offers as a mechanism for the delivery of official and other information to the rural population, would benefit from further research. Responses to a separate ‘lifestyle’ question – not directly related to telephone use - indicated that just under half of respondents felt less need to travel than they had two years previously. Telephone owners, users and non-users all registered a modest reduction over the last two years in the need to travel, i.e. phone access status had no significant bearing on perception of change in need to travel. Furthermore, there is little evidence of an association between frequency of use of phones (i.e. current use) and these findings concerning change in the perceived need to travel.

331
Table C.45 : Perceived need to travel
Question: How has your need to travel increased or reduced in the last 2 years?
Frequency %age Greatly reduced 67 9.2 Reduced 265 36.2 No change 263 35.9 Increased 121 16.5 Greatly Increased 16 2.2 Total 732 100.0
However, questions relating need to travel to telephony indicated that people did perceive value in the telephone from this point of view. The most likely explanation for this apparent discrepancy is that people do see the telephone as valuable in reducing travel in certain circumstances (hence the responses to questions directly relating the two) but that there are many factors influencing need to travel and many reasons for travel which are not substitutable by telephony (hence the responses to the general lifestyle question on need to travel).
Section F: Use of the Internet The final section of the questionnaire posed a number of questions concerning use of Internet. Internet use is often given a high profile in discussions of the role of ICTs in developing countries, and the relative value of telephony and Internet access is an important issue in the ICD debate. It had been hoped that the survey would provide evidence of how the Internet is being used by typical adults within rural communities which could help to inform these important discussions, particularly where policy towards Internet deployment is concerned. Internet cafés were available in the urban areas of two of the three research districts – Sengerema and Njombe – though they do not appear to have been available in Hai. In Sengerema District, in particular, there is a well-established and well-known community telecentre, and the use of e-mail and Internet is quite popular with its user community, rising from 2,365 users in 2002 to 9162 users in 2003. Age, the level of education and gender appear to be major factors affecting the use of these e-mail and Iinternet services. However, a recent evaluation of the telecentre found that only 5% of its users came from rural areas. Among the villages that have been included in Sengerema District for this study, Ibasagemi (one kilometre away) had the highest number of users; however, Katunguru (further from the telecentre) had more users than Tabaruka which was much

332
nearer. This suggests that local factors are likely to be important determinants of user communities at this low level of use. In practice, interviewees in this study had made almost no use of Internet facilities and had almost no experience of Internet use. Of the 736 interviewees taking part in the survey, only 26 reported that they had ever used email or Internet (14 in person, 12 by asking someone else to use the service on their behalf), and only 11 reported that they had ever looked at websites. For almost all of tthe sample population, therefore, the Internet was simply not part of the visible spectrum of communications resources. The sample included insufficient numbers of Internet users to allow any meaningful analysis of Internet use other than to draw conclusions from its absence. The precise reasons for lack of Internet use within the sample are not entirely clear. Very low levels of Internet use of the kind reported imply that the Internet is not likely to be an effective channel for providing information directly to rural communities. (The evidence cannot be generalised to urban communities, and it would be particularly useful to have a similar community wide study of the general community in Sengerema town.) The high reliance on and confidence in traditional information sources – such as radio, television, newspapers and official representatives – which is reported in section D, however, implies that these channels will remain the most important means of imparting information to the community as a whole and of influencing social behaviour (for example on agricultural or health matters). Further research is critically needed into the reasons why Internet use in the respondent population is so low, and into the potential for building new technology techniques into established and effective information flows. There is also an important lesson here for researchers into Internet use in general. Further research is needed to establish detailed Internet usage levels and patterns of use, barriers to Internet use and the potential impact of Internet services in rural communities of the kind surveyed in this research. Trend data, indicating changes in patterns of use over time, are likely to be particularly valuable in this context. In addition, most Internet diffusion studies to date have focused on actual users of Internet facilities, for example by assessing the socio-economic characteristics of cybercafé users. These studies should always be complemented by studies looking at Internet use from the perspective of the potential user community as a whole. Given the importance of face-to-face communications in information and communication flows revealed in section D above, it would also be useful to examine if and how usage and information derived from usage devolve from first movers in Internet use into the wider community. It is not, however, possible to draw any further conclusions concerning Internet use from this study at this time.

333
Section H Conclusion and summary
This section briefly summarises some of the conclusions which can be drawn from the Tanzania research questionnaire and analysis. A fuller conclusion to the study, including comparison of the Tanzania data with those from India and Mozambique, is included in the main research report. The Tanzania sample for this KaR study included 736 individuals, mostly heads of households, resident in rural communities clustered around three research location centres, in Hai, Njombe and Sengerema districts. Extensive questionnaire surveys sought five main types of information from respondents - concerning their personal circumstances, established information and communication flows, access to and use of telephony, value of telephony in meeting livelihoods requirements, and experience of the Internet. These surveys were supported by focus group discussions. The report in this document summarises major results from this survey in a form which can be easily compared with those of the other two country studies in the project. Characteristics of interviewees are summarised in section B. These represent a broad cross-section of household heads and other adults within typical rural communities in Tanzania. Most households had more than one income source, with a majority citing farming as their primary source of income. The majority of interviewees felt positive about general social and economic trends within Tanzania, including their own livelihoods. The availability and use of telephony is described in section C of the annex. Telephony is available throughout the research communities. About 20% of interviewees had private access to telephony, the vast majority through mobile lines which were usually owned by household heads. Most other interviewees made use of telephone facilities, either by borrowing mobile handsets or using kiosks, and a majority of non-owners expressed an intention to become mobile phone owners in due course. Expenditure on telephone use was highest in nominal terms among wealthier respondents, but much higher as a proportion of income among the poorest, suggesting that telephony is a significant factor in reducing vulnerability at all income levels. Section D of the analysis describes established information and communication flows. Respondents placed high confidence in information supplied by the media, particularly broadcast radio (which is almost universally available and in regular and consistent use) but also television and newspapers. National and local government officials were also regarded as reliable, while least confidence was placed in suppliers and manufacturers.

334
The most important types of information and communication identified by interviewees are concerned with high-priority family and social issues, particularly emergencies. These are occasions in which information or communication is likely to be needed urgently and where the need is likely to be exceptional rather than routine. Telephony is much the preferred channel of communication to meet these requirements, which illustrates its value in addressing critical moments of vulnerability in respondents' lives. In such circumstances, cost is relatively unimportant, and there is little difference in demand for telephony between respondents with different levels of income or wealth. However, telephony was not the preferred mode for other types of communication. Face-to-face communication was predominantly used for business interactions which showed much less sensitivity to substitution by telephony than social interation. There are a number of possible explanations for this, but the relative novelty of telephony is likely to be important. Human behaviour changes much more slowly than technology, and it takes time for people to adopt new habits of interaction, particularly where relationships that require trust - such as business - are concerned. Business use of telephony within the sample focused on savings rather than income generation. Telephony played no significant role as a communications channel for information and knowledge gathering, in which broadcasting and face-to-face communications were overwhelmingly preponderant. The survey provides evidence that a transition is taking place from face-to-face communications to telephony. Within the family, the telephone is clearly used to increase contact with family members living elsewhere in Tanzania or outside the country, while there may be some reduction in social interaction with local family members as the telephone substitutes for social visits. From a livelihoods perspective, this suggests that the telephone is most used within the sample in order to address vulnerability at times of crisis; that it is used significantly, where available, in social networking (family relations) and in order to maintain financial capital (by saving expenditure); that it is currently only used to a limited degree in activities to increase financial capital (business activity); and that it is not used to any significant degree in respect of human capital (information and knowledge). Section E presents evidence concerning respondents' perceptions of the impact which telephony has on livelihoods, and confirms the picture given in section D. As well as being the preferred means of communications for emergency and other high saliency communications, the telephone is considered highly efficacious in delivering positive outcomes for these needs. The telephone is also considered valuable in delivering benefits in social interaction, particularly within the family,

335
and in enabling financial savings. The primary area of business activity in which it is considered significantly worthwhile is cost reduction, however, and the telephone is not valued as a source of information. Overall, therefore, respondents felt that the telephone had most value for social purposes (including family emergencies), some value for economic activities, and little value in terms of knowledge acquisition. This has implications for the strategies adopted by governments and businesses to develop communications networks and for development strategies to use telephony and other ICTs in delivering development outcomes, especially where information transmission is concerned. The final section of the document looks at experience of the Internet within the survey population. An extensive series of questions was included in the survey seeking information about Internet use. Although Internet access was available in towns close to research locations, the proportion of respondents with any experience of the Internet was too small - under 4% - to allow for meaningful analysis. For these samples at least, this suggests that the Internet is not yet providing an effective channel for the transmission of information within rural communities, though it may be a worthwhile resource for supporting established information channels (for example through its use by broadcast radio and official intermediaries). Further research is needed in this area.

336
Appendix 1: KaR 8347 questionnaire - India (To be filled by the data entry person before entering the data of this questionnaire) Entry number
GENERAL SURVEY DATA (Fill in questions 1 to 10 prior to starting the interview)
1. Date of interview ___________.
2. Name of Interviewer. _________________________________ .
3. Name of Supervisor. __________________________________ .
4. Name of village. ____________________.
5. Name of ward. __________________________.
6. Name of district _____________________________________
7. Level of telephone service coverage. (Tick the appropriate box)
No local access (1)
Low – fixed line (2)
Medium – fixed line + 1 mobile service provider (3)
High – fixed line plus 2 or more mobile service providers (4)
8. Access to electricity?
(Tick appropriate box)
None (1)
Occasional (2)
Constant (3)
9. Condition of the road. (Tick appropriate box)
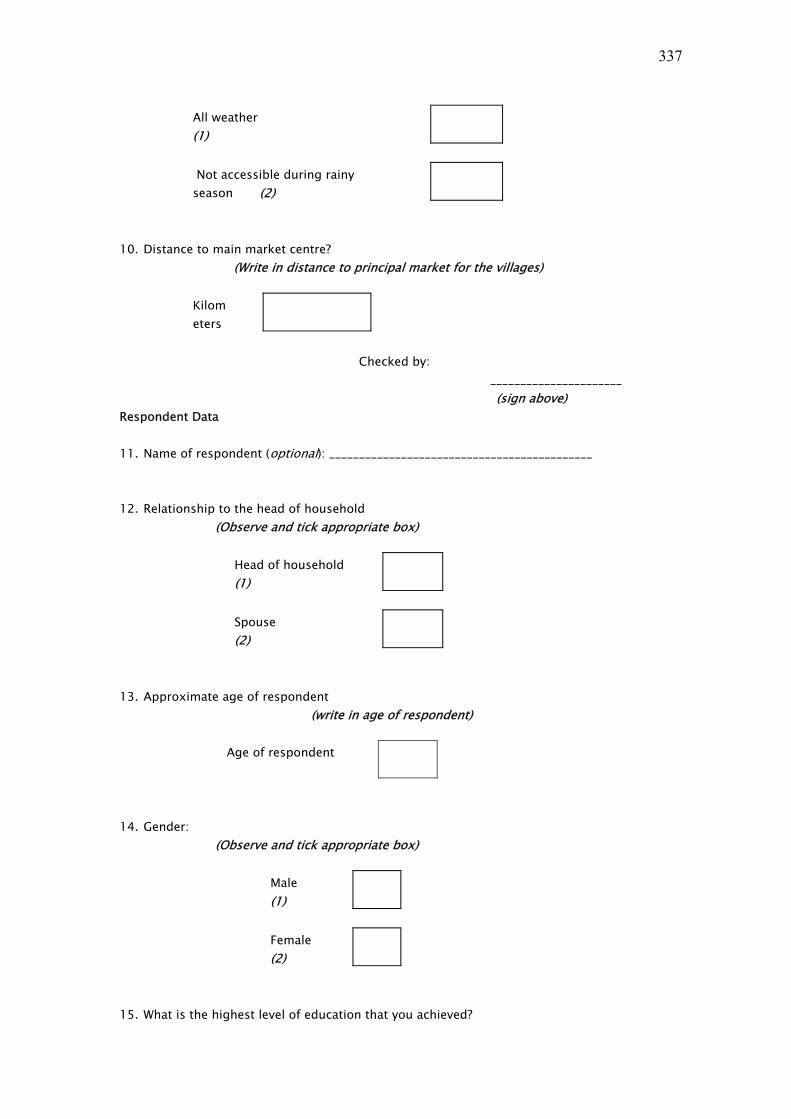
337
All weather (1)
Not accessible during rainy season (2)
10. Distance to main market centre? (Write in distance to principal market for the villages)
Kilometers
Checked by: ______________________
(sign above) Respondent Data 11. Name of respondent (optional): ____________________________________________ 12. Relationship to the head of household
(Observe and tick appropriate box)
Head of household (1)
Spouse (2)
13. Approximate age of respondent
(write in age of respondent)
Age of respondent
14. Gender: (Observe and tick appropriate box)
Male (1)
Female (2)
15. What is the highest level of education that you achieved?

338
(Tick only one box indicating the highest level of education mentioned)
No formal schooling (1)
Primary school (classes 1-4) (2)
Lower secondary (classes 5-8) (3)
Senior Secondary school (classes 9-12) (4)
Post secondary e.g. diploma, degree (5)
Only if they have had no formal schooling ask question 16 16. Do you know how to read and write?
(Tick appropriate box)
Yes (1)
No (2)
17. How many people are living regularly in your household? (not short time visitors)
(Write in the numbers of each age group actually living in the hh)
Children <18
Adults (18 and over) 18. How many of these are :
(Write in the numbers of each)
Dependant on you for financial support
Supporting you in cash or kind
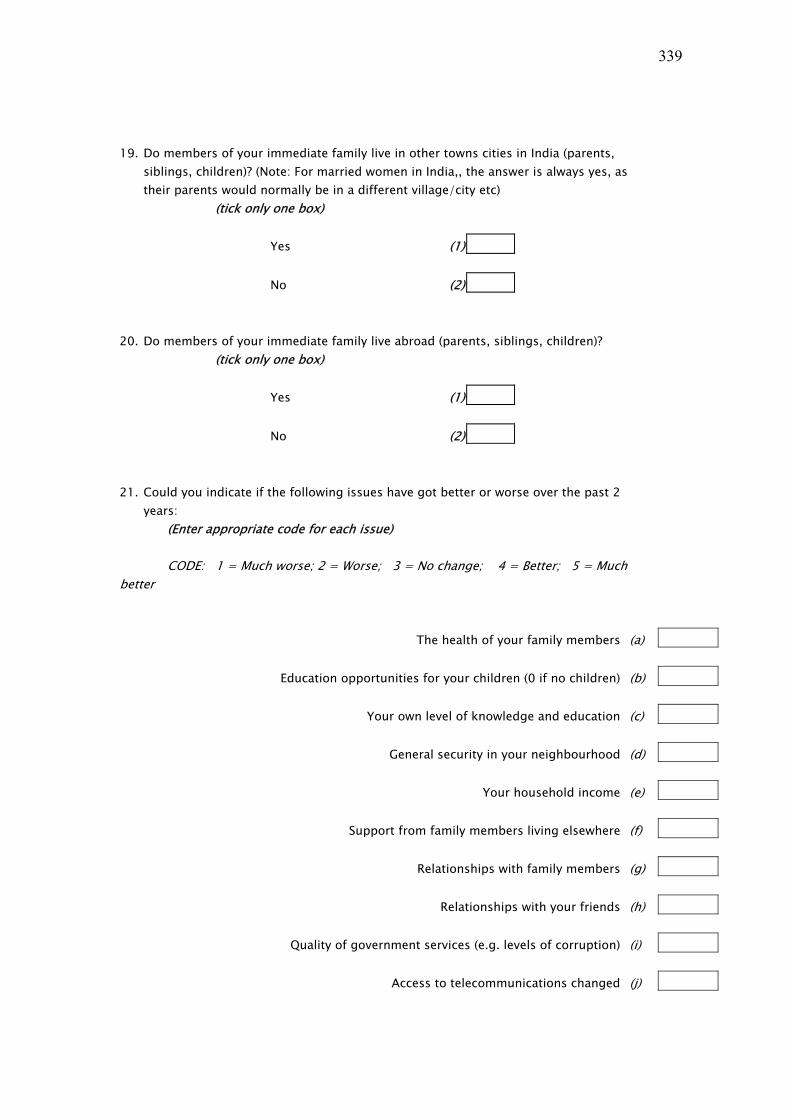
339
19. Do members of your immediate family live in other towns cities in India (parents,
siblings, children)? (Note: For married women in India,, the answer is always yes, as their parents would normally be in a different village/city etc)
(tick only one box)
Yes (1)
No (2) 20. Do members of your immediate family live abroad (parents, siblings, children)? (tick only one box)
Yes (1)
No (2) 21. Could you indicate if the following issues have got better or worse over the past 2
years: (Enter appropriate code for each issue) CODE: 1 = Much worse; 2 = Worse; 3 = No change; 4 = Better; 5 = Much
better
The health of your family members (a)
Education opportunities for your children (0 if no children) (b)
Your own level of knowledge and education (c)
General security in your neighbourhood (d)
Your household income (e)
Support from family members living elsewhere (f)
Relationships with family members (g)
Relationships with your friends (h)
Quality of government services (e.g. levels of corruption) (i)
Access to telecommunications changed (j)

340
2. How has your need to travel increased or reduced in the last 2 years?
(Enter appropriate code in the box)
CODE: 1 = Greatly reduced; 2 = reduced; 3 = No change; 4 = Increased; 5 = Greatly increased
(j)
Economic Status
23. What are your household’s three principal sources of income in order of importance? (Write in the types of occupation and approximate annual income earned
from each) (Note there should be codes for Refusal to answer and also don’t know/can’t say as people either do not want to disclose it or the women may not know)
Type of occupation Approximate
Annual Income Refused to give
income information (Tick box if refused)
Main source of income:
_____________________________ Rs
Second occupation: ______________________________ Rs Third occupation: _______________________________ Rs
24. Regarding your home do you: (Tick only one of the following boxes)
Rent
(1) Personal
ownership (2)
Other: Specify:
(3)
Other (Specify) ______________________________________________________________________
25. Can you describe the type of house you live in: (Tick only one of the following boxes for each element)
Type of roof Thatch Tin Tiles
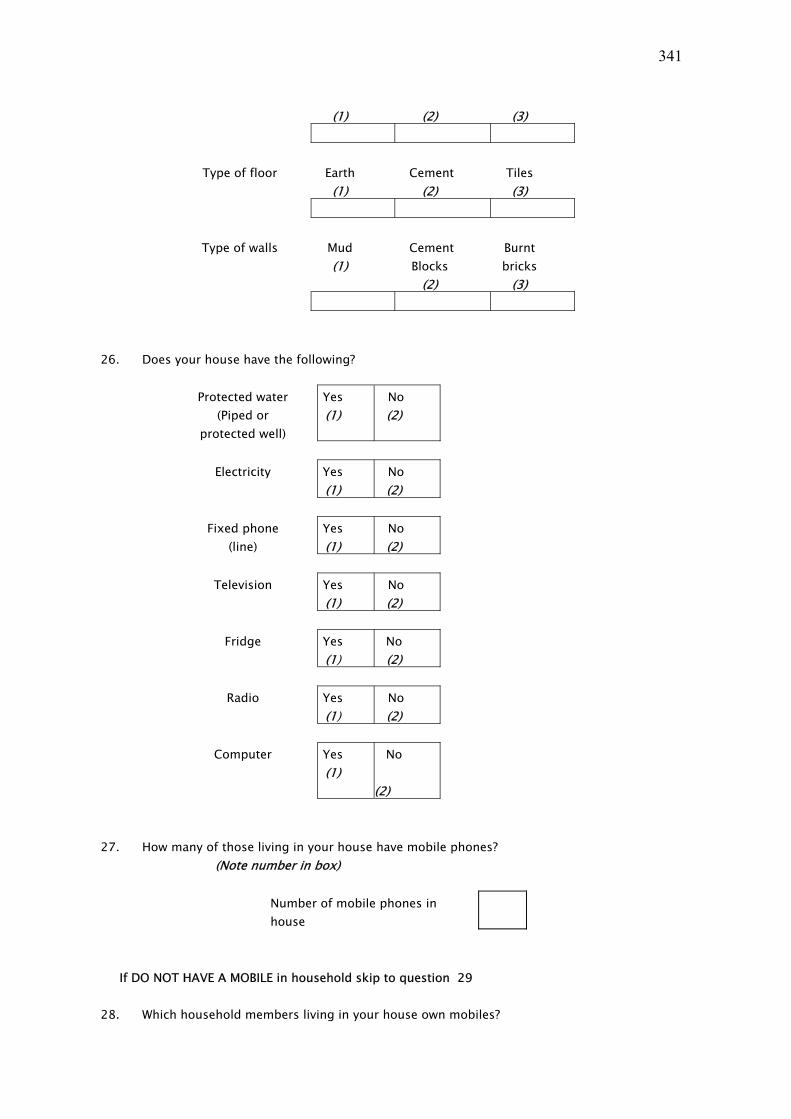
341
(1) (2) (3)
Type of floor Earth
(1) Cement
(2) Tiles (3)
Type of walls Mud
(1) Cement Blocks
(2)
Burnt bricks
(3)
26. Does your house have the following?
Protected water
(Piped or protected well)
Yes (1)
No (2)
Electricity Yes
(1) No (2)
Fixed phone
(line) Yes (1)
No (2)
Television Yes
(1) No (2)
Fridge Yes
(1) No (2)
Radio Yes
(1) No (2)
Computer Yes
(1) No
(2)
27. How many of those living in your house have mobile phones? (Note number in box)
Number of mobile phones in house
If DO NOT HAVE A MOBILE in household skip to question 29
28. Which household members living in your house own mobiles?
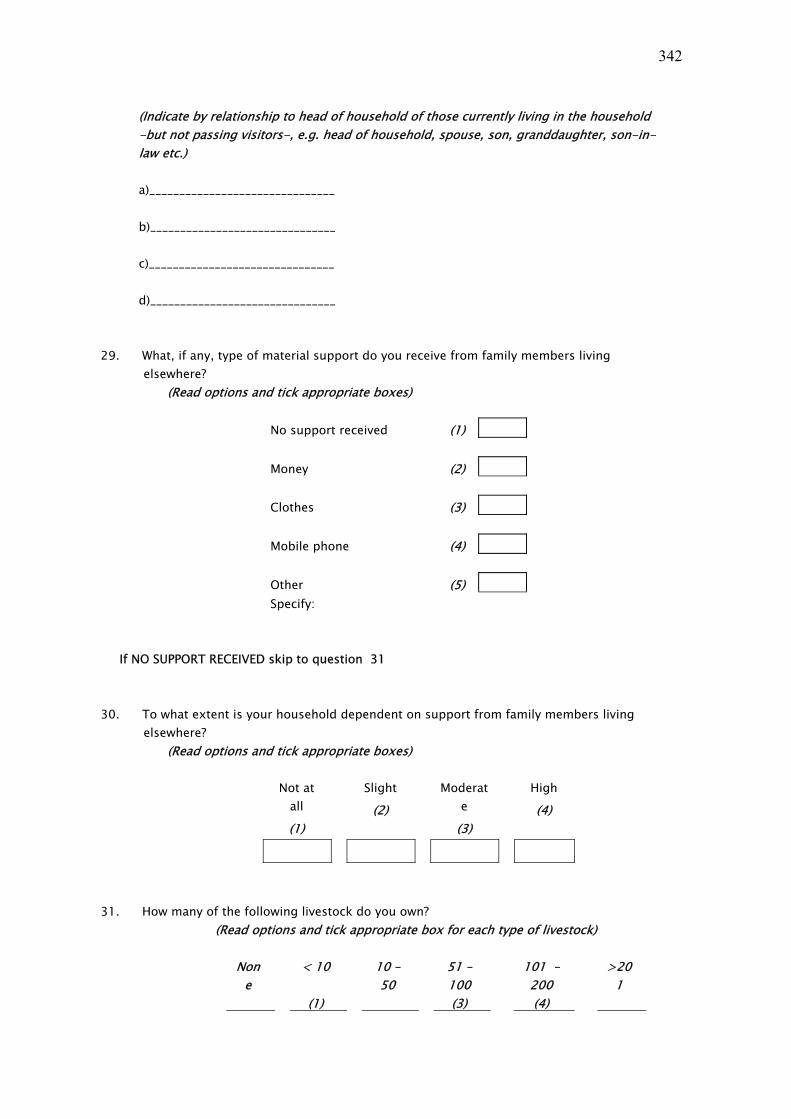
342
(Indicate by relationship to head of household of those currently living in the household -but not passing visitors-, e.g. head of household, spouse, son, granddaughter, son-in-law etc.) a)_______________________________ b)_______________________________ c)_______________________________ d)_______________________________
29. What, if any, type of material support do you receive from family members living
elsewhere? (Read options and tick appropriate boxes)
No support received (1)
Money (2)
Clothes (3)
Mobile phone (4)
Other (5) Specify:
If NO SUPPORT RECEIVED skip to question 31
30. To what extent is your household dependent on support from family members living elsewhere?
(Read options and tick appropriate boxes)
Not at all
(1)
Slight
(2) Moderat
e
(3)
High
(4)
31. How many of the following livestock do you own? (Read options and tick appropriate box for each type of livestock)
None
< 10
(1)
10 – 50
51 – 100 (3)
101 – 200 (4)
>201
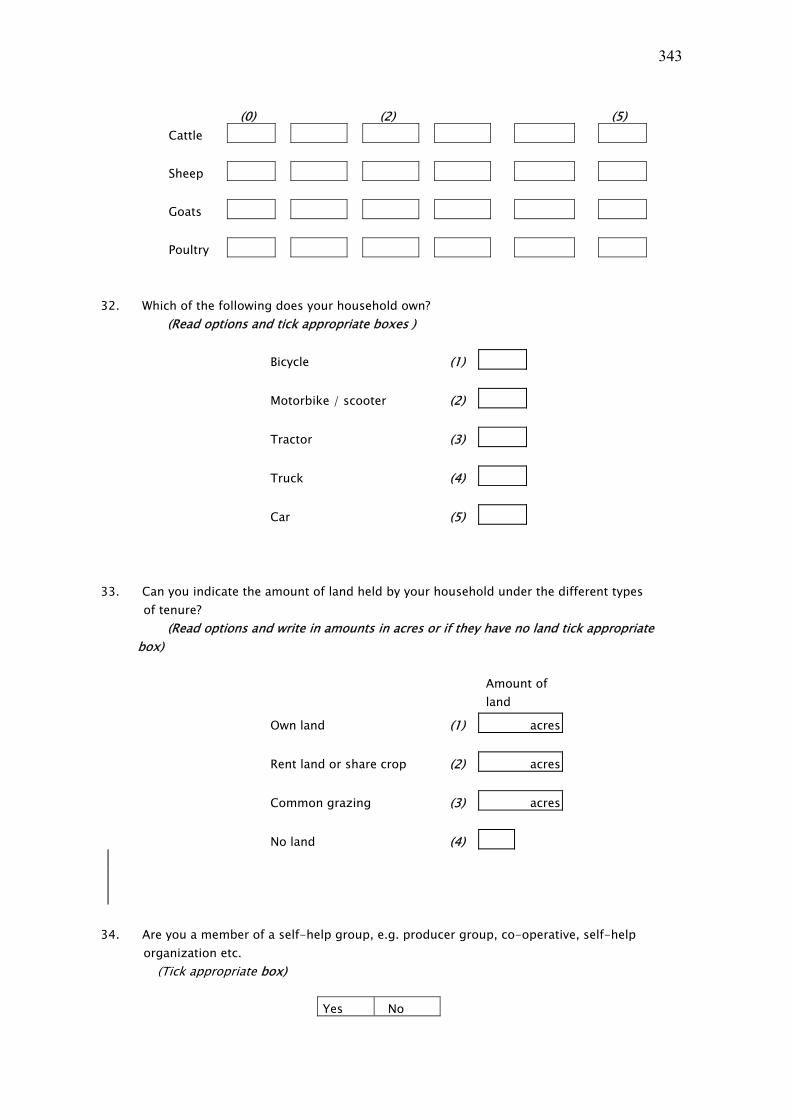
343
(0) (2) (5) Cattle
Sheep
Goats
Poultry
32. Which of the following does your household own? (Read options and tick appropriate boxes )
Bicycle (1)
Motorbike / scooter (2)
Tractor (3)
Truck (4)
Car (5)
33. Can you indicate the amount of land held by your household under the different types of tenure?
(Read options and write in amounts in acres or if they have no land tick appropriate box)
Amount of
land
Own land (1) acres
Rent land or share crop (2) acres
Common grazing (3) acres
No land (4)
34. Are you a member of a self-help group, e.g. producer group, co-operative, self-help organization etc.
(Tick appropriate box)
Yes No
344
(1) (2) If NO skip to question 38
35. What is the size of your group? _________________________(Number of members)
36. What is the purpose of the group? _________________________________________
37. What are the main means of communication of the group:
Among the members ? ______________________________________________________ With customers? __________________________________________________________ With suppliers of inputs, goods etc ____________________________________________
INFORMATION NEEDS AND SOURCES OF INFORMATION
38. Could you indicate: How important the following types of information are for you in general?
(code a: 0 = Not applicable; 1 = unimportant; 2 = not very important; 3= no opinion; 4= important; 5 = very important)
Which means you most commonly used to access or share each type of information?
code b: Not applicable…………...…..0 Face to face contact…..……….1 Local leaders e.g. church ……2 radio.………………………… 3 TV……………………………..4 Newspaper / newsletter.….…..5 adverts……………………….6 village information centre…..7 phone…………………….… 8 internet ………………….…..9 SMS ……………………..…10 Letters………………………11
(Read options and write in code that represents the respondent's opinion re each issue)
Importance (code a)
Means of communicat
ing (code b)
Farming and business information (a)
345
Social information (e.g. family, friends and social events)
(b)
Emergencies (c) Government and political (d) Education (e) Weather (f) News (Local and international) (g)
39. Could you indicate how the frequency with which you consult each has changed over the last 2 year
(code a: 1 = never used; 2 = much less; 3 = less; 4 = no change 5 = more 6 = much more
(Read options and write in code that represents the respondents' opinion in
corresponding box)
Changed use
(code a)
Government services e.g. Agr. Extension officers, vets
(a)
Traders who buy and sell produce (b)
Civil society organizations (NGO’s) (c)
Radio (d)
TV (e)
Newspapers (f)
Access and use of ICTs

346
40. Which of the following information and communication services do you have access to? (Read list and tick corresponding box if they have access)
Radio (a)
TV (b)
Fax (c)
Phone kiosk (d)
Mobile phones (e)
Short message service (SMS) (f)
Private fixed line phone (g)
Email / internet (h)
Personal computer (i)
41. How often have you used them in the last year? (Read list and indicate level of use in the corresponding box)
Code: 1 = not used; 2 = less than once a month; 3 = more than once a month; 4 = 1 or more times a week; 5= 1 or more times a day
Radio (a)
Television (b)
Fax (c)
Phone kiosk (d)
Mobile phones (e)
Short message service (SMS) (f)
Private fixed line phone (g)
Email / internet (h)
Personal computer (j)
347
Ask the following question only if the respondents indicated that they are using a mobile phone
42. Out of 10 times that you use a mobile phone how do you use it?
Call back
SMS (Text message)
Calls
Use of phone (mobile, fixed line, and public access)
43. When did you first acquire a mobile phone in the household
(Tick appropriate box)
More than 2 years ago
(1)
Two years ago (2)
During last year (3)
Do not own a mobile
(4)
If DO NOT OWN A MOBILE skip to question 45
44. If yes which service provider/s do you use? (Tick appropriate boxes)
BSNL
(1) Idea (2)
Hutch (3)
Bharti /Airtel
(4)
45. If you do not have your own mobile phone, how do you communicate by mobile phone? (Tick appropriate box)
Borrow a phone and use it myself (1)

348
Ask a mobile phone owner to call a number and then talk
(2)
Mobile phone kiosk (3)
Do not use mobile phone (4)
46. If you use a mobile phone which is not yours, how much do you pay each time for the following?
(Write in average amount in appropriate boxes)
For call back
Per text message
Per minute for calls
47. How frequently did you use the phone prior to access to mobiles? (Tick appropriate box re previous use of private and or public phones)
No mobile access (0)
Never used (1)
<1 per month (2)
1 – 2 / month (3)
1 -4 / week (4)
1 -2 / day (5)
>2 per day (6)
Private fixed phone
Public phone kiosk
48. How much do you and (did you) spend on phone use per month? (Tick one box in each column)
Mobile phone Fixed line
Private / public
Fixed line before mobile
Not used (1)
< 200/-
(2)

349
200-500 (3)
501-1000 (4)
>1000 (5)
49. What do you mostly use a mobile and or the fixed phone for? (Respondents are not able to differentiate between these categories (business, advisory information, gaining new knowledge)
(Indicate first = 1, second = 2 and third = 3 most common uses in each column)
(a) Mobile
phone (b) Fixed line (c) Fixed line
before mobile
business (1)
communication with friends and family
(2)
emergencies (3)
Impact of phone use:
50. Indicate the extent to which use of phones has influenced each of the following benefits for you over the last 2 years?
(Read item and then tick appropriate box)
Not
applicable No
influence Small
influenceMedium influence
Large influence
New clients
Better market prices
Reduced costs
Increased sales
Quicker turnover

350
Increased support from family
Saving of time spent traveling
Reduced cost of travel
Ability to check on availability of products before travel
Increased speed of communication – get immediate answer compared to letters or even landline
Less time needed to make business arrangements e.g. delivery of produce
Communication with Government dept’s.
More frequent contact with friends and relatives
Help quickly in cases of emergencies
Information about crop management
Information about livestock management
Information about new products and their use and application

351
(Read item and then tick appropriate box) Not
applicable No
influenceSmall
influence Medium influence
Large influence
Availability of professional staff – vets, para-vets, doctor, nurse etc.
Increased awareness of legal rights, e.g. re water and land
Information regarding schools and colleges
Legal requirements
Information regarding subsidies
Better coordination with other group members
Better access to family health information
Improved information regarding deaths, marriages, births and future events
51. How helpful has your investment in the use of a phone been regarding the following?
(Read item and then place appropriate code in appropriate box and indicate reason for response if positive)
Code: 1 = Very unhelpful, 2 = Unhelpful, 3 = No opinion, 4 = Helpful, 5 = Very helpful
For economic activities (a) If helpful how?
_______________________________________
For social communications
(b) If helpful how?
_______________________________________
For knowledge (c) If helpful how?
_______________________________________
(Ask question 52 only if the respondent does not own a phone)

352
52. If you do not own a phone now, how likely are you to own one within the next year? (Tick only one box)
Very unlikely (1)
Unlikely (2)
No opinion (3)
Likely (4)
Very likely (5) (Ask question 53 only if the respondent uses a phone)
53. If you were unable to use a phone any more, how would this impact your economic activities?
(Tick only one box)
Would not be able to continue (1)
Would continue but with difficulty (2)
No opinion (3)
Not much difference (4)
No difference (5)
54. Has the use of other means of communication changed since you started using a
phone? (Read issue and tick only one box regarding each issue)
Large
reduction(1)
Small reduction
(2)
No change
(3)
Slight increase
(4)
Large increase
(5) Use of letters and post office
Face to face communication
Making social visits
Use of newspapers

353
Referral to village council/local leaders
Use of the internet / e-mail
55. How do you communicate by email / internet?
(Tick one box)
Use it myself (1)
Ask an attendant to email / browse for me (2)
Have never communicated by email / internet
(3)
If the respondent has never used the Internet skip to the end – THANK THEM FOR THEIR COOPERATION
56. Do you look at websites? (Tick appropriate box)
Yes (1)
No (2)
57. E-mail - How many e-mails do you send on average?(Tick appropriate box)
Never used (1)
<1 per month
(2)
1 – 2 / month
(3)
1 -4 / week (4)
1 -2 / day (5)
>2 per day (6)
58. Internet – What types of web sites do you browse most often? (Ask as an open question and tick as many boxes as appropriate) News – current affairs (1)
News – sports (2)
Education related (3)
Entertainment – music (4)
Entertainment – games (5)

354
Entertainment – adult (Porno) (6)
Social – e.g. finding pen pals (7)
Religious affairs (8)
Business / work (9)
Government information (10)
Health issues (11)
Marriage CVs (12)
Astrology (13)
59. Where do you regularly access email / internet? (tick as many boxes as appropriate)
Internet café (1) University/College/School (2) Home (own phone) (3) Private line e.g. friends/neighbours
(4)
Place of work (5)
If the respondent does not regularly access email/internet at an internet café skip to question 69
60. How long does the round trip take to access e-mail / internet? (tick only one box)
<30 mins (1)
30 min – 2hrs (2)
2hrs – 5hrs (3)
5hrs – 10hrs
(4)
>10hrs (5)
61. How much do you spend on traveling to access e-mail / internet? (for the round trip) (in Rs.)
(tick only one box)
<20 21 – 50 51 – 75 76-100 >100

355
(1) (2) (3) (4) (5)
62. How much do you spend each time you access the e-mail/internet?
(tick only one box)
<20 (1)
21-50 (2)
51-75 (3)
76-100 (4)
>100 (5)
63. When did you start using the e-mail/internet? (tick one box)
more than 2 years (1)
two years (2)
last year (3)
Impact of Internet and Email
64. Indicate the extent to which use of email / Internet has influenced each of the following benefits to you over the last 2 years?
(Read item and then tick appropriate box)
Not
applicable No influence Small
influence Medium influence
Large influence
New clients
Better market prices
Reduced costs
Increased sales
Quicker turnover
Increased support from family
356
Saving of time spent traveling
Reduced cost of travel
Ability to check on availability of products before travel
Increased speed of communication - get immediate answer compared to letters or even landline
Reduced use of phone
Kiosk
Less time needed to make business arrangements e.g. delivery of produce
Communication with government depts
More frequent contact with friends and relatives
Help quickly in cases of emergencies
Information about crop management
Information about livestock management
Not
applicable No influence Small
influence Medium influence
Large influence
Information about new products and their use and application
Availability of professional staff – vets, para-vets, doctor, nurse etc.

357
Increased awareness of legal rights, e.g. re water and land
Information regarding schools and colleges
Legal requirements
Information regarding subsides
Better coordination with other group members
Better access to family health information
Improved information regarding deaths, marriages, births and future events
65. Has your investment in the use of the Internet / email been helpful? (Read item and then place appropriate code in appropriate box and indicate reason for
response if positive)
Code: 1 = Very unhelpful, 2 = Unhelpful, 3 = No opinion, 4 = Helpful, 5 = Very helpful
For economic activities (a) If helpful how?
_______________________________________
For social communications
(b) If helpful how?
_______________________________________
For knowledge (c) If helpful how?
_______________________________________
66. If you were unable to access the Internet / Email any more, how would this impact your
economic activities? (Tick only one box)
Would not be able to continue (1)
Would continue but with difficulty (2)

358
No opinion (3)
Not much difference (4)
No difference (5)
67. Has the use of other means of communication increased or reduced since you started
using the internet / email? (Read issue and tick only one box regarding each issue)
Large
reduction (1)
Small reduction (2)
No change (3)
Slight increase (4)
Large increase (5)
Use of letters and post office
Face to face communication
Making social visits
Use of phone kiosk to make long distance calls
Use of the fixed line phone
Use of the mobile
Use of newspapers
Referral to village council
THANK YOU FOR YOUR COOPERATION!

359
Appendix 2 : KaR 8347 questionnaire - Mozambique
O Impacto das Tecnologias de Informação e Comunicação (TIC) nos Meios de Vida Rural e na Redução da Pobreza – Moçambique
(A ser preenchido pela pessoa que introduz os dados antes de iniciar a introdução de dados deste questionário) Número do formulário
Entrevistado aleatório ou seleccionado: (marque a caixa certa)
aleatório (1)
seleccionado (2)
I. DADOS GERAIS SOBRE A PESQUISA (Preencha as perguntas de 1 a 10 antes de
começar a entrevista) 1. Data da entrevista ________________________________________________________________ 2. Nome de Entrevistador. ___________________________________________________________ 3. Nome do Bairro/Povoado/Aldeia/Regulado.
___________________________________________ 4. Nome da Localidade. _____________________________________________________________ 5. Nome do Posto Administrativo. _____________________________________________________ 6. Nome do distrito _________________________________________________________________ 7. Nível de cobertura de serviço de telefone (fixo e/ou celular). (Marque numa caixa
apropriada)
Nenhum acesso local (1)
Baixo - acesso público rural (cabinas ou antena) (2)
Médio - cobertura móvel boa (3)
Alto - linha fixa mais móvel (4)
8. Acesso a electricidade?
(Marque na caixa certa)

360
Nenhum
(1) Ocasional
(2) Sempre
(3)
9. Condições das estradas
(Marque na caixa certa)
Acessível todo ano (1)
Não acessível durante estação chuvosa (2)
10. Distância até a administração local? (Escreva a distância para o mercado principal para a aldeia)
Kilómetros
Ou tempo gasto
11. Nome do Supervisor. __________________________________ .
Verificado por:
______________________ (assine em cima)
II. Dados do entrevistado 12. Nome de entrevistado (opcional):
___________________________________________________________ 13. Relação com o chefe do agregado familiar
(Observe e marque a caixa certa. NB é considerado adulto, alguém com mais de 15 anos)
Chefe do agregado familiar (1)
Conjugue (2)
Membro adulto da família (3)
14. Idade aproximada do entrevistado
(escreva a idade do entrevistado)
Idade de entrevistado
361
15. Género: (Observe e marque a caixa certa)
Masculino (1)
Feminino (2)
16. Qual o nível mais alto de educação que você alcançou?
(Marque só uma caixa que indica o nível mais alto de educação mencionada)
Nenhuma educação formal (1)
Educação de adultos (2)
Frequentou o Ensino Primário (1º e/ou 2º graus) (3)
Nível Básico (ensino secundário ou escola básica) (4)
Nível Médio (ensino pré-universitário ou instituto) (5)
Ensino Superior e.g. bacharel, licenciatura, etc (6)
Só se ele(a) não tiver nenhuma educação formal, faça a pergunta 17 17. Sabe ler e escrever (em qualquer língua)?
(marque a caixa apropriada)
Sim (1)
Não (2)
18. Quantas pessoas normalmente moram em sua casa? (excluir visitas de curta estadia)

362
(Escreva o número de pessoas que moram de facto na casa para cada faixa etária)
Crianças (menores de 15 anos)
Adultos (15 e mais)
19. Quantos destes:
(Escreva o número para cada caso)
São dependentes de si para sustento financeiro
Ajudam a família com dinheiro ou de outra espécie
20. Há membros próximos da sua família que vivem em outras cidades de Moçambique
(cônjuge, pais, irmãos & irmãs, filhos)? (marque apenas uma só caixa)
Sim (1)
Não (2) 21. Há membros próximos da sua família que vivem fora de Moçambique (cônjuge, pais,
irmãos & irmãs, filhos)? (marque apenas uma caixa)
Sim (1)
Não (2) 22. Qual é a sua principal razão para viajar? (marque apenas uma só caixa)
Visitar familiares e/ou amigos
(1)
Comprar e/ou vender produtos
(2)
Oficial (p.e. tratar documentos)
(3)
Aceder a um telefone (fixo/celular)
(4)
Emergências (p.e. morte, (5)

363
doença)
Outras (6)
Especifique outras __________________________________________________________________________________________ 23. Poderia dizer se os assuntos seguintes melhoraram ou pioraram durante os últimos 2
anos: (Escreva o código apropriado para cada assunto)
CÓDIGO: 1 = muito pior; 2 = pior; 3 = nenhuma mudança; 4 = melhor; 5 =
muito melhor
A saúde dos membros da sua família (a)
Oportunidades de educação para os seus filhos (escreva 0 se não tiver filhos) (b)
O seu próprio nível de conhecimento e educação (c)
Segurança geral na sua vizinhança/bairro (d)
O seu rendimento familiar (e)
Apoio de familiares que vivem longe (f)
Relações com familiares (g)
Relações com amigos (h)
Relações de negócio ou de grupos de trabalho (i)
Qualidade de serviços do governo (j)
Mudanças no acesso às telecomunicações (k)
Possibilidade de tomar parte em actividades familiares ou da comunidade (l)
Qualidade de vida (m)
A sua posição/reputação na comunidade (n)
24. O número de suas viagens/deslocações aumentou ou reduziu nos últimos 2 anos?
(Escreva o código apropriado na caixa)
364
CÓDIGO: 1 = reduziu muito; 2 = reduziu; 3 = nenhuma mudança; 4 = aumentou; 5 = aumentou muito
III. Estado Económico 25. Quais são as três principais fontes de rendimento de seu agregado familiar por ordem
de importância? (Escreva os tipos de ocupação e renda anual aproximada de cada)
Tipo de ocupação ou fonte Rendimento anual aproximado
Principal fonte de rendimento:
_________________________________
Mts
Segunda fonte de rendimento:
_________________________________
Mts
Terceira fonte de rendimento:
_________________________________
Mts
26. Relativo a sua casa:
(marque apenas uma das seguintes caixas)
aluguer (1)
propriedade pessoal
(2)
outra: (3)
Outra (especifique)
______________________________________________________________________
27. Poderia descrever o tipo de casa onde mora:
(Marque apenas nas caixas seguintes para cada elemento)
Tipo de tecto folhas/capim (1)
Telhas/zinc
o (2)
Placa de cimento
(3)
Tipo de chão areia
(1) Cimento
(2) Tijoleira
(3)

365
Tipo de paredes Caniço/
capim/ areia(1)
madeira/zin
co/ adobe
(2)
tijolos, blocos de cimento
(3)
28. Da lista a seguir abaixo, o que tem em sua casa? (Leia as opções e marque as caixas apropriadas)
Água canalizada ou poço (1)
Energia eléctrica da rede de distribuição (EDM)
(2)
Gerador de uso pessoal (3)
Telefone Fixo (linha) (4)
Televisão (5)
Geleira (6)
Rádio (7)
Computador (8)
Bicicleta (9)
Motorizada / acelera (10)
Tractor (11)
Camioneta (12)
Turismo/carrinha (13)
29. Que tipo de apoio, se houver, recebe dos seus familiares que vivem longe? (Leia as opções e marque as caixas certas)
Nenhum apoio recebido (1)
Dinheiro (2)
Roupas e calçado (3)
Comida (4)
366
Telefone celular (5)
Crédito de telefone (6)
Outros (7)
Outros (especifique)
______________________________________________________________________ Se NUNCA TIVER RECEBIDO ALGUM APOIO salte para a pergunta 31 30. Qual é o nível de dependência do seu agregado familiar no apoio vindo de familiares
que vivem fora? (Leia as opções e marque as caixas apropriadas)
nenhuma
(1)
ligeira
(2) modera
da
(3)
elevada
(4)
31. Quantos animais domésticos das seguintes espécies abaixo possui?
(Leia as opções e marque as apropriadas para cada tipo de animal doméstico)
< 10 (1)
10 – 50(2)
51 – 100 (3)
101 – 200 (4)
>201 (5)
bois
cabritos/ovelhas
porcos
galinhas/patos
32. Você pode indicar a quantia de terra ocupada por sua família considerando os
diferentes tipos de posse? (Leia as opções e escreve em hectares ou se não tiver nenhum terreno marque a caixa certa)
Área do terreno
Terreno próprio (1) Ha

367
Terreno emprestado/alugado
(2) Ha
Terreno de plantio comum (3) Ha
Terreno de pastagem comum
(4) Ha
Sem terra (5)
33. É membro de algum grupo, associação ou organização (de negócio, agrícola, político,
religioso, social, xitique, etc.)? (Leia as opções e marque as caixas apropriadas)
nenhuma (0)
cooperativa (1)
ONG (2)
Outras associações (3) Se não for MEMEBRO DE NENHUM GRUPO passe para pergunta 37 34. Para o grupo mais importante, qual é o tamanho de seu grupo? ________________
(Número de membros) 35. Para o grupo mais importante, qual é o objectivo do
grupo?______________________________________ __________________________________________________________________________________________ 36. Para o grupo mais importante, qual é o meio de comunicação principal do grupo:
entre os membros? ____________________________________________________________________________________________
com os clientes?
______________________________________________________________________________________________
com os fornecedores de insumos, produtos, etc
______________________________________________________________________

368
37. Quantas pessoas que vivem em sua casa têm telefones celulares? (anote o número na caixa)
Numero de telefones celulares em casa
Se não TIVEREM NENHUM TELEFONE CELULAR em casa salte para a pergunta 39 38. Quais dos membros do seu agregado familiar que moram em sua casa têm um
telefone celular próprio? (Indique através da relação com o chefe do agregado familiar, apenas daqueles que actualmente moram na mesma casa - mas não considere visitas - p.e. chefe do agregado familiar, cônjuge, filho(a), neto(a), genro, nora, etc.)
a)_______________________________ b)_______________________________ c)_______________________________ d)_______________________________
IV. NECESSIDADES DE INFORMAÇÃO E FONTES DE INFORMAÇÃO 39. Poderia indicar:
a) Hoje em dia que importância tem os seguintes tipos de informação para si?
(código a: 1 = sem importância; 2 = não muito importante; 3 = nenhuma opinião / não aplicável; 4 = importante; 5 = muito importante)
b) Que meios de comunicação você usa regularmente para acessar ou compartilhar cada tipo de informação? código b: Contacto cara a cara …....................................................…1
Líderes locais por exemplo religiosos ….............................2 Rádio.…………...............................................…………… 3 televisão ...................................…...................................… 4 jornal / boletim informativo.….......................................... 5 publicidade/avisos ................................……………......... .6 centro de informação local ................................................7 telefone (fixo ou celular)...........................................….… 8 Internet…….............................................……………...... 9 SMS………............................................……………....…10 mensageiro ….........................................……………..…11 redes locais…….................................................……..…12 carta (através dos correios).….....................................…13

369
(Faça uma pergunta aberta e depois escreva o código que melhor representa a opinião do entrevistado para cada assunto)
Importância (código a)
Meios de
comunicação
(código b)
Preços de mercado (para vender) Disponibilidade e custos dos insumos a comprar Disponibilidade de créditos, subsídios, pensões, assistência à vulnerabilidade
Informação de mercado, p.e. mercados novos Novos produtos & actividades, p.e. pesticidas, sementes, Informação sobre os clientes e devedores (p.e. capacidade de pagamento)
Informação sobre o Tempo Oportunidades de trabalho/emprego Transferência monetária (p.e. envio de dinheiro para a família)
Notícias sobre amigos Informações urgentes (p.e. emergências, morte, doença)
Notícias sobre familiares Eventos sociais e religiosos (p.e. casamentos) Diversão Rumores (p.e. fofoca) Namoro Oportunidades de aprendizagem (escolas e
370
ensino adicional) Como prevenir e tratar doença dentro da família
Gestão e cuidados de saúde de gado Gestão da produção agrícola (código a: 1 = sem importância; 2 = não muito importante; 3 = nenhuma opinião / não aplicável; 4 = importante; 5 = muito importante)
código b: contacto cara a cara …....................................................…1
líderes locais por exemplo religiosos ….............................2 rádio.…………................................................…………… 3 televisão ...................................…...................................… 4 jornal / boletim informativo.…........................................... 5 publicidade ..…….................................……………......... .6 centro de informação de aldeia ..........................................7 telefone (fixo ou celular)...........................…………….… 8 Internet ……............................................…………….… . 9 SMS………............................................……………... …10 mensageiro ….........................................……………. …11 redes locais…….................................................……. …12 carta (através dos correios).….................................... …13
(Faça uma pergunta aberta e depois escreva o código que melhor representa a opinião do entrevistado para cada assunto)
Habilidades empresariais Exigências governamentais e legais (p.e. impostos, regulamentos)
Notícias (local e internacional) Informação sobre outros produtores (colaboradores, concorrentes)
Horários de transporte e motoristas Outra 1: _______________________________________
Outra 2: ________________________________________

371
40. Poderia indicar:
a) Qual é o grau de confiança que tem em cada uma das fontes de informação seguintes?
(código a: 1 = nenhuma confiança; 2 = pouca confiança; 3 = nenhuma opinião; 4 = confiante; 5 = muito confiante)
b) Ao longo dos últimos 2 anos, a consulta a cada uma das fontes abaixo terá mudado?
(código b: 1 = muito menos; 2 = menos; 3 = nenhuma mudança; 4 = mais; 5 = muito mais (Leia as opções e escreve o código a que representa a opinião do entrevistado na caixa correspondente)
Confianç
a (código
a)
Mudança de uso
(código b)
Vizinhos (a)
Líderes locais/comunitários (b)
Pessoal da administração (c)
Serviços do governo, p.e. oficiais de extensão agrária, veterinários (d)
Comerciantes que vendem insumos para agric.e criação de gado (e)
Fabricas, p.e. fábricas de semente (f)
Redes (associações, grupos de agricultores, informadores) (h)
Rádio (i)
Televisão (j)
Jornais e revistas (k)

372
41. Na sua opinião, quais são as três prioridades de desenvolvimento mais importantes: (Leia as opções e escreve o respectivo código: 1 = 1º mais importante; 2 = 2º mais importante; 3 = 3º mais importante)
Construir mais centros de saúde
Construir mais escolas
Melhorar e fazer manutenção das estradas
Estender cobertura de rede de telefonia móvel
Estender a rede de electricidade para as áreas mais remotas
Melhorar acesso a informação agrícola
Escoamento e comercialização agrícola
V. ACESSO E USO DE TIC 42. Tem acesso a quais dos serviços de informação e comunicação a seguir?
(Leia a lista e marque a caixa correspondente se ele tiver acesso)
Rádio (a)
Televisão (b)
Fax (c)
Telefone público (fixo e/ou celular) (d)
Telefone celular (e)
Serviço de mensagem curta (SMS) (f)
Linha de telefone fixo privado (g)
Correio electrónico / internet (h)
Computador pessoal (i)

373
43. Com que frequência terá usado os mesmos ao longo do último ano?
(Leia a lista e indique nível de uso na caixa correspondente)
Código: 1 = não usou; 2 = uma vez por mês; 3 = mais de uma vez por mês; 4 = 1 ou mais vezes por semana; 5 = 1 ou mais vezes por dia
Rádio (a)
Televisão (b)
Fax (c)
Telefone público (fixo e/ou celular) (d)
Telefone celular (e)
Serviço de mensagem curta (SMS) (f)
Linha de telefone fixo privado (g)
correio electrónico / internet (h)
Computador pessoal (i)
44. Em cada 10 vezes que usa o telefone (fixo ou celular) quantas vezes seriam só para
receber chamadas?
Número de vezes em 10 chamadas
45. Em cada 10 vezes que usa o celular para fazer chamadas, quantas vezes seriam para
enviar mensagens (SMS)?
Número de vezes em 10 chamadas
VI. Uso de telefone (fixo, celular e cabina público) 46. Quando é que se adquiriu o primeiro telefone celular no seu agregado familiar
(marque a caixa apropriada)
Há mais de 2 anos atrás
(1)

374
Há 2 anos (2)
Durante o ano passado (3)
Não possui telefone celular
(4)
Se NÃO POSSUI UM TELEFONE CELULAR salte para pergunta 48 47. Qual(is) do(s) provedor(es) de serviço usa?
(Marque a caixa certa)
Vodacom (1)
MCel
(2)
48. Com que frequência usava o telefone fixo antes de ter acesso ao telefone celular?
(marque a caixa apropriado para os casos de uso prévio de telefone privado e/ou telefones públicos) Nunca
usou (1)
<1 vez por mês (2)
1 – 2 / vezes por mês (3)
1 -4/vezes por semana (4)
1 -2/ vezes por dia (5)
>2 vezes por dia (6)
telefone privado
telefone público
49. Quanto gasta (ou gastou) no uso de telefone por mês em Mts?
(Marque uma caixa em cada coluna) Telefone
celular próprio
Telefone público, fixoou celular
Telefone fixo antes do telefone celul
nunca usou (1)
menos de 15.00 (2)
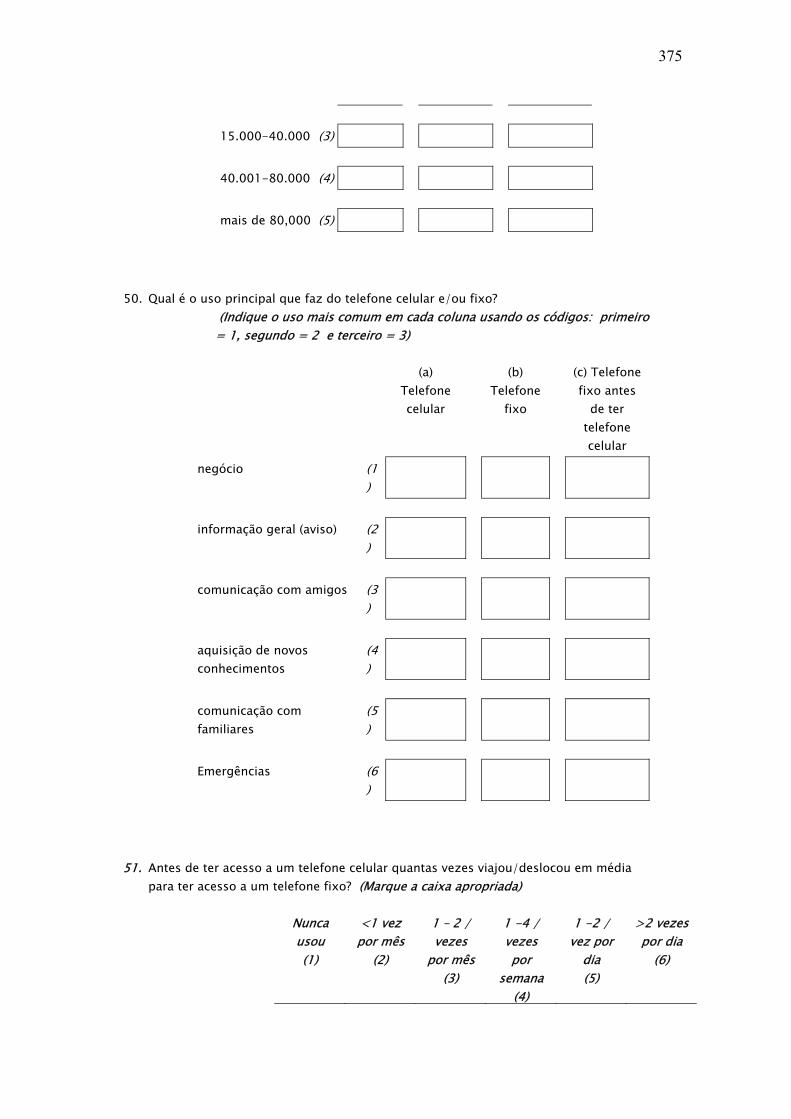
375
15.000-40.000 (3)
40.001-80.000 (4)
mais de 80,000 (5)
50. Qual é o uso principal que faz do telefone celular e/ou fixo?
(Indique o uso mais comum em cada coluna usando os códigos: primeiro = 1, segundo = 2 e terceiro = 3)
(a)
Telefone celular
(b) Telefone
fixo
(c) Telefone fixo antes
de ter telefone celular
negócio (1)
informação geral (aviso) (2
)
comunicação com amigos (3
)
aquisição de novos conhecimentos
(4)
comunicação com familiares
(5)
Emergências (6
)
51. Antes de ter acesso a um telefone celular quantas vezes viajou/deslocou em média
para ter acesso a um telefone fixo? (Marque a caixa apropriada)
Nunca usou (1)
<1 vez por mês
(2)
1 – 2 / vezes
por mês (3)
1 -4 / vezes por
semana (4)
1 -2 / vez por
dia (5)
>2 vezes por dia
(6)

376
52. Se precisar de se deslocar/viajar para usar um telefone agora, de que meios costuma
usar
de transporte privado (1)
de transporte público (machimbombo, chapa)
(2)
de bicicleta (3)
de mota/acelera (4)
à pé (5)
não se desloca para ter acesso (6)
Se NÃO VIAJA/DESLOCA-SE PARA TER ACESSO a um telefone salte para a pergunta 57
53. Se tem viajado para usar um telefone (fixo ou celular) que tipo de telefone usa mais frequentemente?
(Marque só uma caixa)
Meu próprio telefone - viajo para obter sinal (1)
Telefone privado com antena externa (2)
Telefone privado sem antena (3)
Kuluma (4)
Cabinas publicas (5)
Agêncais Digitais (6)
Telecartão (7) 54. Se precisa de viajar/deslocar para usar um telefone (fixo ou celular), quanto tempo
gasta para fazer uma viagem de ida e volta? (Marque a caixa certa)
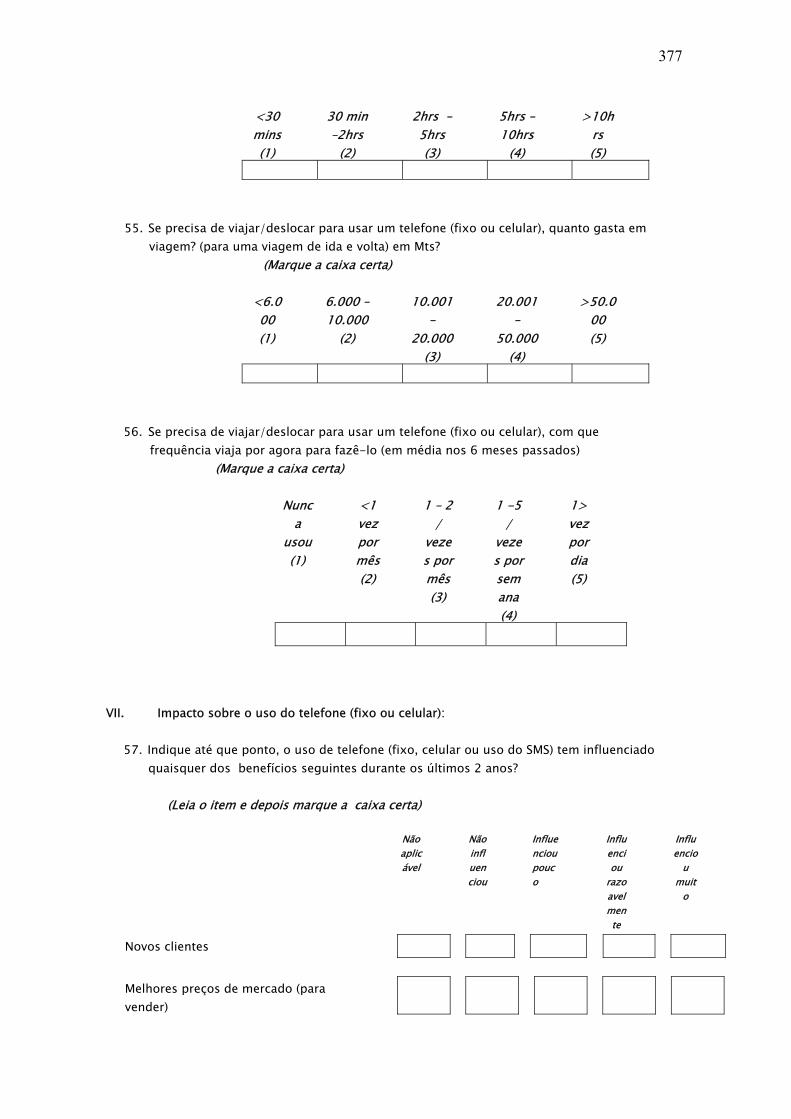
377
<30mins (1)
30 min –2hrs
(2)
2hrs – 5hrs (3)
5hrs – 10hrs
(4)
>10hrs (5)
55. Se precisa de viajar/deslocar para usar um telefone (fixo ou celular), quanto gasta em
viagem? (para uma viagem de ida e volta) em Mts? (Marque a caixa certa)
<6.0
00 (1)
6.000 –10.000
(2)
10.001 –
20.000 (3)
20.001 –
50.000 (4)
>50.000 (5)
56. Se precisa de viajar/deslocar para usar um telefone (fixo ou celular), com que
frequência viaja por agora para fazê-lo (em média nos 6 meses passados) (Marque a caixa certa)
Nunca
usou (1)
<1 vez por mês (2)
1 – 2 /
vezes por mês (3)
1 -5 /
vezes por semana (4)
1> vez por dia (5)
VII. Impacto sobre o uso do telefone (fixo ou celular): 57. Indique até que ponto, o uso de telefone (fixo, celular ou uso do SMS) tem influenciado
quaisquer dos benefícios seguintes durante os últimos 2 anos?
(Leia o item e depois marque a caixa certa)
Não aplicável
Não influenciou
Influenciou pouco
Influenciou
razoavelmente
Influencio
u muit
o
Novos clientes
Melhores preços de mercado (para vender)

378
Custos reduzidos (ao comprar)
Aumento das vendas
Rotação de stockes mais rápida
Melhores vantagens competitivas
Aumentou a ajuda de familiares
Facilitou o obtenção de ajuda de familiares quando necessário
Economizou o tempo gasto em viagens
Diminuiu os gastos com viagens
Deu a possibilidade de verificar a disponibilidade de produtos antes de viajar para comprar
Aumento da rapidez de comunicação
Tornou mais fácil organizar o de negócio p.e. entregas
Tornou mais fácil a comunicação com diferentes departamentos do governo
Contacto mais frequente com os amigos e familiares
Melhorou a capacidade de responder à emergências
Pode-se obter melhores informações sobre familiares
Melhorou a capacidade de organizar assuntos sociais, p.e. casamentos, missas
Mais informação sobre a gestão da
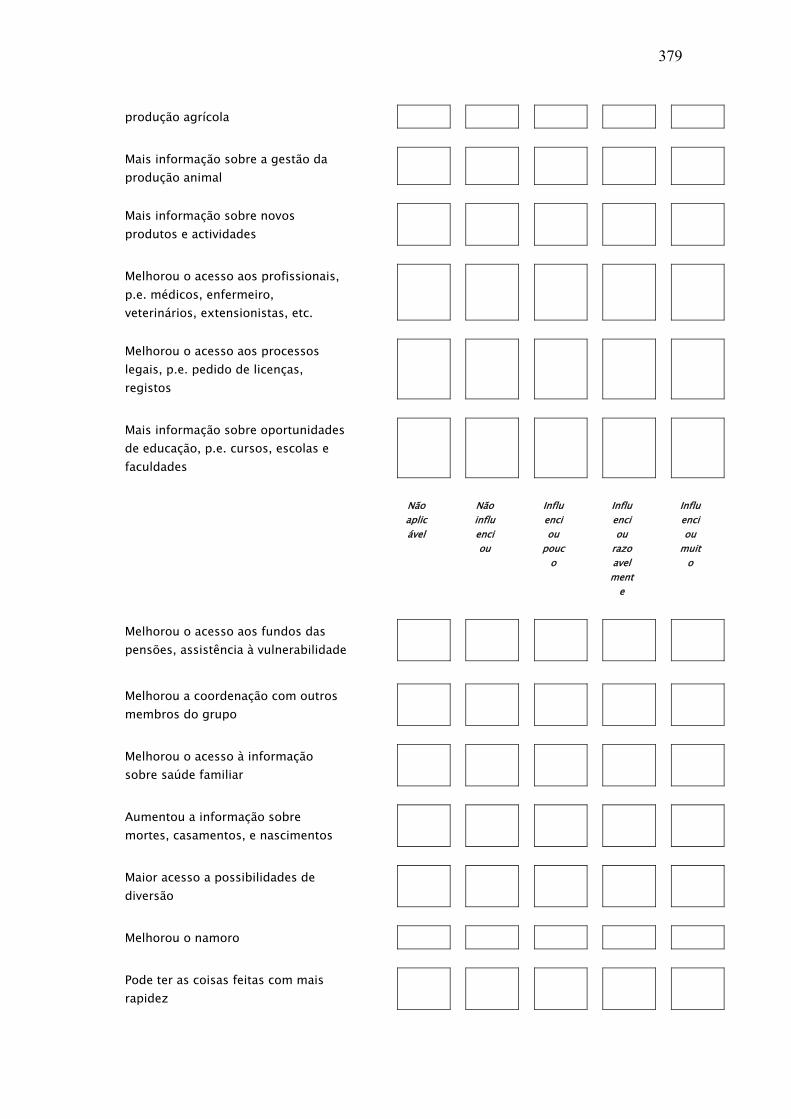
379
produção agrícola
Mais informação sobre a gestão da produção animal
Mais informação sobre novos produtos e actividades
Melhorou o acesso aos profissionais, p.e. médicos, enfermeiro, veterinários, extensionistas, etc.
Melhorou o acesso aos processos legais, p.e. pedido de licenças, registos
Mais informação sobre oportunidades de educação, p.e. cursos, escolas e faculdades
Não aplicável
Não influenciou
Influenciou
pouco
Influenciou
razoavelment
e
Influenciou
muito
Melhorou o acesso aos fundos das pensões, assistência à vulnerabilidade
Melhorou a coordenação com outros membros do grupo
Melhorou o acesso à informação sobre saúde familiar
Aumentou a informação sobre mortes, casamentos, e nascimentos
Maior acesso a possibilidades de diversão
Melhorou o namoro
Pode ter as coisas feitas com mais rapidez

380
Torna mais fácil viajar
Torna-se possível tratar assuntos à distância (p.e. resolver problemas, encomendar produtos/serviços)
58. Em quê tem sido útil o seu investimento no uso de um telefone (fixo ou celular) para
os seguintes itens? (Leia o item e marque o código certo na caixa certa e indica a razão no caso de a resposta ser positiva)
Código: 1 = Totalmente inútil, 2 = Inútil, 3 = Nenhuma opinião, 4 = Útil, 5 = Muito útil
actividades económicas
(a) Explique porquê?
______________________________________________________________
comunicações sociais (b) Explique porquê?
______________________________________________________________
sua educação e conhecimento
(c) Explique porquê?
______________________________________________________________
59. Se não possui um telefone (fixo ou celular) agora, quais são as previsões de obter um,
dentro do próximo ano? (Marque apenas uma caixa)
Muito improvável (1)
improvável (2)
sem opinião (3)
provável (4)
Muito provável (5)

381
(Apenas faça a pergunta 60 se o entrevistado usar o telefone) 60. Se não pudesse usar um telefone nunca mais, como é que esta situação iria influenciar
nas suas actividades de geração de rendimento? (Marque apenas uma caixa)
Não seria capaz de continuar (1)
Continuaria mas com dificuldade (2)
Sem opinião (3)
Sem muita diferença (4)
Nenhuma diferença (5)
61. Como é que o uso de outros meios de comunicação terá mudado, desde que começou a usar o telefone (fixo/ celular)?
(Leia assunto e marque apenas uma caixa para cada assunto) Redu
ção drásti
ca
(1)
Pequena
diminuição
(2)
Nenhum
a mudança
(3)
Pequeno aumento
(4)
Grande aumento
(5)
Uso de cartas e correios
Comunicação cara-a-cara
Realizar visitas sociais
Anúncios dos líderes comunitários nos bairro/povoado/aldeia
Uso de mensageiros
VIII. USO DE INTERNET / E-MAIL (CORREIO ELECTRÓNICO)
62. Como descreve o seu nível de uso do e-mail / internet?
(Marque apenas uma caixa)

382
Sei usar o e-mail / internet (1)
Já experimentei usar e-mail / internet (2)
Nunca usei e-mail / internet (3)
Se o entrevistado NUNCA TIVER USADO INTERNET / E-MAIL então salte para fim – AGRADEÇA-LHE(S) PELA SUA COOPERAÇÃO. 63. Como comunica através do e-mail / internet?
(Marque apenas uma só caixa) Uso pessoalmente (1)
Peço alguém para navegar ou enviar e-mail por mim
(2)
64. Têm navegado em páginas de internet?
(Marque apenas uma só caixa)
Sim (1)
Não
(2)
65. E-mail - Quantos e-mails tem enviado em média?
(Marque apenas uma só caixa)
Nunca
usou (1)
<1 vez por mês (2)
1 – 2 /
vezes por mês (3)
1 -4 /
vezes por semana (4)
1 -2 /
vezes por dia (5)
>2 vezes por dia (6)
66. Internet - Que tipo de páginas de internet têm navegado mais?
(Faça um pergunta aberta e marque tantas caixas quantas indicadas pelo entrevistado)

383
Não navega em páginas de internet
(0)
Notícias - actualidades, desporto
(1)
Relacionadas com o ensino (2)
Divertimento - música, jogos, filmes
(3)
Social – p.e. fazer amigos à distância
(4)
Negócio / trabalho (5)
Informação do Governo (6)
Outras (7)
Outras (especifique) ______________________________________________________________________
67. De onde é que tem regularmente acedido ao e-mail / internet? (Marque tantas caixas quantas forem apropriadas)
Internet café (1) Universidade/Instituto/Escola (2) Agência Digital (TDM) (3) Linha privada p.e. amigos/vizinhos
(4)
Local de trabalho (5)
68. Quanto gasta, em meticais, de cada vez que acede ao e-mail/internet?
(Marque apenas uma só caixa)
<5000 5000- 10000 20001 >50
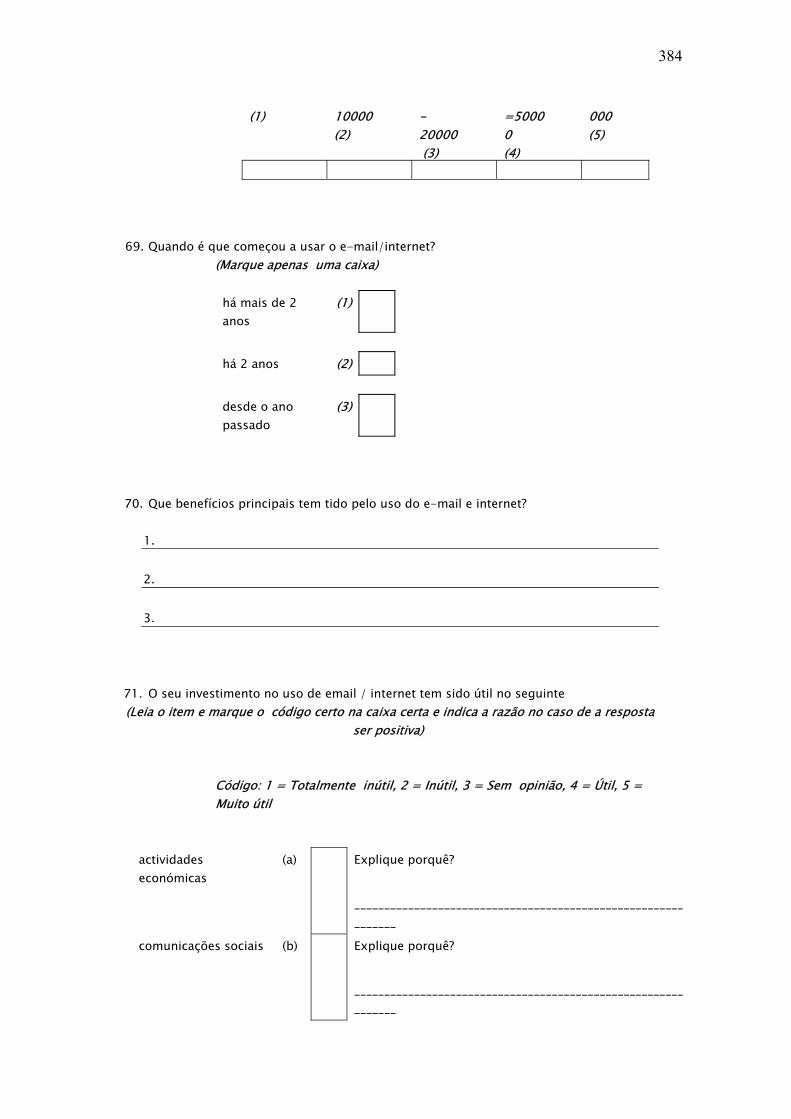
384
(1) 10000 (2)
-20000 (3)
=50000 (4)
000 (5)
69. Quando é que começou a usar o e-mail/internet?
(Marque apenas uma caixa)
há mais de 2 anos
(1)
há 2 anos (2)
desde o ano passado
(3)
70. Que benefícios principais tem tido pelo uso do e-mail e internet?
1. 2.
3.
71. O seu investimento no uso de email / internet tem sido útil no seguinte (Leia o item e marque o código certo na caixa certa e indica a razão no caso de a resposta
ser positiva)
Código: 1 = Totalmente inútil, 2 = Inútil, 3 = Sem opinião, 4 = Útil, 5 = Muito útil
actividades económicas
(a) Explique porquê?
______________________________________________________________
comunicações sociais (b) Explique porquê?
______________________________________________________________

385
sua educação e aquisição de conhecimento
(c) Explique porquê?
______________________________________________________________
72. Se não pudesse aceder nunca mais ao Internet / E-mail, como iria esta situação influenciar nas suas actividades económicas
(Marque apenas uma só caixa)
Não poderia continuar (1)
Continuaria mas com dificuldade (2)
Sem opinião (3)
Alguma diferença (4)
Nenhuma diferença (5)
73. O uso de outros meios de comunicação terá aumentado ou reduzido desde
que começou a usar o internet / e-mail? (Leia o item e marque apenas uma caixa em consideração a cada assunto)
Redu
ção drásti
ca
(1)
Pequena
diminuição
(2)
Nenhum
a mudança
(3)
Pequeno aumento
(4)
Grande aumento
(5)
Uso de cartas e correios
Comunicação cara a cara
Realização de visitas sociais
Uso do telefone fixo
Uso do telefone celular
Remeter assuntos ou

386
anúncios de líderes comunitários
Mensageiros
MUITO OBRIGADO PELA SUA COOPERAÇÃO!

387
Appendix 3: KaR 8347 questionnaire – Tanzania
The Impact of ICTs on Rural Livelihoods and Poverty Reduction - Tanzania (To be filled by the data entry person before entering the data of this questionnaire) Entry number
GENERAL SURVEY DATA (Fill in questions 1 to 10 prior to starting the interview)
1. Date of interview ___________.
2. Name of Interviewer. _________________________________ .
3. Name of Supervisor. __________________________________ .
4. Name of village. ____________________.
5. Name of ward. __________________________.
6. Name of district _____________________________________
7. Level of telephone service coverage. (Tick the appropriate box)
No local access (1)
Low – fixed line (2)
Medium – fixed line + 1 mobile service provider (3)
High – fixed line plus 2 or more mobile service providers (4)
8. Access to electricity? (Tick appropriate box)
None
(1) Occasio
nal (2)
Constant (3)

388
9. Condition of the road. (Tick appropriate box)
All weather (1)
Not accessible during rainy season (2)
10. Distance to main market centre? (Write in distance to principle market for the villages)
Kilometers
Checked by:
______________________ (sign above)
Respndent Data 11. Name of respondent (optional): ____________________________________________ 12. Relationship to the head of household
(Observe and tick appropriate box)
Head of household (1)
Spouse (2)
13. Approximate age of respondent
(write in age of respondent)
Age of respondent
14. Gender: (Observe and tick appropriate box)
Male

389
(1)
Female (2)
15. What is the highest level of education that you achieved?
(Tick only one box indicating the highest level of education mentioned)
No formal schooling (1)
Primary school (2)
Lower secondary (forms I to IV) (3)
Senior Secondary school (forms V to VI) (4)
Post secondary e.g. diploma, degree (5)
Only if they have had no formal schooling ask question 16 16. Do you know how to read and write?
(Tick appropriate box)
Yes (1)
No (2)
17. How many people are living regularly in your household? (not short time visitors)
(Write in the numbers of each age group actually living in the hh)
Children <18
Adults (18 and over) 18. How many of these are :
(Write in the numbers of each)
Dependant on you for

390
financial support
Supporting you in cash or kind
19. Do members of your immediate family live in other towns in Tanzania (parents, siblings,
children)? (tick only one box)
Yes (1)
No (2) 20. Do members of your immediate family live abroad (parents, siblings, children)? (tick only one box)
Yes (1)
No (
2)
21. Could you indicate if the following issues have got better or worse over the past 2
years: (Enter appropriate code for each issue) CODE: 1 = Much worse; 2 = Worse; 3 = No change; 4 = Better; 5 = Much
better 22.
The health of your family members (a)
Education opportunities for your children (0 if no children) (b)
Your own level of knowledge and education (c)
General security in your neighbourhood (d)
Your household income (e)
Support from family members living elsewhere (f)
Relationships with family members (g)
391
Relationships with your friends (h)
Quality of government services (e.g. levels of corruption) (i)
Access to telecommunications changed (j)
3. How has your need to travel increased or reduced in the last 2 years?
(Enter appropriate code in the box)
CODE: 1 = Greatly reduced; 2 = reduced; 3 = No change; 4 = Increased; 5 = Greatly increased
(j)
Economic Status
24. What are your household’s three principal sources of income in order of importance? (Write in the types of occupation and approximate annual income earned
from each)
Type of occupation Approximate Annual Income
Main source of income:
_____________________________ Tz /-
Second occupation:
______________________________
Tz /-
Third occupation:
_______________________________
Tz /-
25. Regarding your home do you: (Tick only one of the following boxes)
Rent
(1) Person
al ownership (2)
Other: Specif
y: (3)
Other (Specify) ______________________________________________________________________

392
26. Can you describe the type of house you live in: (Tick only one of the following boxes for each element)
Type of roof Thatch (1)
Tin (2)
Tiles (3)
Type of floor Earth
(1)
Cement (2)
Tiles (3)
Type of walls Mud
(1)
Cement Blocks
(2)
Burnt bricks
(3)
27. Does your house have the following?
Protected water
(Piped or protected well)
Yes (1)
No (2)
Electricity Yes
(1) No (2)
Fixed phone
(line) Yes (1)
No (2)
Television Yes
(1) No (2)
Fridge Yes
(1) No (2)
Radio Yes
(1) No (2)
Computer Yes
(1) No
(2)
28. How many of those living in your house have mobile phones? (Note number in box)

393
Number of mobile phones in house
If DO NOT HAVE A MOBILE in household skip to question 29
29. Which household members living in your house own mobiles? (Indicate by relationship to head of household of those currently living in the household -but not passing visitors-, e.g. head of household, spouse, son, granddaughter, son-in-law etc.) a)_______________________________ b)_______________________________ c)_______________________________ d)_______________________________
30. What, if any, type of material support do you receive from family members living
elsewhere? (Read options and tick appropriate boxes)
No support received (1)
Money (2)
Clothes (3)
Mobile phone (4)
Other (5) Specify:
If NO SUPPORT RECEIVED skip to question 31
31. To what extent is your household dependent on support from family members living elsewhere?
(Read options and tick appropriate boxes)
Not at all
(1)
Slight
(2) Modera
te
(3)
High
(4)

394
32. How many of the following livestock do you own? (Read options and tick appropriate box for each type of livestock)
None (0)
< 10 (1)
10 – 50 (2)
51 – 100 (3)
101 – 200 (4)
>201 (5)
Cattle
Sheep
Goats
Poultry
33. Which of the following does your household own? (Read options and tick appropriate boxes )
Bicycle (1)
Motorbike / scooter (2)
Tractor (3)
Truck (4)
Car (5)
Boat (6)
34. Can you indicate the amount of land held by your household under the different types of tenure?
(Read options and write in amounts in acres or if they have no land tick appropriate box)
Amount of
land
Own land (1) acres
Rent land (2) acres
Share cropping (3) acres
Common grazing (4) acres
No land (5)

395
35. Are you a member of a self-help group, e.g. producer group, co-operative, self-help
organisation etc. (Tick appropriate box)
Yes (1)
No (2)
If NO skip to question 38
36. What is the size of your group? _________________________(Number of members)
37. What is the purpose of the group? _________________________________________
38. What are the main means of communication of the group:
Among the members ? ______________________________________________________ With customers? __________________________________________________________ With suppliers of inputs, goods etc ____________________________________________
INFORMATION NEEDS AND SOURCES OF INFORMATION
39. Could you indicate: How important the following types of information are for you in general?
(code a: 0 = Not applicable; 1 = unimportant; 2 = not very important; 3= no opinion; 4= important; 5 = very important)
Which means you most commonly used to access or share each type of information?
code b: Not applicable…………...…0 Face to face contact…..……1 Local leaders e.g. church ….2 radio.……………………… 3 TV…………………………..4 Newspaper / newsletter.….…5 adverts……………………….6 village information centre…..7 phone……………………… 8 internet ……………………..9 SMS ……………………..…10 Letters………………………11
(Read options and write in code that represents the respondents opinion re each issue)
Importance Means of

396
(code a) communicating (code b)
Market information e.g. market prices, new markets
(a)
Availability and costs of inputs to purchase (b) Availability of credit and subsidies (c) Information on new products e.g. pesticides, seeds
(d)
Information on clients and debtors e.g. ability to pay
(e)
Weather information (f) Job opportunities (g) Remittances (h) Information about friends and family members (i) Urgent e.g. emergencies, deaths (j) News about sick relatives (k) Social and religious events e.g. marriages (l) Entertainment (m) Gossip (intrigue) (n) Romance (o) Education opportunities (schools and further education)
(p)
How to prevent and treat illness within the family (q) Livestock management & health (r) Crop management (s)
(code a: 0 = Not applicable; 1 = unimportant; 2 = not very important; 3= no opinion; 4= important; 5 = very important)

397
(code b: Not applicable…………...…0 Face to face contact…..……1 Local leaders e.g. church ….2 radio.……………………… 3 TV…………………………..4 Newspaper / newsletter.….…5 adverts……………………….6 village information centre…..7 phone……………………… 8 internet ……………………..9 SMS ……………………..…10 Letters………………………11)
Business skills (t) Government and legal requirements (e.g. taxes, regulations)
(u)
News (local and international) (v) Insurance (w) Information on other producers (collaborators, competitors)
(x)
Other 1: (y) Other 2: (z)
40. Could you indicate: a) How much confidence you have in each of the following sources of information?
(code a: 1 = no confidence ; 2 = little confidence; 3 = no opinion; 4 = confident; 5 = very confident
b) How the frequency with which you consult each has changed over the last 2 years?
(code b: 1 = much less; 2 = less; 3 = no change 4 = more 5 = much more
(Read options and write in code that represents the respondents' opinion in corresponding
box)
Confidence
(code a)
Changed use
(code b)
398
Neighbours (a)
Local leaders (b)
District staff (c)
Government services e.g. Agr. Extension officers, vets
(d)
Traders who sell inputs for agr. and livestock (e)
Manufacturers e.g. Seed Companies (f)
Civil society organizations (NGO’s, CBO’s) (g)
Private associations eg. AKSCG, TFA (h)
Radio (i)
TV (j)
Newspapers (k)
Access and use of ICTs
41. Which of the following information and communication services do you have access to?
(Read list and tick corresponding box if they have access)
Radio (a)
TV (b)
Fax (c)
Phone kiosk (d)
Mobile phones (e)
Short message service (SMS) (f)
Private fixed line phone (g)
Email / internet (h)
Personal computer (i)

399
42. How often have you used them in the last year?
(Read list and indicate level of use in the corresponding box) Code: 1 = not used; 2 = less than once a month; 3 = more than once a month; 4 = 1 or more
times a week; 5= 1 or more times a day
Radio (a)
Television (b)
Fax (c)
Phone kiosk (d)
Mobile phones (e)
Short message service (SMS) (f)
Private fixed line phone (g)
Email / internet (h)
Personal computer (j)
43. Out of 10 times that you use a mobile phone how do you use it?
Beeping
SMS (Text message)
Calls
Use of phone (mobile, fixed line, and public access)
44. When did you first acquire a mobile phone in the household (Tick appropriate box)
More than 2 years ago
(1)
Two years ago (2
)
During last year (3

400
)
Do not own a mobile
(4)
If DO NOT OWN A MOBILE skip to question 45
45. If yes which service provider/s do you use? (Tick appropriate boxes)
Vodacom
(1) Celtel
(2) Mobitel (Buzz)
(3)
46. If you do not have your own mobile phone, how do you communicate by mobile phone? (Tick appropriate box)
Borrow a phone and use it myself (1)
Ask a mobile phone owner to call a number and then talk
(2)
Mobile phone kiosk (3)
Do not use mobile phone (4)
47. If you use a mobile phone which is not yours, how much do you pay each time for the following?
(Write in average amount in appropriate boxes)
For beeping
Per text message
Per minute for calls
48. How frequently did you use the phone prior to access to mobiles? (Tick appropriate box re previous use of private and or public phones)
Never used
<1 per month
1 – 2 / month
1 -4 / week
1 -2 / day
>2 per day

401
(1) (2) (3) (4) (5) (6)
Private fixed phone
Public phone kiosk
49. How much do you and (did you) spend on phone use per month? (Tick one box in each column)
Mobile
phone Fixed line
Private/public
Fixed line before mobile
Not used (1)
<5,000/-
(2)
5,000-10,000
(3)
10,001-20,000
(4)
>20,000 (5
)
50. What do you mostly use a mobile and or the fixed phone for? (Indicate first = 1, second = 2 and third = 3 most common uses in
each column)
(a) Mobile phone
(b) Fixed line
(c) Fixed line before
mobile
business (1)
advisory information (2
)
communication with friends and family
(3)

402
gaining new knowledge
(4)
emergencies (family and friends)
(5)
51. How frequently did you travel to have access to a phone prior to the mobile? (Tick appropriate box)
Never used (1)
<1 per month
(2)
1 – 2 / month
(3)
1 -4 / week (4)
1 -2 / day (5)
>2 per day (6)
52. If there is no access to a phone in the village, what mode of transport do you most frequently use in order to get access to a phone?
(Tick one box)
Private transport (1)
Public transport (bus/taxis) (2)
Bicycle (3)
Scooter / motorcycle (4)
Walking (5)
Don’t travel to get access (6)
If DON’T TRAVEL TO GET ACCESS to phone skip to question 50
53. If you have no local access to a phone, how long do you take to make a round trip to access a phone? (Tick appropriate box)
<30mins (1)
30 min –2hrs (2)
2hrs – 5hrs (3)
5hrs – 10hrs
(4)
>10hrs (5)

403
54. If you have no local access to a phone, how much do you spend on travelling to use a phone? (for the round trip) (in Tz /-.) (Tick appropriate box)
<250 (1)
250 – 500 (2)
501 – 1000 (3)
1001 –5000 (4)
>5000 (5)
55. If you have no local access to a phone, how frequently do you presently travel to use a phone (on average over 6 months) (Tick appropriate box)
Never used (1)
<1 per month
(2)
1 – 2 / month
(3)
1 -5 / week (4)
1 > per day (5)
Impact of phone use:
56. Indicate the extent to which use of phones has influenced each of the following benefits for you over the last 2 years?
(Read item and then tick appropriate box) Not
applicable No
influence Small
influence Medium
influence Large
influence
New clients
Better market prices
Reduced costs
Increased sales
Quicker turnover
Increased support from family
Greater ability to get support from family when it is needed

404
Saving of time spent traveling
Reduced cost of travel
Ability to check on availability of products before travel
Increased speed of communication - get immediate answer compared to letters or even landline
Less time needed to make business arrangements e.g. delivery of produce
Communication with Government dept's.
More frequent contact with friends and relatives
Help quickly in cases of emergencies
Have received information quickly about distant family members
Have been able to arrange social functions such as marriages
Information about crop management
Information about livestock management
Information about new products and their use and application
(Read item and then tick appropriate box)
405
Not
applicable No
influence Small
influence Medium
influence Large
influence
Availability of professional staff – vets, para-vets, doctor, nurse etc.
Increased awareness of legal rights, e.g. re water and land
Astrology information
Ability to get hold of CV (marriage)
Information regarding schools and colleges
Legal requirements
Information regarding subsidies
Better coordination with other group members
Better access to family health information
Improved information regarding deaths, marriages and births
Greater access to entertainment options
Improved love life
57. What proportional impact (%) has using the phone had on?
(Read item and then tick appropriate box)
Can't tell Net loss No change
Small increase
1- 5%
Medium
6 – 10%
Large >10%
Impact on income (earnings)
406
Impact on time saved
Impact on savings (reduced costs)
58. How helpful has your investment in the use of a phone been regarding the following? (Read item and then place appropriate code in appropriate box and indicate reason for response
if positive)
Code: 1 = Very unhelpful, 2 = Unhelpful, 3 = No opinion, 4 = Helpful, 5 = Very helpful
For economic activities
(a) If helpful how?
_______________________________________
For social communications
(b) If helpful how?
_______________________________________
For knowledge (c) If helpful how?
_______________________________________
(Ask question 52 only if the subject does not own a phone)
59. If you do not own a phone now, how likely are you to own one within the next year? (Tick only one box)
Very unlikely (1)
Unlikely (2)
No opinion (3)
Likely (4)
Very likely (5)
(Ask question 53 only if the subject uses a phone)
60. If you were unable to use a phone any more, how would this impact your economic activities? (Tick only one box)

407
Would not be able to continue (1)
Would continue but with difficulty
(2)
No opinion (3)
Not much difference (4)
No difference (5)
61. Has the use of other means of communication changed since you started using a phone? (Read issue and tick only one box regarding each issue)
Large
reduction
(1)
Small reduction
(2)
No change
(3)
Slight increase
(4)
Large increase
(5)
Use of letters and post office
Face to face communication
Making social visits
Use of newspapers
Referral to village council/local leaders

408
Use of the internet / e-mail
62. How do you communicate by email / internet? (Tick one box)
Use it myself (1)
Ask an attendant to email / browse for me
(2)
Have never communicated by email / internet
(3)
If the respondent has never used the Internet skip to the end – THANK THEM FOR THEIR COOPERATION
63. Do you look at websites? (Tick appropriate box)
Yes
(1) No (2)
64. E-mail - How many e-mails do you send on average? (Tick appropriate box)
Never
used (1)
<1 per month
(2)
1 – 2 / month
(3)
1 -4 / week (4)
1 -2 / day (5)
>2 per day (6)
65. Internet – What types of web sites do you browse most often? (Ask as an open question and tick as many boxes as appropriate)
News – current affairs (1)
News – sports (2)
Education related (3)
Entertainment – music (4)
Entertainment – games (5)

409
Entertainment – adult (Porno)
(6)
Social – e.g. finding pen pals
(7)
Religious affairs (8)
Business / work (9)
Government information (10
)
Health issues (11
)
Marriage CVs (12
)
Astrology (13
)
66. Where do you regularly access email / internet? (tick as many boxes as appropriate)
Internet café (1) University/College/School (2) Home (own phone) (3) Private line e.g. friends/neighbours
(4)
Place of work (5)
If the respondent does not regularly access email/internet at an internet café skip to question 69
67. How long does the round trip take to access e-mail / internet? (tick only one box)
<30 mins (1)
30 min – 2hrs (2)
2hrs – 5hrs (3)
5hrs – 10hrs
(4)
>10hrs (5)

410
68. How much do you spend on traveling to access e-mail / internet? (for the round trip) (in Tz/-.)
(tick only one box)
<250 (1)
250 – 500 (2)
501 – 1000 (3)
1001 –5000 (4)
>5000 (5)
69. How much do you spend each time you access the e-mail/internet?
(tick only one box)
<500 (1)
500-1000 (2)
1000-2000 (3)
2001=5000 (4)
>5000 (5)
70. When did you start using the e-mail/internet? (Tick one box)
more than 2 years
(1)
two years (2)
last year (3)
Impact of Internet and Email
71. Indicate the extent to which use of email / Internet has influenced each of the following benefits to you over the last 2 years?
(Read item and then tick appropriate box) Not
applicable No
influence Small
influence Medium
influence Large
influence
New clients
Better market prices
Reduced costs
Increased sales
411
Quicker turnover
Increased support from family
Greater ability to get support from family when it is needed
Saving of time spent traveling
Reduced cost of travel
Ability to check on availability of products before travel
Increased speed of communication - get immediate answer compared to letters or even landline
Reduced use of phone kiosk
Less time needed to make business arrangements e.g. delivery of produce
Communication with government depts
More frequent contact with friends and relatives
Help quickly in cases of emergencies
Have received information quickly about distant family members
Have been able to arrange social functions such as marriages

412
Information about crop management
Information about livestock management
Information about new products and their use and application
Not
applicable No
influence Small
influence Medium
influence Large
influence
Availability of professional staff – vets, para-vets, doctor, nurse etc.
Increased awareness of legal rights, e.g. re water and land
Astrology information
Ability to get hold of CV (marriage)
Information regarding schools and colleges
Legal requirements
Information regarding subsides
Better coordination with other group members
Better access to family health information
Improved information regarding deaths, marriages and births
Greater access to entertainment options

413
Improved love life
72. What impact proportional impact (%) has using the Internet had on your income? (Read item and then tick appropriate box)
Can't
tell Net loss No
change Small
incr’se
1- 5%
Medium
6 – 10%
Large >10%
Impact on income (earnings)
Impact on time saved
Impact on savings (reduced costs)
73. Has your investment in the use of the Internet / email been helpful? (Read item and then place appropriate code in appropriate box and indicate reason for response
if positive)
Code: 1 = Very unhelpful, 2 = Unhelpful, 3 = No opinion, 4 = Helpful, 5 = Very helpful
For economic activities
(a) If helpful how?
_______________________________________
For social communications
(b) If helpful how?
_______________________________________
For knowledge (c) If helpful how?
_______________________________________
74. If you were unable to access the Internet / Email any more, how would this impact your
economic activities? (Tick only one box)
Would not be able to continue (1)
Would continue but with
difficulty (2)
414
No opinion (3)
Not much difference (4)
No difference (5)
75. Has the use of other means of communication increased or reduced since you started using the
internet / email? (Read issue and tick only one box regarding each issue)
Large
reduction
(1)
Small reduction
(2)
No change
(3)
Slight increase
(4)
Large increase
(5)
Use of letters and post office
Face to face communication
Making social visits
Use of phone kiosk to make long distance calls
Use of the fixed line phone
Use of the mobile
Use of newspapers
Referral to village council
THANK YOU FOR YOUR COOPERATION!

415
Appendix 4: Initial Research Framework Document
DFID KaR project:
The economic impact of telecommunications access on rural livelihoods and poverty reduction
RESEARCH FRAMEWORK
(draft by Research Coordinator, 2 March 2004)
Professor David Souter ict Development Associates ltd
1. Introduction This document sets out a draft research framework for implementation of a KaR project in category I1-11. It is intended as a basis for discussion and agreement with research partners before phase 2 of the project (initial country meetings) and for adaptation, following phase 2, to serve as a guidance note during implementation of phases 3 and 4 (field research and data analysis). (The full phasing of the project is described in section 5 below.) 2. Project background and objectives This project is being implemented within the UK Department for International Development (DFID)’s ‘Knowledge and Research’ (KaR) programme, which finances substantial research projects in infrastructure-related sectors. Funding is allocated on the basis of project proposals submitted through a competitive tendering procedure, and project implementation must therefore be consistent with the project proposal agreed between DFID and the main contractor (in this case, the CTO). A copy of the full proposal has been forwarded by the CTO to all project partners. This research framework is fully consistent with that proposal. The research problem addressed by the project is identified in the original proposal as follows:
Information and communication technologies are now widely believed to

416
have a significant part to play in promoting social and economic development, including the improvement of individual livelihoods, community prosperity and the achievement of national development goals related to the UN Millennium Development Goals. National ICT strategies and the programmes of international donors are incorporating ICT components on this basis, with specific objectives in reaching poor rural and peri-urban as well as urban communities. There is, however. little scientific evidence - in particular, evidence from detailed field research in specific poor communities - about the ways in which individuals and communities exploit access to ICTs, particularly telephony but also radio and (where available) internet, and the impact they have on livelihoods in rural and peri-urban communities. This is particularly true where - as in the vast majority of relevant communities - ICT access development has not been accompanied by specific development initiatives (see point 3.2.2). The lack of hard evidence on the relationship between ICT access and rural livelihoods inhibits effective decision-making on both ICT and livelihoods initiatives and programmes by development planners and the ICT sector, and means that scarce development resources may be ineffectively deployed or opportunities for effective pro-poor initiatives are being missed.
The project aims to contribute towards addressing this research problem by providing evidence on the actual relationship between telecommunications/ICT access and rural livelihoods in selected areas of three research countries – India (State of Gujarat), Mozambique and Tanzania. The main report of the project will assess the evidence researched and its value for policymaking a) in each research country and b) more generally, and make recommendations as appropriate. 3. Project partnership and partner responsibilities The project is being implemented by a consortium of partners, whose core responsibilities are described in the following table. Commonwealth Telecommunications Organisation (CTO)
Main contractor with DFID. Responsible for project management. Provision of some research assistant support to the research team.
Ict Development Associates ltd (ictDA) Sub-contractor to CTO. Responsible for research planning and coordination and for drafting final project reports in partnership with other research partners.
Gamos Ltd (Gamos) Sub-contractor to CTO. Responsible
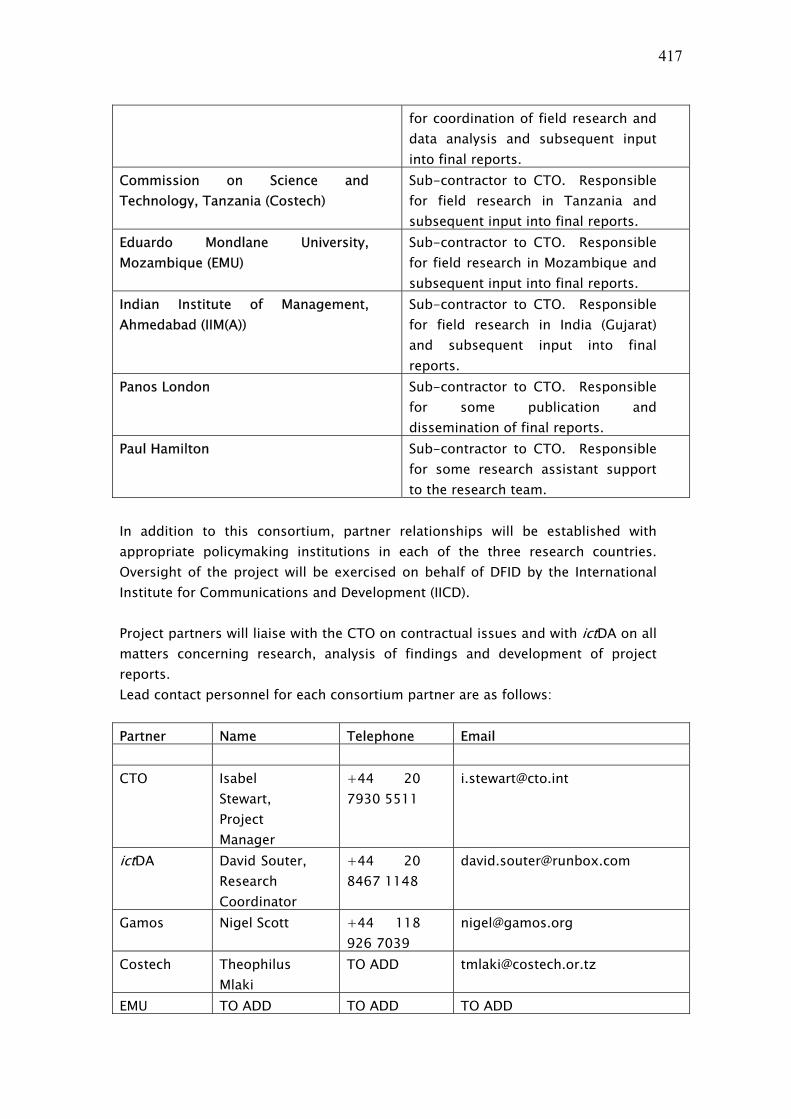
417
for coordination of field research and data analysis and subsequent input into final reports.
Commission on Science and Technology, Tanzania (Costech)
Sub-contractor to CTO. Responsible for field research in Tanzania and subsequent input into final reports.
Eduardo Mondlane University, Mozambique (EMU)
Sub-contractor to CTO. Responsible for field research in Mozambique and subsequent input into final reports.
Indian Institute of Management, Ahmedabad (IIM(A))
Sub-contractor to CTO. Responsible for field research in India (Gujarat) and subsequent input into final reports.
Panos London Sub-contractor to CTO. Responsible for some publication and dissemination of final reports.
Paul Hamilton Sub-contractor to CTO. Responsible for some research assistant support to the research team.
In addition to this consortium, partner relationships will be established with appropriate policymaking institutions in each of the three research countries. Oversight of the project will be exercised on behalf of DFID by the International Institute for Communications and Development (IICD). Project partners will liaise with the CTO on contractual issues and with ictDA on all matters concerning research, analysis of findings and development of project reports. Lead contact personnel for each consortium partner are as follows: Partner Name Telephone Email CTO Isabel
Stewart, Project Manager
+44 20 7930 5511
ictDA David Souter, Research Coordinator
+44 20 8467 1148
Gamos Nigel Scott +44 118 926 7039
Costech Theophilus Mlaki
TO ADD [email protected]
EMU TO ADD TO ADD TO ADD

418
IIM(A) Rekha Jain +91 79 632 4822
Panos Kitty Warnock
+44 20 7239 7603
Paul Hamilton
Paul Hamilton
+44 1454 227496
The role of national research partners (i.e. Costech, EMU and IIM(A)) is central to the successful conduct of the project. Although the overall field research design needs to be consistent across the three research countries (see section 6.d below), national research partners will play a central part in determining how the research is undertaken in their countries, in coordinating input during the Phase 2 country meetings, in implementing the field research, in data analysis and in contributing to final country level and overall project reports. The national research partners will, in particular, have lead responsibility for organising field research in the way that is most appropriate for their national context, and for ensuring the quality and integrity of national research findings. It is hoped that the project will also have lasting value for national research partners, for example by building capacity in field survey work and data analysis, by providing material for further academic research or consultancy work, and by providing baseline data which could be used for additional studies over a period of time. These factors should be considered during the national research design work in Phases 2 and 3 of the project (see below). 4. Constituencies and project outputs The principal target audiences for the research are identified in the project proposal as:
a) policy makers within government - in particular, those concerned with national ICT policies and allocating budgets, especially in development initiatives;
b) the broad range of stakeholders involved in/concerned with national development and ICT policy dialogue, including private sector and civil society;
c) donor institutions assessing appropriate levels of support for development of telecommunications infrastructure.
This includes those responsible for decisions concerning strategic planning and investment for either and both a) rural livelihoods / rural development and b) telecommunications and other ICTs. The research should provide evidence that will assist them in targeting resources more effectively, in particular in:

419
1) focusing the deployment of ICTs for development objectives in ways that maximise the contribution they make to sustainable rural livelihoods and minimise any negative impacts on equality or on specific social groups; and
2) informing decision-making on the deployment of ICTs by commercial
businesses and other stakeholders through a more accurate understanding of how ICTs can and will be used by vulnerable individuals and communities.
Livelihoods research cuts across sectoral boundaries, and this research will therefore address issues related to poverty reduction, agriculture, education, health, employment and other aspects of people’s lives. For the same reason, it will also have relevance to many of the Millennium Development Goals, and any implications for these should be borne in mind during research design. Relevant decision-makers can be found at both local and national levels in the three research countries, and national level reports will focus on findings of particular relevance to them. Findings that have wider relevance and findings from cross-country comparisons will also provide evidence for international-level decision-makers including those in donor institutions. Although the project is primarily concerned with evidence of value to decision-makers at a national and wider level, it will nevertheless produce evidence of considerable value at a local level – both generally within the research countries and specifically within the researched communities. Care should be taken to ensure that this value is properly disseminated at a local level, so that researched communities benefit directly from the work. The following project outputs are identified in the agreed project proposal:
• an inception report to DFID on progress to date, to be delivered by the end of April 2004;
• feedback and verification meetings for officials and other stakeholders in each research country;
• an overall project report extensively summarising the findings and making recommendations to ministers and other stakeholders;
• and a short summary report for dissemination to the wider public (to be produced by Panos).
The project proposal does not require the production of separate country-level reports. However, the project would clearly be much less valuable to target audiences and research partners if it did not lead to such reports. Production of the overall project report will therefore need to be undertaken in such a way that it
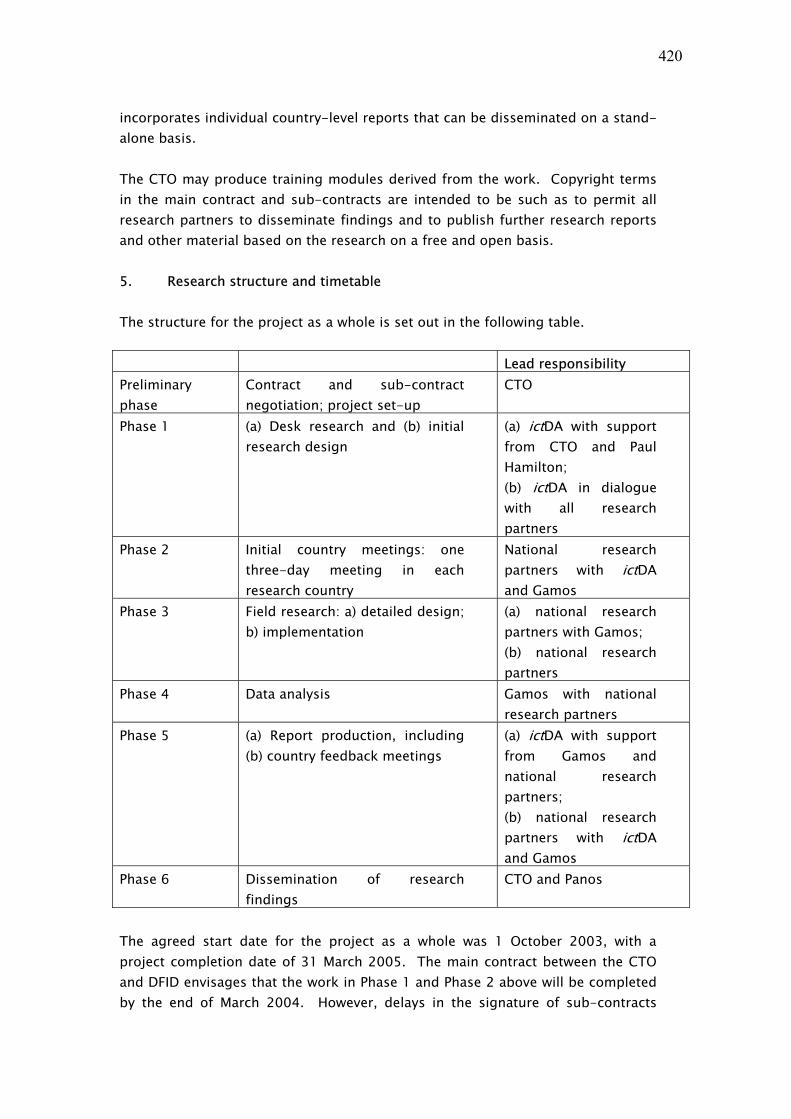
420
incorporates individual country-level reports that can be disseminated on a stand-alone basis. The CTO may produce training modules derived from the work. Copyright terms in the main contract and sub-contracts are intended to be such as to permit all research partners to disseminate findings and to publish further research reports and other material based on the research on a free and open basis. 5. Research structure and timetable The structure for the project as a whole is set out in the following table. Lead responsibility Preliminary phase
Contract and sub-contract negotiation; project set-up
CTO
Phase 1 (a) Desk research and (b) initial research design
(a) ictDA with support from CTO and Paul Hamilton; (b) ictDA in dialogue with all research partners
Phase 2 Initial country meetings: one three-day meeting in each research country
National research partners with ictDA and Gamos
Phase 3 Field research: a) detailed design; b) implementation
(a) national research partners with Gamos; (b) national research partners
Phase 4 Data analysis Gamos with national research partners
Phase 5 (a) Report production, including (b) country feedback meetings
(a) ictDA with support from Gamos and national research partners; (b) national research partners with ictDA and Gamos
Phase 6 Dissemination of research findings
CTO and Panos
The agreed start date for the project as a whole was 1 October 2003, with a project completion date of 31 March 2005. The main contract between the CTO and DFID envisages that the work in Phase 1 and Phase 2 above will be completed by the end of March 2004. However, delays in the signature of sub-contracts
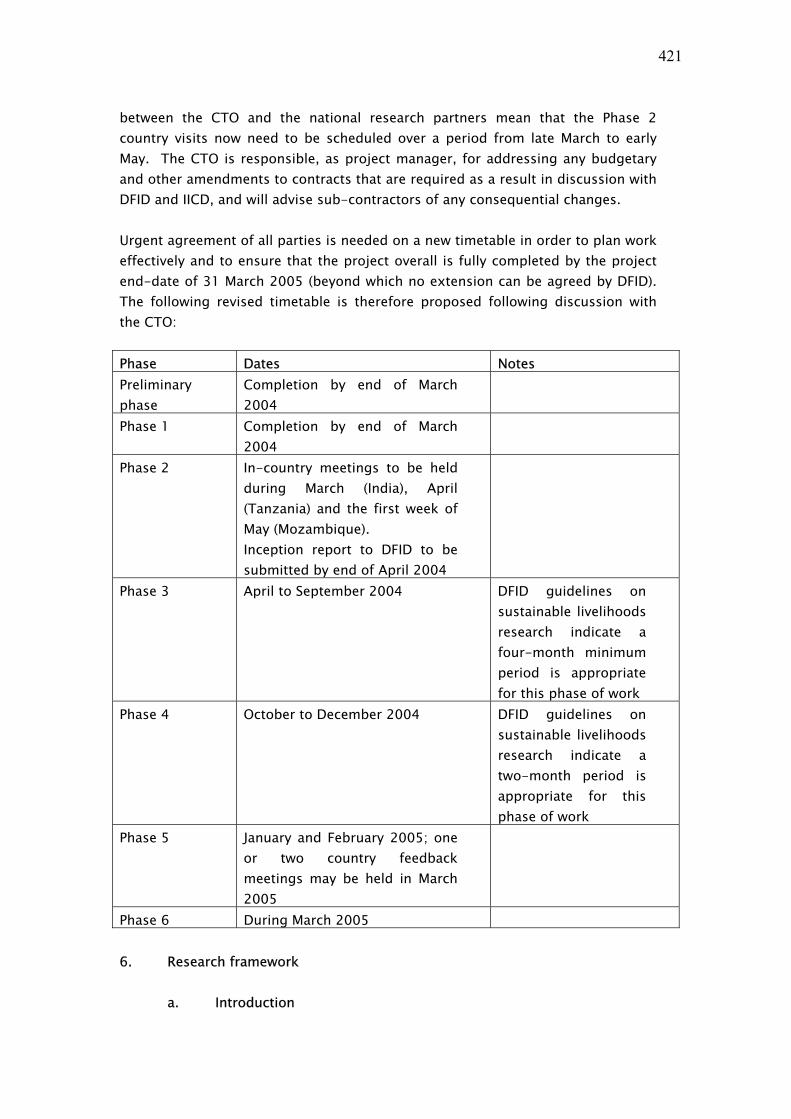
421
between the CTO and the national research partners mean that the Phase 2 country visits now need to be scheduled over a period from late March to early May. The CTO is responsible, as project manager, for addressing any budgetary and other amendments to contracts that are required as a result in discussion with DFID and IICD, and will advise sub-contractors of any consequential changes. Urgent agreement of all parties is needed on a new timetable in order to plan work effectively and to ensure that the project overall is fully completed by the project end-date of 31 March 2005 (beyond which no extension can be agreed by DFID). The following revised timetable is therefore proposed following discussion with the CTO: Phase Dates Notes Preliminary phase
Completion by end of March 2004
Phase 1 Completion by end of March 2004
Phase 2 In-country meetings to be held during March (India), April (Tanzania) and the first week of May (Mozambique). Inception report to DFID to be submitted by end of April 2004
Phase 3 April to September 2004 DFID guidelines on sustainable livelihoods research indicate a four-month minimum period is appropriate for this phase of work
Phase 4 October to December 2004 DFID guidelines on sustainable livelihoods research indicate a two-month period is appropriate for this phase of work
Phase 5 January and February 2005; one or two country feedback meetings may be held in March 2005
Phase 6 During March 2005 6. Research framework
a. Introduction

422
The primary concern of the research in this project falls within the field of rural or sustainable livelihoods, viewing these specifically through the relevance to them of one infrastructure-based sector, telecommunications/ICTs. The project’s approach and research methodology therefore need to be rooted firmly in the context and methodology of livelihoods research as a whole. This approach and methodology are outlined briefly in the project proposal and in more detail below. Much more extensive resources can be found in a series of Sustainable Livelihoods Guidance Notes produced by DFID and available at http://www.livelihoods.org/info/info_guidanceSheets.html. All research partners are recommended to familiarise themselves with this material, and in particular with Section 4 on research methodologies, before the Phase 2 country meetings take place. The following notes draw on these Guidance Notes, other livelihoods and ICT research work and methodologies, and discussions with DFID’s livelihoods advisors. b. The sustainable livelihoods approach
Livelihoods analysis is concerned with the range of assets which individuals, households (and communities) access and use in order to sustain themselves The starting point for livelihoods analysis is the ‘Vulnerability Context’. People’s lives, particularly those of the poor, are strongly affected by three groups of factors which make them (and their assets) vulnerable and which are outside their control. These are:
• trends (such as population change, national and international economic trends and technological change);
• shocks (such as natural disasters, epidemics, civil conflict and economic crises);
• and seasonality (variations in prices, costs, production, food supply, economic opportunity, etc.).
Together or individually, these factors can drastically affect (not necessarily reduce) people’s assets and options. Critical factors for measuring vulnerability can be found in section 2.2 of the DFID Guidance Notes. Within this context, people access and use a variety of assets to achieve positive livelihoods outcomes. The sustainable livelihoods approach organises these assets into five categories, usually illustrated as a pentagram (below). These are:

423
• human capital, i.e. skills, knowledge and the ability to work/produce;
• social capital, i.e. networks, participation in social/productive groups and mutually-beneficial relationships;
• natural capital, i.e. natural resources; • physical capital, i.e. buildings, infrastructure (including power and
water), productive tools etc.; and • financial capital, i.e. funds available for investment, production and
consumption.
Structures and processes are characteristics of the political and social environment within which they find themselves. They can be either positive, supporting people in their livelihood strategies, or negative, acting as barriers and constraints to livelihoods. There is a degree of interaction between people, structures and processes, in as far as people have democratic power to influence laws, government services etc.
Livelihood strategies are the approaches people adopt using the assets they have available to secure sufficient income and welfare to protect themselves against vulnerabilities and achieve other goals (such as sufficient food, education for their children, adequate shelter, medicine improvements in their quality of life). This project is concerned with the impact of telephony on these livelihood outcomes in poor communities. This impact ranges across the asset categories – for example, ICTs both use and make available infrastructural resources, facilitate networking, enable financial transactions and provide means of achieving objectives that may be more or less cost-effective than alternatives, require and foster skills – and the research needs equally to range across the whole livelihoods agenda. The research will therefore address:

424
1) if and how individuals, households and communities – as a whole and disaggregated into significant social groups – make use of the resources studied (telecommunications/ICTs) as part of their livelihoods strategies;
2) what effect, if any, use of these resources has on vulnerability, livelihoods assets, and structures and processes and, where possible, on livelihoods strategies of individuals, households and communities; groupings within the samples should be designed to compare impact between groups:
• do telecoms/ICTs redistribute power, income and other assets between different social groups (such as men and women, landed and landless, rich and poor); if so, why and with what effect?;
• do telecoms/ICTs add to the total stock of livelihood assets available within a community or do they merely redistribute these within the community or between neighbouring communities with more or less access to ICTs?; (this addresses one of the fundamental uncertainties affecting ICT and development policy).
3) what distributional impacts these resources appear to be having on
different livelihoods assets (see below); 4) and what policies, deployment strategies or complementary factors
(e.g. education and training) might serve to maximise the positive impact of these resources on livelihoods and minimise any negative impacts (e.g. increased inequality) i.e. policy related conclusions.
While the main focus of impact assessment is on rural telecommunications/ICTs, this research will necessarily cover many other aspects of people’s lives which affect livelihoods, including poverty, education, health, employment, agriculture and other production, and social, economic and political relationships within their communities. It should be remembered throughout that the project makes no prior assumptions about whether telecommunications/ICTs have any positive or negative impact on rural livelihoods or on any of these other aspects of social and economic life. The aim of this research is not to test any prior assumption or hypothesis but to investigate if there are discernable impacts in the researched communities, what and how significant those impacts are, and what implications they have, if any, for policymakers in the research countries and elsewhere. Research should be designed to avoid giving interviewees/respondents an impression that the researchers expect these findings to be positive or negative, which may influence the information they provide. (Similarly, care should be taken to avoid giving

425
interviewees/respondents the impression that answers of a certain kind will lead to future resource allocations they consider in their favour.) Field activities should stress the independence of the research e.g. from government, from operators. More detailed issues concerning questionnaires are addressed in section 6.k below. h. Research methodologies in research locations Livelihoods research uses a number of established methodologies to accumulate quantitative and qualitative information about a population and its livelihood assets and strategies. These include, in particular:
• analysis of secondary data; • key informant interviews; • focus group discussions; • and quantitative surveys.
For this project, it is assumed that locally available secondary data, including national strategies, will be assessed by the national research partner and input into the work through the Phase 2 country meetings and the research design process. This will complement analysis of national and global literature by the research team as a whole, including the research assistant work undertaken by the CTO and Paul Hamilton. The project proposal set out how the research would be undertaken in each research location:
Stage one:
A study of the national policies and strategies for the provision of telecommunication services (e.g. poverty reduction strategies), and the economic assumptions on which these have been based; …. [This] will employ key informant interviews at senior decision making level, and a review of the supporting documentation. The information gathered in this stage will identify target sectors relevant to rural communities, along with indicators that have been used in the justification of telecommunication policy; it will also provide an understanding of the national context of telecommunications access (e.g. key players, history). [This will covered by the research work in Phase 1 and the Phase 2 country meetings.]
Stage two:

426
Involves a qualitative participatory enquiry involving service providers, sector specific representatives (e.g. trade, health and education) and end user groups within a sub sample of rural communities representing different levels of access to telecommunication services. Key informant interviews, focus groups and participatory research methods will be used to gain an overview of the key stakeholder perceptions and to develop a range of impact indicators for Stage 3. [This will covered by the research work in Phase 3a.]
Stage three:
Stage three will involve two quantitative methods of data gathering. The findings from stages one and two will inform the development of these instruments.
1. A structured household (end user) questionnaire aimed at gathering data regarding the identified sector specific economic indicators to be administered to rural households. A randomised stratified cluster sample will be acquired using the rural communities as the clusters and stratified by the level of access to telecommunication services (e.g. that have no access as opposed to those that do). The data will be analysed using statistical software. The approach will be sensitive to gender issues and socio-economic status.
2. A semi-structured questionnaire to be applied to a sample of sector representatives (intermediary actors, e.g. traders) within each of the rural hub towns (trading centres) which fall within the area from which the household survey is drawn. The results will be used to present a series of case studies comparing the impact of telecommunication access at this intermediary level of rural economic activity.
[This will covered by the research work in Phase 3b.]
Stage four:
National stakeholder workshops to verify and refine the research findings. [These form part b of Phase 5.]
Although this methodology is presented in the proposal, it has been based only on previous experience of similar projects, and the team should maintain an open mind to using those research instruments most appropriate for achieving the objectives of the research. However, there must be consistency of methodology across countries and locations in order to maintain the integrity of cross-country comparisons.

427
c. Definition of researched resources (telecoms/ICTs)
ICT and development professionals have different definitions of ICTs. This project needs to have a clear definition which enables them to be sharply distinguished from other resources (for example, other information sources) and which clarifies for researchers and researched communities alike exactly what is being researched. A useful broad definition of ICTs, for general purposes, might be ‘electronic means of capturing, processing, storing and disseminating information’ (Duncombe & Heeks, Manchester University). More specifically, the research needs to focus on the impact of clearly identifiable resources; and three specific resources are suggested: a) basic voice telephony; b) broadcast radio; c) telecentre and/or Internet café services.
These provide different types of information resource that fit within the definition of ICTs in this section and will be clearly understood in researched communities. Implications for selection of research locations are set out in section 6.g. It will also be important to test them against other locally available information resources. d. Research construct
The research aims to investigate how current use of services links to impact on livelihoods. Different social groupings will use services in different ways i.e. they will exhibit different behaviours. The research will look for evidence of links between patterns of use and livelihoods indicators. Examples of possible livelihoods indicators, prepared by Gamos Ltd, are given in Annex 1. Telecommunications are particularly means of communicating information, organising transactions and establishing/maintaining networks. The research construct for the projects assumes that information communicated (and consequent impact) can be categorised according to the sustainable livelihoods model. The research may also be able to identify critical dependencies in the information transmission pathway e.g. availability and use of information. A draft construct, prepared by Gamos Ltd, is illustrated below.

428
Behaviours (patterns of use of telecoms services e.g. intensity of use)
Contexts (descriptors)
Social (e.g. age, gender, education, household size)
Economic (e.g. employment strategy, household expenditure, housing)
Livelihoods Outcomes (Impact)
Vulnerability
Assets
Structures & processes
Behaviours
ICT (e.g. mobile coverage, public access points, when service provided)
Analysis based on this construct will give a static set of linkages between social groupings, patterns of use, and impacts on livelihoods. It would also be valuable to track changes in livelihoods indicators over time, with a view to tracking changes in use of services to changes in livelihoods, though the time and other resources available make this difficult to do within the project itself. Some contributuion to this can be made by asking views on broad perceptions of change e.g. ‘How have employment opportunities changed in the last 5 years?’ It remains to be seen whether this will be practical. The survey should also be conducted in such a way as to provide baseline data for future work by national project partners. k. Local research (including questionnaire) content The content of sample questionnaires will be partly determined by the need for consistency of data collection across the three research countries, but also informed by input from Phase 2 country meetings and from key informant interviews and focus groups preceding data collection. The primary concern of the research is with rural livelihoods, and then specifically with the impact which telecoms may be having on livelihoods, vulnerability and livelihood strategies. It will be particularly important to disentangle any possible impacts from telecoms from other livelihood-impacting factors. In the light of this, each questionnaire will need to include questions designed to secure information about:
a) Social Descriptors - individual and household characteristics (gender, age, occupations etc.);

429
b) Livelihoods descriptors - individual and household livelihoods characteristics (income, expenditure, social networks etc.);
c) Behaviour - individual and household use of telecoms in general (quantitative);
d) Beliefs and opinions on the value of telecoms and other comparable inputs available for the household and community (qualitative);
DFID’s Sustainable Livelihoods Guidance Notes caution against the tendency to accumulate more data than is necessary to answer the questions asked by the research as a whole. Questionnaires and interviews should be substantial but not overwhelming: the suggestion in DFID’s Guidance Notes is it should take a maximum of around 45 minutes to administer. d. Country selection and cross-country comparisons The three countries selected for research have been chosen in order to give a reasonable spread of communities within low-income societies. A key component of the research is cross-country comparison. It is essential therefore that the core of the research in each national context should be suitable for both aggregation across countries and cross-country comparative analysis. This means that the issues addressed, the methodology used and the questions asked of interviewees during field research should be closely consistent across the three research countries. There will, however, be significant contextual differences between countries and (probably) between research locations within countries which need to be taken into account in the design of research at a local level. The same issues may need to be addressed, in other words, in different ways. It should be possible to acknowledge and accommodate these different requirements during Phase 3 research design. It may also be valuable – either for this project or for other research purposes relevant to national research partners - to add additional questions or issues for investigation in individual countries. Again, it should be possible to accommodate this, provided that a) the subject matter is reasonably close to that of the main enquiry; and b) its inclusion is unlikely to affect responses to the main enquiry. e. Locations for research : number of locations per country The need for comparability also means that overall sample and sub-sample sizes need to be broadly comparable between the three countries (for

430
example, to allow disaggregation by gender, income group, etc.) It does not make it essential that the same number of research locations is used in each country, but this would also be desirable. Discussion with rural livelihoods specialists suggests that the ideal number of research locations per country – balancing the needs of diversity against the significance of sample size – might be six. The funds available, however, are unlikely to be sufficient for this unless research is conducted in pairs of neighbouring localities (which may be an appropriate option). The total number of research locations in all three countries should be agreed before field research begins in any country. Experience in a previous KaR project suggests that three locations (or pairs of locations) per country could be researched effectively in the time and with the resources available. The remainder of this research framework therefore assumes that research will be undertaken in three locations per country. f. Selection criteria for locations – socio-economic criteria The project is concerned with rural livelihoods and the research must therefore be undertaken in communities that are clearly and identifiably ‘rural’. Whatever number of locations is chosen, these need to be selected in accordance with criteria that are consistent across all three countries and which allow statistically viable sample sizes to be developed for a number of different sub-groups within the overall population surveyed. There is quite a wide range of possible options here, including the following:
1. to select locations which have substantial common characteristics within all countries (so focusing the research overall on a particular type of rural community and obtaining results that are more statistically significant for that type of community);
2. to select locations which have substantially different characteristics across the board, i.e. nine significantly different locations in total (maximising the diversity of experience incorporated within the overall sample);
3. to select locations with substantial common characteristics within each individual country, but to select different common characteristics between countries (i.e. three similar locations in India, three locations in Mozambique similar to one another but very different from those in India, etc.);

431
4. to select three types of locations (type A, B and C) according to a predetermined criterion, and to select one of each type of location in each country.
The fourth of these options seems likely to produce the most useful range of results, both within individual countries and for cross-country comparison. There are many possible options for the predetermined criterion that could be used on this basis, including selection according to predominant production or landholding type, extent of economic integration, level of poverty, etc. However, specific socio-economic criteria such as these could exaggerate the impact of non-researched variables in research data. An alternative approach suggested by one DFID livelihoods advisor would be to map the country according to a) income/poverty levels and b) teledensity; and then to selection locations which have A) a relatively high rating for a) and low rating for b); B) a relatively low rating for a) and high rating for b); and C) an average rating for each. This would be a socio-economically neutral criterion but would provide an additional ICT-related parameter for analysis. Whatever criterion is adopted should be consistent in all three research countries and should therefore be decided before the first Phase 2 country meeting in late March. g. Selection criteria for locations – ICT criteria In addition, locations will need to be chosen in such a way as to enable assessment of the range of ICT inputs described in section 6.c above, i.e. telephony, and internet/telecentre services. Within each country, it is therefore suggested that:
• all three locations should have at least public telephony access. However, in view of the fact that time and resources for the project do not allow research to assess trends in any one location over a period of time (i.e. to make repeat research visits), it would be appropriate to choose locations in which access has been available for different periods of time – e.g. available for over three years, available for one year, newly available;
• one location (but probably not two and certainly not all) in each country should have a telecentre or internet café with significant internet capability, available for access by community members.

432
Adoption of these additional criteria should not significantly distort outcomes based on other criteria, including those in section 6.f. h. Sampling Strategy
Sample sizes The suggested sample size for survey in each location is around 300 households. This would provide an aggregate sample in each research country of 900 households, which is large enough to provide statistically useful data within the country itself and for cross-country comparisons, but which will also allow for meaningful disaggregation (see next section). Experience with a previous KaR project suggests that the time and resources available will be sufficient for this level of work. Sample sub-groups (disaggregation) It is important that the sample as a whole should be sufficiently random to give meaningful results for the researched location as a whole. However, it is also important to disaggregate results according to significant social groups. Some such groups (i.e. gender groups, income-level groups, literacy level groups, age bands) will be of equal significance in all three research countries and locations. Other group identifiers may be significant in only one or two countries or some locations – examples might be occupational groups or groupings according to land tenure or religious affiliation. Although the research is poverty focused, it will be important to sample the full range of income level groups in order to assess differential impact between rich and poor. Not all sub-groups can be identified in advance, but the research will rely on the experience of the local research partners to identify relevant descriptors, and also on key informant interviews and focus groups. Consistency in sample selection will be required across countries and locations in the case of sub-groups which are of equal significance (numerically or otherwise) in the three research countries, where cross-country comparisons will be useful, but will not be so important in the case of other sub-groups. It may also be appropriate to ensure that some very specific but small social groups are explicitly included in research in all locations – for example, rural shopkeepers whose business methods are likely to be particularly affected by the availability of telecoms/ICTs, and any providers
433
of specific ICT services (e.g. resellers of phone capacity on privately-owned handsets, telekiosk or telecentre operators). Experience indicates that random sampling should yield adequate sized sub-groups of the principal employment categories (farmer, trader, salaried); the self employed and professionals appear to be groups that may need special attention.
7. The next phases of work
Phase 1: desk research Phase 1 of the project is currently underway. This consists of:
a) desk and literature research on the overall livelihoods and ICT-related themes involved in the project, and on the policies, approaches and local contexts for both livelihoods and ICTs in the three research countries; and
b) the preparation of this draft research framework document, for
discussion amongst research partners. Further desk and literature research is ongoing. This document is being circulated for comment amongst research partners prior to a proposed conference call in early March and fuller discussion during the three country meetings to be held in March to May 2004. Phase 2: country meetings Phase 2 of the project includes three days of meetings in each of the research countries, the aim of which is to explore the livelihoods and ICT policy issues in each country, to consider how the overall research methodology needs to be developed or adapted to meet country-specific requirements and to establish the parameters and programme for national field research. These meetings will be set up by national research partners (i.e. Costech, EMU and IIM(A)) in conjunction with ictDA and Gamos. Although some variation may be appropriate in different contexts – notably in India, because of the different (federal and state) levels of government involved - the suggested programme for these three days of meetings is as follows:
Day 1: Stakeholder forum This will be a forum bringing the research team (national research partner, ictDA and Gamos) together with people with specialist

434
expertise in both rural livelihoods / rural development and the telecoms/ICT sector for a wide-ranging discussion of the issues affecting both rural livelihoods and the ICT sector. The aim of this wide-ranging discussion will be to set the research clearly in a national (or, in India, state and national) context, identify country-specific issues affecting it and clarify any additional areas of investigation that should be incorporated in the field research. Attendance at the forum should be between 20 and 40 people with wide-ranging relevant expertise, including government officials, private sector, academia and civil society. National research partners will need to identify, invite and ensure the attendance of appropriate participants. Day 2: Key informant meetings The second day will be used by members of the research team (national research partner, ictDA and Gamos) to conduct individual meetings with a number of senior people with relevant responsibilities in both livelihoods and ICT areas. This should include senior ministry officials, business people, civil society leaders and other policymakers to whom the findings of the research will be primarily addressed. These may or may not have attended Day 1. The aim of this day is to build on the understanding which the research team has gained from Day 1 and to identify the specific requirements of policymakers which research findings might address. National research partners will need to identify and arrange for interviews with appropriate people. Day 3: Research design The third day will be a private meeting of the research team (national research partner, ictDA and Gamos) to design the overall framework for the national research work in the light of findings from Days 1 and 2. By the end of Day 3, the research team should have a basic plan and programme of work for the national field research which will include any significant variations on the three-country work, criteria (at least) for the identification of research locations, a timetable and plan for field research and division of work between team members. This will provide the basis for the detailed work to be undertaken by the national research partner and visitors from Gamos during the first part of Phase 3.

435
Phase 3: field research The ‘field research’ phase of the project is scheduled in section 5 above to last between five and six months (depending on timing of the country meeting in Phase 2). Phase 3 will be in two parts. During the first part, a researcher from Gamos Ltd will visit each research country for about two weeks to work with the research institution on following up the conclusions of the Phase 2 country meetings, and on exploring issues through key informant interviews and focus groups in order to finalise design of field survey instruments. This period will also enable the national research partner to conclude the most effective way to resource the field research work, including training personnel required. The research itself will then be undertaken by the national research partner during the second part of Phase 3. Data transfer requirements will be agreed between the national research partner and Gamos Ltd, with data to be transferred for analysis not later than the beginning of October 2004.
8. National research teams and research coordination The identification of national research teams should be completed by the end of March, coinciding with the first of the Phase 2 country meetings. A conference call will also be organised around this time, involving all main research partners, to discuss the project as a whole, finalise the broad design of the research programme (including issues raised in this research framework document) and agree future coordination arrangements. National research teams should include expertise in both rural livelihoods / rural development and in ICT sector research, as well as in the methodologies to be used during the research (i.e. in the use of survey questionnaires, focus groups and key informant interviews, though not necessarily in the specific approach to these used for sustainable livelihoods research). In addition to the team leader (who should also act as the point of contact for the other research partners, particularly for the Research Coordinator and for Gamos Ltd), an individual within the national research team should have lead responsibility for coordinating field research and for day-to-day decisions on field research issues. Liaison between national research partners and Gamos Ltd is crucially important throughout the field research phase. All significant information on research

436
progress and decisions concerning research methodology should also be copied to the Research Coordinator. Although the research methodology and approaches needs to be coordinated across the three countries, it would probably be best if national research partners did not exchange information on research outputs or findings until all three have completed data collection. The best way to secure coordination along these lines will be discussed during the conference call at the end of March. 9. Conclusion This document has summarised the proposed research framework for KaR project NUMBER. It is intended as a basis for implementing the research programme set out in the approved project proposal, and for discussion about research design before and during the Phase 2 country meetings and during the first part of the field research phase (Phase 3). Research partners are invited to send comments, contributions and other input to the undersigned and other members of the research team listed in section 3 above. It would be helpful if initial comments were received before 15 March 2004. Professor David Souter [email protected] 2 March 2004
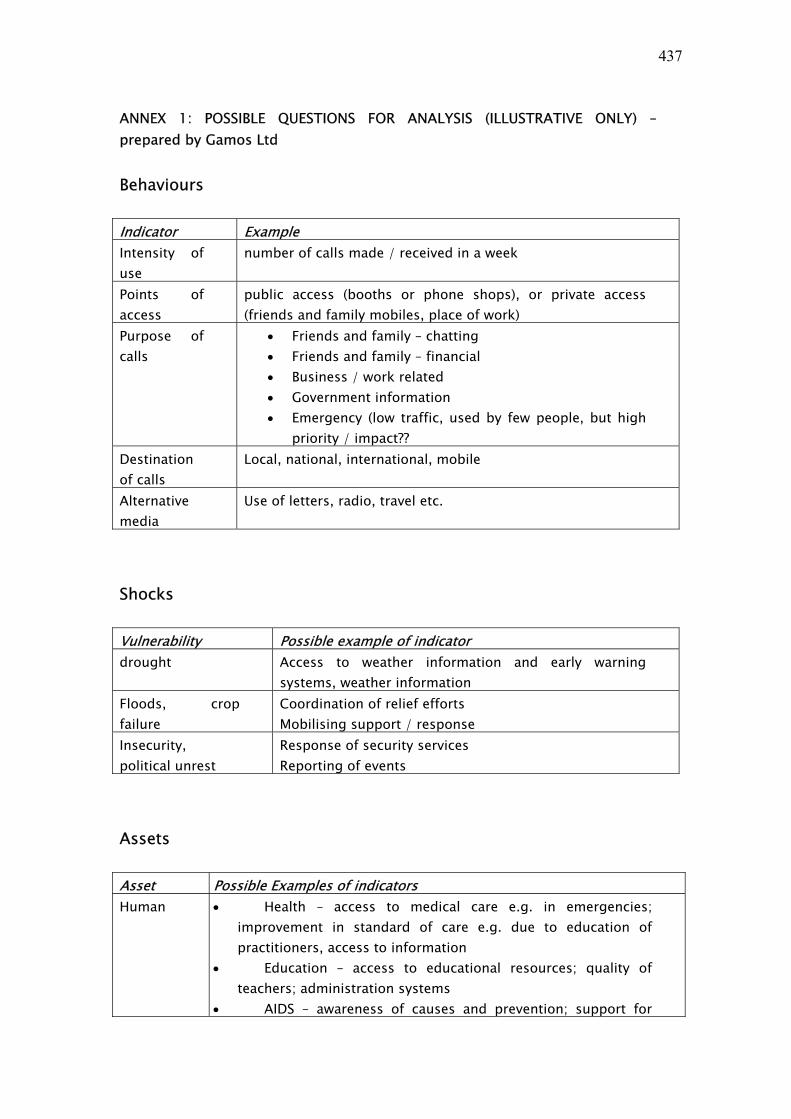
437
ANNEX 1: POSSIBLE QUESTIONS FOR ANALYSIS (ILLUSTRATIVE ONLY) – prepared by Gamos Ltd Behaviours Indicator Example Intensity of use
number of calls made / received in a week
Points of access
public access (booths or phone shops), or private access (friends and family mobiles, place of work)
Purpose of calls
• Friends and family – chatting • Friends and family – financial • Business / work related • Government information • Emergency (low traffic, used by few people, but high
priority / impact?? Destination of calls
Local, national, international, mobile
Alternative media
Use of letters, radio, travel etc.
Shocks Vulnerability Possible example of indicator drought Access to weather information and early warning
systems, weather information Floods, crop failure
Coordination of relief efforts Mobilising support / response
Insecurity, political unrest
Response of security services Reporting of events
Assets Asset Possible Examples of indicators Human • Health – access to medical care e.g. in emergencies;
improvement in standard of care e.g. due to education of practitioners, access to information
• Education – access to educational resources; quality of teachers; administration systems
• AIDS – awareness of causes and prevention; support for

438
carers; social acceptance Physical • Transport – more/less travel (impact on local buses)
• Utilities – fault reporting and maintenance response; billing service
• Extension services – access; quality of information Financial • Jobs – trading efficiency, increased markets; best practice
(e.g. agriculture); better prices & choice of markets; information for service providers (e.g. government workers); unrealistic expectations on service providers e.g. lots of different policies but no cash
• Remittances – from family members • Investment in rural businesses • How much money spent on phone – what is this NOT spent
on? Natural • Land, water courses – environmental information,
campaigns and care. • Natural medicines
Social • Traditional leadership; • family; friends; • religious groups; • NGOs/CBOs; • work related networks e.g. traders (source of credit)
Structures and processes Issue Possible examples of indicators Government services
• (many will relate to assets) • extension services; • education, • health, • utility (where not privatised), • security (police, army), • tax, • registration processs (e.g. vehicle MOT); • participation of people in development planning
Legal • awareness of legal rights e.g. land tenure, access to education, access to health
• enforcement of the law (corruption). • Conflict between traditional and state rule of law?
CSOs • Presence and interventions by NGOs e.g. more NGOs, doing more, doing better?
• trade associations and other CSOs.

439
Financial institutions
Effectiveness of post offices, banks, money transfer offices
Gender contribution toward women’s empowerment Measurement of Livelihood Indicators
Participatory enquiry (Phase 3a) can be used to explore more realistic indicators based on the experience of people themselves. These can then be incorporated into the survey instrument in the form of belief statements e.g. ‘teachers can get hold of mock exam papers through email’; the extent to which people agree / disagree can then give a measure of perceived impact on livelihoods. A complementary approach is to gather secondary data relating to the indicators presented by the participatory enquiry e.g. ask the local education office how many mock papers have been issued to teachers. Whilst this approach is more problematic (e.g. records not kept or lost, people reluctant to hand over information etc.), every effort should be made to gather key data during the Phase 3b interviews.

440
Appendix 5: Participants in stakeholder workshops
India: start of project workshops, March 2004
Research Agenda Workshop in Ahmedabad on 22nd March, 2004
Sr. No.
Name Designation Organization
1 J G Sarvia Director - IT Gujarat Agriculture University, Anand
2 Jagrut Vyas COO - Gujarat Tata Teleservices Limited
3 Kartik Mehta Veterinary Officer Animal Husbandary Department
4 Mona Dave SEWA 5 Mona Kandar District Development
Officer District Development Officer, Bhavnagar
6 Monica Raina SEWA
7 Mukesh Ved Chief Information Officer
Agriculture and Cooperation
8 N. D. Parmar Joint Director Animal Husbandary Department
9 Niraj Singh n-Logue Communications (P) Limited
10 n-Logue Communications (P) L
11 O D Taygi General Manager BSNL, Rural Department
12 Sanjay Joshi Officer of Commissioner
Pancyayats, Rural Housing and Rural Development
13 Subodh Saxena President Reliance Infocomm Limited
14 Tara Sinha SEWA 15 Vajmin Buch Joint Secretary Science and
Technology Department
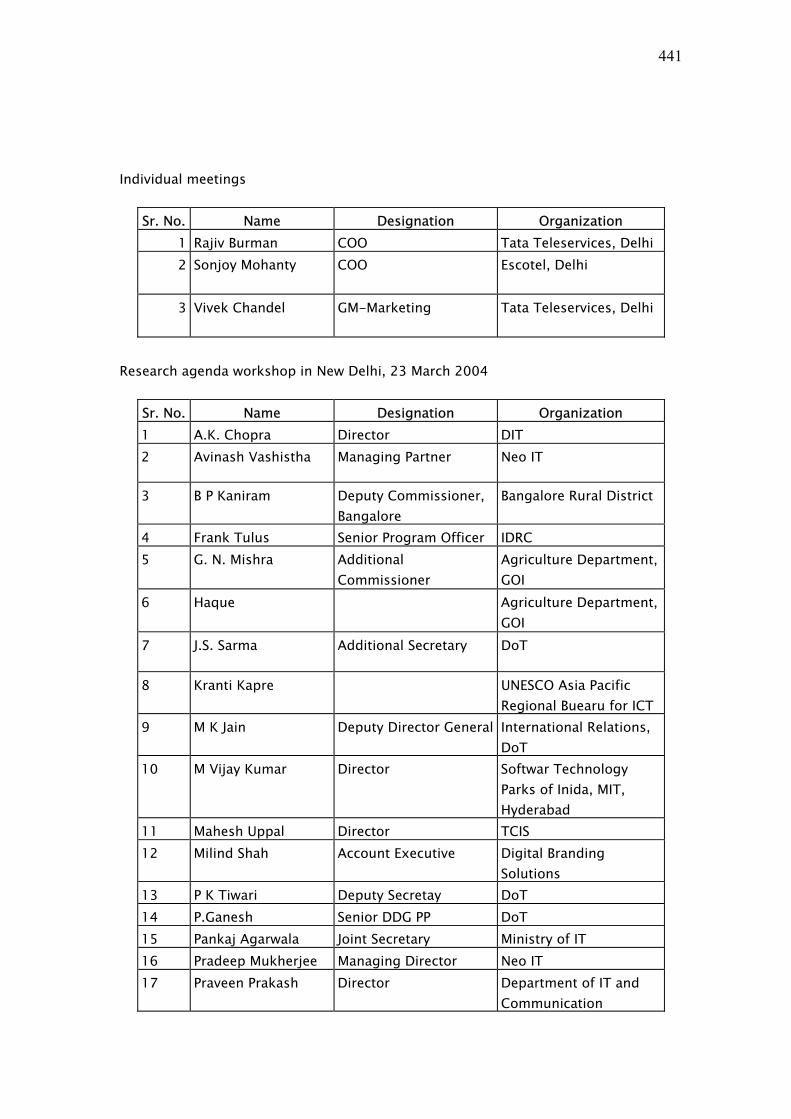
441
Individual meetings
Sr. No. Name Designation Organization 1 Rajiv Burman COO Tata Teleservices, Delhi 2 Sonjoy Mohanty COO Escotel, Delhi
3 Vivek Chandel GM-Marketing Tata Teleservices, Delhi
Research agenda workshop in New Delhi, 23 March 2004
Sr. No. Name Designation Organization 1 A.K. Chopra Director DIT 2 Avinash Vashistha Managing Partner Neo IT
3 B P Kaniram Deputy Commissioner, Bangalore
Bangalore Rural District
4 Frank Tulus Senior Program Officer IDRC 5 G. N. Mishra Additional
Commissioner Agriculture Department, GOI
6 Haque Agriculture Department, GOI
7 J.S. Sarma Additional Secretary DoT
8 Kranti Kapre UNESCO Asia Pacific Regional Buearu for ICT
9 M K Jain Deputy Director General International Relations, DoT
10 M Vijay Kumar Director Softwar Technology Parks of Inida, MIT, Hyderabad
11 Mahesh Uppal Director TCIS 12 Milind Shah Account Executive Digital Branding
Solutions 13 P K Tiwari Deputy Secretay DoT 14 P.Ganesh Senior DDG PP DoT 15 Pankaj Agarwala Joint Secretary Ministry of IT 16 Pradeep Mukherjee Managing Director Neo IT 17 Praveen Prakash Director Department of IT and
Communication

442
Sr. No. Name Designation Organization 18 R K Arora Group Coordinator Department of IT 19 Rajiv Mehta Agriculture Department,
GOI 20 Ranjan Dwivedi National Professional
Officer, E-health World Health Organisation
21 Ravi Gupta Senior Research Associate
i4d
22 Sadhana Dixit Joint Administrator - Finance
USO Fund
23 Satyan Mishra CEO, drishtee.com Drishtee 24 Shalini Kala ENRAP Project
Coordinator IDRC
25 Vinay Dharmadhikari Scientist Deptarment of IT
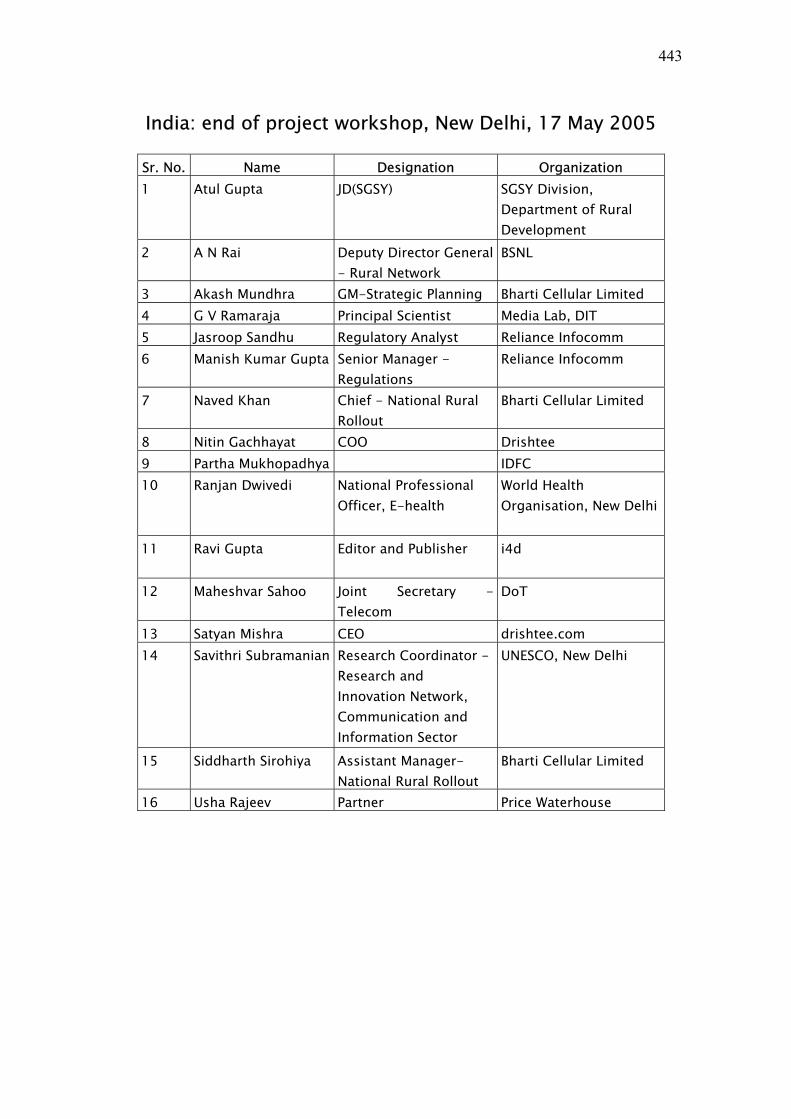
443
India: end of project workshop, New Delhi, 17 May 2005
Sr. No. Name Designation Organization 1 Atul Gupta JD(SGSY) SGSY Division,
Department of Rural Development
2 A N Rai Deputy Director General - Rural Network
BSNL
3 Akash Mundhra GM-Strategic Planning Bharti Cellular Limited 4 G V Ramaraja Principal Scientist Media Lab, DIT 5 Jasroop Sandhu Regulatory Analyst Reliance Infocomm 6 Manish Kumar Gupta Senior Manager -
Regulations Reliance Infocomm
7 Naved Khan Chief - National Rural Rollout
Bharti Cellular Limited
8 Nitin Gachhayat COO Drishtee 9 Partha Mukhopadhya IDFC 10 Ranjan Dwivedi National Professional
Officer, E-health World Health Organisation, New Delhi
11 Ravi Gupta Editor and Publisher i4d
12 Maheshvar Sahoo Joint Secretary -Telecom
DoT
13 Satyan Mishra CEO drishtee.com 14 Savithri Subramanian Research Coordinator -
Research and Innovation Network, Communication and Information Sector
UNESCO, New Delhi
15 Siddharth Sirohiya Assistant Manager- National Rural Rollout
Bharti Cellular Limited
16 Usha Rajeev Partner Price Waterhouse

444
Mozambique: end of project workshop Maputo, 6 June 2005-06-15
Name Institution Bernardo João António Mocuba Administration Elvira António Timba Ministry for Agriculture and Rural Development Lourino Alberto Chemane
UTICT/Comissão para Política de Informática
Nataniel Tembe Chibuto Administration Frederico Tembe Christian Council (CCM) Fransisco Chate Mozambique National Institute for Communication
(INCM) Mário Inácio de Figueiredo
Institute for Social Communication (ICS)
Momade Zainadin Community Development Foundation (FDC) Stélios Papadakis Ministry of Transport and Communication Soraya Omar Ibraimo ORAM /CMC– Associação Rural da Ajuda Mútua Isaías Farranguane ORAM /CMC– Associação Rural da Ajuda Mútua Polly Gaster CIUEM/UNESCO Team members Venâncio Massingue Ministry of Science and Technology (MCT) Américo Muchanga CIUEM Constantino Sotomane MICT Jamo Macanze MICTI Arão Mbalate National Institute for Statistics Deolinda Salomão MICTI David Souter Ict Development Associates ltd Nigel Scott Gamos ltd

445
Tanzania: start of project workshop Dar es Salaam, 27 April 2004
Name Institution Position Ms. Mercy J. Mandawa Ministry of Community Senior Community
Development- Gender and Development Officer Children
Mr. Justus V. Nsenga Sokoine University of Assistant Research Fellow Agriculture, Centre for Sustainable Rural Development
Mr. Paul A.M. Chirika Morogoro Region Regional Administrative Secretary
Mr. Christian Byamungu FAIDERS Mr. Ali A. Kalufya COSTECH Principal Scientific Officer Mr. Vincent Leyaro Prime Minister’s Office Dr. Odass Bilame REPOA Senior Research Fellow Mrs. Theofrida A. Kapinga Tanzania Council for Social
Development (TACOSODE) Mr. Ahmed R. Tarimo Prime Minister’s Office Dr. Godfrey Mandari Ministry of Community Executive Director Development, Gender and Children Mr. Victor Nkya TCRA Senior Financial Analyst Ms. Christine Mwase Private sector Researcher Mr. Theophilus E. Mlaki COSTECH Director of Information &
Documentation Eng. Philemon Kilassa COSTECH Principal Scientific Officer
Face-face interviews Dr. Oswald Mashindano Acting Director, Economic and Social Research Foundation
(ESRF) Eng. Augustus Kowero Assistant to Permanent Secretary, Ministry of
Communications and Transport Prof. Joseph Semboja Director, REPOA Dr. Servacius B. Likwehile Director, Vice President’s Office Mr. George Mbowe Executive Director, Tanzania Telecommunication Company
Ltd (TTCL) Col. A. N. Nalingigwa Acting Director General, TCRA

446
Tanzania: end of project workshop Dar es Salaam, 8 June 2005
Name Institution Stakeholders Ms. Margareth Simba Alasiri Mr. Wambura Semberya Business Times Prof. Matern Victor College of Engineering, University of Dar es
Salaam Eng. P. Kilassa Commission of Science and Technology Mr. Ali Kalufya Commission of Science and Technology Mr. Frank Makalla Commission of Science and Technology Mr. Jonas Kamaleki Commission of Science and Technology Mr. Mathew Elikira Commission of Science and Technology Ms. Esther Rugakingira Commission of Science and Technology Ms. Monica Nyamsisa Commission of Science and Technology Prof. Brig. Gen Y. M. Kohi Commission of Science and Technology Mr. Godfrey C. Mandari Crew Tanzania Dr. Richard Masika Dar es Salaam Institute of Technology Mr. Nils Jensen Embassy of Sweden / Swedish International
Development Cooperation Agency Mr. Obeid Mwangasa Independent Television Mr. Stephen Chuwa Independent Television Mr. Jonathan Cook International Fund for Agricultural Development Mr. Robi Machaba Jua Ltd Mr. Mark Farahani Kilosa District Council Ms. Mercy J. Mandawa Ministry of Community Development, Gender &
Children Mr. Francis W. Tabaro Mobitel Ltd Mr. Daud S. Mfwangavo Morogoro Region Dr. Paula Uimonen Net4Dev & Stockholm University Mr. Ally A. Seleman Ngara Telecentre Mr. Mwajabu M. Mleche Nipashe Mr. Richard Makure Nipashe Mr. David Sawe President’s Office, Public Service Management Ms. Esther Sangan Radio One Miss Mariam Mndeme Radio Tanzania Dar es Salaam Mr. Donald Mmari Research on Poverty Alleviation Mr. Habby Bugalama Sengerema Telecentre Mr. Sanctus Mtsimbe SimbaNet (Tanzania) Ltd Mr. Justus V. Msenga Sokoine University of Agriculture – Centre for

447
Name Institution Sustainable Development
Ms. Yasmine Protace Sunday Observer Dr. Eng. Zaipuna Yonah Tanzania Telecommunications Company Ltd Mr. George Mbowe Tanzania Telecommunications Company Ltd Mr. Jaffar Haniu Television Tanzania Mr. Victor Gunze Television Tanzania Ms. Levina Kateule Television Tanzania Mr. Daniel Mkate The Guardian Mr. Ilivin M. Mgeta The Guardian Mr. Khalfan Said The Guardian Mr. George Mulamula World Intellectual Property Organisation Dr. Edephonce Nfuka University Computing Centre Ltd Prof. Sam Maghimbi University of Dar es Salaam Prof. Hasa Mfaume Mlawa University of Dar es Salaam – Institute of
Development Studies Mr. Maulid Madeni University of Dar es Salaam – Institute of
Journalism and Mass Communication Workshop facilitators Ms. Christine Mwase College of Engineering, University of Dar es
Salaam Mr. Theophilus Mlaki Commission of Science and Technology Mr. Simbo Ntiro eThink Tank Tanzania Dr. Nigel Scott Gamos Ltd Prof. David Souter ictDA / University of Strathclyde Prof. Ntengua Mdoe Sokoine University of Agriculture Mr. Peter Ulanga Tanzania Communications Regulatory Authority