the economic impact of ict - ictliteracy.info economic impact of ict.pdf · the available measures...
TRANSCRIPT

Th
e E
co
no
mic
Imp
ac
t of IC
TM
EA
SU
RE
ME
NT, E
VID
EN
CE
AN
D IM
PL
ICA
TIO
NS
OECD's books, periodicals and statistical databases are now available via www.SourceOECD.org, our online library.
This book is available to subscribers to the following SourceOECD themes:
General Economics and Future StudiesScience and Information Technology
Ask your librarian for more details of how to access OECD books on line, or write to us at
Information and communications technology (ICT) has become a key driver of economic growth over thepast decade. The rapid diffusion of the Internet, of mobile telephony and of broadband networks alldemonstrate how pervasive this technology has become. But how precisely does ICT affect economicgrowth and the efficiency of firms? And how well can these effects be measured?
This report provides an overview of the economic impact of ICT on economic performance, and theways through which it can be measured. Using available OECD data, the first part of the book examinesthe available measures of ICT diffusion, the role and impact of ICT investment and the role of ICT-usingand ICT-producing sectors in overall economic performance. The second part of the book offers ninestudies for OECD countries, based on detailed firm-level data and prepared by researchers andstatisticians from a wide range of OECD countries. These studies use a variety of methods and providedetailed insights on the effects of ICT in individual countries.
The report shows that ICT is indeed having a far-reaching impact on economic performance and on thesuccess of individual firms, in particular when it is combined with investment in skills, organisationalchange and innovation. This impact can be observed in firm-level studies for all OECD countries, buthas not yet translated into better economic performance at the sectoral or economy-wide level in manyof these countries. The report also points to factors that may explain the gap between the impactsof ICT at the firm level and on aggregate performance, such as time lags, difficulties in measuringproductivity at the aggregate level, and the large diversity in the performance of individual firms.
The Economic Impact of ICTMEASUREMENT, EVIDENCE AND IMPLICATIONS
ISBN 92-64-02103-592 2004 05 1 P
-:HSTCQE=UWVUX\:www.oecd.org
The Economic Impactof ICT
MEASUREMENT, EVIDENCE AND IMPLICATIONS
«

© OECD, 2004.
© Software: 1987-1996, Acrobat is a trademark of ADOBE.
All rights reserved. OECD grants you the right to use one copy of this Program for your personal use only. Unauthorised reproduction,lending, hiring, transmission or distribution of any data or software is prohibited. You must treat the Program and associated materialsand any elements thereof like any other copyrighted material.
All requests should be made to:
Head of Publications Service,OECD Publications Service,2, rue André-Pascal, 75775 Paris Cedex 16, France.

ORGANISATION FOR ECONOMIC CO-OPERATION AND DEVELOPMENT
The Economic Impact of ICT
Measurement, Evidence and Implications
Cover_a.fm Page 1 Friday, February 20, 2004 3:30 PM

ORGANISATION FOR ECONOMIC CO-OPERATION AND DEVELOPMENT
Pursuant to Article 1 of the Convention signed in Paris on 14th December 1960, and which came
into force on 30th September 1961, the Organisation for Economic Co-operation and Development (OECD)
shall promote policies designed:
– to achieve the highest sustainable economic growth and employment and a rising standard of
living in member countries, while maintaining financial stability, and thus to contribute to the
development of the world economy;
– to contribute to sound economic expansion in member as well as non-member countries in the
process of economic development; and
– to contribute to the expansion of world trade on a multilateral, non-discriminatory basis in
accordance with international obligations.
The original member countries of the OECD are Austria, Belgium, Canada, Denmark, France,
Germany, Greece, Iceland, Ireland, Italy, Luxembourg, the Netherlands, Norway, Portugal, Spain,
Sweden, Switzerland, Turkey, the United Kingdom and the United States. The following countries
became members subsequently through accession at the dates indicated hereafter: Japan
(28th April 1964), Finland (28th January 1969), Australia (7th June 1971), New Zealand (29th May 1973),
Mexico (18th May 1994), the Czech Republic (21st December 1995), Hungary (7th May 1996), Poland
(22nd November 1996), Korea (12th December 1996) and the Slovak Republic (14th December 2000). The
Commission of the European Communities takes part in the work of the OECD (Article 13 of the
OECD Convention).
© OECD 2004
Permission to reproduce a portion of this work for non-commercial purposes or classroom use should be obtained through the Centre français
d’exploitation du droit de copie (CFC), 20, rue des Grands-Augustins, 75006 Paris, France, tel. (33-1) 44 07 47 70, fax (33-1) 46 34 67 19, for every country except
the United States. In the United States permission should be obtained through the Copyright Clearance Center, Customer Service, (508)750-8400,
222 Rosewood Drive, Danvers, MA 01923 USA, or CCC Online: www.copyright.com. All other applications for permission to reproduce or translate all or part
of this book should be made to OECD Publications, 2, rue André-Pascal, 75775 Paris Cedex 16, France.
Cover_a.fm Page 2 Friday, February 20, 2004 3:32 PM
3
FOREWORD
The OECD brings together 30 member countries and helps governments meet the challenges of a globalised economy. One of the challenges that has gained a substantial amount of attention over the past few years is how to seize the benefits of information and communications technology (ICT) for economic growth and development. The rapid diffusion of the Internet, of mobile telephony and of broadband networks all demonstrate how pervasive this technology has become. But how precisely does ICT affect economic growth and the efficiency of firms? How well can these impacts be measured? And under which conditions do the impacts of ICT emerge?
This report addresses these questions and provides an overview of the impacts of ICT on economic performance, and the ways through which these impacts can be measured. The material contained in the book elaborates on that included in two OECD studies published in 2003, namely Seizing the Benefits of ICT in a Digital Economy and ICT and Economic Growth – Evidence from OECD Countries, Industries and Firms. The book is therefore primarily aimed at analysts, statisticians and researchers working on ICT, productivity and economic growth.
The bulk of the book is devoted to nine studies of OECD countries that were presented at an OECD workshop on ICT and Business Performance in December 2002. These studies are all based on detailed firm-level data and were prepared by researchers and statisticians across OECD countries. They use a broad range of approaches and all provide new insights in the impacts of ICT and the conditions under which ICT can improve performance. The three other main chapters of the book are based on available OECD data. They examine differences in ICT diffusion across OECD countries, the impacts of ICT investment, and the contribution of ICT-using and ICT-producing sectors to overall economic performance.
The report shows that ICT is having substantial impacts on economic performance and the success of individual firms, in particular when it is combined with investment in skills, organisational change and innovation. These impacts can be observed in firm-level studies for all OECD countries, but have not yet translated in better economic performance at the industry or economy-wide level in many OECD countries. The report points to some factors that may explain this gap between firm-level and aggregate performance, such as aggregation effects, time lags and measurement.
The report draws on the work of several OECD staff members, notably in the Directorate for Science, Technology and Industry and the Statistics Directorate. Even more, it reflects the work of statisticians and researchers in many OECD member countries to enhance the understanding of ICT, productivity and economic growth.
The report is published on the responsibility of the Secretary-General of the OECD.

5
TABLE OF CONTENTS
Chapter 1. Introduction and Summary 7
Chapter 2. The Diffusion of ICT in OECD Economies 19
Chapter 3. The Decision to Adopt Information and Communication Technologies: Firm-level Evidence for Switzerland
37
Chapter 4. ICT Investment in OECD Countries and Its Economic Impacts 61
Chapter 5. ICT Production and ICT Use: What Role in Aggregate Productivity Growth?
85
Chapter 6. The Effects of ICTs and Complementary Innovations on Australian Productivity Growth
105
Chapter 7. ICT, Innovation and Business Performance in Services: Evidence for Germany and the Netherlands
131
Chapter 8. Firm Performance in the Canadian Food Processing Sector: The Interaction between ICT, Advanced Technology Use and Human Resource Competencies
153
Chapter 9. Information Technology, Workplace Organisation, Human Capital and Firm Productivity: Evidence for the Swiss Economy
183
Chapter 10. ICT and Business Productivity: Finnish Micro-Level Evidence 213
Chapter 11. Enterprise E-commerce: Measurement and Impact 241
Chapter 12. Productivity Slowdown and the Role of ICT in Italy: A Firm-Level Analysis
261
Chapter 13. IT, Productivity and Growth in Enterprises: New Results from International Micro Data
279
List of Contributors 301

7
CHAPTER 1
INTRODUCTION AND SUMMARY
Dirk Pilat1 Organisation for Economic Co-operation and Development
Abstract
This chapter summarises the main findings of this report. It shows that ICT is having far-reaching impacts on economic performance and the success of individual firms, in particular when it is combined with investment in skills, organisational change, innovation and new firm creation. These impacts can be observed in firm-level studies for many OECD countries, but have only translated into stronger economic performance at the economy-wide or industry level in a few OECD countries. The limited impact of ICT at the aggregate level in many OECD countries is not necessarily due to lack of investment in ICT, but more to lack of complementary changes and investment that enable the full exploitation of ICT. The chapter also identifies some issues that will require further work, in developing better methods and data, and in further empirical analysis.
1. Senior Economist, Economic Analysis and Statistics Division, Directorate for Science, Technology and
Industry. This paper reflects the views of the author and not necessarily those of the organisation or its member countries.

8
1.1. Introduction
Information and communications technology (ICT) has proven to be the key technology of the past decade. The widespread diffusion of the Internet, of mobile telephony and of broadband networks all demonstrate how pervasive this technology has become. But how precisely does ICT affect economic growth and the efficiency of firms? And what are the conditions under which ICT can become a technology that is effective in enhancing economic performance?
Despite the downturn of the economy over the past few years and the passing of the Internet bubble, these questions remain important to policy makers. This is because ICT has become a fact of economic life in all OECD economies. Almost all firms now use computers and most of them have an Internet connection. Moreover, a large share of these firms use computer networks for economic purposes, such as the buying, selling and outsourcing of goods and services. But despite the widespread diffusion of ICT in OECD economies, questions remain about the impact of the technology on economic performance. Thus far, only few OECD countries have clearly seen an upsurge in productivity growth in those sectors of the economy that have invested most in the technology, notably services sectors such as wholesale trade, financial services and business services. In many OECD countries, these impacts have yet to materialise. Improving the understanding of the ways in which ICT affects economic performance and the factors that influence the potential impacts of ICT thus remains important.
This study aims to contribute to a better understanding of these issues. It brings together 12 studies that all provide a different perspective on the impacts of ICT on economic growth. Nine of these studies (Chapter 3 and Chapters 6 to 13) are based on firm-level data and were carried out by researchers in individual OECD countries. Most of these focus on a single OECD country, but some also include a comparative perspective. These firm-level studies provide a wealth of detail and precision about the impacts of ICT. Three other chapters (Chapters 2, 4 and 5) provide a cross-country perspective for all OECD countries and are based on work carried out by OECD staff, using available OECD data. The variety of approaches that is used in the book is important as each perspective – be it from a specific country or using a specific method – adds new evidence to our overall understanding of ICT. This introductory chapter provides a brief summary of the 12 chapters included in this book. It also highlights some of the remaining questions that could be the subject of further empirical analysis.
1.2. The diffusion of ICT – why does it differ across firms and OECD countries?
The first issue addressed in the book, notably in Chapters 2 and 3, concerns the diffusion of ICT across OECD countries. The economic impact of ICT is closely linked to the extent to which different ICT technologies have diffused across OECD economies. This is partly because ICT is a network technology; the more people and firms that use the network, the more benefits it generates. Chapter 2 uses a range of official statistics to show that the diffusion of ICT currently differs considerably between OECD countries. In practice, different indicators of ICT diffusion all tend to point to the same countries as having the highest rate of uptake of ICT. These include the United States, Canada, New Zealand, Australia, the Nordic countries and the Netherlands. From this perspective, it is likely that the largest economic impacts of ICT should also be found in these countries.
The question that follows is why the diffusion of ICT differs so much across countries? All OECD countries have been faced with a rapid decline in ICT prices and with growing opportunities for efficiency-enhancing investment in ICT. A number of reasons can be noted. Chapter 2, by Dirk Pilat and Andrew Devlin, provides a cross-country analysis of diffusion patterns. The empirical evidence presented in this chapter points to several factors affecting the diffusion of ICT. The first of these concerns the direct costs of ICT, e.g. the costs of ICT equipment, telecommunications or the

9
installation of an e-commerce system. The available data point to persistent differences in the costs of ICT across OECD countries, despite heavy international trade in ICT and the liberalisation of the telecommunications industry. A second important factor affecting diffusion patterns is the ability of a firm to absorb new technology, such as ICT. This includes the availability of know-how and qualified personnel, the scope for organisational change and the capability of a firm to innovate. Factors related to competition and the regulatory environment also play an important role, since excessive regulation may make it difficult for firms to seize the opportunities offered by ICT.
Chapter 3, by Heinz Hollenstein, examines the question of ICT diffusion with firm-level evidence for Switzerland. He shows that the decision of a firm to adopt ICT depends on the balance of costs (in the broadest possible sense) and benefits that may be associated with the technology. His analysis primarily seeks to explain inter-firm differences of adoption, emphasising the heterogeneity among firms with respect to the potential profitability of technology adoption. But he also takes account of spill-over effects; the more firms that already use a technology, the more sensible adoption becomes.
The chapter points to a range of important determinants of ICT adoption. These include the anticipated benefits of adoption, notably improved customer-orientation and advantages related to costs. The costs of adoption are important too, notably the direct costs of investment, but also the restrictions posed by finance and deficiencies in knowledge. A third range of factors have to do with the absorptive capacity of a firm and include its human capital base and innovative activity. Other factors influencing adoption are information spill-overs and learning effects, competition and, finally, the size of a firm. A more extended version of the analysis shows that the introduction of new workplace organisation (in particular, team-working, decentralised decision-making and flattening hierarchies of a firm) is also an important factor facilitating ICT adoption. The empirical analysis also shows that the adoption of ICT and that of new workplace organisation are interrelated.
1.3. The economic impacts of ICT – an aggregate perspective
Chapters 4 and 5 of the book move on to the second key question concerning ICT, namely its economic impact. In most analysis of economic growth, three effects of ICT on productivity and growth are distinguished. First, as a capital good, investment in ICT contributes to overall capital deepening and therefore helps raise labour productivity. Second, rapid technological progress in the production of ICT goods and services may contribute to more rapid multifactor productivity (MFP) growth in the ICT-producing sector. And third, greater use of ICT may help firms increase their overall efficiency, and thus raise MFP. Greater use of ICT may also contribute to network effects, such as lower transaction costs and more rapid innovation, which will improve the overall efficiency of the economy, i.e. MFP. These effects can be measured and examined at different levels of aggregation, i.e. at the macro-economic level, the sectoral or industry level, and the firm level.
The role of ICT capital
The first measure of ICT impacts highlighted above considers ICT investment. Chapter 4, by Nadim Ahmad, Paul Schreyer and Anita Wölfl, shows that capital deepening through investment in ICT establishes the infrastructure for the use of ICT (the ICT networks) and provides productive equipment and software to businesses. ICT investment in OECD countries rose from less than 15% of total non-residential investment in the early 1980s, to between 15% and 30% in 2001. Since investment mechanically adds to the capital available to workers it contributes to labour productivity growth. Estimates show that it typically accounted for between 0.3 and 0.8 percentage points of growth in GDP and labour productivity over the 1995-2001 period. The United States, Australia, the Netherlands and Canada received the largest boost; Japan and United Kingdom a more modest one,

10
and Germany, France and Italy a much smaller one. Investment in software accounted for up to a third of the overall contribution of ICT investment.
Chapter 4 also highlights that measuring the impacts of ICT investment is not yet straightforward. This is partly because measures of ICT investment are not always available and when they are, they are not necessarily comparable across countries. Data on software investment are particularly problematic and have been the subject of an OECD/Eurostat Taskforce that has produced a range of recommendations to improve measurement. A second important issue concerns the adjustment of volume measures of ICT investment for rapid quality change. So-called hedonic deflators may help to deal with this issue, but these have only been developed in some countries and for some key product categories. To address problems of international comparability, empirical studies often use US hedonic deflators to represent price changes in other countries. This is only a second-best solution as countries should ideally develop deflators that properly account for quality change of ICT products in their own national context. An OECD Handbook on Quality Adjustment of Price Indexes for ICT Products is due for publication in 2004, and may be followed by further steps to implement its findings in national statistical practices.
The role of the ICT-producing sector
Chapter 5, by Dirk Pilat and Anita Wölfl, moves on to the sectoral impacts of ICT. This is because the second possible economic impact of ICT is linked to having a sector producing ICT goods and services. Having such a sector can be important for growth, since ICT-production has been characterised by rapid technological progress and very strong demand. Chapter 5 shows that in Finland, Ireland and Korea, close to 1 percentage point of aggregate labour productivity growth over the 1995-2001 period was due to the strong productivity performance of the ICT manufacturing sector. In the United States, Japan and Sweden, the ICT-producing sector also contributed significantly to productivity growth. ICT-producing services sector (telecommunications and computer services) typically play a smaller role in aggregate productivity growth, although it has also been characterised by rapid progress. Partly, this is linked to the liberalisation of telecommunications markets and the high speed of technological change in this market. The contribution of this sector to overall productivity growth therefore increased in several countries over the 1990s. Some of the growth in ICT-producing services is also linked to the emergence of the computer services industry, which has been a key factor in the diffusion of ICT networks in OECD countries.
The role of ICT use
A third way of examining the impacts of ICT use is to analyse the performance of those sectors of the economy that are intensive users of ICT. This is the focus of Chapter 5. Most of these sectors are located in the services sector, e.g. industries such as finance, business services and distribution. Chapter 5 finds that the contribution of ICT-using services to aggregate productivity growth rose slightly over the 1990s in Finland, the Netherlands, Norway and Sweden, and more substantially in Australia, Canada, Ireland, Mexico, the United Kingdom and United States. The strong increase in the United States is primarily due to more rapid productivity growth in wholesale and retail trade, and in financial services (securities). The strong increase in productivity growth in Australia, and the contribution made by ICT, is confirmed by Chapter 6, by Paul Gretton, Jyothi Gali and Dean Parham.
In some countries, notably the United States and Australia, there is also evidence that sectors that have invested most in ICT, such as wholesale and retail trade, have experienced an increase in the overall efficiency of using labour and capital, or multi-factor productivity (MFP) growth. This could be because these sectors have received productivity gains from ICT use over and above the labour productivity gains they received from investment in ICT, for instance because of network effects.

11
Chapter 5 also suggests that some of the impacts of ICT might simply not be picked up in official statistics, since measures of output in the services sector are quite weak. OECD is currently working with statistical offices to develop better output measures for certain services sectors, notably finance and insurance. However, more attention will also be required for other services, notably non-market services such as education and health.
1.4 Impacts of ICT at the firm level
Chapters 6 to 13 go beyond industry aggregates and focus on the firm-level impacts of ICT. Studies with firm-level data often find the strongest evidence for economic impacts of ICT. Firm-level data also point to factors influencing the impacts of ICT that can not be observed at the aggregate level. For example, the role of ICT in helping firms gain market share can only be examined with firm-level data, as can the role of organisational change. Moreover, firm-level analysis may help in distinguishing the impact of ICT from that of other, often firm-specific, sources of growth.
Over the past years, much progress has been made in developing statistics on the use of various ICT technologies in the economy (see Chapter 2). In addition, many countries have developed databases that provide detailed and comprehensive data on the performance of individual firms. Combining these two sources of information helps establish a link between firm performance and their use of ICT. Moreover, providing that these databases cover a large proportion of the economy, they can also link the performance of individual firms to that of the economy as a whole.
Chapter 6, by Paul Gretton, Jyothi Gali and Dean Parham, carries out an analysis of firm-level data for Australia. Australia was already highlighted above as one OECD country where ICT already appears to have had considerable impacts. The chapter finds through aggregate growth accounting and the aggregation of firm-level results that ICTs and related effects raised Australia’s annual MFP growth by around two-tenths of a percentage point. This contribution is significant, although it is a relatively small part of Australia’s 1990s rate of MFP growth of 1.8% a year. The association between ICT use and productivity growth at the industry level was clearest in finance & insurance. Importantly, however, the firm-level econometric analysis, which controls for other influences, found positive links between ICT use and productivity growth in all industry sectors that were examined. The analysis for Australia also found that the productivity effects of ICT taper off over time; the ultimate productivity effect from adoption of (a type of) ICT is thus a step up in levels, rather than a permanent increase in the rate of growth.
Chapters 7 to 9 also find clear impacts of ICT on economic performance. Chapter 7, by Thomas Hempell, George van Leeuwen and Henry van der Wiel finds that ICT capital deepening raised labour productivity in services firms in both Germany and the Netherlands. Chapter 8, by John Baldwin, David Sabourin and David Smith finds strong evidence for Canada that the use of ICTs is associated with superior performance. In particular, greater use of advanced information and communication technologies is associated with higher labour productivity growth during the nineties. Chapter 9, by Spyros Arvanitis, finds that labour productivity in Swiss firms is closely correlated with ICT use. Moreover, the use of Internet was found to be less important for firm performance in the manufacturing than in the service sector, presumably because many manufacturing workers do not perform a desk job and are not equipped with a PC and an Internet connection.
Chapter 10, by Mika Maliranta and Petri Rouvinen, finds strong evidence for productivity-enhancing impacts of ICT in Finland. It finds that after controlling for industry and time effects as well as specific characteristics of the firm and workers using ICT, the additional productivity of ICT-equipped labour ranges from 8% to 18%, which corresponds to a 5 to 6 % elasticity of ICT capital. This effect is much higher in younger firms and in the ICT-producing sector, notably ICT-producing

12
services. Overall, the higher productivity induced by ICT seems to be somewhat greater in services than in manufacturing. Manufacturing firms benefit in particular from ICT-induced efficiency in internal communication, which is typically linked to the use of local area networks (LANs), whereas service firms benefit from efficiency gains in external (Internet) communication.
Chapter 11, by Tony Clayton, Chiara Criscuolo, Peter Goodridge and Kathryn Waldron, examines the economic impacts in the United Kingdom of on specific application of ICT, namely electronic commerce. They find a positive effect on firm productivity associated with use of computer networks for trading. However, there is an important difference between e-buying and e-selling, with e-buying having positive impacts on output growth and e-selling typically having negative impacts. This is likely due to pricing effects, since at least part of the gain from investment in electronic procurement by firms comes from the ability to use the price transparency offered by e-procurement to secure more competitive deals. Part of this comes from efficiency gains, but part is likely to be at the expense of suppliers. The study for the UK also presents some evidence on pricing effects. Overall, it seems that the effects of reduced search costs, price transparency and rapid supplier reaction associated with electronic marketing and sale of goods are likely to have a negative impact on prices. However, there is a great deal of variation across industries depending on market conditions.
Chapter 12, by Carlo Milana and Alessandro Zeli, examines the impact of ICT on MFP growth in Italy from 1996 to 1999. The study breaks MFP growth down in a part attributable to technological change and a part to efficiency improvements. The study finds that MFP growth is positively affected by the increased intensity of ICT use. These impacts are not only found in high-technology sectors or sectors that are intensive users of ICT, but also in the construction sector and other community and social services, sectors that are not particularly intensive users of ICT. Despite the positive impacts of ICT, the overall performance of Italy over this period was characterised by negative MFP growth, which the study attributes to the limited scale of investment in ICT and the costs of adjustment to the new technology.
Chapter 13, by B.K. Atrostic, Peter Boegh-Nielsen, Kazuyuki Motohashi and Sang Nguyen, examines the impact of computer networks in three OECD countries, Denmark, Japan and the United States. For the United States, the estimates show that labour productivity in US manufacturing plants with networks is about 5% higher than in plants without networks if the productivity measure is based on gross output. Estimates based on a value-added measure show that labour productivity is about 11% higher in plants with networks. It also finds that a plant that would move from “less likely to having a computer network” to “more likely to having a computer network” would increase its labour productivity by 6.3%. This effect persists when controlling for a range of firm conditions.
For Japan, Chapter 13 finds that use of both intra-firm and inter-firm networks is positively correlated with MFP levels at the firm level. Positive and statistically significant coefficients are found for several types of networks, including open networks (the Internet), CAD/CAM technologies and electronic data interchange (EDI). In Denmark, firms with networks achieved higher growth of value added, particularly after network introduction. In Japan, firms with network use achieved a less sharp drop in labour productivity growth after network introduction as compared to non-users.
Overall, Chapters 6 to 13 show significant impacts of ICT on firm-level performance in all countries considered. In several countries, these impacts are larger than those associated with ICT capital, as there is also evidence for more rapid MFP growth or more rapid innovation.

13
1.5 Complementary factors – innovation, human capital and organisation
Firm-level studies also show that the use of ICT is only part of a much broader range of changes that help firms to enhance performance. This includes complementary investments, e.g. in appropriate skills, and organisational changes, such as new strategies, new business processes and new organisational structures. ICT use by firms is also often linked to the ability of a company to innovate. Users of ICT often help make their investments more valuable through their own experimentation and innovation, e.g. the introduction of new processes, products and applications.
This is confirmed in many of the firm-level studies in the book. Chapter 6 on Australia finds significant interactions between ICT use and complementary organisational variables in nearly all sectors. The complementary factors for which data were available and which were found to have significant influence were: human capital, a firm’s experience in innovation, its use of advanced business practices and the intensity of organisational restructuring. The data for Australia also showed that the earliest and most intensive users of ICTs and the Internet tended to be large firms with skilled managers and workers. Computer use was also commonly associated with use of advanced business practices, the incorporation of companies and firm reorganisation. Moreover, firms with a greater openness to trade seemed to be more intensive users of the Internet.
Chapter 7, by Thomas Hempell, George van Leeuwen and Henry van der Wiel points to the complementarity of innovation and ICT for both Germany and the Netherlands. They test the hypothesis that firms that introduce new products, new processes or adjust their organisational structure can reap higher benefits from ICT investment than firms that refrain from such complementary efforts. Although limited to two countries, the chapter provides important insights in cross-country patterns and differences. For both countries, the results indicate that ICT is used more productively if it is complemented by a firm’s own efforts to innovate. These spill-over effects are a particular feature of ICT capital, since no complementarities between non-ICT capital and innovation could be found in the study. The results also show that innovating on a more continuous basis seems to pay off more in terms of ICT productivity than innovating occasionally. This effect is found for product innovations (Germany) and non-technical innovations (Netherlands) and, to a much smaller extent, for process innovations. For Germany, Chapter 7 also finds evidence for direct benefits from product and process innovation in services on multi-factor productivity (MFP). Service firms that innovate permanently show higher MFP levels. This positive direct effect of innovation on productivity, however, cannot be found for the Netherlands.
Chapter 8 finds that such characteristics are also important in Canada. The innovation strategy of a firm, its business practices, and its human-resource strategies all influence the extent to which a firm adopts new advanced technologies. Moreover, a management team with a focus on improving the quality of its products by adopting an aggressive human-resource strategy – by continuously improving the skill of its workforce through training and recruitment – is also associated with higher productivity growth. A central theme emerging from the Canadian evidence is that a strategic orientation on high-technology is often the core of a successful firm strategy.
Chapter 8 also finds that firms that combined ICT with other advanced technologies do better than firms that only use one technology. Furthermore, the results emphasise that combinations of technologies that involve more than just ICT are important. For example, adoption of advanced process control technology, by itself, has little effect on the productivity growth of a firm, but when combined with ICT and advanced packaging technologies, the effect is significant. Similar effects are evident when firm performance is measured by market-share growth instead of productivity growth. ICTs are therefore important, but mainly in facilitating the effectiveness of other advanced tech-nologies.

14
Chapter 9 finds important complementarities for Switzerland. It finds that labour productivity is positively correlated with human capital intensity and also with organisational factors such as team-work, job rotation and decentralisation of decision making. It also finds some evidence for complementarities between human capital and ICT capital with respect to productivity. However, it does not find evidence of complementarities between organisational capital, human capital and ICT capital, a combination that is found in some other studies.
Chapter 10 finds some evidence of complementarities for Finland, notably for human capital and organisational factors. Organisational factors appear important in Finland since the productivity effects of ICT in the manufacturing sector seem to be much larger in younger than in older firms. Some other studies have shown that the productivity of capital (primarily non-ICT) tends to be higher in older plants, which is possibly due to learning effects. While learning effects undoubtedly also exist with ICT, the finding for Finland is consistent with a view that it may be even more important to be able to make complementary organisational adjustments. Such changes are arguably more easily implemented in younger firms and even more so in new firms. The study for Finland also points to a role for experimentation and selection. While most of the increase in ICT use is driven by growth within firms, restructuring (the growth of some firms and decline of others) also plays an important role. This is notably the case among young firms, where some succeed and grow, and many others fail.
Overall, the evidence of firm-level studies suggests that ICT is associated with complementary changes and investments, notably in skills, organisational changes and innovation. Moreover, investment in ICT may be linked to other technological changes, as shown in the case of Canada. Finally, some of the benefits of ICT seem linked to the entry and growth of new firms and the decline of less successful firms.
1.6 Reconciling evidence from different levels of analysis
Examining the role of ICT at the aggregate, sectoral and firm level raises some difficult questions (see also Chapter 6). The firm-level evidence presented in Chapters 6 to 13 suggests that ICT use is beneficial – though under certain conditions – to firm performance in all countries for which micro-level studies have been conducted. However, the aggregate and sectoral evidence in Chapters 4 and 5 is much less conclusive about the benefits of ICT use. It shows that investment in ICT capital has contributed to growth in most OECD countries, and that the ICT-producing sector has contributed to productivity growth in some OECD countries. There is, however, little evidence that ICT-using industries have experienced more rapid productivity growth, the United States and Australia being the major exceptions. There are several reasons why the aggregate and sectoral evidence may differ from firm-specific evidence.
First, aggregation across firms and industries, as well as the effects of other economic changes, may disguise some of the impacts of ICT in sectoral and aggregate analysis that are more evident from firm level analysis. This may also be because the impacts of ICT depend on other factors and policy changes, which may differ across industries. The size of the aggregate effects over time depends on the rate of development of ICT, their diffusion, lags, complementary changes, adjustment costs and the productivity-enhancing potential of ICT in different industries (Gretton et al., 20022 and Chapter 6).
2. Gretton, P., J. Gali and D. Parham (2002), “Uptake and Impacts of ICTs in the Australian Economy:
Evidence from Aggregate, Sectoral and Firm Levels”, paper prepared for the Workshop on ICT and Business Performance, OECD, Paris, 9 December 2002; Productivity Commission, Canberra, Australia.

15
Second, the firm-level benefits of ICT may be larger in the United States (and possible also in Australia) than in other OECD countries, and thus show up more clearly in aggregate and sectoral evidence. Given the more extensive diffusion of ICT in the United States, and its early start, this interpretation should not be surprising. This is particularly the case if it takes time before the benefits from ICT become apparent, e.g. because of the high costs of adjustment to the new technology. Moreover, the conditions under which ICT is beneficial to firm performance, such as sufficient scope for organisational change, might be more firmly established in the United States than in some other OECD countries.
Measurement may play a role as well. The impacts of ICT may be insufficiently picked up in macroeconomic and sectoral data outside the United States, due to differences in the measurement of output. For example, the United States is one of the few countries that have changed the measurement of banking output to reflect the convenience of automated teller machines. Since services sectors are the main users of ICT, inadequate measurement of service output might be a considerable problem. Improvements in measurement may make some of the benefits of ICT more clearly visible.
Fourth, countries outside the United States may not yet have benefited from spillover effects that could create a wedge between the impacts observed for individual firms and those at the macro-economic level. The discussion above has already suggested that the impacts of ICT may be larger than the direct returns flowing to firms using ICT. For example, ICT may lower transaction costs, that can improve the functioning of markets (by improving the matching process), and make new markets possible. Another effect that can create a gap between firm-level returns and aggregate returns is ICT’s impact on knowledge creation and innovation. ICT enables more data and information to be processed at a higher speed and can thus increase the productivity of the process of knowledge creation. A greater use of ICT may thus gradually improve the functioning of the economy. Such spillover effects may already have shown up in the aggregate statistics in the United States, but not yet in other countries.
Finally, the state of competition may also play a role in the size of spillover effects. In a large and highly competitive market, such as the United States, firms using ICT may not be the largest beneficiaries of investment in ICT. Consumers may extract a large part of the benefits, in the form of lower prices, better quality, improved convenience, and so on. In other cases, firms that are upstream or downstream in the value chain from the firms using ICT might benefit from greater efficiency in other parts of the value chain. For example, Chapter 11 demonstrates productivity impacts for firms purchasing through computer networks, not for firms selling through networks. In countries with limited competition, firms might be able to extract a greater part of the returns, and spillover effects might thus be more limited. Further cross-country research may help to address these questions, and provide new insights in the extent of ICT-related spillovers.
1.7 Concluding remarks and remaining questions
The range of studies presented in the book shows that the empirical evidence of the economic impacts of ICT is significantly improved from what it was only a few years ago. Many OECD countries now provide estimates of ICT investment that enable calculations of capital services (see Chapter 4). Data on the ICT sector and on the services sector are available for many countries, although important gaps in our knowledge remain (Chapter 5). Moreover, many countries now have regular business surveys of ICT use that provide an overview of diffusion patterns (Chapter 2). These surveys provide a wealth of information for the type of empirical research presented in Chapter 3 and Chapters 6 to 13 of the book.

16
The evidence also shows that achieving benefits from investment in ICT is not straightforward. It typically requires complementary investments and changes, e.g. in human capital, organisational change and innovation. Moreover, ICT-related changes are part of a process of search and experi-mentation, where some firms succeed and grow and others fail and disappear. Countries with a business environment that enables this process of creative destruction may be better able to seize benefits from ICT than countries where such changes are more difficult and slow to occur.
The more solid evidence on the economic impacts of ICT and the conditions under which these impacts occur are important for policy, as it helps underpin evidence-based policies. However, further progress in both measurement and economic analysis is feasible and desirable. One important area, already highlighted above, concerns the measures of economic impacts that are available at the aggregate or industry level. This will require more comparable investment data, a greater use of hedonic deflators and improved output measures for services. But a tremendous potential also lies in further work with firm-level data. There are at least two aspects to this.
First, cross-country studies on the impact of ICT at the firm level are still relatively scarce, primarily since comparable data sources are still relatively new. This book contains two studies (Chapters 7 and 13) that engaged in international comparisons. Another example is a recent com-parison between the United States and Germany (Haltiwanger et al., 2002), that examined the relationship between labour productivity and measures of the choice of technology.3 It found that firms in all categories of investment had much stronger productivity growth in the United States than in Germany. Moreover, firms with high ICT investment had stronger productivity growth than firms with low or zero ICT investment. In addition, firms in the United States had much greater variation in their productivity performance than firms in Germany. Understanding the reasons for these differences and the cross-country differences found in Chapters 7 and 13 would benefit from further work, and could lead to helpful insights for policy.
Second, there are several key issues that remain poorly analysed and that offer scope for progress. For example, further work with firm-level data could provide greater insights into firm dynamics, e.g. the role of new firms, the conditions that lead to successful survival and the factors determining firm exit. Moreover, the link between innovation and ICT has only been examined for some OECD countries (see Chapter 7). Understanding this link is of great importance as long-term growth depends on the future pace of innovation. A better understanding of such (and related) phenomena would provide insights into the relative importance of various factors, their interaction, and the scope for policy. Moreover, quantitative analysis of the price and productivity impacts of electronic commerce and e-business processes is still in its early stages, but is a promising area of further work, as suggested by Chapter 11. Finally, while there is growing evidence that ICT can help transform the service sector and make it more innovative and productive, a good understanding of ICT’s impact on the service sector is still lacking, partly because of some thorny measurement problems but also due to lack of cross-country empirical analysis.
Finally, the studies contained in this book point to the importance of close interaction between statistical development and policy analysis. Many of the data used in this book were not yet available 5 or 6 years ago; the bulk were developed in response to demands by policy makers for new and better data on ICT diffusion. The response of statistical offices to this demand has been quick and comprehensive. But this interaction also works the other way; effective use of the large amounts of
3. Haltiwanger, J., R. Jarmin and T. Schank (2002), “Productivity, Investment in ICT and Market
Experimentation: Micro Evidence from Germany and the United States”, paper presented at OECD Workshop on ICT and Business Performance, 9 December 2002.

17
data held by statistical offices can provide a wealth of policy-relevant information if the data is made accessible for research. This remains a challenge in several OECD countries.
ICT has emerged over the past decade as a key technology than can transform economic and social activity. However, its full potential remains unknown, requiring continued monitoring of its impacts and the appropriate policies to seize its benefits.

19
CHAPTER 2
THE DIFFUSION OF ICT IN OECD ECONOMIES
Dirk Pilat and Andrew Devlin1 Organisation for Economic Co-operation and Development
Abstract
This chapter examines the diffusion of ICT across OECD countries. The chapter uses recently developed official statistics that provide a sound basis for international comparisons. Certain ICT technologies, such as the Internet, have now diffused to almost all businesses of more than 10 employees in several OECD countries. Others, such as broadband technologies, are at an earlier stage of the diffusion process. The chapter also shows that large differences in the uptake of ICT technologies persist across the OECD, both between and within OECD countries. Cost differentials and structural differences are among the factors explaining these differences. The state of the business environment in different OECD countries is also an important factor as it affects the degree to which firms can take full benefit from the potential offered by ICT.
1. This chapter is a revised and updated version of Chapter 1 of OECD (2003a).

20
2.1 The state of ICT diffusion
The economic impact of ICT is closely linked to the extent to which different ICT technologies have diffused across OECD economies. This is partly because ICT is a network technology; the more people and firms that use the network, the more benefits it generates. The diffusion of ICT currently differs considerably between OECD countries, however, since some countries have invested more or have started earlier to invest in ICT than other countries. Investment in ICT establishes the infrastructure for the use of ICT (the ICT networks) and provides productive equipment and software to businesses. While ICT investment has accelerated in most OECD countries over the past decade, the pace of that investment differs widely. The data show that ICT investment rose from less than 15% of total non-residential investment in the early 1980s, to between 15% and 30% in 2001. In 2001, the share of ICT investment was particularly high in the United States, the United Kingdom, Sweden, the Netherlands, Canada and Australia (Figure 2.1). ICT investment in many European countries and in Japan was substantially lower than in the United States over the past decade.
Figure 2.1. ICT investment in selected OECD countries
(As a percentage of non-residential gross fixed capital formation, total economy)
0
5
10
15
20
25
30
Portu
gal
Franc
e
Austri
a
Irelan
d
Spain
Italy
Gre
ece
Japa
n
Germ
any
Belgiu
m
Finlan
d
Denmark
Austra
lia
Canad
a
Nether
land
s
Sweden
Unite
d Kin
gdom
United
Sta
tes
1980
1990
2001*
*Or latest available year. Note: Estimates of ICT investment are not yet fully standardised across countries, mainly due to differences in the capitalisation of software in different countries. See Ahmad (2003) and Chapter 4. Source: OECD, Database on capital services.
The high growth of ICT investment has been fuelled by a rapid decline in the relative prices of computer equipment and the growing scope for the application of ICT. Due to rapid technological progress in the production of key ICT technologies, such as semi-conductors, and strong competitive pressure in their production,2 the prices of key technologies have fallen by between 15 and 30% annually, making investment in ICT attractive to firms. The lower costs of ICT are only part of the picture; ICT is also a technology that may offer large potential benefits to firm, e.g. in enhancing information flows and productivity. Chapter 4 examines the impact of ICT investment on economic growth in more detail and discusses some key measurement issues related to this indicator.
2. Aizcorbe (2002) shows that part of the decline in the prices of Intel chips can be attributed to a decline in
Intel’s mark-ups over the 1990s, which points to stronger competition.

21
A second important aspect of the diffusion of ICT is the size of the ICT sector, i.e. the sector that produces ICT goods and services (Box 2.1). Having an ICT-producing sector can be important for ICT diffusion. For example, it may help firms that wish to use ICT, since the close proximity of producing firms might have advantages when developing ICT applications for specific purposes. In addition, having a strong ICT sector should also help generate the skills and competencies needed to benefit from ICT use. And it could also lead to spin-offs, as in the case of Silicon Valley or in other high technology clusters. Having an ICT sector can thus support ICT diffusion, although previous OECD work has shown that it is not a prerequisite to benefiting from the technology (OECD, 2001a).
Box 2.1. OECD definition of ICT-producing industries
In 1998, OECD countries reached agreement on an industry-based definition of the ICT sector based on International Standard Industry Classification (ISIC) Revision 3. The principles are the following: for manufacturing industries, the products of an industry must be intended to fulfil the function of information processing and communication including transmission and display, or must use electronic processing to detect, measure and/or record physical phenomena or control a physical process. For services industries, the products must be intended to enable the function of information processing and communication by electronic means. The following industries were included:
Manufacturing
3000 Manufacture of office, accounting and computing machinery
3130 Manufacture of insulated wire and cable
3210 Manufacture of electronic valves and tubes and other electronic components
3220 Manufacture of television and radio transmitters and apparatus for line telephony and line telegraphy
3230 Manufacture of television and radio receivers, sound or video recording or reproducing apparatus, and associated goods
3312 Manufacture of instruments and appliances for measuring, checking, testing, navigating and other purposes, except industrial process control equipment
3313 Manufacture of industrial process control equipment
Services
5150 Wholesale of machinery, equipment and supplies
7123 Renting of office machinery and equipment (including computers)
6420 Telecommunications
7200 Computer and related activities (hardware consultancy, software consultancy and supply, data processing, database activities, maintenance and repair of office, accounting and computing machinery, other)
Source: OECD (2002a).
In most OECD countries, the ICT sector is relatively small, although it has grown rapidly over the 1990s.3 Its share in business employment ranges from between 3.7% (in Portugal) to 11.3% (in Finland) (OECD, 2003a). Its share in value added is slightly larger, indicating that it has an above-average level of labour productivity, and ranges from around 6% in the Slovak Republic, Greece and Mexico, to 16.5% in Ireland and Finland of business sector value added (Figure 2.2). ICT manufacturing is typically only a small part of this total and ranges between 1.3 and 14% of manufacturing employment, and between 1.6 and 23% of manufacturing value added. Finland and Ireland have the largest ICT manufacturing sectors, followed by Korea. Australia, Greece, Italy, New Zealand, Portugal and Spain, in contrast, have only a small sector producing manufactured ICT goods
3. These estimates are based on the OECD definition of the ICT sector. See OECD (2002a).

22
(OECD, 2003a). The relative size of the service part of the ICT sector also varies considerably across countries, with Germany, Japan, Korea and Mexico having a relatively small ICT service sector. Some of this variation is linked to the telecommunications sector, which is very large in the Czech Republic, Hungary and Portugal and quite small in Mexico, Korea and Italy. Another part is linked to computer and related services, the sector that accounts for much of the production of software. This sector is particularly large in Ireland, Sweden and Belgium (OECD, 2003a). Chapter 5 examines the contribution of the ICT-producing sector to economic performance in more detail.
Figure 2.2. Share of the ICT sector in value added, non-agricultural business sector, 2000
0
5
10
15
20
Irelan
d (1
999)
(1)
Finla
nd (2
001)
Korea
(1999
) (1)
United
King
dom
(200
1)
New Z
ealan
d (2
)
United
Sta
tes
Sweden
Nethe
rland
s
Belgium
(1)
OECD
Hunga
ry
Japa
n (3
,4)
Canad
a
Czech
Rep
ublic
(1,3
)EU
Norway
Denm
ark
Fran
ce
Portu
gal (
1999
) (1)
Austri
a
Austra
lia (2
000-
01)
Spain
Ita
ly
Germ
any
(1,3
)
Greec
e (2
001)
(1,2
,3)
Mex
ico
Slovak
Rep
ublic
(199
9) (1
,3)
ICT manufacturing ICT services%
1. Excludes rental of ICT (ISIC 7123). 2. Includes postal services. 3. Excludes ICT wholesale (ISIC 5150). 4. Includes only part of computer-related activities. Source: OECD (2003a), OECD Science, Technology and Industry Scoreboard, www.oecd.org/sti/scoreboard.
A third key aspect of ICT diffusion and the resulting impacts of ICT in different OECD countries is the distribution of ICT across the economy. In contrast to Solow’s famous remark, “you see computers everywhere but in the productivity statistics” (Solow, 1987), computers are, in fact, heavily concentrated in the service sector. Evidence for the United States shows that more than 30% of the total stock of equipment and software in legal services, business services and wholesale trade consists of IT and software (OECD, 2003a). Education, financial services, health, retail trade and a number of manufacturing industries (instruments and printing and publishing) also have a relatively large share of IT capital in their total stock of equipment and software. The average for all private industries is just over 11%. The goods-producing sectors (agriculture, mining, manufacturing and construction) are much less IT-intensive; in several of these industries less than 5% of total equipment and software consists of IT.
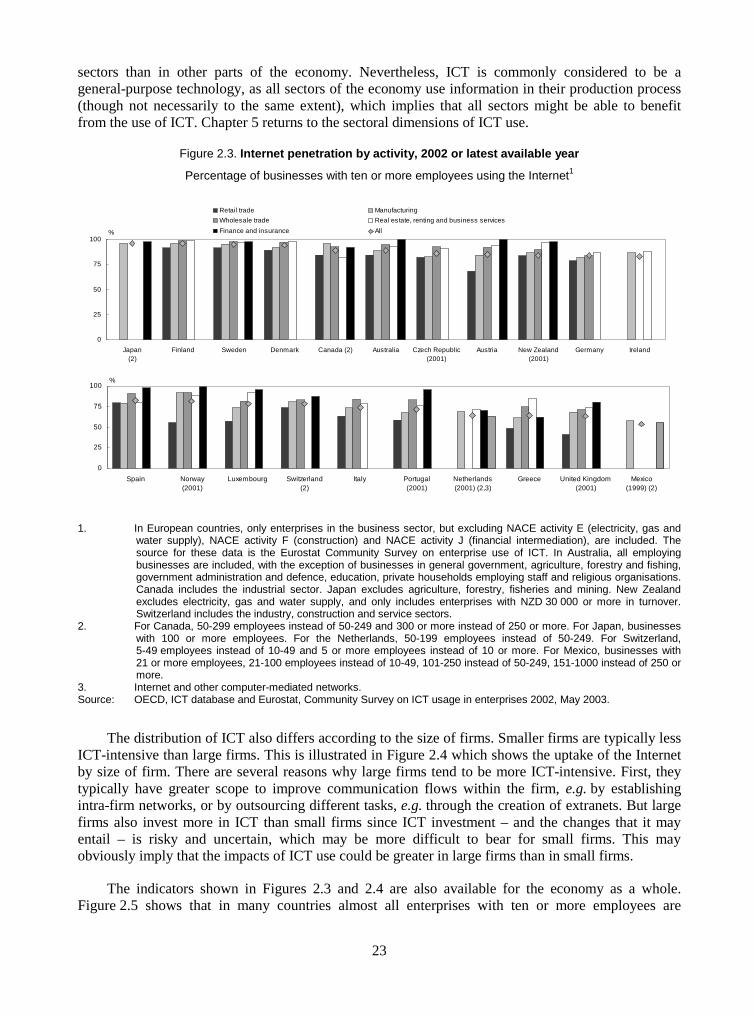
The relative distribution of ICT investment across sectors for other OECD countries is not very different for other OECD countries (Van Ark et al., 2002; Pilat et al., 2002); services sectors such as wholesale trade, financial and business services are typically the most intensive users of ICT.4 Indicators of the uptake of the Internet by economic activity also suggest a high uptake in certain service sectors, notably financial and business services, as well as real estate (Figure 2.3). These results suggest that any impacts on economic performance might be more visible in the services
4. Health and education are also intensive ICT users but are ignored here as their output is difficult to
measure.
23
sectors than in other parts of the economy. Nevertheless, ICT is commonly considered to be a general-purpose technology, as all sectors of the economy use information in their production process (though not necessarily to the same extent), which implies that all sectors might be able to benefit from the use of ICT. Chapter 5 returns to the sectoral dimensions of ICT use.
Figure 2.3. Internet penetration by activity, 2002 or latest available year
Percentage of businesses with ten or more employees using the Internet1
0
25
50
75
100
Japan(2)
Finland Sweden Denmark Canada (2) Australia Czech Republic(2001)
Austria New Zealand(2001)
Germany Ireland
%
Retail trade Manufacturing
Wholesale trade Real estate, renting and business services
Finance and insurance All
0
25
50
75
100
Spain Norway(2001)
Luxembourg Switzerland(2)
Italy Portugal(2001)
Netherlands(2001) (2,3)
Greece United Kingdom(2001)
Mexico(1999) (2)
%
1. In European countries, only enterprises in the business sector, but excluding NACE activity E (electricity, gas and water supply), NACE activity F (construction) and NACE activity J (financial intermediation), are included. The source for these data is the Eurostat Community Survey on enterprise use of ICT. In Australia, all employing businesses are included, with the exception of businesses in general government, agriculture, forestry and fishing, government administration and defence, education, private households employing staff and religious organisations. Canada includes the industrial sector. Japan excludes agriculture, forestry, fisheries and mining. New Zealand excludes electricity, gas and water supply, and only includes enterprises with NZD 30 000 or more in turnover. Switzerland includes the industry, construction and service sectors.
2. For Canada, 50-299 employees instead of 50-249 and 300 or more instead of 250 or more. For Japan, businesses with 100 or more employees. For the Netherlands, 50-199 employees instead of 50-249. For Switzerland, 5-49 employees instead of 10-49 and 5 or more employees instead of 10 or more. For Mexico, businesses with 21 or more employees, 21-100 employees instead of 10-49, 101-250 instead of 50-249, 151-1000 instead of 250 or more.
3. Internet and other computer-mediated networks. Source: OECD, ICT database and Eurostat, Community Survey on ICT usage in enterprises 2002, May 2003.
The distribution of ICT also differs according to the size of firms. Smaller firms are typically less ICT-intensive than large firms. This is illustrated in Figure 2.4 which shows the uptake of the Internet by size of firm. There are several reasons why large firms tend to be more ICT-intensive. First, they typically have greater scope to improve communication flows within the firm, e.g. by establishing intra-firm networks, or by outsourcing different tasks, e.g. through the creation of extranets. But large firms also invest more in ICT than small firms since ICT investment – and the changes that it may entail – is risky and uncertain, which may be more difficult to bear for small firms. This may obviously imply that the impacts of ICT use could be greater in large firms than in small firms.
The indicators shown in Figures 2.3 and 2.4 are also available for the economy as a whole. Figure 2.5 shows that in many countries almost all enterprises with ten or more employees are

24
connected to the Internet. Many of these also have their own Web site; in Finland, Denmark, Canada, Sweden and Ireland, two-thirds or more of all enterprises with ten or more employees have Web sites.
Figure 2.4. Internet penetration by size of firm, 2002 or latest available year
Percentage of businesses with ten or more employees using the Internet1
50
60
70
80
90
100
Finland
Sweden
Denmar
k
Canada
(2)
Austra
lia
Czech
Repu
blic (2
001)
Austria
Japa
n (2
)
New Z
ealan
d (2
001)
Germ
any
Irelan
dSpain
Norway
(200
1)
Nethe
rland
s(20
01) (2
,3)
Luxem
bourg
Switzer
land (2
000)
Italy
Portuga
l (200
1)
Greece
United
Kingdom
(200
1)
Mexico (1
999) (
2)
%[10-49] [50-249] 250 and more 10 and more
See Figure 2.3 for notes 1, 2 and 3. Source: OECD, ICT database and Eurostat, Community Survey on ICT usage in enterprises 2002, May 2003.
Figure 2.5. Business use of the Internet and Web sites, 2002 or latest available year
Percentage of businesses with ten or more employees1
0
20
40
60
80
100
Japa
n (2)
Finla
nd
Sweden
Denm
ark
Canada
Australi
a
Czech
Repu
blic (2
001)
Austria
New Z
ealan
d (2001
)
Germany
Irelan
dSpain
Norway
(200
1)
Nether
lands (
2001
) (3)
Luxe
mbou
rg
Switzer
land
(200
0) (2
)Ita
ly
Portuga
l (20
01)
Greece
United K
ingdom
(200
1)
Mexic
o (1999
) (2)
% Have Internet access Have own Web site
1. See Note 1 of Figure 2.3 for details. 2. For Japan, businesses with 100 or more employees. For Switzerland, five or more employees. For Mexico, businesses with 21 or more employees. 3. Internet and other computer-mediated networks. Source: OECD, ICT database and Eurostat, Community Survey on ICT usage in enterprises 2002, May 2003.
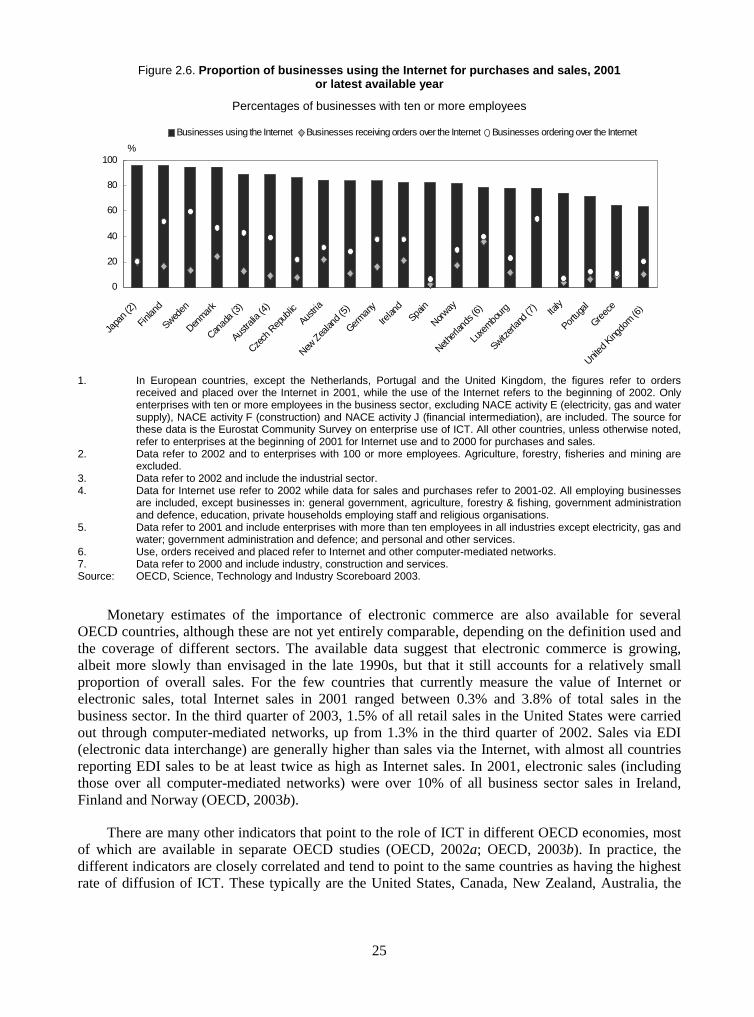
One further indicator that points to the uptake of ICT is the proportion of businesses that use the Internet to make purchases and sales (Figure 2.6). This is not available for all OECD countries, but suggests that a large number of firms use the Internet for sales or purchases in the Nordic countries (Denmark, Finland, Norway and Sweden) as well as in Australia, the Netherlands and New Zealand. In contrast, only few firms in Greece, Italy, Portugal and Spain use the Internet for sales or purchases, even if many are connected to the Internet.
25
Figure 2.6. Proportion of businesses using the Internet for purchases and sales, 2001 or latest available year
Percentages of businesses with ten or more employees
0
20
40
60
80
100
Japa
n (2)
Finlan
d
Sweden
Denmar
k
Canad
a (3)
Austra
lia (4
)
Czech
Rep
ublic
Austria
New Z
ealan
d (5)
German
y
Irelan
dSpa
in
Norway
Nether
lands
(6)
Luxe
mbour
g
Switzerl
and (
7) Italy
Portug
al
Greec
e
United
King
dom (6
)
%
Businesses using the Internet Businesses receiving orders over the Internet Businesses ordering over the Internet
1. In European countries, except the Netherlands, Portugal and the United Kingdom, the figures refer to orders
received and placed over the Internet in 2001, while the use of the Internet refers to the beginning of 2002. Only enterprises with ten or more employees in the business sector, excluding NACE activity E (electricity, gas and water supply), NACE activity F (construction) and NACE activity J (financial intermediation), are included. The source for these data is the Eurostat Community Survey on enterprise use of ICT. All other countries, unless otherwise noted, refer to enterprises at the beginning of 2001 for Internet use and to 2000 for purchases and sales.
2. Data refer to 2002 and to enterprises with 100 or more employees. Agriculture, forestry, fisheries and mining are excluded.
3. Data refer to 2002 and include the industrial sector. 4. Data for Internet use refer to 2002 while data for sales and purchases refer to 2001-02. All employing businesses
are included, except businesses in: general government, agriculture, forestry & fishing, government administration and defence, education, private households employing staff and religious organisations.
5. Data refer to 2001 and include enterprises with more than ten employees in all industries except electricity, gas and water; government administration and defence; and personal and other services.
6. Use, orders received and placed refer to Internet and other computer-mediated networks. 7. Data refer to 2000 and include industry, construction and services. Source: OECD, Science, Technology and Industry Scoreboard 2003.
Monetary estimates of the importance of electronic commerce are also available for several OECD countries, although these are not yet entirely comparable, depending on the definition used and the coverage of different sectors. The available data suggest that electronic commerce is growing, albeit more slowly than envisaged in the late 1990s, but that it still accounts for a relatively small proportion of overall sales. For the few countries that currently measure the value of Internet or electronic sales, total Internet sales in 2001 ranged between 0.3% and 3.8% of total sales in the business sector. In the third quarter of 2003, 1.5% of all retail sales in the United States were carried out through computer-mediated networks, up from 1.3% in the third quarter of 2002. Sales via EDI (electronic data interchange) are generally higher than sales via the Internet, with almost all countries reporting EDI sales to be at least twice as high as Internet sales. In 2001, electronic sales (including those over all computer-mediated networks) were over 10% of all business sector sales in Ireland, Finland and Norway (OECD, 2003b).
There are many other indicators that point to the role of ICT in different OECD economies, most of which are available in separate OECD studies (OECD, 2002a; OECD, 2003b). In practice, the different indicators are closely correlated and tend to point to the same countries as having the highest rate of diffusion of ICT. These typically are the United States, Canada, New Zealand, Australia, the

26
Nordic countries and the Netherlands. From this perspective, it is likely that the largest economic impacts of ICT should also be found in these countries.
The diffusion of ICT in OECD countries has been relatively rapid compared to some other technologies, although technological diffusion typically takes considerable time.5 For example, over 90% of firms with more than ten employees in Denmark, Japan, Finland and Sweden had Internet access in 2001, only six years after the introduction of the World Wide Web in 1995 (OECD, 2002a). Certain recent ICT technologies (such as the Internet) have thus already reached a large proportion of potential users only a few years after their introduction. Other ICT technologies (such as broadband) are in an earlier stage of the diffusion process, however.
The diffusion of ICT continues across OECD economies, despite the current economic slowdown. The share of ICT investment in total capital formation grew rapidly until 2000, and remained at a high share of investment even in 2001 and 2002, suggesting that ICT investment has not been affected disproportionally by the slowdown compared with other types of investment. Evidence for the United States shows that ICT investment was among the first areas of investment to recover in 2002 (BEA, 2003). The continued diffusion of ICT can also be observed in other areas. For example, the number of broadband subscribers in the OECD area rose from 33 million by the end of 2001, to more than 55 million by the end of 2002 and to over 70 million in June 2003. Large ICT networks are now in place throughout the business sector. These will have to be maintained and updated, and will increasingly be made to work and generate economic returns.
2.2 Factors affecting the diffusion of ICT
Why is the diffusion of ICT so different across OECD countries? A number of reasons can be noted. In the first place, firms in countries with higher levels of income and productivity typically have greater incentive to invest in efficiency-enhancing technologies than countries at lower levels of income.6 In a more general sense, the decision of a firm to adopt ICT depends on the balance of costs (in the broadest possible sense) and benefits that may be associated with the technology. There is a large range of factors that affect this decision. Previous OECD work already noted several factors that might be important, such as lack of relevant skills for effective use of ICT, lack of competition, or high costs (OECD, 2001a). These have been confirmed by other recent studies. Caselli and Coleman (2001), for example, found that levels of education and the extent of manufacturing imports are both positively associated with ICT diffusion. Gust and Marquez (2002) found that restrictions in product and labour markets can also affect levels of ICT investment. Moreover, Guerrieri et al. (2003) found that financial conditions, income growth and comparative advantage affect ICT uptake. The discussion below examines some of the empirical evidence that may help explain the differences in ICT diffusion across OECD countries.
The costs of investment in ICT
A first factor concerns the costs of ICT. Since ICT investment goods are traded internationally, their prices should not vary too much across OECD countries. Evidence from international price comparisons suggests otherwise, however. Over much of the 1990s, firms in the United States and
5. Technological diffusion often follows an S-shaped curve, with slow diffusion when a technology is new
and expensive, rapid diffusion once the technology is well established and prices fall, and slow diffusion once the market is saturated.
6. Cross-country panel regressions of the investment shares shown in Figure 2.1 tend to show that levels of GDP per capita have a positive impact on the share of total investment that is devoted to ICT.

27
Canada enjoyed considerably lower costs of ICT investment goods than firms in European countries and Japan (OECD, 2001a). The high costs in Europe and Japan may have limited investment in these countries. Barriers to trade, such as non-tariff barriers related to standards, import licensing and government procurement, may partly explain the cost differentials (OECD, 2002b). The higher price levels in certain OECD countries may also be associated with a lack of competition within countries. In time, however, international trade and competition should erode these cross-country price differences; prices of ICT investment goods in 1996 in European countries and Japan were already much closer to those in the United States than they were in 1993. By 1999, they had come down further across the OECD (OECD, 2002c).7
The investment and diffusion of ICT do not just depend on the cost of the investment goods themselves, but also on the associated costs of communication and use once the hardware is linked to a network. Increased competition in the telecommunications industry, thanks to extensive regulatory reform, has been of great importance in driving down these costs. Countries that moved early to liberalise their telecommunications industry now have much lower communications costs and, consequently, a wider diffusion of ICT technologies than those that followed later on. Despite the decline in telecommunication prices over the past decade in all OECD countries, prices in many countries remain high. For example, prices of leased lines, that are the building blocks of business-to-business electronic commerce, still showed great variation in the OECD in August 2002 (Figure 2.7).
Figure 2.7. OECD price basket for national leased line charges, August 2002
Index, OECD=100 for lines of 2 Mbit/s
0
50
100
150
200
250
300
Icel
and
Swed
enN
orw
ayD
enm
ark
Switz
erla
ndLu
xem
bour
gG
erm
any
Irela
ndU
nite
d St
ates
Belg
ium
Aust
riaFr
ance
Uni
ted
King
dom
Gre
ece
Net
herla
nds
Turk
eyO
ECD
Italy
Can
ada
Spai
nAu
stra
liaPo
rtuga
lJa
pan
Pola
ndN
ew Z
eala
ndM
exic
oH
unga
ryKo
rea
Slov
ak R
epub
licC
zech
Rep
ublic
Index, OECD=100
Source: OECD, Communications Outlook 2003, based on OECD and Teligen.
Firm-specific barriers to ICT use
Costs of the technology itself are only one factor and not necessarily the most important for the decision made by firms to invest in ICT. There are many other barriers that may affect the uptake and use of ICT. Firm-level surveys for the year 2000 point to a broad range of such factors. They show, for example, that lack of security and slow or unstable communications were considered the key problems in accessing the Internet in European countries (Figure 2.8).
7. These comparisons derive from the OECD’s work on purchasing power parities (PPPs). They are only
undertaken for benchmark years, the latest one being 1999. Work on a comparison for 2002 will be released in 2004.

28
Figure 2.8. Perceived barriers to Internet access and use in the business sector, 2000
0 10 20 30 40 50 60
Portugal
Austria
Italy
United Kingdom
Finland
Spain
Sweden
Denmark
Luxembourg
Greece
Spain
Portugal
Italy
Sweden
United Kingdom
Austria
Luxembourg
Greece
Finland
Denmark
Finland
Portugal
United Kingdom
Austria
Spain
Greece
Luxembourg
Italy
Denmark
Sweden
United Kingdom
Portugal
Spain
Denmark
Austria
Luxembourg
Italy
Greece
Portugal
Spain
Sweden
United Kingdom
Austria
Finland
Luxembourg
Italy
Denmark
Greece
%
Lack of security(viruses, hackers)
Datacommunicationstoo slow orunstable
Lackingqualification ofpersonnel / lackof specific knowhow
Costs to make itavailable too high
Internet accesscharges too high
Source: OECD (2002a), Measuring the Information Economy, based on Eurostat, E-commerce Pilot Survey.
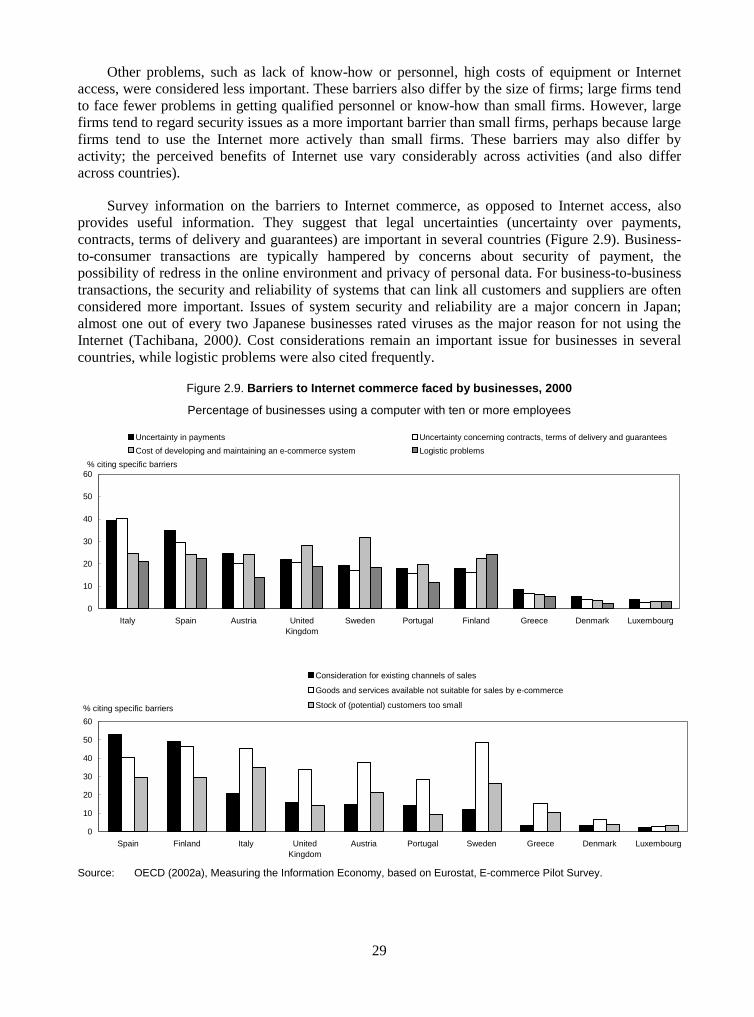
29
Other problems, such as lack of know-how or personnel, high costs of equipment or Internet access, were considered less important. These barriers also differ by the size of firms; large firms tend to face fewer problems in getting qualified personnel or know-how than small firms. However, large firms tend to regard security issues as a more important barrier than small firms, perhaps because large firms tend to use the Internet more actively than small firms. These barriers may also differ by activity; the perceived benefits of Internet use vary considerably across activities (and also differ across countries).
Survey information on the barriers to Internet commerce, as opposed to Internet access, also provides useful information. They suggest that legal uncertainties (uncertainty over payments, contracts, terms of delivery and guarantees) are important in several countries (Figure 2.9). Business-to-consumer transactions are typically hampered by concerns about security of payment, the possibility of redress in the online environment and privacy of personal data. For business-to-business transactions, the security and reliability of systems that can link all customers and suppliers are often considered more important. Issues of system security and reliability are a major concern in Japan; almost one out of every two Japanese businesses rated viruses as the major reason for not using the Internet (Tachibana, 2000). Cost considerations remain an important issue for businesses in several countries, while logistic problems were also cited frequently.
Figure 2.9. Barriers to Internet commerce faced by businesses, 2000
Percentage of businesses using a computer with ten or more employees
0
10
20
30
40
50
60
Italy Spain Austria UnitedKingdom
Sweden Portugal Finland Greece Denmark Luxembourg
% citing specific barriers
Uncertainty in payments Uncertainty concerning contracts, terms of delivery and guarantees
Cost of developing and maintaining an e-commerce system Logistic problems
0
10
20
30
40
50
60
Spain Finland Italy UnitedKingdom
Austria Portugal Sweden Greece Denmark Luxembourg
% citing specific barriers
Consideration for existing channels of sales
Goods and services available not suitable for sales by e-commerce
Stock of (potential) customers too small
Source: OECD (2002a), Measuring the Information Economy, based on Eurostat, E-commerce Pilot Survey.

30
Commercial factors were also cited by many businesses as a factor in not taking up Internet commerce. Many businesses in Finland and Spain found that Internet commerce would threaten existing sales channels. Existing transaction models or strong links with customers and suppliers along the value chain may discourage businesses from introducing new sales models. In many cases, the goods and services on offer by a particular firm were not considered suitable for Internet commerce. In Canada, among businesses that did not buy or sell over the Internet, 56% believed that their goods or services did not lend themselves to Internet transactions; 36% preferred to maintain their current business model. And firms in several countries, notably Italy, considered the market too small. Some of these considerations differ by the size of firm and the activity; large firms found logistical barriers more important than small firms did. However, barriers related to Internet payments and the costs of setting up Internet commerce did not differ in a consistent manner across OECD countries. There also differences across activities; many firms in real estate and hotels and restaurants did not consider their products and services suitable for Internet commerce, whereas only few firms in the financial sector considered this to be the case. More elaborate analysis of this type of survey evidence can provide important insights in the factors explaining ICT uptake (see Chapter 3).
The role of the business environment
The survey evidence outlined above already suggests that the broader business environment plays a role in firm’s decision to adopt ICT. This is further illustrated in Figures 2.10 and 2.11. While not demonstrating causality, Figure 2.10 shows that there is a link between ICT investment as a share of total capital formation in 1998 and product market regulations, as measured by an OECD index of the state of these regulations in 1998. The graph shows that countries that had a high level of regulation in 1998 had lower shares of investment in ICT than countries with low degrees of product market regulation. This may be because product market regulations can limit competition. Competition is important in spurring ICT investment as it forces firms to seek ways to strengthen performance relative to competitors. Moreover, competition may help lower the costs of ICT, which stimulates diffusion. Sector-specific rules may also be important. Since ICT offers firms new capabilities, e.g. in selling or purchasing on-line, firms may be able to enter markets and introduce products and services that were not feasible before. For example, selling books on-line enables companies to sell in markets that they could not easily enter before. This may be in conflict with the regulations that are in place in such markets, simply because such electronic selling was not possible before. In certain cases, ICT might thus enable the introduction of competition in markets that were previously characterised by low competition, for example a national or regional monopoly. Product market regulations may also reduce the incentives for firms to innovate and develop new ICT applications (OECD, 2002d).
Figure 2.11 shows the link between ICT investment and an index of employment protection legislation for 1998. The correlation between levels of ICT investment and labour market regulations may be related to the organisational factors that are required to make ICT work; if firms cannot adjust their workforce or organisation and make ICT effective within the firm, they may decide to limit investment or relocate activities. These links between regulations and ICT investment have been confirmed through econometric analysis; Gust and Marquez (2002) find that regulations impeding workforce reorganisations and competition between firms hinder investment in ICT. Bartelsman et al. (2002) confirm these findings.

31
Figure 2.10. Countries that had strict product market regulations in 1998 had lower ICT investment
United States
United Kingdom
Sw eden
Spain
Portugal
Netherlands
JapanItaly
IrelandGreeceGermany
France
Finland
Denmark
Canada
Belgium
Austria
Australia
0
5
10
15
20
25
30
0 1 2 3Product Market Regulation index
ICT in
vest
men
t in
1998
(as
a %
of G
FC
F)
Correlation = -0.54T-statistics = -2.54
Notes: The scale of indicators is 0-6, from least to most restrictive. Based on the situation in or around 1998. The components are weighted to show their relative importance in the overall indicator. Since 1998, many countries have implemented reforms in product markets.
Source: ICT investment from sources quoted in Figure 2.1; regulations from Nicoletti et al. 1999.
Figure 2.11. Countries with strict employment protection legislation in 1998 had lower ICT investment
United States
United Kingdom
Sw eden
Spain
Portugal
Netherlands
Japan Italy
IrelandGreeceGermany
France
Finland
Denmark
Canada
Belgium
Austria
Australia
0
5
10
15
20
25
30
0 1 2 3 4Employment protection legislation index
ICT
inve
stm
ent i
n 19
98 (
as %
of G
FC
F) Correlation = -0.65
T-statistics = -3.46
Notes: The scale of indicators is 0-6, from least to most restrictive. Based on the situation in or around 1998. The
components are weighted to show their relative importance in the overall indicator. Since 1998, many countries have implemented reforms in employment protection legislations.
Source: ICT investment from sources quoted in Figure 2.1; regulations from Nicoletti et al. 1999.
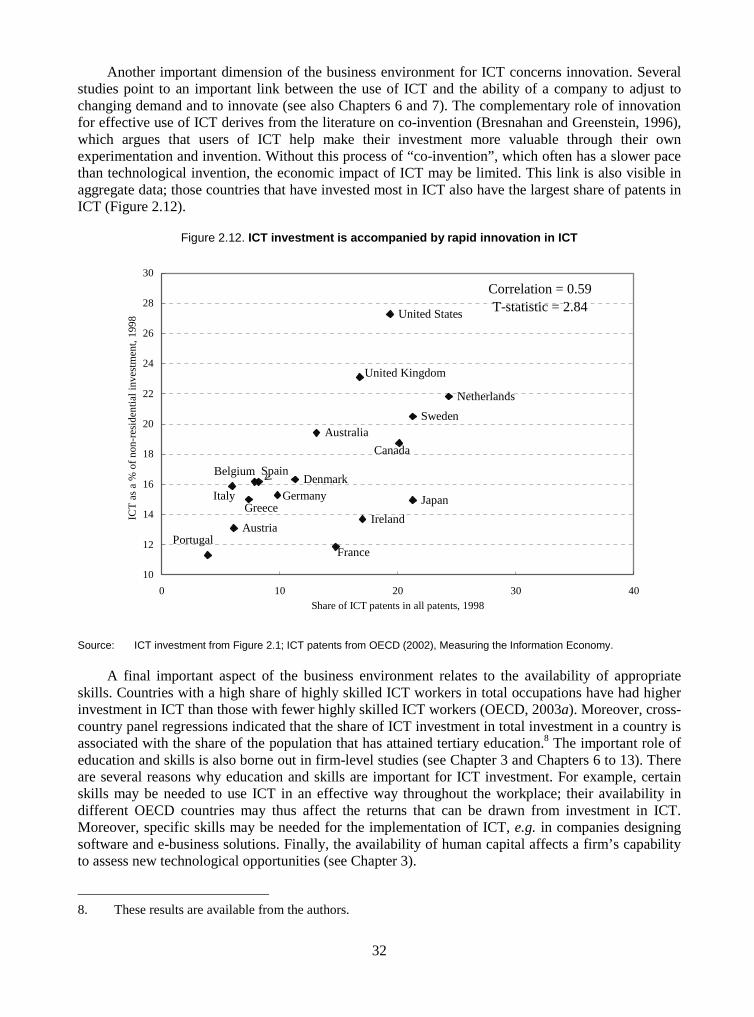
32
Another important dimension of the business environment for ICT concerns innovation. Several studies point to an important link between the use of ICT and the ability of a company to adjust to changing demand and to innovate (see also Chapters 6 and 7). The complementary role of innovation for effective use of ICT derives from the literature on co-invention (Bresnahan and Greenstein, 1996), which argues that users of ICT help make their investment more valuable through their own experimentation and invention. Without this process of “co-invention”, which often has a slower pace than technological invention, the economic impact of ICT may be limited. This link is also visible in aggregate data; those countries that have invested most in ICT also have the largest share of patents in ICT (Figure 2.12).
Figure 2.12. ICT investment is accompanied by rapid innovation in ICT
United States
Japan
Canada
Australia
United Kingdom
Sweden
Spain
Portugal
Netherlands
Italy
IrelandGreece
Germany
France
DenmarkBelgium
Austria
10
12
14
16
18
20
22
24
26
28
30
0 10 20 30 40Share of ICT patents in all patents, 1998
ICT
as
a %
of
non-
resi
dent
ial i
nves
tmen
t, 19
98
Correlation = 0.59T-statistic = 2.84
Source: ICT investment from Figure 2.1; ICT patents from OECD (2002), Measuring the Information Economy.
A final important aspect of the business environment relates to the availability of appropriate skills. Countries with a high share of highly skilled ICT workers in total occupations have had higher investment in ICT than those with fewer highly skilled ICT workers (OECD, 2003a). Moreover, cross-country panel regressions indicated that the share of ICT investment in total investment in a country is associated with the share of the population that has attained tertiary education.8 The important role of education and skills is also borne out in firm-level studies (see Chapter 3 and Chapters 6 to 13). There are several reasons why education and skills are important for ICT investment. For example, certain skills may be needed to use ICT in an effective way throughout the workplace; their availability in different OECD countries may thus affect the returns that can be drawn from investment in ICT. Moreover, specific skills may be needed for the implementation of ICT, e.g. in companies designing software and e-business solutions. Finally, the availability of human capital affects a firm’s capability to assess new technological opportunities (see Chapter 3).
8. These results are available from the authors.

33
Does it help to have an ICT sector?
Is investment in ICT affected by having a large ICT-producing sector? Previous OECD work suggested that having an ICT sector may not be a prerequisite for growth based on new technology (OECD, 2001a). Indeed, several countries (notably Australia and Canada) that are characterised by high ICT investment and use, as well as high multi-factor productivity (MFP) growth, do not have a large ICT sector. And one or two other countries that do have a large ICT sector have not been among the high growth countries of the 1990s.
On the other hand, cross-country panel regressions of ICT investment shares suggest that having a large ICT-producing sector has a positive and significant impact on the share of investment that is devoted to ICT.9 This may simply be because the ICT-producing sector itself invests considerably in ICT. But it may also be because having a strong ICT sector may help firms that wish to use ICT, since their close co-operation might have advantages when developing technologies for specific purposes and in assisting in the process of co-invention. Moreover, having a strong ICT sector may help generate the skills and competencies needed to benefit from ICT use.
All of this shows that having an ICT-producing sector may be beneficial to growth in the digital economy for more reasons than the direct benefits of ICT production. However, this does not imply that countries without such a sector should try to deliberately develop an ICT-producing sector. Proximity to hardware producers may not be as important for ICT users as proximity to software producers and service providers, which are useful to firms needing skills and advice to implement ICT-related changes. Moreover, much of the production of ICT hardware is highly concentrated, because of its large economies of scale and high entry costs. A hardware sector can therefore not simply be set up, and only a few countries will have the comparative advantage to succeed in it.
2.3 Diffusion in the OECD area - some conclusions
This chapter has shown that ICT has diffused rapidly across OECD countries, and is continuing to spread despite the recent slowdown. However, large cross-country differences persist, also across firms and activities within countries. The United States, Canada, New Zealand, Australia, the Nordic countries and the Netherlands typically have the highest rate of diffusion of ICT. From this perspective, it is likely that the largest economic impacts of ICT should also be found in these countries. However, previous studies have shown that having the equipment or networks is not enough to derive economic impacts. Other factors play a role and countries with equal rates of diffusion of ICT will not necessarily have similar impacts of ICT on economic performance. In addition, it is possible to invest too much in ICT and some studies suggest that firms have sometimes over-invested in ICT in an effort to compensate for poor performance.
The chapter has pointed to several factors affecting the diffusion of ICT, namely:
� Factors related to the direct costs of ICT, e.g. the costs of ICT equipment, telecommuni-cations or the installation of an e-commerce system.
� Costs and implementation barriers related to enabling factors and the ability of the firm to absorb new technologies. These factors include the availability of know-how and qualified personnel, the scope for organisational change and the capability of a firm to innovate.
9. These results are available from the authors.

34
� Factors related to risk and uncertainty, e.g. the security of doing business online or the uncertainty of payments, delivery and guarantees online.
� Factors related to the nature of the businesses. ICT is a general purpose technology, but is more appropriate for some activities than for others. ICT may not fit in all contexts and specific technologies, such as electronic commerce, may not be suited to all business models.
� Factors related to competition and the regulatory environment. A competitive environment is more likely to lead a firm to invest in ICT, as a way to strengthen performance and survive, than a more sheltered environment. Moreover, competition puts downward pressure on the costs of ICT. Excessive regulation in product and labour market may also make it more difficult for firms to draw benefits from investment in ICT and may thus hold back such spending.
These categories point to several areas that are relevant for policy development, most of which have already been the subject of OECD work over the past years. For example, measures to increase competition can help bring down costs, effective labour market and education policies may help reduce skill shortages, and risk and uncertainty may be tackled by the development of a well designed regulatory framework.

35
REFERENCES
Ahmad, N. (2003), “Measuring Investment in Software”, STI Working Paper 2003/6, OECD, Paris.
Aizcorbe, A. (2002), “Why are Semiconductor Prices Falling So Fast? Industry Estimates and Implications for Productivity Measurement”, Finance and Economics Discussion Series 2002-20, Federal Reserve Board, Washington DC.
Bartelsman, E. A. Bassanini, J. Haltiwanger, R. Jarmin, S. Scarpetta and T. Schank (2002), “The Spread of ICT and Productivity Growth — Is Europe Really Lagging Behind in the New Economy?”, Fondazione Rodolfo DeBenedetti.
Bresnahan, T.F. and S. Greenstein (1996), “Technical Progress and Co-Invention in Computing and the Use of Computers”, Brookings Papers on Economic Activity: Microeconomics, pp. 1-77.
Caselli, F and Coleman, W.J. (2001), “Cross-country Technology Diffusion: The Case Study of Computers”, NBER Working Papers No. 8130, National Bureau of Economic Research, February.
Guerrieri, P., C. Jona-Lasinio and S. Manzocchi (2003), “Searching for the determinants of IT Investment: Panel data evidence on European countries”, Department of Economics – University of Rome La Sapienza, mimeo, December.
Gust, C. and J. Marquez (2002), “International Comparisons of Productivity Growth: The Role of Information Technology and Regulatory Practices”, International Finance Discussion Papers, No. 727, Federal Reserve Board, May.
Nicoletti, G., S. Scarpetta and O. Boylaud (1999), “Summary Indicators of Product Market Regulation with an Extension to Employment Protection Legislation”, OECD Economics Department Working Paper No. 226, Paris.
OECD (2002a), Measuring the Information Economy 2002, http://www.oecd.org/sti/measuring-infoeconomy.
OECD (2002b), “Non-tariff Barriers in the ICT Sector: A Survey”, TD/TC/WP(2001)44/FINAL, OECD, Paris, September.
OECD (2002c), Purchasing Power Parities and Real Expenditures, 1999, Paris.
OECD (2002d), “Productivity and Innovation: The Impact of Product and Labour Market Policies”, OECD Economic Outlook, No. 71, June, pp. 171-183, Paris.
OECD (2003a), OECD Communications Outlook 2003, Paris.
Solow, R.M. (1987), “We’d Better Watch Out”, New York Times, July 12, Book Review, No. 36.

36
Tachibana, T. (2000), “The Survey on ICT Usage and E-Commerce on Business in Japan”, paper presented 2000 at the Voorburg Group on Services Statistics meeting, Madrid, 18-22 September.
Van Ark, B., R. Inklaar and R.H. McGuckin (2002), “Changing Gear Productivity, ICT and Services: Europe and the United States”, Research Memorandum GD-60, Groningen Growth and Development Centre, Groningen, http://www.eco.rug.nl/ggdc/homeggdc.html.

37
CHAPTER 3
THE DECISION TO ADOPT INFORMATION AND COMMUNICATION TECHNOLOGIES (ICT): FIRM-LEVEL EVIDENCE FOR SWITZERLAND
Heinz Hollenstein Swiss Federal Institute of Technology (ETHZ), Institute for Business Cycle Research (KOF), Zurich
Austrian Institute of Economic Research (WIFO), Vienna
Abstract
The paper aims, firstly, at explaining the decision of firms to adopt ICT. To this end, we present econometric estimates of a basic and extended version of a model of adoption, where the second approach investigates the role of new workplace organisation in adoption decisions. The second goal of the analysis is to derive from the model estimates a set of policy recommendations. The empirical analysis of the adoption decision yields a quite robust pattern of explanation, which is largely in line with theory. Estimation of the extended model shows that the introduction of new work practices favours the adoption of ICT; however, we also find evidence for the reverse relationship, indicating that ICT adoption and organisational change are, to some extent, complements. Based on the explanatory part of the study, we identified six areas of policies suited to promoting the adoption of ICT: enhancing the human capital base of the economy, enhancing the flexibility of the labour market, securing more intensive competition, fostering innovative activities, increasing macroeconomic stability, and improving the regulatory framework for e-business. The results thus support a framework-oriented policy design rather than a more activist policy orientation.

38
3.1 Introduction
Recent contributions to the literature have shown that an ICT producing sector is not a precondition to capture the benefits of “information and communication technologies” (ICT). Timely diffusion of new technology or, from a firm’s point of view, its adoption is at least as important to promoting macroeconomic growth (see, for example, Pilat and Lee, 2001; van Ark et al., 2002). From this perspective, understanding the factors determining technology adoption becomes highly relevant also from the policy point of view.
In the present paper, we aim, firstly, at explaining the decision of firms to adopt (elements of) ICT. To this end, we present econometric estimates of a basic as well as an extended version of a model of adoption, where the second approach investigates the role of new workplace organisation in adoption decisions. The second goal of the analysis is to derive from the model estimates a set of policy recommendations and to compare them with those formulated in the OECD growth project (OECD, 2001a).
The investigation is primarily based on a “rank model” of technology diffusion, which, in explaining inter-firm differences of adoption time and intensity, emphasises differences among firms with respect to the profitability potential of technology adoption arising from the heterogeneity of firms. In addition, we take account of information spillovers from users to non-users which are the main element of the “epidemic model” of technology diffusion (for a survey of diffusion models, see Karshenas and Stoneman, 1995; Geroski, 2000).
The data used in this analysis stem from a survey on the use of ICT we conducted in the Swiss business sector in autumn 2000. We have at our disposal firm-specific information on, for example, the time period of adoption of nine technology elements, the proportion of employees using specific technologies, the range of application of Internet and Intranet respectively, the objectives of and obstacles to the adoption of ICT, etc. Moreover, we have information referring to various structural characteristics of the firm (size, industry affiliation, etc.) as well as a large number of variables pertaining to workplace organisation which may serve as determinants of the adoption decision.
The set-up of the paper is as follows: in Section 3.2, we provide some information on the data and describe briefly the time profile of the diffusion of various elements of ICT in the Swiss economy. Section 3.3 is devoted to the analysis of the adoption decision of firms. The theoretical background is presented in subsection 3.3.1, followed by the specification and estimation of the basic and the extended version of the model of ICT adoption. In Section 3.4, we turn to the policy analysis, and, finally, we draw some conclusions.
3.2 Database and time profile of the diffusion of ICT
3.2.1 Data
The analysis is based on firm data of the Swiss business sector collected in a survey carried out in autumn 2000. The questionnaire was addressed to a sample of 6 717 firms with five or more employees. The sample is (disproportionally) stratified by 28 industries and three industry-specific firm size classes, with full coverage of large firms. The response rate of about 40% (2 641 firms) is quite satisfactory in view of the very demanding questionnaire. The data are corrected for “unit” as well as for “item” non-response (for the methods used see Donzé, 1998).

39
The questionnaire1 yielded data on the time profile of the introduction of nine ICT elements, the intensity of use of ICT, the assessment of a number of objectives pursued by introducing ICT and the importance of factors impeding its application, the specific use of ICT elements such as Internet or Intranet and the impact of ICT on efficiency and labour requirements. Besides, we received information on the adoption of new work practices (team-work, job rotation, etc.) and training activities, which presumably are relevant when a firm decides on the adoption of ICT. Finally, we dispose of information about structural characteristics of firms such as size, industry affiliation, propensity to export, human capital endowment, etc. which may also serve as determinants of ICT adoption.
3.2.2 Time path of diffusion
Table 3.1 contains some information on the time path of adoption of nine elements of ICT in the Swiss business sector. The degree of diffusion in 2003 (percentage of firms using a certain technology in the year 2000 or planning to use it till 2003) and the velocity of diffusion (increase of the percentage of firms using a certain ICT element in the period 1994-2003) vary quite strongly among these technologies. For example, diffusion of PCs, being already an “old” technology, was quite high in 1994 and increased since then (compared to other ICT elements), by “only” 55%. On the other hand, “new” technologies, in particular Internet and related technologies (e-mail, Intranet, Extranet), were used by a very small fraction of firms in the mid-nineties, but the use of these technologies “exploded” in the second half of the last decade. The growth of the degree of diffusion, as planned by the surveyed firms for the period 2000/2003, has slowed down for most ICT elements primarily reflecting the high level of diffusion already reached in 2000. In the years to come, diffusion will thus primarily take place within rather than across firms.
Table 3.1. Diffusion of information and communication technologies (ICT)
(Percentage of business sector firms having adopted a specific ICT element; 2003: planned adoption)
Degree of diffusion (%)
Technology element 1994 1997 2000 2003
Digital assistants 7.2 16.2 32.6 38.4
Laptop 12.0 27.1 46.2 50.2
PCs, workstations, terminals 60.4 80.2 93.8 94.6
E-mail 3.0 23.2 86.1 90.2
Internet 1.7 16.1 78.1 88.8
EDI 5.2 15.7 40.1 50.9
LAN/WAN 17.8 34.4 53.4 57.9
Intranet 1.8 8.0 27.0 35.6
Extranet 0.6 3.1 13.3 24.4
Note: Weighted to account for deviations of the sample structure from that of the underlying population, different response rates by “size-industry cells” of the sample and for “unit“ non-response (see Donzé, 1998).
Source: Arvanitis and Hollenstein (2002).
1. The questionnaire can be downloaded from http://www.kof.ethz.ch.

40
A characterisation of the various technology elements according to the criteria “degree of diffusion” and “velocity of diffusion” leads to the following mapping: technologies with a high degree of diffusion are PCs (with low velocity) as well as e-mail and Internet (very high velocity); ICT elements with a medium degree of diffusion are LAN/WAN, EDI, Laptop and to some extent also Digital Assistants (high velocity, particularly EDI), and, finally, technologies with still low diffusion are Intranet and Extranet (very high velocity).
These tendencies vary by firm size, strongly in case of network technologies (EDI, LAN/WAN, Intranet, Extranet), not very pronounced for other ICT elements. There are also differences among industrial sectors with “modern” service industries (business services, R&D/IT firms, banking/ insurance) and high-tech manufacturing taking the lead; low-tech manufacturing and “traditional services” are in a medium position, whereas the construction sector is clearly lagging. Compared to other countries, diffusion of ICT in Switzerland (i.e. the business sector) is high; Switzerland ranks behind the USA and Scandinavia, but is (perhaps together with the Netherlands) ahead of other European countries (see Arvanitis and Hollenstein, 2002 and Arvantis, et al., 2003, based on various sources such as OECD, 2001b or Deiss, 2002 as well as Hollenstein et al., 2003).
3.3 Explaining the adoption of ICT
3.3.1 Theoretical background
3.3.1.2 Approach
The main objective of this section is to formulate an equation explaining the decision to adopt ICT based on a set of mainly firm-specific factors determining the profitability of new technology. Within the general conceptual framework proposed by Karshenas and Stoneman (1995) our approach belongs primarily to the category of “rank models” emphasising the heterogeneity of firms as determinant of inter-firm diffusion patterns. However, we also take into account some elements of the “epidemic model” which stresses information spillovers from adopters to non-adopters. In the rank model, it is assumed that potential users of a new technology differ in important dimensions so that some firms obtain a greater return from new technology than others. The larger the net advantage resulting from adoption, the stronger the tendency to introduce a technology early and intensively.
3.3.1.3 Basic model
We distinguish several groups of factors which potentially influence a firm’s profitability from adopting new technology and therefore the decision to introduce it at a certain point in time. A first one includes a set of anticipated benefits of new technology (for the case of ICT see e.g. Brynjolfsson and Hitt, 2000; OECD, 2000) such as savings of capital and labour, general efficiency gains, reduced transaction costs, higher flexibility, improvement of product quality in a broad sense (e.g. variety, convenience), etc. For this group of variables we expect a positive influence on the adoption decision, i.e. they will favour early and/or intensive use of the new technology.
A second category of variables, which are negatively related to adoption, refers to anticipated barriers to the use of new technology. We identify five main types of such hindrances: unfavourable financial conditions, human capital restrictions, information and knowledge barriers (reflecting, for example, uncertainties with respect to the performance of ICT); organisational and managerial barriers (resistance to new technology; insufficient awareness of managers of the potential gains of ICT), and, finally, sunk cost barriers. This latter factor refers to the substitution costs that firms have to incur in

41
order to introduce the new technology, for example, in case of insufficient compatibility of ICT with existing equipment or organisation.2
The firm’s ability to absorb knowledge from external sources is another major determinant of technology adoption in a similar way as it supports innovation performance. There are mainly two aspects of a firm’s absorptive capacity for new technologies: firstly, the firm’s overall ability to assess technological opportunities in or around its fields of activity in terms of products and production techniques, which depends primarily on its endowment of human and knowledge capital (Cohen and Levinthal, 1989). Secondly, learning effects that may arise from earlier use of ICT or a predecessor of a specific ICT element which already embodies constituent elements of later applied, more advanced vintages (see e.g. Colombo and Mosconi, 1995; McWilliams and Zilberman, 1996). Both elements of absorptive capacity should be positively related to early and intensive use of ICT.
Whereas these aspects of absorptive capacity are specifically related to internal conditions, the standard epidemic model of technology diffusion stresses information spillovers from users to non-users of the technology. This model basically states that a firm’s propensity to adopt a technology at a certain point in time is positively influenced by the present (or lagged) degree of its diffusion in the economy as a whole or in the industry to which the firm is affiliated to. This proposition captures also network externalities which are important in the case of ICT3 .
The adoption of ICT may also be affected by (product) market conditions under which firms are operating, particularly the competitive pressure they are exposed to. In markets where competition is stronger, demand elasticities can be expected to be higher because of the existence of close substitutes, thus driving firms to innovative activity or rapid technology adoption (see e.g. Majumdar and Venkataraman, 1993).4 In case of (small) open economies like Switzerland international competition is a particularly effective way of forcing firms to adopt the most efficient way of producing, or to temporarily evade competitive pressure through product innovations (see e.g. Bertschek, 1995). We do not include a measure of concentration as a determinant of ICT adoption, since (game-)theoretic models do not come up with unambiguous results (Reinganum, 1989), and because the usual measures of concentration, which refer to the home market only, are not helpful in case of small open economies like Switzerland.
Firm size is an explanatory variable which is used in most studies of adoption.5 It captures size-specific variables which are not explicitly modelled, such as the capacity to absorb risks related to future developments of ICT, economies of scale in e-commerce, etc. Finally, industry dummies represent demand and supply side factors influencing adoption time and intensity which are, to some extent, common to most firms of an industry (e.g. trend growth of demand, (technological) oppor-
2. See e.g. Cainarca et al. (1990) or Link and Kapur (1994) for a treatment of these aspects based on the case
of flexible manufacturing systems, or the results of a survey on obstacles to the adoption of e-commerce (WITSA, 2000).
3. For a discussion of the various brands of this approach see e.g. Geroski (2000).
4. In accordance with this line of reasoning, we have proxied competitive pressure through the intensity of price and non-price competition on the product market, and postulated a positive relationship to inno-vative activity (see Arvanitis and Hollenstein, 1994) and technology adoption“ (Arvanitis and Hollenstein, 2001).
5. The same holds for firm age. However, we do not include this variable, since the theoretical arguments with respect to the role of firm age are not conclusive (positive experience effects vs. negative adjustment cost effects in case of older firms, see e.g. Dunne, 1994).

42
tunities determining extent and limits of the use of ICT, etc.). Industry dummies are thus used to control for unobserved variable bias.
3.3.1.4 Extended model
The past decade saw an impressive increase of adoption not only of ICT but also of new workplace organisation (see e.g. OECD, 1999). It is thus not surprising that the investigation of the impact of the two factors on variables such as efficiency and productivity, labour and skill demand, etc. has become a prominent field of research (for an overview see, for example, Murphy, 2002). Whereas most studies have tried to establish a direct link between organisational change and the use of ICT on productivity growth,6 some recent studies have stressed the complementarity of the adoption of new modes of workplace organisation and the introduction or a more intensive use of ICT. In this view, investment in ICT is more productive if accompanied by suitable organisational innovations, and the productivity gains from adjusting workplace organisation are higher if it is supported by investments in ICT (see e.g. Bresnahan et al., 2002; Brynjolfsson and Hitt, 2000; Bertschek and Kaiser, 2001; McKinsey, 2001). Against this background, we formulate an extended model of ICT adoption which complements the basic approach by variables representing (the change of) workplace organisation.
3.3.2 Basic model: specification and empirical results
3.3.2.1 Adoption variables
The database allows the construction of various adoption variables. A first category of measures refers to the time period of adoption of ICT, a second one to the intensity of use of ICT at a given point in time (see Table 3.2).
Time period of adoption
We dispose of information on five time periods of adoption for the nine ICT elements listed in Table 3.1. In addition, there is information on the actual and planned use of the Internet for various objectives (e-selling, e-procurement, etc.). We shall present results for two variables. The first one refers to the adoption of Internet (INTERNET) which is specified as a variable with five response levels, ranging from value 4 for the earliest adoption period (up to 1994) to value 0 for firms not even planning adoption up to 2003. The second variable captures the adoption of Internet-based selling (ESALES); it has three response levels with value 2 representing adoption in the time period up to the year 2000, value 1 for 2001-2003 (planned use) and zero for “no use till 2003”.
Intensity of adoption
To construct a variable for adoption intensity, we used information on the within-firm diffusion of certain elements of ICT (PC’s, Internet, Intranet, etc.). We present again results for two variables. Firstly, we calculated a four level ordinal measure of the overall ICT intensity (ICTINT), defined as the number of ICT elements (as listed in Table 3.1) already in use in the year 2000, ranging from an intensity level 3 (seven to nine ICT elements) to level 0 (less than three elements; zero included). The
6. For an empirical analysis of the direct link between organisational change and productivity growth at the
micro-level see e.g. Ichniovski et al. (1997) or Black and Lynch (2000). The (direct) impact of the use of ICT on productivity growth is investigated at the aggregate level (see e.g. Jorgenson and Stiroh, 2000; Jorgenson 2001; Colecchia and Schreyer, 2001) as well as at the firm-level (see e.g. Lichtenberg, 1995; Brynjolfsson and Hitt, 1995; Greenan and Mairesse, 1996).
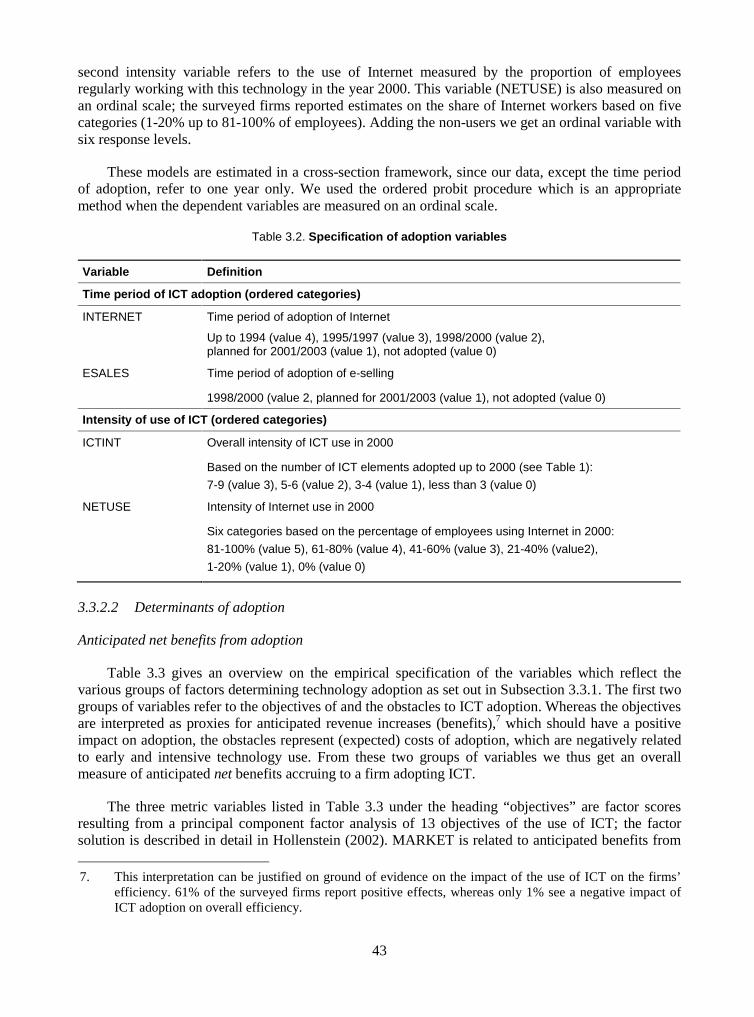
43
second intensity variable refers to the use of Internet measured by the proportion of employees regularly working with this technology in the year 2000. This variable (NETUSE) is also measured on an ordinal scale; the surveyed firms reported estimates on the share of Internet workers based on five categories (1-20% up to 81-100% of employees). Adding the non-users we get an ordinal variable with six response levels.
These models are estimated in a cross-section framework, since our data, except the time period of adoption, refer to one year only. We used the ordered probit procedure which is an appropriate method when the dependent variables are measured on an ordinal scale.
Table 3.2. Specification of adoption variables
Variable Definition
Time period of ICT adoption (ordered categories)
INTERNET Time period of adoption of Internet
Up to 1994 (value 4), 1995/1997 (value 3), 1998/2000 (value 2), planned for 2001/2003 (value 1), not adopted (value 0)
ESALES Time period of adoption of e-selling
1998/2000 (value 2, planned for 2001/2003 (value 1), not adopted (value 0)
Intensity of use of ICT (ordered categories)
ICTINT Overall intensity of ICT use in 2000
Based on the number of ICT elements adopted up to 2000 (see Table 1):
7-9 (value 3), 5-6 (value 2), 3-4 (value 1), less than 3 (value 0)
NETUSE Intensity of Internet use in 2000
Six categories based on the percentage of employees using Internet in 2000:
81-100% (value 5), 61-80% (value 4), 41-60% (value 3), 21-40% (value2),
1-20% (value 1), 0% (value 0)
3.3.2.2 Determinants of adoption
Anticipated net benefits from adoption
Table 3.3 gives an overview on the empirical specification of the variables which reflect the various groups of factors determining technology adoption as set out in Subsection 3.3.1. The first two groups of variables refer to the objectives of and the obstacles to ICT adoption. Whereas the objectives are interpreted as proxies for anticipated revenue increases (benefits),7 which should have a positive impact on adoption, the obstacles represent (expected) costs of adoption, which are negatively related to early and intensive technology use. From these two groups of variables we thus get an overall measure of anticipated net benefits accruing to a firm adopting ICT.
The three metric variables listed in Table 3.3 under the heading “objectives” are factor scores resulting from a principal component factor analysis of 13 objectives of the use of ICT; the factor solution is described in detail in Hollenstein (2002). MARKET is related to anticipated benefits from
7. This interpretation can be justified on ground of evidence on the impact of the use of ICT on the firms’
efficiency. 61% of the surveyed firms report positive effects, whereas only 1% see a negative impact of ICT adoption on overall efficiency.

44
ICT use on the revenue side capturing, besides increasing sales in general, benefits from higher quality, more variety, providing complementary services, better market presence and stronger customer-orientation. COST stands for expected cost reductions in general, and, more specifically, for advantages to be gained from improving internal communication and decision-making as well as optimising the production process. The factor INPUT covers anticipated advantages from improving external relationships on the input side (labour market, co-operation with suppliers) as well as with respect to technology. These three variables capture to a large extent the benefits accruing from the use of ICT as proposed by the literature.
The model covers all five categories of obstacles to the adoption of ICT we mentioned above. The variable NOUSE captures the fact that in some instances there is only a very limited potential for using ICT. The other four variables reflecting impediments to the use of ICT are again the result of a principal component factor analysis (see Hollenstein, 2002). These variables, with the exception of INVCOST which stands for problems of financing ICT investments, can be interpreted, primarily, as proxies for uncertainties, knowledge deficiencies and information problems as well as adjustment costs related to the introduction of ICT (TECH, KNOWHOW, COMPAT). They thus capture determinants of adoption which, according to Karshenas and Stoneman (1995), are neglected in most studies examining this topic.
Absorptive capacity and learning
The firm’s ability to absorb knowledge from external sources, which we expect to be positively related to early and intensive adoption, is represented by three variables measuring the availability of human and knowledge capital as well as innovative activity (see Table 3.3): EDUC, the share of employees with qualifications at the tertiary level, is a general measure of the firm’s ability to assess technological opportunities and to use external knowledge for own innovative activities. INNOPD, a dichotomous measure indicating whether a firm launched product innovations in a three years reference period, is used to take into account the well-known proposition according to which internal innovative activity is a precondition for successfully using external knowledge. The third variable we employ to capture absorptive capacity is more directly linked with ICT; we use the share of employees which in 1999 attended ICT-oriented training courses (TRAINING) as a proxy for the firm’s specific knowledge in ICT.8
In a cross-section framework, it is not so easy to find suitable proxies for measuring learning from previous vintages of ICT. Variables which could be used to measure learning in the field of ICT in general, such as, for example, the intensity of use of PC’s at an early stage, are problematic, because they are determined by similar factors as measures reflecting ICT intensity at a later stage. Therefore, we explored the role of learning only in one specific case where an earlier and a later vintage of technology are clearly linked: we hypothesise that experience with electronic data interchange (EDI), measured by the dummy variable EDI97 (adoption of EDI up to 1997), favours adoption of Internet-based e-selling (although adjustment costs incurred by the substitution of the new for the old technology work in the opposite direction). Information spillovers (“epidemic effects”) are represented by the rate of diffusion of ICT at industry level in 1997; the percentage share of firms that are more ICT-intensive than the average-firm of the corresponding industry (EPIDINT) is used in explaining the time period of adoption of Internet and the two variables measuring ICT intensity in the year 2000 (lagged epidemic effect). In case of e-selling, where, in our dataset, the first adoption period refers to 1998/2000, “epidemic” effects are proxied by the industry-specific degree of diffusion in 2000 (EPIDSALE; contemporaneous effect).
8. Since some training is necessary when ICT is introduced, this variable is not strictly exogenous.

45
Table 3.3. Basic model of ICT adoption: specification of the explanatory variables
Variable Description Sign
Objectives of ICT adoption
(Scores of a principal component factor analysis of the importance of 13 objectives of ICT adoption as assessed by firms on a five-point Likert scale)
MARKET Improving quality, increasing variety, etc. of products, improving customer-relations, increasing market presence and sales +
COSTRED Improving internal processes, communication and/or decision-making, reducing costs
+
INPUT Improving position with respect to input factors (technology, suppliers of inputs, labour) +
Obstacles to ICT adoption
(The first four variables are scores of a principal component factor analysis of the importance of 12 obstacles to ICT adoption as assessed by firms on a five-point Likert scale)
INVCOST Technology too expensive, investment volume to large, lack of finance -
KNOWHOW Lack of ICT personnel, information and management problems -
TECH Technological uncertainties, performance of ICT not sufficient -
COMPAT Insufficient compatibility with existing ICT and work organisation -
NOUSE Limited potential to use ICT (firms’ assessments on a five-point scale) -
Human capital, absorptive capacity
EDUC Share of employees with qualifications at the tertiary level (%) +
TRAINING Share of employees having attended ICT-oriented training courses (%) +
INNOPD Introduction of new products (yes/no) in the period 1998-2000 +
Experience
EDI EDI already in use in 1997 +
Epidemic effects (alternative measures depending on the variable to be explained)
EPIDINT Share of firms (%) with above-average use of ICT in 1997 in the industry the company is affiliated to (used for explaining INTER, ICTINT and NETUSE)
+
EPIDSALE Share of firms (%) active in e-selling in the year 2000 in the industry the company is affiliated to (used for explaining ESALES)
+
Export
X, X2 Sales share of exports (%) and its square + and -
Firm size
S 5 dummy variables based on the number of employees: S5-19, S20-49, S50-99, S100-199, S200-499 (reference group: firms with 500 and more employees)
-
Industry affiliation
Fifteen dummies: food, textiles/clothing, wood/paper/printing, non-metallic minerals/base metals, metal products, machinery/vehicles/electrical machinery, electronics/instruments/watchmaking, wholesale trade, retail trade/personal services, hotels/restaurants, transport/telecommunication, banking/insurance, IT-/R&D services, business services (reference group: energy/water/construction).
?
Competition
Competitive pressure on the (international) product market is proxied by the firm’s export pro-pensity (export-to-sales ratio). We use a specification with a linear and a quadratic term (variables X,

46
X2) assuming that beyond a certain export intensity competitive pressure increases less than pro-portionally, or does not increase any more (positive sign for X, negative sign for X2).
Firm size and industry affiliation
Firm size (S), which we expect to be positively related to early and intensive adoption, is represented by dummy variables referring to five size classes based on the number of employees, with large firms (500 and more employees) as reference group. In this specification, a negative sign indicates a positive size effect. Finally, we include fourteen industry dummies which should capture differences between industries with respect to technological opportunities and demand prospects, and are used as controls for an unobserved variable bias.
3.3.2.3 Empirical results
Time period of ICT adoption
Estimation results referring to the time period of adoption of Internet and Internet-based selling respectively (variables INTERNET and ESALES) are presented in column 1 and 2 of Table 3.4. All categories of explanatory variables have a statistically significant impact on the timing of adoption decisions, and the overall fit of the model is satisfactory. The core of our adoption model is thus confirmed.
Among the anticipated benefits, those related to market- and customer-orientation (MARKET) are the most important ones in case of both dependent variables;9 it is not surprising that this is particularly pronounced in case of ESALES. Cost- and input-related benefits (COSTRED, INPUT) are only relevant for explaining the adoption of Internet. Among the obstacles to adoption, insufficient opportunities to benefit from an application (NOUSE) are an important factor in both cases. With regard to other impediments, Internet and Internet-based selling are different: for the former, investment costs and financial restrictions, and, even more, knowledge problems (deficiencies with respect to qualified manpower, management as well as information problems) are important (INVCOST, KNOWHOW). In the latter case, we find, against our prediction, a positive sign for technological uncertainty (TECH), presumably reflecting the particularly high uncertainty of adoption of e-selling at an early stage (see WITSA, 2000). We find no evidence for compatibility problems (COMPAT); high adjustment costs seem to be unimportant when only a single element of ICT is introduced.
We also find that the various dimensions of absorptive capacity as well as the propensity to export strongly stimulate early adoption of the Internet, but only weakly that of e-selling (variable INNOPD only). This difference may be compensated by the strong effect of information spillovers (“epidemic effects”) we find in case of ESALES, which reflects a high pressure to keep up with competitors. In addition, learning from the use of a predecessor technology (EDI) also plays an important role in fostering early adoption of e-selling; this result implies that the adjustment costs a firm incurs when it substitutes Internet-based selling for using EDI are lower than the benefits to be captured from this change.
Larger firms have a higher propensity to adopt these two technologies. However, beyond a threshold of 200 employees, we cannot find any significant size-specific differences of adoption.10 We 9. The coefficients of the variables measuring the objectives of ICT adoption can be directly compared since
their values are standardised; the same holds for the obstacles to adoption.
10. See Hollenstein (2002) for an in-depth analysis of the role of firm size in adoption decisions.

47
find a strong correlation between industry effects (which are not reported in Table 3.4) and epidemic effects, which is not surprising since the latter are defined at the industry level. At the empirical level, it is thus difficult to disentangle epidemic effects from unspecified factors we assume to be captured by industry dummies (demand prospects, technological opportunities, etc.).
Table 3.4. Time period and intensity of the adoption of ICT (ordered probit estimates)
Explanatory Time period of adoption Intensity of adoption Variable INTERNET ESALES ICTINT NETUSE
Objectives MARKET .334*** .547*** .158*** .281*** (.04) (.05) (.04) (.04) COSTRED .182*** -.048 .375*** .212*** (.04) (.05) (.04) (.04) INPUT .200*** .067 .206*** .194*** (.04) (.05) (.04) (.04) Obstacles INVCOST -.092** -.052 -.121*** -.100*** (.04) (.05) (.04) (.04) KNOWHOW -.131*** -.038 -.085** -.160** (.04) (.05) (.04) (.04) TECH .028 .112** .022 .006 (.04) (.05) (.04) (.04) COMPAT .026 .044 .061* .034 (.04) (.05) (.04) (.04) NOUSE -.069* -.100** -.127*** -.102*** (.04) (.05) (.03) (.03) Absorptive capacity EDUC .319** .100 .991*** 1.68*** (.10) (.10) (.22) (.21) TRAINING .008*** .003 .014*** .014*** (.00) (.00) (.00) (.00) INNOPD .298*** .274*** .438*** .269*** (.09) (.10) (.08) (.09) Experience EDI /// .315*** /// /// (.10) Epidemic effects EPIDINT .026*** /// .035*** .027*** (.00) (.00) (.00) EPIDSALE /// .071*** /// /// (.01) Exports X .027*** .007 .017*** .018*** (.01) (.01) (.00) (.01) X2 -.000*** -.000 -.000*** -.000*** (.00) (.00) (.00) (.00)
(continued on next page)

48
Table 3.4. Time period and intensity of the adoption of ICT (ordered probit estimates) (continued)
Explanatory Time period of adoption Intensity of adoption Variable INTERNET ESALES ICTINT NETUSE
Firm size S5-19 -1.47*** -.971*** -2.42*** .017 (.19) (.20) (.19) (.18) S20-49 -.488*** -.328*** -.756*** .148* (.10) (.10) (.10) (.18) S50-99 -.731*** -.410** -1.05*** .324* (.20) (.21) (.20) (.19) S100-199 -.584*** -.521** -.449*** .100 (.20) (.21) (.20) (.19) S200-499 -.308 -.244 -.037 .122 (.22) (.22) (.21) (.20) N 2641 2641 2641 2641 Slope test 241.8*** 124.6*** 119.3*** 466.4*** McFadden R2 .144 .122 .212 .147 % concordance 74.5 74.9 80.0 76.2
Note: Each column includes the estimated parameters with standard errors in brackets. The statistical significance of the estimates is indicated with ***, ** and * representing the 1%, 5% and 10% level respectively. The estimates for the intercepts and the 15 industry dummies are omitted.
Intensity of use of ICT
The results of estimations for the intensity of use of ICT, based on an overall measure (ICTINT, i.e. the number of ICT elements) as well as on the intensity of Internet use (NETUSE, i.e. the proportion of employees working with Internet) are also depicted in Table 3.4 (column 3 and 4). The pattern of explanation for the two intensity variables is similar. More importantly, they do not much differ from that we found for the timing of adoption decisions. However, the explanatory power of the model explaining the intensity of adoption is higher.
Nevertheless, we also find some differences of the explanatory pattern between intensity and timing variables. Firstly, on the benefit side of anticipated profitability, market- and customer-orientation are less important in case of both intensity variables, and cost-oriented factors become more relevant when the intensity of use is to be explained. Secondly, among the obstacles to adoption, investment costs and funding restrictions are now a bigger problem, indicating that in case of an already larger ICT infrastructure investment needs are increasing (transition to more complex, network-oriented technologies). Similarly, limitations of the potential to use ICT are more of a problem in case of intensity variables, again a plausible result. If, for some firms, the introduction of one ICT element is already not very promising, this holds even more when a more intensive application of ICT is considered. With respect to knowledge and information problems, the comparison of intensity variables and those depicting the first use of ICT yields mixed results; the largest negative impact found refers to the intensity of use of the Internet, the lowest for the introduction of e-selling. Thirdly, the capacity to absorb external knowledge is distinctly a more important factor determining adoption when intensity measures are used as dependent variable; this result is plausible in view of the more complex problems to be solved when a large set of ICT elements is already in use. A similar argument holds for compatibility problems which are, against our prediction, positively correlated with ICT intensity. However, this result is not implausible; if the ICT infrastructure is already highly developed, incompatibilities and high adjustment costs may be more prominent obstacles than in case of ICT adoption from scratch. Fourthly, big firms have a much larger advantage in the adoption process in case of ICTINT, the most complex adoption variable. Interestingly, and not implausible, we do not find any size effects (or even some advantages for medium-sized firms) for the within-firm diffusion of the Internet (NETUSE).

49
3.3.3 Extended model: the role of workplace organisation
3.3.3.1 Model specification
The extended model, which includes measures of new workplace organisation as additional explanatory variables, is used to clarify the role organisation plays in the process of ICT adoption. It should also yield some indications with regard to potential complementarities of ICT adoption and organisational innovations. At this stage of analysis, we no longer consider the time period of adoption as dependent variable; we only present results for the overall ICT intensity (ICTINT).
New workplace organisation is captured by various elements of workplace organisation as well as some measures of organisational change in the period 1995-2000 (see Table 3.5). Firstly, we take into account three types of (new) work practices, i.e. team-working (TEAM), job rotation (ROTATE) and multi-skilling (MSKILL). The first two variables measure the diffusion within the firm of team-working and job rotation respectively on a six-point ordinal scale (value 5 representing “very common practice”, value zero standing for “does not exist”). MSKILL represents the degree of diversity of tasks an “average worker” performs (five-point scale; “very high” to “very low”). We expect that the existence of these work practices favours intensive adoption. Similarly, a high degree of worker’s participation in decision-making is assumed to impact positively on the adoption of ICT. The two variables we use to measure the role of workers in decision-making processes are factor scores resulting from a principal component factor analysis of seven dimensions of work tasks for which the surveyed firms assessed the balance of decision-making power between workers and managers (five-point scale, ranging from “decision is the sole responsibility of workers” to “manager decides alone”); for details, we again refer to Hollenstein (2002). We identified two factors: PRODDEC pertains to dimensions of work which are related to the production process (design of work process, distribution of tasks among workers, work pace, etc.), USERDEC is primarily related to customer-oriented tasks (e.g. regular contact with customers, contact with clients in case of complaints). Two other variables reflect the process of decentralising decision-making power within a firm which took place in many companies during the second half of the nineties: DELCOMP measures whether there has been an increase of delegation of decision-making power towards the workers (yes/no), whereas FLAT stands for a flattening of the hierarchical structure (reduction of the number of management layers yes/no). Both variables are expected to favour adoption of ICT.
As an alternative to the use of this set of variables that capture specific dimensions of (a change of) workplace organisation, we constructed a composite measure of new work practices, applying a procedure proposed by Bresnahan et al. (2002): The values of TEAM, ROTATION, MSKILL, PRODDEC, USERDEC, DELCOMP and FLAT are standardised and simply added up.

50
Table 3.5. Extended model of ICT adoption: specification of explanatory variables related to workplace organisation
Variable Description Sign
Elements of new work practices
TEAM Team-working (six-point scale: “very common practice”, ..., “does not exist”) +
ROTATION Job rotation (six-point-scale: “very common practice”, ..., “does not exist”) +
MSKILL Diversity of tasks performed by the “average worker” (5-point scale: “very high”, ..., “very low”)
+
Distribution of decision-making power
(Scores of a principal component factor analysis of the distribution of decision-making power between workers and managers with respect to seven dimensions of work as assessed by firms on a five-point Likert scale)
High values are associated with high participation of workers in decision-making
PRODDEC Production-oriented dimensions of work +
USERDEC Customer-oriented dimensions of work +
Decentralisation of decision-making since 1995
DELCOMP Increase of delegation of decision-making to workers (yes/no) +
FLAT Reduction of the number of hierarchical levels (yes/no) +
Alternative specification: Aggregate measure of work organisation
ORG Sum of standardised values (mean 0, standard deviation 1) of TEAM, ROTATION, MSKILL, PRODDEC, USERDEC, DELCOMP, FLAT; rescaled into four ordinal categories
+
3.3.3.2 Empirical results
Table 3.6 shows results for the two specifications of the extended model (several organisational dimensions in column 1, composite measure of organisation in column 2) using ICTINT (number of ICT elements) as the dependent variable.11 It turned out that “organisation” exerts a statistically significant influence on ICT adoption in both specifications of the model. Among the various organisational dimensions, team-working, decentralised decision-making in the production process and lowering the number of hierarchical layers are the relevant aspects of workplace organisation for explaining the use of ICT. Estimates, not reported here, point to some interaction between workplace organisation, on the one hand, and education, training and innovation on the other.12
11. Since our survey yielded information about organisational matters only for firms with at least 20
employees (against a threshold of five employees in the other sections of the survey), the dataset is reduced to 1 667 firms (as against 2 641 observations in the original sample). Estimates of the basic model using the smaller sample yielded a pattern of explanation which is very similar to that from the larger sample.
12. If EDUC, TRAINING and INNOPD are removed from the equation, the coefficient of ORG increases substantially (from 0.21 to 0.31).

51
These results, however, may be biased because of an endogeneity problem. This would be the case if the adoption of new workplace organisation depends, among other factors, from the intro-duction of ICT. A straightforward way to handling this problem is to lag the organisation variable in the ICT equation,13 assuming, as proposed by Bresnahan et al. (2002), that organisational adjustments take longer than changes of technology. In this view, organisation is considered as a quasi-fixed factor in the short run, whereas it is held that new work practices and ICT adoption are complements in the longer run; the same holds, according to these authors for human resource development and product innovation. Estimates of an equation where the variable ORG is lagged by three years yield a slightly better model fit than those based on a contemporaneous specification. In addition, the impact of organisational change increases (see Hollenstein, 2002). The pattern of explanation, however, remains the same as before, and we find again some interaction between organisation and the variables re-flecting human capital and innovation.
Table 3.6. Workplace organisation and the adoption of ICT (ordered probit estimates)
Explanatory variable ICT ORG Organisation Disaggregated TEAM .130*** /// /// (.03) ROTATION .022 /// /// (.04) MSKILL -.065 /// /// (.06) PRODDEC .123** /// /// (.05) USERDEC .041 /// /// (.05) DELCOMP .044 /// /// (.05) FLAT .250** /// /// (.11) Aggregated ORG /// .210*** /// (.05) ICT /// .307*** (.06) Objectives of ICT adoption MARKET .127*** .117** /// (.05) (.05) COSTRED .341*** .339*** /// (.05) (.05) INPUT .120** .133*** /// (.05) (.05) Obstacles to ICT adoption INVCOST -.165*** -.160*** /// (.05) (.05) KNOWHOW -.091* -.078 /// (.05) (.05) TECH -.042 -.043 /// (.05) (.05) COMPAT .045 .042 /// (.05) (.05) NOUSE -.049 -.049 /// (.04) (.04) (continued on next page)
13. Since some of the variables representing new workplace organisation (i.e. DELCOMP and FLAT) pertain
to changes during the five-year period preceding the measurement of the dependent variable ICTINT, the variable “organisation” is already lagged to some extent even in a contemporaneous specification of the extended model.

52
Table 3.6. Workplace organisation and the adoption of ICT (ordered probit estimates) (continued)
Explanatory variable ICT ORG Objectives of new work organisation PERS /// /// .392*** (.05) COSTFLEX /// /// .140*** (.05) Obstacles to new work organisation HUMAN /// /// .017 (.05) ADJDIFF /// /// -.017 (.05) ADJCOST /// /// -.082* (.05) NONEED /// /// -.125*** (.04) Absorptive capacity EDUC 1.56*** 1.56*** 1.67*** (.33) (.33) (.31) TRAINING .011*** .011*** .013*** (.00) (.00) (.00) INNOPD .415*** .432*** .380*** (.10) (.10) (.10) Epidemic effects EPIDINT .032*** .034*** /// (.00) (.00) Exports X .012** .013* -.007
(.01) (.01) (.01) X2 -.000* -.000* .000
(.00) (.00) (.00) Firm size S5-19 -1.61*** -1.74*** -.797** (.37) (.36) (.35) S20-49 -1.44*** -1.52*** -.616*** (.20) (.20) (.19) S50-99 -1.06*** -1.12*** -.457** (.20) (.20) (.19) S100-199 -.475** -.482*** -.374* (.21) (.20) (.19) S200-499 -.040 -.039 -.186 (.21) (.22) (.20) N 1667 1667 1667 Slope test 136.5*** 127.4*** 85.7** McFadden R2 .161 .157 .098 % concordance 76.1 75.6 71.1
See notes of Table 3.4.
3.3.3.3 Reverse causality?
Specification of a model of adoption of new workplace organisation
A more fundamental way of taking account of endogeneity is to look for evidence of the reverse causality, i.e. to investigate whether the adoption of ICT exerts an influence on (the change of) workplace organisation. To this end, we specify an equation explaining the adoption of new work practices, where ICT is one of the explanatory variables. The basic structure of this “organisation model” is the same as that of the “ICT model”; it is only the content of the two categories of variables representing anticipated benefits and costs of adoption which makes the difference.
Detailed information about a number of dimensions of objectives of and obstacles to organi-sational change is condensed to a few variables by means of principal component factor analysis. As a

53
result of this exercise, documented in detail in Hollenstein (2002), we obtain two variables representing anticipated benefits of new work practices as well as three factors depicting barriers to change of workplace organisation (Table 3.7). Among the benefits, the variable PERS represents the potential of exploiting previously untapped human resources by reorganising work processes (strengthening motivation, use of specific knowledge of workers, etc.), and COSTFLEX stands for expected gains from reducing costs and enhancing organisational flexibility to adjust to changes of a firm’s environment. Insufficient readiness on the workers and management side is one of the potential barriers preventing reorganisation (HUMAN). The other obstacles refer to difficulties encountered in the adjustment process, that is slow speed and high costs of organisational adjustments (variables ADJDIFF and ADJCOST). Another variable to take account of is NONEED which controls for the fact that, in some instances, it may not be necessary at all to change the firm’s organisation (this could be the case, for example, in small firms with simple and flexible organisational structures).
Table 3.7. Anticipated net benefits of new work practices
Variable Description Sign
Objectives
(Scores of a principal component factor analysis of the importance of six objectives of the introduction of new work practices as assessed by firms on a five-point Likert scale)
PERS Making use of specific knowledge of workers, improving their motivation, shortening decision-making processes
+
COSTFLEX Reducing costs, enhancing flexibility to adjusting to changes of the environment +
Obstacles
(The first three variables are scores of a principal component factor analysis of the importance of seven obstacles to the introduction of new work practices as assessed by firms on a five-point Likert scale)
HUMAN Insufficient training of workers, low attention of managers with respect to organisational innovations, resistance to change
-
ADJDIFF Slow adjustment process, insufficient information on organisational matters -
ADJCOST High adjustment costs and problems of financing the organisational change -
NONEED Adjustment of organisation not really necessary -
Empirical results
The results of estimating this model, which explains the adoption of new workplace organisation, are shown in column 3 of Table 3.6. It turns out that anticipated benefits of and (some of the) obstacles to organisational change exert a statistically significant influence on the adoption of new work practices. The same holds for formal qualifications of the personnel, training and innovativeness as well as for firm size. Moreover, a high ICT intensity, specified as a contemporaneous variable, also favours the introduction of new work practices. The “organisation model” is thus confirmed.
However, in the same way as in case of the “ICT model”, we are confronted with an endogeneity problem, this time with respect to the ICT variable. Therefore, we estimated an equation where the measure of ICT intensity is lagged by three years. The results, not reported here, show that the model fit is about the same as in case of the contemporaneous specification; however, the impact of the ICT variable decreases substantially. Besides, there are indications of some interaction between ICT

54
intensity (whether lagged or contemporaneous), on the one hand, and education, training and inno-vation on the other.14
The results we obtained by estimating the “organisation model” and those we found with the extended version of the “ICT model” point in the same direction: ICT intensity and workplace organisation are interrelated; we find statistically significant results for both directions of causality. In addition, there is some evidence for interactions between both ICT intensity and (new) workplace organisation, on the one hand, and, on the other, education, training and innovative activity. Another finding is related to the time structure of the relationship between the adoption of ICT and new work practices; the lagged effect of the “organisational variable” on ICT adoption turns out to be stronger than the contemporaneous one, whereas the opposite is true in modelling the adoption of new work practices. This result seems to be in line with the assumption of a more sluggish change of organisations as compared to technology adoption (i.e. the organisation as a quasi-fixed factor in the short run).
3.3.4 Summary and assessment of the empirical results
The basic model of ICT adoption is strongly confirmed by the data. Anticipated benefits (in particular, improved customer-orientation and cost-oriented advantages) and high costs of adoption (in the first instance, investment costs, financial restrictions and knowledge deficiencies), absorptive capacity (human capital, innovative activity), information spillovers and learning effects, competition and, finally, firm size are the core determinants of ICT adoption. The extended model shows that the introduction of new workplace organisation (in particular, team-working, decentralised decision-making and flattening the hierarchical structure of the firm) is also an important factor facilitating ICT adoption. Attempts to control for endogeneity problems related to “organisation” by introducing lags or reversing causality (i.e. ICT as one of the factors determining organisational innovations) showed that the adoption of ICT and that of new workplace organisation are interrelated. In addition, both variables are correlated, to some extent, with human capital input and innovation performance.
The empirical explanation of the adoption of ICT and new work practices presented in this paper is based on a single-equation framework. In view of the presumed endogeneity problems, it would be sensible to check the results by means of simultaneous estimations. This procedure might also give some indication of the magnitude of the impact of the introduction of ICT on organisational innovations as compared to that of new work practices on ICT adoption. Although this line of research is recommended, we would be quite surprised when it would alter the basic conclusions. As far as the time structure of the adoption of ICT and the introduction of new work practices is concerned, cross-section analyses clearly are of limited value, although our model has some time dimension represented by the lagged explanatory variables. To get more reliable results, a dynamic modelling of the adoption of ICT and new work practices would be required. However, panel estimates are not feasible with the data at hand.
Taken as a whole, our results are consistent with those of some recent studies which found that ICT, new workplace organisation and human capital are complementary factors to increasing the efficiency of production and the quality of products (see e.g. Bresnahan et al., 2002; Brynjolfsson and Hitt, 2000; Bertschek and Kaiser, 2001).
14. If EDUC, TRAINING and INNOPD are removed from the equation, the coefficient of ICTINT
(contemporaneous specification) increases substantially, i.e. from 0.31 to 0.45.

55
3.4 Policy
The relevance of the various factors determining the adoption of ICT and the introduction of new workplace organisation, as identified in our empirical analysis, enables us to draw some policy conclusions. In this respect, the variables referring to the role played by different aspects of absorptive capacity and by the obstacles to adoption are particularly informative. We identify the following six policy areas to be important for promoting the diffusion of ICT.
Firstly, strengthening and enhancing the human capital base of the economy is crucial for the adoption of ICT and new work practices. According to the model estimates, formal qualifications as well as training (on- and off-the-job) exert a strongly positive effect on ICT adoption; in addition, skill deficiencies (lack of qualified personnel as well as management problems which, at least to some extent, are also due to know-how problems), significantly impede early and intensive adoption of ICT. Moreover, information spillovers are an important driver of ICT adoption; the spillover potential can be exploited to a particularly large extent if a firm’s workforce is highly qualified. In view of these results, education policy and specific measures to foster ICT-training are core policy areas in the present context. This holds true even if, at present, there is no (general) shortage of ICT-skills.
As far as training is concerned, policy is confronted with a well-known externality problem, since ICT skills, to a large extent, are “general skills” which do not lose their value when a worker leaves a firm. In these circumstances, the incentive for firms to invest in ICT-oriented training is negatively affected, and “poaching” could be an alternative firm strategy to secure ICT skills. From the policy point of view, there is a risk of underinvestment in ICT-oriented training, which might be serious since in case of rapidly developing technologies (like ICT) training is particularly important as compared to basic educational qualification. Moreover, underinvestment in ICT-training might be even larger in case of SMEs, since they cannot offer, to the same degree as large companies, career perspectives (and other opportunities) to newly-trained employees which could encourage them to stay with the firm.
Secondly, as shown in the empirical analysis, measures facilitating organisational change at the workplace are beneficial to the diffusion of ICT. The benefits firms expect from such changes are strongly related to making better use of untapped human resources and increasing flexibility. However, we do not find evidence for resistance on the workers’ side being an important obstacle to the adoption of new workplace organisation. This result presumably reflects the fact that, in Switzerland, labour markets are only weakly regulated (Nicoletti et al., 2000), unions are weak in most industries, the relations between management and firm-internal labour representatives are ruled by trust, and, finally, the participation of workers in decision-making, although informal, is quite high (Arvanitis et al., 2002). Therefore, in many countries, reforms facilitating the smooth working of the labour market, as well as measures to strengthening trust between employers and employees (and their representatives) within the firm to support organisational change could significantly contribute to the diffusion of ICT.
Thirdly, more intensive competition on the markets for hardware, software and telecom-munication services could reduce the investment and current costs of ICT, which, according to our estimations, are significant obstacles to early and intensive adoption. This result is in line with cross-country evidence (see e.g. OECD, 2001b). Moreover, intensified competition on the product market enforces firms to introduce ICT to realise the significant cost reductions which, according to the model estimates, can be realised through the adoption of these technologies. Policies strengthening compete-tion in general and, more specifically, on the markets for ICT products and services could thus significantly contribute to the rapid diffusion of ICT.

56
Fourthly, the econometric work presented here shows that firms which are innovative in general are also early and intensive adopters of ICT. This result implies that policies fostering innovation in general can also be used to promote the diffusion of ICT. In particular, policies supporting innovative activities of SMEs could be helpful. In the Swiss case, correcting for capital market imperfections would be a sensible way to contribute to this objective, as has been shown in empirical work based on innovation survey data (see Arvanitis and Marmet, 2002).
Fifthly, sound macroeconomic policies can substantially contribute to the diffusion of ICT. This proposition is strongly supported by evidence from Switzerland where the economy, to a large extent because of too restrictive fiscal and monetary policy, did hardly grow between 1991 and 1997 (see Arvanitis et al., 2001). Based on an analysis of data stemming from four rounds of the Swiss Innovation Survey covering the period 1988/90 to 1997/99 we could show that innovative activity is strongly influenced by the business cycle (positive correlation). It seems not far-fetched if we conclude that the same holds in case of investments in ICT, and thus the diffusion of these technologies.
Finally, there are some other problems that can be addressed by policy measures, which are not covered by our firm data base. An important one, as shown, for example, by the results of pilot surveys on e-commerce conducted in thirteen EU countries in 2001 as well as those of OECD work on e-commerce (Deiss, 2002; OECD, 2000), are difficulties related to the security of transactions. Pre-liminary results from a similar survey for Switzerland, based on the same sample we used for the present study, confirm these results (Hollenstein et al., 2003). Policy should thus provide a legal and regulatory framework which helps to build trust in e-transactions (consumer protection, securing privacy, etc.).
The empirical results thus support a framework-oriented policy rather than a more activist policy design: strengthening the human capital base of the economy, securing competition and correcting for some market imperfections, improving the regulatory environment and macroeconomic stabilisation are the core areas of a policy designed to promote the diffusion of ICT.
3.5 Summary and conclusions
Since recent research at macro-level has shown that the productivity effects of the diffusion of ICT are (at least) as important as those of ICT production, it has become highly relevant, also from the policy point of view, to understand why a firm introduces (some of) these technologies. It is against this background, that, firstly, we tried to explain empirically the decision of firms to adopt ICT and explored the role organisational innovations play in the adoption process. In a second step, the empirical results were used to derive some policy recommendations. The analysis is based on survey data stemming from a large sample of Swiss firms.
The adoption behaviour of firms in the field of ICT is characterised by a basic pattern of explanation which is quite robust across various model estimations based on different adoption variables. All categories of explanatory variables postulated by theory seem to be relevant, although not to the same extent. Most important are anticipated benefits (in particular, by improving customer-relations, increasing product quality and variety and optimising production processes) and costs of adoption (in the first place, too large volume and high costs of investment as well as know-how and management problems). Other key factors to explaining the adoption of ICT are the firm’s ability to absorb knowledge from other companies and institutions, information spillovers from early adopters, experience with earlier vintages of a certain technology, and (international) competitive pressure.

57
Firm size, which is one of the most prominent variables included in models of adoption, is usually positively correlated with early and intensive use of a new technology. In case of ICT, we get a more differentiated picture: in general, we find positive size-effects only up to a threshold of about 200 employees; for some specific ICT elements, for example Internet, we find that medium-sized companies are even more intensive users than large firms.
In addition to these firm-specific determinants, there is also evidence for industry effects. The probability of adoption is clearly above-average in some high-tech industries, in the trading sector as well as in “modern” service industries. This result reflects, among other factors, differences regarding technological opportunities and demand prospects.
Estimates of an extended version of our model yielded strong evidence for the influential role (new) workplace organisation plays in decisions related to the adoption of ICT. Team-working, decentralised decision-making and flattening hierarchical structures are the most relevant organisational dimensions favouring the adoption of ICT, whereas we do not find an impact of, for example, job rotation or multi-skilling. To circumvent the problem of endogeneity of workplace organisation as an explanatory variable, we introduced time lags and investigated the reverse causality running from the adoption of ICT to the introduction of new work practices; we also find evidence for this reverse relationship. Moreover, the use and development of human resources as well as innovative activities turn out to be correlated to some extent with the adoption of ICT as well as with new workplace organisation. These findings are consistent with those of some recent studies which found that ICT, new workplace organisation, human capital investment and innovative activity are complementary elements of a strategy to increase the efficiency of production and to generate product innovations. However, further research is required to investigate in more detail the relationship between these seemingly complementary variables. Particularly, the use of simultaneous estimation techniques (ICT, organisation and human capital as endogenous variables) and panel estimations (to detect the dynamic relationships between these factors) could yield further insights.
Based on the results of the explanatory part of the study, we could identify six areas of policies suited to promoting the adoption of ICT: enhancing the human capital base of the economy in general and, despite the current oversupply of ICT-workers, with regard to ICT competencies; enhancing the flexibility of the labour market to facilitate structural change and organisational innovations; securing more intensive competition on product markets in general and, specifically, on the markets for ICT goods and services; fostering innovative activities, in the first place of SMEs (correcting capital market imperfections, etc.); increasing macroeconomic stability; and, finally, improving the regulatory framework for e-business (security of transactions, guaranteeing privacy, consumer protection, etc.). The empirical results thus support a framework-oriented policy design rather than a more activist policy orientation. These conclusions are more or less in line with the recommendations on policies to seize the benefits of ICT as formulated in the OECD growth project (OECD, 2001a).

58
REFERENCES
van Ark, B., R. Inklaar and R.H. McGuckin (2002), “Changing Gear – Productivity, ICT and Service Industries: Europe and the United States”, Paper presented at the 2nd ZEW Conference on the Economics of Information and Communication Technologies, Mannheim, June 24-25.
Arvanitis, S., M. Bezzola, L. Donzé, H. Hollenstein and D. Marmet (2001), “Innovationsaktivitäten in der Schweizer Wirtschaft – Eine Analyse der Ergebnisse der Innovationserhebung 1999”, Strukturberichterstattung Nr. 5, Staatssekretariat für Wirtschaft (seco), Bern.
Arvanitis, S. and H. Hollenstein (1994), “Demand and Supply Factors in Explaining the Innovative Activity of Swiss Manufacturing Firms. An Analysis Based on Input-, Output- and Market-oriented Innovation Indicators”, Economics of Innovation and New Technology, 3, 15-30.
Arvanitis, S. and H. Hollenstein (2001), “The Determinants of the Adoption of Advanced Manufacturing Technology. An Empirical Analysis Based on Firm-level Data for Swiss Manufacturing”, Economics of Innovation and New Technology, 10, 377-414.
Arvanitis, S. and H. Hollenstein (2002), “Die Wirtschaft in der Informationsgesellschaft”, in: Swiss Federal Office of Statistics (ed.), Informationsgesellschaft Schweiz: Standortbestimmung und Perspektiven, Neuchâtel.
Arvanitis, S., Hollenstein, H. and D. Marmet (2003), “Die Schweiz auf dem Weg zu einer wissensbasierten Ökonomie: Eine Bestandesaufnahme”, Strukturberichterstattung Nr. 17, Staatssekretariat für Wirtschaft (seco), Bern.
Arvanitis, S. and D. Marmet (2002), “Finanzierung von Innovationsaktivitäten – Eine Empirische Analyse anhand von Unternehmensdaten”, Strukturberichterstattung Nr. 9, Staatssekretariat für Wirtschaft (seco), Bern.
Bertschek, I. (1995), “Product and Process Innovation as a Response to Increasing Imports and Foreign Direct Investment”, Journal of Industrial Economics, 43(4), 341-357.
Bertschek, I. and U. Kaiser (2001), “Productivity Effects of Organizational Change: Microeconometric Evidence”, Centre for European Economic Research, Discussion Paper No.01-32, Mannheim.
Black, S. and L. Lynch (2001), “How to Compete: The Impact of Workplace Practices and Information Technology on Productivity”, Review of Economics and Statistics, 83(3), 434-445.
Bresnahan, T.F., E. Brynjolfsson and L.M. Hitt (2002), “Information Technology, Workplace Organisation, and the Demand for Skilled Labor: Firm-level Evidence”, Quarterly Journal of Economics, 112(1), 339-376.
Brynjolfsson, E. and L.M. Hitt (1995), “Information Technology as a Factor of Production: The Role of Differences Among Firms”, Economics of Innovation and New Technology, 3, 183-200.
Brynjolfsson, E. and L.M. Hitt (2000), “Beyond Computation: Information Technology, Organizational Transformation and Business Performance”, Journal of Economic Perspectives, 14(4), 23-48.

59
Cainarca G.C., M.G. Colombo and S. Mariotti (1990), “Firm Size and the Adoption of Flexible Automation”, Small Business Economics, 2(2), 129-140.
Cohen W.M. and D.A. Levinthal (1989), “Innovation and Learning: The two Faces of R&D”, Economic Journal, 99(4), 569-596.
Colecchia, A. and P. Schreyer (2001), “ICT Investment and Economic Growth in the 1990s: Is the United States a Unique Case? A Comparative Study of Nine OECD Countries”, STI Working Papers 2001/7, OECD: Paris.
Colombo M. and R. Mosconi (1995), “Complementarity and Cumulative Learning Effects in the Early Diffusion of Multiple Technologies”, Journal of Industrial Economics, 43(1), 13-48.
Deiss, R. (2002), “E-Commerce in Europe”, Statistics in Focus, Theme 4, 12/2002, Eurostat, Luxembourg.
Donzé, L., (1998), “Développement et entretien du ‘Panel d’entreprise’ du KOF/ETHZ. Une étude méthodologique”, Zurich, septembre (downloadable from http://www.dplanet.ch/users/ldonze).
Dunne T. (1994), “Plant Age and Technology Use in U.S. Manufacturing Industries”, Rand Journal of Economics, 25(3), 488-499.
Geroski, P. (2000), “Models of Technology Diffusion”, Research Policy, 29, 603-625.
Greenan, N. and J. Mairesse (1996), “Computers and Productivity in France: Some Evidence”, NBER Working Paper 5836, Cambridge, MA.
Hollenstein, H. (2002), “Determinants of the Adoption of Information and Communication Technologies (ICT). An Empirical Analysis Based on Firm-level Data for the Swiss Business Sector”, Swiss Institute for Business Cycle Research (KOF), Working Paper No. 60, Zurich, July (downloadable from http://www.kof.ethz.ch).
Hollenstein, H., N. Sydow and M. Wörter (2003), “Die Verbreitung von Informations- und Kommunikationstechnologien und E-Commerce in der Schweizer Wirtschaft. Ergebnisse der KOF-Panelumfrage vom Herbst 2002”, Swiss Federal Office for Statistics (ed.), Neuchatel.
Ichniovski, C., K. Shaw and G. Prennushi (1997), “The Effects of Human Resource Management Practices on Productivity”, American Economic Review, 87(3), 291-313.
Jorgenson, D.W. (2001), “Information Technology and the U.S. Economy”, American Economic Review, 91(1), 1-32.
Jorgenson, D.W. and K.J. Stiroh (2000), “Raising the Speed Limit: US Economic Growth in the Information Age”, Economics Department Working Papers No. 261, OECD: Paris.
Karshenas M. and P. Stoneman (1995), “Technological Diffusion”, in: P. Stoneman (ed.), Handbook of the Economics of Innovation and Technological Change, Oxford: Blackwell.
Lichtenberg, F.R. (1995), “The Output Contributions of Computer Equipment and Personal: A Firm-level Analysis”, Economics of Innovation and New Technology, 3, 201-217.
Link A.N. and P. Kapur (1994), “A Note on the Diffusion of Flexible Manufacturing Systems Technology”, Economics Letters, 46, 357-362.
Majumdar S.K. and S. Venkataraman (1993), “New Technology Adoption in US Telecommunications: The Role of Competitive Pressures and Firm-level Inducements”, Research Policy, 22, 521-536.

60
McKinsey (2001), US Productivity Growth 1995-2000. Understanding the Contribution of Information Technology Relative to Other Factors, McKinsey Global Institute, Washington, D.C., October.
McWilliams B. and D. Zilberman (1996), “Time of Technology Absorption and Learning by Using”, Economics of Innovation and New Technology, 4(2), 139-154.
Murphy, M. (2002), “Industry Issues: Organisational Change and Firm Performance”, STI Working Papers 2002/14, OECD, Paris.
Nicoletti, G., S. Scarpetta and O. Boylaud (2000), “Summary Indicators of Product Market Regulation with an Extension to Employment Protection Legislation”, Economics Department Working Papers No. 226, OECD.
OECD (1999), “New Enterprises Work Practices and Their Labour Market Implications”, in: OECD Employment Outlook 1999, OECD, Paris, S. 179-221
OECD (2000), The Economic and Social Impacts of Electronic Commerce: Preliminary Findings and Research Agenda, Paris.
OECD (2001a), The New Economy: Beyond the Hype, the OECD Growth Project, Paris.
OECD (2001b), OECD Science, Technology and Industry Scoreboard 2001 – Towards a Knowledge-based Economy, Paris.
Pilat, D. and F.C. Lee (2001), “Productivity Growth in ICT-Producing and ICT-Using Industries: A Source of Growth Differentials in the OECD?”, STI Working Papers 2001/4, OECD: Paris.
Reinganum J.F. (1989), “The Timing of Innovation: Research, Development and Diffusion”, in: R. Schmalensee and R. Willig (eds.), Handbook of Industrial Organisation, Vol. 1, Elsevier Science Publishers, New York.
WITSA (2000), International Survey of E-Commerce 2000, The World Information Technology Services Alliance, London.
61
CHAPTER 4
ICT INVESTMENT IN OECD COUNTRIES AND ITS ECONOMIC IMPACTS
Nadim Ahmad, Paul Schreyer and Anita Wölfl1 Organisation for Economic Co-operation and Development
Abstract
This chapter examines the measurement of ICT investment and its role in economic growth. It explores the problems that exist in producing reliable measures of ICT investment and comparing them across countries. Particular attention is also given to the issues associated with the measure-ment and comparison of ICT prices. The chapter also discusses how measures of ICT investment and capital can be used to make a quantitative assessment of the economic impacts of ICT. Estimates of such impacts are presented for a range of OECD countries.
1. Statistics Directorate and Directorate for Science, Technology and Industry, respectively. This paper
reflects the view of the authors and not necessarily those of the organisation or its member countries.
62
4.1 Introduction
ICT has been a very dynamic area of investment over the past decade. This is mainly due to a steep decline in ICT prices, which has encouraged investment in ICT, at times shifting investment away from other assets. The capital deepening which results from investment in ICT is an important driver of economic growth. It establishes the infrastructure for the use of ICT (the ICT networks) and provides productive equipment and software to businesses. Measures of ICT investment are therefore of considerable interest in examining growth performance in OECD countries. The measurement of this indicator and its accuracy in comparing the extent of ICT diffusion across OECD countries, as well as the economic impacts from ICT investment are discussed in this chapter.
The chapter first discusses the measurement of ICT investment in current prices and the problems that exist in making such measures comparable across OECD countries. The third section discusses the prices that are required to examine trends in ICT investment over time and the specific problems this raises for international comparisons. The fourth section discusses how measures of ICT investment can be used to measure the economic impacts of ICT and presents estimates for a range of OECD countries. The final section draws some conclusions and points to work that is currently underway, at the OECD and elsewhere, to further improve the international comparability of measures of ICT investment.
4.2 Measuring ICT investment
Investment is usually estimated by statistical offices using business surveys specifically designed to capture investment. These surveys usually allow total investment to be disaggregated into a number of well established and well defined asset groups: plant & machinery, dwellings, vehicles and intangibles. This is not the case for investment in ICT, however, since no internationally agreed definitions currently exist. A first step towards comparable data would involve a definition of ICT products based on an international product classification list. A proposal for manufactured goods has been developed by the OECD Working Party on Indicators for the Information Society (WPIIS). This definition is close to being approved but, in its absence, comparisons of ICT investment will inevitably involve some degree of incomparability. Nevertheless, there is a broad understanding in the statistical community about the definition of ICT products, based largely on the criteria set out to define the ICT producing sector (see Chapter 2). As considerable effort has gone into producing this definition, the size of definitional differences in ICT investment should, in principle, be limited.
Investment in ICT
Comparability issues
Because ICT investment is only a subset of ICT products (since it reflects only expenditure on ICT products that satisfy the rules on investment of the basic system of national accounts or SNA) it should, in theory, be relatively easy to achieve international comparability. For example, expenditure on rental of office machinery (which is part of the ICT sector) will normally not be recorded as investment. In practice, ICT investment is typically divided into three components: IT equipment, communications equipment and software. These components represent the subset of ICT products that can usually be capitalised. Nevertheless, even when presented at this relatively aggregated level comparability problems remain.
One of the main problems reflects the delineation between the groups and also between other asset types. For example, the total value of software sold as a bundle with hardware may be recorded as either software or IT investment; depending on the value of each component. Moreover, the
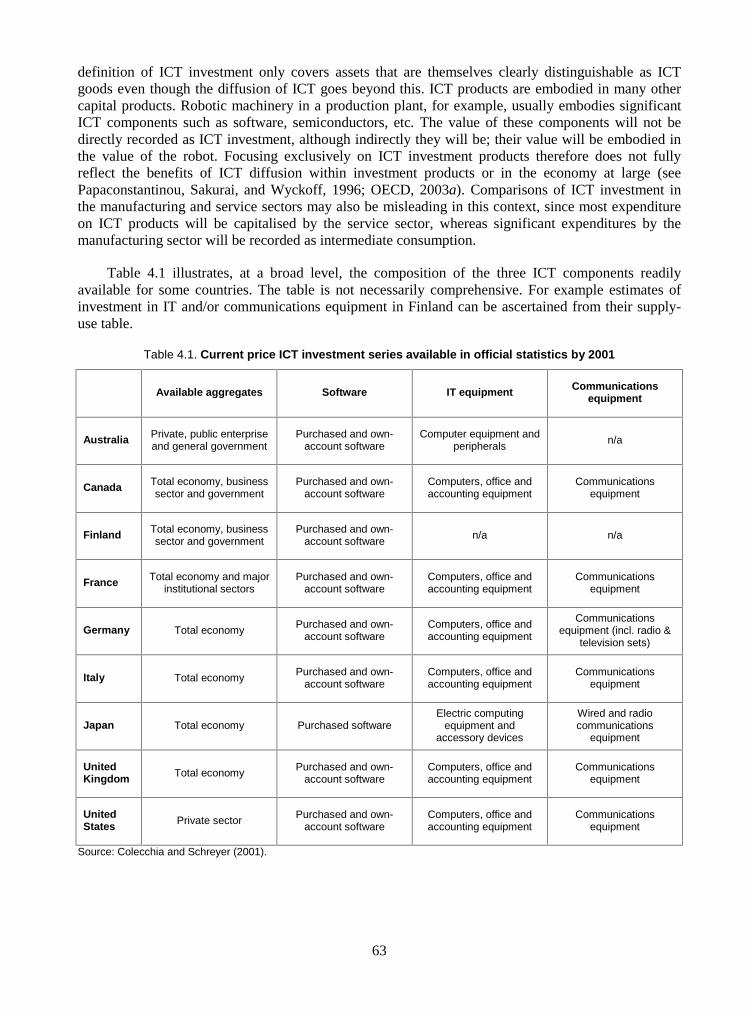
63
definition of ICT investment only covers assets that are themselves clearly distinguishable as ICT goods even though the diffusion of ICT goes beyond this. ICT products are embodied in many other capital products. Robotic machinery in a production plant, for example, usually embodies significant ICT components such as software, semiconductors, etc. The value of these components will not be directly recorded as ICT investment, although indirectly they will be; their value will be embodied in the value of the robot. Focusing exclusively on ICT investment products therefore does not fully reflect the benefits of ICT diffusion within investment products or in the economy at large (see Papaconstantinou, Sakurai, and Wyckoff, 1996; OECD, 2003a). Comparisons of ICT investment in the manufacturing and service sectors may also be misleading in this context, since most expenditure on ICT products will be capitalised by the service sector, whereas significant expenditures by the manufacturing sector will be recorded as intermediate consumption.
Table 4.1 illustrates, at a broad level, the composition of the three ICT components readily available for some countries. The table is not necessarily comprehensive. For example estimates of investment in IT and/or communications equipment in Finland can be ascertained from their supply-use table.
Table 4.1. Current price ICT investment series available in official statistics by 2001
Available aggregates Software IT equipment Communications equipment
Australia Private, public enterprise and general government
Purchased and own-account software
Computer equipment and peripherals
n/a
Canada Total economy, business sector and government
Purchased and own-account software
Computers, office and accounting equipment
Communications equipment
Finland Total economy, business sector and government
Purchased and own-account software
n/a n/a
France Total economy and major institutional sectors
Purchased and own-account software
Computers, office and accounting equipment
Communications equipment
Germany Total economy Purchased and own-account software
Computers, office and accounting equipment
Communications equipment (incl. radio &
television sets)
Italy Total economy Purchased and own-account software
Computers, office and accounting equipment
Communications equipment
Japan Total economy Purchased software Electric computing
equipment and accessory devices
Wired and radio communications
equipment
United Kingdom Total economy Purchased and own-
account software Computers, office and accounting equipment
Communications equipment
United States Private sector Purchased and own-
account software Computers, office and accounting equipment
Communications equipment
Source: Colecchia and Schreyer (2001).

64
The development of a product classification definition for ICT products is unlikely to prove a complete panacea for the problems noted above. International product classification lists are relatively static, changing usually every decade, but many products change much more quickly, particularly ICT products or products that embody significant ICT components. An additional problem arises from business accounting which, in many cases, allows some expenditure to be treated as intermediate costs although it would be recorded as investment under SNA93. This is particularly true for software produced on own-account (or in-house), which, for the first time, was recognised as investment in the 1993 revision of the SNA. Moreover, for software in particular, achieving a common understanding of investment across national statistical offices has proven to be difficult. This partly reflects differences in estimating own-account software but it also reflects differences in interpreting SNA93 rules for pre-packaged software. This is because pre-packaged software can be bought in a multitude of ways; e.g. via rental, licenses, bundles, embedded in hardware, etc. These problems are partly conceptual and partly practical.
For other ICT products, such as hardware and communications equipment, conceptual differences in assigning expenditure to investment or intermediate consumption are likely to be negligible, or non-existent, though practical measurement differences may exist. To what extent this is the case remains to be seen, since no comprehensive analysis of cross-country differences has been undertaken. Simple cross-country comparisons of intermediate consumption and investment in some ICT products, for example communications equipment, indicate that measurement differences may indeed explain some of the recorded differences in ICT investment rates across countries. Further work will be needed to fully establish this.
Investment in software
For software, considerable progress has been made in resolving the issues that affect international comparability. In November 2001, an OECD-Eurostat Task Force was set up to investigate the lack of comparability and to provide recommendations that could improve matters. For example, the Task Force found that methods used to estimate own-account software differed significantly. All countries surveyed estimated own-account software using an input method (taking the sum of all or some input components: intermediate consumption, wages, etc.) rather than using information from business surveys. This is because these were considered to provide unrealistically low estimates, owing to the fact that companies rarely capitalised own-account software. However, even though all countries used the same (input) method, significant differences remained. For example, not all countries included estimates of operating surplus in the value of own-account software. Others included only labour costs. Indeed even where the methods appeared to be the same this was often only superficial, as the definitions of labour costs often differed, as did the definitions of employees working on own-account production and the proportion of time spent by these individuals on own-account activities. For example in Australia, Denmark, Finland, the Netherlands and Sweden it was assumed that employees engaged in own-account production spent all of their time on this activity, whereas in Canada, France and the United States, it was assumed that only 50% of their time was spent on this activity (Ahmad, 2003).
The Task Force also found that estimates of investment in purchased software were largely incomparable. Figure 4.1 compares the ratio of purchased software capitalised by businesses and government as a percentage of total expenditure (intermediate and investment) on computer services (software). If one reasonably interprets the ratio as being a broad measure of the propensity of a statistical office to capitalise software, the obvious conclusion is that countries are not adopting the same rules for capitalising purchased software. Spain, for example, capitalises over 70% of all expenditure whereas the United Kingdom capitalises only about 5%.

65
Many national statistical offices have already begun to revise their estimates of software investment in line with the recommendations and methods advocated by the Task Force, although some of the recommendations remain the subject of debate (Ahmad, 2003). Adopting the recom-mendations in their entirety will have a considerable impact on the recorded levels of software investment in some countries. Figure 4.2 below compares estimates of software investment as a percentage of GDP based on the Task Force recommendations with currently published estimates. It points to considerable differences for the United Kingdom and, to a lesser extent, France. The higher estimate for Japan reflects the fact that currently published estimates of software investment in Japan do not include own-account software.
Figure 4.1. Investment ratios for purchased software
(share of total expenditure on computer services that is capitalised)
0
0.2
0.4
0.6
0.8
UK 99
France
98
Italy
98
Denm
ark 9
7
Czech
Rep
ublic 99
US 97
Nether
lands 9
8
Canad
a 98
Sweden
99
Greec
e 98
Spain 96
Country
Rat
io
Source: Ahmad (2003).

66
Figure 4.2. Comparison of estimates of investment in software
(as a percentage of GDP)
0.00
0.50
1.00
1.50
2.00
2.50
Greec
e 98
UK 99
Spain 96
Italy
98
France
95
Canad
a 98
Japan
99
Nether
lands 9
8
Austra
lia 9
8/99
Denm
ark 9
7
US 97
Sweden
99
�������
�
Estimates based on Task Force Recommendations
Official, National Accounts Estimates
Source: Ahmad (2003).
Estimates of ICT Investment
As described above, international comparisons of ICT estimates are hampered by the lack of comparability, or indeed availability, of estimates by statistical offices. To improve comparability, adjustments to national data sources, or estimates where no data exists, are often needed. The OECD’s capital services database is a step in this direction. It uses national data sources, where available, and where they are broadly consistent with the generally understood definition of ICT investment, supplementing this data from additional sources or estimates where this is not the case (see, Schreyer, Bignon and Dupont, 2003). For example, estimates of investment in software in the United Kingdom are consistent with the estimates obtained by applying the OECD Task Force recommendations, as shown in Figure 4.2 above, and not with the estimates produced by the UK Office for National Statistics.

67
Figure 4.3. ICT investment by assets in OECD countries, 2000
Percentage of non-residential gross fixed capital formation, total economy
0
5
10
15
20
25
30
35
Portugal
France
Austria
Irela
nd
Spain
Greec
eIta
ly
Finlan
d
Belgiu
m
Germ
any
Japan
Denm
ark
Austra
lia
Nether
lands
Canad
a
Sweden
United K
ingdom
United S
tate
s
%
Software Communications equipment IT equipment
Source: OECD Database on Capital Services.
The database shows that ICT investment accounts for a large part of total investment in OECD countries. In the Netherlands, Canada, the United Kingdom and Sweden, such investment exceeded 20% of all non-residential investment in 2000, while the share of such investment in the United States was approximately 30% in 2000 (Figure 4.3). In addition, this share has been growing considerably over the past decade, providing evidence that the importance of ICT investment has been increasing.2 For example, in Finland and Sweden, the share of ICT investment in total investment more than doubled between 1990 and 2000. In Australia, France, Canada, the United Kingdom, Greece, Denmark, Ireland and Japan, the corresponding growth rate over this period was also over 50%. The contribution of ICT investment to GDP is also significant and growing. By 2000, ICT investment accounted for between 2% and 4% of GDP (Figure 4.4), a share that has almost doubled since 1980 in almost all OECD countries (OECD, 2003a).
The OECD database on capital services is still relatively new but over time, the comparability of estimates can be expected to improve. This and the preceding discussion on measurement problems highlight the need for caution in interpreting statistics on ICT investment. For example, Figure 4.3 suggests that most ICT investment in Denmark is software, while the corresponding share in Belgium, Italy, Portugal and Spain is only around 30%.
It is difficult to explain these differences and they might simply point to the difficulties in measuring and compiling data on ICT investment in these countries. Ahmad (2003) looks specifically at the category of ICT investment that is most complicated in terms of measurement, i.e. software, and calculates alternative estimates of software investment based on harmonised estimation methods.
2. However, in 2001, the share of ICT investment declined in many OECD countries (see OECD, 2003a;
OECD, 2003b)

68
These alternative estimates are able to shed some light on the cross-country differences of ICT estimates used in the capital services database. For example, they propose a lower measure of own-account software for Denmark. Using these estimates reduces Denmark’s very high share of software investment to a percentage more comparable with those recorded for other countries.
Figure 4.4. The share of investment in ICT in total GDP, percentages
0.0
0.5
1.0
1.5
2.0
2.5
3.0
3.5
4.0
4.5
Franc
e
Portug
al
Irelan
d
Austri
aIta
ly
Ger
man
y
Finlan
d
Belgiu
mSpa
in
Gree
ce
Canad
a
United
Kin
gdom
Sweden
Denm
ark
Nethe
rland
s
Austra
lia
Japa
n
Unite
d Stat
es
1990
2001*
* Or latest available year. Source: OECD Database on Capital Services.
4.3 Measuring ICT prices
Measures of ICT expenditure at current prices are valuable for a number of indicators, such as the share of ICT in total investment or in GDP. For many other indicators, however, a volume measure is needed that controls for changes in the price level of ICT products. Price indices are therefore needed to deflate current-price expenditure data and to obtain ‘constant price’ measures. Constructing price indices for ICT products is a challenging task for statisticians. Due to rapid technological progress in the production of key ICT technologies, such as semi-conductors, and strong competitive pressure in their production, the prices of key technologies have fallen by between 15 and 30% annually over the second half of the 1990s. The rate of price decline was even more rapid from 1995 to 1999 as tech-nological progress was more rapid during this period and new micro-processors were introduced at a more rapid pace than prior to 1995 or after 1999.3
Hardware and communications equipment
Generally, price indices are constructed by comparing prices of sampled products between two periods in time. Two conditions have to be fulfilled for this to yield reliable estimates: the products in the sample have to be representative of a whole product group and they should be comparable between the two periods. Rapid technical change implies that neither condition is easily satisfied in the case of ICT goods such as computers: models change very rapidly and there is a risk of comparing two non-identical products. And if only prices of those models that are available in both periods are compared, 3. An international roadmap for the production of semiconductors is published by the International
Technology Roadmap for Semi-conductors (ITRS). See http://public.itrs.net/

69
there is a risk of using a non-representative sample if the price movements of these goods do not reflect the broader market conditions. In a situation where the price statistician has to compare two different models, the fundamental question is: how much of the observed price change is due to quality change and how much to a true change in prices?
Consider the following example: in year 1, an old model costs 100; in year 2, a new model costs 90. How does one split the observed price change of 10 into a price and a quality component? What is missing here is the price that the old model would have collected in year 2, had it still been on the market4. Suppose we know that price, and suppose it is 80. Then it would be easy to state that the price change between the two periods is 80-100= -20 and that the quality change equals +10. But the price of the old model in year 2 is not known, and the price statistician, implicitly or explicitly, has to make some estimate. Simply ignoring the model change and calling -10 the true price decline is tantamount to saying that there has been no improvement in quality, or that the price of the old model in year 2 would have been 90 as well. As a consequence, the fall in prices would have been understated by half. Thus, to get price changes right, a more informed estimate of the year 2 price of the old model is required. Such an estimate may come from expert advice, from “option pricing”, or from some observation of the price at which the old model is traded for in second-hand markets.
The hedonic method5 is a systematic way to obtain an informed estimate for the price of the old model in year 2. Under this method, a hedonic function is estimated, that links the price of computer models to their characteristics such as speed, memory, equipment, etc. Suppose, for ease of exposition that there is only one such characteristic. By observing a sufficiently large number of computer models in year 2, it is possible to establish a systematic relationship between price and this characteristic. One can then infer a hypothetical price for the old computer model in year 2 by using the information about its technical characteristics (which are known from period 1) and so obtain an approximation to the true price change.
A number of countries use such hedonic methods, among them the United States where hedonic functions are constructed for different types of computers and peripheral equipment, semiconductors and software. Australia, Canada, Japan, France, Germany and some other countries have also de-veloped hedonic functions or adopted those of the United States. For ICT products, the hedonic method tends to yield price changes that drop more rapidly than price indices based on other estimates. Figure 4.5 shows price indices for ICT hardware investment for selected countries. The United States, Canada, France and Australia employ hedonic methods, and show the fastest rates of price decline. Although a hedonic price index has recently been developed in Germany, and introduced into the consumer price index, the investment deflator shown here is still based on the previous methodology. This explains its slower rate of change. No hedonic adjustment is carried out in Italy and in the United Kingdom. Japan constructs a hedonic producer price index for ICT hardware but it is not clear whether this deflator is also used in the national accounts. Table 4.2 summarises the use of hedonic methods for ICT hardware components and communications equipment.
4. This is a simplified example. Strictly speaking, looking for a price of the old model in year 2 is correct
only if the price index uses expenditure weights of period 1, i.e. if it is formulated as a Laspeyres-type index. Under a Paasche price index, weights of period 2 are relevant, and one would seek a proxy for the price of the new model in year 1.
5. For a much more complete description and discussion see OECD (forthcoming).

70
Figure 4.5. Price indices for computers and office equipment Average annual rates of change, 1995-2001*
-25% -20% -15% -10% -5% 0%
Italy
Japan
Germany
France
Canada
Australia
United States
United Kingdom
* United Kingdom: 1995-2000. Source: National sources.
The cross-country variation in price declines has either been taken as a sign that conventional estimates understate true price changes, or as an argument to dismiss hedonic methods as producing unrealistically rapid price declines for some goods and thus overstate true price changes6. One strand of discussion7 about hedonic methods concerned the question of whether they reflected user values or production costs. For example, when computers are used for investment, one wants the valuation of computers to depend on computers’ contributions to production. This is known in the literature as a “user value” measure of quality change. But if hedonic indexes reflect user value, the implication is that they are not the appropriate measure for output and producer price indexes where resource cost, not user value, is the theoretically appropriate way to value quality change (Fisher and Shell, 1971; Triplett, 1983). The issue of user value and resource cost was played out in a major debate on productivity measurement between Jorgenson and Griliches (1972) and Denison (1972). However, Rosen (1974) showed that hedonic functions were not uniquely identified with the demand side of the market, so that hedonic indexes were not uniquely described as measures of user value. That means that they do not trace demand functions for characteristics (utility functions for computer buyers), nor do they map supply functions for characteristics (production functions for computer suppliers). In other words, the user value-resource cost argument is inadequate to dismiss hedonic methods for output price indices.
6. For a discussion of hedonic methods, see Triplett (1990).
7. This draws on OECD (forthcoming).
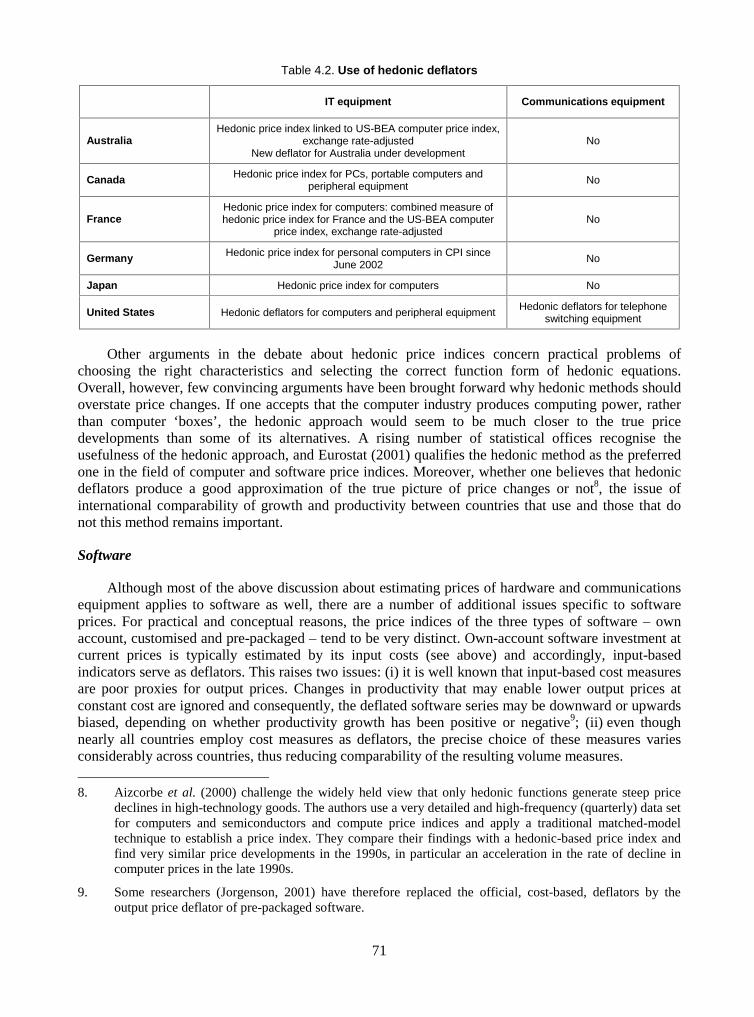
71
Table 4.2. Use of hedonic deflators
IT equipment Communications equipment
Australia Hedonic price index linked to US-BEA computer price index,
exchange rate-adjusted New deflator for Australia under development
No
Canada Hedonic price index for PCs, portable computers and peripheral equipment
No
France Hedonic price index for computers: combined measure of hedonic price index for France and the US-BEA computer
price index, exchange rate-adjusted No
Germany Hedonic price index for personal computers in CPI since June 2002
No
Japan Hedonic price index for computers No
United States Hedonic deflators for computers and peripheral equipment Hedonic deflators for telephone switching equipment
Other arguments in the debate about hedonic price indices concern practical problems of choosing the right characteristics and selecting the correct function form of hedonic equations. Overall, however, few convincing arguments have been brought forward why hedonic methods should overstate price changes. If one accepts that the computer industry produces computing power, rather than computer ‘boxes’, the hedonic approach would seem to be much closer to the true price developments than some of its alternatives. A rising number of statistical offices recognise the usefulness of the hedonic approach, and Eurostat (2001) qualifies the hedonic method as the preferred one in the field of computer and software price indices. Moreover, whether one believes that hedonic deflators produce a good approximation of the true picture of price changes or not8, the issue of international comparability of growth and productivity between countries that use and those that do not this method remains important.
Software
Although most of the above discussion about estimating prices of hardware and communications equipment applies to software as well, there are a number of additional issues specific to software prices. For practical and conceptual reasons, the price indices of the three types of software – own account, customised and pre-packaged – tend to be very distinct. Own-account software investment at current prices is typically estimated by its input costs (see above) and accordingly, input-based indicators serve as deflators. This raises two issues: (i) it is well known that input-based cost measures are poor proxies for output prices. Changes in productivity that may enable lower output prices at constant cost are ignored and consequently, the deflated software series may be downward or upwards biased, depending on whether productivity growth has been positive or negative9; (ii) even though nearly all countries employ cost measures as deflators, the precise choice of these measures varies considerably across countries, thus reducing comparability of the resulting volume measures. 8. Aizcorbe et al. (2000) challenge the widely held view that only hedonic functions generate steep price
declines in high-technology goods. The authors use a very detailed and high-frequency (quarterly) data set for computers and semiconductors and compute price indices and apply a traditional matched-model technique to establish a price index. They compare their findings with a hedonic-based price index and find very similar price developments in the 1990s, in particular an acceleration in the rate of decline in computer prices in the late 1990s.
9. Some researchers (Jorgenson, 2001) have therefore replaced the official, cost-based, deflators by the output price deflator of pre-packaged software.

72
Table 4.3. Comparison of software deflators
Country Own-account Customised Pre-packaged
Australia Prices are assumed to fall by 6% a year.
Canada
Weighted average (2:1) of programmer labour costs and non-labour inputs to the computer services industry.
Weighted average of own-account and pre-packaged (1:3).
Average of US index for pre-packaged adjusted for exchange rates. A new index is due for release.
Czech Republic Price indices for the output of the computer services industry.
Denmark 1993-95 Weighted average of labour costs and PC hardware (1:1).
1996-97 Weighted average labour and PC hardware (3:1). Weighted labour and PC hardware (1:1).
1998+ Geometric average of labour and hardware (3:1).
Finland 1975-97 Average earnings index for the computer services industry.
1998+ Weighted average of labour costs of the computer services industry and US pre-packaged software index adjusted for exchange rates.
France 1995 (-) US price index adjusted for exchange rates.
1995+ Labour costs.
Greece General (whole inflation) price index.
Japan Corporate Service Price Index for “the development of computer software tailored for corporations”, based on the labour costs.
Netherlands Labour costs of ICT personnel. Producer price index. Producer price index.
Spain Based on producer price index for office machinery and the general consumer price index (excluding renting).
Sweden Average earnings index for the computer services industry.
United Kingdom Average earnings series adjusted for the computer services industry with 3% productivity adjustment since 1996.
United States
Weighted average (roughly 1:1) of programmer labour costs and non-labour inputs to the computer services industry.
Weighted average of own-account and pre-packaged (1:3).
Directly collected price index
Source: Ahmad (2003).
Customised and pre-packaged software – when separately identified from own-account software – feature an even more diverse treatment across countries (see Table 4.3). Only two of the surveyed countries have explicit price indices for pre-packed software. In several cases, the price index for customised software is a weighted average of that for pre-packaged and own account software. In many other instances, the price indices for customised and pre-packaged software are based on input costs or on output prices of related products such as hardware. Applying the hardware-related deflator could mean introducing a downward bias to software prices, however; where price indices for hardware and software have been established separately, software price indices fell less rapidly than price indices for hardware.
It should not come as a surprise that the observed price indices for software exhibit large differences across countries (Figure 4.6). As in the case of hardware, it is unlikely that these differences are exclusively due to true differences in price developments – at least a sizeable part of them is accounted for by differences in the methodology for price indices.

73
Figure 4.6. Price indices for software investment, 1995=100
70
80
90
100
110
120
130
1992 1993 1994 1995 1996 1997 1998 1999 2000
AUS CAN DEN
FIN FRA GRC
ITA NLD SPA
SWE USA
Source: Ahmad (2003).
A short-term solution: ‘harmonised deflators’
Schreyer (2000) and Colecchia and Schreyer (2001) use a ‘harmonised’ deflator for information and communication technology products and for software investment to adjust at least roughly for differences in price index methodology between countries. This remains an approximation, though, and cannot replace more systematic efforts by countries to use similar methodologies in the construction of their price indices. But the adjustment permits a comparison between investment measures constructed with national and those based on ‘harmonised’ deflators.
Thus, one way of assessing the effects of the choice of price index methodologies on measures of investment, output or productivity is to reconstruct the same measure with a different underlying deflator. In particular, it is instructive to replace national price indices by those used in the United States, as comparisons and discussions about measurement issues frequently focus on the comparison with the United States. However, one has to keep in mind that replacing one country’s price index by that of another country implies assuming away differences in the composition of ICT production or consumption as well as differences in market structure and competition. Both can have a significant impact on the aggregate ICT price index and the use of ‘harmonised’ deflators remains at best an approximation to a lower bound of a true price change. Also, there are several possibilities for transposing the US deflators to other countries’ accounts for purposes of such a simulation. Here, three such possibilities are explored.
First, it is possible to use the United States deflator, unadjusted for domestic inflation. This constitutes the most direct way of transposing a price index from one country to another. The underlying hypothesis is that nominal prices of ICT products change at the same rate in different countries: for example, a 20% fall of computer prices in the United States translates into a 20% decline
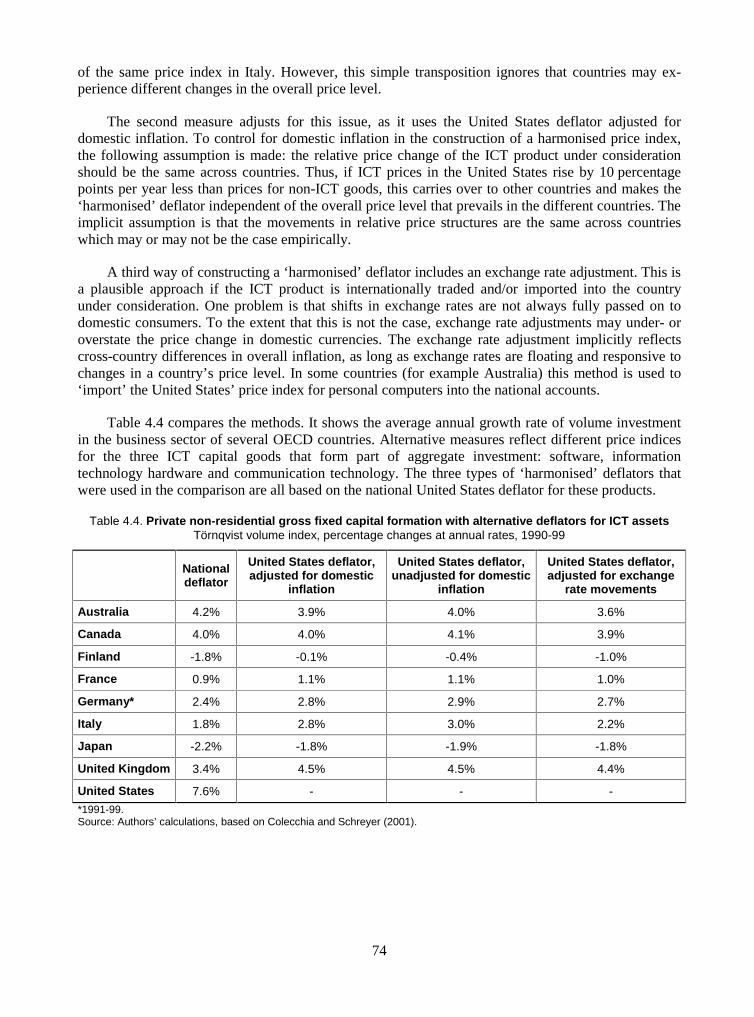
74
of the same price index in Italy. However, this simple transposition ignores that countries may ex-perience different changes in the overall price level.
The second measure adjusts for this issue, as it uses the United States deflator adjusted for domestic inflation. To control for domestic inflation in the construction of a harmonised price index, the following assumption is made: the relative price change of the ICT product under consideration should be the same across countries. Thus, if ICT prices in the United States rise by 10 percentage points per year less than prices for non-ICT goods, this carries over to other countries and makes the ‘harmonised’ deflator independent of the overall price level that prevails in the different countries. The implicit assumption is that the movements in relative price structures are the same across countries which may or may not be the case empirically.
A third way of constructing a ‘harmonised’ deflator includes an exchange rate adjustment. This is a plausible approach if the ICT product is internationally traded and/or imported into the country under consideration. One problem is that shifts in exchange rates are not always fully passed on to domestic consumers. To the extent that this is not the case, exchange rate adjustments may under- or overstate the price change in domestic currencies. The exchange rate adjustment implicitly reflects cross-country differences in overall inflation, as long as exchange rates are floating and responsive to changes in a country’s price level. In some countries (for example Australia) this method is used to ‘import’ the United States’ price index for personal computers into the national accounts.
Table 4.4 compares the methods. It shows the average annual growth rate of volume investment in the business sector of several OECD countries. Alternative measures reflect different price indices for the three ICT capital goods that form part of aggregate investment: software, information technology hardware and communication technology. The three types of ‘harmonised’ deflators that were used in the comparison are all based on the national United States deflator for these products.
Table 4.4. Private non-residential gross fixed capital formation with alternative deflators for ICT assets Törnqvist volume index, percentage changes at annual rates, 1990-99
National deflator
United States deflator, adjusted for domestic
inflation
United States deflator, unadjusted for domestic
inflation
United States deflator, adjusted for exchange
rate movements
Australia 4.2% 3.9% 4.0% 3.6%
Canada 4.0% 4.0% 4.1% 3.9%
Finland -1.8% -0.1% -0.4% -1.0%
France 0.9% 1.1% 1.1% 1.0%
Germany* 2.4% 2.8% 2.9% 2.7%
Italy 1.8% 2.8% 3.0% 2.2%
Japan -2.2% -1.8% -1.9% -1.8%
United Kingdom 3.4% 4.5% 4.5% 4.4%
United States 7.6% - - -
*1991-99. Source: Authors’ calculations, based on Colecchia and Schreyer (2001).

75
Future prospects
Many difficulties continue to persist in the computation of reliable, accurate and internationally comparable price series for ICT investment goods. This is a reflection of the conceptual and practical difficulties that statisticians face with these rapidly-changing goods and markets. For ICT investment goods, international comparability is inhibited by the use of different statistical methodologies to adjust for quality change. In particular, countries that use hedonic methods for quality adjustment of ICT prices tend to show more marked declines in prices than those countries that do not rely on hedonic methods. As a result, countries that use hedonic indexes are likely to record faster real growth in investment and production of information and communications technology (ICT) than countries that do not use them. This faster real growth will translate into a larger contribution of ICT capital to growth performance. Short-run solutions such as the ‘harmonised’ deflators discussed above exist but true improvements can only be achieved by reviewing and improving methods for every country.
Whereas the focus here has been on price indices for ICT investment goods, it is worth pointing out that price measurement probably even more difficult in the field of ICT-related services, for example communication services. The picture is not all bleak, though. New work has been carried out for service sectors, for example by Magnien (2003) on pricing mobile phone services. Fraumeni (2001) also points to several areas of progress in ICT-related statistics. Several countries have recently started to adopt hedonic methods (e.g. Germany) and this will help to improve international comparability. Several new international handbooks and manuals on price indices will facilitate implementation of new methods in other countries.10 Also, ICT itself will further facilitate price measurement, for example through the availability of scanner data, internet quotes or other new sources of information that can be exploited by price statisticians.
4.4 Measuring the impacts of investment in ICT
Estimating ICT capital services
In a production process, labour, capital and intermediate inputs are combined to produce one or several outputs. The analysis of the contribution of capital goods, including ICT capital goods requires the measurement of the flow of capital services in production. Because these are usually not directly observable, they have to be approximated. Most often, this is done by assuming that service flows are in proportion to the stock of assets, after each vintage has been converted into standard ‘efficiency’ units. The capital stock, so computed, is sometimes referred to as the ‘productive stock’ of a given type of asset. Accordingly, the importance of capital stock measures to productivity analysis derives solely from the fact that they offer a practical tool to estimate flows of capital services – were the latter directly observable, there would be no need to measure capital stocks.
The price of capital services is measured by their rental price. If there were complete markets for capital services, rental prices could be directly observed. In the cases of, for example, office buildings or cars, rental prices do exist and are observable in the market. However, this is not the case for many other capital goods that are owned by producers and for which rental prices have to be imputed. The implicit rent that capital good owners ‘pay’ themselves leads to the terminology ‘user costs of capital’.
Because many different types of capital goods are used in production, an aggregate measure of the capital stock or of capital services must be constructed. Typically, each type of asset is associated with a specific flow of capital services and strict proportionality is assumed between capital services 10. In particular, OECD (forthcoming) as well as new international manuals on producer price and consumer
price indices.
76
and capital stocks at the level of individual assets. This ratio is not the same, however, for different kinds of assets, so that the aggregate stock and the flows covering different kinds of assets must diverge. A single measure cannot serve both purposes except when there is only one single homogenous capital good (Hill, 1999).
Under competitive markets and equilibrium conditions, user costs reflect the marginal pro-ductivity of the different assets. User cost weights thus provide a means to effectively incorporate differences in the productive contribution of heterogeneous investments as the composition of investment and capital changes. Jorgenson (1963) and Jorgenson and Griliches (1967) were the first to develop aggregate capital service measures that take the heterogeneity of assets into account. They defined the flow of quantities of capital services individually for each type of asset, and then applied asset-specific user costs as weights to aggregate across services from the different types of assets.
The estimation of ICT capital service flows starts with identifying ICT and non-ICT assets at the lowest level of aggregation. In OECD work, this amounts to seven types of assets of which three are ICT-type assets. For each type of asset, long time series of current-price investment expenditure and of corresponding price indices are required. Letting the current price investment series for asset type i in
year t be itIN
��and the corresponding price index be i
tq , a productive stock itK can be constructed for
each ICT and non-ICT asset:
� ����
�������
iT
0
iii0,t
it
it FhqINK
In this expression, the productive stock of asset i at the beginning of period t is the sum over all past investments in this asset, where current price investment in past periods is deflated with the
purchase price index of new capital goods. iT represents the maximum service life of asset type i.
Because past vintages of capital goods are less efficient than new ones, an age efficiency function ih� has to be applied. It describes the efficiency time profile of an asset. It takes the value of one for a
new asset and declines with increasing age of the capital good. In OECD work, the age-efficiency function of ICT assets is assumed to be hyperbolic, with a very slow decline in asset efficiency over the first years of its service life.11
Furthermore, capital goods of the same type purchased in the same year do not generally retire at
the same moment. This is captured by iF�, describing the probability of survival over a cohort’s life
span. Other approaches exist, notably the geometric approach where age efficiency and retirement functions are combined into one single constant geometric rate.
The price of capital services is given by the user cost or rental price expression. User costs are imputed prices and reflect how much would be charged in a well-functioning market for a one period-
rental of a capital good. Ignoring taxes, user costs itu of an asset i are composed of the net rate of
return r applied to the purchase price of a new asset itq , of the costs of depreciation, captured by the
11. In OECD work (Schreyer et al. 2003), the average service lives that are assumed for the different assets
are as follows: seven years for IT equipment, 15 years for communications equipment, other equipment and transport equipment, 60 years for non-residential structures, three years for software and seven years for remaining other products. The same service lives apply across countries.

77
rate of depreciation itd , and by the rate of change of the asset price itself, as expressed by the term
it
it qlnd�� :
� �it
itt
it
it drqu ���� .
The expression in brackets represents the gross rate of return on a new capital asset. For ICT assets, the gross rate of return tends to be higher than for other assets. This reflects the rapid obsolescence of ICT assets, which enters the user cost term via changes in purchase prices of new capital goods and via depreciation. Generally, falling purchase prices raise the cost of holding a capital good while making it less expensive to buy. In many studies, the net rate of return in the user cost expression is determined as the ex-post rate (Jorgenson and Griliches, 1967) that will make the user costs just exhaust the gross operating surplus of the sector under consideration.12 Depreciation rates reflect the relative loss of an asset’s value due to ageing. In the specific case where the age-efficiency profile described earlier is captured by a constant geometric pattern, the depreciation rates are also constant. This facilitates computation and is also common practice in many studies.
Measuring the growth contribution of ICT
Once flows of ICT capital services have been derived, it is possible to estimate the contribution of such investment to economic growth. This is typically done through growth accounting.13 Suppose the growth accounting framework considers deflated value-added14 as its output measure, and this is called Q. Associated with the volume measure of output is a price index for the same period, P. Inputs comprise the primary inputs labour tL paid at the rate tw and capital. Capital services are provided
by different types of assets, but to keep things simple, the only distinction made here is between the
flow of capital services from ICT capital CtK and the flow of capital services from non-ICT
capital NtK . Empirically, the rate of change of a measure of combined labour and capital inputs, tX
can be computed as tLt
Nt
Nt
Ct
Ctt LlnsKlnsKlnsXln ��� or as a weighted average of the
rates of change of different inputs. The average cost shares of each input serve as weights,
where C,Ni;LwKu
Kus
C,Nj ttjt
jt
it
iti
t �
�
�
�
�
���
�
,
�
�
�
�
���
� C,Nj ttjt
jt
ttLt LwKu
Lws and � �i
1tit2
1it sss
�
��
for i=N, C, L. Given this measure of combined inputs, the growth rate of output can be decomposed
12. This is the most widely-used method based on an assumption of perfect foresight. It fits well with the
general equilibrium assumption implied by growth accounting models and has the clear advantage of simplicity. However, it will be subject to measurement errors of gross operating surplus and it is an ex-post measure that may not reflect the conditions facing producers at the beginning of the period. An alternative method is to choose an exogenous expected rate of return instead of an endogenous realised rate of return. It makes capital measures independent of measures of output and does not have to make the strong assumption that all observed price changes have been fully anticipated by economic actors. Such alternative models were studied by Harper, Berndt and Wood (1989), and more recently by Diewert (2001). See also Schreyer et al. (2003).
13. For one of the first applications of growth accounting techniques to ICT capital, see Oliner and Sichel (1994).
14. This is only one, albeit convenient, way of presenting the production process. Other formulations are feasible; in particular approaches that recognise both primary and intermediate inputs and that use a concept of gross output. For an overview of the discussion, see OECD (2001).
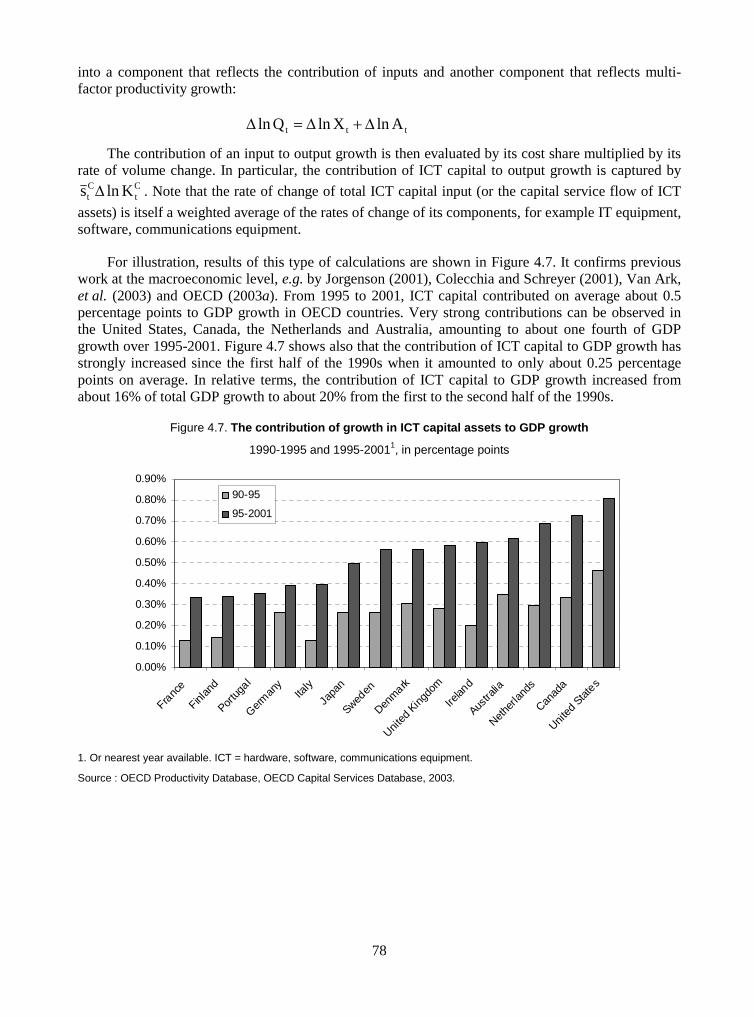
78
into a component that reflects the contribution of inputs and another component that reflects multi-factor productivity growth:
ttt AlnXlnQln ��
The contribution of an input to output growth is then evaluated by its cost share multiplied by its rate of volume change. In particular, the contribution of ICT capital to output growth is captured by
Ct
Ct Klns . Note that the rate of change of total ICT capital input (or the capital service flow of ICT
assets) is itself a weighted average of the rates of change of its components, for example IT equipment, software, communications equipment.
For illustration, results of this type of calculations are shown in Figure 4.7. It confirms previous work at the macroeconomic level, e.g. by Jorgenson (2001), Colecchia and Schreyer (2001), Van Ark, et al. (2003) and OECD (2003a). From 1995 to 2001, ICT capital contributed on average about 0.5 percentage points to GDP growth in OECD countries. Very strong contributions can be observed in the United States, Canada, the Netherlands and Australia, amounting to about one fourth of GDP growth over 1995-2001. Figure 4.7 shows also that the contribution of ICT capital to GDP growth has strongly increased since the first half of the 1990s when it amounted to only about 0.25 percentage points on average. In relative terms, the contribution of ICT capital to GDP growth increased from about 16% of total GDP growth to about 20% from the first to the second half of the 1990s.
Figure 4.7. The contribution of growth in ICT capital assets to GDP growth
1990-1995 and 1995-20011, in percentage points
0.00%
0.10%
0.20%
0.30%
0.40%
0.50%
0.60%
0.70%
0.80%
0.90%
Franc
e
Finlan
d
Portu
gal
Ger
man
yIta
ly
Japa
n
Sweden
Denm
ark
United
Kin
gdom
Irelan
d
Austra
lia
Nethe
rland
s
Canad
a
Unite
d Sta
tes
90-95
95-2001
1. Or nearest year available. ICT = hardware, software, communications equipment.
Source : OECD Productivity Database, OECD Capital Services Database, 2003.
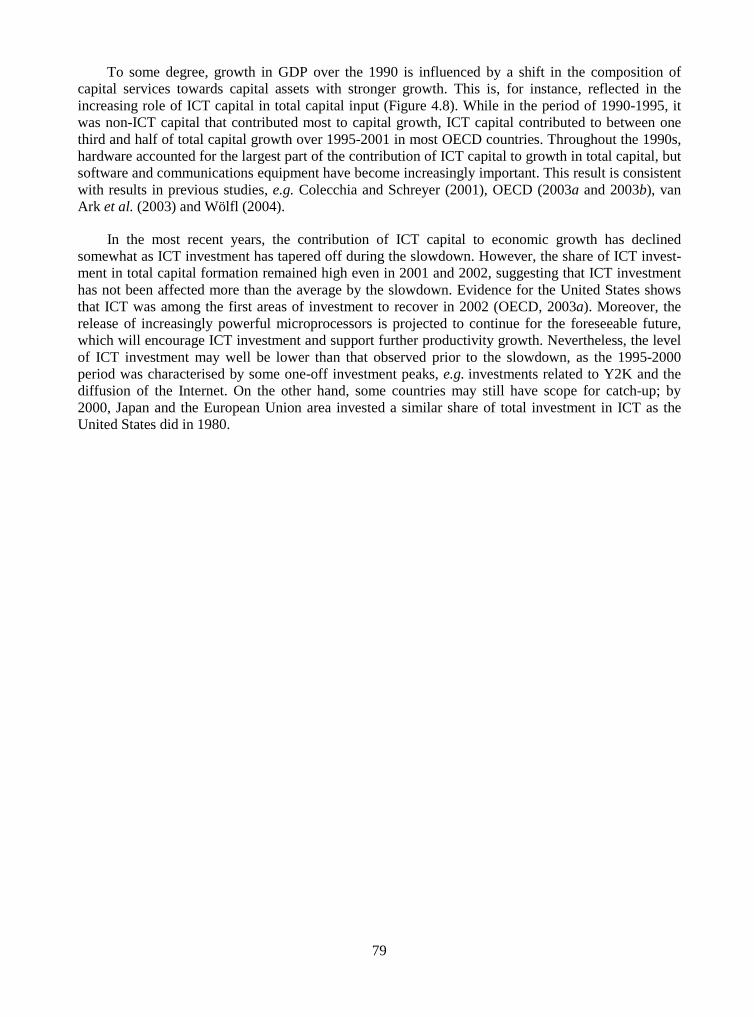
79
To some degree, growth in GDP over the 1990 is influenced by a shift in the composition of capital services towards capital assets with stronger growth. This is, for instance, reflected in the increasing role of ICT capital in total capital input (Figure 4.8). While in the period of 1990-1995, it was non-ICT capital that contributed most to capital growth, ICT capital contributed to between one third and half of total capital growth over 1995-2001 in most OECD countries. Throughout the 1990s, hardware accounted for the largest part of the contribution of ICT capital to growth in total capital, but software and communications equipment have become increasingly important. This result is consistent with results in previous studies, e.g. Colecchia and Schreyer (2001), OECD (2003a and 2003b), van Ark et al. (2003) and Wölfl (2004).
In the most recent years, the contribution of ICT capital to economic growth has declined somewhat as ICT investment has tapered off during the slowdown. However, the share of ICT invest-ment in total capital formation remained high even in 2001 and 2002, suggesting that ICT investment has not been affected more than the average by the slowdown. Evidence for the United States shows that ICT was among the first areas of investment to recover in 2002 (OECD, 2003a). Moreover, the release of increasingly powerful microprocessors is projected to continue for the foreseeable future, which will encourage ICT investment and support further productivity growth. Nevertheless, the level of ICT investment may well be lower than that observed prior to the slowdown, as the 1995-2000 period was characterised by some one-off investment peaks, e.g. investments related to Y2K and the diffusion of the Internet. On the other hand, some countries may still have scope for catch-up; by 2000, Japan and the European Union area invested a similar share of total investment in ICT as the United States did in 1980.

80
Figure 4.8. The contribution of growth in ICT capital to growth in total capital input
1990-1995 and 1995-20011), in percentage points
1995-2001
0.0%
1.0%
2.0%
3.0%
4.0%
5.0%
6.0%
7.0%
8.0%
Finl
and
Aust
ralia
Ger
man
y
Fran
ceU
nite
d Ki
ngdo
m
Italy
Japa
n
Swed
enN
ethe
rland
s
Den
mar
kU
nite
d St
ates
Can
ada
Portu
gal
Irela
nd
Non-ICT-Capital Hardw are Communications Equipment Softw are
1990-95
0.0%
1.0%
2.0%
3.0%
4.0%
5.0%
6.0%
7.0%
8.0%
Finl
and
Aust
ralia
Uni
ted
Kin
gdom
Irela
nd
Sw
eden
Net
herla
nds
Italy
Ger
man
yD
enm
ark
Fran
ceU
nite
d St
ates
Portu
gal
Can
ada
Japa
n
Non-ICT-Capital Hardware Communications Equipment Software
1. Or nearest year available.
Source : OECD Productivity Database, OECD Capital Services Database, 2003.

81
4.5 Concluding remarks
The measurement and impacts of ICT investment have been discussed in several recent studies quoted in this text. A considerable body of work has also examined the broader measurement of ICT diffusion (OECD, 2002; 2003a). This work suggests that a number of problems still affect the measurement of ICT investment. These include:
� Measures of ICT investment are not yet fully comparable across countries. Measures of software investment are particularly problematic (Ahmad, 2003), and have been the subject of an OECD/Eurostat Taskforce that has produced a range of recommendations to improve measurement; these are currently being implemented by statistical offices in OECD countries. Further efforts will be needed to improve the existing measures; this should include work to settle on a definition of ICT goods as well as work to improve business surveys of capital expenditure.
� Adjustment for quality change remains difficult. Hedonic deflators that may help to deal with this issue have only been developed in some countries and for some key product categories. To address problems of international comparability, empirical studies often use US hedonic deflators to represent price changes in other countries. This is only a second-best solution as countries should ideally use hedonic deflators that reflect their own national context. An OECD Handbook on Hedonic Price Measurement is due for publication in 2004, and may be followed by further steps to implement its findings in national statistical practices.
� While the measurement of capital services is relatively straightforward, its empirical implementation is based on a number of assumptions that are not always founded on a strong empirical basis. For example, relatively little is known about age-efficiency profiles and retirement patterns of assets.
A great deal has been achieved over the past years and measures of the ICT investment and the economic impacts of ICT are currently much improved from what they were only a few years ago. The more solid evidence is important for policy, as it helps underpin evidence-based policies. Further improvements in ICT measurement offer a great potential for future analysis, with potentially important policy implications. Given the continuing diffusion of ICT, better measurement remains a challenge.

82
REFERENCES
Ahmad, N. (2003), “Measuring Investment in Software”, STI Working Paper 2003/6, OECD, Paris.
Aizcorbe, A., C. Corrado and M. Doms (2000), “Constructing Price and Quantity Indexes for High-Technology Goods”, CRIW workshop on Price Measurement at NBER Summer Institute.
Colecchia, A. and P. Schreyer (2001), “The Impact of Information Communications Technology on Output Growth”, STI Working Paper 2001/7, OECD, Paris.
Denison, Edward F. (1972), “Classification of Sources of Growth”, Review of Income and Wealth, Vol. 18, pp. 1-25.
Diewert, E.D. (2001), “Measuring the Price and Quantity of Capital Services under Alternative Assumptions”, Department of Economics Working Paper No 01-24, University of British Columbia.
EUROSTAT (2001), Handbook on Price and Volume Measures in National Accounts, Luxembourg.
Fisher, Franklin and Karl Shell (1972), The Economic Theory of Price Indices: Two Essays on the Effects of Taste, Quality, and Technological Change, New York: Academic Press.
Fraumeni, Barbara (2001), “E-Commerce: Measurement and Measurement Issues”, American Economic Review, Vol. 91, No 2.
Harper, M., E.R. Berndt and D.O. Wood (1989), “Rates of Return and Capital Aggregation Using Alternative Rental Prices”, in Jorgenson, D.W. and R. Landau (eds.), Technology and Capital Formation, MIT Press.
Hill, P. (1999), “The productive capital stock and the quantity index for flows of capital services”, paper presented at the third meeting of the Canberra Group on Capital Stock Statistics, Washington, D.C..
Jorgenson, D.W. (1963), “Capital Theory and Investment Behaviour”, American Economic Review, Vol. 53, pp. 247-259.
Jorgenson D.W. (2001), “Information Technology and the U.S. Economy”, American Economic Review, Vol. 91, No. 1, pp. 1-32.
Jorgenson, D.W. and Z. Griliches (1967), “The Explanation of Productivity Change”, Review of Economic Studies, 34.
Jorgenson, D.W. and Z. Griliches (1972), “Issues in Growth Accounting: A Reply to Edward F. Denison”, Survey of Current Business 52, No 5.

83
Magnien, François (2003), “Mesurer l’évolution des prix des services de téléphonie mobile”, Economie et Statistique, No 362.
OECD (2001), OECD Productivity Manual: A Guide to the Measurement of Industry-Level and Aggregate Productivity Growth, Paris.
OECD (2002), Measuring the Information Economy, Paris, www.oecd.org/sti/measuring-infoeconomy.
OECD (2003a), ICT and Economic Growth: Evidence from OECD Countries, Industries and Firms, OECD, Paris.
OECD (2003b), OECD Science, Technology and Industry Scoreboard, OECD, Paris.
OECD (forthcoming), Handbook on Quality Adjustment of Price Indexes for Information and Communication Technology Products, Paris.
Oliner, S.D. and D.E. Sichel (1994), “Computers and Economic Growth Revisited: How Big is the Puzzle?”, Brookings Papers on Economic Activity, pp. 273-317.
Papaconstantinou, G., N. Sakurai and A. Wyckoff (1996), “Embodied Technology Diffusion: An Empirical Analysis for 10 OECD Countries”, STI Working Paper 1996/1, OECD, Paris.
Rosen, Sherwin (1974), "Hedonic Prices and Implicit Markets: Product Differentiation in Pure Competition." Journal of Political Economy Vol. 82 No. 1 (Jan.-Feb.): 34-55.
Schreyer, Paul (2000), "The contribution of information and communication technology to output growth: a study of the G7 countries, STI Working Papers 2000/2".
Schreyer, Paul, Pierre-Emmanuel Bignon and Julien Dupont (2003), “OECD Capital Services Estimates: Methodology and a First Set of Results”, OECD Statistics Working Paper 2003/6 Paris.
Triplett, Jack (1983), “Concepts of Quality in Input and Output Price Measures: A Resolution of the User Value-Resource Cost Debate”, in: Murray F. Foss (ed.), The U.S. National Income and Product Accounts: Selected Topics, Conference on Research in Income and Wealth: Studies in Income and Wealth, Volume 47. University of Chicago Press for the National Bureau of Economic Research, 1983: 296-311.
Triplett, Jack (1990), “Hedonic Methods in Statistical Agency Environments: An Intellectual Biopsy”, in: Berndt, Ernst and Jack Triplett (eds.), Fifty Years of Economic Measurement, National Bureau of Economic Research.
Van Ark, B., J. Melka, N. Mulder, M. Timmer and G. Ypma (2003), “ICT Investments and Growth Accounts for the European Union, 1980-2000”, Research Memorandum GD-56, Groningen Growth and Development Centre, Groningen, http://www.eco.rug.nl/ggdc/homeggdc.html
Wölfl, Anita (2004), “Growth Accounts for OECD Countries”, STI Working Paper, OECD, Paris, forthcoming.

85
CHAPTER 5
ICT PRODUCTION AND ICT USE: WHAT ROLE IN AGGREGATE PRODUCTIVITY GROWTH?
Dirk Pilat and Anita Wölfl1 Organisation for Economic Co-operation and Development
Abstract
This paper examines the roles of the ICT-producing sector and of key ICT-using industries in overall productivity growth in OECD countries. The ICT manufacturing sector, in particular, has been characterised by very high rates of productivity growth in many countries and provides a large contribution to labour productivity growth in Finland, Ireland and Korea. In a few countries, notably the United States and Australia, certain ICT-using services have also experienced an above-average pick-up in productivity growth in the second half of the 1990s. Differences in the measurement of productivity in ICT-producing and -using industries across countries complicate the cross-country analysis.
1. This chapter is a revised and updated version of a paper previously published in OECD Economic Studies
(Pilat et al., 2002).

86
5.1 Introduction
The previous chapter examined the role of ICT investment, using macro-economic data on ICT investment. Another approach to examining the impacts of ICT is based on industry-level data. This approach allows, for example, an examination of the role of the ICT-producing sector in different OECD countries. Some studies have argued that the pick-up in US multi-factor productivity (MFP) growth in the second half of the 1990s was primarily due to rapid technological progress in the production of ICT goods and services (Gordon, 2000). The relative importance of the ICT-producing sector in different countries, and its growth over time, might thus be one factor contributing to the differences in growth performance that have been observed in several OECD countries in recent years. This is the first issue examined in this chapter.
If the rise in MFP growth due to ICT were little more than a reflection of rapid technological progress in the production of computers, semi-conductors and related products and services, the effects of ICT on MFP growth in countries that are not already producers of ICT might be limited. For ICT to have benefits on MFP growth in countries that do not produce ICT goods, it needs to have impacts linked to its use in the production process. Recent studies for the United States have attributed a substantial part of the pick-up in US productivity growth to ICT-using sectors, notably services (Baily, 2002; Bosworth and Triplett, 2003). This marks a change with the past experience of these sectors, as the productivity record of many services sectors has often been poor. The application of ICT may have allowed some of these sectors to strengthen productivity performance, at least in the United States. The question is whether the United States is the exception or the rule? The second issue addressed in this paper is therefore an empirical, cross-country examination of productivity growth in the ICT-using sectors, notably services.
Impacts of ICT use on productivity growth might reflect several factors. The first is capital deepening, which was already discussed in Chapter 4. However, ICT might have impacts on productivity growth beyond those deriving from increased capital per worker, e.g. due to efficiency gains and network effects. Such effects would translate in higher multi-factor productivity (MFP) growth. Since estimates of MFP growth at the sectoral level can only be derived for a few OECD countries, due to the scarcity of data on capital input at the industry level, the paper will first examine the contribution of ICT-producing and ICT-using sectors to labour productivity growth. Attention will also be given to the measurement problems that complicate productivity analysis in ICT-producing and ICT-using sectors. The final part of the paper examines the contribution of ICT-producing and ICT-using sectors to MFP growth and draws some conclusions.
5.2 Growth and productivity performance in ICT-producing and ICT-using industries
5.2.1 The ICT-producing sector
Measuring productivity in the ICT-producing sector
Chapter 2 showed that the ICT producing-sector, as defined by the OECD, accounts for only a small share of the economy. But a small sector can make a relatively large contribution to growth and productivity performance if it grows much more rapidly than the remainder of the economy. Simple statistical analysis points to a positive correlation between the size of the ICT manufacturing sector and MFP growth, but this is mainly due to a few countries, notably Finland and Ireland (OECD, 2001a). A positive correlation should be expected, since the ICT manufacturing sector typically has very high rates of technological progress and MFP growth. However, some countries with a relatively

87
small ICT sector, such as Australia, have also experienced high MFP growth, suggesting that a large ICT sector is not a necessary condition for improvements in MFP growth (see also Chapters 2 and 6).
Examining the role of ICT-producing sectors in economic growth is heavily influenced by measurement problems, both regarding outputs and inputs. The key measurement problem for the manufacturing of ICT goods on both the output and input side concerns prices, in particular how to statistically capture significant quality improvements associated with technological advances in goods such as computers and semi-conductors. The use of hedonic deflators is generally considered as the best way to address these problems (Box 5.1; OECD, forthcoming).2
Box 5.1. The use of hedonic deflators in the ICT-producing sector
Several countries currently use hedonic methods to deflate output in the computer industry (e.g. Canada, Denmark, France, Sweden and the United States). The production price deflator for the computer industry (ISIC Rev 3, Division 30) is shown in Figure 5.1. 3 It shows a very rapid decline in production price indices for France and the United States, and a gradual decline in Denmark since 1984, but relatively little change in the other countries. These differences may partly reflect the use of a hedonic deflator in both France and the United States, the use of an exchange rate adjusted US hedonic deflator by Denmark, and the use of conventional deflators in the other countries.
Figure 5.1. Producer price indexes for the computer industry, 1995=100
0
50
100
150
200
250
1985
1986
1987
1988
1989
1990
1991
1992
1993
1994
1995
1996
1997
1998
1999
2000
2001
2002
United States
Denmark
Finland France
AustriaKorea
Source: OECD, STAN database, January 2004.
Adjusting for these methodological differences in computer deflators for the purpose of a cross-country comparison is difficult, however, since there are considerable cross-country differences in industrial specialisation. Only few OECD countries produce computers, where price falls have been very rapid; many only produce peripheral equipment, such as computer terminals. Similar differences in industry composition exist in Radio, Television and Communication Equipment (ISIC 32), which includes the semi-conductor industry. The differences in the composition of output are typically larger than in computer investment, where standardised approaches have been applied (e.g. Colecchia and Schreyer, 2001; Chapter 4). These different price indexes obviously also have impacts on measures of output growth (Wyckoff, 1995; Pilat et al., 2002).
2. Hedonic deflators for the output of ICT manufacturing are not the only measurement problem in this
sector. Measuring input prices for these industries is also complicated, and requires detailed input-output tables as well as hedonic deflators for certain inputs, such as semi-conductors.
3. Production price indices for Canada are not available from the OECD STAN database.

88
The measurement of output in the telecommunications industry also raises problems. Some countries use consumer price indexes of phone rates to deflate value added; others use physical quantity indexes of calls, telexes, and other services to measure volume changes in output; and some countries use a composite index of producer price indices for relevant components (OECD, 1996). Most of these methods do not address key measurement problems in this sector, i.e. quality change, adjustment for new products and services, the separation of goods and services, and increased price differentiation. The currently available measures of price for telecommunications services still show a considerable variety in approaches across the OECD (OECD, 2000).
Measurement in the third component of the ICT-producing sector, the computer services industry, also raises problems. This sector includes difficult-to-measure services, such as hardware and software consultancy services, and maintenance and repair of computer equipment, but also includes several activities where quality has changed rapidly over time and hedonic deflators may be needed. These include the development, production and supply of customised and non-customised software, as well as data processing and database activities.
The methodological differences highlighted above affect cross-country comparisons of productivity. Adjusting for these differences is no simple task, as it is not clear, a priori, to what extent differences in output and value added deflators for these industries are due to measurement (e.g. the use of hedonic deflators) or to differences in industrial specialisation. However, countries that produce computers and semi-conductors, but that use conventional deflators (e.g. Korea), are likely to underestimate output and productivity growth in this industry (see Pilat, et al., 2002). Some studies (e.g. van Ark et al., 2002) have applied US deflators to the measurement of output in ICT manufacturing in other countries. This demonstrates the potential size and significance of the problem, but may overstate growth in the ICT-producing sector of certain countries that are less specialised than the United States in producing ICT goods characterised by very rapid price declines. Clearly, more work on the development of appropriate hedonic deflators in each country is warranted.
The contribution of the ICT-producing sector to labour productivity growth
The contribution of the ICT-producing sector to recent growth performance reflects the productivity performance of the different ICT-related industries and their weight in the economy (see Annex). The OECD STAN database provides most of the required information in this regard. While it does not cover all components of the ICT sector separately, the role of key industries can be examined.4
4. The analysis here focuses on ISIC 30-33 (Office and computing machinery; Electrical machinery and
apparatus; Radio, television and communication equipment; and Medical, precision and optical instru-ments) for ICT manufacturing, and ISIC 64 (Post and telecommunications) and ISIC 72 (Computer services) for ICT services. These sectors are often available from detailed national accounts. More detailed breakdowns, as demanded by the OECD definition of the ICT sector, create some problems in particular in estimating output and value added in constant prices. Data for wholesale of ICT equipment (ISIC 5150) and renting of ICT equipment (ISIC 7123) are also not available from STAN.

89
Figure 5.2 shows the contribution of ICT manufacturing to labour productivity growth over the 1990s, distinguishing between the first and second half of the decade.5 In most OECD countries, the contribution of ICT manufacturing to overall labour productivity growth has risen over the 1990s. This is partly due to the growing share of ICT manufacturing in total manufacturing, but can primarily be attributed to more rapid technological progress in the production of certain ICT goods, such as semi-conductors, which has contributed to more rapid price declines and thus to higher growth in volumes (see Chapter 4). ICT manufacturing made the largest contributions to aggregate labour productivity growth in Finland, Ireland and Korea, with close to 1 percentage point of aggregate labour productivity growth in the 1995-2002 period being due to ICT manufacturing. The contribution of ICT manufacturing declined in 2001 and 2002, as demand for ICT equipment fell and sales declined.
Figure 5.2. Contribution of ICT manufacturing to aggregate labour productivity growth
(Total economy, value added per person employed, contribution in percentage points)
-0.1
0.0
0.1
0.2
0.3
0.4
0.5
0.6
0.7
0.8
0.9
1.0
1.1
Luxe
mbo
urg
Norway
Spain
Italy
Mex
ico
Nethe
rland
s
Canad
a
Germ
any
Denm
ark
Austria
Unite
d Kin
gdom
Switzer
land
Belgiu
m
Franc
e
Japa
n
Unite
d Sta
tes
Sweden
Finlan
d
Irelan
d
Korea
1990-95
1996-2002*
Note: 1991-1995 for Germany; 1992-95 for France and Italy and 1993-1995 for Korea; 1996-98 for Sweden, 1996-99 for
Korea and Spain, 1996-2000 for Ireland, Norway and Switzerland, 1996-2001 for France, Germany, Japan, Mexico, the Netherlands, the United Kingdom and the United States.
Source: Estimates on the basis of the OECD STAN database. See Tables A5.1 and A5.2 in the annex to this chapter for detail.
The ICT-producing services sector (telecommunications and computer services) plays a smaller role in aggregate labour productivity growth, although it is also characterised by rapid improvements (Figure 5.3). In part, rapid productivity growth is linked to the liberalisation of telecommunications markets and the high speed of technological change in this market. The contribution of this sector to overall labour productivity growth increased in several countries over the 1990s, notably in Finland, Germany and the Netherlands. Some of the growth in ICT-producing services is due to the emergence
5. The productivity measurement in the paper follows the procedures outlined in OECD’s Productivity
Manual (OECD, 2001b). Since value added is more widely available in the STAN database than pro-duction, productivity measurement is based on value added. An industry’s contribution to aggregate labour productivity growth is calculated as the difference between its contribution to the growth of total value added and its contribution to the growth of total labour input. See chapter annex for details.

90
of the computer services industry, which has accompanied the diffusion of ICT in OECD countries. Growth in this sector was particularly important for Ireland (see Table A5.2 in annex to this chapter).
Figures 5.2 and 5.3 show that the ICT sector is an important driver of growth and productivity for a few OECD countries. But in most countries, the contribution of this sector to overall productivity growth is quite small, although it has typically increased over the 1990s. This result is linked to differences in specialisation. Only few OECD countries are specialised in those parts of ICT sector that are characterised by rapid technological progress, e.g. the production of semi-conductors and electronic computers. Much of the production of this type of ICT hardware is highly concentrated, because of its large economies of scale and high entry costs. Establishing a new semi-conductor plant cost some USD 100 million in the early 1980s, but as much as USD 1.2 billion in 1999 (United States Council of Economic Advisors, 2001). In other words, only a few countries will have the necessary comparative advantage to succeed in producing these types of ICT products. This may not necessarily be a problem for countries that do not produce such goods to the extent that a substantial part of the benefits of ICT production accrue to importing countries and to users, that can benefit from investment and consumer goods characterised by rapid price declines (Bayoumi and Haacker, 2002).
Figure 5.3. Contribution of ICT-producing services to aggregate labour productivity growth
(Total economy, value added per person employed, contribution in percentage points)
0.0
0.1
0.2
0.3
0.4
0.5
0.6
0.7
0.8
0.9
1.0
Switzer
land
Belgiu
m
Norway
Denm
ark
Austri
a
Franc
eSpa
in
Unite
d Stat
es
Nethe
rland
s
Japa
n
Mex
ico Italy
Canad
a
Sweden
United
Kin
gdom
Irelan
d
Korea
Luxe
mbo
urg
Finlan
d
Ger
man
y
1990-95
1996-2002*
Note: See Figure 5.2 for period coverage.
Source: Estimates on the basis of the OECD STAN database. See Tables A5.1 and A5.2 in the annex to this chapter for detail.

91
5.2.2 Does ICT use increase productivity growth?
Much of the current interest in ICT’s potential impact on growth is not linked to the ICT-producing sector, but to the potential benefits arising from its use in the production process elsewhere in the economy. The use of ICT could have several impacts on productivity. For example, it might help more productive firms gain market share. In addition, the use of ICT may help firms expand their product range, customise the services offered, or respond better to client demand; in short, to innovate. Moreover, ICT may help reduce inefficiency in the use of capital and labour, e.g. by reducing inventories. All these effects might lead to higher productivity growth.
Investment in ICT might also have benefits going beyond those accruing to investors in ICT. For instance, the diffusion of ICT may help establish networks, which produce greater benefits (the so-called spillover effects) the more customers or firms are connected to the network. Moreover, the spread of ICT may reduce transaction costs, which could lead to a more efficient matching of supply and demand, and enable the growth of new markets. Increased use of ICT may also lead to greater efficiency in the creation of knowledge. Where such spillovers exist, they raise overall MFP growth. Studies at the firm level (see OECD, 2003 and Chapters 6 to 13) indeed point to spillovers from ICT capital, but it has generally been difficult to confirm these results at more aggregate levels of analysis.
One way to examine the role of ICT use in more detail is by focusing on those sectors that are the most intensive users of ICT. If the use of ICT is having effects on MFP growth, it is likely that heavy users would be the first sectors to experience such effects. Although computers may appear to be everywhere, the use of ICT is actually highly concentrated in the services sector and in a few manufacturing sectors (McGuckin and Stiroh, 2001; Chapter 2). Empirical evidence on ICT use by industry is available for several countries, based on capital flow matrices and capital stock estimates. Figure 5.4 shows evidence for the United States. It shows the share of the total stock of equipment and software that is accounted for by IT equipment and software (excluding communications equipment). The graph shows that more than 30% of the total stock of equipment and software in legal services, business services and wholesale trade consists of IT and software. Education, financial services, health, retail trade and a number of manufacturing industries (instruments and printing and publishing) also have a relatively large share of IT capital in their total stock of equipment and software. The average for all private industries is just over 11%. The goods-producing sectors (agriculture, mining, manufacturing and construction) are much less IT-intensive; in several of these industries less than 5% of total equipment and software consists of IT.

92
Figure 5.4. Information technology as a percentage of all stock of equipment and software, United States, 2001
0
10
20
30
40
Lega
l ser
vices
Whole
sale
trade
Busin
ess
serv
.
Educa
tion
Printin
g, p
ublis
hing
Inst
rum
ents
Finance
, ins
uranc
e, re
al e
state
Retai
l trad
e
Health
All priv
ate
indu
strie
s
Perso
nal s
ervic
es
Durab
le g
oods
man
ufac
turin
g
Comm
unicat
ions
Man
ufactu
ring
Const
ructi
on
Nondu
rabl
e go
ods
Electr
ic, g
as, w
ater
Mini
ng
Trans
porta
tion
Agricu
lture
, for
estry
, fish
ing
Source: Bureau of Economic Analysis, US Department of Commerce, Fixed Assets Tables, http://www.bea.doc.gov/
The relative distribution of ICT investment across sectors for other OECD countries does not appear very different for other OECD countries (Pilat et al., 2002); services sectors such as wholesale trade and financial services are typically the most intensive users of ICT.6 This may suggest that any impacts on economic performance might be more visible in the services sectors than in other parts of the economy. Examining the performance of these sectors over time and comparing it with sectors of the economy that do not make intensive use of ICT, can help point to the role of ICT use in strengthening productivity growth.7 Nevertheless, ICT is commonly considered to be a general-purpose technology, as all sectors of the economy use information in their production process, which implies that all sectors might be able to benefit from the use of ICT.
Labour productivity growth in ICT-using industries
In several of the sectors that are important users of ICT, output and productivity are hard to measure (Box 5.2). These measurement problems may obscure actual productivity gains (Gullickson and Harper, 1999). The STAN database distinguishes several of the ICT-using industries that were mentioned above, notably wholesale and retail trade, finance, insurance and business services. For the discussion here, the focus is primarily on these services, which are all intensive users of ICT.
6. Health and education are also intensive ICT users but are ignored here as their output is difficult to
measure.
7. A more rigorous method would be to examine the link between ICT use and productivity performance through econometric methods, e.g. panel estimation across countries. Unfortunately, only few countries provide data on ICT investment by industry over sufficiently long time periods.

93
Box 5.2. Measurement of productivity in ICT-using services
For several parts of the services sector, output is difficult to measure (Dean, 1999). There is little agreement, for example, on the output of banking, insurance, medical care and retailing. In addition, it is difficult to separate service output from the consumer’s role in eliciting the output. For example, output of the education sector is partly due to the efforts made by students themselves. Such difficulties indicate that the volume and price of services – and changes in their quality – are harder to measure than those of goods. In addition, some services are not sold in the market, so that it is hard to establish prices. In practice, these constraints mean that output in some services is measured on the basis of relatively simple indicators. Several series are deflated by wages or consumer prices or extrapolated from changes in employment, sometimes with explicit adjustment for assumed labour productivity changes. Given these difficulties, adjusting for quality is even more difficult.
With better measurement, potential productivity gains may become visible. Fixler and Zieschang (1999), for example, derive new output measures for the US financial services industry (depository institutions). They introduce quality adjustments to capture the effects of improved service characteristics, such as easier and more convenient transactions, e.g. use of ATMs, and better intermediation. Their output index grows by 7.4% a year between 1977 and 1994, well above the official measure for this sector of only 1.3% a year on average. Measures of GDP growth for the United States already incorporate improved estimates of banking output, notably on the real value of non-priced banking services, which better capture productivity growth in this industry.
While some new approaches to measurement in these sectors are being developed (Triplett and Bosworth, 2000), only few countries have thus far made substantial changes in their official statistics to improve measurement. The measurement problems can be seen clearly in the official productivity statistics for several countries, with several service industries showing negative MFP growth over a prolonged period (see Wölfl, 2003).
Figure 5.5 shows the contribution of the key ICT-using services (wholesale and retail trade, finance, insurance and business services) to aggregate labour productivity growth over the 1990s. The graph suggests small improvements in the contribution of ICT-using services in Finland, the Netherlands, Norway and Sweden, and substantial increases in Australia, Canada, Ireland, Mexico, the United Kingdom and United States. The strong increase in the United States is primarily due to more rapid productivity growth in wholesale and retail trade, and in financial services (securities), and is confirmed by several other studies (e.g. Baily, 2002; Bosworth and Triplett, 2003, Figure 5.6). The strong increase in productivity growth in Australia has also been confirmed by other studies (Parham, 2001; Chapter 6). In some countries, ICT-using services made a negative contribution to aggregate productivity growth. This is particularly the case in Switzerland in the first half of the 1990s, resulting from poor productivity growth in the banking sector.8
8. Poor measurement of productivity in financial services may be partly to blame. The OECD is currently
working with member countries to improve measures of output growth for this sector.

94
Figure 5.5. Contribution of ICT-using services to aggregate labour productivity growth, 1990-95 and 1996-2002
(Total economy, value added per person employed, contributions in percentage points)
-0.6
-0.4
-0.2
0.0
0.2
0.4
0.6
0.8
1.0
1.2
1.4
United
Sta
tes
Mex
ico
Austra
lia
United
Kin
gdom
Irelan
d
Sweden
Canad
a
Denmark
Switzer
land
Nether
land
s
Finlan
d
Spain
Norway
Austri
aKor
ea
Japa
n
Luxe
mbo
urg
Belgiu
mIta
ly
Germ
any
Franc
e
1990-95 1996-2002*
Countries where productivity growth deteriorated
Countries where productivity growth improved
Note: See Figure 5.2 for period coverage. Data for Australia are for 1996-2001.
Source: Estimates on the basis of the OECD STAN database. See chapter annex for detail.
From the examination above it is possible to determine how productivity growth in ICT-producing and ICT-using sectors has contributed to aggregate productivity growth in OECD countries. The contributions of ICT-producing, ICT-using industries and other activities to aggregate labour productivity growth are shown in Table 5.1.
Among the G7 countries, the United States and Canada are the only countries that experienced a marked improvement in labour productivity growth over the 1990s. In the United States, both ICT-producing and ICT-using industries contributed to the improvement in labour productivity growth, with the ICT-using sector accounting for the bulk of the pick-up in labour productivity in the second half of the 1990s. In Canada, ICT-producing and ICT-using services accounted for the acceleration. In the other G7 countries, ICT-producing services provided a slightly stronger contribution to labour productivity growth in the second half of the 1990s, thanks to rapid growth in the telecommunications sector. However, the contribution of ICT-using industries was small and declined in several countries over the 1990s, the United Kingdom being the main exception.

95
Figure 5.6. Labour productivity growth in selected ICT-using services, 1990-95 and 1996-2002
(Total economy, value added per person employed, annual average growth rates in percent)
Financial services, ISIC 65-67
-4.0 -2.0 0.0 2.0 4.0 6.0 8.0
Netherlands
France
Canada
Italy
Austria
United Kingdom
Spain
Australia
Korea
Japan
Norway
Germany
Denmark
Finland
United States
Mexico
per cent
1990-95 1996-2002
Wholesale and retail trade, ISIC 50-52
-4.0 -2.0 0.0 2.0 4.0 6.0
Japan*
Germany
Spain
Italy
France
Belgium
Austria
Finland
Netherlands
United Kingdom
Denmark
Australia
Mexico
Canada
Korea
United States
Norway
per cent
1990-95 1996-2002
Notes: See Figure 5.2 for period coverage. Wholesale and retail trade includes hotels and restaurants for Japan.
Source: Estimates on the basis of the OECD STAN database, January 2004.
Among the other OECD countries, the growing contribution of ICT manufacturing sector to aggregate labour productivity growth in the 1990s is also visible, in particular in Finland, Ireland, Korea and Sweden. ICT-producing services only experienced more rapid growth in a few OECD countries, notably Finland and Ireland. The ICT-using industries experienced no strong pick-up in labour productivity growth in the 1990s, however, Australia, Ireland and Mexico being exceptions.

96
Table 5.1. Contributions to aggregate labour productivity growth, 1990-1995 and 1996-2002
Contributions to value added per person engaged, in percentage points
Austria Australia Belgium Canada Denmark Finland France Germany Ireland Italy Japan
1990-95
ICT-producing manufacturing 0.12 .. 0.03 0.09 0.09 0.20 0.20 0.17 0.43 0.09 0.36
ICT-producing services 0.15 0.43 0.12 0.08 0.27 0.13 0.02 0.18 0.10 0.12 0.10
ICT-using services 0.59 0.47 0.77 0.16 0.36 0.10 0.01 0.17 0.15 0.88 1.13
Other activities 1.47 0.80 0.98 0.78 1.27 2.21 0.90 1.58 1.71 1.74 -0.22
Total economy 2.32 1.71 1.90 1.11 1.99 2.65 1.13 2.11 2.39 2.83 1.36
1996-2002
ICT-producing manufacturing 0.11 .. 0.13 0.07 0.09 0.82 0.21 0.09 0.89 0.02 0.36
ICT-producing services 0.13 0.33 0.05 0.20 0.13 0.36 0.14 0.46 0.28 0.20 0.18
ICT-using services 0.51 1.05 0.17 0.46 0.37 0.22 -0.17 0.12 0.73 0.14 0.37
Other activities 0.98 0.73 0.42 0.79 0.86 0.62 0.82 0.71 1.87 0.20 0.49
Total economy 1.73 2.10 0.78 1.52 1.45 2.02 1.00 1.38 3.76 0.56 1.41
Acceleration 1990-95 to 1996-2002
ICT-producing manufacturing -0.01 .. 0.10 -0.02 0.00 0.62 0.01 -0.08 0.46 -0.07 0.00
ICT-producing services -0.02 -0.11 -0.07 0.12 -0.14 0.23 0.12 0.28 0.18 0.08 0.08
ICT-using services -0.08 0.58 -0.60 0.30 0.00 0.12 -0.18 -0.06 0.58 -0.74 -0.76
Other activities -0.49 -0.08 -0.56 0.00 -0.41 -1.59 -0.07 -0.87 0.15 -1.54 0.72
Total economy -0.59 0.40 -1.12 0.41 -0.55 -0.63 -0.13 -0.73 1.37 -2.27 0.04
Korea Luxem-bourg
Mexico Nether- lands
Norway Spain Sweden Switzer- land
United Kingdom
United States
1990-95
ICT-producing manufacturing 0.84 -0.03 0.01 0.10 0.01 0.14 0.27 0.10 0.19 0.33
ICT-producing services 0.23 0.74 0.19 0.09 0.19 0.09 0.24 0.06 0.18 0.14
ICT-using services 0.74 0.22 0.25 0.10 0.65 -0.17 0.45 -0.58 0.37 0.24
Other activities 3.13 1.15 0.07 0.33 2.26 1.16 1.99 0.39 1.46 0.40
Total economy 4.94 2.08 0.51 0.63 3.11 1.22 2.95 -0.03 2.20 1.12
1996-2002
ICT-producing manufacturing 1.02 -0.01 0.02 0.03 0.00 0.01 0.51 0.13 0.12 0.45
ICT-producing services 0.31 0.32 0.18 0.17 0.11 0.16 0.22 0.01 0.24 0.16
ICT-using services 0.49 -0.20 1.17 0.28 0.57 -0.03 0.60 0.29 0.85 1.29
Other activities 2.25 0.40 0.45 0.29 1.02 0.14 1.33 0.67 -0.12 -0.15
Total economy 4.07 0.51 1.82 0.77 1.71 0.28 2.67 1.10 1.08 1.74
Acceleration 1990-95 to 1996-2002
ICT-producing manufacturing 0.18 .. 0.01 -0.07 -0.02 -0.13 0.25 0.03 -0.07 0.11
ICT-producing services 0.07 -0.42 -0.01 0.08 -0.07 0.07 -0.02 -0.06 0.06 0.01
ICT-using services -0.24 -0.41 0.92 0.18 -0.08 0.14 0.15 0.87 0.48 1.04
Other activities -0.88 -0.76 0.39 -0.04 -1.24 -1.02 -0.66 0.28 -1.59 -0.54
Total economy -0.87 -1.57 1.31 0.15 -1.41 -0.94 -0.28 1.13 -1.12 0.62
Source: Estimates based on the OECD STAN database and data from van Ark et al. (2002b). See tables in the annex to this chapter for detail.

97
5.3 The contribution of ICT production and use to MFP growth
Stronger growth in labour productivity in ICT-producing and ICT-using industries could simply be due to capital deepening, i.e. greater use of capital by workers (see Chapter 4). Estimates of MFP growth, as opposed to labour productivity growth, adjust for this factor. Breaking aggregate MFP growth down in its sectoral contributions can also help show whether changes in MFP growth should be attributed to ICT producing sectors, to ICT-using sectors, or to other sectors. Figure 5.6 shows the contribution of all activities to aggregate MFP growth for the 8 countries for which estimates of capital stock at the industry level were available in the OECD STAN database. It shows that the ICT-producing sector provided an important contribution to the acceleration in MFP growth in Finland, with both ICT-producing manufacturing and ICT-producing services providing a strong contribution. In France and Germany, the contribution of ICT production to MFP growth also increased over the 1990s, in both ICT-producing manufacturing and ICT-producing services, confirming rapid technological progress in this sector.
If ICT were to have effects on productivity growth over and above its contribution to capital deepening, MFP in sectors that are intensive users of ICT would need to increase. The estimates of Figure 5.6 show that the contribution of ICT-using services to aggregate MFP growth has slightly increased in Canada, Denmark and Germany, and substantially in Finland. In the other countries shown in the Figure, MFP growth in the ICT-using services was zero or negative over the 1990s, suggesting that there appear to be no additional effects of ICT use in these sectors above those due to capital deepening. This may also be because some of the productivity changes in these sectors are not sufficiently picked up in the statistics, or because the adjustments that may be required to make ICT work have actually led to a (often temporary) drop in productivity growth (see also OECD, 2003a).
The OECD STAN database does not yet include capital stock for the United States, which implies that MFP estimates for the United States can not be derived from this source. Several studies provide estimates of the sectoral contributions to US MFP growth, however, that show considerable variation. For example, Oliner and Sichel (2002) found no contribution of non-ICT producing industries to MFP growth; Gordon (2002) and Jorgenson, Ho and Stiroh (2002) found a relatively small contribution, while Baily (2002) and the US Council of Economic Advisors (2001) found a much more substantive contribution.9 The problem with some of these studies (e.g. Oliner and Sichel, 2002 and Gordon, 2002) is that all non-ICT producing sectors are combined, and the contribution of the non ICT-producing sector to aggregate MFP growth is calculated as a residual.
9. The differences between the various US studies are partly due to the data sources and methodology used,
as well as the timing of various studies.

98
Figure 5.6. Contributions of key sectors to MFP growth, 1990-95 and 1996-2002*
(Total economy, contributions to annual average growth rates, in percentage points)
-1.5
-1.0
-0.5
0.0
0.5
1.0
1.5
2.0
2.5
1990-95
1996-2002
1990-95
1996-2002
1990-95
1996-2001
1990-95
1996-2001
1990-95
1996-2002
1990-95
1996-2000
1990-95
1996-98*
1990-95
1996-2002
in %ICT-producing manufacturing ICT-producing services
ICT-using services Other activitiesDenmark France Germany Italy JapanFinland CanadaBelgium
*Or latest available year, i.e. 2001 for Germany and France, 2000 for Italy, and 1998 for Japan.
Note: Estimates are based on official estimates of capital stock and sector-specific labour shares (adjusted for labour income from self-employment). No adjustment is made for capital services.
Source: OECD STAN database, January 2004.
More detailed examination for the United States provides a different perspective (Bosworth and Triplett, 2003). This study finds, for example, that MFP growth in wholesale trade accelerated from 1.5% annually to 3.1% annually from 1987-95 to 1995-2001. In retail trade, the jump was from 0.2% annually to 2.9%, and in securities the acceleration was from 3.1% to 6.6%. Several other service sectors also experienced an increase in productivity growth over this period. On average, Bosworth and Triplett estimate that the contribution of service producing industries to aggregate MFP growth increased from 0.27% over the 1987-95 period to 1.2% over the 1995-2001 period, with the largest contributions coming from the sectors mentioned above.
There is therefore good evidence for strong MFP growth in the United States in ICT-using services. More detailed studies suggest how these productivity changes due to ICT use in the United States could be interpreted. First, a considerable part of the pick-up in productivity growth can be attributed to retail trade, where firms such as Walmart used innovative practices, such as the appropriate use of ICT, to gain market share from its competitors (McKinsey, 2001). The larger market share for Walmart and other productive firms raised average productivity and also forced Walmart’s competitors to improve their own performance. Among the other ICT-using services, securities accounts also for a large part of the pick-up in productivity growth in the 1990s. Its strong performance has been attributed to a combination of buoyant financial markets (i.e. large trading volumes), effective use of ICT (mainly in automating trading processes) and stronger competition (McKinsey, 2001; Baily, 2002). These impacts of ICT on MFP are therefore primarily due to efficient use of labour and capital linked to the use of ICT in the production process. They are not necessarily due to network effects, where one firms’ use of ICT has positive spillovers on the economy as a whole.

99
Spillover effects may also play a role, however, as ICT investment started earlier, and was stronger, in the United States than in most OECD countries (Colecchia and Schreyer, 2001; OECD, 2003). Moreover, previous OECD work has pointed out that the US economy might be able to achieve greater benefits from ICT since it got its fundamentals right before many other OECD countries (OECD, 2001a). Indeed, the United States may have benefited first from ICT investment ahead of other OECD countries, as it already had a high level of competition in the 1980s, which it strengthened through regulatory reforms in the 1980s and 1990s. For example, early and far-reaching liberalisation of the telecommunications sector boosted competition in dynamic segments of the ICT market. The combination of sound macroeconomic policies, well-functioning institutions and markets, and a competitive economic environment may thus be at the core of the US success. A recent study by Gust and Marquez (2002) confirms these results and attributes relatively low investment in ICT in European countries partly to restrictive labour and product market regulations that have prevented firms from getting sufficient returns from their investment (see Chapter 2).
The United States is not the only country where ICT use may already have had impacts on MFP growth. Studies for Australia (Parham et al., 2001; Chapter 6), suggest that a range of structural reforms have been important in driving the strong uptake of ICT by firms and have enabled these investments to be used in ways that generate productivity gains. This is particularly evident in wholesale and retail trade and in financial intermediation, where most of the Australian productivity gains in the second half of the 1990s have occurred.
In sum, the United States and Australia are almost the only OECD countries where there is evidence at the sectoral level that ICT use can strengthen labour and multi-factor productivity growth. In some other countries, including Canada and the United Kingdom, there is evidence that certain ICT-using industries have experienced a pick-up in labour productivity growth, though not in MFP growth. And for many other OECD countries, there is little evidence that ICT-using industries are experiencing an improvement in labour productivity growth, let alone any change in MFP growth. Further improvements in labour and product markets, as well as greater policy efforts to seize the benefits from ICT may be required in these countries before ICT will clearly show up in the productivity statistics.

100
REFERENCES
Aizcorbe, A. (2002), “Why are Semiconductor Prices Falling so Fast? Industry Estimates and Implications for Productivity Measurement”, Finance and Economics Discussion Series 2002-20, Federal Reserve Board, Washington, DC.
Baily, M.N. (2002), “The New Economy: Post Mortem or Second Wind”, Journal of Economic Perspectives, Vol. 16, No. 2, Spring 2002, pp. 3-22.
Bayoumi, T. and M. Haacker (2002), “It’s Not What You Make, It’s How You Use It: Measuring the Welfare Benefits of the IT Revolution Across Countries”, CEPR Discussion Papers No. 3555, Center for Economic Policy Research, London.
Bosworth, B.P and J.E. Triplett (2003), “Services Productivity in the United States: Griliches’ Services Volume Revisited”, paper prepared for CRIW Conference in Memory of Zvi Griliches, Brookings Institution, Washington, DC, September.
Colecchia, A. and P. Schreyer (2001), “The Impact of Information Communications Technology on Output Growth”, STI Working Paper 2001/7, OECD, Paris.
Dean, E.R. (1999), “The Accuracy of the BLS Productivity Measures”, Monthly Labor Review, February, pp. 24-34.
Fixler, D. and K. Zieschang (1999), “The Productivity of the Banking Sector: Integrating Approaches to Measuring Financial Service Output”, Canadian Journal of Economics, Vol. 32, No. 2, pp. 547-569.
Gordon, R.J. (2000), “Does the ‘New Economy’ Measure up to the Great Inventions of the Past?”, Journal of Economic Perspectives, Vol. 14, pp. 49-74.
Gordon, R.J. (2002), “Technology and Economic Performance in the American Economy”, NBER Working Papers, No. 8771, National Bureau of Economic Research, February.
Gust, C. and J. Marquez (2002), “International Comparisons of Productivity Growth: The Role of Information Technology and Regulatory Practices”, International Finance Discussion Papers, No. 727, Board of Governors of the Federal Reserve System, Washington, DC, May.
Gullickson, W. and M.J. Harper (1999), “Possible Measurement Bias in Aggregate Productivity Growth”, Monthly Labor Review, February, pp. 47-67.
Jorgenson, D.W., M.S. Ho and K.J. Stiroh (2002), “Information Technology, Education, and the Sources of Economic Growth across US Industries”, mimeo.
McGuckin, R.H. and K.J. Stiroh (2001), “Do Computers Make Output Harder to Measure”, Journal of Technology Transfer, Vol. 26, pp. 295-321.

101
McKinsey (2001), US Productivity Growth 1995-2000: Understanding the Contribution of Information Technology relative to Other Factors, McKinsey Global Institute, Washington, DC, October.
OECD (1996), Services – Measuring Real Annual Value Added, Paris.
OECD (2000), “OECD Inquiry on National Collection of Services Producer Prices”, Statistics Directorate, September 2000, mimeo.
OECD (2001a), The New Economy: Beyond the Hype, OECD, Paris.
OECD (2001b), OECD Productivity Manual: A Guide to the Measurement of Industry-Level and Aggregate Productivity Growth, OECD, Paris.
OECD (2003a), OECD Science, Technology and Industry Scoreboard, OECD, Paris.
OECD (2003b), ICT and Economic Growth – Evidence for OECD Countries, Industries and Firms, Paris.
OECD (forthcoming), Reader on Quality Adjustment of Price Indices for Information Technology Products, Paris.
Oliner, S.D. and D.E. Sichel (2002), “Information Technology and Productivity: Where are We Now and Where Are We Going?”, Finance and Economics Discussion Series, No. 2002-29, Federal Reserve Board, May.
Parham, D., P. Roberts and H. Sun (2001), Information Technology and Australia’s Productivity Surge, Staff Research Paper, Productivity Commission, AusInfo, Canberra.
Pilat, D., Lee, F. and B. van Ark (2002), “Production and use of ICT: A Sectoral Perspective on Productivity Growth in the OECD Area”, OECD Economic Studies, No. 35, pp. 47-78, OECD, Paris.
Stiroh, K. (2001), “Information Technology and the US Productivity Revival: What Do the Industry Data Say”, Staff Report no. 115, Federal Reserve Bank of New York, New York.
Triplett, J.E. and B. Bosworth (2000), “Productivity in the Services Sector,” in: R.M. STERN (ed.), Services in the International Economy, forthcoming.
United States Council of Economic Advisors (2001), Economic Report of the President 2001, United States Government Printing Office, Washington, DC, February.
Van Ark, B., R. Inklaar and R.H. McGuckin (2002), “‘Changing gear’” – Productivity, ICT and Service Industries: Europe and the United States”, Economics Program Working Paper Series EPWP �02-01, The Conference Board, New York.
Wölfl, A. (2003), “Productivity Growth in Service Industries: An Assessment of Recent Patterns and the Role of Measurement”, STI Working Papers 2003-6, OECD, Paris.
Wyckoff, A.W. (1995), “The Impact of Computer Prices on International Comparisons of Labour Productivity”, Economics of Innovation and New Technology, Vol. 3, No. 2, pp. 277-293.

102
ANNEX
MEASURING LABOUR PRODUCTIVITY AND MULTI-FACTOR PRODUCTIVITY
The productivity measurement in the paper follows the procedures outlined in OECD’s Productivity Manual (OECD, 2001b). Since value added is more widely available in the STAN database than production, productivity measurement in this paper is based on value added. The value-
added based measure of labour productivity by industry ( j� ) is given by the relation jjj LAV ��� . jAV denotes the rate of change of real value-added in industry j and jL the rate of change of labour
input. The aggregate rate of change in value added is a share-weighted average of the industry-specific rate of change of value-added where weights reflect the current-price share of each industry in value-added:
� ��j
jjVA AVsAV , where
VAP
VAPs
VA
jjVAj
VA � , ��j
jjVAVA VAPVAP
On the input side, aggregation of industry-level labour input is achieved by weighting the growth rates of hours worked by industry with each industry’s share in total labour compensation.
� ��j
jjL LsL , where
wL
Lws
jjjL � , ��
j
jj LwwL
Aggregate labour productivity growth is defined as the difference between aggregate growth in value-added and aggregate growth in labour input:
� ��j
jjL
jjVA )LsAVs(�
An industry’s contribution to aggregate labour productivity growth is jjL
jjVA LsAVs � , or the
difference between its contribution to total value-added and to total labour input. If jL
jVA ss � , total
labour productivity growth is a simple weighted average of industry-specific labour productivity growth.
Multifactor productivity growth, on the basis of value added, is computed as the difference between the rate of growth of deflated value-added and the rate of growth of the primary factor inputs. It is straightforward to aggregate industry-level productivity growth to an economy-wide measure. Aggregation weights are simply each industry’s current price share in total value-added.
Source: OECD (2001b).

10
3
Tab
le A
5.1.
Co
ntr
ibu
tio
ns
to la
bo
ur
pro
du
ctiv
ity
gro
wth
by
ind
ust
ry, 1
990-
951
(Con
trib
utio
ns to
val
ue a
dded
per
per
son
enga
ged,
in p
erce
ntag
e po
ints
)
ISIC Rev. 3
Austria
Australia
Belgium
Canada
Denmark
Finland
France
Germany
Ireland
Italy
Japan
Korea
Luxembourg
Mexico
Netherlands
Norway
Spain
Sweden
Switzerland
United Kingdom
United States
Tota
l eco
no
my
01-9
9 2.
32
1.71
1.
90
1.11
1.
99
2.65
1.
13
2.11
2.
39
2.83
1.
36
4.94
2.
08
0.51
0.
63
3.11
1.
22
2.95
-0
.03
2.20
1.
12
ICT-
pro
du
cin
g m
anu
fact
uri
ng
30
-33
0.12
..
0.03
0.
10
0.09
0.
20
0.20
0.
17
0.43
0.
09
0.36
0.
84
-0.0
3 0.
01
0.10
0.
01
0.14
0.
27
0.10
0.
19
0.33
O
ffice
, acc
ount
ing
& c
omp.
mac
h.
30
0.00
..
.. 0.
03
0.02
0.
01
0.05
0.
05
0.28
0.
01
.. 0.
03
.. 0.
02
.. 0.
01
.. 0.
01
0.00
..
..
Ele
ctric
al m
achi
nery
, nec
31
0.
04
.. ..
0.02
0.
04
0.04
0.
04
0.03
0.
12
.. ..
0.02
..
-0.0
1 ..
0.00
..
0.03
0.
00
.. ..
Rad
io, T
V &
com
m. e
quip
men
t 32
0.
06
.. ..
0.04
0.
01
0.19
0.
10
0.07
..
.. ..
0.75
..
0.00
..
0.02
..
0.19
0.
03
.. ..
Med
ical
, pre
cisi
on &
opt
ical
inst
r.
33
0.02
..
.. ..
0.02
0.
00
-0.0
1 0.
03
0.03
0.
02
0.00
0.
05
.. ..
.. -0
.01
.. 0.
04
0.06
..
0.00
IC
T-p
rod
uci
ng
ser
vice
s 64
+72
0.15
0.
43
0.12
0.
08
0.27
0.
13
0.02
0.
18
0.10
0.
12
0.10
0.
23
0.74
0.
19
0.09
0.
19
0.09
0.
24
0.06
0.
18
0.14
P
ost a
nd te
leco
mm
unic
atio
ns
64
0.14
0.
43
0.12
0.
08
0.12
0.
14
0.02
0.
17
0.07
0.
12
0.10
0.
23
0.81
0.
19
0.09
0.
21
0.09
0.
18
0.09
0.
18
0.14
Com
pute
r se
rvic
es
72
0.02
..
.. ..
0.15
-0
.01
0.00
0.
02
0.03
0.
01
.. ..
-0.0
7 ..
.. -0
.03
.. 0.
05
-0.0
3 ..
.. IC
T-u
sin
g s
ervi
ces
0.
59
0.47
0.
77
0.18
0.
36
0.10
0.
01
0.17
0.
15
0.88
1.
13
0.74
0.
22
0.25
0.
10
0.65
-0
.17
0.45
-0
.58
0.37
0.
24
Who
lesa
le &
ret
ail t
rade
, rep
airs
50
-52
0.15
0.
13
0.25
0.
06
0.36
0.
18
0.19
0.
07
-0.0
4 0.
53
0.69
-0
.26
0.16
-0
.33
-0.0
4 0.
50
0.05
0.
42
-0.1
5 0.
15
0.25
Fin
anci
al in
term
edia
tion
65-6
7 0.
23
0.22
..
0.17
-0
.07
-0.0
7 -0
.03
0.07
0.
33
0.25
0.
14
0.58
0.
32
0.27
0.
05
0.21
-0
.18
0.10
-0
.06
0.14
0.
12
Fin
anc.
inte
rm, e
xcl.
insu
r/pe
ns
65
0.24
..
.. ..
-0.0
7 -0
.05
-0.0
5 0.
06
0.21
0.
17
.. ..
0.33
..
.. 0.
20
.. 0.
10
-0.1
2 0.
09
0.06
Ins
uran
ce &
pen
sion
fund
ing
66
0.00
..
.. ..
-0.0
1 0.
00
0.00
0.
03
0.09
0.
03
.. ..
0.09
..
.. 0.
02
.. ..
0.08
0.
05
0.02
Act
iviti
es r
elat
ed to
fin.
. int
. 67
0.
00
.. ..
.. 0.
02
0.00
0.
03
-0.0
1 0.
04
0.03
..
.. -0
.13
.. ..
-0.0
2 ..
.. -0
.02
0.01
0.
01
Ren
ting
of m
&eq
, oth
er b
uss.
act
. 71
-74
0.21
0.
11
.. -0
.05
0.22
-0
.04
-0.1
5 0.
04
-0.1
5 0.
12
0.31
0.
42
-0.2
6 0.
30
0.09
-0
.06
-0.0
4 -0
.07
-0.3
7 0.
10
-0.1
0
Ren
ting
of m
ach.
& e
quip
m.
71
0.07
..
.. ..
0.07
-0
.01
-0.0
2 0.
04
0.01
..
.. ..
0.04
..
.. 0.
00
.. -0
.04
0.00
0.
03
.. R
esea
rch
and
deve
lopm
ent
73
0.02
..
.. ..
0.00
0.
00
-0.0
2 0.
00
-0.0
3 ..
.. ..
.. ..
.. 0.
00
.. 0.
00
-0.0
1 0.
01
..
Oth
er b
usin
ess
activ
ities
74
0.
10
.. ..
.. 0.
00
-0.0
2 -0
.11
-0.0
1 -0
.13
0.11
..
.. -0
.30
.. ..
-0.0
6 ..
-0.0
3 -0
.36
0.03
..
Oth
er a
ctiv
itie
s
1.38
0.
76
0.92
0.
87
1.34
2.
39
0.89
1.
79
1.87
1.
56
-0.3
0 3.
10
0.87
-0
.06
0.52
2.
25
0.83
1.
95
0.41
1.
63
0.34
A
gric
ultu
re, f
ores
try,
fish
ing
01-0
5 0.
31
0.08
0.
07
0.04
0.
23
0.37
0.
19
0.19
0.
52
0.20
0.
06
0.81
0.
07
0.12
0.
17
0.34
0.
03
0.07
-0
.02
0.02
0.
01
Min
ing
and
quar
ryin
g 10
-14
-0.0
1 0.
30
0.01
0.
13
0.05
0.
03
0.
09
0.07
0.
02
0.00
0.
08
0.01
0.
08
0.06
1.
20
0.05
0.
01
-0.0
1 0.
27
0.05
Non
-IC
T m
anuf
actu
ring
15-2
9,
34-3
7 0.
68
0.30
0.
49
0.48
0.
31
0.92
0.
60
1.02
1.
77
0.76
0.
22
1.78
0.
71
0.49
0.
45
0.11
0.
30
0.91
0.
52
0.65
0.
23
Ele
ctric
ity, g
as a
nd w
ater
40
-41
0.06
0.
16
0.08
0.
03
0.10
0.
10
0.01
0.
07
0.11
0.
10
0.07
0.
21
0.04
0.
01
0.04
0.
05
0.05
0.
02
0.16
0.
18
0.06
Con
stru
ctio
n 45
0.
18
0.03
-0
.03
-0.0
1 -0
.04
0.14
0.
09
-0.1
1 -0
.08
-0.0
2 -0
.37
0.39
-0
.19
-0.2
1 -0
.07
0.30
0.
14
0.15
-0
.12
0.14
0.
00
Hot
els
and
rest
aura
nts
55
-0.0
3 -0
.05
0.00
-0
.03
0.02
0.
11
-0.1
0 -0
.09
-0.2
6 -0
.02
-0
.47
-0.0
7 -0
.11
-0.0
6 -0
.01
0.06
0.
05
-0.1
8 -0
.05
0.01
Tra
nspo
rt a
nd s
tora
ge
60-6
3 0.
01
.. ..
0.08
0.
14
0.27
0.
06
0.19
0.
17
0.32
0.
00
0.21
..
-0.0
7 0.
08
0.29
0.
14
-0.0
2 -0
.14
0.13
0.
06
Rea
l est
ate
70
0.15
..
.. 0.
42
0.06
0.
35
0.17
0.
32
-0.0
3 0.
12
0.23
..
0.47
..
.. 0.
11
0.14
0.
29
0.28
0.
02
0.23
Com
m.,
soci
al, p
ers.
ser
vice
s 75
-99
0.03
-0
.06
0.30
-0
.26
0.46
0.
11
-0.1
4 0.
11
-0.4
1 0.
08
-0.5
1 0.
09
-0.1
7 -0
.37
-0.1
5 -0
.15
-0.0
8 0.
47
-0.0
9 0.
26
-0.3
0 S
um
of
sect
ors
2.23
1.
66
1.84
1.
22
2.06
2.
83
1.12
2.
32
2.55
2.
64
1.28
4.
91
1.80
0.
39
0.81
3.
10
0.89
2.
90
-0.0
1 2.
37
1.07
R
esid
ual
0.09
0.
04
0.06
-0
.11
-0.0
7 -0
.18
0.01
-0
.21
-0.1
6 0.
18
0.08
0.
03
0.28
0.
13
-0.1
9 0.
02
0.33
0.
05
-0.0
2 -0
.17
0.05
1. 1
991-
95 fo
r G
erm
any;
199
2-95
for
Fra
nce
and
Italy
and
199
3-95
for
Kor
ea.
Sou
rce:
OE
CD
ST
AN
dat
abas
e, e
stim
ates
for
Irel
and,
Sw
eden
and
Sw
itzer
land
from
dat
a un
derly
ing
van
Ark
et a
l. (2
002b
).

10
4
Tab
le A
5.2.
Co
ntr
ibu
tio
ns
to la
bo
ur
pro
du
ctiv
ity
gro
wth
by
ind
ust
ry, 1
996-
2002
1
(Con
trib
utio
ns to
val
ue a
dded
per
per
son
enga
ged,
in p
erce
ntag
e po
ints
)
ISIC Rev. 3
Austria
Australia
Belgium
Canada
Denmark
Finland
France
Germany
Ireland
Italy
Japan
Korea
Luxembourg
Mexico
Netherlands
Norway
Spain
Sweden
Switzerland
United Kingdom
United States
Tota
l eco
no
my
01-9
9 1.
73
2.10
0.
78
1.65
1.
45
2.02
1.
00
1.38
3.
76
0.56
1.
41
4.07
0.
51
1.82
0.
77
1.71
0.
28
2.67
1.
10
1.08
1.
74
ICT-
pro
du
cin
g m
anu
fact
uri
ng
30
-33
0.11
..
0.13
0.
07
0.09
0.
82
0.21
0.
09
0.89
0.
02
0.36
1.
02
-0.0
1 0.
02
0.03
0.
00
0.01
0.
51
0.13
0.
12
0.45
O
ffice
, acc
ount
ing
& c
omp.
mac
h.
30
0.01
..
.. 0.
02
0.02
0.
00
0.04
0.
02
0.37
0.
00
.. 0.
18
.. ..
.. 0.
02
0.00
0.
01
0.01
..
..
Ele
ctric
al m
achi
nery
, nec
31
0.
05
.. ..
0.01
0.
02
0.04
0.
03
0.01
0.
36
.. ..
-0.0
4 ..
.. ..
-0.0
2 0.
02
0.01
0.
10
.. ..
Rad
io, T
V &
com
m. e
quip
men
t 32
0.
02
.. ..
0.03
0.
00
0.80
0.
10
0.03
..
.. ..
0.80
..
.. ..
0.02
0.
00
0.43
0.
00
.. ..
Med
ical
, pre
cisi
on &
opt
ical
inst
r.
33
0.02
..
.. ..
0.05
0.
01
0.02
0.
03
0.18
0.
00
0.01
0.
02
.. ..
.. -0
.02
0.00
0.
07
0.02
..
-0.0
1 IC
T-p
rod
uci
ng
ser
vice
s 64
+72
0.13
0.
33
0.05
0.
12
0.13
0.
36
0.14
0.
46
0.28
0.
20
0.18
0.
31
0.32
0.
18
0.17
0.
11
0.16
0.
22
0.01
0.
24
0.16
P
ost a
nd te
leco
mm
unic
atio
ns
64
0.13
0.
33
0.05
0.
12
0.15
0.
34
0.15
0.
34
-0.0
3 0.
19
0.18
0.
31
0.43
0.
18
0.21
0.
26
0.15
0.
18
0.04
0.
24
0.16
Com
pute
r se
rvic
es
72
0.00
..
.. ..
-0.0
2 0.
02
-0.0
1 0.
12
0.31
0.
01
.. ..
-0.1
2 ..
-0.0
4 -0
.15
0.01
0.
05
-0.0
4 ..
.. IC
T-u
sin
g s
ervi
ces
0.
51
1.05
0.
17
0.40
0.
37
0.22
-0
.17
0.12
0.
73
0.14
0.
37
0.49
-0
.20
1.17
0.
28
0.57
-0
.03
0.60
0.
29
0.85
1.
29
Who
lesa
le &
ret
ail t
rade
, rep
airs
50
-52
0.20
0.
31
0.12
0.
29
0.28
0.
15
0.02
-0
.02
0.25
0.
05
-0.0
9 0.
10
0.36
0.
73
0.28
0.
64
0.09
0.
40
-0.0
8 0.
28
0.92
Fin
anci
al in
term
edia
tion
65-6
7 0.
18
0.24
-0
.09
0.10
0.
23
0.13
-0
.05
0.21
0.
03
0.13
0.
22
0.30
-0
.07
0.22
-0
.03
0.19
-0
.02
0.24
0.
56
0.16
0.
43
Fin
anc.
inte
rm, e
xcl.
insu
r/pe
ns
65
0.15
..
.. ..
0.16
0.
07
-0.0
4 0.
23
0.03
0.
15
.. ..
-0.1
3 ..
0.00
0.
19
0.00
0.
24
0.50
..
0.21
Ins
uran
ce &
pen
sion
fund
ing
66
0.05
..
.. ..
0.07
0.
04
0.01
-0
.05
0.00
0.
00
.. ..
-0.0
5 ..
-0.0
3 -0
.01
-0.0
5 ..
0.05
..
0.01
Act
iviti
es r
elat
ed to
fin.
. int
. 67
0.
00
.. ..
.. 0.
00
0.03
0.
00
0.01
0.
00
-0.0
2 ..
.. 0.
11
.. 0.
01
0.00
0.
03
.. 0.
01
.. 0.
19
Ren
ting
of m
&eq
, oth
er b
uss.
act
. 71
-74
0.13
0.
50
0.15
0.
01
-0.1
3 -0
.05
-0.1
8 0.
10
0.45
-0
.03
0.25
0.
09
-0.4
9 0.
23
0.00
-0
.25
-0.1
0 -0
.04
-0.1
8 0.
40
-0.0
5
Ren
ting
of m
ach.
& e
quip
m.
71
0.07
..
.. ..
-0.0
1 0.
01
0.02
0.
07
0.04
..
.. ..
0.04
..
0.07
0.
02
0.00
-0
.01
0.00
..
.. R
esea
rch
and
deve
lopm
ent
73
0.00
..
.. ..
0.00
-0
.01
-0.0
3 0.
00
-0.0
2 ..
.. ..
.. ..
-0.0
1 -0
.01
0.00
0.
00
-0.0
2 ..
..
Oth
er b
usin
ess
activ
ities
74
0.
04
.. ..
.. -0
.14
-0.0
8 -0
.15
-0.1
2 0.
43
-0.0
2 ..
.. -0
.53
.. -0
.08
-0.2
6 -0
.10
-0.0
3 -0
.16
.. ..
Oth
er a
ctiv
itie
s
0.87
0.
71
0.43
0.
96
0.76
0.
72
0.76
0.
63
1.93
0.
19
0.42
2.
42
0.14
0.
18
0.33
0.
85
0.32
1.
14
0.74
0.
15
0.27
A
gric
ultu
re, f
ores
try,
fish
ing
01-0
5 0.
15
0.13
0.
04
0.05
0.
12
0.31
0.
07
0.07
0.
24
0.07
0.
06
0.30
-0
.02
0.11
0.
05
0.08
0.
15
0.09
-0
.12
-0.0
3 0.
07
Min
ing
and
quar
ryin
g 10
-14
0.01
0.
16
0.00
0.
00
0.18
0.
00
.. 0.
00
0.01
-0
.01
0.01
-0
.01
0.01
0.
03
0.02
0.
59
0.00
0.
00
0.01
0.
00
-0.0
1
Non
-IC
T m
anuf
actu
ring
15-2
9,
34-3
7 0.
64
0.32
0.
46
0.42
0.
27
0.33
0.
36
0.19
2.
84
0.12
0.
23
1.71
0.
26
0.43
0.
30
0.11
0.
07
0.41
0.
64
0.20
0.
09
Ele
ctric
ity, g
as a
nd w
ater
40
-41
0.11
0.
06
0.11
0.
03
0.00
0.
07
0.06
0.
09
0.09
0.
09
0.13
0.
20
0.05
0.
00
0.03
0.
07
0.13
0.
01
-0.0
1 0.
13
-0.0
1
Con
stru
ctio
n 45
0.
15
0.03
0.
05
0.02
0.
03
-0.0
6 -0
.07
0.09
-0
.38
0.00
-0
.05
0.27
0.
10
-0.3
1 -0
.06
-0.1
9 -0
.14
0.00
0.
02
-0.0
7 -0
.06
Hot
els
and
rest
aura
nts
55
0.04
0.
02
0.00
0.
00
-0.0
5 -0
.06
0.00
-0
.08
-0.2
4 -0
.08
.. -0
.19
-0.0
1 0.
05
0.00
0.
02
-0.0
2 0.
04
0.04
-0
.10
-0.0
1
Tra
nspo
rt a
nd s
tora
ge
60-6
3 0.
05
.. ..
0.06
0.
21
0.15
0.
07
0.10
-0
.05
-0.0
3 -0
.11
0.43
..
0.18
0.
05
0.03
0.
18
0.15
0.
10
0.02
0.
01
Rea
l est
ate
70
0.09
..
.. 0.
35
0.13
0.
26
0.20
0.
24
0.04
0.
02
0.20
..
0.22
..
0.15
0.
21
0.05
0.
11
0.30
0.
08
0.32
Com
m.,
soci
al, p
ers.
ser
vice
s 75
-99
-0.3
7 -0
.02
-0.2
4 0.
04
-0.1
4 -0
.28
0.07
-0
.06
-0.6
2 0.
01
-0.0
3 -0
.29
-0.4
6 -0
.31
-0.2
2 -0
.07
-0.1
1 0.
33
-0.2
2 -0
.07
-0.1
4 S
um
of
sect
ors
1.62
2.
08
0.73
1.
56
1.35
2.
11
0.93
1.
30
3.83
0.
54
1.33
4.
25
0.26
1.
55
0.81
1.
53
0.46
2.
48
1.17
1.
35
2.16
R
esid
ual
0.11
0.
02
0.05
0.
09
0.09
-0
.09
0.07
0.
08
-0.0
7 0.
02
0.08
-0
.17
0.25
0.
28
-0.0
4 0.
18
-0.1
8 0.
19
-0.0
7 -0
.28
-0.4
2
1. 1
996-
98 f
or S
wed
en;
1996
-99
for
Kor
ea a
nd S
pain
; 19
96-2
000
for
Irel
and,
Nor
way
and
Sw
itzer
land
, 19
96-2
001
for
Fra
nce,
Ger
man
y, J
apan
, M
exic
o, N
ethe
rland
s,
Uni
ted
Kin
gdom
and
Uni
ted
Sta
tes.
S
ourc
e: O
EC
D S
TA
N d
atab
ase,
est
imat
es fo
r Ir
elan
d, S
wed
en a
nd S
witz
erla
nd fr
om d
ata
unde
rlyin
g va
n A
rk e
t al.
(200
2b).

105
CHAPTER 6
THE EFFECTS OF ICTS AND COMPLEMENTARY INNOVATIONS ON AUSTRALIAN PRODUCTIVITY GROWTH
Paul Gretton, Jyothi Gali and Dean Parham1 Productivity Commission, Canberra
Abstract
Australia experienced both rapid uptake of ICTs and strong productivity growth in the 1990s. Growth accounting has established some links between the two, but the existence of productivity gains from complementary product and process innovations remained uncertain. Analysis in this paper using firm-level data from the Australian Business Longitudinal Survey shows positive and significant links between ICT use and productivity growth in manufacturing and a range of service industry sectors. Firm-characteristics were found to be important in identifying businesses using ICTs while significant interactions were also found between ICT use and complementary organi-sational characteristics (including skill, improved business practices and business restructuring) in raising productivity. Transition dynamics and time lags were of importance. After an initial pro-ductivity boost associated with the uptake of selected ICTs, productivity effects were estimated to have tapered off over time. Thus, the study suggests that the ultimate productivity effect of a new innovation is a step up in levels, rather than a permanent increase in the rate of growth.
1. This is a shortened version of the paper by the same authors, “Uptake and Impacts of ICTs in the Australian Economy: Evidence from Aggregate, Sectoral and Firm Levels”, presented at the Workshop on ICT and Business Performance, OECD, on 9 December 2002 (available at http://www.pc.gov.au/research/ confproc/uiict/index.html). Econometric estimates based on firm-level data are unchanged but growth accounting estimates have been updated in accordance with a further release of national accounts data. Further econometric work has been undertaken and is documented in forthcoming reports. The paper was prepared as part of a joint research project of the Productivity Commission, the Australian Bureau of Statistics, the Department of Industry, Tourism and Resources, and the National Office for the Information Economy. The joint project was set up to provide an Australian contribution to a set of country studies on ICT and Business Performance, facilitated and co-ordinated by the OECD. The paper and the views expressed should be attributed to the authors and not to the participating agencies. On the other hand, it is stressed that the paper draws on the contributions of all members of the study team from the participating agencies and the guidance and scrutiny of Dr. Trevor Breusch from the Australian National University.

106
6.1 Introduction
Australia’s productivity growth surged in the 1990s. Growth in both labour productivity and multifactor productivity more than doubled, compared with 1980s rates.
Whilst no single explanation for the productivity surge has emerged, the introduction of micro-economic policy reforms over the past 15 years or so has been identified as a major contributor (see, for example, PC 1999, OECD 2001a). Reforms have improved productivity by encouraging and facilitating a process of economic restructuring that has invigorated Australia’s catch-up towards the productivity levels of “leader” economies (Parham 2002a).
Information and communications technologies (ICTs) are also considered to have played a role in Australia’s surge, but through the use of ICT equipment, rather than the manufacture of ICTs (Parham 2002b). Since Australia is a very small producer of ICT equipment, it cannot access substantial multifactor productivity (MFP) gains associated with the production of ICTs, as has been found in the major producing countries. On the other hand, OECD comparisons show that Australia became a relatively high user of ICTs in the 1990s (OECD 2002).
Two links between ICT use and Australia’s labour productivity growth are possible: increased capital deepening (raising the ratio of capital to labour) as businesses step up investment in ICT; and MFP gains associated with ICT use. Whilst the capital deepening component is commonly recognised in the economics literature (see, for example, Jorgenson 2001), the existence and importance of an MFP component associated with ICT use are more controversial.
There are two lines of argument about the possible effects of ICT use on MFP growth. The first looks upon ICTs as a general purpose technology that enables other productivity-enhancing changes. For example, ICTs could provide an indispensable platform upon which further product or process innovations are based (Brynjolfsson and Hitt 2000). The second line of argument looks to spillover effects, such as network economies, as sources of MFP gains. For example, an expansion in connections to the Internet or “closed” networks could reduce search and transactions costs for businesses.
This paper explores the nature and importance of the links between ICTs and Australian productivity at the aggregate, sectoral and firm levels. A broad indication of the importance of ICTs in Australia’s improved economic performance can be obtained from productivity growth accounting at the aggregate and industry-sector levels. However, such exercises provide a statistical accounting or decomposition and are suggestive, rather than conclusive, on the nature and extent of the links between ICTs and productivity growth. Importantly, they do not control for other factors that can influence productivity growth.
Fortunately, an Australian firm-based longitudinal dataset can be used to analyse ICT-productivity links with controls on other influences. This dataset enables comprehensive analysis that is not readily handled elsewhere – analysis of ICTs and complementary changes at the firm level and analysis of ICT-related effects in a range of industry sectors including services as well as manufacturing.
The paper has two main parts. The next section explores the extent of and reasons for the strong uptake of ICTs in Australia. Section 6.3 investigates the performance effects of ICTs at the aggregate, sectoral and firm levels. Both growth accounting and econometric approaches are used. Conclusions and implications are set out in section 6.4.

107
6.2 Uptake of ICTs
Australia’s investment in ICTs has been growing strongly for decades, but initially from a low base. National accounts data2 (covering information technology equipment, but not communications equipment) show that real IT investment grew from around 3% of total market sector investment in 1989-90 to around 19% in 2000-01. Growth of 31% a year in the second half of the 1990s was sufficient to double the rate of investment every three years.
Services industries featured very prominently in the uptake of ICTs, absorbing at least three-quarters of total market sector IT investment (about 10 percentage points more than their share of market sector output).3 The Finance & insurance sector stands out as the main area of uptake, with a 25-27% share of investment – more than double its output share. Manufacturing has also been a major user (around 15-17%). These two sectors were major contributors to the acceleration in market sector IT use in the 1990s (Table 6.1). Other prominent sectors were Wholesale trade, Retail trade, Transport & storage and Communication services.
The uplift in ICT use was particularly strong from 1995. Some cyclical and one-off factors – the dampening effect of the early 1990s recession and the accelerating effect of defensive expenditure to forestall the threat of the “Y2K bug” – may have also contributed to the perception of a post-1995 “boom”. Nevertheless, some genuine post-1995 developments, including more rapid technological advances and price declines, contributed to an uplift in ICT investment trends.
But strong growth in ICT use goes back well before 1995. Some sectors (Finance & insurance, Communication services and Cultural & recreational services) raised their use of ICTs strongly from the second half of the 1980s.
Survey data4 show that there was rapid diffusion of ICTs among firms in the 1990s to match the rapid growth in investment and use. In 1993-94, around 50% of firms in a wide range of sectors used computers and around 30% had Internet access (Figure 6.1). By 2000-01, these proportions had grown to nearly 85% and 70% respectively. But the penetration still varies across industries (Table 6.1).
Large firms were earlier and stronger in the uptake of ICTs. Data from the Business Longitudinal Survey (BLS)5 suggest that nearly all medium to large firms (i.e. firms employing 50 persons or more) used computers by 1996-97. However, the uptake of computers by “smaller” firms (i.e. with employment of up to 50 persons) varied substantially across sectors. For example, over 70% of small firms in the Wholesale trade, Finance & insurance, Property & business services and Cultural & recreational services were computer users by this time. On the other hand, only around 40% of small firms in the Retail, Accommodation etc., and Transport & Storage sectors were computer users.
2. Australian Bureau of Statistics (ABS), Australian System of National Accounts, Cat. no. 5204.0.
3. Gretton, Gali and Parham (2002).
4. Australian Bureau of Statistics (ABS), Business Use of IT, Cat. no. 8129.0.
5. The BLS is a longitudinal dataset, compiled by the ABS and cast over four years from 1994-95 to 1997-98. It gathered a considerable range of performance, operational and related data from up to 9 000 firms. A panel of over 4 000 firms were included in all four survey years.

108
6.2.1 Analysis of factors influencing the use of ICTs
Formal modelling was used to explore the factors affecting firms’ use of computers and the Internet. An overview of the approach is provided in appendix 1. In essence, BLS data from four years (1994-95 to 1997-98) were pooled and firms’ use of ICT and the Internet (in logit and probit form) was regressed against a number of explanatory variables including time, firm size and firm age. There were separate regressions for eight industry sectors.
Table 6.1. Summary statistics on ICT use and MFP growth by industry sector
National accounts (1993-94 to 1998-99) Business use of IT (2000-01)
IT growtha MFP growth Proportion of firms using
Sector Contrib to mkt. sect.
acceler.b
Sector Contrib to mkt. sect.
acceler.b
Computers Internet Web
%pa pp %pa pp % % %
Agriculture 25.9 0.1 4.3 0.0 - - -
Mining 28.5 0.1 0.1 -0.3 88 79 30
Manufacturing 29.0 1.2 0.5 -0.5 81 66 28
Elect., gas & water 28.9 0.9 1.8 -0.2 95 89 44
Construction 22.5 0.1 2.2 0.4 80 64 10
Wholesale trade 21.4 -0.1 5.8 1.1 89 77 33
Retail trade 24.6 0.1 1.4 0.1 78 57 22
Accommodation, etc. 25.2 0.0 0.8 0.1 71 53 26
Transport & storage 16.9 -0.7 1.8 0.1 76 60 19
Communications 17.5 -0.6 5.1 -0.1 78 58 20
Finance & insurance 25.4 1.4 1.7 0.3 90 81 22
Cult. & rec. services 25.5 0.1 -4.1 -0.1 87 74 30
Market sector 24.2 2.6 1.8 1.1 - - -
Prop. & bus. services 93 85 25
Health & comm. 89 72 14
Personal services 72 52 22
Total 84 69 22
a. Annual average rates of growth in IT capital services.
b. Sector contribution to acceleration in market sector growth between the last two complete productivity cycles — 1988-89 to 1993-94 and 1993-94 to 1998-99.
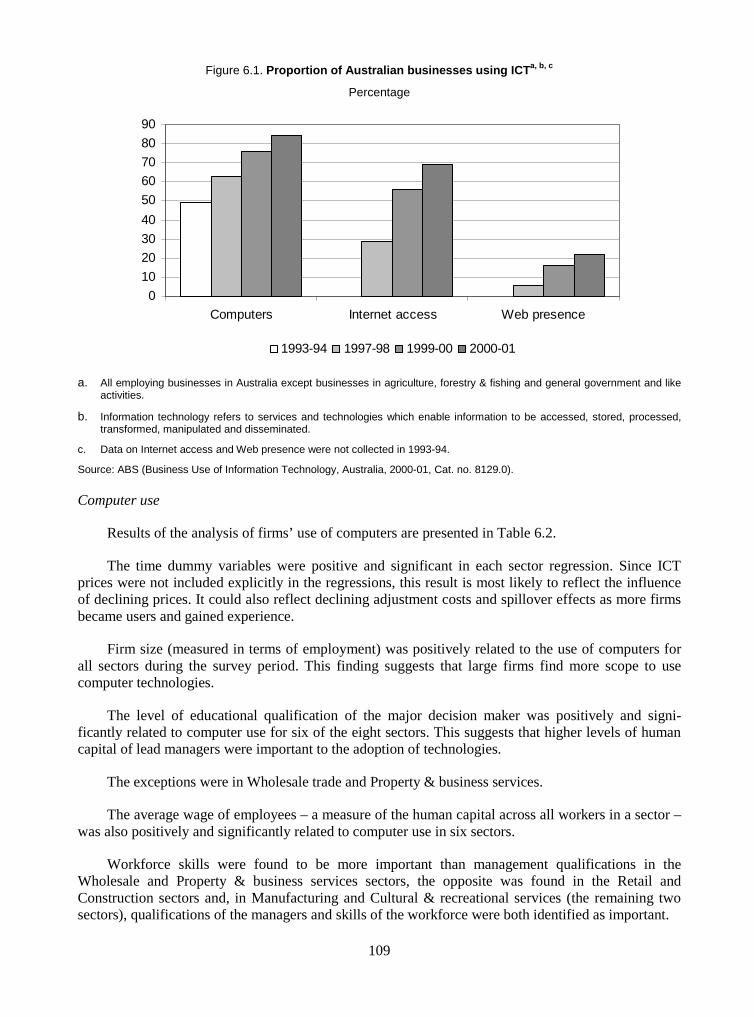
109
Figure 6.1. Proportion of Australian businesses using ICTa, b, c
Percentage
0
10
20
30
40
50
60
70
80
90
Computers Internet access Web presence
1993-94 1997-98 1999-00 2000-01
a. All employing businesses in Australia except businesses in agriculture, forestry & fishing and general government and like activities.
b. Information technology refers to services and technologies which enable information to be accessed, stored, processed, transformed, manipulated and disseminated.
c. Data on Internet access and Web presence were not collected in 1993-94.
Source: ABS (Business Use of Information Technology, Australia, 2000-01, Cat. no. 8129.0).
Computer use
Results of the analysis of firms’ use of computers are presented in Table 6.2.
The time dummy variables were positive and significant in each sector regression. Since ICT prices were not included explicitly in the regressions, this result is most likely to reflect the influence of declining prices. It could also reflect declining adjustment costs and spillover effects as more firms became users and gained experience.
Firm size (measured in terms of employment) was positively related to the use of computers for all sectors during the survey period. This finding suggests that large firms find more scope to use computer technologies.
The level of educational qualification of the major decision maker was positively and signi-ficantly related to computer use for six of the eight sectors. This suggests that higher levels of human capital of lead managers were important to the adoption of technologies.
The exceptions were in Wholesale trade and Property & business services.
The average wage of employees – a measure of the human capital across all workers in a sector – was also positively and significantly related to computer use in six sectors.
Workforce skills were found to be more important than management qualifications in the Wholesale and Property & business services sectors, the opposite was found in the Retail and Construction sectors and, in Manufacturing and Cultural & recreational services (the remaining two sectors), qualifications of the managers and skills of the workforce were both identified as important.

110
The intensity with which advanced business practices such as business planning, budget forecasting and inter-firm comparisons were used by firms was positively and significantly related to the use of computers in each sector. The direction of causality is not clear cut. Management practices could highlight a need for ICTs, or the presence of ICTs could enable use of advanced business practices.
Being an incorporated company was positively and significantly related to the use of computers for five sectors. More computer use could stem from the additional reporting requirements associated with incorporation.
At least one of the variables representing firm reorganisation (listed under the heading “Organisational and processing efficiency”) was positively and significantly related to computer use in all sectors, except Cultural & recreational services.6 These results support the view that the take up of ICTs was more prominent among firms undergoing restructuring. Again, the direction of causality is ambiguous. A firm reorganisation could lead to computer use to support change or, alternatively, the adoption of ICT could create a need or opportunity for organisational changes.
A negative relation in Transport & storage, however, is difficult to interpret. Even so, it does not rule out the possibility that ICTs have been useful in transport networks that cover a wide geographic area, perhaps coordinated from a single location.
A positive relationship was generally found between ICT use and the existence of any product innovation (involving new or substantially changed goods and services) at any point over the period. However, the relationship with frequency of product innovation was more mixed.
Frequency of innovation was positive in Manufacturing and Construction but negative in Accommodation, cafes & restaurants and, again, in Transport & storage. 7, 8
Overall, large firms with more skilled managers and workforce, a greater propensity to use advanced business practices and implement organisational change were the firms most likely to have been computer users during the mid-1990s period.
6. The intensity of restructuring variable was based on an index of 11 within-period possibilities (such as changes in range of products and services, advertising, technical and on the job training, and business structure). The “flag” variable indicates whether firms restructured in any one of the four survey years.
7. It should also be noted that the sample weight was significant and negative in five of the eight cases. These results suggest that firms with a low probability of sample selection (i.e. firms with the highest sample weights) were biased towards non-computer users and this bias was stronger in some sectors than others. For Cultural & recreational services the bias appears to have gone in the opposite direction.
8. The instances of negative results on product innovation are at odds with the view that the use of ICT enhances the ability of a firm to “innovate”. They may signify the possibility that: the take-up and use of advanced technologies may be more directly associated with “input” (or process) innovation such as adoption of new business strategies, business processes and organisational structures (covered by other explanatory variables); the scope for frequent product innovations may be more limited in particular industries; or the significance of innovation is not reflected in the number of innovations in some cases. It may also indicate lagged relationships between computer use or product innovation, or data consider-ations that are not fully reflected in the model specification.

11
1
Tab
le 6
.2. C
har
acte
rist
ics
of
firm
s u
sin
g c
om
pu
ters
, 199
4-95
to
199
7-98
a
Poo
led
cros
s-se
ctio
n re
gres
sion
, unw
eigh
ted
estim
ates
Sec
tor
sum
mar
y
Cha
ract
eris
tic
Mne
mon
ic
Expected sign
Manufacturing
Construction
Wholesale trade
Retail trade
Accom., cafes & restaurans
Transport & storage
Property & bus. services
Cultural & rec. services
No. of positives
No. of negatives
Dum
my
1996
T
DU
M96
+
+
***
+**
* +
***
+**
* +
**
+**
+
**
+*
8
Dum
my
1997
T
DU
M97
+
+
***
+**
* +
***
+**
* +
***
+**
+
# +
* 8
Dum
my
1998
T
DU
M98
+
+
***
+**
* +
***
+**
* +
***
+**
* +
**
+**
* 8
Ab
sorp
tive
cap
acit
y
Em
ploy
men
t _T
OT
FT
E
+
+**
* +
***
+**
* +
***
+**
* +
***
+**
* +
**
8
Bus
ines
s lo
catio
ns
_BU
SLO
CS
+
+*
+#
-***
+
#
3 1
Old
er fi
rm fl
ag
DA
GE
2 +
-***
+
**
-*
**
+**
-*
**
+#
3 3
Fin
anci
al c
on
dit
ion
s
Low
pro
fitab
ility
flag
D
EB
IT1
-
-#
+#
+
***
+**
* -*
+
# 4
2
Hu
man
cap
ital
Edu
catio
n of
dec
isio
n m
aker
E
DU
CA
TN
+
+
# +
*
+**
+
# +
**
+
# 6
Ter
tiary
qua
lif. o
f dec
isio
n m
aker
T
ER
TQ
UA
+
+
# -#
-**
-#
1
3
Ave
rage
wag
e W
AG
ER
AT
E
+
+**
*
+**
+**
* +
***
+#
+#
6
Info
rmat
ion
an
d k
no
wle
dg
e
Use
of a
dvan
ced
bus.
pra
ctic
es
_BU
SP
RA
C
+
+**
* +
# +
***
+**
* +
***
+**
* +
***
+*
8
Org
anis
atio
nal
an
d m
anag
emen
t co
nd
itio
ns
Uni
on m
embe
rshi
p _U
NIO
NM
E
-/+
+
# -#
-#
1 2
Typ
e of
lega
l org
anis
atio
n T
OLO
+
+
***
+
**
+**
*
+**
+
#
5

11
2
Tab
le 6
.2. C
har
acte
rist
ics
of
firm
s u
sin
g c
om
pu
ters
, 199
4-95
to
199
7-98
a (c
ontin
ued)
Poo
led
cros
s-se
ctio
n re
gres
sion
, unw
eigh
ted
estim
ates
Sec
tor
sum
mar
y
Cha
ract
eris
tic
Mne
mon
ic
Expected sign
Manufacturing
Construction
Wholesale trade
Retail trade
Accom., cafes & restaurans
Transport & storage
Property & bus. services
Cultural & rec. services
No. of positives
No. of negatives
Org
anis
atio
nal
an
d p
roce
ssin
g e
ffic
ien
cy
Inte
nsity
of r
estr
uctu
ring
_BU
SR
ES
T
+
+**
* +
***
+**
* +
***
+**
+
**
+**
7
Res
truc
turin
g fla
g R
ES
TD
1 +
+
***
+**
*
+**
+
**
4
Pro
du
ct in
no
vati
on
Inno
vatio
n fla
g IN
NO
D1
+
-#
+
# +
# +
# +
**
+**
5 1
Fre
quen
cy o
f inn
ovat
ion
INN
OF
RE
Q
+
+**
+
**
-#
-*
* -*
**
+
# 3
3
Op
enn
ess
Exp
ort i
nten
sity
_E
XP
INT
+
+
# -#
-#
+
# +
#
3 2
Sam
ple
bia
s
Sam
ple
wei
ght
_WG
HT
_F
-
-*
**
-***
-*
**
-***
-#
+
# 1
5
Dia
gn
ost
ics
Per
iod
1994
-95
to
1997
-98
Mod
el
Unw
eigh
ted,
Lo
git
A
vera
ge
Obs
erva
tions
N
o.
5
340
936
2 41
9 1
164
595
596
2 38
8 38
4
Firm
s us
ing
com
pute
rs
%
89
%
71%
95
%
78%
56
%
75%
88
%
86%
79
%
Cor
rect
pre
dict
ions
%
90%
75
%
95%
83
%
80%
79
%
89%
87
%
84%
***
Coe
ffici
ent s
igni
fican
t at t
he 1
% le
vel,
** a
t the
5%
leve
l or
* at
the
10%
leve
l. #
Coe
ffici
ent r
elev
ant a
s in
dica
ted
by a
t-st
atis
tic >
1.
a.
Firm
s in
the
BLS
onl
y in
199
4-95
and
firm
-rec
ords
with
inco
mpl
ete
data
are
not
incl
uded
in t
he r
egre
ssio
n. T
ypic
ally
eac
h fir
m is
obs
erve
d fo
ur ti
mes
. S
ourc
e: R
egre
ssio
n an
alys
is b
ased
on
the
BLS
Con
fiden
tialis
ed U
nit R
ecor
d F
ile (
CU
RF
). S
ee A
BS
(B
usin
ess
Long
itudi
nal S
urve
y, 1
994-
95 to
19
97-9
8, C
at.
no.
8141
.0.3
0.00
1).
The
num
ber
of b
usin
ess
loca
tions
was
pos
itive
ly r
elat
ed t
o co
mpu
ter
use
for
a nu
mbe
r of
sec
tors
. T
his
sugg
ests
that
ICT
s w
ere
usef
ul in
coo
rdin
atio
n of
firm
s’ a
ctiv
ities
bet
wee
n lo
catio
ns, i
ncre
asin
g w
ith th
e nu
mbe
r of
loca
tions
.

113
Internet access
Analysis of the characteristics of firms with Internet access was based on pooled cross-section data for firms with computers for the years 1996-97 and 1997-98. There was not sufficient information on Internet access in the BLS to include data for 1994-95 and 1995-96. For reasons of space, the results of this analysis are not specifically reported here (see Gretton, Gali and Parham 2002 for details).
Overall, as with computer usage, the analysis suggested that larger firms with more skilled managers and workforce, a greater propensity to use advanced business practices and implement organisational change were more likely to have been early adopters of Internet communications. The results support the findings of Loundes (2002) on the link between process and product innovation and Internet access, although the link between product innovation and Internet access is evident for some sectors but not others in our work. Openness to international trade was also important in some sectors.
6.3 Performance effects of ICTs
As noted in the introduction, some indication of any association between ICTs and improved productivity performance can be gained from aggregate and sectoral productivity growth accounting. But firm-based econometric analysis provides the scope for clearer insights. Aggregate and sectoral growth accounting and firm-based modelling are reported here. The growth accounting estimates have been updated since Gretton, Gali and Parham (2002), but the modelling results are the same.
6.3.1 Contributions to aggregate productivity growth
Growth accounting involves a statistical decomposition of growth in labour productivity into contributions from capital deepening – increases in the capital-labour ratio – and MFP growth.
With the very strong growth in ICT investment, it is not surprising that the IT capital deepening contribution to labour productivity growth climbed to a very substantial proportion in the 1990s (Figure 6.2). Between 1993-94 and 1998-999, IT capital deepening accounted for a third of the very strong labour productivity growth of 3.2% a year (Table 6.3). IT capital deepening also made a strong contribution of 0.3 of a percentage point to the labour productivity acceleration of 1.2 percentage points between the last two productivity cycles (Table 6.3).
However, in an accounting sense, the larger IT capital deepening contribution has come at the expense of the other-capital deepening contribution, which meant that there was no change in the overall rate of capital deepening. Controlling for cyclical effects, the faster growth in IT use has been offset by slower growth in use of other forms of capital. Figure 6.2 shows very little change in the overall rate of capital deepening across all productivity cycles (apart from the 1984-85 to 1988-89 cycle, during which there was particularly strong employment growth). Table 6.3 confirms this off-setting effect over the last two (complete) productivity cycles.
The strong surge in MFP growth in the 1990s therefore fully accounted for the labour pro-ductivity acceleration (Table 6.3). But there is no way of determining from the aggregate growth accounting whether, or to what extent, use of IT is associated with the acceleration in MFP growth. Parallels with the US experience suggest that one or two-tenths of a percentage point of the MFP
9. These two years are productivity peaks and define a complete productivity cycle.

114
acceleration – up to a maximum of 0.3 of a percentage point – could be associated with IT use (Parham 2002b).
Figure 6.2. Contributions to average annual labour productivity growth over productivity cycles, 1964-65 to 2001-02a
Percentage points
-0.5
0.5
1.5
2.5
3.5
1964-65 to1968-69
1968-69 to1973-74
1973-74 to1981-82
1981-82 to1984-85
1984-85 to1988-89
1988-89 to1993-94
1993-94 to1999-00
Hardware capital deepening Software capital deepening
Other capital deepening MFP growth
a. The final period, 1998-99 to 2001-02 is not a complete productivity cycle.
Source: Productivity Commission estimates based on unpublished ABS data.
Table 6.3. Contributions to the acceleration in average annual labour productivity growtha in the 1990s
Per cent per year, percentage points and (per cent)
1988-89 to 1993-94 1993-94 to 1998-99 Acceleration
Labour productivity growth 2.0 (100) 3.2 (100) 1.2
Capital deepening 1.3 (66) 1.4 (42) 0.0
- Information technology 0.6 (31) 1.0 (30) 0.3
� Hardware 0.2 (12) 0.6 (20) 0.4
� Software 0.4 (19) 0.3 (10) -0.1
- Other capital 0.7 (35) 0.4 (12) -0.3
MFP growth 0.7 (34) 1.8 (58) 1.1
a. Numbers in brackets are percentage contributions to labour productivity growth. Factor income shares, used in calculating contributions are averaged over the periods indicated.
Source: Productivity Commission estimates based on unpublished ABS data.

115
It has been common in other growth accounting studies to assess the contribution of IT and other factors to productivity growth in the first and second halves of the 1990s, without controlling for effects of the business cycle. Unsurprisingly, this approach gives rise to more prominent IT-capital deepening and this is not entirely offset by slower other-capital deepening.10
6.3.2 Performance effects at the sectoral level
The seemingly small productivity impact of ICTs at the aggregate level masks more prominent associations at the sectoral level. The strength of IT capital deepening varied across industries in the late 1990s (Table 6.4). It was particularly strong in Finance & insurance and was above average in Manufacturing and Electricity, gas & water. But only in Finance & insurance did IT-capital deepening either make the strongest contribution or raise labour productivity growth above the average.
The ICT-productivity associations appear even weaker across industries when the contribution to labour productivity acceleration over the last two productivity cycles are examined (Table 6.5).
Table 6.4. Contributions to sectoral labour productivity growth, 1993-94 to 1998-99
Per cent per year and percentage points
Labour
productivity growth
Capital deepening
IT capital deepening
Other capital deepening
MFP growth
%pa pp pp pp pp
Agriculture 3.7 -0.5 0.2 -0.7 4.3
Mining 5.2 5.1 0.3 4.8 0.1
Manufacturing 2.4 1.9 1.2 0.7 0.5
Electricity, gas & water 7.2 5.5 1.2 4.3 1.8
Construction 2.4 0.1 0.6 -0.5 2.2
Wholesale trade 6.8 0.9 0.7 0.2 5.8
Retail trade 2.3 0.9 0.9 0.1 1.4
Accom., cafes & restaurants 1.8 0.9 0.6 0.3 0.8
Transport & storage 2.3 0.5 0.6 -0.1 1.8
Communication services 7.4 2.1 1.0 1.0 5.1
Finance & insurance 4.4 2.8 3.2 -0.4 1.7
Cultural & rec. services -0.7 3.8 1.0 2.8 -4.1
Market sector 3.2 1.4 1.0 0.4 1.8
Source: Productivity Commission estimates based on unpublished ABS data.
None of the three industries with the strongest uplift in ICT-capital deepening (Finance & insurance, Electricity, gas & water and Manufacturing) had above average acceleration in labour productivity growth. In fact, MFP growth slowed in Manufacturing and Electricity, gas & water.
10. This finding, as presented in Gretton, Gali and Parham (2002), is not undermined by revisions to national accounts data.

116
The strongest case for any association between uplift in ICT use and MFP acceleration is in Finance & insurance. There is some possibility also in Wholesale trade, Accommodation, cafes & restaurants and Construction. But an association in the second biggest investor in ICTs – Manufacturing – is not apparent.
The partial overlap of industries showing high uptake of ICTs and productivity in both Australia and the USA strengthens the possibility that ICTs are having some causal effect on productivity. US industries that are high ICT users and have strong productivity improvements include financial intermediation, distribution (wholesale and retail trade) and business services (Nordhaus 2001, CEA 2001 and Pilat and Lee 2001).
The productivity gains in Finance & insurance are consistent with substantial restructuring, greater use of electronic transactions and a reduction in face-to-face transactions. New financial and risk-management products, made possible by improved information storage and processing, have been developed and offered. Output has grown with fewer unit requirements for physical offices and staff (Weir 2002, Oster and Antioch 1995).
Table 6.5. Contributions to accelerations in sectoral productivity growth, over the last two productivity cyclesa
Percentage points
Contributions to sectoral labour productivity acceleration
Labour productivity acceleration
Capital deepening
IT capital deepening
Other capital
deepening MFP growth
Agriculture -1.1 -1.0 0.1 -1.1 0.0
Mining -0.1 2.2 0.2 2.0 -2.2
Manufacturing -1.7 -0.3 0.5 -0.8 -1.5
Electricity, gas & water -0.1 2.3 0.9 1.4 -2.2
Construction 2.0 -0.8 0.1 -0.9 2.7
Wholesale trade 8.2 0.1 0.2 -0.1 8.0
Retail trade 0.7 0.0 0.2 -0.2 0.7
Accom., cafes & restaurants 3.4 0.6 0.3 0.3 2.8
Transport & storage 0.4 -0.6 -0.2 -0.5 1.0
Communication services -2.2 -1.3 -0.4 -0.9 -1.0
Finance & insurance 0.8 -0.9 0.9 -1.7 1.7
Cultural & rec. services -0.2 1.7 0.0 1.7 -1.7
Market sector 1.2 0.0 0.3 -0.3 1.1
a. The last two productivity cycles are 1988-89 to 1993-94 and 1993-94 and 1998-99.
Source: Productivity Commission estimates based on ABS data.

117
The strong productivity gains in Australia’s Wholesale trade are consistent with transformation of some activities from storage-based configurations to “fast flow-through” systems (Johnston et al. 2000). The sector has not become much more ICT-intensive. But ICTs have played a part in the transformation through the increased use of bar-coding and scanning technology, communications and tracking systems and inventory management systems. Less storage and handling has reduced input requirements. Part of the very strong productivity acceleration in Wholesale trade can be attributed to ICTs and part to “catch-up” gains.
The weak correlation between ICT use and MFP growth across industries reflects the fact that non-ICT factors, including policy reform, have had independent effects on productivity performance. More formal analysis is needed to control for other influences.
6.3.3 Performance effects at the firm level
BLS data for 1996-97 indicate that firms using computers were on average more likely to have had higher labour productivity than those that did not (Gretton, Gali and Parham 2002). There was also a tendency for firms that had used computers longer to have had higher labour productivity on average, although there were significant differences across sectors.
An overview of the methodology used to formally analyse the effect of ICTs on firm productivity is presented in appendix 1. The essential features of the methodology are:
� Growth in labour productivity was analysed in a framework consistent with formal growth theory.
� Explanatory variables included duration of computer use and whether or not firms used the Internet.
� Growth in fixed capital, lagged level of labour productivity (to allow for the possibility of conditional convergence) and firm size were also included.
Computer use was generally found to have had a positive and statistically significant influence on labour productivity growth in all eight sectors (Table 6.6). For example, firms in Manufacturing, Construction, Wholesale and Retail trade that had used computers for a short period (around two years) were estimated to have raised labour productivity growth by between 0.2 and just over 0.3 of a percentage point.
A particular dynamic effect on firm productivity growth was found, with the productivity response forming an inverted “U” pattern as the duration of ICT use increased (Figure 6.3). The initial impact of computer take-up tends to be negligible (or a small negative/positive). As the duration of computer use increases, so do the positive effects on firm performance. But, after a period of adjustment of around five years, the productivity growth stimulus of computer take-up appears to have been largely completed.
However, the results should be interpreted cautiously as they do not incorporate changes in the intensity of computer use and the variables for the earlier years in the survey period were imputed using information collected towards the end of the period.
Figure 6.3 also indicates that Internet access typically had a positive and significant influence on productivity growth. (Available information did not support the analysis of time profiles for this aspect of ICT use.)

11
8
Tab
le 6
.6. E
stim
ated
imp
act
of
ICT
on
pro
du
ctiv
ity
gro
wth
– b
asic
mo
del
Reg
ress
ion
coef
ficie
nts,
dep
ende
nt v
aria
ble
is c
hang
e in
labo
ur p
rodu
ctiv
ity, u
nwei
ghte
d es
timat
es
M
anuf
actu
ring
Con
stru
ctio
n W
hole
sale
tr
ade
Ret
ail t
rade
A
ccom
mo-
datio
n, c
afes
&
rest
aura
nts
Tra
nspo
rt a
nd
stor
age
Pro
pert
y an
d bu
sine
ss
serv
ices
Cul
tura
l and
re
crea
tiona
l se
rvic
es
Inte
rcep
t 1.
498*
**
2.40
9***
1.
815*
**
1.68
3***
1.
333*
**
1.52
5***
1.
756*
**
0.51
8**
Log(
y t-1)
-0.4
23**
* -0
.638
***
-0.4
78**
* -0
.48*
**
-0.3
91**
* -0
.415
***
-0.4
5***
-0
.224
***
k do
t 0.
397*
**
0.27
2***
0.
422*
**
0.38
5***
0.
334*
**
0.39
0***
0.
333*
**
0.29
7***
Siz
e (’0
0)b
0.04
7*
0.21
0*
0.02
2 -0
.228
***
-0.1
99#
0.08
7 -0
.004
-0
.232
#
ICT
_d1(
<2y
rs)
0.12
4***
-0
.095
# -0
.005
0.
124*
* 0.
071
0.13
1#
-0.0
25
-0.1
48
ICT
_d2
(sho
rt)
0.22
3***
0.
319*
**
0.28
3***
0.
202*
**
0.17
8#
0.16
9#
0.13
9#
0.53
9**
ICT
_d3
(2-5
yr)
0.13
0***
0.
061
0.13
6**
0.12
4***
0.
187*
**
0.09
7#
-0.0
11
0.31
8*
ICT
_d4
(5+
yrs
) 0.
054*
-0
.132
# -0
.025
0.
052#
0.
110#
0.
007
-0.1
52
0.21
0#
Net
acc
0.06
4***
0.
059
0.08
2***
0.
072*
0.
051
0.06
5 0.
132*
**
0.16
3#
Cap
ital
sh
are
Aus
tral
ian
natio
nal
acco
unts
a 0.
40
0.26
0.
30
0.20
0.
24
0.36
0.
37
0.41
Mo
del
su
mm
ary
Pan
el m
odel
O
ne w
ay R
E
One
way
RE
O
ne w
ay R
E
One
way
RE
O
ne w
ay R
E
One
way
RE
O
ne w
ay R
E
One
way
RE
BLS
ob
serv
atio
ns
8 07
7 1
398
3 37
5 2
570
952
942
3 61
5 56
5
Mod
el
obse
rvat
ions
4
503
623
1 85
8 1
299
477
432
1473
18
7
Num
ber
of fi
rmsb
1 79
0 28
9 73
8 54
9 20
7 19
2 65
2 92
R2
0.40
0.
46
0.40
0.
44
0.40
0.
43
0.41
0.
30
BP
LM
test
15
.31
0.63
0.
36
3.23
6.
09
2.18
9.
36
3.17
Hau
sman
�2
test
3
809.
84
120.
91
1 19
6.7
352.
64
318.
25
122.
1 97
0.07
17
9.24
Wal
d �
2 test
1
783.
71
656.
35
1 73
8.84
1
242.
7 32
6.05
41
5.74
1
329.
71
91.6
7
***
Sig
nific
ant a
t 1%
leve
l, **
5%
leve
l, *
10%
leve
l, #
rele
vant
with
the
t-st
atis
tic is
at l
east
one
.
a.
Nat
iona
l acc
ount
s ca
pita
l inc
ome
excl
usiv
e of
an
allo
wan
ce fo
r la
bour
inco
me
of o
wne
r op
erat
ors
incl
uded
in th
e na
tiona
l acc
ount
s ag
greg
ate
gros
s op
erat
ing
surp
lus
and
mix
ed
inco
me.
(D
ata
wer
e no
t ava
ilabl
e to
com
plet
e th
e ad
just
men
t for
Pro
pert
y &
bus
ines
s se
rvic
es).
b.
Firm
s in
the
BLS
onl
y in
199
4-95
and
firm
s w
ith in
com
plet
e da
ta n
ot in
clud
ed in
the
regr
essi
on. T
ypic
ally
, eac
h fir
m is
obs
erve
d th
ree
times
.
Sou
rce:
R
egre
ssio
n an
alys
is b
ased
on
the
BLS
Con
fiden
tialis
ed U
nit R
ecor
d F
ile (
CU
RF
). S
ee A
BS
(B
usin
ess
Long
itudi
nal S
urve
y, 1
994-
95 to
199
7-98
, Cat
. no.
814
1.0.
30.0
01).

119
Figure 6.3. Contribution of ICT to productivity growtha – basic model
Percentage points
Manufacturing Construction
-0.04-0.020.000.020.040.060.080.100.120.140.16
Internet <2 yrs shorter use 2-<5 yrs >=5 yrs
-0.04
-0.02
0.00
0.02
0.04
0.06
0.08
0.10
0.12
0.14
0.16
Internet <2 yrs shorter use 2-<5 yrs >=5 yrs
Wholesale trade Retail trade
-0.04
-0.02
0.00
0.02
0.04
0.06
0.08
0.10
0.12
0.14
0.16
Internet <2 yrs shorter use 2-<5 yrs >=5 yrs
-0.04
-0.02
0.00
0.02
0.04
0.06
0.08
0.10
0.12
0.14
0.16
Internet <2 yrs shorter use 2-<5 yrs >=5 yrs
Accommodation, cafes and restaurants Transport and storage
-0.04
-0.02
0.00
0.02
0.04
0.06
0.08
0.10
0.12
0.14
0.16
Internet <2 yrs shorter use 2-<5 yrs >=5 yrs
-0.04
-0.02
0.00
0.02
0.04
0.06
0.08
0.10
0.12
0.14
0.16
Internet <2 yrs shorter use 2-<5 yrs >=5 yrs
Property and business services Cultural and recreational services
-0.04
-0.02
0.00
0.02
0.04
0.06
0.08
0.10
0.12
0.14
0.16
Internet <2 yrs shorter use 2-<5 yrs >=5 yrs
-0.04
-0.02
0
0.02
0.04
0.06
0.08
0.1
0.12
0.14
0.16
Internet <2 yrs shorter use 2-<5 yrs >=5 yrs
a. Contribution of each ICT_d variable to average labour productivity growth evaluated at the BLS regression sample means.
Source: Regression analysis based on the BLS Confidentialised Unit Record File (CURF). See ABS (Business Longitudinal Survey, 1994-95 to 1997-98, Cat. no. 8141.0.30.001).

120
More detailed results are reported in Table 6.6:
The coefficients on lagged labour productivity (log(yt-1)) were negative and significant, implying conditional convergence was present – that is, labour productivity growth was more rapid when coming off a lower base.
The coefficients provide an indication of the adjustment period required to reach a new equilibrium following a change in capital intensity. They suggest that adjustment halfway towards a new equilibrium was: around three years for Construction;11 four years for Wholesale and Retail trade; five years for Manufacturing, Transport & storage and Property & business services; six years for Accommodation, cafes & restaurants; and twelve years for Cultural & recreational services.
The coefficients on growth in capital per unit of labour input (i.e. capital deepening, kdot) were positive and significant.
The coefficients were generally of a similar magnitude to the capital share in value added, which is often taken to be the case under assumptions of constant returns to scale and inputs paid according to marginal products.
The coefficients on firm size (size), measured in terms of employment, were positive for the Manufacturing and Construction sectors, suggesting that size provides some productivity advantage in these areas.
They were negative in four sectors, and significantly so in Retail trade. This suggests, perhaps counter intuitively, that larger retailers did not have the same scope for productivity gains.
Interactions between other factors and ICT use
The above analysis does not elaborate on possible complementary relations between ICT use by firms and their level of skill (or human capital), innovation, business practices and organisational changes. It also does not take account of all information available from the BLS that may influence productivity growth in its widest sense. To take account of these influences the basic model was augmented in two ways:
The ICT variables, in addition to being entered individually, were interacted with organisational and technical factors to take account of the proposition that for firms to achieve improvements through the use of ICT they must possess skill advantages, have business practices that enable the assimilation of knowledge about new technologies and undertake organisational change.
Additional growth variables suggested by the literature were added as independent explanatory variables to control, as far as practicable, for firm-specific productivity influences not accounted for by other factors.
Broadly, estimates of coefficients on the general growth variables were not sensitive to the changes in model specification considered. Nevertheless, impact of computer use taken on its own tended to be of lower significance than in the basic model. This can be attributed to a tendency for the combined effect of computer use with firm characteristics (i.e. the interaction terms of the model)
11. Calculated as � �4/)1638.0ln()5.0ln( ���� (Barro and Sal-i-Martin 1995, p. 37).
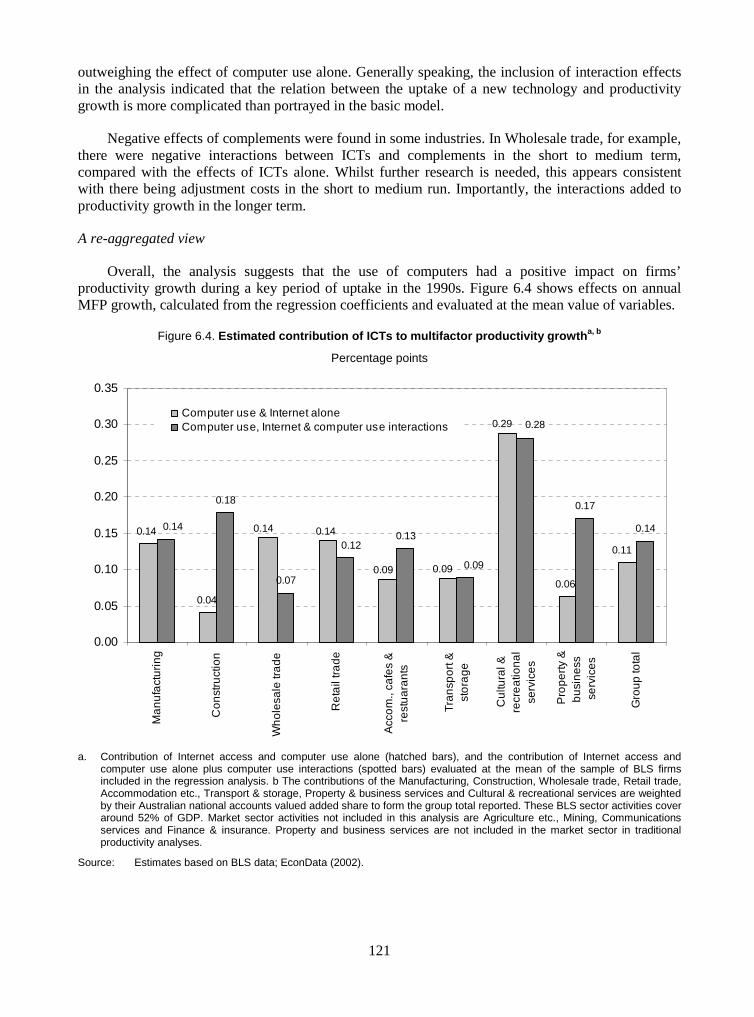
121
outweighing the effect of computer use alone. Generally speaking, the inclusion of interaction effects in the analysis indicated that the relation between the uptake of a new technology and productivity growth is more complicated than portrayed in the basic model.
Negative effects of complements were found in some industries. In Wholesale trade, for example, there were negative interactions between ICTs and complements in the short to medium term, compared with the effects of ICTs alone. Whilst further research is needed, this appears consistent with there being adjustment costs in the short to medium run. Importantly, the interactions added to productivity growth in the longer term.
A re-aggregated view
Overall, the analysis suggests that the use of computers had a positive impact on firms’ productivity growth during a key period of uptake in the 1990s. Figure 6.4 shows effects on annual MFP growth, calculated from the regression coefficients and evaluated at the mean value of variables.
Figure 6.4. Estimated contribution of ICTs to multifactor productivity growtha, b
Percentage points
0.18
0.07
0.13
0.17
0.140.14
0.04
0.14 0.14
0.09 0.09
0.29
0.06
0.11
0.09
0.28
0.12
0.14
0.00
0.05
0.10
0.15
0.20
0.25
0.30
0.35
Ma
nu
fact
uri
ng
Co
nst
ruct
ion
Wh
ole
sale
tra
de
Re
tail
tra
de
Acc
om
., ca
fes
&re
stu
ara
nts
Tra
nsp
ort
&st
ora
ge
Cu
ltura
l &re
cre
atio
na
lse
rvic
es
Pro
pe
rty
&b
usi
ne
ssse
rvic
es
Gro
up
tota
l
Computer use & Internet aloneComputer use, Internet & computer use interactions
a. Contribution of Internet access and computer use alone (hatched bars), and the contribution of Internet access and computer use alone plus computer use interactions (spotted bars) evaluated at the mean of the sample of BLS firms included in the regression analysis. b The contributions of the Manufacturing, Construction, Wholesale trade, Retail trade, Accommodation etc., Transport & storage, Property & business services and Cultural & recreational services are weighted by their Australian national accounts valued added share to form the group total reported. These BLS sector activities cover around 52% of GDP. Market sector activities not included in this analysis are Agriculture etc., Mining, Communications services and Finance & insurance. Property and business services are not included in the market sector in traditional productivity analyses.
Source: Estimates based on BLS data; EconData (2002).

122
The strength of the links to ICTs, and the importance of complementary factors, varies across industries. Controlling for a range of other factors, ICTs were found to have the greatest influence on productivity growth in Cultural & recreational services. (Finance & insurance was not included in the analysis due to data limitations.) Manufacturing, Wholesale trade (without complements), Retail trade (without complements), Construction (with complements), and Property & business services (with complements) formed a middle group. Taking relative sector size into account, ICT use in Manufacturing, Property & business services and Construction had the most effect on aggregate productivity performance.
Computer use and Internet access alone is estimated to have raised MFP growth across the eight industry sectors (as a group) by 0.11 percentage points per year over the period 1994-95 to 1997-98. Once the influence of associated skill, restructuring and organisational characteristics of firms is explicitly taken into account, MFP growth is estimated to have been raised to 0.14 percentage points per year.
6.4 Conclusions
The aggregate, sectoral and firm level evidence examined in this paper presents a picture of strong uptake of ICTs in Australia in the 1990s which, in concert with restructuring of firms and production, has brought performance gains.
6.4.1 Main findings
Australia experienced very strong growth in ICT investment in the 1990s, especially after 1995 (at over 30% a year). Finance & insurance and manufacturing were particularly prominent in the absorption of ICTs.
The firm-level analysis of four years from 1994-95 has pointed to the “march of time” as a significant explanatory factor of ICT uptake and Internet access. This covers the influence of time-related factors, which could include the continual decline in ICT prices, lower adjustment costs (learning) and network effects (advantages from more users joining computer networks). Lower prices, at least, are likely to be a major influence.
The influence of other factors on ICT and Internet use varied across industry sectors. But positive relationships with firm size and skill were commonly found. The earliest and most intensive users of ICTs and the Internet tended to be large firms with skilled managers and workers, although the relative importance of management and worker skills varied across industries. Computer use was also commonly associated with use of advanced business practices, company incorporation and firm reorganisation. There also appears to have been a link between openness to trade and the use of the Internet.
Both the aggregate growth accounting and a re-aggregation of the firm-based results suggest that ICTs and related effects raised Australia’s annual productivity growth by around two-tenths of a percentage point. This contribution is significant, but a relatively small part of Australia’s 1990s rate of MFP growth of 1.8% a year.
However, the aggregate view masks more prominent effects at the micro level. At the sectoral level, the association between ICT use and productivity growth seems from casual observation to be clearest in Finance & insurance. Importantly, however, the firm-level econometric analysis, which controls for other influences, found positive links between ICT use and productivity growth in all industry sectors examined.
123
The micro analysis has also highlighted dynamics and the importance of lags. Productivity growth effects in industry sectors taper over time, meaning that the ultimate productivity effect from adoption of one form or generation of ICT is a step up in levels, rather than a permanent increase in the rate of growth. Naturally, further technical developments over time can set further productivity-enhancing processes in train.
Significant interactions between ICT use and complementary organisational variables were also found in nearly all sectors. The complementary factors for which there were data and which were found to have significant influence were: human capital, history of innovation, use of advanced business practices and intensity of organisational restructuring.
6.4.2 Further interpretation of results
The micro analysis in this paper supports the view reached in earlier research that Australia has derived productivity gains associated with the use of ICTs. Production of ICT equipment is not necessary to access ICT-related productivity gains.
The analysis also supports the general purpose technology view of ICTs – that is, that there are productivity-enhancing complementarities between ICTs and product and process innovations. There could also be network economies, but the paper has not specifically tested for their existence.
The view of ICTs as general-purpose, enabling technologies means that it is not just ICTs alone, but also other complementary factors (reorganisation of production and investments in associated innovations) that jointly determine the performance effects of ICTs. Since the incidence of complementary factors can vary across firms, even within the same industry, a micro or firm-based view is needed to develop better understanding of the technological, organisational and policy influences – and their interaction – on restructuring and productivity growth.
The aggregate, sectoral and firm-level perspectives give somewhat different views on the importance of ICT-related productivity effects. The micro results suggest the modest aggregate productivity effects are due to aggregation – the strong positive effects in some firms and industries are counterbalanced by weaker effects in other firms and industries. But, as a corollary, with further development of ICTs, further diffusion and complementary changes, the aggregate productivity effects of ICTs could, in principle, increase above that found in the time periods analysed here.
The firm-level results help to resolve the puzzle about the apparent lack of productivity response to the strong uplift in ICT use in Manufacturing. Controlling for other factors, a relatively large and significant relationship between ICT use and productivity was found. In other words, the analysis suggests that the drop in Manufacturing productivity performance in the 1990s was due to factors unrelated to ICT use and associated factors. Again, it could be at least partly due to aggregation within the sector.
There are differences in measurement and approach between the aggregate, sectoral and firm-level analyses presented in this paper. The aggregate and sectoral analysis simply accounts for growth in labour productivity in terms of growth in ICT use. ICT use is measured in volume terms that take account of improvements in the quality of equipment. The firm-level analysis, on the other hand, is an econometric approach that controls for the influence of many other factors on productivity growth and, in principle, can identify more precise ICT-performance relationships. ICT use, in this case, is measured in terms of the duration of ICT use, rather than in volume terms. Even with the difference in approach, however, there is remarkable similarity in the aggregate productivity effects derived from both the econometric and growth accounting methods.

124
Turning to broad policy implications, the use of ICTs can be fostered by ensuring access to the latest technological advances and with the full flow-through benefit of price reductions. Appropriate access to reliable communications infrastructure is also likely to be important.
This paper has also pointed to the significance of management and employee skills to the uptake and productive use of ICTs. It confirms previous research, which found ICT use to be biased toward higher levels of skills. This has implications for education and training. Decision makers require not only ICT-related skills (seeing the opportunities that ICTs provide) but also the management skills to implement the necessary structural changes.
The links between ICTs and restructuring also points to the importance of flexibility in delivering productivity gains. This can have wide policy implications including the reduction in unnecessary “process” regulation, ensuring that product and factor markets operate as freely as possible, consistent with social and environmental objectives, and tailoring the education and training systems to meet the need for flexibility.
A number of these elements have been picked up in policy approaches over the past two decades. Policy reforms in Australia have provided competitive incentives to take up ICTs in order to improve performance; have opened the economy to trade, investment and the transfer of technology, including access to ICTs; and have increased the flexibility of the economy to adjust. The analysis in this paper points to success in facilitating the absorption of technology and raising productivity growth by encouraging and enabling businesses to change what they do and how they do it.
125
ANNEX
OVERVIEW OF METHODOLOGY FOR MICRO ANALYSIS OF UPTAKE AND PRODUCTIVITY EFFECTS OF ICTS
This appendix describes the general features of the models used to analyse firms’ uptake of ICTs and their productivity effects. Details are provided in Gretton, Gali and Parham (2002).
Uptake of ICTs
Binary choice (this is logit and probit) models were used in which the dependent variable is an index indicating whether a firm used ICT or not. The data for the analysis of computer use were drawn from all of the four BLS years in pooled regressions. Data for the analysis of Internet access were drawn from pooled data for the two BLS years 1996-97 and 1997-98. The pooled regressions enabled the inclusion of time-related effects on the spread of ICT technologies across firms in addition to cross section information on firm-specific factors drawn from the BLS.
The independent, or explanatory variables, upon which ICT use was considered to be conditional include firm size and firm age, and a range of other firm-specific characteristics. The approach adopted has been to include, as far as practicable, characteristics suggested by the literature as increasing the likelihood of firms adopting and using ICTs early and using them more intensively than other firms. Groupings of characteristics and a rationale for their inclusion in the analysis are outlined in the table below.
The regression analysis on the characteristics of firms using cover eight industry sectors in the BLS: Manufacturing; Construction; Wholesale trade; Retail trade; Accommodation, cafes & restaurants; Transport & storage; Property & business services; and Cultural & recreational services. It does not cover the Mining sector or the Finance & insurance sector because of the lumpiness of changes in a small number of large firms comprising Mining and the lack of information to define firm value added in Finance & insurance.
Productivity effects
The regression model for performance effects is based on a production function approach derived from a growth framework in which technological progress shows up as a new basic innovation or general purpose technology (Romer (1986), (1990), Barro and Sala-I-Martin (1995)). Viewing ICT as a new general purpose technology provides a rationale for ICT contributions to MFP growth to be analysed in this general framework. It also enables the introduction of ICT to be considered as part of a continuum of change contributing to growth rather than as an ad hoc technological disturbance.

126
Table A6.1. Firm-characteristic groups
Balance panel indicator
Time dummies Allow for the diffusion of ICTs over time on account of declining relative prices, information spillovers and network externalities between firms (Geroski, 2000)
Absorptive capacity Allow for potential economies of scale and scope arising from size, multiple locations and type of legal organisation, and the impact of experience through firm age (Karkenas and Stoneman, 1995) vs. the lower adjustment costs for young firms (Dunne, 1994)
Financial conditions Allow for the possibility of liquidity constraints to the take up and use of ICTs (Hollenstein, 2002)
Human capital Allow for firms ability to assess technological opportunities and put new technologies into practice (Cohen and Levinthal 1989; Hollenstein, 2000), and learning effects from the adoption of new technology (Colombo and Mosconi, 1995; McWilliams and Zilberman, 1996; Arvanitis and Hollenstein, 2001)
Information and knowledge Allow for the effects of advanced business practices — formal business planning, budget forecasting, regular reporting, firm comparisons, export marketing — on the propensity to recognise and take up new technologies
Organisational and management conditions Allow institutional conditions (such as union membership) to be linked to use of new technologies
Organisational change and processing efficiency Allow for links between the implementation of organisational change and the use of new general purpose/productivity improving technologies (Ichniowski et al., 1997; Black and Lynch, 2001)
Product innovation Allow for the possibility that innovative firms are more successful and are likely to use new technologies as inputs to the innovation process, ahead of general market supply functions (Loundes, 2002)
Openness Allow for the possibility that openness, as measured by export intensity, increases market competition and motivates firms to rapid technological adoption (e.g. Majumdar and Venkataraman, 1993)
Sample bias Allow for the possibility that the BLS sample design unintentionally was biased either toward or away from firms using ICT, after controlling for other factors
For empirical analysis, the underlying estimation model is expressed in its labour intensive form
with Cobb-Douglas technology. Formally, labour productivity is defined as L
Yy � where Y is the
level of value added output12 and L is the level of labour inputs. Similarly, capital inputs per unit of
labour input are defined as L
Kk � where K is the level of capital inputs. Secondly, the model is
12. This practice conforms to many other studies, for example Rogers and Tseng (2000), Atrostic and Nguyen (2001), Baldwin and Sabourin (2001), and Hempell (2002).
127
specified in changes to provide a basis for the inclusion of growth dynamics in the analysis. The basic labour productivity growth equation including ICT is:
���� ���� ICT2k10y �
� (4.1)
Where the dot over y and k indicates the logarithmic change between years in labour productivity and capital intensity, respectively.13 The coefficient 1� is the elasticity of labour productivity with
respect to a change in capital intensity. 1� would also be equal to the capital income share in output for firms characterised by constant returns to scale (CRS) with competitive pricing of inputs. Where there is a prior understanding that these conditions generally hold, the magnitude of the estimated
1� provides a useful qualitative test on the specification of the estimated model.
�2 represents the impact of ICT take-up on labour productivity growth and is a component of the measure “multifactor productivity” growth which is the subject of traditional productivity analyses. A positive and statistically significant value would indicate that the take-up of ICT has contributed to MFP growth. �0 represents the growth in labour productivity not accounted for by other factors. In traditional growth studies, �0 would also provide an estimate of the MFP arising from all technological and organisational changes. However, as the contribution of ICTs to MFP growth is being separately estimated in this study, the definition of �0 differs from that of traditional growth accounting studies.
The specification of the model was refined in a number of ways to complete two estimation models. First, a basic estimation model was specified in which:
� The ICT variable was decomposed into five components with four indicating the duration of ICT use to allow for non-linearities between the duration of use and MFP growth, and one indicating whether a firm has Internet access or not.
� Two variables were added to the model, one to account for conditional convergence in labour productivity towards a “best practice” and a second to allow for a possible underlying relation between firm size and growth.
Formally, the basic estimation model can be written as:
netacc
4d_ICT3d_ICT2d_ICT1d_ICTkSize)ylog(y
_5
4,43,42,41,4321t10
�
��������
�
���������
��
The variable size is defined as full time equivalent employment (the BLS variable _totfte). The four duration of computer ‘dummy’ variables are: ICT_d1 (the BLS variable COMDUM1) that has a value of one if a firm used computers for less than two years and zero otherwise; ICT_d2 (the BLS variable COMDUM2) that has a value of one if a firm used computers for a ‘shorter’ period of time and zero otherwise (imputed for the years 1994-95 and 1995-96 on the basis of duration of use data collected in 1996-97 returns); ICT_d3 (the BLS variable COMDUM3) that has a value of one if a firm used computers for between two and five years and zero otherwise; and ICT_d4 (the BLS variable
13. That is, ���
����
�
��
1log
tyty
y� and ���
����
�
��
1tktk
logk� .

128
COMDUM4) that has a value of one if a firm used computers for five or more years and zero otherwise.
Because of data limitations, it was not possible to extend this methodology to Internet use or Web presence variables. In our analysis, therefore, account has been taken of the extension of the use of ICT, through these media with a single binary variable _netacc with a value of one for firms with Internet access and zero otherwise.
Formally, the empirical model is augmented with other variables and computer use interaction variables as shown below. The dependent variable is the same as in the basic growth model – logarithmic change in labour productivity. The explanatory variables in the augmented model include:
A regression constant: 0�
The basic growth and ICT variables
netacc
dICTdICTdICTdICTkSizeyt
_5
4,43,42,41,43211 4_3_2_1_)log(
�
�������
�
�������
�
Computer use interaction variables
,...,)1*1_(,...,)_*1_(
,...,)1*1_(,...,)_*1_(
,...,)1*1_(,...,)_*1_(
,...,)2^*1_(
1,121,11
1,101,9
1,81,7
1,6
����
����
����
��
busreldICTbusrebidICT
buspraldICTbuspracdICT
inovatldICTinnovadICT
wageratedICT
��
��
��
�
where the variables interacted multiplicatively with each computer use dummy (ICT_d) are: the wage rate (squared) (wagerate^2) to represent human capital; innovation experience and the lag of innovation experience (_innovat & l1inovat); an index reflecting the intensity of adoption of 6 advanced business practices and the lag of those business practices (_busprac & l1buspra) and an index of the propensity of current and past year implementation of 11 major firm-specific organisational changes (_busrebi & l1busre).
Other control variables
it
arrregarrunrearrcontarrawarconoutunionme
biranddtolonewbuslagebuslocs
�
������
������
�������
������_242322212019
18_1716151413
_____
exp_1__
The variables included in this group are: the incidence of multiple locations (_buslocs), firm age (_age); new business status (l1newbus); type of legal operation (tolo); ); research and development (_randd); export status of the firm (_expbi); extent of union membership (_unionme); incidence of contracting out activities previously done by own employees (_conout); type of employment arrangements — awards (_arrawar); individual contracts (_arrcont); and unregistered & registered agreements (_arrunre &_arrreg). Panel regression methods were used to estimate of the basic and augmented models.

129
REFERENCES
ABS (Australian Bureau of Statistics) (2000), Business Longitudinal Survey, Confidentialised Unit Record File, 1994-95, 1995-96, 1996-97 and 1997-98 (Cat. no. 8141.0.30.001), ABS, Canberra.
ABS (Australian Bureau of Statistics) (2002a), Australian System of National Accounts (Cat. no. 5204.0), November 2002, ABS, Canberra.
ABS (Australian Bureau of Statistics) (2002b), Business Use of Information Technology, Australia (Cat. no. 8129.0), ABS.
Arvanitis, S. and H. Hollenstein (2001), “The Determinants of the Adoption of Advanced Manufacturing Technology: An Empirical Analysis Based on Firm-Level Data for Swiss Manufacturing”, Economics of Innovation and New Technology, vol. 10, no. 5, pp. 377–414.
Barro, R.J. and Sala-i-Martin (1995), Economic Growth, McGraw-Hill, New York.
Black, S. and L. Lynch (2001), “How to compete: The Impact of Workplace Practices and Information Technology on Productivity”, The Review of Economics and Statistics, vol. 83, no. 3, pp. 434-45.
Brynjolfsson, E. and L. Hitt (2000), “Beyond Computation: Information Technology, Organisational Transformation and Business Performance”, Journal of Economic Perspectives, vol. 14, no. 4, Fall, pp. 23–48.
CEA (Council of Economic Advisors) (2001), Economic Report of the President, Transmitted to Congress, January 2001, United States Government Printing Office, Washington.
Cohen, W. and D. Levinthal (1989), “Innovation and Learning: The Two Faces of R&D”, Economic Journal, vol. 99, no. 397, pp. 569–96.
Colombo, M. and R. Mosconi (1995), “Complementarity and Cumulative Learning Effects in the Early Diffusion of Multiple Technologies”, Journal of Industrial Economics, vol. 43, no. 1, pp. 1348.
Dunne, T. (1994), “Plant Age and Technology Use in US Manufacturing Industries”, Rand Journal of Economics, vol. 112, no. 1, pp. 488–99.
EconData (2002), dX for Windows, Official Database: Australian National Accounts, assessed 20 November 2002.
Geroski, P. (2000), “Models of Technology Diffusion”, Research Policy, vol. 29, no. 4-5, pp. 603–25.
Gretton, P., J. Gali and D. Parham (2002), “Uptake and Impacts of ICTs in the Australian Economy: Evidence from Aggregate, Sectoral and Firm Levels”, paper prepared for the Workshop on ICT and Business Performance, OECD, Paris, 9 December 2002, Productivity Commission, Canberra, Australia.
Hollenstein, H. (2002), “Determinants of the Adoption of Information and Communication technologies (ICT)”, Swiss Federal Institute of Technology, Zurich.
Ichniowski, C., K. Shaw and G. Prennushi (1997), “The Effects of Human Resources Management Practices on Productivity”, American Economic Review, vol. LXXXVII, no. 3, pp. 291-313.

130
Johnston, A., D. Porter, T. Cobbold and R. Dolamore (2000), “Productivity in Australia’s Wholesale and Retail Trade”, Productivity Commission Staff Research Paper, AusInfo, Canberra.
Jorgenson, D. (2001), “Information Technology and the US Economy”, American Economic Review, vol. 91, no. 1, pp. 1-32.
Karshenas, M. and P. Stoneman (1995), “Technological Diffusion”, in: P. Stoneman (ed.), Handbook of the Economics of Innovation and Technological Change, Oxford, Blackwell.
Loundes, J. (2002), “Business Use of Internet in Australia”, Melbourne Institute Working Paper no. 20/02, Melbourne Institute of Applied Economic and Social Research, Melbourne.
Majumdar, S. and S. Venkataraman (1993), “New Technology Adoption in US Telecommunications: The Role of Competitive Pressures and Firm-level Inducements”, Research Policy, vol. 22, pp. 521-36.
McWilliams, B. and D. Zilberman (1996), “Time of Technology Adoption and Learning by Using”, Economics of Innovation and New Technology, vol. 4, no. 2, pp. 139–54.
Nordhaus, W. (2001), “Productivity Growth and the New Economy”, NBER Working Paper 8096, Cambridge MA, January.
OECD (2001a), OECD Economic Surveys: Australia, OECD, Paris.
OECD (2001b), OECD Science, Technology and Industry Scoreboard: Towards a Knowledge-based Economy, OECD, Paris.
OECD (2002), Measuring the Information Economy, OECD, Paris.
Oster, A. and L. Antioch (1995), “Measuring Productivity in the Australian Banking Sector”, in P. Andersen, J. Dwyer and D. Gruen (eds.), Productivity and Growth, Proceedings of a Conference, Reserve Bank of Australia, July.
Parham, D. (2002a), “Productivity and Policy Reform in Australia”, International Productivity Monitor, no. 5, Fall.
—— (2002b), Productivity Gains: Importance of ICT’s Agenda, vol. 9, no. 3, pp. 195-210.
PC (Productivity Commission) (1999), “Microeconomic Reforms and Australian Productivity: Exploring the Links”, Commission Research Paper, AusInfo, Canberra, November.
Pilat, D. and F. Lee (2001), “Productivity Growth in ICT-producing and ICT-using Industries: A Source of Growth Differentials in the OECD?”, STI Working Paper 2001/4, OECD, Paris.
Romer, P. (1986), “Increasing Returns and Long-Run Growth”, Journal of Political Economy, vol. 94, no. 5, October, pp. 1002-1037.
—— (1990), “Endogenous Technical Change”, Journal of Political Economy, vol. 98, no. 5, October, part II, pp. S71-S102.
—— Weir, T. (2002), “An Australian Bank Adapts to Deregulation and Information Technology”, ITR New Economy Issues Paper, no. 7, Dept of Industry, Tourism and Resources, Canberra, February. (Available from www.industry.gov.au).

131
CHAPTER 7
ICT, INNOVATION AND BUSINESS PERFORMANCE IN SERVICES: EVIDENCE FOR GERMANY AND THE NETHERLANDS
Thomas Hempell, Centre for European Economic Research (ZEW), Mannheim, Germany1
George van Leeuwen and Henry van der Wiel CPB Netherlands Bureau for Economic Policy Analysis, The Hague, Netherlands2
Abstract
Using broadly comparable panel data for German and Dutch firms in services, this paper analyses the importance of ICT capital deepening and innovation for productivity. We employ a model that takes into account that innovation and ICT use may be complementary. The results show that the contribution of ICT-capital deepening is raised when firms combine ICT use and technological innovations on a more permanent basis. Moreover, the joint impact of ICT use and permanent technological innovation on productivity appears to be of the same order of magnitude in the two countries. However, the direct impact of innovation on multi-factor productivity (MFP) seems to be more robust for Germany than for the Netherlands.
1. The contribution by Thomas Hempell was written as part of the research project “Productivity and Spill-over Effects from ICT as a General Purpose Technology” commissioned by the Landesstiftung Baden-Württemberg.
2. The data analysis for the Netherlands reported in this contribution was carried out at the Centre for Research of Economic Microdata (CEREM) of Statistics Netherlands.

132
7.1 Introduction
Over the past decades, information and communication technologies (ICT) have diffused rapidly in industrialised economies. The main forces behind this success story have been sustained technological progress in the ICT sector combined with continuously falling prices for computers and networks that have attracted more and more firms to invest in these new technologies. However, falling prices are only one part of the story. Most ICT applications can be applied for a large variety of purposes. For example, ICT is used to facilitate communication, to easily store and process information, to automate business processes, or to widen the access to information via the World Wide Web. This broad spectrum of applications has helped ICT diffuse to practically all sectors of today’s economies.
This paper focuses on the importance of co-innovation for the adoption of ICT. Although a variety of anecdotal evidence and case studies point to the crucial role of innovations for a successful implementation of ICT,3 quantitative studies on the topic are scarce.4 In particular, to the best of our knowledge, no contribution to the economic literature on ICT has thus far econometrically investigated the complementary role of innovations for more than one country. With this paper, we aim to fill this gap drawing on structurally very similar data from the Community Innovation Survey (CIS) for Germany and the Netherlands.
Thanks to its broad range of uses, ICT has been compared to other great innovations of the past like the steam engine or electricity.5 These inventions are often designated as general purpose technologies (GPTs) since they can be adopted by a wide range of industries and thus have a sustained impact on the economy. Moreover, GPTs may entail a large potential for technological improvements and a broad scope for innovation-related complementarities.6 The innovation of the microprocessor, on which ICT is largely based, has initiated series of further innovations like the development of main-frames, personal computers and electronic networks. This development has led to continued pro-ductivity gains within the ICT producing industries.
Moreover, and maybe most importantly, ICT has also opened a large potential for innovation in many sectors outside the ICT producing industries. For example, the use of ICT enables firms to restructure their organisations (like flattening hierarchies and delegation of responsibilities), to re-engineer business processes (like introducing just-in-time management or engaging in e-commerce) and to develop completely new products (e.g. software and consultancies). These complementary measures often involve high additional expenses, such as for reorganisation and for training workers. While some studies based on firm-level evidence as well as case studies have argued that these co-innovations together with an upgrading of skills may entail a substantial potential for firms to raise
3. See, for example, Brynjolfsson and Hitt (2000) for a review.
4. Exceptions are studies by Licht and Moch (1999) and Hempell (2002a), which focus on the role of product and process innovation in German service firms, as well as studies by Bresnahan et al. (2002) and Brynjolfsson, Hitt and Yang (2002) which analyse complementarities between ICT use and organisational changes.
5. See David (1991).
6. See Bresnahan and Traijtenberg (1995).

133
their productivity,7 analyses at the industry level have failed to quantitatively detect such spillovers from innovation.8
Even though computers are practically everywhere today, the degree of ICT adoption varies substantially between countries and even within sectors. In the two countries examined in this study, Germany and the Netherlands, differences are particularly pronounced. The share of expenditures on ICT in gross domestic product in 2002 amounts to 7.8% in the Netherlands as compared to only 6.4% in Germany.9 These differences in diffusion of ICT can only partially be explained by structural differences of the economies.10 Moreover, the adoption of ICT and its applications also varies strongly between firms within industries and countries.11 These differences at the firm-level indicate that the productivity gains from ICT depend on the individual knowledge base and innovative activities that differ substantially between individual businesses.12 In industry figures, these differences between firms are aggregated out; this implies that spillovers from innovation are much more likely to be detected using firm-level data.
ICT adoption is generally most advanced in the service sector.13 Moreover, business-related services have been the most important driver of economic growth in industrialised countries.14 Despite the key role of services, most existing studies analysing the productivity impacts of ICT have focused on manufacturing. In contrast, the focus of the empirical analysis conducted in this paper is on business-related services and distribution services.
For both countries, we can use longitudinal data for a large number of firms. These panel data allow us to take important methodological issues into account. For example, well-managed firms tend to be more productive and invest more intensively in ICT.15 If such firm-specific effects are not properly taken into account, quantitative analyses may come up with biased results and misleading conclusions. Moreover, the two-country approach allows us to distinguish between links between innovation and ICT usage that are common in both countries on the one hand, and links that are more likely to result from country-specific environments on the other. Our results show that ICT capital deepening raises productivity and that the productivity improvements are more pronounced when ICT use is combined with a more permanent innovation strategy.
The paper is organised as follows. In the following part, we set out the theoretical background and the model on which the analysis is based. In section three, we describe the data sources for both Germany and the Netherlands with special attention to similarities and differences. We present and compare the empirical results for both countries in section four and discuss the results with special
7. See, for example, Bresnahan and Greenstein (1996) and Bresnahan et al. (2002).
8. Sectoral studies by Stiroh (2002) and Van der Wiel (2001a) find no clear evidence that ICT capital and MFP growth are significantly correlated in the United States and the Netherlands respectively.
9. See EITO (2003).
10. See van Ark et al. (2002).
11. See, for example, Bertschek and Fryges (2002) and Hollenstein (2002).
12. See Bresnahan and Greenstein (1996), Bresnahan et al. (2002) and Hempell (2002a).
13. See OECD (2000a).
14. See OECD (2000b).
15. See Brynjolfsson and Hitt (1995) and Hempell (2000b).

134
attention to the possible underlying economic sources. Section five concludes with some final remarks.
7.2 Theoretical background and empirical model
One of the big puzzles about ICT is to explain why firms and countries differ so widely in their ability to make productive use of the potential entailed in these new technologies. While there exists broad evidence that the diffusion of ICT has led to substantial increases in labour productivity throughout the US economy, results for European countries are rather mixed.16 Similarly, the adoption of ICT and its applications vary largely between firms within the same industry.17 This heterogeneity has led researchers to explore to what extent the benefits from ICT depend on particular firm characteristics and strategies. In this section we summarise the results obtained on this topic in earlier studies and discuss an empirical model that is used to empirically investigate the relationship between ICT productivity and complementary innovations.
7.2.1 Earlier studies
Various theoretical and empirical studies have focused on the specific relevance of innovations and organisational changes involved in applications of ICT within firms. Bresnahan and Greenstein (1996) argue that co-inventions in ICT-using firms involve high adjustment costs and uncertainties that may differ substantially between firms. Similarly, Brynjolfsson and Hitt (2000) point to large costs and complementary efforts, e.g. due to complementary organisational changes, that are required for an efficient implementation of ICT. These adjustment costs often exceed the costs of ICT investments and may help explain the apparent excess returns that various empirical studies have found for ICT investment. Bresnahan et al. (2002) and Brynjolfsson, Hitt and Yang (2002) report that the use of ICT involves a whole range of complementary and simultaneous efforts, such as organisational changes, innovations and an upgrading of the skills of the workforce. The difficulty to introduce such clusters of arrangements simultaneously may explain both the varying ICT engage-ments of firms and the difficulty to copy apparent best practices from other firms. Similarly, Hempell (2002a) finds that complementary innovations are not enough for firms to attain productivity gains from ICT usage. Rather, the success of adopting ICT depends on a firm’s long term innovation strategy, in particular, its experience from past innovations. For a representative sample of firms in German distribution and business-related services, the study finds that firms that have introduced process innovations in the past have output elasticities with respect to ICT capital that are four times as high as in firms without such experience.
7.2.2 Empirical model
The main question examined in this paper is whether firms that introduce new products, introduce new processes or adjust their organisational structure can reap higher benefits from ICT investment than firms that refrain from such complementary efforts. This implies that the marginal product of ICT is higher in innovative firms than in other businesses. In order to empirically test this hypothesis, we follow a very similar approach as in Hempell (2002a) and employ an extended Cobb-Douglas function with two types of capital, i.e. ICT capital and non-ICT capital (henceforth entitled as “other capital”) and innovation. In this set-up, the elasticity of output with respect to ICT depends on whether the corresponding firm has successfully introduced an innovation or not:
16. See, for example, Colecchia and Schreyer (2001), van Ark (2001), van der Wiel (2001a).
17. See, for example, Bertschek and Fryges (2002).

135
Equation 1
itiiii eeICTKALY JJit
Jititit
�������� ����� 643521
with Yit denoting value added of firm i in period t, L it labour input, ICTit the amount of ICT capital, Kit non-ICT capital. �i captures unobserved determinants of the productivity of firm i and �it represents normally distributed shocks. Ji is a dummy variable that proxies the firm’s innovative activities which are assumed to be constant over the time period analysed. Subject to various definitions discussed below, Ji takes the value of one if firm i has been innovating successfully, and zero otherwise.
In this specification, innovative activities are assumed to not only have a direct impact on firm productivity18 (which is reflected by the coefficient ��) but also to have an indirect effect by affecting the marginal productivity of the capital stocks ICT and K. These indirect impacts are captured by the coefficients �� and ��. The main question of interest is whether innovative activities enhance the productivity contributions of ICT (�� >0). Moreover, if this property is a feature that distinguishes ICT from conventional capital K, we will expect innovative activities not to affect the marginal product of K, such that �� =0.
In order to investigate equation 1 econometrically, we transform it into a linear model by taking logs of both sides. Simple rearranging then yields the empirical model:
Equation 2
itiiiitiititititit JJkJictictklay �������� ����������� 654321 )()(
where small letters denote the corresponding logarithms.
While the treatment of the inputs L, ICT and K is mainly an issue of correct measurement,19 the consideration of firms’ innovative activities deserves some more detailed attention. In investigating the sources of complementarities between innovation and ICT, it is important to distinguish various possibilities of how the indicator Ji for innovative activities is defined. Following suggestions put forward in the Oslo Manual (OECD/Eurostat 1997), we classify innovations into two types according to the degree to which they are based on technologically new knowledge. A first type, (a), entails technologically oriented innovations, like the implementation of technologically new processes or the introduction of technologically new products. By contrast, a second type, (b), consists of non-technical innovations in firms, like changes in the organisational structures or new management techniques.
In various specifications of the model, we set Ji equal to one if firm i has reported to have introduced innovations according to notion (a) or according to (b). For the case of Germany, we are
18. Equation 1 can equally be transformed into an equation of labour productivity by dividing both sides by labour input. The only difference of such a transformation is that the new coefficient of labour ��* will be reduced by 1, such that ��* =��-1. All the other coefficients are unaffected by this transformation, such that the results and interpretation are the same. Since the framework of the untransformed production function can be interpreted more easily, we follow the specification pursued in most of the related literature and employ the untransformed production function.
19. The measurement of the variables for the empirical analysis is discussed in more detail in the following section.

136
also able to further differentiate the technological innovations (a) to whether they are based on the adoption of (i) new processes or (ii) the introduction of new products. On the other hand, for the case of the Netherlands, we have the opportunity to distinguish several types of non-technological innovations (b) like changes in (i) strategy, (ii) marketing, (iii) restructuring and (iv) management.
A further aspect of the exploration concerns the question on whether the continuity of a firm’s engagement in innovation is important. The introduction of ICT-based systems may have large impacts on the structure of businesses within firms. Therefore, ICT investment projects may take a long time to be implemented successfully. Moreover, the adoption of ICT-based processes may lead to a whole chain of subsequent innovations. To improve efficiency in large firms, for example, the standardisation of processes and data formats may lead to a sequence of innovations in various parts of an enterprise. Moreover, the successful introduction of new services may require continuous im-provements of the products. Therefore, we expect firms that are more continuously engaged in ICT will be able to reap higher productivity gains from cost savings (through better processes) or sales growth (due to better products) than firms that innovate rather occasionally or not at all.
Since we only have data available on innovation from two cross-sections of the Community Innovation Survey (CIS), we distinguish the cases whether firm i has reported a product (or process) innovation in both periods 1994-1996 AND 1996-1998 (Ji =1) or not (Ji =0). The results from this definition will be compared to the outcomes of an alternative, weaker, definition of Ji in which Ji=1 if firm i has reported an innovation in at least one of the periods 1994-96 OR 1996-1998. This distinction between the AND and the OR-definition of Ji intends to reflect the importance or sustainability of the corresponding innovation strategy and therefore forms the basis for the regressions conducted for both countries.
7.3 Data and summary statistics
For the empirical analysis, firm-level data from the Community Innovation Survey (CIS) are employed. The main aim of CIS is to collect representative and internationally comparable firm-level data on technological innovations. The survey resulted from an initiative by the OECD and the European Statistical Office (Eurostat) to formulate guidelines for an internationally comparable questionnaire and methodology for innovation surveys for its member countries.20 In Germany, the survey is conducted annually by the Centre for European Economic Research (ZEW), Mannheim, on behalf of the German ministry for education and research (BMBF).21 In the Netherlands, the survey is conducted by Statistics Netherlands.
The harmonised survey of CIS is conducted and evaluated every four years. For our analysis, we employ the second wave of the survey (CIS 2) with data referring to 1996. Moreover, a very similar survey has been repeated in both countries for 1998, and this wave (denoted as CIS 2.5) is also employed. We restrict the analysis to the service sector. More specifically, we consider business-related and distribution services. The detailed list and classification of the corresponding industries is summarised in Table A7.2 in the chapter annex.
20. See the Oslo Manual (OECD/Eurostat 1997) that was first published in 1992.
21. See Janz et al. (2001) for a detailed discussion of the German innovation survey.
137
The focus of innovation as defined by CIS is mainly on three characteristics of innovations. The innovation should (1) be based on technological new knowledge, (2) be new or significantly improved to the corresponding firm,22 and it should (3) be implemented successfully, either in the form of new (or significantly improved) products or services (product innovations) or new processes (process innovations). The harmonised questionnaire refers to a three-year period such that a firm is designed as an innovator if it has introduced an innovation in the current or one of the two preceding years.
Beyond these data, various more detailed questions are included in the individual CIS questionnaires for Germany and the Netherlands, but these are not harmonised. For the purpose of our analysis, the Dutch survey covers more detailed information on four types of non-technological innovations (changes in strategy, marketing, restructuring and management), and the German survey allows an explicit distinction between product and process innovations. This additional information will be used in more detailed individual regressions for both countries.
The sample of data for which information from both countries is available covers firms with five and more employees.23 This thus omits a substantial part of small sized firms, in particular a large fraction of newly-started firms which may be important sources of innovation.24 However, compared to most other studies that analyse the productivity of ICT at the firm level and that are mainly focused on large firms, the size spectrum entailed in the employed sample is quite broad.
In order to assess the productivity effects, we further employ data on firms’ output, labour input (in full-time equivalents) as well as investments in ICT and non-ICT. In the German innovation survey, this information is covered in the CIS questionnaire. For the Dutch survey, these data are merged from corresponding census data for the period 1993-99. The data set is based on annual surveys undertaken by Statistics Netherlands among enterprises with their main activity in the services sector. An important difference between the German and the Dutch sample concerns the coverage of ICT investments. While in the case of the Netherlands, the variable only includes investment in tangible ICT goods, the German survey also includes investment in software. Since software expendi-tures amount to about 29% of total ICT investment in the EU (EITO, 2003), this may lead to sub-stantial differences in the calculated ICT stocks.
For output, we calculate firms’ value added as the difference between sales and intermediate inputs.25 All the monetary variables are deflated using corresponding deflators from the statistical offices of Germany and the Netherlands.26 Since official statistics tend to understate the true price declines for ICT goods (Hoffmann, 1998), we employ harmonised price deflators for Germany as proposed by Schreyer (2000).27
22. This means that product innovations are not necessarily market novelties.
23. CIS 2 for the Netherlands, however, did not contain firms with five to nine employees.
24. Although the sample is continuously updated with young firms, these firms will emerge with a certain delay.
25. Since intermediate inputs are not available for German firms, we imputed values by using value added-to-sales shares of corresponding industry averages, i.e. the shares of value added in sales at the two-digit NACE, as provided by the German statistical office.
26. These industry-specific deflators are defined at the two-digit level for Germany and at a more detailed three-digit level for the Netherlands.
27. Schreyer (2000) takes the bias of official price indexes into account by calculating a harmonised price index for various OECD countries. He employs official statistics on ICT prices in the United States as a

138
Since both types of investments (ICT and non-ICT) considered do not depreciate instantly but rather over time, simple investment data are an unsatisfactory proxy of the capital intensity of firms. To take account of this issue, we take advantage of the longitudinal structure of the data and construct capital stocks (for the beginning of each period) from the corresponding investment data by the perpetual inventory method (See Box 7.1). In our analysis, we thus explicitly take into account potential time lags between the time of investment and the time at which the resulting productivity effects show up.28
Box 7.1. Construction of capital stocks
An important issue for assessing the productivity effects of ICT concerns the separate construction of capital stocks for ICT capital and conventional (non-ICT) capital from the firm-level investment data. For this purpose, we employ the perpetual inventory method (PIM) as described in Hempell (2002b) and Van Leeuwen and van der Wiel (2003a). The capital stock K (denoting ICT or non-ICT correspondingly) is assumed to result from investment in the previous period in the following way:
11)1(��
��� ttt IKK � (eq. 3)
where K denotes the real capital stock, � the depreciation rate and I investment in constant prices. We construct the initial stock for the first period of the sample by assuming constant growth rates of the investment expenditures g during the pre-sample period. As illustrated by Hall and Mairesse (1995), inserting the initial stock K0 into equation 3 together with backward substitution and simplification leads to:
)(/00 ��� gIK (eq. 4)
Since both the growth rates of ICT investments and its depreciation rates are substantially larger than those of most other capital goods, we construct both stocks of capital in separate exercises. Table 7.1 summarises the different parameters for capital stocks in both countries. The derivation of the parameters is explained in Hempell (2000b) and van der Wiel (2001a).
reference, since these are based on hedonic techniques assuming that the differences between price changes for ICT and non-ICT capital goods are the same across countries (see also Chapter 4). For the Netherlands, we have also experimented with using a special price index of ICT to deflate the ICT investment series based on information of Statistics Netherlands, with little impact on the results.
28. Some firms reported a share of ICT investment in total investment expenditure equal to zero for all the periods surveyed. Since the econometric specification is in logs, these firms should be excluded from the full sample. However, it may seem more reasonable to assume that ICT investments in these firms are not zero, in fact, but rather very low and rounded to zero by the respondents. Excluding these firms might lead to an overestimation of the real output contributions of ICT in the economy. Therefore, the ICT stock per worker in firms that reported zero ICT investment was assumed to be equal to the corresponding industry minimum and the corresponding values were imputed.

139
Table 7.1. Parameterisation of the depreciation rates for the German and Dutch sample
Annual depreciation rates Annual growth rates of investment Germany Netherlands Germany Netherlands ICT capital 25% 30% 40% 24.2%b Non-ICT capital 6.5% 9.0%a 5.0% 6.5%c
a. Unweighted mean of the depreciation rates by industries. For the calculation of non-ICT capital stocks, data from the German Statistical Office at the NACE two-digit level are employed. For further details, see Hempell (2002b), pp. 7-8.
b. Unweighted mean of the growth rates by industries, consisting of 25% for wholesale trade, 27.5% for retail trade and 20% for other services.
c. Unweighted mean of the growth rates by industries, consisting of 6% for wholesale and retail trade and 7.5% for other services.
In the final cleansing of the samples, we had to exclude a variety of firms with item non-response or negative value added. Moreover, we restricted the analysis to firms with at least three subsequent observations to enable the application of suitable econometric techniques for panel data (see subsequent section).29 The resulting samples comprise 995 firms for Germany and 972 firms for the Netherlands.
The corresponding summary statistics reported in Table A7.1 in the annex to this chapter show that the mean values for inputs and outputs (per employee) are substantially higher for the German samples as compared to the Dutch. Several sources may lead to these large differences.
First, the higher capital intensities for Germany might be due to a stronger skewness to the right of the distribution.30 Second, as explained above, the measured ICT capital stock for German firms is based on a much broader definition of ICT than in the case of Dutch firms. Third, for both countries, slightly different parameters for growth and depreciation are used for the construction of ICT capital stocks. Fourth, the dissimilarity may result to some extent from differences in the composition of the sample by industries. For example, the weight of wholesale and retail trade in the Dutch sample is twice as high as in the German sample (74% vs. 36%; compare Table A7.2 in the chapter annex.31 These industries are less ICT-capital intensive than other services industries like electronic data processing and technical services.
Table 7.2 reports some figures on the temporal evolution of ICT intensities over times. For both countries, a strong increase in ICT intensity can be observed, independently from whether ICT intensity is measured as the share of ICT in output or as the share in total capital. This development is due to two sources: First, firms have intensified their spending on ICT over time. Secondly, the quality
29. For the Netherlands, for which more data are available, this threshold was raised to five subsequent periods to improve the reliability of the calculations of the corresponding capital stocks.
30. The German mean value of firm size (about 292 employees) substantially exceeds the median, which is only 36 employees (not reported). The strong skewness also explains the high standard deviations for Germany. The mean values for Germany also substantially exceed those for the Netherlands in capital endowments. This is mainly due to very capital intensive firms in individual industries, like rental of buildings. In the econometric analysis, this skewness is ameliorated substantially since the specification is in logarithms.
31. The difference in sample coverage is partly due to the absence of the majority of “other Dutch business services” (i.e. SBI 748) in 1999. Part of this branch could not be included since the firm level data of the 1999 survey were considered to be implausible by Statistics Netherlands and thus not disseminated. For this reason a considerable part of “other business services” could not be used in the analysis.

140
of ICT products have increased dramatically which is taken into account by adjusting prices accordingly. Again, as discussed before, the intensities for Germany are substantially higher than those for the Netherlands.
Table 7.2. Comparison of ICT intensities in the German and Dutch sample (constant prices)
Netherlands Germany
1994 1999 1994 1999
Share of ICT in total capital 1.5 4.6 13.1 19.1
Share of ICT in value added 2.1 6.0 3.2 9.7
Note: The figures denote the unweighted average of the corresponding shares over all firms in the samples.
Finally, Table 7.3 reports some statistics on the differences between innovative and non-innovative firms. In the reference classification, firms are classified as innovative if they have reported a technological innovation, i.e. a product or process innovations or both, for both the period 1994-96 and the period 1996-98. In the German sample, 18% of the firms correspond to this definition, while the value for the Netherlands is nearly 30%. The discrepancy between the percentages of permanently innovating firms in favour of the Netherlands might be due to the lower share of very small firms (5-9 employees) in the Dutch sample: 6% versus 18% in the German sample. It may also be due to methodological reasons; since for Germany an unbalanced panel for 1994-99 is used, some firms may not be covered for both 1996 and 1998.
Despite these differences in the share of innovators, there is a consistent pattern in the capital intensity for Germany and the Netherlands. The endowment of workplaces with both ICT and non-ICT is substantially higher in innovating firms than in non-innovating ones in both countries. In the Dutch sample, these differences are also reflected in the corresponding numbers for labour productivity which are higher in innovating firms. For Germany, there is a reverse pattern. If, however, one considers the corresponding median values, which are more robust to the role of potential outliers, the pattern for German firms corresponds very well to the pattern for Dutch firms as summarised in Table 7.3.
Table 7.3. Labour productivity and capital endowment per worker in the German and Dutch samples by innovating and non-innovating firms
Germany Netherlands
Innovators* Others Innovators* Others
Share of firms (%) 18.0% 82.0% 29.6% 70.4%
Value added per employee and year 125 289 140 362 61 900 52 700
ICT per employees 5 283 3 861 2 282 1 689
Non-ICT per employees 307 764 222 181 70 078 65 799
* “Innovators” refers to firms that have reported process or product innovations (or both) for both the period 1994-96 and the period 1996-98.
Note: Figures refer to the unweighted sample of 995 German and 972 Dutch firms in the service sector. The time periods underlying the averages are 1994-99 for Germany and 1993-99 for the Netherlands.

141
7.4 Empirical results
In this section we present the main econometric results for the two countries. To explore the effect of ICT and innovation on firm performance and the interrelation between innovation and ICT, we estimate our production function model from equation 2 using the same type of innovation for both. Innovation experience in the “common” model is represented by technical innovation (the implementation of product and/or process innovation) of a more permanent nature. Thus, the dummy variable Ji takes on a value of 1 if firms have implemented product and/or process innovation both in period 1994-96 and 1996-98.
After this first set of estimations, we shift our attention to country specific models by adapting the “common model” to the country-specific data on innovation. For Germany this special analysis focuses on the productivity differences between product and process innovations. For the Netherlands the focus is on the different contributions of technical and non-technical innovations to productivity. All models are estimated by using the method of SYS-GMM (see Box 7.2).
Box 7.2. Estimation method
In this study we use heterogeneous firm-level data to investigate the relation between ICT use, innovation and productivity. It is well known that the tremendous heterogeneity in performance records at the firm-level can also be attributed to unobservable firm-specific effects. Ignoring these effects may severely bias OLS estimates. The usual approach to circumvent this problem is to eliminate the firm specific parameters by transforming the model into growth-rates and then use the GMM method of estimation. Arellano and Bover (1995) and Blundell and Bond (1998) showed that this method may fail in case of weak instruments due to a lack of sufficient correlation between explanatory variables and instruments. To overcome this problem they introduced the method of SYS-GMM. This is a generalized instrumental variables method that uses both the equations in levels and growth rates to account for various sources of estimation biases like measurement errors, reversed causality or endogeneity of explanatory variables. This method has been applied in this study.
7.4.1 Results for the common specification
The results for the common specification are presented in Table 7.4.32 The coefficients of all three inputs, i.e. labour, ICT capital and non-ICT capital, are significantly different from zero at the one-percent level for the Netherlands. However, although similar in size, the elasticity of ICT capital stocks for Germany appears to be only weakly significant.33
By contrast, the labour elasticity obtained for the Dutch sample is much lower than the outcome for Germany. The latter result could be due to the different composition of industries in the panel data for the two countries, already mentioned in section 7.3. The Dutch panel data contains relatively more wholesale and retail firms that have lower levels of income shares, which is a rough indicator for the labour elasticity. Another notable difference between the results of both countries is the implied scale
32. For both countries, the regressions also include time dummies and industry dummies. Moreover, the regressions for Germany also take account of a dummy variable for firms located in East Germany.
33. The lower constant term in the German regressions reflects different scaling of the variables. While German data are in million DM, the Dutch variables are in absolute euros.
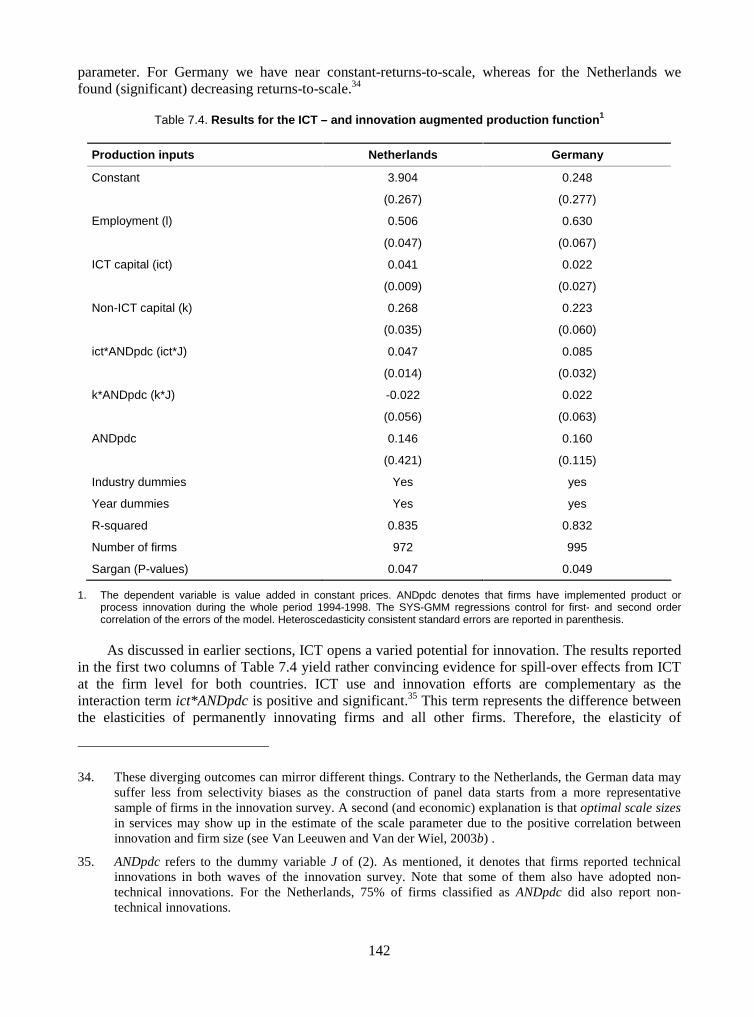
142
parameter. For Germany we have near constant-returns-to-scale, whereas for the Netherlands we found (significant) decreasing returns-to-scale.34
Table 7.4. Results for the ICT – and innovation augmented production function1
Production inputs Netherlands Germany
Constant 3.904 0.248
(0.267) (0.277)
Employment (l) 0.506 0.630
(0.047) (0.067)
ICT capital (ict) 0.041 0.022
(0.009) (0.027)
Non-ICT capital (k) 0.268 0.223
(0.035) (0.060)
ict*ANDpdc (ict*J) 0.047 0.085
(0.014) (0.032)
k*ANDpdc (k*J) -0.022 0.022
(0.056) (0.063)
ANDpdc 0.146 0.160
(0.421) (0.115)
Industry dummies Yes yes
Year dummies Yes yes
R-squared 0.835 0.832
Number of firms 972 995
Sargan (P-values) 0.047 0.049
1. The dependent variable is value added in constant prices. ANDpdc denotes that firms have implemented product or process innovation during the whole period 1994-1998. The SYS-GMM regressions control for first- and second order correlation of the errors of the model. Heteroscedasticity consistent standard errors are reported in parenthesis.
As discussed in earlier sections, ICT opens a varied potential for innovation. The results reported in the first two columns of Table 7.4 yield rather convincing evidence for spill-over effects from ICT at the firm level for both countries. ICT use and innovation efforts are complementary as the interaction term ict*ANDpdc is positive and significant.35 This term represents the difference between the elasticities of permanently innovating firms and all other firms. Therefore, the elasticity of
34. These diverging outcomes can mirror different things. Contrary to the Netherlands, the German data may suffer less from selectivity biases as the construction of panel data starts from a more representative sample of firms in the innovation survey. A second (and economic) explanation is that optimal scale sizes in services may show up in the estimate of the scale parameter due to the positive correlation between innovation and firm size (see Van Leeuwen and Van der Wiel, 2003b) .
35. ANDpdc refers to the dummy variable J of (2). As mentioned, it denotes that firms reported technical innovations in both waves of the innovation survey. Note that some of them also have adopted non-technical innovations. For the Netherlands, 75% of firms classified as ANDpdc did also report non-technical innovations.

143
permanently innovating firms is approximately 11% (= 0.022 + 0.085) for Germany and about 9% (0.04 + 0.05) for the Netherlands. Thus, the direct contribution of ICT to productivity of permanent innovating firms is twice as much or more (for Germany) as the corresponding value for firms that do not innovate permanently.
Likewise, we can look at the interaction of innovation and non-ICT capital and compare it with the similar interaction for ICT. This comparison yields insights whether ICT is a special type of capital. Once again, we obtain the same result for both countries, indicating that innovation and other capital are not complementary. Indeed, this suggests that ICT is a rather special type of capital, due to its link with innovation.
Finally, we comment on the results for the direct contribution of innovation to multi-factor productivity (MFP), which can be judged through the estimate for ANDpdc. Here, we found that innovation seems to contribute positively to MFP, although for the Netherlands the corresponding estimate is insignificant.
The latter result may be due to various reasons. One possible source may be selectivity. Firms that introduce innovations may do so because they face economic difficulties. In this case, an insignificant direct impact might mirror the lower productivity of firms that decide to engage in innovations rather than the effect of the introduction of new processes or products. An alternative explanation might be more important. The figures for the Netherlands, taken literally, imply that the only productivity gains from innovations in services are attained if they are combined with the simultaneous use of new technologies. Furthermore, there may also be measurement errors that make the estimation of the direct productivity contribution imprecise.
7.4.2 Further results for technological innovations in Germany
A further issue raised in the theoretical part concerns the question whether firms that innovated more continuously than others would exhibit higher benefits of productive ICT use than firms that innovated rather occasionally. As already stated in the previous section, the data available for Germany also allow investigating in more detail the link between ICT and innovation, notably in considering the type of innovation introduced. The regression results presented in Table 7.5 shed some light on these issues.
The first column (ORpdc) of Table 7.5 uses the same type of innovation as in Table 7.4, but now a firm is considered as an innovator if it introduced some technological innovation (new processes or products) in at least one of the two periods (1994-96 or 1996-98) considered. The estimate for the interaction term is of the same order of magnitude in this new specification. The same conclusion applies to the innovation contribution to MFP. Thus, using the broadest definition of innovation, there seems to be no additional productivity benefits of innovating more permanently. However, this conclusion changes if we choose a more narrow definition of innovation. Columns 2 and 3 compare the results for product innovations as a special type of innovation. The interaction of product innovation and ICT as well as the innovation impact on MFP become more significant for the firms that implemented new products during the whole period. This finding indicates that a sustained product innovation strategy yields more substantial productivity potentials from ICT usage than just occasional product innovation. The differential in the elasticity of ICT for occasional product innovators (0.049) is less than half as high as for continuous innovators (0.121).

144
Table 7.5. Impacts of product and process innovations on the productivity of ICT1
Type of innovation ORpdc ANDpd ORpd ANDpc ORpc
(1) (2) (3) (4) (5)
Constant 0.132 0.211 0.163 0.296 0.289
(0.299) (0.296) (0.308) (0.312) (0.296)
Employment (l) 0.628 0.641 0.623 0.620 0.604
(0.069) (0.073) (0.074) (0.075) (0.069)
ICT-capital (ict) -0.005 0.028 0.004 0.032 0.019
(0.035) (0.027) (0.034) (0.026) (0.032)
Non-ICT capital (k) 0.222 0.200 0.244 0.237 0.209
(0.045) (0.055) (0.047) (0.052) (0.048)
ict*innovation (ict*J) 0.086 0.121 0.049 0.118 0.112
(0.039) (0.043) (0.038) (0.060) (0.039)
Innovation 0.189 0.237 0.098 0.168 0.255
(0.122) (0.104) (0.113) (0.111) (0.110)
Sargan 0.330 0.179 0.215 0.216 0.407
R-squared 0.831 0.831 0.830 0.831 0.827
1. The definition of “innovation”-dummy varies between columns as follows. Innovation is 1 if the corresponding firm has reported technical innovations for at least one of the periods 1994-96 or 1996-98 (ORpdc), a product innovation for both periods (ANDpd), a product innovation in at least one of the periods (ORpd), a process innovation for both periods (ANDpc) and a process innovation in at least one of the periods (ORpc). All estimations are based on two-step SYS-GMM estimator with robust standard errors. Sargan tests of the validity of the instruments used are not rejected for all specifications at the 10% level.
In columns 4 and 5 of Table 7.5, we compare the results for firms that were engaged in process innovations persistently or occasionally. In both specifications, the interaction terms of ICT and innovation are both significant and quite high at similar levels. This indicates that for long term innovation strategies, the impacts on ICT productivity are quite similar for product and process innovations.
Summing up the German evidence, the most striking result is that while for continuous process innovators, the productivity gains from ICT are about as high as for occasional ones, continuity in innovations is more important for product innovations than for process innovations. These results indicate that development of new products based on ICT usage calls for a long-term innovation strategy.
7.4.3 Further results for non-technological innovations in the Netherlands
Whereas the German CIS survey enables a further breakdown of technical innovation, the Dutch CIS survey allows a more detailed examination of the impact of non-technical innovations on productivity than the German survey. The Dutch survey distinguishes four types of non-technical innovations; besides organisational changes, Statistics Netherlands also differentiates changes in strategy, marketing and management.

145
Recent Dutch research already pointed towards the importance of non-technical innovations in (business) services. Van der Wiel (2001b) found that firms in Dutch business services that reported non-technical innovations showed higher productivity growth rates than firms engaged in technical innovation or firms that reported no innovation at all. This subsection investigates whether this result can be supported when using a regression framework. Table 7.6 reports the results of this exercise.
Table 7.6. ICT and non-technical innovations (NTI): impact on output for the Netherlands1
Type of innovation ORnti ANDnti ANDorg
(1) (2) (5)
Constant 4.835 4.935 4.593
(0.293) (0.299) (0.273)
Employment (l) 0.518 0.464 0.499
(0.047) (0.049) (0.047)
ICT-capital (ict) 0.048 0.034 0.046
(0.012) (0.011) (0.012)
Non-ICT capital (k) 0.151 0.162 0.187
(0.038) (0.038) (0.036)
ict*innovation (ict*J) -0.007 0.040 -0.005
(0.017) (0.016) (0.014)
Innovation -0.054 0.036 0.143
(0.069) (0.080) (0.075)
R-squared 0.825 0.830 0.822
% innovators 24.2 34.9 21.4
1. The definition of “innovation”-dummy varies between columns as follows. Innovation is 1 if the corresponding firm has reported non-technical innovations for at least one of the periods 1994-96 or 1996-98 (ORnti), non-technical innovations for both periods (ANDnti) or organisational changes in both periods (ANDorg). All estimations are based on two-step SYS-GMM estimator with robust standard errors. Sargan tests of the validity of the instruments used are not rejected for all specifications at the 10% level.
Taking the rather broad definition of “non-technological innovation” into account, it is obvious that certain elements of non-technical innovations also point to the possible emergence of product or process innovation. Thus, it should be no surprise that many firms simultaneously applied technical innovations as well as non-technical innovations according to the corresponding definitions (see footnote 33).
Nevertheless, and similar as in the case of technical innovations, firms may also be more or less permanent involved in non-technical innovation. Table 7.6 clearly points to the benefits of being permanently innovative in a non-technical sense (see the column ANDnti of Table 7.6). Following a non-technical innovation strategy on a more continuous basis appears to pay off more than innovating occasionally. In fact, column ANDnti of Table 7.6 is quite similar to the (Dutch) result of Table 7.4, where innovation was defined as the implementation of technical innovations during all years of the period considered. In this respect, the results of Table 7.6 are more distinct from the German sensitivity analysis: for firms that performed non-technical innovations only incidentally, the interaction of ICT use and non-technical innovations does not lead to higher output growth (compare the ORnti and ANDnti results of Table 7.6).

146
Finally, the last column of Table 7.6 looks at a specific type of non-technical innovation, i.e. organisational changes implemented more continuously. The results show that this type of innovation had a significant and sizeable impact on MFP in Dutch services. Surprisingly, ICT use and organisational changes do not seem to be complementary here, as the coefficient of ICT*innovation appears to be insignificant. This contradicts evidence from similar studies for the United States (Brynjolfsson et al., 2002). This surprising finding may have something to do with the difficulty of defining organisational changes in a strict sense.
7.5 Concluding remarks and issues for further research
This paper focuses on the link between ICT use, innovation and business performance in services for Germany and the Netherlands. We adopted an extended production function framework to investigate the link between ICT use and innovation. This framework has been applied to test the hypothesis that firms that introduce new products, new processes or adjust their organisational structure can reap higher benefits from ICT investment than firms that refrain from such complementary efforts. For the empirical implementation of innovation in the model, we employ data from business-related and distribution services obtained from two waves of the Community Innovation Survey (CIS) for both countries.
Although limited to two countries, this comparative study provides important insights in cross-country patterns and differences. The main results of our study can be summarised as follows:
� In both Germany and the Netherlands, ICT capital deepening has raised labour productivity in services firms.
� For both countries, the results indicate that ICT is used more productively if it is complemented by own innovation efforts in the ICT-using firms. This finding points to spill-over effects from ICT. Moreover, these spillovers are a particular feature of ICT capital since no complementarities between non-ICT capital and innovation could be found.
� For Germany, we find evidence for direct benefits from product and process innovation on multi-factor productivity (MFP) in services. Firms that innovate permanently show higher MFP levels. This positive direct effect of innovation on productivity, however, cannot be found for the Netherlands.
� The results also show that innovating on a more continuous basis seems to pay off more in terms of ICT productivity than innovating occasionally. This effect is found for product innovations (Germany) and non-technical innovations (Netherlands) and, to a much smaller extent, for process innovations.
As far as economic policy is concerned, the findings of our paper point to the importance of an innovative business environment that is needed to lay the fundamentals for an efficient use of ICT and to stimulate productivity growth. For the Netherlands, an acceleration of productivity growth is needed to prevent a substantial decline in GDP growth in the coming years since demographic factors will further slow down the growth of labour supply.
In particular, rigid labour markets due to both institutional and legislative barriers may prevent firms from re-structuring their processes and the adoption of new workplace practices and organisational changes that are needed for a productive use of ICT. In Germany, for example, 9% of
147
firms mention internal resistance as a barrier to the adoption of ICT.36 Moreover, given that the adoption of ICT is also linked to the invention of new products and services, missing innovation incentives due to the lack of competition may slow down the diffusion of ICT substantially. This is particularly true for business-related services where the potential for ICT use is particularly large since markets are still highly regulated and local.37
The approach taken in this study may be extended in various directions in future research. For example, further analysis may focus in more detail on the similarities and differences regarding the construction of the capital variables. Also, potential biases from the lack of output prices at the firm-level may be checked (see e.g. Klette and Griliches, 1996). Most interesting would be if the analysis could be extended to more countries that have been participating in the Community Innovation Survey.
36. This result is obtained from a representative survey on the diffusion of ICT among German firms in manufacturing and services, conducted by ZEW Mannheim among 4 450 firms in the fourth quarter of 2002.
37. Business service markets do not comply with the standard of perfect competition derived from welfare theory. Three types of market failures appear to be relevant: failure to account for social externalities, failure due to the existence of market power and failure due to information asymmetry (see Kox, 2002).

148
REFERENCES
Arellano, M. and O. Bover (1995), “Another Look at the Instrumental Variable Estimation of Error-Components Models”, Journal of Econometrics 68: 29–51.
Ark, B. van (2001), “The Renewal of the Old Economy: An International Comparative Perspective”, STI Working Paper 2001/5, OECD, Paris.
Ark, B. van, R. Inklaar and R.H. McGuckin (2002), “Changing Gear – Productivity, ICT and Service Industries: Europe and the United States”, paper presented at the ZEW Conference 2002 on the Economics of Information and Communication Technologies, June 24-25, Mannheim.
Bertschek, I. and H. Fryges (2002), “The Adoption of Business-to-Business E-Commerce: Empirical Evidence for German Companies”, ZEW Discussion Paper No. 02–05, Centre for European Economic Research.
Blundell, R. and Bond, S. (1998), “GMM Estimation with Persistent Panel Data: an Application to Production Functions”, Working Paper Series No. W99/4, Institute for Fiscal Studies.
Bresnahan, T. and S. Greenstein (1996), “Technical Progress and Co–invention in Computing and in the Uses of Computers”, Brooking Papers on Economic Activity, Microeconomics pp. 1–77.
Bresnahan, T. F. and M. Trajtenberg (1995), “General Purpose Technologies: ‘Engines of Growth’?”, Journal of Econometrics 65: 83–108.
Bresnahan, T. F., E. Brynjolfsson and L.M. Hitt (2002), “Information Technology, Workplace Organization, and the Demand for Skilled Labor: Firm–Level Evidence”, Quarterly Journal of Economics 117: 339–376.
Brynjolfsson, E. and L.M. Hitt (1995), “Information Technology as a Factor of Production: The Role of Differences Among Firms”, Economics of Innovation and New Technology, 3: 193-199.
Brynjolfsson, E. and L.M. Hitt (2000), “Beyond Computation: Information Technology, Organizational Transformation and Business Performance”, Journal of Economic Perspectives 14: 23-48.
Brynjolfsson, E., L.M. Hitt and S. Yang (2002), “Intangible Assets: Computers and Organizational Capital”, Brookings Papers on Economic Activity pp. 137–198.
Colecchia, A. and P. Schreyer (2001), “ICT Investment and Economic Growth in the 1990s: Is the United States a Unique Case?”, STI Working Papers 2001/7, OECD.
David, P. (1991), “Computer and the Dynamo: The Modern Productivity Paradox in a Not-Too-Distant Mirror”, in: Technology and Productivity: The Challenge for Economic Policy, OECD, Paris, pp. 315-348.

149
EITO (2003), European Information Technology Observatory 2003, EITO, Frankfurt/Main.
Hall, B. H. and J. Mairesse (1995), “Exploring the relationship between R&D and productivity in French manufacturing firms”, Journal of Econometrics, vol. 65(1), pp 263-293.
Hempell, T. (2002a), “Does Experience Matter? Innovation and the Productivity of ICT in German Services”, ZEW Discussion Paper 02-43, Centre for European Economic Research (ftp://ftp.zew.de/pub/zewdocs/ dp/dp0243.pdf).
Hempell, T. (2002b), “What’s Spurious, What’s Real? Measuring the Productivity of ICT at the Firm-Level”, ZEW Discussion Paper 02–42, Centre for European Economic Research (ftp://ftp.zew.de/pub/zewdocs/ dp/dp0242.pdf).
Hoffmann, J. (1998), “Problems of Inflation Measurement in Germany”, Discussion Paper No. 01-98, Economic Research Centre of the Deutsche Bundesbank.
Hollenstein, H. (2002), “The Decision to Adopt Information and Communication Technologies (ICT) – Explanation and Policy Conclusions”, paper presented at the OECD Workshop on ICT and Business Performance, 9 December 2002, Paris, see Chapter 5.
Janz, N., G. Ebling, S. Gottschalk and H. Niggemann (2001), “The Mannheim Innovation Panels (MIP and MIP-S) of the Centre for European Economic Research (ZEW)”, Schmollers Jahrbuch 121: 123-129.
Klette, T.J. and Z. Grilliches (1996), “The Inconsistency of Common Scale Estimators when Output Prices are Unobserved and Endogenous”, Journal of Applied Econometrics, vol. 11, p.p. 343-361.
Kox, H.L.M. (2002), “Growth Challenges for the Dutch Business Services Industry: International Comparison and Policy Issues”, CPB Netherlands Bureau of Economic Policy Analysis, The Hague, special publication.
Leeuwen, G. van, and H.P. van der Wiel (2003a), “ICT, innovation and productivity”, CPB report 2003/II (forthcoming), CPB Netherlands Bureau of Economic Policy Analysis, The Hague.
Leeuwen, G. van, and H.P. van der Wiel (2003b), “Do ICT-Spillovers Matters? Empirical Evidence for the Netherlands”, CPB Discussion Paper (forthcoming), CPB Netherlands Bureau of Economic Policy Analysis, The Hague.
Licht, G. and D. Moch (1999), “Innovation and Information Technology in Services”, Canadian Journal of Economics 32: 363-383.
OECD (2000a), “A New Economy? The Changing Role of Innovation and Information Technology in Growth”, OECD, Paris.
OECD (2000b), “The Service Economy, Business and Industry Policy Forum Series”, STI/OECD.
OECD/Eurostat (1997), Oslo Manual, Proposed Guidelines for Collecting and Interpreting Technological Innovation Data, OECD/Eurostat, Paris.

150
Schreyer, P. (2000), “The Contribution of Information and Communication Technology to Output Growth: A Study of the G7 Countries”, STI Working Paper 2000/2, OECD.
Stiroh, K.J., (2002), “Are ICT Spillovers Driving the New Economy?”, Review of Income and Wealth, Series 48, Number 1, March 2002.
Wiel, H.P. van der, (2001a), “Does ICT Boost Dutch productivity growth?”, CPB document no 16, CPB Netherlands Bureau of Economic Policy Analysis, The Hague.
Wiel, H.P. van der (2001b), “Innovation and Productivity in Services”, CPB report 2001/1, CPB Netherlands Bureau of Economic Policy Analysis, The Hague.

151
ANNEX
Table A7.1. Summary statistics on key variables
Germany
Variable Mean* Standard dev.* Mean of values per employee**
Value added 36.293 332.22 137 651
Employees 292.13 3855.21 ---
ICT capital 0.789 5.40 4 117
Non-ICT capital 34.319 176.10 237 576
Netherlands
Variable Mean* Standard dev.* Mean of values per employee**
Value added 7.925 21.231 58 900
Employees 194 682 ---
ICT capital 0.311 1.194 1 987
Non-ICT capital 10.456 56.336 67 810
* Monetary values in million euros.
** Values in euros.
Note: Numbers refer to an unbalanced panel of 995 firms with a total of 4 134 observations from the period 1994-99 for Germany, and a balanced panel of 972 firms with a total of 6 804 observations for the Netherlands.
Table A7.2. Industrial composition of the samples
Industry NACE-code # firms % firms # firms % firms
Germany Netherlands
Wholesale trade 51 172 17.3 430 44.2
Retail trade 50, 52 190 19.1 287 29.5
Electronic data processing 72 95 9.5 32 3.3
Consultancies 74.1, 74.4 103 10.4 78 8.0
Technical services 73, 74.2, 74.3 143 14.4 70 7.2
Other business-related services 70, 71, 74.5-.8 292 29.3 75 7,7
Total 995 100 972 100

152
Table A7.3. Composition of samples by firm size
Size class (# employees) # firms % firms # firms % firms
Germany Netherlands
Up to 9 176 17.7 58 6.0
10 to 49 379 38.1 238 24.5
50 to 99 124 12.5 328 33.7
100 to 249 162 16.3 196 20.2
250 to 499 60 6.0 94 9.7
500 and more 94 9.4 58 6.0
Total 995 100 972 100
153
CHAPTER 8
FIRM PERFORMANCE IN THE CANADIAN FOOD PROCESSING SECTOR: THE INTERACTION BETWEEN ICT, ADVANCED TECHNOLOGY USE
AND HUMAN RESOURCE COMPETENCIES
John R. Baldwin, David Sabourin and David Smith Micro-Economic Analysis Division, Statistics Canada
Abstract
This chapter investigates the evolution of industrial structure in the Canadian food processing sector and its relationship to technological change. It uses a dataset combining advanced tech-nology use that is derived from a 1998 special survey on advanced technology use in the food sector that is linked to data on firm performance derived from administrative records covering the period 1988-1997.
The chapter first examines the characteristics of firms (size, nationality, emphasis given to training, innovativeness) that adopt advanced technologies and then how the use of these tech-nologies is related to plant performance (growth in productivity and market share). Plants that adopted more advanced technologies enjoyed superior productivity growth. Process control and network communications technologies are particularly important to productivity growth in the food-processing sector. Those plants that increased their relative productivity growth and used more advanced technologies saw their market share increase.

154
8.1 Introduction
The choice of a successful strategy is key to a firm’s growth. One of the strategies that we have found to be related to growth is innovation (Baldwin, 1996, Baldwin and Johnson, 1999a). One successful innovation strategy involves the use of advanced technologies.
This chapter examines how an advanced technology strategy in the food-processing sector is related to superior firm performance. It builds on two previous streams of research. The first are the studies that examine the characteristics of firms that are more innovative, either in the sense of introducing new products or new processes, or in terms of introducing new technologies. The second is the research that examines the connection between innovation and firm performance. Our work in both these areas conditions our view of the forces that are operating to influence dynamic change in the business population.
Firms have choices to make with regards to the strategies that they follow. Some try to be more innovative than others. To be successful innovators, firms have to combine a number of competencies (Baldwin and Johnson, 1998, 1999a, 1999b). They have to develop the capabilities to innovate – either by investing in R&D or in their technological capabilities. But they also have to develop special capabilities on the human-resource side, and in marketing and finance.
Decisions on which strategic competencies are developed are then reflected in a firm’s performance. Growth is a stochastic process that involves learning. Production opportunities are not unique and the growth of individual firms occurs in a world where each explores which advanced technologies and other strategies out of a set of many technological possibilities and strategies might be the most suitable to its circumstances. Firms adopt new, advanced technologies as they learn about their possibilities and experiment with the applicability of the new advanced technologies to their specific situations. Experimentation rewards some firms with superior growth and profitability. Market forces cull those firms that have made the wrong choices and reward those who have correctly chosen those policies that work.
This chapter replicates and expands upon earlier work that finds performance is related to technological choice (Baldwin, Diverty and Sabourin, 1995; Baldwin and Sabourin, 2001). In these papers, we find that manufacturing plants that had adopted advanced manufacturing technologies, in particular information and communications technologies (ICTs), experienced faster growth in productivity and in market share than those plants that had not managed to incorporate these advanced technologies into their plants.
These findings, based on Canadian empirical evidence, are confirmed by research that covers the experience of other countries. Stoneman and Kwon (1996), Rischel and Burns (1997), Ten Raa and Wolff (1999), Van Meijl (1995), and McGuckin et al. (1998) find a positive relationship between advanced technology use and superior firm performance.
Many other papers focus on a narrow range of ICTs. In our papers, we ask not only how advanced communications systems affect performance but also how a range of other advanced manufacturing technologies does so. The first of these two papers (Baldwin, Diverty and Sabourin, 1995) examines this connection in the 1980s; the second paper (Baldwin and Sabourin, 2001) does so for the 1990s.

155
Here, we examine a specific sector – the food-processing sector – and extend our earlier work that focused on all manufacturing industries in two ways. First, by focusing on a specific sector, we are able to examine a far more extensive list of technologies. The earlier work that focused on all of manufacturing had to focus on a core set of about 20 technologies that were common across a wide range of industries. Here we use The Survey of Advanced Technology in the Food Processing Sector (see Baldwin, Sabourin and West, 1999) to examine a group of more than 60 technologies. Second, we focus on how groups of technologies interact. Imbedded in the list of technologies examined are a number of industry-specific technologies (infra-red heating) plus most of the technologies previously examined. In particular, information and communications technologies (ICT), which were found in the two previous studies to be associated with growth, are included. This enables us to examine not only whether ICT matters, but also which other technologies they complement.
The focus of this chapter is on technology choice and its consequences for performance. While R&D is often stressed as a key activity for innovators, technological capabilities are just as important. Baldwin, Hanel and Sabourin (2000) demonstrate that the probability of becoming an innovator increased by about 20 percentage points if a firm goes from placing little emphasis on technology to a much greater emphasis on technology, while performing R&D has about a 30 percentage point effect. Baldwin and Hanel (2003) stress that a technological focus is a unique way, often quite separate from R&D, by which firms develop innovations.
While our focus is on technology, we recognize that other factors may impact on performance. We therefore also examine the relative importance of other factors – such as whether a firm is conducting R&D, developing a cadre of skilled workers, or has adopted specific advanced business practices.
This chapter first asks what factors are related to technology use. The chapter then studies the effect of technological choices on plant performance – using measures such as growth in market share and growth in relative productivity (the ratio of a plant’s labour productivity to the average labour productivity of its industry). It examines the relationship between the use of advanced manufacturing technology – such as programmable controllers, aseptic processing, and local and wide area networks – and these two measures of plant performance. It investigates whether plants using advanced technologies are selected for survival and growth by the search and culling process that is associated with competition.
The economic performance data used in the study come from a longitudinal file developed from the Annual Survey of Manufactures, which includes data on employment (production and non-production), labour productivity (value added per worker), wages and salaries, shipments, and value added for Canadian food-processing plants during the period 1988 to 1997. These data allow us to develop an objective measure of actual plant performance (growth in market share and relative productivity), as opposed to subjective measures derived from an evaluation by the survey respondents of their performance relative to competitors. The objective economic performance data were linked to data on advanced technology use at the plant level derived from the 1998 Survey of Advanced Technology in the Canadian Food Processing Industry. In what follows, we will be using plants as the unit of analysis. The results are weighted so that they represent the population of plants in the food-processing sector.

156
8.2 Market turnover
Within industries, there is a considerable amount of turnover, as growing firms replace declining firms. Previous studies (Baldwin, 1995; Baldwin, Diverty and Sabourin, 1995; Baldwin and Sabourin, 2001) have described the amount of change taking place over a ten-year period within the manufacturing sector. Growth and decline also takes place in the food-processing sector as some plants wrest market share away from others. During the period 1988-97, some 32% of market share was transferred, on average, from those losing market share to those gaining market share measured at the four-digit industry level.1 Growing continuers accounted for 20 percentage points of the gain, while entrants accounted for the remaining 12 percentage points. Decline in market share, on the other hand, came from declining continuers (13 percentage points) and exits (19 percentage points).
One of the factors that facilitate the development of competitive advantage is productivity growth. Firms that gain productivity relative to their competitors can put that advantage to work by dropping prices or increasing quality and thereby gain market share. There is also substantial change taking place in relative productivity of different plants in the food-processing sector.
A substantial percentage of continuing plants shifted position with regards to relative labour productivity between 1988 and 1997. More than half of the continuing plants that were in the lowest quartile in 1988 shifted up at least one quartile by 1997, while half shifted down out of the top quartile. The movement was even higher for the middle two quartiles, with only a third of plants still remaining in the same quartile in which they had started.
Changes in relative productivity and changes in market share are related. The relative labour productivity of plants that gained market share over the period was lower than that of decliners at the start of the period. Opening-period success with regards to relative productivity is not a good indicator of growth in market share over a subsequent period. But, by the end of the period, those plants gaining market share simultaneously managed to increase their relative productivity. By 1997, their relative productivity was well above that of the declining group. The market rewards those who have managed to improve their labour productivity with an increase in market share.
All of this suggests that there is a close relationship between changes in relative productivity and market-share growth – but that the relationship is one that is best investigated by examining the growth in market share over a period and the differences in characteristics that have emerged by the end of the period. The market rewards correct choices – but the evidence for this emerges only by the end of the period studied.
8.3. Data source for advanced technology use
We focus, in this chapter, on the adoption of a list of advanced technologies developed specifically for the Canadian food processing sector – a two-digit SIC manufacturing industry. The survey from which the data on technology used were taken is based on a frame of Canadian food processing establishments drawn from Statistics Canada’s Business Register. The sample was randomly drawn from a population of food processing establishments that was stratified by four-digit SIC industry, size and nationality of ownership. Excluded from the target population were food-processing establishments with fewer than 10 employees. The overall response rate to the survey was 84%.
1. Industry structure is measured at the establishment level (SIC-E).
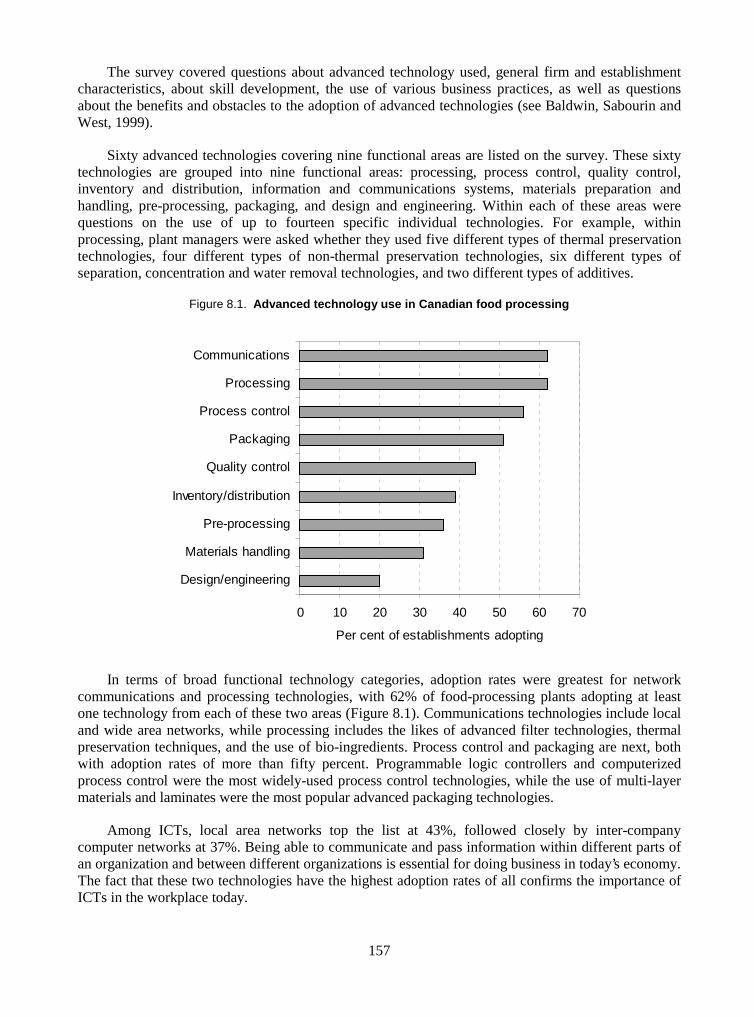
157
The survey covered questions about advanced technology used, general firm and establishment characteristics, about skill development, the use of various business practices, as well as questions about the benefits and obstacles to the adoption of advanced technologies (see Baldwin, Sabourin and West, 1999).
Sixty advanced technologies covering nine functional areas are listed on the survey. These sixty technologies are grouped into nine functional areas: processing, process control, quality control, inventory and distribution, information and communications systems, materials preparation and handling, pre-processing, packaging, and design and engineering. Within each of these areas were questions on the use of up to fourteen specific individual technologies. For example, within processing, plant managers were asked whether they used five different types of thermal preservation technologies, four different types of non-thermal preservation technologies, six different types of separation, concentration and water removal technologies, and two different types of additives.
Figure 8.1. Advanced technology use in Canadian food processing
0 10 20 30 40 50 60 70
Design/engineering
Materials handling
Pre-processing
Inventory/distribution
Quality control
Packaging
Process control
Processing
Communications
Per cent of establishments adopting
In terms of broad functional technology categories, adoption rates were greatest for network communications and processing technologies, with 62% of food-processing plants adopting at least one technology from each of these two areas (Figure 8.1). Communications technologies include local and wide area networks, while processing includes the likes of advanced filter technologies, thermal preservation techniques, and the use of bio-ingredients. Process control and packaging are next, both with adoption rates of more than fifty percent. Programmable logic controllers and computerized process control were the most widely-used process control technologies, while the use of multi-layer materials and laminates were the most popular advanced packaging technologies.
Among ICTs, local area networks top the list at 43%, followed closely by inter-company computer networks at 37%. Being able to communicate and pass information within different parts of an organization and between different organizations is essential for doing business in today’s economy. The fact that these two technologies have the highest adoption rates of all confirms the importance of ICTs in the workplace today.

158
8.4 Model specification
In order to meet their objectives, firms have a wide array of strategies from which they choose. One of those strategies is what we refer to as an advanced technology strategy. But in order to implement this technology strategy, a set of complementary competencies like human-resource strategies needs to be put in place. The successful use of technology will depend on the existence of these complementary competencies, but also on the nature of the industry environment in which the firm finds itself. For example, firms in a more competitive environment may behave differently from firms in a less competitive environment.
Three separate equations are estimated. The first examines technology use. The second equation estimates the correlates of productivity growth. The third investigates the correlates of market-share growth. The regressions that were estimated are:
1. Tech = �0 + �1*Size88 + �2*Foreign + �3*R&D + �4*Compet + �5*Practices + �6*Compenv + �7*Strategies + �8*Innov + �9*Industry
2. Prodgrth = �0 + �1*Tech + �2*Size88 + �3*Foreign + �4*�Capint + �5*Labprod88 + �6*R&D + �7*Compet + �8*Practices + �9*Compenv + �10*Strategies + �11*Innov + �12*Industry
3. Shargrth = �0 + �1*Tech + �2*Size88 + �3*Foreign + �4*Labprod88 + �5*�Labprod + �6*Mktshr88 + �7*R&D + �8*Compet + �9*Practices + �10*Compenv + �11Strategies + �12*Innov + �13*Industry
where:
TECH measures the number of advanced technologies used by the establishment.
PRODGRTH measures the growth in relative labour productivity of a plant.
SHARGRTH MEASURES THE GROWTH IN market SHARE OF A PLANT.
SIZE88 measures opening-period employment size of the plant.
FOREIGN captures whether or not an establishment is foreign owned.
�CAPINT captures changes in the capital intensity of a plant through changes in profitability.
�LABPROD measures changes in relative labour productivity over time.
LABPROD88 measures opening-period labour productivity levels.
MKTSHR88 measures opening-period market share.
R&D captures whether or not an establishment is an R&D performer.
COMPET measures the number of competitors a firm faces.
PRACTICES measures the use of advanced business and engineering practices.

159
COMPENV measures the intensity of competition within an industry.
STRATEGIES measures the competencies of a firm.
INNOV measures the innovative characteristics of a firm.
INDUSTRY captures industry effects.
For equation 1, the technological capabilities of the firm are hypothesized to be related to certain intrinsic characteristics of the firm such as foreign ownership, to the activities in which the firm is engaged such as innovation, and to the competitive environment in which it is placed.
In equation 2, we estimate the effects of different plant characteristics on relative productivity growth. We focus first on whether plants with higher relative productivity growth are those using advanced technologies. But we are careful to avoid being biased towards technological determinism. Other characteristics of a firm may also influence productivity growth. In particular, some of the same characteristics that influenced technological choice may have an additional impact on productivity growth. For example, foreign ownership may not only be related to whether more advanced manu-facturing technologies are used, but it may have an independent effect if multinationals are more efficient in other domains than just technology acquisition.
We relate performance over a period (1988-97) to advanced technology use at the end of the period (1998). Technology use at the end of a period is just the sum of technology use at the beginning of the period plus changes in technology use over the period. As such, we are postulating that performance over any period is posited to be a function of both advanced technology use at the beginning of the period and changes during the period.
In equation 3, we ask whether those plants with growth in relative labour productivity also have a higher growth in market share. As firms improve their relative productivity, this superior performance can be reflected in either price reductions or quality improvements. In either case, market share should improve. In addition to the impact of productivity growth on market-share growth, we hypothesize that other plant, firm and environmental characteristics may affect market-share growth.
It may be the case that productivity growth and advanced technology use are endogenous variables, that is, they are each correlated with the error term. The degree to which this is true will depend on the lag structure inherent in the effect of technology use on performance. If the effects of technology use on firm performance are felt with a relatively long lag, then performance during a period will be mostly a function of technology use at the beginning of the period, and less a function of additions of technology during the period. As such, end period technology use will be little affected by productivity growth over the preceding period.
We examine the issue of possible endogeneity using the Hausman (1978) test, and reject the existence of simultaneity between productivity growth and technology use. As a result we employ ordinary least-squares regression techniques for the growth in productivity equation.
In equation 3, we see productivity growth driving market-share growth. While there may be a feedback effect from market-share growth to productivity growth (for example, that runs from market-share growth to increased profitability to increases in the purchases of technology), we believe that lags in this process make simultaneity unlikely. We examined the existence of this possibility by running two-stage least squares regressions for both equations two and three. When market share was

160
included in the productivity growth equation, it was found to be insignificant2 and corrections for endogenous productivity growth in equation three had no significant effect on the parameter estimates produced by ordinary least squares. We therefore report the results of the latter technique here.
Finally, it should be noted that both equations two and three are in their first-difference form because we are naturally interested in the growth of performance over time. By taking first differences, we coincidentally remove the problem of fixed effects that may exist in the productivity or market share equations expressed in levels, if these effects should happen to remain unchanged over time. But to the extent that they do change, we may still have a specification problem in both equations. However, our inclusion of a large number of characteristics and activities of the firm in both equations 2 and 3 partially serves the function of correcting for the remaining problem of changing fixed effects. The coefficients on these variables will be zero if the fixed effects related to these variables are unchanging.
8.5 Technology use
8.5.1 Variables
8.5.1.1 Technology use
Technology use in this study is measured first as the number of advanced technologies that had been adopted. But this method does not allow us to effectively measure how different technologies are being used in combination, one with another.
Principal component analysis was also used to examine how different combinations or dimensions of technology use is related to firm performance. Interpretation of the resulting principal components is provided in Table A8.1 of Annex A of this chapter.3 For example, the first principal component jointly captures the use of advanced process control, information and communications and packaging technologies. The second principal component captures the combined use of advanced processing technologies of all types. But at the same time it represents plants in which advanced packaging machinery, robots and the use of CAD output for procurement are not important.
The first principal component, which explains 14% of the variance in the original set of variables representing each of the 60 technologies, captures the use of advanced process control, information and communications, and packaging technologies.
8.5.1.2 Plant and firm characteristics
Plant size is included to capture several factors. First, large plants are likely to have more functions within them and therefore a higher probability of needing more advanced technologies. Second, large plants tend to invest more per dollar of sales in new equipment and capital are therefore more likely to spend part of their investment on advanced technologies. Third, larger plants are also
2. We note that we do not rule out the possibility of simultaneity. But the data used herein do not allow us to
discern its impact. Part of the reason for the insignificance of market-share growth in the relative productivity growth equation using the two-stage approach is the low explanatory power of the equation that predicts market-share growth. Market-share growth is a stochastic process and is difficult to predict in the best of circumstances. Our choice then of the methodology adopted here is as much a result of our priors on the nature of the lag process as a result of definitive statistical tests on endogeneity.
3. For more detail, see Baldwin, Sabourin and Smith (2002).
161
more likely to have the superior financial and informational capabilities needed to ingest new advanced technologies. Employment data are used to measure size.
Nationality of control of an establishment is included since multinational firms are seen to play an important role in the global diffusion of advanced technologies (Caves, 1982). The advantages of multinational enterprises are typically related to their size, expertise and financial resources. Nationality of control is captured by a binary variable that takes a value of one if the establishment is foreign controlled, and a value of zero if the establishment is domestically controlled.
Size is often used as a proxy for scale effects. But it is also a proxy for differences in the internal capabilities of firms. The largest firms at any point in time contain a large group that are more competent and that have recently grown. Competencies of firms are rarely included in economic studies of the innovation process,4 despite the fact that firms build up sets of competencies that are important for their overall growth and success. Baldwin and Johnson (1998) concluded in their study of small and medium sized businesses that the more successful innovative firms placed more emphasis on marketing, finance, production and human-resource competencies than less-innovative firms. Technologically advanced firms are among the most innovative and, therefore, might be expected to build up these types of competencies in order to incorporate new technologies into the production process.
Whether a firm will be able to adopt new advanced technology should depend on whether a firm has developed a number of specialized competencies – relating to organisational structure, culture, and the capabilities of employees. To construct a set of measures that capture a variety of competencies that we have shown elsewhere to be related to whether a firm is capable of innovation (Baldwin and Johnson, 1998), we use a question on the food-processing survey that asks respondents to rate the importance of a set of factors, ranging from management to marketing to human-resource strategies. Firms rank the importance they gave to various marketing, technology, production, management and human-resource strategies on a five-point Likert scale, ranging from 1 (low importance) to 5 (high importance).
Three competency variables are constructed that are based on the firms’ responses to this set of questions. Responses to three questions are used to construct a market strategy variable. The questions measure the importance to the firm of introducing new products in present markets, introducing current products in new markets, and introducing new products in new markets. Similarly, a technology strategy variable is constructed using the responses to three other questions – the importance of using technology developed by others, of developing new technology, and of improving existing technology. Finally, management and human-resource strategies were combined into a single category. Six questions were used to construct this variable. They measure the importance to the firm of continuously improving quality, of introducing innovative organizational structure, of using information technology, of continuously training staff, of introducing innovative compensation packages, and of recruiting skilled workers.
The scores given to these strategy variables by a firm are taken here to represent underlying competencies in the firm. We use principal factor analysis to represent these underlying competencies. Two factors were constructed and used for each of the three competency variables (see Annex B of this chapter).
4. For an exception, see Baldwin and Hanel (2003).

162
Also driving the need for advanced technologies are certain activities in which a firm may be engaged. For example, firms employ a variety of business and engineering practices that require advanced technologies if they are to be effective. Some, such as hazard analysis critical points (HACCP) and food safety enhancement programs (FSEP), are aimed at enhancing the quality of the products produced by the firm. Others are used to manage the materials handled by the firm. Materials requirement planning and just-in-time inventory are two examples of this type of practice. A third set includes techniques geared to increasing the speed, efficiency and effectiveness of product and process development. Examples include rapid prototyping and concurrent engineering. Each of these activities requires or is facilitated by the use of advanced technologies.
Previous studies (Gordon and Wiseman, 1995; Baldwin and Sabourin, 2000) find that the adoption of such practices, particularly those devoted to product and process development, provide firms with a comparative advantage and an increased likelihood of being innovative.
Three binary variables are constructed to capture the effects of using advanced practices. The first binary variable captures whether a plant uses practices aimed at quality enhancement; the second, whether it uses practices targeted for materials management; the third whether it uses practices aimed at product and process development.
Each of the three binary variables takes a value of one if a firm uses any of the practices listed within the group, and a value of zero otherwise.
Eight practices are listed on the survey questionnaire relating to quality enhancement – continuous quality improvement, benchmarking, acceptance sampling, certification of suppliers, good manufacturing practices, hazard analysis critical control points, food safety enhancement program and plant quality certification.
Seven practices pertain to materials management – materials requirement planning, manu-facturing resource planning, process changeover time reduction, just-in-time inventory control, electronic work order management, electronic data interchange and distribution resource planning.
Nine practices are listed for product and process development – rapid prototyping, quality function deployment, cross-functional design teams, concurrent engineering, computer-aided design, continuous improvement, process benchmarking, process simulation and process value-added analysis.
Finally, the innovative stance of a firm is hypothesized to affect technology adoption. Innovative firms are more likely to use advanced technologies because the latter are often associated with the introduction of either new products or new processes (Baldwin and Sabourin, 2001). The innovative stance of the firm is measured in two ways in this study – first, with a variable that captures the extent to which innovations are being produced; second, with a variable that captures whether R&D is being performed.
Innovation characteristics are captured using a taxonomy that classifies firms into one of five mutually exclusive types – process specialized innovators, product specialized innovators, combined innovators, comprehensive innovators and non-innovators. Process specialized innovators are innovators that specialize in process innovations. Product specialized innovators are innovators that primarily produce product innovations. Combined innovators are establishments that introduce some combination of process innovation and product innovation, either with or without associated process innovation. And comprehensive innovators are innovators that introduce innovations of all types. Five binary variables were constructed to capture the innovator type.

163
To capture related aspects of an innovation program, a binary variable is also included indicating if a plant reported that its parent firm performs R&D. Contrary to the innovation variables that capture whether there any outputs from the innovation process, this variables captures inputs to the innovation process. A firm may not have any innovative outputs despite having devoted resources to R&D. For this reason, both the innovation and R&D variables are used here.
8.5.1.3 Industrial environment
Technology use might be related to the competitive environment faced by a firm. Firms involved in fiercely competitive markets could have more pressures placed upon them to adopt technologies.
Competition is measured in two ways in this study. First, it is measured by numbers of competitors. Plants are assigned to one of three competition groups according to the number of competitors they face – five or fewer, six to 20, or more than 20 competitors. Three binary variables are used to capture these competitive categories.
An alternative approach is also pursued. Plant managers are asked in the food processing survey to evaluate the importance to their industry of a set of factors that together determine the competitive environment faced by their plant – whether competition from imports is important; whether new competitors pose a constant threat; whether production technology changes rapidly; whether consumer demand is hard to predict; whether competitors are unpredictable; whether products quickly become obsolete; whether competitors can easily substitute among suppliers; and whether customers or suppliers can easily become competitors.
Scores on these categories are summed across all eight statements. High aggregate scores suggest a highly competitive environment, while low aggregate scores suggest just the opposite.
Finally, binary variables are included to control for industry effects. Seven sub-industries of food processing were used – bakery, cereal, dairy, fruit and vegetables, fish, meat, and other food products.
8.5.2 Empirical results for technology use
The results of the OLS regression that measures technology use by numbers of technologies adopted are presented in Table 8.1. All regressions are weighted and are estimated against an excluded plant that is Canadian-owned, does not perform R&D, and is in the bakery industry.
The number of technologies that are used is a positive function of both size and of nationality. As has been found repeatedly (Baldwin, Diverty and Sabourin, 1995; Baldwin and Sabourin, 1995; and Baldwin, Sabourin and West, 1999), larger plants use more advanced technologies than small plants.
Table 8.1. Regressions for technology use (establishment weighted)
Model 1 Model 2 Model 3
Intercept -3.80*** -4.21*** -1.72*
Plant size
Employment Size-1988 0.017*** 0.016*** 0.014***
Nationality of control
Foreign 1.81*** 1.54** 1.22*
(continued on next page)

164
Table 8.1. Regressions for technology use (establishment weighted) (continued)
Model 1 Model 2 Model 3
Innovation
Process specialised . 1.92** 1.32
Product specialised . 0.96 0.77
Combined . 2.67*** 2.29***
Comprehensive . 3.83*** 3.38***
R&D
Ongoing R&D performer 1.09** 0.45 0.11
Competition
6-20 competitors 1.06** 0.71 0.49
Over 20 competitors 1.12** 0.96* 0.73
Business practices
Product quality 1.94*** 1.42* 0.37
Management 2.54*** 2.52*** 2.15***
Product/process development 3.24*** 2.78*** 2.54***
Firm strategies
Technology
– Factor 1 . . 0.78***
– Factor 2 . . 0.16
Marketing
– Factor 1 . . -0.10
– Factor 2 . . -0.18
Management/human resources
– Factor 1 . . 0.45*
– Factor 2 . . -0.38**
Industry
Cereal 1.53** 1.92*** 1.71***
Dairy 4.43*** 4.31*** 4.10***
Fish 1.45* 1.46* 1.22
Fruit & vegetables 2.12*** 2.34*** 2.44***
Meat 3.17*** 3.19*** 3.11***
Other 2.30*** 1.98*** 1.83***
Summary statistics
N 538 538 538
F(degrees of freedom) F(14,523) = 26.90 F(18,519) = 23.27 F(24,513) = 19.07
R2 0.38 0.43 0.46
*** Statistically significant at the 1% level. ** Statistically significant at the 5% level. *Statistically significant at the 10% level.

165
We also confirm the finding that foreign plants are more likely to use more advanced tech-nologies, even after for controlling for their larger plant size (Baldwin, Rama and Sabourin, 1999).
Firms that are more innovative are more likely to use advanced technologies, which confirms the findings of the 1993 Survey of Innovation and Advanced Technology that many firms that introduce innovations adopt new advanced manufacturing technologies at the same time (Baldwin and Hanel, 2003). Performing R&D is positively related to technology use, though this variable becomes insignificant once the innovation variables are included. The categories of innovation that are positively related to the use of advanced technologies all involve some aspect of process innovation.
Two of the groups of business practices are positively and significantly related to advanced technology use, after controlling for firm competencies. Certain activities – managing materials and product/process development – drive the adoption of advanced technologies. Product quality practices are positively correlated to technology use but their significance is greatly reduced when innovation is included. Innovation and quality improvement are closely related.
Most of the underlying characteristics are found to be insignificant once the other controls are included. Not surprisingly, adopting a technological bent (developing new technologies and improving existing technologies) matters. But so does the second factor under the management and human-resource group. The results show that using innovative compensation packages, information tech-nology and innovative organizational structures is associated with the use of advanced technologies.
8.6. Productivity growth
8.6.1 Description of variables
Productivity growth is hypothesized to be a function of the technological profile of the industry. We capture advanced technology use in two ways. In the first case, we employ a measure of intensity of use – the number of technologies an establishment has adopted. As there are 60 advanced tech-nologies listed on the survey, this is a variable ranging from zero to 60.
In the second case, we employ a measure of the different combinations of technologies being used. To measure different combinations of advanced technology use, we employ principal component analysis, which was discussed in Section 4.
Productivity growth is also likely to be a function of changes in capital intensity. Since advanced technology use probably increases with increases in the capital intensity of a plant, our measure of technology use may simply capture capital intensity. We would also like to know whether advanced technology use still matters after capital intensity has been taken into account. For then it is not so much the amount of capital employed, as the type of capital (advanced or otherwise) that matters. To correct for capital intensity, the increase in a plant’s relative profitability (its profit/sales ratio) is included.
Productivity growth is also postulated to depend on productivity in the initial period in order to allow for regression-to-the-mean. Previous studies (Baldwin, 1995; Baldwin and Sabourin, 2001) have reported that plants tend to regress to the mean over the period.
Finally, we include the same set of firm characteristics – nationality, competencies, innovation intensity, and competitive environment – that were used in the technology equation. Our use of this variable allows us to test whether productivity growth depends not just on technology but also on a wider range of firm characteristics.

166
Nationality is included since previous work has found that labour productivity growth in foreign-controlled plants has been higher than in the domestic sector in the 1980s and 1990s (Baldwin and Dhaliwal, 2001).
Competencies are included to test whether the underlying characteristics of firms that are related to technology use also affect the amount of productivity growth that is generated. The inclusion of these variables not only provides us with insight into the types of competencies that are associated with productivity growth, but it also helps to reduce the fixed-effects econometric problem. The econometrics literature has spent considerable effort worrying that equations such as the ones we are trying to estimate will yield biased estimates of the parameters attached to the independent variables if there are omitted fixed effects at the plant level that are correlated with the included variables. Previous studies have found advanced technology adoption is correlated with R&D activity, innovation, and the use of advanced business and engineering practices. Because of this, a regression that includes advanced technology use, but not any of the firm characteristic and activity variables, risks attributing any effect due to intrinsic competencies and activities to the adoption of advanced technology. The correlation between technology use and productivity growth may simply reflect the fact that superior firms, in addition to making more use of advanced technologies, do a host of other things that influence growth as well (see McGuckin et al., 1998). The inclusion of several measures of firm characteristics and activities hopefully serves to alleviate this problem.
Previous studies (Lichtenberg and Siegel, 1991; Hall and Mairesse, 1995; Dilling-Hansen et al., 1999) indicate that R&D has a positive effect on productivity. In this study, we are also interested in knowing whether R&D activity and innovation affect productivity performance after the technology mix has been taken into account.
Productivity growth might also be related to the competitive environment faced by a firm. Firms involved in fiercely competitive markets might be expected to have more gains in productivity than those firms in a much less competitive environment. For this reason, our measures of competitive environment are included.
8.6.2 Empirical results for growth in labour productivity
The results for productivity growth are presented in Table 8.2. Interpretations of the principal component results for the technology variables are provided in Table 8.3.
Growth in relative labour productivity is positively and significantly related to the number of advanced technologies used (results not reported here) and to six of the technology principal components. Establishments that emphasize the joint use of advanced information and communications systems, process control, and packaging technologies are more likely to enjoy productivity growth, according to the coefficients attached to the first principal component (Tech1). ICT systems then are critical to processing control technologies.
Plants, for which the use of advanced pre-processing and process control technologies together are important, and where advanced packaging and thermal preservation together are not (Tech4), are also more likely to undergo growth in productivity. Process control technology includes the likes of programmable logic controllers, computerized process control and sensor-based inspection equipment. Pre-processing technologies are technologies used for raw product quality enhancement and raw product quality assessment, including bran removal, micro separation and electronic grading. In an industry concerned with product regulations governing food quality and safety, the use of advanced technologies dedicated to minimizing spoilage and wastage can lead to gains in productivity.

167
The coefficient attached to the seventh principal component (Tech7) is also highly significant. This component is negatively related to productivity growth, which means that plants that emphasize advanced separation processing techniques, sophisticated testing techniques and the use of advanced packaging methods, while de-emphasizing information and communications systems, thermal preservation heating and design and engineering, are more likely to be associated with productivity growth.
Three other of the top fifteen principal components (Tech5, Tech6 and Tech15) are significant at the 10% level. All three are negatively related to productivity growth. In the case of Tech6, this means that plants favouring information and communications technologies and rapid testing techniques, and not statistical process control, machine vision, product handling and high-pressure sterilization, are more likely to achieve growth in productivity.
In summary, information and communication technologies have been positively linked to productivity growth through a number of different components. ICT is important, but in combination with other technologies. Adoption of technologies like local and wide area networks, and inter-company computer networks are positively associated with higher productivity growth throughout the 1990s. Transfer of information both within an organization and between organizations is closely associated with growth in productivity, lending support to the view that the adoption of ICTs is important to productivity growth.
There is a large, significant effect of the growth in capital intensity on the growth in relative labour productivity that is consistent with the literature.
The coefficient on the starting-period relative productivity variable is negative and highly significant. There is regression-to-the-mean in relative productivity. Plants that started the period with a high relative labour productivity saw their relative labour productivity decline. Equivalently, those plants that were below average in terms of relative labour productivity at the start of the period saw their productivity increase relative to their compatriots.
Table 8.2. OLS principal components regressions for productivity growth (1988-97)
(Establishment-weighted)
Model 1 Model 2 Model 3 Model 4
Advanced technology use
Tech1 0.034** 0.029* 0.039** 0.033*
Tech2 -0.009 -0.008 -0.008 -0.006
Tech3 -0.072 -0.071 -0.074 -0.073
Tech4 0.082** 0.082** 0.081** 0.081**
Tech5 -0.053* -0.054 -0.057* -0.058*
Tech6 -0.046* -0.043 -0.056** -0.053*
Tech7 -0.074*** -0.073*** -0.070*** -0.069***
Tech8 -0.025 -0.024 -0.028 -0.026
Tech9 -0.019 -0.016 -0.024 -0.020
Tech10 0.009 0.011 0.006 0.008
(continued on next page)

168
Table 8.2. OLS principal components regressions for productivity growth (1988-97) (continued)
(Establishment-weighted)
Model 1 Model 2 Model 3 Model 4
Advanced technology use (cont’d)
Tech11 -0.006 -0.006 -0.005 -0.005
Tech12 0.013 0.015 0.006 0.008
Tech13 -0.007 -0.006 -0.005 -0.004
Tech14 -0.018 -0.015 -0.019 -0.016
Tech15 -0.074* -0.071* -0.076* -0.072*
Plant size
Employment size (1988) 0.0004 0.0004 0.0005 0.0005
Nationality of control
Foreign -0.025 -0.020 -0.028 -0.025
Capital intensity
Profitability change (1988-97) 0.019*** 0.019*** 0.019*** 0.019***
Initial labour productivity
Relative productivity (1988) -0.483*** -0.486*** -0.476*** -0.478***
R&D
Ongoing R&D performer -0.142* -0.168* -0.129 -0.153*
Competition
6-20 competitors -0.024 -0.038 0.004 -0.013
Over 20 competitors -0.021 -0.030 0.001 -0.008
Business practices
Product quality 0.147 0.137 0.122 0.110
Management 0.051 0.049 0.077 0.079
Product/process development -0.001 -0.012 -0.010 -0.018
Competitive environment
Industry environment 0.00008 -0.00009 -0.00006 0.0001
Innovation
Process specialised --- 0.126 --- 0.136
Product specialised --- 0.103 --- 0.088
Combined --- 0.083 --- 0.095
Comprehensive --- 0.141 --- 0.150
(continued on next page)

169
Table 8.2. OLS principal components regressions for productivity growth (1988-97) (continued)
(Establishment-weighted)
Model 1 Model 2 Model 3 Model 4
Firm strategies
Technology
– Factor 1 --- --- 0.007 0.007
– Factor 2 --- --- -0.032 -0.024
Marketing
– Factor 1 --- --- -0.006 -0.007
– Factor 2 --- --- -0.019 -0.020
Management/human resources
– Factor 1 --- --- -0.033 -0.038
– Factor 2 --- --- 0.075* 0.077*
Industry
Cereal 0.048 0.066 0.068 0.087
Dairy 0.229 0.240 0.261 0.270
Fish 0.104 0.118 0.120 0.132
Fruit & vegetables 0.040 0.051 0.073 0.084
Meat 0.285 0.298 0.299 0.310
Other 0.092 0.089 0.107 0.102
N 524 524 524 524
F(degrees of freedom) F(32,491) = 4.09 F(36,487) = 3.66 F(38,485) = 3.66 F(42,481) = 3.31
R2 0.20 0.20 0.20 0.21
*** Statistically significant at the 1% level. ** Statistically significant at the 5% level. * Statistically significant at the 10% level.
Outside of R&D and certain firm competencies, few of the firm characteristics variables are significant. Size of establishment and whether a plant has introduced innovations are positively, although not significantly, related to productivity growth. The coefficient attached to country of control is negative, but also not significant. And whether an establishment adopts advanced engineering and business practices is also not significant.
Neither innovation nor R&D activity is associated with higher productivity growth. Indeed, R&D activity has a negative and weakly significant impact on productivity growth.
Of the firm competencies, only management and human resources have a significant effect. The second factor for this competency is positively, and significantly, related to productivity growth. The second factor loads positively on three characteristics and negatively on three other characteristics (Annex B of this chapter). The three factors that are positively loaded are continuously improving quality, continuously training staff and recruiting skilled workers. The negative loadings are for introducing innovative organizational structure, using information technology and introducing innovative compensation packages. This factor describing a firm’s tendency to concentrate on creating and maintaining a skilled workforce, through both training and recruitment, and to improve the quality of the products offered by the firm. Food processing plants that exhibited this competency were less

170
likely to have adopted advanced technologies but were more likely to have enjoyed productivity growth if they had done so during the nineties. We interpret this to mean that these practices served as substitutes for an advanced technology strategy in the food-processing sector.
The competitive environment, measured in two ways in this study, is not significantly related to the productivity growth of establishments in the food processing industry, at least not throughout the 1990s. Neither the number of competitors that a firm faces, nor the intensity of competition within an industry as measured by an extensive set of environmental characteristics has a statistically significant effect.
Table 8.3. Interpretation of statistically significant technology principal components for productivity growth regression
Principal component
Sign of coefficient
Emphasises Downplays
Tech1 Positive Process control; information and communications; packaging; rapid testing; CAD/CAE
---------------------------
Tech4
Positive
Pre-processing (separation, testing, grading); process control; DNA probes
Bar coding; modified atmosphere and laminates (packaging); aseptic processing and flexible packages (thermal preservation); monoclonal antibodies (quality control)
Tech5
Negative
Quality control (excl. simulation modelling); bio-ingredients for processing; rapid testing; digital CAD; pre-processing
Inventory and distribution; machine vision; use of the internet
Tech6 Negative
High pressure sterilisation; product handling; statistical process control; machine vision; robots; digital CAD
Information and communications; collagen probe (pre-processing); rapid testing
Tech7
Negative
Information and communications; thermal preservation heating; simulation modeling (quality control); design and engineering (excluding CAD/CAE)
Separation techniques; sensor-based testing; rapid testing; modified atmosphere, laminates, and multi-layer materials (packaging)
Tech15
Negative
Thermal preservation; pre-processing separation and grading; and automated laboratory testing
Chemical antimicrobials; DNA probes; bio-ingredients; chromotography; and defect sorting
8.7 Market-share growth
8.7.1 Description of variables
The third model that we estimate examines the correlates of growth in market share. Growth in market share is postulated to depend on factors that give a firm an advantage over its competitors.
Growth in market share is posited to be a function of both the advantages in labour productivity experienced at the beginning of the period and its growth over the period. Initial period relative productivity is represented by the relative productivity advantage of a plant at the beginning of the period, while growth in relative productivity captures changes in this advantage that take place during the period.

171
In our formulation, growth in relative labour productivity is a proxy for a host of factors that are related to technical efficiency, changes in capital intensity, and other competencies in a firm – from management capabilities to human-resource strategies such as training.
But we also explicitly include certain measures of a firm’s competencies. Measures relating to the importance attributed by firms to their market strategy, their technological development strategy, their management, and their human-resource strategy are included in the market-share equation. This allows us test whether these competencies affect market-share growth independent of their indirect effect on productivity growth through technology use.
Although we already included advanced technology use in the labour productivity equation, we also include it in the market-share equation to test whether there is an effect of advanced technology on market-share growth that is separate from its effect on the growth in relative labour productivity. Advanced technology use not only allows relative cost gains that are reflected in lower prices, but it also improves the flexibility in the production process and the quality of products produced (Baldwin, Sabourin and Rafiquzzaman, 1996; Baldwin, Sabourin, and West, 1999). As such, it might be expected to have an effect on growth in market share independent of its effect on measured labour productivity.
The other variables that were included in the market-share equation are essentially the same as those used in the relative productivity growth model, with the addition of opening-period market share to allow for regression-to-the-mean.
8.7.2 Empirical results for growth in market share
The results for market-share growth are presented in Table 8.4. Interpretations of the principal component results for the technology variables are provided in Table 8.5.
Growth in labour productivity over the period is a positive, and highly significant, factor contributing to market-share growth. Labour productivity at the start of the period, on the other hand, does not significantly contribute to the growth in market share.
Even after taking into account the effects of relative productivity growth on market share, there is an additional impact of advanced technology use on the growth in market share. In the market-share growth regression, the first principal component is once again significant. An emphasis on advanced information and communications systems, process control and packaging technologies is positively related to market-share growth.
Plants that manage to incorporate advanced information and communication systems, process control technologies, and even advanced packaging technologies tended to grow in terms of their relative productivity during the past decade. In turn, growth in productivity from adopting these technologies leads to growth in market share. The fact that this principal component is significant even after controlling for growth in productivity indicates that there exists an additional effect, over and above that received from productivity growth.
The sign of the coefficient on the second principal component indicates that establishments that adopt both advanced preservation and advanced packaging technologies, and tend not to adopt advanced processing technologies, are more likely to achieve growth in market share. Similarly, the sign on the fifteenth component indicates that the adoption of advanced thermal technologies, advanced non-thermal preservation technologies and advanced separation and water removal tech-nologies, but not advanced quality control technologies, is associated with increasing market share.

172
Table 8.4. OLS principal components regressions for market-share growth (1988-97)
(Establishment-weighted)
Model 1 Model 2 Model 3 Model 4
Intercept 0.002 0.002 0.003 0.002
Advanced technology use
Tech1 0.0003* 0.0004* 0.0003* 0.0003*
Tech2 -0.0004** -0.0005** -0.0004** -0.0005**
Tech3 -0.0002 -0.0002 -0.0002 -0.0002
Tech4 0.0007* 0.0007* 0.0007* 0.0007*
Tech5 0.00005 0.0001 0.00006 0.0001
Tech6 0.00001 -0.00004 0.00004 -0.00001
Tech7 0.00006 0.00004 0.00007 0.00005
Tech8 0.0003 0.0003 0.0003 0.0003
Tech9 -0.0002 -0.0002 -0.0002 -0.0002
Tech10 0.0005 0.0005 0.0005 0.0005
Tech11 -0.0007 -0.0007 -0.0007 -0.0007
Tech12 0.0005 0.0005 0.0005 0.0005
Tech13 0.0005 0.0005 0.0005* 0.0005
Tech14 -0.0002 -0.0002 -0.0002 -0.0002
Tech15 0.0008** 0.0008** 0.0008** 0.0008**
Plant size
Employment size-1988 0.00001 0.00001 0.00001 0.00001
Nationality of control
Foreign 0.002 0.002 0.002 0.002
Initial market share
Market share (1988) -0.00004 -0.0005 0.0002 -0.0002
Initial labour productivity
Relative productivity (1988) -0.0006 -0.0006 -0.0007 -0.0006
Labour productivity growth
Relative productivity growth 0.0014*** 0.0014*** 0.0014*** 0.0014***
R&D
Ongoing R&D performer -0.0007 -0.0006 -0.0008 -0.0007
Competition
6-20 competitors 0.0007 0.0009 0.0006 0.0008
Over 20 competitors -0.0002 -0.0001 -0.0003 -0.0002
(continued on next page)

173
Table 8.4. OLS principal components regressions for market-share growth (1988-97) (continued)
(Establishment-weighted)
Model 1 Model 2 Model 3 Model 4
Business practices
Product quality -0.0002 -0.0002 -0.0002 -0.0002
Management -0.0006 -0.0004 -0.0006 -0.0004
Product/process development 0.0002 0.0003 0.0003 0.0003
Competitive environment
Industry environment -0.00001 0.000002 0.000009 0.000003
Innovation
Process specialised --- -0.0005 --- -0.0004
Product specialised --- -0.0010 --- -0.0010
Combined --- 0.0003 --- 0.0003
Comprehensive --- -0.0008 --- -0.0008
Firm strategies
Technology
– Factor 1 --- --- 0.0002 0.0002
– Factor 2 --- --- 0.0001 0.0001
Marketing
– Factor 1 --- --- 0.0001 0.0001
– Factor 2 --- --- -0.0001 -0.0001
Management/human resources
– Factor 1 --- --- -0.0001 -0.0002
– Factor 2 --- --- -0.0001 -0.0001
Industry
Cereal -0.001 -0.001 -0.001 -0.001
Dairy -0.0002 -0.0003 -0.0001 -0.0002
Fish 0.0001 -0.0001 0.00004 -0.0001
Fruit & vegetables 0.0006 0.0007 0.0006 0.0007
Meat 0.0008 0.0008 0.0009 0.0009
Other -0.0010 -0.0009 -0.0009 -0.0009
Summary statistics
N 537 537 537 537
F(degrees of freedom) F(33,503) = 1.43 F(37,499) = 1.28 F(39,497) = 1.32 F(43,493) = 1.20
R2 0.11 0.11 0.11 0.11
*** Statistically significant at the 1% level. ** Statistically significant at the 5% level. * Statistically significant at the 10% level.

174
It is noteworthy that none of the additional strategic competency, business practices, innovation, or competitive environment variables has a significant direct impact on market share. They have a direct impact on technology use and technology use, in turn, affects productivity and productivity affects market-share growth. But they have no separate impact on the latter.
The coefficients for both size and foreign ownership are positive, but neither is significant. R&D and growth in market share are negatively related; but, like the coefficients on size and ownership, this result is not statistically significant.
Table 8.5. Interpretations of statistically significant technology principal components
Market-share regressions
Principal component Sign of coefficient Emphasises Downplays
Tech1 Positive Process control; information and communications; packaging; rapid testing; CAD/CAE
---------------------------
Tech2 Negative Processing technology, of all types
Robots; packaging machinery; statistical process control; CAD output
Tech 4 Positive Pre-processing (separation, testing, grading); process control; DNA probes
Bar coding; modified atmosphere and laminates (packaging); aseptic processing and flexible packages (thermal preservation); monoclonal antibodies (quality control)
Tech15 Positive Thermal preservation; pre-processing separation and grading; and automated laboratory testing
Chemical antimicrobials; DNA probes; bio-ingredients; chromotography; and defect sorting
8.8 Conclusion
This study builds on our previous work that finds firm performance is related to the innovative stance of a firm.
There are many factors behind the growth of firms – from overall management capabilities, to marketing, human resources, and operational capabilities. A substantial part of a firm’s capital consists of these internal competencies. These capabilities extend beyond just R&D performance to encompass those activities that enable a firm to ingest new information about new technologies and to act quickly and effectively on it. All of these capabilities underlie a firm’s innovative capacity.
The importance given to innovative activity as a factor behind success is confirmed by our Canadian studies that have consistently found that the innovative capabilities of firms are related to their success (see Baldwin and Gellatly, 2004). Earlier studies investigated the difference in the competencies found in growing and declining firms to see whether a key difference between the two lies in the nature of their innovation regime. These studies use three different surveys as sources and find similar results in each case.

175
Baldwin (1996) and Baldwin and Johnson (1998) find that while firms need to do many things better in order to succeed, innovation is the one factor that appears to discriminate best between the more-successful and less-successful firms. Baldwin, Chandler et al. (1994) study growing small and medium sized firms in the 1980s and find that the key characteristic that distinguished the more-successful from the less-successful was the degree of innovation taking place in a firm. Measuring success as a vector of characteristics such as market-share growth and relative productivity growth, they report that the more-successful firms tend to place more emphasis on R&D capability and R&D spending. They are also more likely to give more importance to developing new technology.
Johnson, Baldwin and Hinchley (1997) report that in new firms that entered in the mid 1980s and survived into their teen years in the 1990s, growth in output was closely related to innovation. Faster growing entrants are twice as likely to report an innovation, and more likely to invest in R&D and technology than slower growing firms. However, faster growing firms are also more likely to place higher emphasis on training, recruiting skilled employees and providing incentive compensation programs (Baldwin, 2000).
These findings regarding the importance that firms give to innovative strategies and activities are confirmed by two other studies that use data at the plant level on the use of advanced technologies. Advanced technology use is a form of innovation. These studies report that plants using advanced technology both grow faster and increase their productivity relative to plants not using advanced technologies (Baldwin, Diverty and Sabourin, 1995; Baldwin and Sabourin, 2001).
In summary, all these studies have found that firms that manage to grow more quickly simultaneously develop certain innovative competencies that distinguish them from firms that grow less quickly. Differences in technological competencies have the same effect. That innovative and technological competencies are linked is not surprising. Some 53% of respondents to the 1993 Survey of Innovation and Advanced Technologies who had indicated that they introduced the advanced technologies did so in conjunction with the introduction of a product or process innovation.
This chapter is the third in Canada to confirm the relationship between firm performance and advanced technology use. The previous studies reported that it was information and communications technologies (ICTs) that were most closely associated with superior performance. This study finds the same. It provides strong evidence that the use of ICTs is associated with superior performance. Greater use of advanced information and communication technologies is associated with higher labour productivity growth during the nineties.
Our previous study (Baldwin, Diverty and Sabourin, 1995) also showed that firms that combined ICTs with other advanced technologies fared the best. This chapter corroborates these findings. The results show that beyond ICTs, the adoption of advanced process control and packaging technologies is also associated with higher productivity growth. For certain industries, the adoption of advanced pre-processing technologies also increases firm performance.
Furthermore, the results emphasize that combinations of technologies that involve more than just ICTs are important. For example, adoption of advanced process control technology, by itself, has little effect on the productivity growth of a firm, but when combined with ICTs and advanced packaging technologies, the effect is significant. Similar effects are evident when firm performance is measured by market-share growth instead of productivity growth. ICTs are important, but as facilitators of the effectiveness of other advanced technologies.

176
What is more significant is that these results still hold even when other activities and underlying characteristics of the firm are taken into account. We know that many factors determine whether a firm succeeds or fails. The food-processing survey has allowed us to measure not only technology use in a detailed way, but also to look at various other characteristics and competencies of a firm. We find that the association between technology use and productivity growth is robust to the inclusion or exclusion of the other activities and characteristics of the firm.
Other characteristics like the innovation stance of the firm, its business practices, and human-resource strategies influence the extent to which a firm adopts new advanced technologies. But their direct impact on productivity growth or market-share growth is less than the indirect impact through their influence on technology use.
Does that mean that the other characteristics of the firm do not matter when it comes to firm growth? The answer is no. The capital intensity of a firm is positively and significantly related to productivity growth. Regression to the mean for the productivity growth equation is highly significant. A management team with a focus on improving the quality of its products by adopting an aggressive human-resource strategy – by continuously improving the skill of its workforce through training and recruitment – is also associated with higher productivity growth.
Despite the importance of strategies outside the technology arena, the central theme that emerges from this analysis is that a high-technology orientation is at the core of a strategy set that is closely associated with success.

177
REFERENCES
Baldwin, J.R. (1995), The Dynamics of Industrial Competition. A North American Perspective, Cambridge University Press, Cambridge.
Baldwin, J.R. (1996), “Innovation: The Key to Success in Small Firms”, in: J. De la Mothe and G. Paquette (eds.), Evolutionary Economics and the New International Political Economy, Pinter, London.
Baldwin, J.R. (2000), Innovation and Training in New Firms, Analytical Studies Research Paper Series 11F0019MIE2000123, Analytical Studies Branch, Statistics Canada, Ottawa.
Baldwin, J.R., W. Chandler, C. Le and T. Papailiadis (1994), Strategies for Success: A Profile of Growing Small and Medium-sized Enterprises in Canada, Catalogue No. 61-523, Statistics Canada, Ottawa.
Baldwin, J.R. and N. Dhaliwal (2001), “Heterogeneity in Labour Productivity Growth in Manufacturing: Differences Between Domestic and Foreign Controlled Establishments”, in: Productivity Growth in Canada, Catalogue No. 15-204, pp. 51-76, Statistics Canada, Ottawa.
Baldwin, J.R., B. Diverty and D. Sabourin (1995), “Technology Use and Industrial Transformation: Empirical Perspectives”, in: T. Courchesne (ed.), Technology, Information, and Public Policy, John Deutsch Institute for the Study of Economic PolicyKingston, Queens University, Ontario. (See also Analytical Studies Research Paper Series 11F0019MIE1995075, Analytical Studies Branch, Statistics Canada, Ottawa.)
Baldwin, J.R. and G. Gellatly (2004), Innovation Strategies and Performance in Small Firms, Edward Elgar, forthcoming.
Baldwin, J.R. and P. Hanel (2003), Knowledge Creation and Innovation in a Small Open Economy, Cambridge University Press.
Baldwin, J.R., P. Hanel and D. Sabourin (2000), Determinants of Innovative Activity in Canadian Manufacturing Firms: The Role of Intellectual Property Rights, Analytical Studies Research Paper Series 11F0019MIE2000122, Analytical Studies Branch, Statistics Canada, Ottawa. With an abridged shorter version published as “Determinants of Innovative Activity in Canadian Manufacturing Firms”, in: A. Kleinknecht and P. Mohnen (eds.), Innovation and Firm Performance, pp. 86-111, Palgrave, Houndsmith, Basingstoke, Hampshire.
Baldwin, J.R. and J. Johnson (1998), “Innovator Typologies, Related Competencies and Performance”, in: G. Eliasson and C. Green (eds.), .Microfoundations of Economic Growth, pp. 227-53, Ann Arbor, University of Michigan.
Baldwin, J.R. and J. Johnson (1999a), “Innovation and Entry”, in: Z. Acs (ed.), Are Small Firms Important? Their Role and Impact, Kluwer.

178
Baldwin, J.R. and J. Johnson (1999b), The Defining Characteristics of Entrants in Science-based Industries, Catalogue No. 88-517-XPB, Analytical Studies Branch, Statistics Canada, Ottawa.
Baldwin, J.R., E. Rama and D. Sabourin (1999), Growth of Advanced Technology Use in Canadian Manufacturing during the 1990s, Analytical Studies Research Paper Series 11F0019MIE1999105, Analytical Studies Branch, Statistics Canada, Ottawa.
Baldwin, J.R. and D. Sabourin (1995), Technology Adoption in Canadian Manufacturing, Catalogue No. 88-512, Analytical Studies Branch, Statistics Canada, Ottawa.
Baldwin, J.R. and D. Sabourin (2000), “Innovative Activity in Canadian Food Processing Establishments”, International Journal of Technology Management, Vol. 20, No. 5-8: 511-527.
Baldwin, J.R. and D. Sabourin (2001), “Impact of the Adoption of Advanced Information and Communication Technologies on Firm Performance in the Canadian manufacturing Sector”, Analytical Studies Research Paper Series 11F0019MIE2001174, Analytical Studies Branch, Statistics Canada, Ottawa.
Baldwin, J.R., D. Sabourin, and D. Smith (2002), Impact of Advanced Technology Use on Firm Performance in the Canadian Food Processing Sector, Economic Analysis Research Paper Series No. 12, Catalogue No. 11F0027MIE012, Statistics Canada, Ottawa.
Baldwin, J.R., D. Sabourin and M. Rafiquzzaman (1996), Benefits and Problems Associated with Technology Adoption in Canadian Manufacturing, Catalogue No. 88-514, Statistics Canada, Ottawa.
Baldwin, J.R., D. Sabourin and D. West (1999), Advanced Technology in the Canadian Food-Processing Industry, Catalogue No. 88-518, Statistics Canada, Ottawa.
Caves, R.E. (1982), Multinational Enterprise and Economic Analysis, Cambridge University Press, Cambridge.
Dilling-Hansen, M., T. Eriksson, E.S. Madsen and V. Smith (1999), The Impact of R&D on Productivity: Evidence from Danish Firm-level Data, International Conference on Comparative Analysis of Enterprise Data, The Hague, the Netherlands.
Gordon, J. and J. Wiseman (1995), Best-Plant Practices, School of Business, Queen’s University.
Hall, B. and J. Mairesse (1995), “Exploring the Relationship between R&D and Productivity in French Manufacturing Firms”, Journal of Econometrics 65: 265-93.
Hausman, J. (1978), “Specification Tests in Econometrics”, Econometrica 48: 697-720.
Johnson, J., J.R. Baldwin and C. Hinchley (1997), Successful Entrants: Creating the Capacity for Survival and Growth, Catalogue No. 61-524, Statistics Canada, Ottawa.
Lichtenberg, F.R. and D. Siegel (1991), “The Impact of R&D Investment on Productivity: New Evidence using linked R&D-LRD data”, Economic Inquiry 29: 203-28.
McGuckin, R., M. Streitwieser and M. Doms (1998), “Advanced Technology Usage and Productivity Growth”, Economics of Innovation and New Technology 7: 1-26.

179
Rischel, T. and O. Burns (1997), “The Impact of Technology on Small Manufacturing Firms”, The Journal of Small Business Management, Vol. 35I, pp. 2-10.
Stoneman, P. and M. Kwon (1996), “Technology Adoption and Firm Profitability”, The Economic Journal, Vol. 106, pp. 952-962.
Ten Raa, T. and E. Wolff (1999), Engines of Growth in the U.S. Economy, ECIS/SCED Conference on Economic Growth, Trade and Technology, 3-4 October, Eindhoven.
Van Meijl, H. (1995), “Endogenous Technological Change: The Case of Information Technology. Theoretical Considerations and Empirical Results”, MERIT, University of Limburg, Maastricht, p. 289.

180
ANNEX A
PRINCIPAL COMPONENTS OF TECHNOLOGY USE
Table A8.1. Interpretation of principal components and their importance by industry
Principal component
Interpretation Variance explained (%)
Tech1 Emphasises process control, information and communications and packaging technologies. 13.6
Tech2 Emphasises advanced processing technology, of all types. Downplays robots, packaging machinery, statistical process control and CAD output.
5.8
Tech3 Emphasises pre-processing (except for near infrared analysis), non-thermal preservation, bar coding, and microwave drying and water activity control. Downplays separation and concentration processing, chromotography and near infrared analysis.
4.1
Tech4 Emphasises pre-processing, process control, and DNA probes. Downplays thermal preservation and advanced materials packaging, bar coding and monoclonal antibodies
3.7
Tech5 Emphasises quality control, bio-ingredients, rapid testing, digital CAD, and pre-processing. Downplays inventory and distribution, internet use & machine vision.
3.3
Tech6 Emphasises product handling, high-pressure sterilization, statistical process control, robots, machine vision, and digital CAD. Downplays information and communications, and rapid testing.
3.0
Tech7 Emphasises information and communications, thermal preservation heating, simulation modeling, and design and engineering. Downplays separation techniques, sensor-based and rapid testing and advanced materials packaging.
2.8
Tech8 Emphasises infrared and ohmic heating, microwave drying, and DNA probes. Downplays design and engineering, ultrasonic techniques and chemical antimicrobials, and electronically controlled machinery.
2.7
Tech9 Emphasises flexible packages, DNA probes, simulation modeling, bran removal and micro component separation, and active and multi-layer materials packaging. Downplays ultrasonic techniques, colour assessment, defect sorting and animal stress reduction.
2.5
Tech10 Emphasises microwave drying, laboratory testing, simulation modeling, high-pressure sterilisation, and internet use. Downplays aseptic processing, animal stress reduction and infra red heating.
2.3
Tech11 Emphasises animal stress reduction, deep chilling, monoclonal antibodies, and microwave drying. Downplays microencapsulation, defect sorting, and packaging.
2.2
Tech12 Emphasises design and engineering and ion exchange. Downplays microbial cells, microencapsulation, and robots.
2.2
Tech13 Emphasises microencapsulation, laboratory testing, and bar coding. Downplays thermal preservation, PLCs, and rapid testing.
2.0
Tech14 Emphasises ion exchange, chromotography, packaging machinery and animal stress reduction. Downplays CAD/CAM, inventory and distribution, defect sorting and LANs.
2.0
Tech15 Emphasises thermal preservation, pre-processing separation and grading, and automated laboratory testing. Downplays chemical antimicrobials, bio-ingredients, chromotography, DNA probes and defect sorting.
1.9

181
ANNEX B
FACTOR ANALYSIS FOR FIRM COMPETENCY VARIABLES
Table B8.1. Factor loadings for firm competency factors
Factor pattern Variable
Factor 1 Factor 2
Markets
– Introducing new products in present markets 0.832 -0.471
– Introducing current products in new markets 0.780 0.602
– Introducing new products in new markets 0.906 -0.086
Technology
– Using technology developed by others 0.758 0.622
– Developing new technology 0.865 -0.095
– Improving existing technology 0.803 -0.485
Management/human resources
– Continuously improving quality 0.695 0.589
– Introducing innovative organisational structure 0.781 -0.387
– Using information technology 0.801 -0.278
– Continuously training staff 0.785 0.346
– Introducing innovative compensation packages 0.767 -0.254
– Recruiting skilled workers 0.778 0.051

183
CHAPTER 9
INFORMATION TECHNOLOGY, WORKPLACE ORGANISATION, HUMAN CAPITAL AND FIRM PRODUCTIVITY: EVIDENCE FOR THE SWISS ECONOMY1
Spyros Arvanitis Swiss Institute of Business Cycle Research (KOF), Swiss Federal Institute of Technology (ETHZ)
Abstract
This chapter is based on a multivariate cross-section analysis of data of 1382 Swiss firms for the year 2000. It shows that labour productivity correlates positively a) with ICT indicators measuring the intensity of use of internet and intranet respectively by firms’ employees; b) with variables for new forms of workplace organisation such as team-work, job rotation and decentralisation of decision making; and c) with human capital intensity. Some evidence is also found for complementarities between human capital and ICT capital with respect to productivity but not between organisational capital and the other two kinds of inputs.
1. This study was supported by the Swiss National Research Foundation (project number 5004-05446; SPP
“Switzerland – Towards the Future”).

184
9.1 Introduction
Over the past ten to fifteen years it has become clear that production of goods and services in developed economies increasingly requires not only such traditional factors as physical capital and labour, but also skills, know-how, organisational structures and other factors referred to as “intangible” assets. Investment in information and communication technologies (ICT) has become recognised as one of the most prominent of these factors and there has been extensive empirical research on this issue over the past years (see Pilat and Lee 2001 and OECD 2003 for recent reviews of the empirical literature). The contribution of human capital to economic growth at aggregate, sectoral and firm levels has been properly appreciated for a long time (see e.g. Jorgenson and Fraumeni, 1995). Recently, many prominent economists have been engaged in an intensive discussion on the reasons for the observed shift of labour demand towards high-skilled workers (see e.g. Johnson, 1997 and the other contributions of the symposium in the Spring 1997 issue of the Journal of Economic Perspectives). New organisational practices are a further important intangible factor whose impact on firm efficiency and performance has been analysed over the past years (see Arnal et al., 2001 and Murphy, 2002 for a survey of the empirical literature on this subject).
Already from the beginning of the nineties some authors pointed to the relevance of comple-mentarities between the factors ICT, organisation and human capital as the most important charac-teristic of a new firm paradigm (see e.g. Milgrom and Roberts 1990). Since then a number of empirical studies have shown that such effects do exist and contribute significantly to firm performance (see Brynjolfsson and Hitt, 2000 for a review of the empirical literature in this field).
The present study explores empirically the hypothesis that ICT, new organisational practices and human capital are important determinants of firm efficiency and performance, and that the combined use of these three factors leads to a mutual strengthening of their impact on firm performance. The analytical framework is that of a production function at firm level. The study’s contribution to the empirical literature consists in being the first empirical study of this type for Switzerland.2 The study uses a rich data set at the firm level which was collected by means of a postal survey. It gives particular attention to the complementarities (using several approaches) and to the endogenisation of the technology and organisation variables. In addition, we focused on some statistical problems typically related to survey data; multiple imputations were used to substitute for missing values (to address the problem of item non-response) and some sensitivity analysis was done with respect to the applied imputation methods. Despite these advantages there are also shortcomings of the study, the principal one being that it is only a cross-section analysis which does not allow the test of causal relations, the use of lags between variables, etc.
The set-up of the chapter is as follows: section 9.2 sketches the analytical background of the chapter related to new theories on the combined influence of ICT, organisational factors and human capital on firm performance. Section 9.3 provides descriptive information on the existence and diffusion of ICT and new organisational practices in the Swiss business sector. In section 9.4 we describe our data. In section 9.5 we present and discuss the specification of the two versions of the empirical model (the basic model and the “compact” model). Sections 9.6 and 9.7 contain the results of the econometric estimates of the basic model and the “compact” model. In section 9.8 we present results on the complementarities. Finally, we summarise the main findings, indicate some directions for future research and draw some policy conclusions.
2. Recently the determinants of the adoption of computer-based manufacturing technologies as well as the
adoption of ICT in the Swiss business sector were investigated empirically (see Arvanitis and Hollenstein, 2001, Hollenstein, 2002 and Chapter 3).
185
9.2 Analytical framework
The new firm model
The past ten to fifteen years have witnessed a constellation of important changes in the production process, such as the extensive use of computer-aided production technologies, the advances in information and communication technologies, the emergence of new ideas on how to organise firms, changes in the skill requirements of labour and changes in employee preferences towards more flexible working conditions. On this basis, recently many authors have even postulated a shift to a new “firm paradigm”. Some of them focus their attention mainly on technological changes, some find the introduction of new organisational practices a central characteristic of this “paradigm change”. A third group concentrates primarily on the shift of firm demand to high-skilled labour in the past 20 years and analyses the determinants of this shift. In this section we briefly review some of this literature.
Milgrom and Roberts (1990) focus mainly on manufacturing and proclaim the replacement of the “mass production model by the vision of a flexible multi-product firm that emphasizes quality and speedy response to market conditions while utilizing technologically advanced equipment and new forms of organization” (p. 511). Changes in the production techniques and their implications for firm efficiency and performance are the main subjects of their theoretical analysis. Lindbeck and Snower (2000) analyse the shift from “‘Tayloristic’ organisation (characterised by specialisation by tasks) to ‘holistic’ organisation (featuring job rotation, integration of tasks and learning across tasks)” (p. 353). Bresnahan et al. (2002) take the relative demand of skilled-labour as the starting point of their analysis and consider the increased use of “complementary systems” of information technologies, workplace organisation and product innovation as drivers of skill-biased technical change. A point which is central in all types of analysis and a common characteristic of these studies is the existence of complementarities among several factors which mutually enhance their impact on firm performance.
Role of ICT
The benefits of ICT for a firm include savings of inputs, general cost reductions, higher flexibility, improvement in product quality, etc. The new technology may save labour or some specific labour skills; it may reduce capital needs through, for example, increased utilisation of equipment, reduction of inventories or space requirements, etc. It may also lead to higher product quality or better conditions for product development. Moreover, it may increase the flexibility of the production process allowing the exploitation of economies of scale (see e.g. Milgrom and Roberts, 1990, 1995). A specific feature of ICT is related to networking and communication. As new technologies reduce the cost of lateral communication, firms use these technologies to facilitate communication among employees and reduce co-ordination costs. Monitoring technologies can also be used to reduce the number of supervisors required in the production process. Thus, the use of ICT has direct implications for firm organisation.
While inventions that lead to improvements in ICT are readily available throughout the economy, complementary organisational changes involve a process of co-invention by individual firms (Bresnahan and Greenstein, 1997). Identifying and implementing such organisational changes is difficult and costly. These adjustment difficulties lead to variation across firms in the use of ICT, its organisational complements and the resulting outcomes.
Role of new organisational practices
Theories have also been developed to explain why these new high-skill, high-involvement workplaces may be more effective (see e.g. Ichniowski et al., 2000). These can be divided, first, into

186
theories that focus on the effort and motivation of workers and work groups; these suggest that due to the positive worker incentives created by new organisational forms performance increases. A second group of theories focuses on changes in the structure of organisations that improve efficiency. We concentrate here mainly on this second group. These theories imply that new arrangements can make organisational structures more efficient. For example, decentralising decision-making to self-directed teams can reduce the number of supervisors and middle managers required while improving communication; employee involvement can eliminate or reduce grievances and other sources of conflict within the firm, thus improving performance.
For these organisational practices as for other factors and inputs, interdependencies exist. Some of the changes in work design are associated with the introduction and diffusion of information technologies within the firm. For example, Greenan and Guellec (1994) show in a theoretical paper that the relative efficiency of a centralised mode of firm organisation in which knowledge is confined to specialised workers and a decentralised one in which every worker participates in learning depends on the technological level of the firm: “whereas the centralized style is more efficient when the technological level is low, the decentralized one becomes more efficient when the technological level is higher” (p. 173).
Role of human capital
The shift towards skilled workers appears to have accelerated in the past twenty years. While many factors have contributed to this increase most authors think that this effect is attributable primarily to skill-based technical change. The size, breadth and timing of the recent shift in labour demand have led many to relate skill-biased technical change to the largest and most widespread new technology of the past years, ICT (see Bresnahan et al., 2002). On the one hand, high-skilled labour is a precondition for the use of ICT; for example, training in problem-solving, statistical process controls and computer skills can increase the benefits of ICT. On the other hand, highly computerised systems not only systematically substitute computerised decision-making for human decision-making in routine work, but also produce a large quantity of data which requires high-skilled workers, managers and professionals to get adequately utilised.
Role of complementarities
The use of ICT, new organisational practices and human capital build a “complementary system” of activities (Bresnahan et al. 2002, p. 341ff; Milgrom and Roberts 1995, p. 191ff.). According to Milgrom and Roberts (1990, p. 514), “the term ‘complement’ is used not only in the traditional sense of a specific relation between pairs of inputs but also in a broader sense as a relation among groups of activities”. For example, modern advanced manufacturing techniques consist of a bundle of tech-nology elements implying considerable complementarities among these elements; a standard illustration refers to the use of CAD which leads to complementarities with other programmable manufacturing equipment. But complementarities are also found with respect to organisation and human capital.
According to the formal definition of complementarities of a firm’s two discrete activities with respect to some performance variable, the following proposition can be postulated based on the theory of super modularity (see e.g. Athey and Stern, 1998, p. 8f.). Suppose there are two activities A1 and A2, each activity can be performed by the firm (Ai = 1) or not (Ai =0). The function F(A1, A2) (e.g. F is firm performance) is “super modular” and A1 and A2 are “complements” only if: F(1,1) - F(0,1) >= F(1,0) - F(0,0), i.e. performing the first activity together with the second one yields a higher incremental effect on F (performance) than when performing the first activity alone. This proposition is quite useful for testing complementarities empirically.

187
Production function framework
The discussion above shows that there are some common testable hypotheses with respect to the contribution of ICT, new organisational practices and human capital to firm efficiency and performance which can best be put together in the framework of a production function. Besides the classical production factors labour and physical capital this also contains the new ones, ICT capital, organisation capital and human capital (see Brynjolfsson and Hitt, 2000, for a recent survey of the empirical literature on this topic):
� Hypothesis 1: there are considerable direct positive effects of ICT, organisation and human capital on firm performance.
� Hypothesis 2: there are considerable indirect positive effects of these factors on firm per-formance which can be traced back to complementarities among them.
9.3 Use of ICT and new organisational practices in the Swiss business sector
Information and communication technologies (ICT)
Between 1995 and 2000, as in many other OECD countries, the use of information technologies in the Swiss business sector increased at a tremendous rate. In 2000, 94.0% of all firms (with more than five employees) used a personal computer, 86.1% used e-mail and 78.0% used Internet; about 55% of Internet users disposed of a homepage (see Arvanitis et al,. 2002). Many firms used also more complicated networking-technologies (electronic data exchange with other firms (EDI), firm computer networks (LAN/WAN), Intranet and Extranet).
We concentrate here on Internet and Intranet, both of them technologies which permit a high degree of networking among various activities of firms. 81.3% of manufacturing firms used Internet in the year 2000, about the same as firms in the service sector (79.5%) but significantly more often than construction enterprises (69.4%) (see Table 9.1). On the whole 27.0% of firms used an internal network (Intranet) in 2000; this percentage was about the same in the manufacturing and in the service sector (28.2% and 31.6% respectively), it was considerably lower in the construction industry (11.3%).
On the whole, Swiss firms are well-equipped with information technology; compared to other countries Switzerland is ranked behind the USA and the Scandinavian countries (with respect to the overall diffusion of information technologies), but ahead of other European countries (see Arvanitis and Hollenstein, 2002).
More important with respect to firm performance than the incidence of ICT may be the intensity of the use of new technology within a firm. Table 9.2 presents some information on the percentage of employees using Internet and Intranet respectively. On average, 28.6% of the employees of all firms applying this technology used Internet in 2000 in their work, 50.7% of the employees of all firms having Intranet made use of it in their daily work. There are considerable differences with respect to the intensity of use of ICT among sectors of the economy. The employees of service firms are more strongly integrated via Internet and/or Intranet (36.5% and 59.4% respectively) than those in manufacturing (20.0% and 41.7% respectively) and in construction firms (15.7% and 34.9% respectively).

188
Table 9.1. Diffusion of ICT and new organisational practices in the Swiss business sector (percentage of firms)
Manufacturing Construction Services Total
Internet
Before 1995 1.6 0.0 2.2 1.7
1995-1997 14.0 13.7 14.7 14.4
1998-2000 65.7 55.7 62.6 62.0
Total 81.3 69.4 79.5 78.1
Intranet
Before 1995 1.6 0.5 2.4 1.8
1995-1997 6.1 1.9 7.6 6.2
1998-2000 20.5 8.9 21.6 19.0
Total 28.2 11.3 31.6 27.0
Job rotation
Before 1995 7.8 4.7 4.1 5.1
1995-1997 2.3 0.5 1.9 1.8
1998-2000 7.1 0.1 2.9 3.5
Total 17.2 5.3 8.9 10.4
Team-work
Before 1995 18.6 14.2 17.0 16.9
1995-1997 11.3 3.5 7.0 7.4
1998-2000 14.5 13.4 9.4 11.4
Total 44.4 31.1 33.4 35.7
Note: Data of 2 648 firms (Internet, Intranet) and 1 667 firms (job rotation, team work) resp.; multiple imputations for missing values (see section 9.4); the data were corrected for unit non-response bias and weighted in order to reflect the population of Swiss enterprises belonging to the two-digit industries listed in Table A9.1.
New organisational practices
Two main forms of flexible organisation are team-working (work in formally organised project groups, teams, quality circles, semi-autonomous groups, etc.) and job rotation. According to Table 9.1, 35.7% of Swiss firms (with at least five employees) had introduced team-working, 10.4% of them job rotation. There is a considerable acceleration of the adoption of such organisational practices in the Swiss economy since 1995. 16.9% of all firms had already introduced team-working before 1995, 7.4% did it between 1995 and 1998, 11.4% between 1998 and 2000. For job rotation the corresponding shares of firms are considerable lower, but also increasing; only 5.1% of firms used job rotation before 1995, 1.8% of them introduced this organisational practice between 1995 and 1997, 3.5% between 1998 and 2000. These forms of flexible workplace organisation could be found in all sectors of the economy, but the most in manufacturing, particularly job rotation. 20.8% of all firms reported that they intensively used team-work; for job rotation 4.2% of firms reported that they intensively use it (see Table 9.2). There are no significant differences with respect to the intensity of use of these forms of flexible organisation among sectors of the economy.

189
Table 9.2. Intensity of use of ICT and new organisational practices, 2000
Manufacturing Construction Services Total
Average percentage of employees using a technology
Internet 20.0 15.7 36.5 28.6
Intranet 41.7 34.9 59.4 50.7
Percentage of firms using an organisational practice intensively1
Job rotation 5.0 3.9 3.3 4.2
Team work 20.7 16.0 22.4 20.8
1. Percentage of the firms reporting value 4 or value 5 on a five-point Likert scale.
Note: Data of 2 648 firms (Internet, Intranet) and 1 667 firms (job rotation, team-work) resp.; multiple imputations for missing values (see section 9.4); the data were corrected for unit non-response bias and weighted in order to reflect the population of Swiss enterprises belonging to the two-digit industries listed in Table A9.1.
Parallel to these organisational changes a decentralisation of decision-making within enterprises has also taken place. 40% of all firms declared in a representative survey conducted in 2000 that management has delegated various competencies to their employees or teams of employees since 1995, aiming at a decentralisation of firms‘ decision-making process (see Table 9.3). Only 2.9% of these found that a shift towards stronger competencies of managers and not of workers had taken place since 1995; for 57.0% of firms there was no change with respect to within-firm competency delegation. This decentralisation effect was strongest in manufacturing. The shift of competencies towards workers was only weakly reflected in changes of the formal organisational structure: only 9.4% of all firms reported a decrease in the number of managerial levels since 1995, for 85.8% the overall organisational structure remained unchanged (Table 9.3). There were no significant differences among the sectors of the economy with respect to this phenomenon.
Vocational education and job-related training
The share of employees with university and other tertiary-level education (business and technical colleges, etc.) in the Swiss business sector was 18.7% in 1999 (Table 9.4). 47.5% of employees had a full vocational education ending with a formal degree, 27.8% had only some vocational education without a formal degree, or no vocational education at all. The share of employees with full vocational education did not vary much among the sectors of the economy; the significant differences with respect to overall formal education in Table 9.4 come from the shares of employees with tertiary and low education respectively. Manufacturing firms had on average a considerably higher share of employees with tertiary education (22.2%) than firms belonging to the service (16.8%) or the construction sector (13.4%). In accordance, only 21.9% of employees of manufacturing firms had low education, whereas this share is 32.8% in the service and 29.2% in the construction sector.
Table 9.4 also contains some information on job-related training: 29.0% of all employees on the average attended training courses in 1999; in the service sector this percentage was higher (34.3%), in manufacturing it was lower than the average (22.2%).

190
Table 9.3. Changes with respect to some organisational practices since 1995 (percentage of firms)
Change in the number of managerial levels
Decrease (1) No change (2) Increase (3) Difference (1)-(3)
Manufacturing 13.6 80.7 5.7 7.9
Construction 13.6 82.8 3.6 10.0
Services 6.3 88.9 4.8 1.6
Total 9.4 85.8 4.8 4.6
Shift of competences
No shift (1) Toward employees (2) Toward managers (3) Difference (2)-(3)
Manufacturing 50.0 48.0 2.0 46.0
Construction 78.2 21.2 0.6 20.6
Services 53.6 42.4 4.0 38.4
Total 57.0 40.0 2.9 37.1
Note: Data of 1 667 firms; multiple imputations for missing values (see section 9.4); the data were corrected for unit non-response bias and weighted in order to reflect the population of Swiss enterprises belonging to the two-digit industries listed in Table A9.1.
Table 9.4. Formal education and job-related training of employees in the business sector, 1999
Manufacturing Construction Services Total
Formal education (average share of employees)
University 7.4 1.7 3.6 5.0
Other tertiary-level education
14.8 11.7 13.2 13.7
Vocational education; formal degree
49.1 49.0 45.6 47.4
Vocational education without formal degree; no vocational education
21.9 29.2 32.8 27.8
Job-related training (average share of employees attending training courses)
22.3 21.4 34.3 29.0
Note: Data of 2 648 firms; multiple imputations for missing values (see section 9.4); the data were corrected for unit non-response bias and weighted in order to reflect the population of Swiss enterprises belonging to the two-digit industries listed in Table A9.1.
Impact of ICT and new organisational practices on firm performance
It is interesting to compare managers’ subjective assessment of the impact on performance of the introduction and use of ICT and new organisational practices with the results of a micro econometric model like the one to be presented in one of the next sections. 60.8% of all firms using ICT reported a positive impact of ICT use on overall firm efficiency, 38.1% of them could not ascertain any change, only 1.1% found that the use of ICT led to an efficiency decrease (see Table 9.5). There are no large

191
differences among the sectors (with the exception of the construction sector). Even if we take into consideration that managers may have a “positive bias” toward ICT use, it is quite remarkable that almost 40% of users could not identify any positive impact on efficiency; firms also do not consider ICT to be a panacea for all kinds of problems. Our analysis also finds an overall positive effect of ICT use.
In the face of our results (see section 9.7) it is rather astonishing that 70.4% of all firms applying some or all of the new organisational practices assessed the impact of these changes on firm efficiency to be positive; only 26.7% of them could not find any influence. The assessments with respect to the impact of organisational change on firm efficiency are quite similar among the sectors of the economy. Do managers exaggerate this effect in order to justify their own involvement in introducing and carrying through new organisational practices? The question is sensible but difficult to answer without further information.
Table 9.5. Impact of ICT and new organisational practices on overall firm efficiency (percentage of firms)
Decrease (1) No change (2) Increase (3) Difference (3)-(1)
ICT
Manufacturing 0.8 40.9 58.3 57.5
Construction 0.4 50.0 49.6 49.2
Services 1.3 35.6 63.1 61.8
Total 1.1 38.1 60.8 59.7
New organisational practices
Manufacturing 3.3 26.9 69.8 66.7
Construction 7.7 29.8 62.5 54.8
Services 2.1 26.5 71.4 69.3
Total 2.8 26.7 70.4 67.6
Note: Data of 2 648 firms (Internet, Intranet) and 1 667 firms (new organisational practices) resp.; multiple imputations for missing values (see section 9.4); the data were corrected for unit non-response bias and weighted in order to reflect the population of Swiss enterprises belonging to the two-digit industries listed in Table A9.1.
9.4 Data
The data used in this study were collected in the course of a specific survey among Swiss enterprises using a questionnaire which included questions on the incidence and within-firm diffusion of several ICT technologies (e-mail, Internet, Intranet, Extranet, etc.) and new organisational practices (team-work, job rotation, employees‘ involvement, etc.) on employees’ vocational education and job-related training, flexibility of working conditions, and labour compensation schemes.3 The survey was based on a (with respect to firm size) disproportionately stratified random sample of firms with at least 20 employees covering all relevant industries of the business sector as well as firm size classes. The survey on the whole covered 28 industries and, within each industry three industry-specific firm size classes with full coverage of the upper class of large firms. Answers were received from 1667 firms,
3. The questionnaire was based to a considerable extent to similar questionnaires used in earlier surveys (see
EPOC 1997, Francois et al. 1999, Vickery/Wurzburg 1998, Statistics Canada 1999). Versions of the questionnaire in German, French and Italian can be found at www.kof.ethz.ch.

192
i.e. 39.4% of the firms in the underlying sample.4 The response rates do not vary much across industries and size classes with a few exceptions (over-representation of paper and energy industry, under-representation of hotels, catering and retail trade; see Table A9.1 in the annex of this chapter for the structure of the used data set by industry and firm size class). The non-response analysis (based on a follow-up survey of a sample of the non-respondents) did not indicate any serious selectivity bias with respect to the use of ICT and new organisational practices (team-work, job rotation). A careful examination of the data of these 1 667 firms led to the exclusion of 285 cases with contradictory or non-plausible answers; there remained 1 382 valid answers which were used for this analysis.
Further we used the multiple imputations technique by Rubin (1987) to substitute for missing values in the variables due to item non-response (see Donzé, 2001 for a detailed report on these imputations). In the estimations we inserted the mean of five imputed values for every missing value of a certain variable. To test the robustness of this procedure we estimated the basic model for the original data without imputed values (containing only 598 observations), for every single set of imputed values as well as for the mean of them; finally we calculated the mean and the variance of the parameters of the estimates based on the single five imputed values according to the method described in Donzé (2001) and compared the results. They showed a relatively high robustness of the estimated parameters; e.g. the estimates based on the mean of the imputed values and the estimates based on the average of the parameters estimated for the single sets of imputed values were quite similar. The largest divergence was related to the estimates based on the original data without imputed values.
9.5 Model specification and variable construction
Basic model
Throughout this study we use the logarithm of sales per employee as the dependent variable. As a consequence, we insert a right-hand variable to control for material and service inputs (logarithm of the value of material and service inputs per employee). Since we do not dispose of data on physical capital, we rely on extensive industry controls to seize the influence of this important variable.
As measures for technology input, particularly ICT input (“ICT capital”), we use the intensity of use of two important network technologies, Internet (linking to the outside world) and Intranet (linking within the firm). This intensity is measured by the share of employees using Internet and Intranet respectively in their daily work. The firms were asked to report this share not by a precise figure but within a range of twenty percentage points (1% to 20%, 21% to 40% and so on). Based on these data we constructed five dummy variables for each technology covering the whole range from 1% to 100% (see note to Table 9.6). The idea behind this variable is that a measure of the diffusion of a certain technology within a firm would be a more precise proxy for “ICT capital” than the mere incidence of this technology or some kind of simple hardware measure (e.g. number of PCs, etc.). We expect in general a positive correlation of technology variables with average labour productivity, in particular an increasing positive correlation with a higher percentage of employees using a certain technology.
4. The descriptive analysis of the data for ICT and human capital in section 3 was based on a sample of
2 648 firms with at least five employees. The information on organisation was raised only for firms with at least 20 employees (sample of 1 667 firms). As a consequence, we could use data for 1 667 firms for the econometric analysis.

193
Table 9.6. Basic model: average labour productivity (log(sales per employee) 19991) – OLS estimates
Explanatory variables All firms Manufacturing Services
Original coeff.
Standardised coeff.
Intercept 5.255*** 5.332*** 5.411*** (0.142) (0.170) (0.256) Log(materials/employee)1 0.741*** 0.276 0.615*** 0.094** (0.243) (0.263) (0.043)
Technology
Use of Internet (% of employees)2
1-20 0.038 0.027 0.033 0.034 (0.043) (0.044) (0.095) 21-40 0.105** 0.061 0.149*** 0.007 (0.052) (0.053) (0.115) 41-60 0.141** 0.058 0.114 0.129 (0.068) (0.074) (0.132) 61-80 0.297*** 0.098 0.183* 0.379*** (0.081) (0.095) (0.042) 81-100 0.214* 0.055 0.313 0.133 (0.114) (0.220) (0.156)
Use of Intranet (% of employees)2
1-20 0.126*** 0.067 0.157*** 0.058 (0.043) (0.050) (0.074) 21-40 0.204*** 0.120 0.167*** 0.312*** (0.048) (0.049) (0.110) 41-60 0.208*** 0.131 0.198*** 0.209** (0.052) (0.049) (0.095) 61-80 0.179*** 0.088 0.167*** 0.210** (0.052) (0.059) (0.092) 81-100 0.360*** 0.167 0.228*** 0.457*** (0.074) (0.082) (0.121)
Workplace organisation
Team-work3 0.072** 0.042 0.051 0.126* (0.036) (0.039) (0.073) Job rotation3 -0.070 -0.020 -0.128* 0.098 (0.076) (0.077) (0.210)
Delegation of competences from managers to employees:
Overall delegation of competences from managers to employees4 -0.008 -0.006 -0.052* 0.078
(0.027) (0.028) (0.054) Employees competence to solve production problems5 0.105 0.032 0.160* 0.058 (0.085) (0.097) (0.141) Employees competence to contact customers5 0.114*** 0.065 0.079* 0.148** (0.037) (0.042) (0.063) Decrease of number of managerial levels6 0.013 0.004 -0.068 0.078 (0.065) (0.064) (0.054)
Human capital
Share of employees with high education7 0.275*** 0.070 0.400*** 0.232 (0.114) (0.138) (0.184) Share of employees receiving job-related training8 0.126** 0.048 0.177** 0.047 (0.063) (0.071) (0.089) Computer training9 0.060** 0.043 0.073** 0.030 (0.028) (0.030) (0.059)
(continued on next page)

194
Table 9.6. Basic model: average labour productivity (log(sales per employee) 19991) – OLS estimates (continued)
Working conditions, compensation
Team compensation10 0.067** 0.045 0.054* 0.119** (0.029) (0.030) (0.059) Part-time work11 -0.068** -0.043 -0.061* -0.100* (0.032) (0.035) (0.056) Flexible working time11 -0.050* -0.036 -0.053* -0.065 (0.026) (0.028) (0.058)
N 1 382 893 489 DF 50 41 31 SER 0.494 0.424 0.598 F 27.4*** 15.2*** 18.8*** R2adj. 0.488 0.392 0.535
1. Number of employees calculated in full-time equivalents.
2. Dummy variables (value 1 for firms reporting that the share of employees using Internet (Intranet) is between 1% and 20%, 21% and 40%, 41% and 60%, 61% and 80%, 81% and 100% respectively; reference group: firms which do not use Internet (Intranet)).
3. Dummy variable (value 1 for firms reporting that the use of team-work (project groups, quality circles, semi-autonomous teams, etc.) or job rotation is “widespread“ (values 4 and 5 on a five-point Likert scale)).
4. Dummy variable (value 1 for firms reporting that since 1995 (not further specified) competences were transferred from managers to employees).
5. Dummy variables (value 1 for firms reporting that at the workplace level employees have the competence to solve autonomously emerging production problems or to contact autonomously customers (values 4 and 5 on a five-point Likert scale)).
6. Dummy variable (value 1 for firms reporting that the number of managerial levels decreased since 1995).
7. Education at the tertiary level (universities, technical and business colleges, etc.).
8. Job-related training: internal and/or external training courses initialised or supported by the firm.
9. Dummy variable (value 1 for firms reporting that computer training is “important“ (values 4 and 5 on a five-point Likert scale)).
10. Dummy variable (value 1 for firms reporting that employee compensation according to team performance is “important“ (values 4 and 5 on a five-point Likert scale)).
11. Dummy variable (value 1 for firms reporting that part-time work (flexible annual working time) is “important“ (values 4 and 5 on a five-point Likert scale)); estimations include also two-digit industry controls (27 dummies); ***, **, * denote statistical significance at the 1%, 5% and 10% level respectively; heteroscedasticity robust standard errors (White procedure).
The measurement of organisational inputs, here restricted to inputs related to workplace organisation, is an issue still open to discussion, since there is not yet any agreement among applied economists about the exact definition of “organisational capital” (see Black and Lynch, 2002, and Lev, 2003 for a discussion of this matter; see also Appelbaum et al,. 2000, Chapter 7 for definitions of high-performance work system variables). In order to choose the variables related to changes and/or introduction and use of new organisational practices at the workplace level we draw on the definition offered by Black and Lynch (2002). They distinguish two components of organisational capital (in a narrow sense, i.e. without training which we view as part of the human capital of the firm): “work design” and “employee voice”. Examples of practices that are included in the first component are reengineering efforts that may involve changing the occupational structure of the workplace, the number of levels of management within the firm, the existence and diffusion of job rotation, and job share arrangements. The second component of organisational capital, “employee voice”, is associated with practices such as individual job enrichment schemes, employees being consulted in groups, employees having more decision competences, the existence and diffusion of work in (formally constituted) teams, etc. Our data enable us to construct the following dummy variables covering most of the above-discussed aspects of organisational capital: intensive use of team-work (project groups, quality circles, semi-autonomous teams, etc.); intensive use of job rotation; decrease of the number of

195
management levels; overall shift of decision competencies from managers to employees; employees having the competence to solve relatively autonomously emerging production problems (production) or to contact customers (sales) (see also note to Table 9.6). We expect an overall positive correlation of organisational variables with average labour productivity, but we do not have expectations about the sign for every single variable.
We include three more variables which are related to workplace organisation but are not components of organisational capital per se. The first one is referring to incentive-based compensation and is a dummy variable for the existence of employee compensation according to team-performance (see note to Table 9.6). The other two variables measure labour flexibility (dummy variable for the intensive use of part-time work) and working time flexibility (dummy variable for flexible yearly working time) (see also note to Table 9.6). With respect to the compensation variable the sign of the correlation with the dependent variable is not a priori clear; whether team-performance enhances employee incentives for higher performance is an open empirical question. Also the relation of part-time work to productivity is not clear in the empirical literature and depends on the overall conditions of the labour market as well as its institutional framework; we expect a positive effect for flexible annual working time as this does not only expand employee’s sovereignty over time but also contributes to a more efficient combination of labour and machines.
A third important category of production inputs is related to human capital. We use three variables to approximate human capital: the share of employees with vocational education at the tertiary level (universities, business and technical colleges, etc.); the share of employees receiving job-related training (internal and/or external training courses initialised or supported by the firm); a dummy variable for strong orientation of training particularly to computer training (see also note to Table 9.6). According to standard analysis (see e.g. Barro and Lee, 1994) we expect a strong positive correlation of these variables to labour productivity.
“Compact” model
In the basic model ten dummy variables for the use of Internet and Intranet are proxies for “ICT capital”, six organisational variables are used to approximate “organisational capital” and three variables are proxies for human capital. In order to be able to assess the relative significance of the three variable blocks for labour productivity, one has to make the overall measures for these variables comparable. We applied two separate procedures to construct composite indices for technology, organisation and human capital based on the proxies for these variables. In the first version a composite index was calculated as the sum of the standardised (average 0; standard deviation 1) values of the variables. For the technology variable (TECHNS) the original variables for the use of Internet and Intranet (measured on a five-point Likert scale) were used for the standardisation procedure (see also note to Table 9.7). The organisational variable (ORGANS) was constructed as a sum of the standardised values of the six constituent variables, the human capital variable (HUMANS) as a sum of the three constituent variables (see note to Table 9.7). In the second procedure we used the factor scores of the one-factor solution of a principal component factor analysis of the three sets of variables as composite indices for technology (TECHF), organisation (ORGANF) and human capital (HUMANF).
The “compact” model contained either the variables TECHNS, ORGANS and HUMANS or TECHF, ORGANF and HUMANF besides the variables for labour compensation, labour flexibility and working time flexibility and the controls for industry and material and service inputs. A second reason for specifying the “compact” model was the possibility of investigating the complementarities between technology, organisation and human capital; the composite indices are considered as metric variables and interaction terms of these variables can be inserted in the model (see section 9.8).

196
Table 9.7. Compact model: average labour productivity (log(sales) per employee) 19991) – OLS estimates of versions of the model with composite indices for technology, organisation and human capital based on
standardised values (first version) or factor scores (second version)
Explanatory variables (1) (2) (3) (4) (5) (6)
Standardised variables Factor scores
Intercept 5.592*** 5.588*** 5.586*** 5.640*** 5.633*** 5.615***
(0.149) (0.149) (0.149) (0.149) (0.147) (0.152)
Log(mat/employee)1 0.763*** 0.762*** 0.763*** 0.763*** 0.768*** 0.759***
(0.248) (0.248) (0.248) (0.246) (0.246) (0.249)
TECHNS2 0.646*** 0.676** 0.673***
(0.096) (0.097) (0.096)
ORGANS3 0.190*** 0.203*** 0.184***
(0.062) (0.067) (0.063)
HUMANS4 0.490*** 0.399*** 0.398***
(0.099) (0.103) (0.104)
TECHNF5 0.148*** 0.147*** 0.168***
(0.022) (0.022) (0.022)
ORGANF6 0.053*** 0.055*** 0.061***
(0.015) (0.015) (0.015)
HUMANF7 0.079*** 0.074***
(0.020) (0.019)
Team Compensation8 0.696** 0.677** 0.677** 0.621** 0.611** 0.729***
(0.292) (0.292) (0.293) (0.291) (0.291) (0.295)
Part-time work9 -0.716** -0.708** -0.712** -0.701** -0.695** -0.700**
(0.323) (0.323) (0.323) (0.323) (0.323) (0.326)
Flexible working time10 -0.490* -0.479* -0.478* -0.565** -0.555** -0.429
(0.267) (0.266) (0.267) (0.266) (0.266) (0.268)
Interaction terms:
TECHNS*ORGANS -0.022
(0.042)
TECHNS*HUMANS 0.109** 0.096**
(0.053) (0.048)
ORGANS*HUMANS -0.021
(0.042)
TECHNF*ORGANF -0.012
(0.019)
TECHNF*HUMANF 0.009 0.028*
(0.019) (0.017)
TECHNF*ORGANF 0.012
(0.025)
(continued on next page)

197
Table 9.7. Compact model: average labour productivity (log(sales) per employee) 19991) – OLS estimates of versions of the model with composite indices for technology, organisation and human capital based on
standardised values (first version) or factor scores (second version) (continued)
N 1 382 1 382 1 382 1 382 1 382 1 382
DF 34 37 35 34 37 34
SER 0.499 0.498 0.498 0.497 0.495 0.498
F 38.2*** 35.4*** 37.4*** 39.0*** 36.3*** 38.6***
R2adj. 0.478 0.479 0.479 0.487 0.486 0.480
1. Number of employees calculated in full-time equivalents.
2. Sum of the standardised variables for user intensity of Internet and Intranet (two variables measured on a five-point Likert scale).
3. Sum of the standardised variables for work place organisation (six dummy variables for: job rotation; team work; decrease of the number of managerial levels since 1995; overall transfer of (unspecified) competences from managers to employees since 1995; employees have at the workplace level the competence to solve autonomously emerging production problems; employees have at the workplace level the competence to contact autonomously customers).
4. Sum of the standardised variables for human capital (three variables: share of employees with high education; share of employees receiving job-related training; dummy variable for computer training).
5. Factor scores of a one-factor solution of principal component factor analysis of the two variables for information technology mentioned in note (2) above.
6. Factor scores of a one-factor solution of principal component factor analysis of the six variables for workplace organisation mentioned in note (3) above.
7. Factor scores of a one-factor solution of principal component factor analysis of the three variables for human capital mentioned in note (4) above.
8. Dummy variable (value 1 for firms reporting that employee compensation according to team performance is “important” (values 4 and 5 on a five-point Likert scale)).
9. Dummy variable (value 1 for firms reporting that part-time work is “important” (values 4 and 5 on a five-point Likert scale)); dummy variable (value 1 for firms reporting that flexible annual working time is “important” (values 4 and 5 on a five-point Likert scale)); estimations include also two-digit industry controls (27 dummies); ***, **, * denote statistical significance at the 1%, 5% and 10% level respectively; heteroscedasticity robust standard errors (White procedure).
9.6 Results for the basic model
Tables 9.6 contains the results of the OLS estimates of the basic model for all firms (column 1) as well as separately for the firms of the manufacturing and construction sector (column 3) and the service sector (column 4). Since the results are only cross-section estimates, it is not possible to state causal relations between the independent variables and the dependent variable. Nevertheless, some robust regularities come out, which if interpreted in the light of our hypothesis 1 (see section 2) could possibly indicate the direction of causal links. The overall fit of the model (R2=0.488; column 1) is satisfactory for a cross-section investigation.
The coefficients of nine of the ten dummy variables for the intensity of use of Internet and Intranet, as expected, are positive and statistically significant. Only the coefficient for the lowest intensity category of Internet (1%-20% of employees using Internet in their daily work) is not significant. The general tendency is that the higher the intensity of use of these technologies among a firm’s employees, the higher is also the positive correlation to labour productivity. The coefficients of the Internet dummy variables become larger the higher the share of the employees using this technology up to 80%; the coefficient of the fifth dummy variable (81%-100%) is somewhat lower than that of the fourth one (61%-80%). In the case of the Intranet dummies this regularity of increasing coefficients can be found up to 60%, then the next coefficient (61%-80%) is lower than that for the range of 41% to 60%, the coefficient for the range 81%-100% is the largest of the coefficients for

198
Intranet use. Thus, there is a more or less systematic positive correlation between the level of intensity of use of ICT and the level of labour productivity. With respect to Intranet there are no differences between manufacturing and service firms. According to the results in column 3 and 4 the use of Internet is less important for firm performance in the manufacturing than in the service sector, presumably due to the existence of a considerable share of production workers that do not perform a desk job and are not equipped with a PC and an Internet connection.
In the estimates for all firms we could find statistically significant positive effects for two organisational variables, for the within-firm widespread use of team-work (project groups, quality circles, semi-autonomous teams, etc.), a component of “work design”, and for the existence of employee competence to contact autonomously firm customers (an aspect of “employee voice”). The team-work effect is considerably more important for the service than for the manufacturing firms; team-work is less relevant in manufacturing because of the lack of mass-production industries (e.g. automobile industry) in the Swiss economy which most often apply this organisational practice form (e.g. semi-autonomous production teams). No effect could be found for another dimension of “work design”, the change of the number of management levels. The descriptive analysis showed that only few firms reported such a change (see Table 9.3), although the dominant discourse in the management literature in the nineties has been that the flattening of the overall firm structure would enhance firm performance. A possible explanation for this behaviour may be found in the size distribution of Swiss firms with a (relative to other economies) very large share of small firms with very few hierarchical layers. There was also no indication of significant effects for the overall delegation of competences from managers to employees (except for a slight negative effect for manufacturing). Finally, we obtained a statistically significant positive coefficient for employee competence to solve autonomously problems in the production sphere, but only for manufacturing in which physical production is dominant. We conclude that an overall shift of competences towards employees may prove to be too unspecific to lead to a positive performance impact; moreover it is the clear-targeted delegation of specific competencies from managers to employees, for example, with respect to production and customer problems that could enhance productivity.
On the whole, the organisational variables correlate considerably weaker with the dependent variable (and explain less of its variance) than the technological variables; the average absolute value of the standardised coefficients of the organisational variables is 0.028, that of the technological variables 0.087 (see column 2 in Table 9.6).
All three proxy variables for human capital, as expected, have statistically significant positive coefficients in the estimates for all firms. The strongest effect comes from formal education, but job-related training is also important; computer training seems to be the most effective type of training, it also helps to utilise ICT more efficiently (complementarity effect; see section 9.8). Human capital is more relevant for firm performance in the manufacturing than in the service sector on the whole. However, there are of course modern service industries in which the human capital intensity is very high (business services, banking and insurance). The average value of the standardised coefficients of the human capital variables is 0.054; thus, human capital ranks next to technology with respect to the strength of its correlation to labour productivity.
Employee compensation according to team performance correlates significantly positive with productivity via positive employee incentives. Finally, part-time work and – rather unexpectedly – annual flexible working time have negative correlations to firm performance. Part-time work is still not particular popular among Swiss personnel managers and numerical labour flexibility is not the device typically applied to enhance productivity. The typical career of a well-qualified male employee is mostly, even in the nineties, based on a full-time job; part-time work remained primarily the domain of low-skilled persons.
199
In sum, we found significant positive correlations for many of the single variables belonging to the three main variable blocks (technology, organisation and human capital); the strongest effects are traced back to technology, the proxies for human capital are somewhat weaker than those for technology, the organisational variables show the weakest relation to productivity.5
9.7 Results for the “compact” model
The estimates of the two versions of the “compact” model are presented in Table 9.7: column 1 contains the results for the version with the standardised variables, column 4 the results for the version based on the factor scores. In both versions all three composite indices for technology, organisation and human capital have significant positive coefficients and the relative importance with respect to labour productivity measured by the magnitude of the regression coefficients of these three variables leads to the same ranking of the three factors as in the basic model: technology at the first position, then human capital, at the end organisational factors.
The compact version of the productivity model considerably facilitates the investigation of the important question of endogeneity of some of the independent variables which are the focus of this study, namely technology and organisation. It is of course not possible to settle this matter definitely based only on cross-section data. However, some hints with respect to the robustness of the cross-section estimates can be gained through 2SLS estimates of the productivity equation. In the first stage the variables TECHNS and ORGANS were instrumented, the first stage estimates are shown in columns 2 and 3 of Table 9.8. As instruments we used in both cases besides the dummy variables for part-time work, annual flexible working time and team compensation, six firm size dummies and three additional dummy variables not included in the productivity model. These refer to employee competence for the sequence of performing tasks, employee competence for the way of performing tasks and for the possibility of investment decisions being discussed in teams.6 The overall statistical fit of the two first stage estimates for TECHNS and ORGANS, particularly for ORGANS (R2 = 0.068), was rather poor. The 2SLS estimates in column 1 of Table 9.8 showed that the effect of TECHNS had been rather underestimated in the model version without instruments, that of the variable ORGANS becomes statistically insignificant (at the test level of 10%). In the face of this evidence the importance of the organisational factors has to be somewhat reconsidered; on the other hand the 2SLS estimates have to be viewed with caution because of the difficulty in estimating statistically satisfactory instrument equations with the available data.
5. We conducted some additional probit estimations of the basic model not presented here with the
discretionary variables “introduction of innovations in the period 1998-2000 yes/no”, “introduction of product innovations in the period 1998-2000 yes/no” and “introduction of process innovations in the period 1998-2000 yes/no”) as dependent variables. We obtained similar results for the technology and human capital variables. Team-work was significant only for process innovations, overall delegation of competencies from managers to employees for all three innovation variables.
6. These three variables we also used as independent variables in earlier versions of the basic model, but they correlated very weakly with the performance variable.

200
Table 9.8. Compact model: average labour productivity (log(sales per employee), 19991) – 2SLS estimates of the model version with composite indices for technology, organisation and human capital based on
standardised values; TECHNS and ORGANS are instrumented
Explanatory variables (1) (2) (3)
2 SLS estimate First stage estimates
TECHNS ORGANS
Intercept 5.571*** 0.127 -0.838***
(0.080) (0.352) (0.557)
Log(mat/employee)1 0.777***
(0.056)
TECHNS2 1.094**
(0.448)
ORGANS3 0.236
(0.310)
HUMANS4 0.633***
(0.085)
Team compensation5 0.488 0.128 0.594***
(0.344) (0.086) (0.137)
Part-time work6 -0.728** 0.088 -0.005
(0.334) (0.095) (0.150)
Flexible working time7 -0.634** 0.042 0.201
(0.298) (0.083) (0.132)
Investment decisions are discussed in teams8 0.423*** 0.454*** (0.106) (0.168)
Employees’ competence for the sequence of performing tasks9
0.267** 0.823***
(0.111) (0.175)
Employees’ competence for the way of performing tasks9
0.007 0.751***
(0.108) (0.171)
Firm size:
20-49 employees -0.282 -0.077
(0.298) (0.472)
50-99 employees 0.107 -0.135
(0.300) (0.475)
100-199 employees 0.257 0.049
(0.302) (0.479)
200-499 employees 0.475 0.041
(0.306) (0.485)
(continued on next page)

201
Table 9.8. Compact model: average labour productivity (log(sales per employee), 19991) – 2SLS estimates of the model version with composite indices for technology, organisation and human capital based on
standardised values; TECHNS and ORGANS are instrumented (continued)
500-999 employees 0.656 0.069
(0.341) (0.540)
> 999 employees 0.446 0.303
(0.353) (0.559)
N 1 382 1 382 1 382
DF 34 39 39
SER 0.506 1.455 2.306
F 35.6*** 9.8*** 3.6***
R2adj. 0.461 0.200 0.068
1. Number of employees calculated in full-time equivalents.
2. Sum of the standardised variables for user intensity of Internet and Intranet (two variables measured on a five-point Likert scale).
3. Sum of the standardised variables for work place organisation (six dummies for: job rotation; team work; decrease of the number of managerial levels since 1995; overall delegation of (not further specified) competences from managers to employees since 1995; employees have at the workplace level the competence to solve autonomously emerging production problems; employees have at the workplace level the competence to contact autonomously customers).
4. Sum of the standardised variables for human capital (three variables: share of employees with high education; share of employees receiving job-related training; dummy variable for computer training).
5. Dummy variable (value 1 for firms reporting that employee compensation according to team performance is “important” (values 4 and 5 on a five-point Likert scale)).
6. Dummy variable (value 1 for firms reporting that part-time work is “important” (values 4 and 5 on a five-point Likert scale)).
7. Dummy variable (value 1 for firms reporting that flexible annual working time is “important” (values 4 and 5 on a five-point Likert scale)).
8. Dummy variable (1 for firms reporting that investment decisions are “often” discussed in work teams (values 4 and 5 on a five-point Likert scale)).
9. Dummy variables (value 1 for firms reporting that at the workplace level employees have the competence for determining the sequence of performing tasks (the way of performing tasks) (values 4 and 5 on a five-point Likert scale)); estimations include also two-digit industry controls (27 dummies); ***, **, * denote statistical significance at the 1%, 5% and 10% level respectively.
9.8 Complementarities
We investigated the complementarities of technology, organisation and human capital with respect to labour productivity in the framework of a production function by using several approaches (see Athey and Stern 1998 for a thorough discussion).
First, we investigated the correlations between the three variables for technology, organisation and human capital in both versions, conditional on some other variables, by estimating an OLS regression for every composite variable using the other two as right-hand variables together with controls for industry and firm size (see Table 9.9). A positive coefficient of the right-hand variables would indicate a positive correlation with the left-hand variable which could be interpreted as a sign for the existence of complementarities. Using TECHNS as a dependent variable leads to positive coefficients for ORGANS and HUMANS of which only the coefficient of HUMANS is statistically significant (see column 1 of Table 9.9). When TECHNF is the dependent variable the coefficients of the other two variables are positive and significant but the coefficient of ORGANF is very small, about a seventh of the coefficient of HUMANF (see column 3 in Table 9.9). The estimates for

202
HUMANS and HUMANF as dependent variables showed that the correlation between the human capital and the technology variables is much stronger as the correlation between the human capital and the organisation variable. In sum, there is evidence for a strong positive relation between human capital and technology and a much weaker one between these two variables and organisation, whereas the relation of organisation to human capital is somewhat stronger that that to technology.
Second, we inserted in both versions of the “compact” model in Table 9.7 interaction terms of the three composite variables for technology, organisation and human capital which are considered as metric variables (column 2: TECHNS*ORGANS, TECHNS*HUMANS, ORGANS*HUMANS for the version with the standardised variables; column 5: TECHNF*ORGANF, TECHNF*HUMANF, ORGANF*HUMANF for the version with the factor scores). In both cases we found that only the coefficient of the interaction term of the technology variable with the human capital variable is positive and statistically significant. This result can be interpreted as a sign for the existence of complementarities between ICT and human capital, which means that the combined use of ICT and human capital in a firm would enhance its performance beyond the direct effects of these factors taken alone.
Third, we studied the question of complementarities in the framework of the basic model which contains almost only discrete variables. For concrete variables it is not possible to build an interactive term by multiplying the two variables. All three blocks of variables contain mainly binary (0,1) variables with the exception of the shares of employees with high education and training in the human capital variable block which can easily transformed to binary variables. As briefly discussed in section 9.2, complementarities of individual practices such as having team-work, training programmes, use of Internet, etc. can be formulated as a parametric restriction on the production function which leads to the following test statistic for complementarities between two practices: �11 – �01 – [�10 – �00] > 0, whereby the �’s are the coefficients of a series of four possible “states” of combined activity in form of dummy variables: (1,1), (0,1), (1,0), (0,0). For example if one practice is team-work and the second one a certain percentage of employees using Intranet, there are four possible combinations of these two activities: team-work and Intranet use, no team-work and Intranet use, team-work and no Intranet, no team-work and no Intranet.
We decided to test this restriction for the activities “use of Internet by employees” (0: up to 20% of employees; 1: more than 20% of employees), “use of Intranet by the employees”, (0: up to 40% of employees; 1: more than 40% of employees); “intensity of use of team-work” (see dummy variable for team-work), “use of human capital” (0: share of employees with high education up to 10%; 1: more than 10% of employees with high education) (see also note to Table 9.10). In this way we test the existence of complementarities between team-work and Internet use (“states” s11, s12, s13, s14 in Table 9.10), team-work and Intranet use (“states” s21, s22, s23, s24), team-work and employee high education (“states” s31, s32, s33, s34), Internet use and employee high education (“states” s41, s42, s43, s44) and Intranet use and employee high education (“states” s51, s52, s53, s54). The coefficient restriction for every pair of the above-defined activities was tested separately by inserting four dummy variables for the four possible combinations of these activities in the productivity equation. The results are presented in Table 9.10. The coefficients of the “states” (1,1) are positive and statistically significant (test level of 10%) for every pair of activities taken into consideration. The complementarity condition is fulfilled only for the activities “use of Internet” and “use of human capital” and “use of Intranet” and “use of human capital”. This approach also leads to the same result as in the second paragraph of this section: if complementarities with respect to labour productivity exist, they exist between ICT and human capital; organisational factors do correlate positively directly to productivity, but no synergy effects with ICT and human capital could be traced for the firm sample used in this study.

203
Table 9.9. Relations among the variables TECHNS(F), ORGANS(F) AND HUMANS(F) – OLS estimates of simple factor equations
Dependent variables:
Independent variables TECHNS HUMANS TECHNF HUMANF
Intercept 0.575 -0.507 0.267 -0.267
(0.352) (0.371) (0.168) (0.172)
ORGANS1 0.011 0.100***
(0.015) (0.018)
HUMANS2 0.255***
(0.022)
TECHNS3 0.300***
(0.027)
ORGANF4 0.046** 0.125***
(0.019) (0.022)
HUMANF5 0.335***
(0.024)
TECHNF6 0.393***
(0.028)
N 1 518 1 518 1 518 1 518
DF 35 35 35 35
SER 1.461 1.584 0.711 0.771
F 16.6*** 16.9*** 26.6*** 22.7***
R2adj 0.265 0.268 0.371 0.328
1. Sum of the standardised variables for work place organisation (six dummies for: job rotation; team work; decrease of the number of managerial levels since 1995; overall delegation of (not further specified) competences from managers to employees since 1995; employees have at the workplace level the competence to solve autonomously emerging production problems; employees have at the workplace level the competence to contact autonomously customers).
2. Sum of the standardised variables for human capital (three variables: share of employees with high education; share of employees receiving job-related training; dummy variable for computer training).
3. Sum of the standardised variables for user intensity of Internet and Intranet (two variables measured on a five-point Likert scale).
4. Factor scores of a one-factor solution of principal component factor analysis of the six variables for workplace organisation mentioned in note (1) above.
5. Factor scores of a one-factor solution of principal component factor analysis of the three variables for human capital mentioned in note (2) above.
6. Factor scores of a one-factor solution of principal component factor analysis of the two variables for information technology mentioned in note (3) above; estimations include also two-digit industry controls (27 dummies) and firm size controls (six dummies); ***, **, * denote statistical significance at the 1%, 5% and 10% level respectively; heteroscedasticity robust standard errors (White procedure).

204
Table 9.10. Tests for complementarities between technology, organisation and human capital (in pairs) with respect to average labour productivity – OLS estimates for log(sales per employee), 1999
Explanatory variables (1) (2) (3) (4) (5)
Intercept 5.151*** 5.201*** 5.365*** 5.318*** 5.276*** (0.177) (0.155) (0.148) (0.144) (0.148) Log(materials/employee) 0.768*** 0.747*** 0.773*** 0.759*** 0.747*** (0.247) (0.244) (0.249) (0.245) (0.244) Technology:
Use of Internet (% of employees):
1-20 0.070* 0.064 0.027 (0.041) (0.041) (0.042) 21-40 0.143*** 0.134*** 0.095* (0.052) (0.050) (0.051) 41-60 0.188*** 0.202*** 0.154** (0.068) (0.063) (0.065) 61-80 0.345*** 0.331*** 0.279*** (0.082) (0.078) (0.076) 81-100 0.310** 0.314*** 0.215** (0.118) (0.108) (0.105) Use of Intranet (% of employees):
1-20 0.135*** 0.134*** 0.130*** (0.042) (0.040) (0.041) 21-40 0.207*** 0.191*** 0.192*** (0.047) (0.045) (0.045) 41-60 0.214*** 0.211*** 0.207*** (0.047) (0.046) (0.046) 61-80 0.199*** 0.188*** 0.172*** (0.051) (0.049) (0.050) 81-100 0.393*** 0.388*** 0.362*** (0.076) (0.070) (0.069)
Workplace organisation:
Team-work 0.080** 0.086** (0.037) (0.036) Job rotation -0.070 -0.078 -0.059 -0.067 -0.056 (0.076) (0.074) (0.075) (0.073) (0.074) Delegation of competence from managers to employees:
Overall transfer of competence from managers to employees 0.000 -0.016 0.003 -0.010 -0.005 (0.027) (0.027) (0.026) (0.026) (0.025) Employees competence to solve production problems 0.111 0.100 0.112 0.108 0.114 (0.086) (0.084) (0.085) (0.084) (0.085) Employees competence to contact customers 0.118*** 0.115*** 0.106*** 0.102*** 0.103*** (0.037) (0.037) (0.036) (0.036) (0.035) Decrease of number of managerial levels 0.021 0.016 0.030 0.031 0.021 (0.066) (0.064) (0.062) (0.061) (0.062) Human capital:
Share of employees with high education 0.333*** 0.301*** (0.110) (0.114) Share of employees receiving job-related training 0.147** 0.129** 0.132** 0.115** 0.111** (0.063) (0.063) (0.055) (0.055) (0.055) Computer training 0.071** 0.059** 0.062** 0.052** 0.052* (0.029) (0.028) (0.027) (0.027) (0.027) Compensation, working conditions:
Team compensation 0.065** 0.069** 0.062** 0.064** 0.062** (0.029) (0.029) (0.028) (0.028) (0.028)
(continued on next page)

205
Table 9.10. Tests for complementarities between technology, organisation and human capital (in pairs) with respect to average labour productivity – OLS estimates for log(sales per employee), 1999 (continued)
Part-time work -0.063* -0.063** -0.068** -0.070** -0.071** (0.032) (0.032) (0.031) (0.031) (0.030) Flexible working time -0.050* -0.052** -0.046* -0.050* -0.048* (0.026) (0.026) (0.026) (0.026) (0.026) “States“:
si1 0.270** 0.170** 0.074 0.061 0.111** (0.126) (0.076) (0.048) (0.048) (0.046) si2 0.267** 0.187** 0.019 0.017 0.062 (0.117) (0.077) (0.050) (0.056) (0.068) si3 0.177 0.076 -0.014 -0.020 -0.009 (0.116) (0.070) (0.046) (0.046) (0.044) si4 0.332*** 0.248*** 0.208*** 0.221*** 0.192*** (0.122) (0.089) (0.052) (0.053) (0.059)
F test [Ho : coeff.(si3)+coeff.(si4)-(coeff.(si1)-coeff.(si2)=0]; (column i: =1,...5]:
F value 0.1 0.2 3.7 4.5 0.0 p 0.713 0.649 0.059 0.034 0.896
N 1 382 1 382 1 382 1 382 1 382 DF 48 48 48 48 48 SER 0.498 0.495 0.490 0.487 0.486 F 27.7*** 28.2*** 29.6*** 30.2*** 28.1*** R2adj. 0.480 0.486 0.484 0.490 0.491
Column (1):
s11: Dummy for team-work = 1; dummy for use of Intranet = 0 s12: Dummy for team-work = 0; dummy for use of Intranet = 1 s13: Dummy for team-work = 0; dummy for use of Intranet = 0 s14: Dummy for team-work = 1; dummy for use of Intranet = 1 (dummy for use of Intranet: 0: up to 40%; 1: more than 40% of employees)
Column (2):
s21: Dummy for team-work = 1; dummy for use of Internet = 0 s22: Dummy for team-work = 0; dummy for use of Internet = 1 s23: Dummy for team-work = 0; dummy for use of Internet = 0 s24: Dummy for team-work = 1; dummy for use of Internet = 1 (dummy for use of Internet: 0: up to 20%; 1: more than 20% of employees)
Column (3):
s31: Dummy for human capital = 1; dummy for use of Intranet = 0 s32: Dummy for human capital = 0; dummy for use of Intranet = 1 s33: Dummy for human capital = 0; dummy for use of Intranet = 0 s34: Dummy for human capital = 1; dummy for use of Intranet = 1 (dummy for human capital: 0: share of employees with high education up to 10%; 1: more than 10% of employees
with high education); dummy for use of Intranet: 0: up to 40%; 1: more than 40% of employees)
Column (4):
s41: Dummy for human capital = 1; dummy for use of Internet = 0 s42: Dummy for human capital = 0; dummy for use of Internet = 1 s43: Dummy for human capital = 0; dummy for use of Internet = 0 s44: Dummy for human capital = 1; dummy for use of Internet = 1 (dummy for human capital: 0: share of employees with high education up to 10%; 1: more than 10% of employees
with high education); dummy for use of Internet: 0: up to 20%; 1: more than 20% of employees)
Column (5):
s51: Dummy for human capital = 1; dummy for team-work = 0 s52: Dummy for human capital = 0; dummy for team-work = 1 s53: Dummy for human capital = 0; dummy for team-work = 0 s54: Dummy for human capital = 1; dummy for team-work = 1 (dummy for human capital: 0: share of employees with high education up to 10%; 1: more than 10% of employees
with high education)
See also notes of Table 9.1 for other variables; estimations include two-digit industry controls (27 dummies); ***, **, * denote statistical significance at the 1%, 5% and 10% level respectively; heteroscedasticity robust standard errors (White procedure).

206
On the whole, we could find evidence only for complementarities between ICT and human capital. One reason for not being able to identify any other complementary effects may be that, as longitudinal studies show, firms using ICT for a short time (e.g. less than two years in the Australian case; see Chapter 6) appear to have little complementary relation with organisational changes; moreover, the impact not only of ICT use but also of complementary changes tends to fade away with the length of ICT use (see e.g. Gretton et al., 2002 and Chapter 6).
9.9 Summary and conclusions
The basic model yielded positive coefficients for all but one of the dummy variables for the intensity of use of Internet and Intranet as measured by the share of employees using these technologies in daily work. Positive effects were also obtained for the three variables measuring human capital (share of employees with education at the tertiary level and job-related training respectively, high importance of computer training). The results for the organisational variables were mixed: positive effects for team-work and delegation of competences to employees to solve autonomously production problems (only in manufacturing) and to contact customers; negative effects of job rotation and overall delegation of competences from managers to employees in manufacturing.
We also found considerable positive correlations with labour productivity for two types of composite variables for ICT and for human capital (sum of standardised values of the single variables, factor scores of the one-factor solution of a principal component factor analysis). There was a positive effect also for the composite variables related to organisation, but it was considerably weaker as those for technology and human capital; moreover this effect became insignificant in the 2SLS estimation.
On the whole, the results for all three variable blocks seem to be quite robust across several specifications (single variables, two types of composite variables, instrumented versions).
There is also evidence for strong positive complementarities between ICT and human capital but not between these two factors and organisation (at least in the way workplace organisation was measured and specified in this study).
A comparison with other similar studies (see Table 9.11)7 shows that most studies find a positive effect for ICT and organisation respectively, some of them also for human capital; most US studies in the Table did not find a significant positive effect for human capital. With respect to these direct effects Swiss firms tend to give more attention to human capital than to organisation relative to firms in other countries. What about complementarities? The US studies find all three possible types of complementarities between ICT, organisation and human capital to be significant; the Australian study shows the existence of complementarities primarily between ICT and human capital and – somewhat weaker – between ICT and organisation. In the European studies there is a tendency for complementarities between ICT and human capital and organisation and human capital (as in our study). The results are indicative but not completely comparable because some of the observed differences can be traced back to differences with respect to the sectors and industries covered in the studies, the specification of the organisational variables and the nature of the investigations (cross-sectional versus longitudinal).
7. The choice of the studies reported in Table 9.11 was based on the following criteria: recent date of
publication, consideration of at least two of the three variable blocks technology, organisation and human capital in the model specification, firm-level analysis, coverage of all sectors of the economy.

207
The main shortcoming of this study is that no data were available for a longitudinal study which would allow us to take into consideration possible lags between the variables and to test causal relationships between the explanatory factors and firm performance. We hope in the future to be able to repeat the survey for 2000, so that data for an additional point in time would become available.
Finally, we make a remark about the possible policy implications of the observed complementarities between education and training and the use of ICT: if there is public support for training, education, etc., for example through subsidies, then knowledge of such complementarities is useful for policy makers because it can lead to the more effective choice and combination of policy initiatives and measures.
Table 9.11. Summary of the empirical literature
Study ICT ORG HC Complementarities
USA
Black and Lynch (2000)
– Cross-section Positive Positive ns ns
– Longitudinal Positive Positive ns ns
Capelli/Neumark (2001)
– Cross-section Positive Positive ns ns
– Longitudinal Positive Positive nc ns
Bresnahan et al. (2002)
– Cross-section Positive Positive Positive ORG/ICT; HC/ICT
Brynjolfsson et al. (2002)
– Longitudinal Positive ns nc ORG/ICT
Australia:
Gretton et al. (2002)
– Longitudinal Positive Positive Positive ORG/ICT; HC/ICT
Germany:
Bertschek/Kaiser (2001)
– Cross-section Positive Positive nc ns
Wolf/Zwick (2002)
– Longitudinal Positive Positive Positive nc
Hempell (2003)
– Longitudinal Positive nc ns ICT/HC
France:
Caroli/Van Reenen (1999) ns Positive Positive ORG/HC
– Longitudinal
Notes: ICT: information and communication technologies; ORG: workplace organisation; HC: human capital; “positive”: statistically significant (at the test level of 10%) positive coefficient of the variables(s) for ICT, ORG and HC respectively; ns: statistically not significant (at the test level of 10%); nc: not considered.
208
REFERENCES
Appelbaum, E., T. Bailey, P. Berg and A.L. Kalleberg (2000), Manufacturing Advantage. Why High-Performance Work Systems Pay Off, Cornell University Press, Ithaca (Ch. 7 “Measuring the Components of a High-Performance Work System”).
Arnal, E., W. Ok and R. Torres (2001), “Knowledge, Work Organisation and Economic Growth”, OECD Labour Market and Social Policy – Occasional Papers No. 50, Paris.
Arvanitis, S. and H. Hollenstein (2001), “The Determinants of the Adoption of Advanced Manufacturing Technology. An Empirical Analysis Based on Firm-level Data for Swiss Manufacturing”, Economics of Innovation and New Technology, 10, 377-414.
Arvanitis, S. and H. Hollenstein (2002), “Die Wirtschaft in der Informationsgesellschaft”, in: Schweizerisches Bundesamt für Statistik, Gruppe für Wissenschaft und Forschung und Bundesamt für Kommunikation (Hrsg.), Informationsgesellschaft Schweiz: Standortbestimmung und Perspektiven, Neuchâtel, 68-82.
Arvanitis, S., Marmet, D. and D. Staib (2002), Einsatz von Informations- und Kommunikationstechnologien in den schweizerischen Unternehmungen – KOF/ETH-Panelumfrage 2000, Bundesamt für Statistik (BFS), Neuchâtel.
Athey, S. and S. Stern (1998), “An Empirical Framework for Testing Theories about Complementarity in Organizational Design”, NBER Working Paper No. 6600, Cambridge, Mass.
Barro, R.J. and J.-W. Lee (1994), “Sources of Economic Growth”, Carnegie-Rochester Conference Series on Public Policy, 40, 1-46.
Bertschek, I. and U. Kaiser (2001), “Productivity Effects of Organizational Change: Microeconomic Evidence”, ZEW Discussion Paper No. 01-32, Mannheim.
Black, S.E. and L.M. Lynch (2000), “What’s Driving the New Economy: The Benefits of Workplace Innovation”, NBER Working Paper No. 7479, Cambridge, Mass.
Black; S.E. and L.M. Lynch (2002), “Measuring Organizational Capital in the New Economy”, CES Working Paper 02-04, Washington D.C.
Bresnahan, T.F., E. Brynjolfsson and L.M. Hitt (2002), “Information Technology, Workplace Organisation, and the Demand for Skilled Labour: Firm-level Evidence”, Quarterly Journal of Economics, 112(1), 339-376.
Bresnahan, T.F. and S. Greenstein (1997), “Technical Progress and Coinvention in Computing and in the Uses of Computers”, Brookings Papers on Economic Activity, Micro, 1-83.
Brynjolfsson, E. and L.M. Hitt (2000), “Beyond Computation: Information Technology, Organizational Transformation and Business Performance”, Journal of Economic Perspectives, 14(4), 23-48.
Brynjolfsson, E., L.M. Hitt and S. Yang (2002), “Intangible Assets: Computers and Organizational Capital”, Brookings Papers on Economic Activity 1, 137-199.

209
Canada Statistics (1999), Information and Communications Technologies and Electronic Commerce, Survey.
Capelli, P. and D. Neumark (2001), “Do ‘High Performance’ Work Practices Improve Establishment-Level Outcomes?”, Industrial and Labor Relations Review, 54(4), 737-775.
Caroli, E. and J. Van Reenen (1999), “Skill Biased Organizational Change? Evidence from a Panel of British and French Establishments”, Institute for Fiscal Studies Working Papers Series No. W99/23, London.
Donzé, L. (2001), “L’imputation des données manquantes, la technique de l’imputation multiple, les conséquences sur l’analyse des données: l’enquête 1999 KOF/ETHZ sur l’innovation”, Schweizerische Zeitschrift für Volkswirtschaft und Statistik, 137(3), 301-317.
EPOC (1997), “New Forms of Work Organization. Can Europe Realize its Potential?”, Results of a Survey of Direct Employee Participation in Europe, European Foundation for the Improvement of Living and Working Conditions, Dublin.
Francois, J.-P., F. Favre and N. Greenan (1999), Organizational Changes in Industrial Firms and Computerization of Industrial Enterprises, OECD, Paris.
Greenan, N. and D. Guellec (1994), “Coordination within the Firm and Endogenous Growth”, Industrial and Corporate Change, 3(1), 173-195.
Gretton, P., J. Gali and D. Parham (2002), “Uptake and Impacts of ICT in the Australian Economy: Evidence from Aggregate, Sectoral and Firm levels”, Paper Presented in The OECD Workshop on ICT and Business Performance, Paris, December 9.
Hempell, T. (2003), “Do Computers Call for Training? Firm-level Evidence on Complementarities between ICT and Human Capital Investments”, ZEW Discussion Paper No. 03-20, Mannheim.
Hollenstein, H. (2002), “Determinants of the Adoption of Information and Communication Technologies (ICT). An Empirical Analysis Based on Firm-level Data for the Swiss Business Sector”, KOF Working Paper No. 60, Zurich.
Ichniowski, C., T.A. Kochan, D.I. Levine, C. Olson and G. Strauss (2000), “What Works at Work: Overview and Assessment”, in: C. Ichniowski, D.I. Levine, C. Olson and G. Strauss (eds.): The American Workplace. Skills, Compensation and Employee Involvement, Cambridge University Press, Cambridge, 1-37.
Jorgenson, D.W. and B.M. Fraumeni (1995), “Investment in Education and U.S. Economic Growth”, in: D.W. Jorgenson (ed.), Productivity, Volume I: Postwar U.S. Economic Growth, MIT Press, Cambridge, Mass.
Lev, B. (2003), “The Measurement of Firm-specific Organizational Capital”, NBER Working Paper No. 9581, Cambridge, Mass.
Lindbeck, A. and D.J. Snower (2000), “Multi-Task Learning and the Reorganization of Work: From Tayloristic to Holistic Organization”, Journal of Labor Economics, 18, 353-376.
Milgrom, P. and J. Roberts (1990), “The Economics of Modern Manufacturing”, American Economic Review, 80 (3), 511-528.
Milgrom, P. and J. Roberts (1995), “Complementarities and Fit Strategy, Structure, and Organizational Change in Manufacturing”, Journal of Accounting and Economics, 19, 179-208.
Murphy, M. (2002), “Organizational Change and Firm Performance”, STI Working Paper 2002/14, OECD, Paris.

210
OECD (2003), ICT and Economic Growth – Evidence from OECD Countries, Industries and Firms, OECD, Paris.
Pilat, D. and F.C. Lee (2001), “Productivity Growth in ICT-Producing and ICT-Using Industries: A Source of Growth Differentials in the OECD?”, STI Working Papers, 2001/4, OECD, Paris.
Rubin, D.B. (1987), Multiple Imputation for Non-response in Surveys, John Wiley, New York.
Vickery, G. and G. Wurzburg (1998), The Challenge of Measuring and Evaluating Organizational Change in Enterprises, OECD, Paris.
Wolf, E. and T. Zwick (2002), “Reassessing the Impact of High Performance Workplaces”, ZEW Discussion Paper No. 02-07, Revised Version, Mannheim.

211
ANNEX
Table A9.1. Composition of the dataset (basic model)
N Percentage
Industry
Food, beverage 62 4.5
Textiles 24 1.7
Clothing, leather 13 0.9
Wood processing 17 1.2
Paper 24 1.7
Printing 51 3.7
Chemicals 50 3.6
Plastics, rubber 28 2.0
Glass, stone, clay 28 2.0
Metal 15 1.1
Metal working 107 7.7
Machinery 123 9.0
Electrical machinery 33 2.4
Electronics, instruments 74 5.4
Watches 24 1.7
Vehicles 15 1.1
Other manufacturing 30 2.2
Energy, water 24 1.7
Construction 151 11.0
Wholesale trade 145 10.5
Retail trade 84 6.1
Hotels, catering 33 2.4
Transport, telecommunication 63 4.6
Banks, insurances 54 3.9
Real estate, leasing 4 0.3
Computer services 20 1.4
Business services 79 5.7
Personal services 7 0.5
Firm size:
20-49 employees 443 32.1
50-99 employees 336 24.3
100-199 employees 278 20.1
200-499 employees 198 14.3
500-999 employees 69 5.0
> 1 000 employees 58 4.2
Total 1 382 100

213
CHAPTER 10
ICT AND BUSINESS PRODUCTIVITY: FINNISH MICRO-LEVEL EVIDENCE
Mika Maliranta and Petri Rouvinen Research Institute of the Finnish Economy (ETLA)
Abstract
Widespread use of ICT in Finnish business enterprises is quite recent. Contrary to what was believed during the new economy boom, the increasing use of ICT is primarily a phenomenon within firms; the contribution of restructuring to the observed changes in aggregate ICT-intensity is rather marginal. Decompositions of productivity growth suggest, however, that experimentation and selection are quite intense among young ICT-intensive firms. After controlling for industry and time effects as well as labour and other firm-level characteristics, the additional productivity of ICT-equipped labour ranges from 8% to 18% corresponding to roughly a 5% to 6 % elasticity of ICT capital. The effect is much higher in younger firms and in ICT-providing activities. The finding for firm age is consistent with the need for ICT-complementing organisational changes. The finding for ICT-providing activities is not driven by the communications equipment industry but rather by ICT services. Overall, the excess productivity induced by ICT seems to be somewhat higher in services than in manufacturing. Manufacturing firms benefit in particular from ICT-induced efficiency in internal communication (linked to use of local area networks or LANs) whereas service firms benefit from efficiency in external (Internet) communication. We find weak evidence for the complementarity of ICT and education.

214
10.1 Introduction
Koski, Rouvinen and Ylä-Anttila (2002) show that in a decade Finland has gone from being one of the least ICT-specialised industrialised countries to the most specialised. The Finnish ICT sector (see Paija, 2001; Paija and Rouvinen, 2003) is heavily specialised in communications technology production and is dominated by Nokia, although the cluster comprises several thousand firms, including over three hundred first-tier suppliers of Nokia (see, for example, Ali-Yrkkö, 2001; Ali-Yrkkö, 2003). There are indications that Finland may not be as exceptional as a user of ICT than it is as a producer. Studies at the macro level show that the overall effects of ICT are quite large in Finland, but that they are mostly linked to ICT provision (Jalava and Pohjola, 2002).
The Finnish economy has experienced a great leap in its productivity since the late 1980s, largely attributable to advances in the manufacturing sector. Analysis with plant-level data has shown that the acceleration in productivity has mostly taken place through micro-level restructuring between plants but within industries (Maliranta, 2002). These findings underline the importance of firm (and plant) demographics in the productivity evolution and are in accordance with various firm life-cycle models (Ericson and Pakes, 1995; Jovanovic, 1982). These models show that the process of incessant experimentation and selection in the markets is at the core of long-run economic development. While productivity-enhancing plant-level restructuring seems to have taken off as early as the late 1980s, it is unclear to what extent this can be attributed to ICT. Various other profound changes in the economic environment since the 1980s have probably contributed to the process and paved the road for ICT and its productivity effects in the 1990s.
In what follows, we primarily study the productivity effects of ICT at the level of a firm. We address the following questions:
� Does ICT have measurable effects on productivity?
� If so, does the role of ICT differ between manufacturing and services and/or between ICT and non-ICT industries?
� Does the impact of ICT vary by firm age?
� Does the impact of ICT vary across time?
� Is ICT complementary to education?
� What are the effects of various technologies, e.g. computers, Internet, local area networks (LANs)?
This introductory part is followed by a discussion in section 10.2 of some of the developments in workers use of ICT. Section 10.3 performs a principal components and decomposition analysis. Section 10.4 provides a brief theoretical background and review of previous literature and provides the estimation results of the model. Section 10.5 concludes.

215
10.2 Increase in workers use of ICT
One of the key questions of the study is how much the productivity of Finnish businesses is boosted by having a greater share of ICT-equipped labour, i.e. workers that use a computer, Internet, and/or a local area network (LAN) at work. In order to answer this question, we first look at the increases in ICT use in recent years.
Figure 10.1. Exposure of firms (left panels) and employment (right panels) to various forms of ICT in Finnish manufacturing and services (probability and employment weighted)
1992 1993 1994 1995 1996 1997 1998 1999 2000 20010%
20%
40%
60%
80%
100%
Internet
Intranet
Extranet
EDI
1998 1999 2000 20010%
20%
40%
60%
80%
100%
Sh. of comp. eq.
Sh. of I-net eq.
Sh. of LAN eq.
Manufacturing
1992 1993 1994 1995 1996 1997 1998 1999 2000 20010%
20%
40%
60%
80%
100%
Internet
Intranet
Extranet
EDI
1998 1999 2000 20010%
20%
40%
60%
80%
100%
Sh. of comp. eq.
Sh. of I-net eq.
Sh. of LAN eq.
Services
Source: Statistics Finland’s Internet use and e-commerce in enterprises surveys. The shares of firms and employees are calculated by using employment and probability weights. Calculations by the authors.

216
Figure 10.1 shows the increase in the use (or availability) of various forms of ICT. Several findings are noteworthy. First, widespread use of ICT is a recent phenomenon; as late as 1995 one third of workers had (external) email at their disposal – by 2001 this technology was nearly completely diffused. Overall it is clear that all workers and firms are exposed to at least some form(s) of ICT; discussing diffusion in general may therefore not be worthwhile. Some key technologies are, however, nowhere near their full penetration levels. For example, “only” three fourths of all manufacturing employment worked in a firm that had an intranet in 2001. The respective proportion for service employment is two thirds. Interestingly the role of electronic data interchange (EDI), in some sense the “old generation” technology for inter-organisational networking, is decreasing, especially in services.
We can also observe that the use of computers has steadily increased over time in manufacturing. 58% of manufacturing and 71% of service employment used a computer (or a terminal) at work in 2001. The figure for services in considerably higher, but has not increased in recent years. The proportions of workers that are connected to a local area network (LAN) or Internet has increased in manufacturing as well as in services.
The samples of the surveys underlying Figure 10.1 vary from year-to-year which, despite weighting, causes point estimates to be somewhat “noisy”. In order to reduce the problem, we consider only firms that are included in two consecutive samples. Further, we decompose the annual changes in ICT use among continuing firms into “within firms” and “between firms” effects. The within component indicates the average change in ICT use of the firms. The between component provides us with a gauge of micro-level restructuring. It is positive when high ICT-intensity firms increase their labour share at the cost of low ICT-intensity firms.1 The formula for the method used is as follows:
��� ���� ��� � � ���� ��� � � ���� � � �� �
where ��� ���
��� � �� is the ICT intensity, i.e. the share of labour equipped with a computer, Internet,
or LAN, ��� � ��� � �
��� � �� is the ICT intensity of the firm � , � � �
� � �� � is the employment share of
the firm � in the industry, �
� and ��� ���� are the average employment share and ICT intensity of the firm � in the initial and end year, respectively.
The first term in the right-hand side of (1) is the within and the second the between component. As the decomposition method is implemented for a sample, each firm is weighted by the inverse of the sampling probability. More specifically, the average weight in the initial and end year is used. There are at least three alternative ways in analysing the year-to-year changes. One can consider:
1. Firms that are unchanged as legal entities between the two points in time (original).
2. Legal entities that are structurally unchanged in time, i.e. have not acquired or sold plants (filtered).
1. We have ignored the roles of entry and exit for two reasons. More detailed investigations performed by
linking ICT data with the Business Register indicated that only few firms in the ICT data are true entries and exits. Measurement of the entry and exit effects would thus be highly unreliable. Besides, true entry and exit accounts for an insignificant labour share; only a few percentages altogether (see Ilmakunnas and Maliranta, 2003). Both entry and exit should be seen as time-consuming events and therefore restructuring takes place essentially among the continuing firms (and their plants).

217
3. The “synthetic” firms formed by summing up the plants that the firm has continuously possessed between the two points in time (synthetic).
The first alternative is simple but somewhat inaccurate; the second is accurate but observations are lost quite rapidly especially if differences over longer periods are considered; the third uses available information efficiently but obscures the definition of a firm.
Table 10.1 considers the changes in the proportions of ICT-equipped employment and decomposes the changes to within and between effects using the firm definitions discussed above. Manufacturing shows a robust growth in both computer and Internet intensity, whereas the development has been more stagnant in services, as already indicated in Figure 10.1 above. The decompositions show that structural components (between effect) have a slight positive effect on diffusion, but that the growth in ICT intensity overwhelmingly takes place within firms. In other words, no evidence was found that there is a systematic re-allocation of employment towards high ICT-intensity firms within manufacturing or services.
Table 10.1. Decomposition of the change in computer and Internet intensity (based on chained sample data on “original”, “filtered” and “synthetic” firms as discussed above)
Original Filtered Synthetic
Ch. in the Within Between Ch. in the Within Between Ch. in the Within Betweensh. of comp. effect effect sh. of comp. effect effect sh. of comp. effect effect
eq. labour in the ch. in the ch. eq. labour in the ch. in the ch. eq. labour in the ch. in the ch.
1998–1999 4.7% 4.5% 0.2% 3.2% 2.8% 0.4% 4.5% 4.3% 0.1%1999–2000 3.3% 3.4% 0.0% 3.6% 3.8% -0.2% 3.3% 3.4% 0.0%2000–2001 1.5% 1.5% 0.0% 5.4% 5.4% 0.0% 2.1% 2.2% -0.1%
1998–2001 16.1% 15.9% 0.2% 14.9% 14.0% 0.9% 17.1% 16.5% 0.5%
Original Filtered Synthetic
Ch. in the Within Between Ch. in the Within Between Ch. in the Within Betweensh. of I-net effect effect sh. of I-net effect effect sh. of I-net effect effecteq. labour in the ch. in the ch. eq. labour in the ch. in the ch. eq. labour in the ch. in the ch.
1998–1999 6.5% 6.6% -0.1% 4.3% 4.1% 0.2% 6.5% 6.5% 0.1%1999–2000 8.6% 9.0% -0.3% 8.7% 9.0% -0.2% 8.8% 9.0% -0.2%2000–2001 3.2% 3.3% -0.1% 7.7% 7.7% 0.0% 4.1% 4.2% -0.1%
1998–2001 22.1% 22.2% -0.1% 21.1% 20.6% 0.4% 23.1% 22.7% 0.4%
Original Filtered Synthetic
Ch. in the Within Between Ch. in the Within Between Ch. in the Within Betweensh. of comp. effect effect sh. of comp. effect effect sh. of comp. effect effect
eq. labour in the ch. in the ch. eq. labour in the ch. in the ch. eq. labour in the ch. in the ch.
1998–1999 1.6% 0.6% 1.0% 1.0% 0.3% 0.7% 1.5% 0.5% 1.0%1999–2000 6.9% 7.0% -0.1% 5.4% 4.8% 0.6% 7.0% 6.9% 0.2%2000–2001 -2.6% -2.3% -0.3% -2.3% -2.1% -0.2% -2.5% -2.3% -0.2%
1998–2001 4.8% 5.1% -0.3% 8.2% 6.4% 1.9% 5.3% 4.8% 0.5%
Original Filtered Synthetic
Ch. in the Within Between Ch. in the Within Between Ch. in the Within Betweensh. of I-net effect effect sh. of I-net effect effect sh. of I-net effect effecteq. labour in the ch. in the ch. eq. labour in the ch. in the ch. eq. labour in the ch. in the ch.
1998–1999 4.2% 2.6% 1.7% 2.5% 1.6% 0.9% 4.0% 2.5% 1.5%1999–2000 6.9% 6.4% 0.5% 7.2% 6.1% 1.0% 6.8% 6.3% 0.4%2000–2001 1.3% 1.5% -0.2% 0.3% 0.3% 0.0% 1.5% 1.5% 0.0%
1998–2001 16.9% 14.9% 2.0% 21.1% 17.6% 3.5% 16.5% 14.4% 2.0%
Manufacturing, Computers
Manufacturing, Internet
Services, Computers
Services, Internet
Source: Statistics Finland’s Internet use and e-commerce in enterprises surveys. Calculations by the authors.

218
Figure 10.2. Computer, Internet, and LAN intensity by industry (estimated by weighted OLS)
ICT manuf.Chemicals
Mach. & equip.Pulp & paper
Metals & miner.Foodstuffs
Textiles etc.Wood
0% 100%
Empl. & prob. w. Empl. weights
Manufacturing – Internet Intensity
ICT manuf.Chemicals
Pulp & paperMach. & equip.
Metals & miner.Wood
FoodstuffsTextiles etc.
0% 100%
Empl. & prob. w. Empl. weights
Manufacturing – LAN Intensity
ICT servicesICT content
Fin. & bizW-sale & retail
TransportationHealth, etc.
0% 100%
Empl. & prob. w. Empl. weights
Services – Internet Intensity
ICT servicesICT content
Fin. & bizW-sale & retail
TransportationHealth, etc.
0% 100%
Empl. & prob. w. Empl. weights
Services – Computer Intensity
ICT contentICT services
Fin. & bizW-sale & retail
TransportationHealth, etc.
0% 100%
Empl. & prob. w. Empl. weights
Services – LAN Intensity
ICT manuf.Chemicals
Pulp & paperMach. & equip.
Metals & miner.Textiles etc.Foodstuffs
Wood
0% 100%
Empl. & prob. w. Empl. weights
Manufacturing – Computer Intensity
Note: Data from Statistics Finland’s Internet Use and E-commerce in Enterprises Surveys. Calculations by the authors. Standard errors of these estimates are 2-3 percentage points. Manufacturing industries defined as follows: Foodstuffs (15-16); Textiles etc. (17-19); Wood (20); Pulp & paper (21); Chemicals (23-25); Metals & miner. (26-28); Mach. & equip. (29, 311, 312, 314-316, 331, 334, 335, 34, 35); ICT manuf. (30, 313, 32, 332, 333). Service industries defined as follows: Wholesale & retail (50-52); Transportation (60-63); Fin. & buss (65-67, 70, 71, 741-743, 745-748); Health, etc. (55, 75, 85, 90, 91, 923, 925-927, 93); ICT services (642, 72); ICT content (221, 744, 921, 922, 924). Two-digit industries explained in Table 10.3.
It should be pointed out that the discussion above (and in most cases also elsewhere in this paper) focused on employment-weighted results, i.e. they examine the situation a Finnish worker is facing and are thus appropriate when considering the broader situation. Results in this section are mainly driven by the situation in large and medium-sized firms. If one were to consider firm counts only, penetration rates would appear somewhat lower (these results have been reported in several public-cations of Statistics Finland in the Science, Technology and Research series).
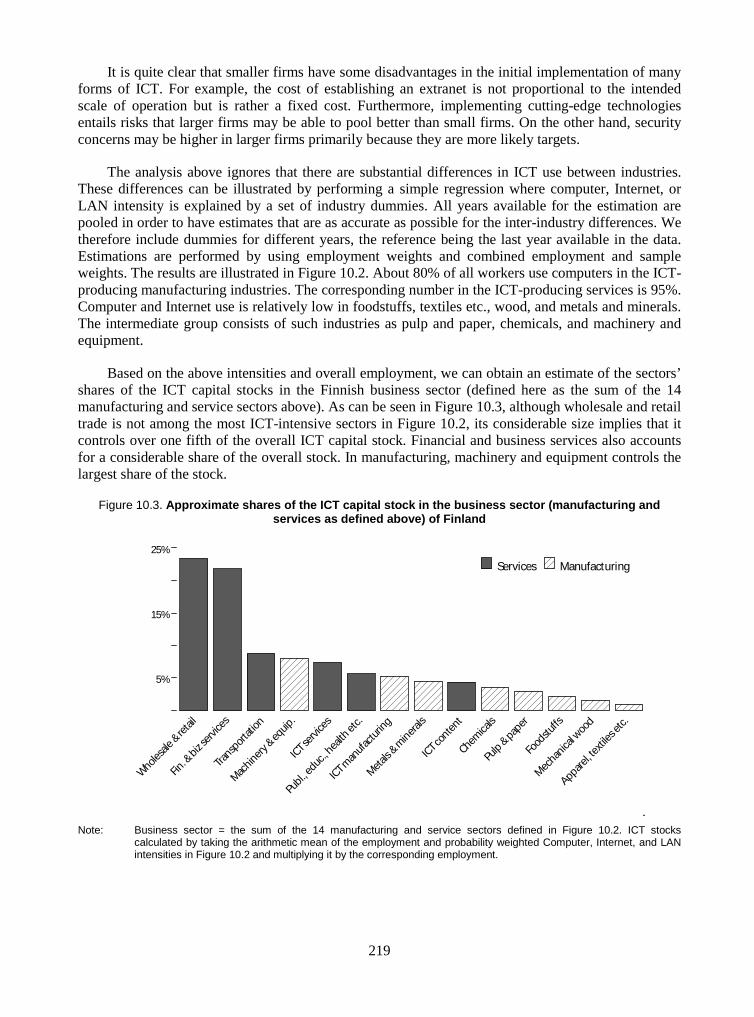
219
It is quite clear that smaller firms have some disadvantages in the initial implementation of many forms of ICT. For example, the cost of establishing an extranet is not proportional to the intended scale of operation but is rather a fixed cost. Furthermore, implementing cutting-edge technologies entails risks that larger firms may be able to pool better than small firms. On the other hand, security concerns may be higher in larger firms primarily because they are more likely targets.
The analysis above ignores that there are substantial differences in ICT use between industries. These differences can be illustrated by performing a simple regression where computer, Internet, or LAN intensity is explained by a set of industry dummies. All years available for the estimation are pooled in order to have estimates that are as accurate as possible for the inter-industry differences. We therefore include dummies for different years, the reference being the last year available in the data. Estimations are performed by using employment weights and combined employment and sample weights. The results are illustrated in Figure 10.2. About 80% of all workers use computers in the ICT-producing manufacturing industries. The corresponding number in the ICT-producing services is 95%. Computer and Internet use is relatively low in foodstuffs, textiles etc., wood, and metals and minerals. The intermediate group consists of such industries as pulp and paper, chemicals, and machinery and equipment.
Based on the above intensities and overall employment, we can obtain an estimate of the sectors’ shares of the ICT capital stocks in the Finnish business sector (defined here as the sum of the 14 manufacturing and service sectors above). As can be seen in Figure 10.3, although wholesale and retail trade is not among the most ICT-intensive sectors in Figure 10.2, its considerable size implies that it controls over one fifth of the overall ICT capital stock. Financial and business services also accounts for a considerable share of the overall stock. In manufacturing, machinery and equipment controls the largest share of the stock.
Figure 10.3. Approximate shares of the ICT capital stock in the business sector (manufacturing and services as defined above) of Finland
Wholes
ale &
retail
Fin. &
biz s
ervice
s
Trans
porta
tion
Machin
ery &
equip
.
ICT se
rvice
s
Publ.
, edu
c., he
alth e
tc.
ICT m
anufa
cturin
g
Metals &
mine
rals
ICT co
nten
t
Chem
icals
Pulp
& pap
er
Food
stuffs
Mecha
nical
wood
Appare
l, tex
tiles e
tc.
5%
15%
25%
Services Manufacturing
Note: Business sector = the sum of the 14 manufacturing and service sectors defined in Figure 10.2. ICT stocks calculated by taking the arithmetic mean of the employment and probability weighted Computer, Internet, and LAN intensities in Figure 10.2 and multiplying it by the corresponding employment.

220
10.3 Principal components and decomposition analysis
The preliminary analysis in this section uses plant-level (as opposed to firm-level) manufacturing (as opposed to manufacturing and services) data.
Principal component analysis (PCA) can be seen as a method “… to reduce the dimensionality of a data set consisting of a large number of interrelated variables…” (Jolliffe, 2002, p. 1). We perform a correlation matrix-based PCA with a sample of Finnish manufacturing plants covering roughly half of manufacturing employment in year 2000. The following variables are included: measures of ICT-intensity (the computer and Internet labour shares), measures of employees (average age of employees, average tenure in the plant, share of employees with higher technical education, and share of employees with higher non-technical education) and plant characteristics (plant age and R&D intensity).
Two principal components (PCs) with eigenvalues above one are found (results not shown but available upon request). The first PC (PC1) has an eigenvalue of nearly three and explains over one third of the variation. It has high (positive) loadings on ICT-intensities and technical education but low (negative) loadings on plant age and employee tenure. In other words, plants with a high PC1 value tend to be relatively technology-intensive new plants.
Based on the extracted PC1 values, we divide the sample into three equally sized groups. The first group consists of plants with the highest PC1 values, which we label new. The last group consists of plants with the lowest PC1 values, which we label traditional. The remaining one third belongs to the group labelled middle. In what follows, productivity decompositions are applied separately for these three groups. The following productivity decomposition method is applied (Foster, Haltiwanger and Krizan, 2001):
��� �� �� ��� � � �
� � � � � �� � �� � ��� �
where � and �� are the productivity indicators of the total industry and plant � , respectively and
�� is the input share of the plant � . Here input is measured by a weighted geometric average of labour input and the capital stock. The weights are determined by the respective factor income shares. We limit our analysis to the continuing plants for the reasons explained in note 1.
The first term in the right-hand side of the equation is the “within plants” component that indicates the (weighted) average productivity growth rate of the plants. The second term is the “between plants” component. It gauges how much plant-level restructuring has increased aggregate productivity during the period under consideration. It is positive when there is a systematic reallocation of resources from low productivity plants to high productivity plants. It thus measures the productivity-enhancing selection among plants.
As Figure 10.4 shows, there are no major differences between the three groups in total factor productivity growth that takes place inside (within) the plants. Despite the fact that the effect of micro-structural change is eliminated from the within component, the numbers for the “representative plant” obviously hide a lot of heterogeneity in the changes in ICT intensity between plants.

221
Figure 10.4. TFP growth within plants – no major differences between the groups
1992 1993 1994 1995 1996 1997 1998 1999 2000-20%
-10%
0%
10%
20%
30%Traditional Middle New
Figure 10.5. Between plants – effect in TFP growth – “creative destruction” among new plants
1992 1993 1994 1995 1996 1997 1998 1999 2000-2%
-1%
0%
1%
2%
3%
4%Traditional Middle New
Figure 10.5 illustrates the development of the between component in the three groups of plants. The new have consistently higher between effects, indicating that productivity enhancing restructuring (selection) is the highest among them as compared to the other two groups. This is consistent with the argument that ICT-related experimentation by the new plans leads to intensive “creative destruction”, i.e. plants with successful experimentation grow and others decline. It is worth noting that since the productivity decomposition is conducted with plant-level data these results may reflect intra-firm as well as inter-firm restructuring among the new or among the two other groups of plants. The above findings are in accordance with Maliranta (2001, pp. 37-8). His analysis indicated that a disproportionally large share of the positive between component can be attributed to plants with high R&D-intensity. However, the within component showed no significant differences between plants with high and low R&D-intensity.

222
Figure 10.6 shows the variation in TFP levels between the three groups. Two things immediately invite attention. First, the variation seems to have diminished in all three groups since the mid-1990s. This is caused by the decline of low productivity plants as a consequence of the deep recession. Second, after this “cutting off the lower end of the productivity distribution” had been completed by the mid-1990s, we observe higher variation in the TFP levels of new plants. This is consistent with experimentation, i.e. possibly equally intense but nevertheless different approaches to the implementation of ICT lead to different “draws” from the productivity distribution among the new plants. In a competitive setting we would not expect the high variation in TFP levels to persist, unless the process is not continually nourished by new innovations and further experimentation. A change in productivity dispersion suggests that the balance between experimentation (more intense experimentation increases the dispersion) and restructuring/selection (which reduces the dispersion as lower productivity plants decline) has changed in the more dynamic and competitive environment.
Figure 10.6. Standard deviation in logged TFP levels – more variation among new plants
1992 1993 1994 1995 1996 1997 1998 1999 20000.3
0.4
0.5
0.6
0.7
0.8Traditional Middle New
10.4 Productivity effects of ICT
As section 10.2 showed, ICT penetration progressed rapidly in the late 1990s. Depending on the measure used, it grew ten to twenty percentage points in a few years. The increase was a within firms phenomenon; the contribution of restructuring (the between effect) was less than one percentage point over the four year period.
TFP decompositions in section 10.3 showed that restructuring was particularly rapid among young ICT-intensive plants (“new”) even though their average TFP growth was similar to other firms. This finding is consistent with intense experimentation and selection within the new group.

223
10.4.1 Model
A standard Cobb-Douglas production function of firm � at time � can be presented as
� �
�� �� �� �� � �� �� �
��� �
where is output (value added), is disembodied technology, � is capital, � is labour, and � a vector of other firm characteristics. Embodied technology is, by definition, included in the productive assets and/or intermediate inputs.
Assume that all workers ( � ) are perfect substitutes, but that they may have different marginal productivities depending on whether they use ICT (
���� ) or not ( � ). This can be introduced into (3)
as follows:
�
�
���
��� ��
�� �� �� �� �
��
� � �
�
�
� �� �� �� �
� �� �� �� �� �� �� �� �� �
����
�
where ����
� is a parameter capturing the possible additional productivity effect associated with the use
of ICT. Slight manipulation yields the labour productivity specification
�� �� �� �� �� �����
��� ���� ��
�� � � � � � ��
�� �� ��
� � �� � �
� � � � �� �� � � � � �
� � � � � � � �� �� � � � � �� �� � � � � �� ��
� ���
where ��� � ���� �� � controls for deviations from constant returns to scale (Griliches and Ringstad,
1971). Approximating ������ ��� �� ��
� ��� with ��� �� ��� � yields
� ��� �� �� �� �����
��� ���� ��
�� � � � � � ��
�� �� ��
�� �� �� � �
� � � � �� � � � � �
� � � � � � �� � � � � �
�� ��
�
An increase in � will make all factors proportionately more productive. Lehr and Lichtenberg (1999) propose that this might be the case with ICT if its primary function is to improve communication. Atrostic and Nguyen (2002), for example, incorporate a computer network dummy into � .
This leads us to consider alternative ways of introducing ICT into (3). ICT efficiency � can be defined as follows (
����� indicates the share of ICT (
��� �� ��� � ) and
�� the share of non-ICT (
�� ��� � )
labour):
� �� � ��� ��� �� ��� ��� �
��� � �� � �
�
If the role of ICT is merely to augment labour, (3) becomes
� � �
� � ��� ��� �� ��� ���� �
�� �� �� ��� � � � �
��� � � �� �� � �
� ����
�

224
leading to the specification considered in (6), where the relationship is now exact rather than approximate. If, instead, ICT augments output and/or increases efficiency of all inputs (and constant returns to scale prevails), (3) becomes
� � � � � �� � � � � � � � ��� ��� �� ��� �� �� ��� �� ��� �� �� ��� �� ��� ��� � � � � �
�� �� �� �� ��
�� ��
� � � � � � �� �
� � �� �
�
� � � � � � � � �� � � � �� � � � � �
� � � �� �� �
�� ��� �
leading to
�� �� �� �����
��� ���� ��
�� �
�� �� ��
� �� � �
� �� � � � � �
� � � �� � � � � �� � � � � �
�� ��
�
With the exception of the ICT coefficient ���� �
� � that appears as ����
� above, (10) is a constant
returns to scale version of (6). Estimations of (6) and (10) would be identical, but the interpretation of the ICT coefficient would be somewhat different.2
10.4.2 Analysis
We will capture disembodied technology and industry specific shocks by defining
��
��� �� ���
where � refers to the industry of firm � . Thus, our empirical specification becomes
� ��� �� �� �����
��� ���� ���� � � � � �� ��
�� �� ��
�� � �� � �
� � � � � � �� � � � � �
� � � � � � � �� � �
�� ��
�
where � is the error term. Separately and together we consider three alternative measures for
��� �� ��� � in (12):
� Share of labour using a computer or a terminal at work (comp.).
� Share of labour using an Internet-connected computer or a terminal at work (I-net).
� Share of labour using a local area network connected computer or terminal at work (LAN).
Besides the ICT indicator(s), all specifications include a constant term ( � ) as well as interacted two-digit industry and annual time dummies ( ��� ), the (log of the) capital-labour ratio ( ��
�� ��� � ),
and (the log of) labour ( ����
� ). Four specifications are considered:
2. A further alternative would be to specify the firm’s ICT stock (proxied, e.g. by the number of computers
in use, which could be calculated from the data at our disposal by multiplying the computer intensity by employment) as an additional factor of production in (3) or derive the ICT’s share in the overall capital stock and proceed as we have done with the labour share of ICT-equipped labour.

225
� Column 1: A basic version of (12) with � comprising two firm age dummies (control group: middle-aged firms).
� Column 2: As Column 1, but � also includes the labour shares of lower, medium, and higher technical and non-technical education; two employment age dummies (control group: 35–44 year olds); and the labour share of female employees.
� Column 3: As Column 2, but the ICT indicator is now interacted with three firm age dummies.
� Column 4: As Column 1, but � includes the average years of schooling which is also interacted with the ICT indicator.
We also estimated an variant of column 3 (not shown) with the ICT indicator interacted with time rather than with firm age dummies, but found no evidence for changes in the impact of ICT over time.3
All of the results are derived separately for manufacturing and services firms. Depending on the ICT indicator(s) used, the sample size varies from 949 to 1 444 observations in manufacturing and from 746 to 1 472 in services. Table 10.2 represents the basic descriptive statistics of the largest manufacturing and services samples, Table 10.3 shows the distribution of firms by industry, and Table 10.4 illustrates the time-series cross-section patterns in the data. One noteworthy point on these tables is that the panel dimension of our data is rather weak, e.g. only about one in ten firms is observed for all three years considered (1998–2000).
3. Note, however, that our controls include interacted two-digit industry and annual time dummies which
would necessarily capture some of this effect.

226
Table 10.2. Descriptive statistics of the largest (comp.) samples
Manufacturing Services
Variables Obs. Mean St. dev. Min. Max. Obs. Mean St. dev. Min. Max.
DEPENDENT: ln(value added / labour) 1,444 10.74 0.48 7.48 13.43 1,472 10.70 0.61 5.97 17.45
CD: ln(physical capital stock / labour) 1,444 10.59 1.37 5.07 17.66 1,472 9.79 1.54 4.12 20.61
ICT: sh. of comp. equipped labour 1,444 0.46 0.30 0.00 1.00 1,472 0.78 0.30 0.01 1.00ICT: sh. of I-net equipped labour 1,412 0.28 0.28 0.00 1.00 1,446 0.61 0.39 0.00 1.00ICT: sh. of LAN equipped labour 967 0.46 0.30 0.01 1.00 759 0.71 0.33 0.01 1.00
ICT: sh. of comp. × Firm: young 1,444 0.03 0.14 0.00 1.00 1,472 0.12 0.32 0.00 1.00ICT: sh. of comp. × Firm: middle-aged 1,444 0.24 0.32 0.00 1.00 1,472 0.46 0.44 0.00 1.00ICT: sh. of comp. × Firm: old 1,444 0.19 0.28 0.00 1.00 1,472 0.20 0.37 0.00 1.00
ICT: sh. of I-net × Firm: young 1,412 0.02 0.13 0.00 1.00 1,446 0.11 0.30 0.00 1.00ICT: sh. of I-net × Firm: middle-aged 1,412 0.15 0.25 0.00 1.00 1,446 0.34 0.42 0.00 1.00ICT: sh. of I-net × Firm: old 1,412 0.11 0.21 0.00 1.00 1,446 0.16 0.33 0.00 1.00
ICT: sh. of LAN × Firm: young 967 0.03 0.15 0.00 1.00 759 0.08 0.27 0.00 1.00ICT: sh. of LAN × Firm: middle-aged 967 0.25 0.32 0.00 1.00 759 0.44 0.43 0.00 1.00ICT: sh. of LAN × Firm: old 967 0.19 0.29 0.00 1.00 759 0.19 0.36 0.00 1.00
ICT: sh. of comp. × Labour: education 1,444 0.57 0.39 0.00 1.62 1,472 1.02 0.44 0.01 1.77ICT: sh. of I-net × Labour: education 1,412 0.35 0.37 0.00 1.62 1,446 0.81 0.56 0.00 1.77ICT: sh. of LAN × Labour: education 967 0.57 0.39 0.01 1.61 759 0.93 0.47 0.01 1.66
Firm: young (avg. plant age < 5) 1,444 0.06 0.23 0.00 1.00 1,472 0.14 0.35 0.00 1.00Firm: old (avg. plant age > 15) 1,444 0.46 0.50 0.00 1.00 1,472 0.26 0.44 0.00 1.00
Educ.: sh. of technical, lower 1,444 0.36 0.16 0.00 0.85 1,472 0.17 0.18 0.00 1.00Educ.: sh. of technical, med. 1,444 0.16 0.11 0.00 1.00 1,472 0.22 0.23 0.00 1.00Educ.: sh. of technical, higher 1,444 0.04 0.08 0.00 0.69 1,472 0.08 0.14 0.00 1.00
Educ.: sh. of non-technical, lower 1,444 0.11 0.08 0.00 0.67 1,472 0.19 0.18 0.00 1.00Educ.: sh. of non-technical, medium 1,444 0.04 0.07 0.00 1.00 1,472 0.13 0.17 0.00 1.00Educ.: sh. of non-technical, higher 1,444 0.01 0.03 0.00 0.35 1,472 0.03 0.09 0.00 0.75
Labour: young (avg. age < 34) 1,444 0.31 0.15 0.00 1.00 1,472 0.36 0.21 0.00 1.00Labour: old (avg. age > 45) 1,444 0.39 0.15 0.00 1.00 1,472 0.33 0.19 0.00 1.00
Labour: sh. of females 1,444 0.31 0.23 0.00 1.00 1,472 0.43 0.28 0.00 1.00
Labour: education (avg. years of) 1,444 1.19 0.09 0.99 1.62 1,472 1.28 0.14 0.90 1.77 Note: Internet and LAN variables do not correspond to the sets used in regressions. Education in tens of years.

227
Table 10.3. Number of firms by industry (largest samples)
Code Obs. Description Code Obs. Description
15 126 Food products, beverages 50 99 Sale and maintenance of motor veh.
17 40 Textiles 51 304 Wholesale and commission trade
18 34 Wearing apparel, etc. 52 201 Retail trade; repair of pers. goods
19 20 Dressing of leather, etc. 55 85 Hotels and restaurants
20 93 Wood and wood products 60 24 Transport, storage and communic.
21 79 Pulp, paper, paper prod. 61 4 Water transport
22 125 Publishing, printing, etc. 63 6 Supporting transport activities, etc.
23 4 Coke, nuclear fuel, etc. 64 72 Post and telecommunications
24 70 Chemicals, etc. 70 44 Real estate, renting and business
25 73 Rubber and plastic prod. 71 10 Renting of machinery w/o operator
26 73 Other non-met. mineral prod. 72 141 Computer and related activities
27 56 Basic metals 74 481 Other business activities
28 154 Fabricated metal products 92 1 Recreational, cultural, sport act
29 185 Machinery and equipm. nec. 50–93 1,472 Services
30 4 Electrical equipment, etc.
31 75 Electrical machinery, nec.
32 47 Radio communic. equipm. etc.
33 34 Medical instruments, etc.
34 34 Motor vehicles, etc.
35 38 Other transport equipment
36 80 Furniture, manuf. nec.
15–37 1,444 Manufacturing
Note: If there are no usable observations for a given industry, it is excluded from the table.
Table 10.4. Data patterns and their frequencies in the data for the regressions below
Largest manufacturing sample (computers) Largest services sample (computers)
# of firms # of years Firms × years
1998
1999
2000 # of firms # of years Firms × years
1998
1999
2000
354 1 354 1 378 1 378 1162 2 324 1 1 315 1 315 1139 1 139 1 97 2 194 1 1112 3 336 1 1 1 97 2 194 1 187 2 174 1 1 80 2 160 1 156 2 112 1 1 75 3 225 1 1 15 1 5 1 6 1 6 1
915 1–3 1,444 1,048 1–3 1,472
Smallest manufacturing sample (LAN) Smallest services sample (LAN)
# of firms # of years Firms × years
1998
1999
2000 # of firms # of years Firms × years
1998
1999
2000
391 1 391 1 343 1 343 1258 2 516 1 1 157 2 314 1 163 1 63 1 103 1 103 1
712 1–2 970 603 1–2 760
Note: LAN is the smallest of the single ICT indicator samples. Data patterns of the Internet and the three ICT indicator samples are omitted. The former is similar to the largest and the latter to the smallest samples shown above.

228
Table 10.5 presents the results of estimating equation (12) by ordinary least squares (OLS) using computers as the ICT indicator. This first set of regression results is discussed in some detail; for further results we primarily concentrate on the ICT variables.
The term “fully robust” implies that we employ White (1980) heteroscedasticity consistent standard errors and also allow for the dependence (autocorrelation) of observations across . Thus, the measurement of standard errors is robust as long as the � s are independently distributed (for discussion see Stata, 2001, section 23.11). The results are weighted, i.e. they refer to employment in manufacturing or services. We do not impose constant returns to scale. All of the results are also derived with and without weighting as well as with and without imposing constant returns to scale and are available upon request.
In general the alternative reported below (weighted, constant returns to scale not imposed, interacted time and industry dummies) seems to be the least favourable to finding ICT-related results.4 However, it is arguably the most appropriate method for the situation at hand.5
The first column of Table 10.5 would seem suggest that the use of a computer would increase a worker’s productivity by 17% in manufacturing and by nearly 30% in services. If we control for employment characteristics (the second column), the effect becomes statistically insignificant in manufacturing and reduces to 10% in services. What is noteworthy, however, is that the effect in
4. However, the tendency of ICT to be more productive in younger firms weakens in the unweighted results.
5. In the Table below (only the ICT indicator coefficient estimates are reported) we have re-estimated manufacturing Column 2 in Table 10.5 with all possible combinations of the following:
� Weighted / non-weighted.
� With / without constant returns to scale imposed.
� Identically independently distributed (homoskedastic, no autocorrelation, non-robust) / robust / fully robust standard errors.
� With only the constant term (No) / only industry dummies (Ind.) / only time dummies (Time) / industry and time dummies (Ind.+Time) / interacted industry and time dummies (Ind.*Time).
� The alternative reported in the text is marked with a rectangle.
�
Options DummiesWeighted Constant Robust No Ind. Time Ind.+Time Ind.*TimeNo No No 0.251*** 0.164*** 0.246*** 0.154*** 0.151***No No Yes 0.251*** 0.164*** 0.246*** 0.154*** 0.151***No No Yes, fully 0.251*** 0.164*** 0.246*** 0.154*** 0.151**No Yes No 0.298*** 0.208*** 0.284*** 0.191*** 0.189***No Yes Yes 0.298*** 0.208*** 0.284*** 0.191*** 0.189***No Yes Yes, fully 0.298*** 0.208*** 0.284*** 0.191*** 0.189***Yes No No 0.237*** 0.097** 0.223*** 0.076* 0.089*Yes No Yes 0.237*** 0,097 0.223*** 0,076 0,089Yes No Yes, fully 0.237*** 0,097 0.223*** 0,076 0,089Yes Yes No 0.233*** 0.088* 0.222*** 0,072 0.093*Yes Yes Yes 0.233*** 0,088 0.222*** 0,072 0,093Yes Yes Yes, fully 0.233*** 0,088 0.222*** 0,072 0,093
As can be seen in the above table, the largest and most significant ICT coefficient estimates are reached with no or only time dummies. The smallest and least significant coefficient estimates are reached with both industry and time dummies. Weighting reduces the significance of the coefficient estimates. Robust standard errors reduces the significance of the coefficient estimates (slightly higher for fully robust than robust). Coefficient estimates are higher and more significant when constant returns to scale are imposed.

229
manufacturing becomes again significant if the impact of ICT is examined by firm age (the third column). The productivity effects of ICT seem to be much larger in younger than in older firms. A similar effect is not observed in services. Contrary to our findings on ICT, other studies have shown that the productivity of (primarily non-ICT) capital tends to be higher in older plants, which is possibly due to learning effects. While learning effects undoubtedly also exist with ICT, our finding is consistent with the argument that it may be even more important to be able to make complementary organisational adjustments. Such changes are arguably more easily implemented in younger firms and certainly in new firms, which by definition have a completely new organisational structure. We are unable to verify the complementarity of ICT and education (the fourth column).
Table 10.5. Labour productivity ( ���� ��
� � ) regressions with the share of labour using a computer at work as the ICT indicator – pooled OLS with fully robust standard errors
Manufacturing Services
(1) (2) (3) (4) (1) (2) (3) (4)
ICT: sh. of comp. equipped labour 0.176** 0.089 -0.563 0.282*** 0.106* -1.165(0.081) (0.072) (1.387) (0.073) (0.063) (0.869)
ICT: sh. of comp. × Firm: young 0.475** 0.118(0.239) (0.137)
ICT: sh. of comp. × Firm: middle 0.166** 0.122*(0.084) (0.071)
ICT: sh. of comp. × Firm: old -0.066 -0.031(0.141) (0.143)
ICT: sh. of comp. × Labour: education 0.527 1.120(1.179) (0.735)
CD: ln(physical capital stock / labour) 0.120*** 0.106*** 0.104*** 0.111*** 0.123*** 0.110*** 0.109*** 0.119***(0.035) (0.031) (0.030) (0.036) (0.026) (0.026) (0.026) (0.026)
CD: ln(labour) 0.053*** 0.067*** 0.068*** 0.049*** -0.029** -0.026** -0.026** -0.017(0.017) (0.016) (0.016) (0.016) (0.012) (0.012) (0.013) (0.012)
Firm: young (avg. plant age < 5) 0.041 0.107 -0.050 0.001 -0.188* -0.121 -0.119 -0.139(0.063) (0.086) (0.120) (0.074) (0.101) (0.103) (0.134) (0.107)
Firm: old (avg. plant age > 15) 0.019 0.057 0.176*** 0.037 0.114** 0.123** 0.231* 0.131**(0.049) (0.046) (0.067) (0.048) (0.054) (0.054) (0.124) (0.056)
Educ.: sh. of technical, lower -0.061 -0.056 0.035 0.057(0.319) (0.317) (0.214) (0.221)
Educ.: sh. of technical, med. 0.773** 0.783** 0.535** 0.557**(0.340) (0.336) (0.211) (0.225)
Educ.: sh. of technical, higher 0.426 0.378 1.011*** 1.021***(0.642) (0.640) (0.279) (0.287)
Educ.: sh. of non-technical, lower 0.693* 0.689* 0.297 0.319(0.397) (0.398) (0.224) (0.228)
Educ.: sh. of non-technical, medium 0.118 0.189 0.458 0.482(0.383) (0.384) (0.315) (0.323)
Educ.: sh. of non-technical, higher -1.090 -1.382 1.245*** 1.267***(0.856) (0.876) (0.313) (0.321)
Labour: young (avg. age < 34) -0.241 -0.235 -0.298 -0.310(0.253) (0.253) (0.239) (0.237)
Labour: old (avg. age > 45) -0.320 -0.317 0.082 0.075(0.230) (0.231) (0.232) (0.231)
Labour: sh. of females -0.832*** -0.845*** -0.154 -0.143(0.168) (0.165) (0.139) (0.141)
Labour: education (avg. years of) 0.699 0.204(0.717) (0.686)
Observations 1,444 1,444 1,444 1,444 1,472 1,472 1,472 1,472Adjusted R-squared 0.48 0.54 0.55 0.49 0.46 0.50 0.50 0.49
Also incl. a constant term as well as interacted industry and time dummies Constant, industry × time
Note: ***, ***, and * respectively indicate significance at 1, 5, and 10 % level. Standard errors in parentheses.

230
As expected, physical capital intensity has a positive and significant effect on labour productivity. The estimated coefficients may seem somewhat low, but it should be kept in mind that the interacted industry and time dummies effectively remove all variation across time and industries, which has consequences on all coefficients but especially on those with significant variation by industry such as capital intensity. There seem to be increasing returns to scale in manufacturing but decreasing returns to scale in services. Older services firms tend to be considerably more productive.
In manufacturing, high shares of employment with technical medium (bachelor level) and non-technical lower (post secondary but below bachelor level) levels of education seem to contribute to productivity. In our interpretation this shows that it pays to have sufficiently educated personnel on the “factory floor”. In services, high shares of employment with technical and non-technical higher (master level or above) education as well as with technical medium level education contribute to productivity. The effect of education seems to be more straightforward in services. This may be because a more educated person is able to produce a higher value added directly, e.g. in professional services, whereas in manufacturing the effects are transmitted via the process and product innovation(s) that this type of worker may generate in the longer run.
Computer usage may be regarded as a general proxy for ICT use in the organisation in question. The next set of regressions considers Internet use, thus arguably emphasising the role of external electronic communication.
Table 10.6 represents the results of estimating equation (12) by ordinary least squares (OLS) with Internet as the ICT indicator. In manufacturing we find that the productivity effect of Internet is negative, especially in older plants (the second and third column). In services, however, the effect of Internet appears to be even larger than that of computers. The second column suggests that, after controlling for labour characteristics, Internet-equipped labour is 15% more productive. Furthermore, with Internet we do observe a much higher productivity effect of ICT in younger as compared to older service firms (the third column). This effect is qualitatively quite similar to that found with computers in manufacturing.

231
Table 10.6. Labour productivity ( ���� ��
� � ) regressions with the share of labour using an Internet-connected computer at work as the ICT indicator – pooled OLS with fully robust standard errors
Manufacturing Services
(1) (2) (3) (4) (1) (2) (3) (4)
ICT: sh. of I-net equipped labour -0.073 -0.201** 0.352 0.294*** 0.150** -0.567(0.114) (0.100) (1.161) (0.083) (0.070) (0.577)
ICT: sh. of I-net × Firm: young 0.311 0.402*(0.210) (0.242)
ICT: sh. of I-net × Firm: middle -0.174 0.158**(0.125) (0.077)
ICT: sh. of I-net × Firm: old -0.321** -0.050(0.136) (0.121)
ICT: sh. of comp. × Labour: education -0.484 0.620(0.956) (0.466)
CD: ln(physical capital stock / labour) 0.125*** 0.103*** 0.102*** 0.105*** 0.125*** 0.111*** 0.110*** 0.118***(0.035) (0.031) (0.031) (0.036) (0.027) (0.027) (0.027) (0.026)
CD: ln(labour) 0.052*** 0.067*** 0.068*** 0.049*** -0.021* -0.021* -0.017 -0.013(0.016) (0.016) (0.016) (0.016) (0.013) (0.012) (0.013) (0.011)
Firm: young (avg. plant age < 5) 0.047 0.105 -0.096 0.014 -0.189* -0.130 -0.286 -0.134(0.068) (0.091) (0.103) (0.079) (0.097) (0.102) (0.217) (0.104)
Firm: old (avg. plant age > 15) 0.015 0.055 0.092 0.038 0.120** 0.126** 0.239** 0.138***(0.050) (0.046) (0.062) (0.047) (0.053) (0.053) (0.098) (0.053)
Educ.: sh. of technical, lower -0.068 -0.056 0.137 0.173(0.316) (0.315) (0.194) (0.202)
Educ.: sh. of technical, medium 0.867** 0.890** 0.614*** 0.601***(0.349) (0.349) (0.205) (0.222)
Educ.: sh. of technical, higher 0.786 0.736 1.021*** 0.999***(0.642) (0.640) (0.262) (0.267)
Educ.: sh. of non-technical, lower 0.650* 0.640 0.363* 0.381*(0.394) (0.398) (0.211) (0.213)
Educ.: sh. of non-technical, med. 0.300 0.410 0.621** 0.632**(0.366) (0.363) (0.275) (0.282)
Educ.: sh. of non-technical, higher -0.618 -0.878 1.199*** 1.212***(0.805) (0.816) (0.303) (0.312)
Labour: young (avg. age < 34) -0.282 -0.296 -0.129 -0.138(0.255) (0.253) (0.220) (0.220)
Labour: old (avg. age > 45) -0.365 -0.367 0.173 0.178(0.232) (0.231) (0.211) (0.211)
Labour: sh. of females -0.831*** -0.836*** -0.114 -0.110(0.165) (0.162) (0.133) (0.132)
Labour: education (avg. years of) 1.720*** 0.807**(0.468) (0.410)
Observations 1,415 1,415 1,415 1,415 1,448 1,448 1,448 1,448Adjusted R-squared 0.48 0.55 0.55 0.50 0.46 0.50 0.51 0.50
Also incl. a constant term as well as interacted industry and time dummies Constant, industry × time
Note: ***, ***, and * respectively indicate significance at 1, 5, and 10 % level. Standard errors in parentheses.
Whereas computers are regarded a general proxy for ICT use and Internet is seen as a proxy for external electronic communication, LAN may be seen as a proxy for the role of internal electronic communication in the organisation considered.
Table 10.7 represents the results of estimating equation (12) by ordinary least squares (OLS) with LAN as the ICT indicator. Unfortunately this indicator is only available for two years, so the samples are considerably smaller. Despite this the productivity effects of ICT come through strongly and positively in both manufacturing and services. In manufacturing, LAN-equipped labour seems to be 15% more productive. In services the corresponding effect is 18%. There is also some indication of the complementary of education and ICT (see the fourth column under Services).

232
Table 10.7. Labour productivity ( ���� ��
� � ) regressions with the share of labour using a LAN computer at work as the ICT indicator – pooled OLS with fully robust standard errors
Manufacturing Services
(1) (2) (3) (4) (1) (2) (3) (4)
ICT: sh. of comp. equipped labour 0.213*** 0.149* -1.259 0.310*** 0.182** -2.298*(0.082) (0.078) (1.080) (0.081) (0.076) (1.220)
ICT: sh. of comp. × Firm: young 0.237 0.639(0.200) (0.702)
ICT: sh. of comp. × Firm: middle 0.212** 0.171**(0.103) (0.072)
ICT: sh. of comp. × Firm: old 0.029 0.140(0.146) (0.149)
ICT: sh. of comp. × Labour: education 1.171 2.126**(0.928) (1.044)
CD: ln(physical capital stock / labour) 0.118*** 0.112*** 0.111*** 0.109*** 0.129*** 0.114*** 0.115*** 0.122***(0.034) (0.031) (0.031) (0.035) (0.027) (0.027) (0.027) (0.026)
CD: ln(labour) 0.049** 0.060*** 0.060*** 0.047** -0.042** -0.049*** -0.048*** -0.034**(0.019) (0.018) (0.018) (0.018) (0.017) (0.015) (0.015) (0.015)
Firm: young (avg. plant age < 5) 0.076 0.137 0.127 0.030 -0.258 -0.228 -0.627 -0.224(0.067) (0.093) (0.143) (0.078) (0.176) (0.179) (0.694) (0.181)
Firm: old (avg. plant age > 15) 0.030 0.069 0.162** 0.046 0.054 0.043 0.063 0.071(0.056) (0.053) (0.074) (0.055) (0.056) (0.060) (0.124) (0.055)
Educ.: sh. of technical, lower -0.016 -0.025 0.027 0.018(0.374) (0.373) (0.260) (0.258)
Educ.: sh. of technical, med. 0.979*** 0.970*** 0.560** 0.556**(0.355) (0.353) (0.261) (0.264)
Educ.: sh. of technical, higher -0.131 -0.144 1.107*** 1.109***(0.555) (0.558) (0.384) (0.385)
Educ.: sh. of non-technical, lower 0.577 0.539 0.341 0.332(0.440) (0.448) (0.229) (0.231)
Educ.: sh. of non-technical, medium 0.227 0.251 0.377 0.374(0.404) (0.405) (0.394) (0.395)
Educ.: sh. of non-technical, higher -0.823 -0.926 1.619*** 1.634***(0.821) (0.847) (0.347) (0.349)
Labour: young (avg. age < 34) -0.233 -0.260 -0.203 -0.210(0.286) (0.289) (0.310) (0.313)
Labour: old (avg. age > 45) -0.318 -0.351 0.230 0.223(0.254) (0.249) (0.284) (0.285)
Labour: sh. of females -0.821*** -0.832*** -0.086 -0.103(0.174) (0.170) (0.171) (0.160)
Labour: education (avg. years of) 0.154 -0.456(0.636) (0.982)
Observations 970 970 970 970 760 760 760 760Adjusted R-squared 0.46 0.52 0.52 0.47 0.49 0.54 0.54 0.53
Also incl. a constant term as well as interacted industry and time dummies Constant, industry × time
Note: ***, ***, and * respectively indicate significance at 1, 5, and 10 % level. Standard errors in parentheses.
Table 10.8 runs the three ICT indicators together. The regressions have some obvious problems not least because of collinearity between the three measures. In case of manufacturing the negative effect of Internet in older plants comes through quite clearly as does the positive effect of LAN. There is also some indication for the complementary of education and LAN. In services the effect of Internet is positive especially in younger firms (the Internet × young coefficient is significant at the 15% level). There is also some indication of complementary of education and Internet.
Based on the evidence presented in this section it seems that the excess productivity effect of ICT-equipped labour typically ranges from 8% to 18%. The effect tends to be larger in services than in manufacturing. The effect is often much higher in younger firms and can even be negative in older

233
firms. Since organisational changes are arguably easier to implement in younger firms and recently established firms have by definition a new structure, we interpret this as evidence for the need for complementary organisational changes. Manufacturing firms seem to benefit from ICT-induced efficiency in internal communication whereas service firms benefit from efficiency in external communication.
Table 10.8. Labour productivity ( ���� ��
� � ) regressions with all three ICT indicators – pooled OLS with fully robust standard errors
Manufacturing Services
(1) (2) (3) (4) (1) (2) (3) (4)
ICT: sh. of comp. equipped labour 0.212 0.084 0.864 0.066 -0.029 1.619ICT: sh. of I-net equipped labour -0.341** -0.402*** 1.795 0.259** 0.168* -1.879ICT: sh. of LAN equipped labour 0.203 0.233** -4.535* 0.150 0.127 -0.165
ICT: sh. of comp. × Firm: young 0.920 -1.060ICT: sh. of comp. × Firm: middle-aged 0.126 0.130ICT: sh. of comp. × Firm: old 0.032 -0.975***
ICT: sh. of I-net × Firm: young 0.474* 1.310ICT: sh. of I-net × Firm: middle-aged -0.438** 0.104ICT: sh. of I-net × Firm: old -0.419** -0.230
ICT: sh. of LAN × Firm: young -1.199 0.196ICT: sh. of LAN × Firm: middle-aged 0.284** 0.024ICT: sh. of LAN × Firm: old 0.158 1.238***
ICT: sh. of comp. × Labour: education -0.683 -1.317ICT: sh. of I-net × Labour: education -1.861 1.705*ICT: sh. of LAN × Labour: education 4.051* 0.215
Non-ICT variables as above Non-ICT variables as above
Observations 949 949 949 949 746 746 746 746Adjusted R-squared 0.47 0.54 0.54 0.50 0.49 0.54 0.55 0.53
Also incl. a constant term as well as interacted industry and time dummies Constant, industry × time
Note: ***, ***, and * respectively indicate significance at 1, 5, and 10 % level. Standard errors omitted.
10.4.3 ICT vs. non-ICT industries
Macro-level studies have shown that overall productivity trends in Finland are largely driven by rapid productivity growth in ICT-providing industries in general and in communication equipment manufacturing in particular. In the above results industry-level effects are removed with the introduction of interacted industry and time dummies. Thus, industry-level productivity levels or trends do not drive the findings. It is nevertheless possible that within ICT industries the excess productivity of ICT-equipped labour is higher than in non-ICT industries.
Table 10.9 re-estimates the Column (2) specifications of Table 10.5 for the ICT (as proxied by industries 30, 32, 64, and 72) and non-ICT industries as well as for the communications equipment industry (32), which is commonly associated with Nokia.6 The sample sizes for the ICT and communications equipment industries are quite low and the results should thus be interpreted cautiously. Due to the small samples and the possible presence of one dominant company, weighted and non-weighted results are considered. Since industry dummies are not applicable for the
6. Due to data confidentiality laws the identity of firms has been hidden from us. We have not identified
Nokia from the sample and are unaware whether it is included or not in the ICT survey(s).

234
estimations for a single industry (leftmost section), the ICT and non-ICT results are provided without industry dummies to facilitate comparisons.
Comparison of the coefficients in the first row reveals that the impact of ICT seems to be much higher in ICT-provision. This finding is not driven by the communications equipment industry, which can be inferred from the coefficient estimates of the rightmost section. Some non-ICT coefficient estimates in the middle and rightmost sections are implausible, and thus cast doubt also on the ICT-related findings. It nevertheless seems that ICT-providers are able to reap higher benefits from their own ICT use as compared to non-ICT firms and employment.
Table 10.9. Labour productivity ( ���� ��
� � ) regressions with the share of labour using a computer at work as the ICT indicator for Non-ICT, ICT and communication equipment industries – pooled OLS with
fully robust standard errors
Non-ICT ICT (30, 32, 64, 72) Communic. eq. (32)
Weighted: No No Yes Yes No No Yes Yes No YesDummies: Time Time*Ind Time Time*Ind Time Time*Ind Time Time*Ind Time Time
ICT: comp. eq. 0.197*** 0.150*** 0.122** 0.058 0.463** 0.370 0.439* 0.505** -0.018 -0.200(0.038) (0.044) (0.053) (0.053) (0.201) (0.258) (0.252) (0.245) (0.432) (0.427)
CD: ln(K/L) 0.132*** 0.123*** 0.169*** 0.122*** 0.103*** 0.061** 0.107** 0.051 -0.037 0.054(0.018) (0.020) (0.026) (0.023) (0.034) (0.025) (0.042) (0.037) (0.080) (0.132)
CD: ln(labour) 0.016 0.009 0.016 0.014 0.067** 0.071*** 0.081*** 0.077*** 0.095* 0.186**(0.011) (0.011) (0.019) (0.012) (0.026) (0.025) (0.023) (0.026) (0.051) (0.091)
Firm: young -0.063 -0.077 -0.086 -0.133 0.145 0.112 0.263** 0.233* 0.624** 0.672**(0.059) (0.060) (0.079) (0.083) (0.100) (0.102) (0.108) (0.121) (0.280) (0.299)
Firm: old 0.058** 0.055** 0.127*** 0.057 0.095 0.046 0.056 -0.013 -0.350* -0.342(0.023) (0.024) (0.042) (0.039) (0.077) (0.081) (0.125) (0.127) (0.204) (0.272)
Ed.: tec., lo. -0.154 -0.105 0.014 0.135 -0.204 -0.370 0.781 0.586 -1.774* -2.487(0.094) (0.103) (0.226) (0.207) (0.396) (0.410) (0.688) (0.658) (0.926) (1.984)
Ed.: tec., me. 0.146 0.203* 0.365 0.614*** -0.058 -0.051 0.600 0.685 -4.423** -5.368**(0.103) (0.118) (0.257) (0.202) (0.334) (0.341) (0.554) (0.553) (1.739) (1.983)
Ed.: tec., hi. 0.237 0.298 0.855** 0.465 0.556 0.561 1.997** 2.238*** 5.734** 6.254*(0.256) (0.264) (0.337) (0.318) (0.356) (0.353) (0.852) (0.772) (2.659) (3.086)
Ed.: n.-tec., lo. -0.180 0.008 -0.089 0.343* -0.575 -0.518 -1.332 -0.229 -1.185 -0.720(0.122) (0.146) (0.233) (0.204) (0.394) (0.386) (0.880) (0.720) (1.358) (3.172)
Ed.: n.-tec., me. 0.184 0.217 0.363 0.371 -0.133 -0.174 2.763** 3.177*** 2.330 2.644(0.127) (0.136) (0.322) (0.241) (0.637) (0.633) (1.184) (1.046) (4.671) (7.801)
Ed.: n.-tec., hi. 0.892*** 0.992*** 0.483 0.996*** 0.039 -0.084 0.061 -0.323 -4.363 -12.056(0.194) (0.211) (0.385) (0.310) (0.707) (0.699) (1.401) (1.377) (3.253) (10.305)
Labour: young -0.044 -0.047 -0.383 -0.392** -0.120 -0.118 1.537** 0.650 0.186 -0.667(0.109) (0.111) (0.251) (0.186) (0.400) (0.401) (0.612) (0.519) (0.788) (1.722)
Labour: old 0.035 0.052 -0.347 -0.230 0.378 0.237 1.471*** 0.969* 0.639 0.218(0.128) (0.130) (0.266) (0.173) (0.421) (0.415) (0.550) (0.510) (0.779) (1.118)
Labour: females -0.393*** -0.322*** -0.459*** -0.419*** -0.006 -0.015 -0.576** -0.876*** -1.672** -2.087**(0.053) (0.067) (0.093) (0.115) (0.260) (0.254) (0.287) (0.296) (0.640) (0.979)
Observations 2,652 2,652 2,652 2,652 264 264 264 264 47 47Adj. R-squared 0.24 0.26 0.46 0.54 0.23 0.25 0.53 0.56 0.26 0.78
Note: ***, ***, and * respectively indicate significance at 1, 5, and 10 % level. Standard errors omitted.
235
10.4.4 The presence of a firm effect
The above results are consistent in large samples with a relatively weak set of assumptions. It is nevertheless true that pooled OLS is biased and inconsistent if the firm effect is correlated with any of the explanatory variables in (12). While we can easily do away with the firm effect by a suitable trans-formation, this introduces a new set of problems.
The time dimension of our data is quite short and the data is best characterised as a pooled cross-section rather than a panel, so we have a rather limited ability to deal with the possible presence of a firm effect in the usual manner. Furthermore, our firm identifiers based on legal units may be somewhat deficient in tracing the longitudinal linkages of firms.7 As noted above, only roughly 10% of the firms in the sample are observed for the three years considered. In particular, with such short panels it is impossible to capture the effects of ICT adoption if it requires a few years to embed ICT effectively into the production system. Pakes and Griliches (1984) find that investments made three to four years earlier have a greater impact on profitability than more recent investments. Lags seem to be even longer for the formation of intangible capital via R&D investments. Espost and Pierani (2003), Maliranta (2002), and Rouvinen (2002) find evidence that returns to the most recent R&D investments are quite insignificant. These studies suggest that the returns are the highest after about four years. Given the time-consuming and cumulative characteristics of building the tangible capital and knowledge stocks within firms, it may well be the case that regression analysis in levels captures the productivity effects of ICT more reliably than changes. Evidence on the time lag between ICT investment and its expected effects is scarce, although the findings of Brynjolfsson and Hitt (2002) suggest that the lag might be somewhere between three to seven years.
An additional practical problem is that the “within” variation of ICT measures during the observation period is rather small.8 Furthermore, it is very much dominated by noise resulting from a possibly serious errors-in-variable problem. Thus, estimates originated from “within” variation may be seriously biased towards zero.
We nevertheless estimated fixed effects and first differenced versions of the above model(s) as well as experimented with the Arellano-Bond type (Arellano and Bond, 1991; Arellano and Bover, 1995; Blundell and Bond, 1998) panel data estimators. This gave disappointing results not only on ICT but also on other explanatory variables. Even the capital-labour ratio, the one variable having almost certainly a positive effect on labour productivity, did not come out positively and significantly in all the cases, which makes one doubt the reliability of these estimates.
This leads us to consider alternatives in studying the robustness of the results in the above section. One obvious alternative is to consider the firm effect as an omitted variable and employ instrumental variable (IV) techniques to reach a consistent estimate of the coefficients. The usual IV suspects are not available in our case, as industry and regional aggregates cannot be used (for industry data)9 or are unavailable (for regional data) in our current data set. Indicators on the factors hampering ICT use are a potential set of instruments. Dummies indicating whether the “lack of qualified ICT
7. Structural changes have been particularly numerous and intense among Finnish firms in the 1990s as
compared to both other countries and earlier history. This is likely to weaken both the amount and the accuracy of within firm variation in our legal unit-based firm data. One option would be to make use establishment-firm links in order to produce “filtered” or “synthetic” firm units for the analysis.
8. In the case of the ICT indicators, the “between” variation (std. dev.) is from three and a half to seven and a half times larger than the “within” variation.
9. Note that the industry–time dummies already control for all industry-level variation.

236
personnel on the labour market hinders ICT use” and/or “market supply does not meet companies’ ICT needs” seem to satisfy the necessary and sufficient conditions of IVs.10 We instrumented the ICT indicator with these two IVs and estimate a weighted and non-weighted two stage least squares (2SLS) version of Column 2 in Table 10.5. With weights the ICT coefficient estimate is nearly zero with a large standard error. Without weights the ICT coefficient estimate is large and positive, but only significant at about 30% level.
10.4 Discussion
ICT and productivity studies typically estimate the elasticity of ICT capital. In order to compare our results to those obtained elsewhere, we derive a similar measure. Let us consider (3) without � , � , and � (subscripts � and ignored):
� �� ����� � � � � �� �� � � � �
where ���
� � �� � . Substituting back for � and taking logs yields
� ��� �����
� � �� �� �
Totally differentiating gives
���
���
����� � �
��
��
�
which is used to derive elasticity
� ����
��� ��� ��� ���
����� � � � � � �
� �� � �
� �� � �
� �
If we take the formula in (16), the estimates in the above section, and assume a 60% ICT-intensity, which roughly corresponds to our sample mean, we get an average elasticity of computer capital that is in the 5% to 6% range. We obtain a similar estimation result in an ICT capital elasticity specification. According to Kevin Stiroh (2003), the average elasticity of ICT capital of forty estimates in twenty international studies is about 5.4%. The elasticity of our measure of LAN capital is a little above 8%. Other results are qualitatively the same as those discussed above.
For the year 1998 we have detailed, albeit noisy, information on firms’ ICT-associated expenditures. Comparing these to the estimated labour productivity gains suggest that, on average, ICT investments do not boost profitability, i.e. associated expenses are roughly in line with the estimated labour cost savings. Younger firms, where the effects of ICT are highest, also spend more on ICT, but proportionally less so.
10. See, for example, Wooldridge (2002, pp. 83-4, 92, 105): (1) IVs must be partially correlated with the
variable to be instrumented once the other exogenous variables are netted out. Tested by regressing the variable to be instrumented on all exogenous variables and IVs. IVs are individually and jointly significant at conventional levels. (2) IVs must be redundant in the model. Tested by estimating the model with the IVs included as regressors. IVs are individually and jointly insignificant. (3) IVs must be uncorrelated with the error term. This cannot be tested precisely, as the true coefficient estimates are unobserved. We nevertheless study the correlation with the OLS residuals and found no evidence for it.

237
Conclusions
As shown above, widespread use of ICT is a recent phenomenon. Thus analysing its effects on productivity is challenging, especially if there is a time lag between the introduction of a technology and the effects it might generate. There is little research and certainly no consensus on the timing of performance gains from a given ICT investment, but according to Cisco Systems Inc. CEO John T. Chambers “… the greatest payoff doesn’t come until seven to nine years after an investment is made.” (Business Week, 17 February 2003, p. 45). Results by Brynjolfsson and Hitt (2002) indirectly suggest that the lag might be from three to seven years. Not only are there possibly lengthy lags, it has been suggested that the immediate effect of a technology investment may even be negative (Huggett and Ospina, 2001). Thus, if anything, our study is likely to point to the lower bound of the productivity effects of ICT use.11
Contrary to what was believed during the new economy boom, the increase in ICT use is largely a within firm phenomenon; the contribution of restructuring (between effect) to ICT diffusion is rather marginal (see section 10.2). Even though restructuring does not seem to drive overall diffusion, this is not to say that it would not have a role to play – quite the contrary in fact. Decompositions (see section 10.3) suggest that experimentation and selection is particularly intense among young ICT-intensive plants.
Evidence from the regressions (section 10.4) seems to indicate that, after controlling for industry and time effects as well as labour and other firm-level characteristics, the “lower bound estimate” of excess productivity of ICT-equipped labour ranges from 8% to 18%. The effect is often much higher in younger firms and in ICT-providing branches and – at least the immediate effect – can even be negative in older firms. The interesting findings with regard to firm age are consistent with the need for ICT-complementing organisational changes. The finding on ICT-providing branches is not driven by the communications equipment industry but rather by ICT services.
Overall, the ICT-induced excess productivity seems to be somewhat higher in services than in manufacturing. Manufacturing firms benefit in particular from ICT-induced efficiency in internal communication whereas service firms benefit form efficiency in external communication.
Our results also suggest that it is important to carefully control for human capital related characteristics of employment when studying the effects of ICT. If this is not done, the ICT-related results can be inflated. This suggests that ICT and human capital are certainly correlated and quite likely also complementary. We only find weak evidence for this complementarity, although the issue should be studied in more detail.
11. Also from a technical point of view we report the lower bound estimates, i.e. we report
����� rather than
���� �� � .

238
REFERENCES
Ali-Yrkkö, J. (2001), Nokia’s Network – Gaining Competitiveness from Co-Operation, Helsinki, Finland: Taloustieto Oy (ETLA B 174).
Ali-Yrkkö, J. (2003), “Nokia – A Giant in the Finnish Innovation System”, in G. Schienstock (Ed.), Finnish National Innovation System, Aldershot, Great Britain: Edward Elgar.
Arellano, M. and S. Bond (1991), “Some Tests of Specification for Panel Data: Monte Carlo Evidence and an Application to Employment Equations”, Review of Economic Studies, 58(2), 277-297.
Arellano, M. and O. Boyer (1995), “Another Look at the Instrumental Variables Estimation of Error-Components Models”, Journal of Econometrics, 68(1), 29-51.
Atrostic, B.K. and S.V. Nguyen (2002), “Computer Networks and US Manufacturing Plant Productivity: New Evidence from the CNUS Data”, CES Working Paper, 02(01).
Blundell, R. and S.R. Bond (1998), “Initial Conditions and Moment Restrictions in Dynamic Panel Data Models”, Journal of Econometrics, 87(1), 115-143.
Brynjolfsson, E. and L.M. Hitt (2002), “Computing Productivity: Firm-Level Evidence”, MIT Working Paper, 4210(01).
Ericson, R. and A. Pakes (1995), “Markov Perfect Industry Dynamics: A Framework for Empirical Work”, Review of Economic Studies, 62, 53-82.
Espost, R. and P. Pierani (2003), “Building the Knowledge Stock: Lags, Depreciation, and Uncertainty in R&D Investment and Link with Productivity Growth”, Journal of Productivity Analysis, 19, 33-58.
Foster, L., J. Haltiwanger and C.J. Krizan (2001), “Aggregate Productivity Growth: Lessons from Microeconomic Evidence”, in C. R. Hulten and E. R. Dean and M. J. Harper (Eds.), New Developments in Productivity Analysis (pp. 303-363), Chicago: University of Chicago Press (for NBER, National Bureau of Economic Research).
Griliches, Z. and V. Ringstad (1971), Economies of Scale and the Form of the Production Function: An Econometric Study of Norwegian Manufacturing Establishment Data, Amsterdam: North-Holland Publishing Company.
Huggett, M. and S. Ospina (2001), “Does Productivity Growth Fall after the Adoption of New Technology?”, Journal of Monetary Economics, 48, 173-195.
Ilmakunnas, P. and M. Maliranta (2003), “The Turnover of Jobs and Workers in a Deep Recession: Evidence from the Finnish Business Sector”, International Journal of Manpower, 24(forthcoming).

239
Jalava, J. and M. Pohjola (2002), “Economic Growth in the New Economy: Evidence from Advanced Economies”, Information Economics and Policy, 14(2), 189-210.
Jolliffe, I. T. (2002), Principal Components Analysis (2 ed.), New York, NY: Springer-Verlag.
Jovanovic, B. (1982), “Selection and the Evolution of Industry”, Econometrica, 50(3), 649-670.
Koski, H., P. Rouvinen and P. Ylä-Anttila (2002), “ICT Clusters in Europe: The Great Central Banana and Small Nordic Potato”, Information Economics and Policy, 14(2), 145-165.
Lehr, B. and F.R. Lichtenberg (1999), “Information Technology and Its Impact on Productivity: Firm-Level Evidence from Government and Private Data Sources, 1977-1993”, Canadian Journal of Economics, 32(2), 335-362.
Maliranta, M. (2001), “Productivity Growth and Micro-level Restructuring – Finnish Experiences During the Turbulent Decades”, ETLA Discussion Papers No. 757.
Maliranta, M. (2002), “From R&D to Productivity through Micro-Level Restructuring”, ETLA Discussion Papers, 795.
Paija, L. (Ed.) (2001), Finnish ICT Cluster in the Digital Economy, Helsinki, Finland: Taloustieto Oy (ETLA B 176).
Paija, L. and P. Rouvinen (2003), “Evolution of the Finnish ICT cluster”, in G. Schienstock (Ed.), Finnish National Innovation System, Aldershot, Great Britain: Edward Elgar.
Pakes, A. and Z. Griliches (1984), “Estimating Distributed Lags in Short Panels with and Application to the Specification of Depreciation Patterns and Capital Stock Constructs”, Review of Economic Studies, 51, 243-262.
Rouvinen, P. (2002), “R&D-Productivity Dynamics: Causality, Lags, and ‘Dry Holes’”, Journal of Applied Economics, V(1), 123-156.
Stata (2001), Stata Statistical Software: Release 7.0 User’s Guide (software manual), College Station, TX: Stata Corporation.
Stiroh, K. (2003), Reassessing the Impact of IT in the Production Function: A Meta-Analysis, mimeo.
White, H. (1980), “A Heteroscedasticity-Consistent Covariance Matrix Estimator and a Direct Test for Heteroscedasticity”, Econometrica, 48, 817-838.
Wooldridge, J. M. (2002), Econometric Analysis of Cross Section and Panel Data, Cambridge, Massachusetts: MIT Press.

241
CHAPTER 11
ENTERPRISE E-COMMERCE: MEASUREMENT AND IMPACT
Tony Clayton, Chiara Criscuolo, Peter Goodridge and Kathryn Waldron Office for National Statistics, United Kingdom
Abstract
Measurement of e-commerce in the United Kingdom, which started in 2001, has moved from assessment of usage by firms to analysis of its economic effects on firm performance. The pro-gramme of work at ONS has so far focused on analysis aspects of the technology adoption process which affect ability to identify performance effects, and the productivity and market efficiencies which can be detected from large scale surveys. This chapter brings together evidence from three UK sources, the enterprise e-commerce survey, the annual business inquiry and monthly producer price inquiries over the period 2000-2001. Despite the high levels of turbulence and change in electronic markets over this period, productivity modelling shows significant gains (and some losses) associated with electronic network use. The evidence suggests that some of these are related to the impact which e-procurement has on market prices.

242
11.1 Introduction
This chapter outlines work in ONS to improve measurement and understanding of information and communication technology (ICT), and how its use affects economic activity. It reviews data on technology adoption, and changes in firm behaviour associated with electronic transactions. It also summarises work to identify economic effects of e-commerce, through different survey sources
Survey measurement of e-commerce and Internet use is in its third year in the UK. ONS uses a variety of surveys to improve understanding of the role and impact of the information economy. Its current four main survey instruments are:
� An annual enterprise e-commerce survey, on Information and Communication Technology (ICT) use across all firm sizes, and the use of electronic transactions and e-business processes.
� Quarterly household surveys on Internet access and use for various purposes, on attitudes, and expenditure.
� A monthly survey of Internet Service Providers which tracks the growth in Internet accounts.
� Quarterly and annual surveys of investment at firm level, including investment in ICT hardware and software.
Much of the international work on the economic impacts of ICT to date has been based on growth accounting approaches. OECD and the ICT industry have questioned whether the United Kingdom reflects in its National Accounts the levels of investment in software shown in other major economies. This issue will be reviewed as sources improve and work to assess UK software capital using OECD methodology proceeds. However, recent growth accounting analysis by London Economics, making ICT investment assumptions based on Bank of England work, shows positive effects on productivity correlated with investment in ICT across a range of UK sectors (Muller 2003).
The work outlined in this paper takes a different approach. Instead of focusing on accounting relationships it uses survey micro-data to examine behaviour and performance of individual firms. It seeks evidence for patterns in their adoption of ICT, for changes in firm behaviour and for differences in firm performance resulting from technology. It also looks for evidence on market effects of electronic networks. Its purpose is to provide statistical evidence to support policy makers concerned with productivity and growth. ONS work in this area has been supported by a team of academic economists, and co-ordinated with parallel work in other OECD countries.
11.2 Technology adoption
The ONS e-commerce survey launched in 2000 is based on the Eurostat model. Among other items it gathers data on the adoption patterns and use of ICT by UK enterprises. The most recent survey published (Prestwood 2002) shows that among UK businesses with ten or more employees, only 11% used no form of PCs or workstations in 2001, and only 28% were not connected to the Internet. Employment weighted, these figures drop to 2% and 9%, showing that the impact of ICT and e-commerce on the economy and employees is larger than simple “firm count” data suggests. Data for 2002 will be published shortly.

243
The initial 2000 survey by ONS contained considerable detail on timing of ICT adoption. 40% of large firms had adopted network technologies by 1997 (Figure 11.1), with a further 23% adopting in 1998. The peak adoption period for small and medium sized enterprises followed in 1999/2000.
Figure 11.1. Year of adoption of network technologies by sizeband
0
5
10
15
20
25
30
Pre1995
1995 1996 1997 1998 1999 2000
% o
f bu
sine
sses
Small
Medium
Large
Source: E-commerce Survey 2000.
Definitions of network technologies here include Internet connection, the earlier, closed, technologies underpinning electronic data interchange (EDI) which have been developed since the 1980s, and Intranets within firms. ONS surveys make it clear that although Internet connection is the most common “standalone” application of network technology, it is often used alongside EDI or Intranet, particularly in medium and larger firms. This, together with evidence below on firm behaviour, suggests that the Internet has not replaced closed networks for electronic interactions between firms. Instead it seems to have broadened the options for firms which were already “connected” and created opportunities for those which were excluded from closed networks
11.3 E-commerce behaviour
Usage patterns relating technology adoption to development of e-commerce activity in the United Kingdom have been completed for 2000 data, and included in the OECD’s report on ICT Impacts (OECD, 2003). These confirm that established, closed trading networks still account for much electronic trading; sales over these are almost ten times greater than sales via Internet. Figure 11.2 shows business sales over the Internet and via “all electronic networks”, of which EDI is the largest element. In small firms (under 50 employees), the proportion of business sold over the Internet is half of all electronic sales, which implies that EDI and Internet sales are comparable. For large firms Internet sales are only around 10% of total network sales, with EDI and other systems accounting for the rest. This suggests the Internet is used as a point of entry to electronic trading for small firms, giving them access to electronic transactions already available to larger firms.

244
Figure 11.2. E-commerce sales as % of turnover, by sizeband
0
1
2
3
4
5
6
7
8
9
Small Medium Large
% e
-sal
es
sales via Internet only
sales via all networks
Source: E-commerce Survey 2000.
Analysing the pattern of e-commerce in ONS 2000 and 2001 surveys shows rapid change in activity. In 2000, as the “dot.com bubble” inflated, a majority of firms reporting e-commerce sales said that it accounted for less than 1% of their turnover. By 2001 this pattern changed significantly, with a greater number of firms for which Internet based e-commerce accounts for 1% of sales or more (Figure 11.3). However, in 2001 most firms for which e-commerce sales make up a majority of business are based on closed networks, not the Internet. Activity in these closed electronic systems, such as EDI, seems to have grown in response to Internet growth.
Figure 11.3. Business e-commerce sales via Internet, and via other networks
0
1
2
3
4
5
6
7
0.01 0.1 0.5 1 5 10 15 25 50 75 100
% sales via electronic networks
% o
f bu
sine
sses
Internet All electronic networks
Source: E-commerce Survey 2001.
Within this overall pattern of consolidation and growth of e-commerce, there is considerable firm level turbulence between the 2000 and 2001 surveys. Of firms responding in both surveys, and which did not sell through electronic networks in 2000, 30% said they had adopted some form of electronic selling by 2001. Of firms which were selling electronically in 2000, half increased their proportion of e-business, and 40% had either ceased electronic selling or scaled down their dependence on it (Clayton and Waldron 2003). The data shows a dynamic pattern, with experimentation and exit widespread. This must affect the ease with which we can identify impacts of e-commerce use.

245
11.4 International approaches to estimating productivity impacts of ICT
The most widely publicised studies of economic gains due to ICT adoption and use are those based on growth accounting studies, at country or sector level. These track relationships between inputs (capital, labour, material, ICT measures) and outputs over time, attributing part of any overall output increase to ICT. The availability of firm survey data permits an alternative approach.
The use of micro-level data to study the relationship between ICT and firm performance is now being undertaken in a number of countries. These studies draw on both official and private data sources and use different methodologies. Recent examples of some of the different approaches adopted are listed below:
� Inclusion of ICT capital stock at firm level as a separately identified capital input in labour productivity or total factor productivity (TFP) analysis (e.g. Brynjolfsson and Hitt, 2003; Hempell, 2002).
� Inclusion of ICT capital alongside other measures of ICT use, such as Internet use or number of employees using ICT (Maliranta and Rouvinen, 2003; Chapter 10).
� Inclusion of ICT capital stock together with measures on innovation and/or organisational change (van Leeuwen and van der Wiel; Brynjolfsson and Hitt, 2003; Chapter 7).
� Including measures of computer network use (behaviour) as an additional determinant of labour productivity or TFP in a productivity regression equation (e.g. Atrostic and Nguyen, 2002; Chapter 13).
Atrostic and Nguyen (2002) use the US 1999 manufacturing census combined with the US Computer Network Use Survey (CNUS), a large scale supplementary survey on computer network use. The CNUS asks firms about use of networks both inside and outside their operations and was completed by more than 38 000 firms. The information consists mainly of tick box measures of how computer networks are used for transactions, logistics, operations, and other steps in the business’ value chain. Of the firms reporting use of computer networks, only half were using them to buy or sell.
Using this dataset, Atrostic and Nguyen use regression analysis to test whether the presence of computer networks in 1999 was associated with increased total factor productivity (TFP). They conclude that the use of computer networks increased TFP by about 5%, and that this result is robust to different model specifications and to selection. Superior performance by electronically networked firms could be due to:
� Use of networks inside firms facilitating more effective process control and resource use.
� Use of networks between firms reducing transaction costs and improving coordination.
� Reduction in search costs changing the way in which markets operate.
11.5 UK data on e-commerce use and business performance
In the UK, survey data to compile firm level ICT capital estimates is still under development. Our analytical approach has therefore been based on firm behaviour, using methodology similar to that for the US. Initial attempts to link detailed data from the first round enterprise e-commerce survey to

246
productivity data from the UK Annual Business Inquiry (ABI) did not deliver sufficiently large samples for productivity analysis. Therefore an alternative source was needed.
For the UK the largest source of information comparable to that available in the United States is provided by qualitative questions added to the ABI from 2000 onwards (Figure 11.4). These ask firms to indicate whether they use electronic networks to place orders for goods and services, or to receive orders. This covers Internet transactions, or buying and selling over closed networks, and is, in line with the OECD’s “broad definition” of e-commerce use.
Figure 11.4. ABI questions on e-commerce
E-commerce
If you use the Internet, electronic data interchange or any other network to :
� Place orders for goods or services, please enter “1” in the box provided. If not, please enter “2”. �
� Receive orders for goods or services, please enter “1” in the box provided. If not, please enter “2”. �
Responses to these questions are available for over 6 000 manufacturing reporting units in 2000
and 5 500 in 2001, and for each of these we have employment and output data which permits productivity to be calculated. This compares to an overlap of 650 manufacturing firms between the ARD and the E-commerce Survey in 2000 and around 1 600 in 2001.
11.6. What the data shows
Unlike US data, the ABI survey does not identify reporting units that use computer networks generally, but only those which use them for buying and selling. This means our study is different from Atrostic and Nguyen, but this limitation has been used to advantage. There is interest in looking at the effect of e-commerce as a means of procurement or of supply chain management separately from other applications. So far this has been led by evidence from case studies. Adoption of electronic procurement systems by firms is claimed to improve efficiency by cutting internal administration costs and speeding up purchasing processes, by improving price transparency, and by reducing search costs. Anecdotal evidence from industry providers of e-commerce systems, and cases from the European Union’s e-business w@tch programme, suggest we should expect e-procurement to have a positive effect on productivity.
Figure 11.5 below shows that firm level data supports this hypothesis. Value added per employee is shown for over 7 000 UK firms, under four headings:
� Firms which do not use e-commerce at all (none).
� Firms which use it for either buying or selling (either).
� Firms only using e-commerce for selling (sell).
� Firms using e-commerce only for buying (buy).
Data for 2000 is taken from the final ABI, that for 2001 from provisional results.

247
Figure 11.5. Productivity in UK manufacturing firms
(value added per employee, in thousand £)
27
28
29
30
31
32
33
34
35
36
37
none either sell buy
2000 2001
Source: ABI 2000/2001.
The group with the highest value added per employee – in both 2000 and 2001 – is of firms which only use e-commerce for buying. The lowest is of firms which use e-commerce only for selling. This may suggest efficiency effects associated with e-procurement, but also price effects. Differences may be driven by other effects. As the descriptive data in Tables 11.1 and 11.2 shows, reporting units that carry out e-buying and e-selling are larger and more capital intensive than reporting units which do not, besides having higher labour productivity.
Table 11.1. Characteristics for 2000
2000 none either sell buy Sell no buy Buy no Sell Buy and Sellobs 3365 1771 2310 2812 1269 502 1041
EMP mean 184 350 349 378 302 354 387sd (414) (852) (776) (992) (533) (1138) (928)
GO/EMP mean 97.34 108.91 108.69 117.64 94.06 109.95 120.69sd (128.86) (160.41) (168.43) (188.44) (93.63) (116.74) (210.12)
VA/EMP mean 30.47 33.68 32.82 35.87 29.95 37.61 35.18sd (34.60) (34.32) (31.93) (38.92) (24.17) (43.49) (36.95)
K/EMP mean 55.28 55.79 55.20 57.86 52.28 58.53 57.60sd (85.32) (73.74) (74.66) (79.73) (62.12) (69.37) (83.49)
Table 11.2. Characteristics for 2001
2001 none either sell buy Sell no buy Buy no Sell Buy and Sellobs 2622 1978 2398 2964 1412 566 986
EMP mean 192 337 350 359 292 282 390sd (467) (729) (772) (809) (529) (502) (902)
GO/EMP mean 109.18 111.50 108.21 118.19 98.07 125.42 115.29sd (200.77) (121.87) (117.38) (136.47) (83.80) (138.52) (135.59)
VA/EMP mean 33.17 33.66 32.50 35.28 30.43 38.61 33.94sd (53.79) (32.08) (28.23) (34.72) (25.69) (44.56) (29.79)
K/EMP mean 57.92 60.16 58.20 62.99 54.48 68.49 60.79sd (99.56) (73.69) (70.56) (79.95) (58.80) (85.26) (77.64)
Note: Figures reported are unweighted averages. Standard deviations in parentheses.
Source: Authors’ own calculations using ARD 2000 and 2001.

248
The effects of e-commerce appear to be consistent between the two years, but possibly more pronounced in proportional terms for value added than for gross output. In both years the “e-buy only” group appears to have a higher capital/labour (K/EMP) ratio; this is consistent with accounts from industry sources that firms with e-procurement systems are likely to be more sophisticated. To control for the role of other factors (size, capital intensity, or industry) regression analysis similar to that by Attrostic and Nguyen has been completed.
11.7 Regression analysis
Our analysis using UK ABI data has set out to take account of all the factors in the US work, plus multinational effects which earlier studies have shown to be important (Criscuolo and Martin 2003). It covers only the manufacturing sector, because firm level capital stock data is not yet available for services.
The regression model is a Cobb-Douglas production function of the form:
Q AK L M� � ��
where K, L and M are capital, labour and materials inputs (all available from the ABI). A is a technology change term which shifts the production function, and is a function of the use of computer/electronic networks for buying or selling, of the form:
0 1exp( )A eActivity� ��
and where eActivity has the value 1 if a reporting unit uses an electronic network for buying or selling, as appropriate, and zero if it does not. The equation on which regression is based is therefore:
0 1ln ln ln ( 1) lnQ K M
eActivity L uL L L
� � � � � � �� � � � � � � � � � � �� � � � � �
The eActivity term in the analysis is split into a number of dimensions for different specifications of the model, to show separately the effects for:
� Firms using computer networks for selling.
� Firms using computer networks for buying.
� Firms using networks for either buying or selling.
� Firms using networks for both buying and selling.
The reason for investigating selling and buying separately is to distinguish between “market effects” and internal effects. Market effects from e-selling could be positive for a firm due to increased market size and ability to grow or negative due to tougher competition. Market effects from e-procurement could be due to access to more supply sources, to better collaborative working, or to better pricing conditions. Expected effects of e-commerce on internal efficiency may be due to reduced transaction costs, and to better information and process flows within the firm.

249
The analysis controls for:
� Reporting unit size, as represented by number of employees.
� Industry sector and region.
� Ownership (both multinationality which has a major influence and foreign ownership).
� Age of reporting unit.
� Macroeconomic shocks as measured by year dummies.
Results have been developed using labour productivity as measured by gross (sales) and net (value added) measures of total factor productivity, and for value added per employee (Table 11.3). All show positive statistically significant effects of e-procurement on productivity. As shown in columns 2 and 8, negative correlation exists in the value added specifications between the use of computer networks for selling and labour productivity, and for TFP.
Table 11.3. Regression results
(1) (2) (3) (4) (5) (6) (7) (8) (9)
e-buy or sell 0.020 0.001 0.009
(0.013) (0.007) (0.012)
e-sell -0.045 -0.012 -0.048
(0.015)*** (0.008) (0.014)***
e-buy 0.078 0.023 0.070
(0.015)*** (0.008)*** (0.014)***
e-sell, no buy -0.036 -0.021 -0.046
(0.018)* (0.009)** (0.017)***
e-buy, no sell 0.093 0.008 0.074
(0.022)*** (0.014) (0.021)***
e-buy & sell 0.031 0.014 0.021
(0.016)* (0.008)* (0.015)
Observations 11497 11656 11433
Labour productivity
Dependent variable: value added Dependent variable: gross output Dependent variable: value added
Total factor productivity Total factor productivity
Note: Robust standard errors in parentheses. Unreported regressors are:
– For columns 1-3: ln employment; columns 4-6: ln employment, ln (capital/employment), ln (materials/ employment).
– Columns 7-9: ln employment, ln (capital/employment). All regressions also control for age of firm, ownership (multinational, foreign dummies), industry, region and year.
In unreported results we take account of possible endogeneity problems with the eActivity variable. We assume, as Atrostic and Nguyen do, that high productivity firms are more likely to carry out e-commerce. Using a two-stage estimation procedure, with computer related expenditure in prior periods as an instrumental variable, we conclude that the UK result is robust, and comparable to those achieved in the United States.

250
11.8 Interpreting the regression results
Buying vs. selling
The regression results show an overall positive effect on firm productivity – on all the three measures listed above – associated with use of computer networks for trading. However, a comparison of the gross output result with the value added results shows that pricing effects play a large part in the differences. Gross output results show a 2.3% gain in output associated with e-procurement. However, the value-added results show gains associated with e-procurement between 7% and 9%, and a loss of value added associated with e-selling of between 2 and 5%. The most likely explanation for the loss to sellers appears to be due to pricing effects.
Industry sources suggest that at least part of the gain from investment in electronic procurement by firms comes from the ability to use better price transparency to secure more competitive deals. Part of this comes from efficiency gains, but part is likely to be at the expense of suppliers. A well documented example of case evidence was provided by Siemens to the DG Infso e-business w@tch workshop in November 2002, emphasising that procurement savings to the company came from both internal and external sources.
Larger vs. smaller firms
A hypothesis advanced from case evidence is that the “price effect” which may benefit firms through e-procurement is partly due to large firms using electronic markets to strengthen their position at the expense of smaller ones. For example, if a large multinational firm has a procurement system which enables it to put all its purchasing requirements out to international tender, and buy in a global market, while smaller suppliers tend to be local, unable to access wider markets, then smaller firms could be disadvantaged. Smaller buyers may find it difficult to buy electronically in international markets, and therefore to secure gains available to larger firms.
To test this possibility, the productivity analysis for 2000 and 2001 has been split between:
� Reporting units which are smaller than the median reporting unit in their four digit sector, as measured by employment (and likely to include firms with low market share).
� Reporting units which are larger than or equal to the median reporting unit in their four digit sector, as measured by employment (and likely to include firms with high market share).
Unreported results show that the productivity effects associated with e-buying and with e-selling are almost equally strong in large and small firms. Both show value added productivity loss associated with e-selling, and coefficients are larger for large firms than for small. Both groups of firms show value added productivity advantages associated with e-procurement, with coefficients for the large firms only marginally bigger than for the small.
Integration
Policy makers have put forward the hypothesis that firms which both buy and sell are likely to be more “integrated” in terms of their network use, and therefore show greater efficiency gains from ICT use. This is tested in the “e-buy and sell” results above, and does not seem to be strongly supported. Units which both buy and sell, appear to have additional productivity advantage in only two of the six specifications of the regression model tested (columns 3 and 6, table 3), the one for labour pro-ductivity.

251
Regression conclusions
Comparison of UK results with Atrostic and Nguyen’s for the United States suggests that they are consistent, but with e-procurement, as opposed to computer networks, having a measurable positive impact on firm level productivity. However, it seems possible that both approaches may understate the productivity impact of ICT at firm level:
� Our analysis because it takes no account of e-business processes which are unrelated to buying or selling and which Atrostic and Nguyen found to be an important part of overall network use; in our analysis, firms using networks in this way are categorised as “non users”.
� Atrostic and Nguyen because their data does not distinguish e-commerce between buying and selling, and the analysis may therefore be unable to separate out the partly offsetting “market effects” on both sides of transactions.
To overcome these and other analytical difficulties, the “ideal” dataset for analysing computer network use effects should have a longitudinal dimension, to permit analysis of usage and effects over time, and would include:
� Distinction between network use for buying and selling.
� Records of network use for other purposes (as included in the latest UK e-commerce survey).
It would also include firm level data on ICT capital, so that we could distinguish between the investments firms make in technology and the use they make of it.
11.9 Economic effects of e-commerce on prices
Literature on the price effects of digital markets (reviewed in Smith, Bailey and Brynjolfsson, 2000) covers a complex set of possible effects, which depend on the types of transactions covered.
For simple products which can be specified in relatively few dimensions, electronic markets may increase price transparency and commoditisation, raising the importance of price in buying decisions which may tend to push prices down. For more complex products, where differentiation is possible there may be added scope, through the one to one relationship between buyer and seller permitted by e-commerce, for price discrimination based on specific buyer circumstances, increasing both price dispersion and level.
Electronic transactions may affect market boundaries in opposite ways. Lower search costs for buyers may enable them to seek more suppliers, tipping the balance of supply and demand in their favour and edging prices down. On the other hand, the investment required by suppliers in some EDI type closed electronic purchasing systems may limit entry, reducing scope for competition; but once made such investment may act as a barrier to exit, so that competition in supply increases over time.
Interviews with firms which provide the infrastructure and databases on which electronic transaction systems are based have confirmed that gains through the management of backward supply chains are among the most important ex-ante justifications for investment for firms. The sources of cost saving for them are both internal and external, reducing the search and administrative costs associated with buying, and reducing purchase prices through access to a broader and better specified set of suppliers.

252
One system supplier specialist interviewed qualified the experience of price effects by commenting that in their experience the effect of electronic buying and selling depends on the relative numbers of buyers and sellers, as well on the nature of the transactions. In markets where there are a large number of sellers making sales propositions to fewer buyers, the most likely outcome is downward pressure on prices, but where a larger number of buyers face a small number of sellers the effect of electronic networks is to exert upward pressure on prices. These considerations were said to affect the design of buying/selling networks.
E-commerce can also change the nature of transactions. Adoption of systematised e-procurement models by firms often changes relationships with suppliers from a negotiation process towards long term agreements into a series of auctions and bids for specific, shorter term, contracts which are likely to be more intensely competitive. Against this, use of electronic networks for purposes in addition to the purchase decision can facilitate the delivery of value added services as part of a more intimate partnership between suppliers and customers in the value chain.
The most dramatic effects of e-commerce can arise when suppliers use it to sell direct to their end users, cutting out a stage in the distribution chain; the best known example of this is Dell computers, selling direct to consumers and by-passing PC retailers.
One further difference between electronic sales and traditional marketing approaches is that the ability of suppliers to change prices quickly and cheaply using web-based price lists is greater. For example, traditional catalogue selling organisations were restricted to changing prices, via catalogues, two or three times a year to avoid unacceptably high costs; with web based selling they can change prices from day to day, and target offers at selected customers whose buying patterns are known. Greater price flexibility and speed of response to shocks may be expected.
Many of these effects have been identified, but not often quantified, in the OECD E-Business Impact Programme (EBIP) which brings together e-commerce experiences from a number of countries (see www.oecd.org/sti/information-economy). The quantified evidence quoted by Smith Bailey and Brynjolfsson (2000) tends to come from consumer Internet markets (which still account for a small minority of e-commerce in the UK) rather than from digital business to business markets. This evidence seems to suggest that consumer prices are as likely to have risen as to have fallen over the Internet, and that price dispersion has, on the whole, been unaffected.
11.10 UK survey data on producer prices, linked to e-commerce
Based on our results from section 11.6 above, using ABI data to identify large numbers of manufacturing businesses which do, and do not, use electronic networks for selling, we are able to test the behaviour of prices in UK firms as a function of their use of e-commerce, mainly in business to business markets. So far we have conducted only a limited test covering firms identified for the year 2000, but it suggests that results are statistically significant and worth further investigation as additional years’ data become available.
To undertake this analysis, the following indirect data linking exercise has been undertaken. From the ABI responses to the e-commerce questions shown in Figure 11.4, the use / non use of electronic networks for selling has been identified for firms in 40 SIC sectors and sub-sectors where e-commerce is known to be significant. Through identifiers from the UK business register (IDBR) the firms have been matched with those that respond to the monthly UK producer price inquiry (PPI). This inquiry asks a large number of firms for monthly quotes for specific, detailed, products on a consistent and confidential basis.

253
The PPI results are summarised in a database which captures monthly movements for the prices returned, corrected for any changes in quality specification which occur. Based on January 1995 = 100, the “price relatives” for each specified product show its movement since the base date. These are weighted together according to value of output from each respondent to develop the UK Producer Price Index dataset.
For this analysis we are only able to identify firms that sell electronically in the year 2000, not the specific products they sell over electronic networks, or the year in which they might have started selling over electronic networks. To test for possible differences, the first approach has been to separate the PPI sets for firms which do, and do not, sell electronically within each SIC, taking the firm identifier as the definition of industrial classification (which may not be the same classification as the products quoted).
We have then weighted the price relatives equally within each of the two sets (e-sellers and non e-sellers), because we are concerned to identify possible differences between trends in the two sets of data than to reproduce the Producer Price Indices. Only in about 30% of cases do the two datasets (PPI and ABI) overlap, so price data is only available for a partial set of the firms on which our productivity evidence is based
Results show a very mixed pattern reflecting the range of economic forces at work, and summarised in section 11.9 above. Figures 11.6 to 11.10 at the end of the paper show specific sectors as examples. Each graph shows the evolution of average price relative data for e-sellers and for non e-sellers month by month over the period January 1997 to December 2000. Each individual price relative series is based on January 1995 = 100, and the individual series are equally weighted to produce the average. They appear to show different effects in different markets, and we have grouped them into five main patterns of price behaviour over time.
i) Sectors where prices diverge in the period, and e-sellers’ prices fall relative to non e-sellers
This group (Figure 11.6) includes pharmaceuticals manufacture (177 firms observed), where e-commerce systems have been adopted by major pharmaceutical wholesalers over the period as part of the process of increasing competition in a regulated market. It also includes mechanical engineering (32 firms observed), which is a relatively heterogeneous sector subject to increasing international competition over the period.
ii) Sectors where e-sellers’ “non e-sellers” prices diverged between 1995 and 1997, and where e-sellers’ prices remained lower through to 2000
This group (Figure 11.7) includes food products in both meat processing (125 observations) and bakery production (67 observations) which sell a large part of their output to supermarkets, all of whom have used electronic procurement systems based on closed (EDI) systems for some time.
iii) Sectors where e-sellers’ prices had fallen relative to non e-sellers’ prior to 1997, and appear to re-converge by 2000
This group (Figure 11.8) includes basic organic chemicals (191 observations) and pesticides and agrochemical products (41 observations). In both these sectors there are effectively global markets, and there has been substantial international consolidation of supply during the later 1990s. These sectors are also subject to input price shocks from the oil market, to which they adjust with varying degrees of speed.

254
iv) Sectors where prices for the two groups are indistinguishable
This group (Figure 11.9) includes electronic components (137 observations) and newspaper publishing (118 observations), both areas related to sectors where e-commerce is well established, and has influenced markets for a considerable time. In such markets it is possible that competition has ensured that prices have stayed aligned. It is worth noting that in productivity analysis by sector (not reported here) publishing and computer manufacture were the two sectors in which value added/employee productivity measures for e-sellers were higher than for e-buyers.
v) Sectors where e-sellers’ prices are higher than non e-sellers’
This group (Figure 11.10) includes manufacture of parts for motor vehicles (148 observations) and manufacture of soap and detergents (58 observations). These are both sectors where intermediate demand includes both major brand owners who purchase for inclusion into branded consumer products, and “spot” demand for other applications. It may be that differences in service levels or specification account for the differences.
11.11 Initial conclusions on price effects of e-commerce
UK price evidence from this limited set supports the view from the literature that a range of forces are at work to affect prices in electronic markets. Across all the 21 groups examined, the sectors in which e-sellers’ prices are lower (groups i to iii above) outnumber those where there is no difference, or where e-sellers’ prices are higher. Overall therefore, it seems that the effects of reduced search costs, price transparency and rapid supplier reaction associated with electronic marketing and sale of goods is likely to have a negative impact on prices – but there is a great deal of variation depending on market conditions.
This conclusion is supported by regression analysis for 2 400 reported price series across forty four digit sectors in manufacturing for which we have data, each series monthly over four years. The results suggest that the electronic receipt of orders has a negative impact on relative prices which is statistically significant at the ten per cent level, after taking sector and size effects into account. The sample contains all firm level observations of relative prices for the selected sectors between January 1997 and December 2000 where real responses are available. Monthly price trends and sector effects have been controlled for using monthly and industry dummies, the latter using four digit SIC codes.
Next steps in this work are to generalise it across all sectors for which PPI data is available, and to test whether the conclusions on price effects and competition due to e-commerce are robust. The comparison of these results with our productivity conclusions for manufacturing suggest – in most areas – that they should be.

255
Figure 11.6.
1513 Production of meat and poultry products
90
92
94
96
98
100
102
104
106
108
110
Jan-97
Apr-97
Jul-97
Oct-97
Jan-98
Apr-98
Jul-98
Oct-98
Jan-99
Apr-99
Jul-99
Oct-99
Jan-00
Apr-00
Jul-00
Oct-00
e-sellers non e-sellers
1581 Manufacture of bread; manufacture of fresh pastry goods and cakes
98
100
102
104
106
108
110
Jan-97
Apr-97
Jul-97
Oct-97
Jan-98
Apr-98
Jul-98
Oct-98
Jan-99
Apr-99
Jul-99
Oct-99
Jan-00
Apr-00
Jul-00
Oct-00
e-sellers non e-sellers

256
Figure 11.7
2852 General Mechanical Engineering
92
94
96
98
100
102
104
106
108
Jan-97
Apr-97
Jul-97
Oct-97
Jan-98
Apr-98
Jul-98
Oct-98
Jan-99
Apr-99
Jul-99
Oct-99
Jan-00
Apr-00
Jul-00
Oct-00
e-sellers non e-sellers
2442 Manufacture of pharmaceutical preparations
94
96
98
100
102
104
106
108
110
112
114
Jan-97
Apr-97
Jul-97
Oct-97
Jan-98
Apr-98
Jul-98
Oct-98
Jan-99
Apr-99
Jul-99
Oct-99
Jan-00
Apr-00
Jul-00
Oct-00
e-sellers non e-sellers

257
Figure 11.8
2414 Manufacture of other inorganic chemicals
60
65
70
75
80
85
90
95
100
Jan-97
Apr-97
Jul-97
Oct-97
Jan-98
Apr-98
Jul-98
Oct-98
Jan-99
Apr-99
Jul-99
Oct-99
Jan-00
Apr-00
Jul-00
Oct-00
e-sellers non e-sellers
2420 Manufacture of pesticides and other agro-chemical products
85
90
95
100
105
110
115
Jan-97
Apr-97
Jul-97
Oct-97
Jan-98
Apr-98
Jul-98
Oct-98
Jan-99
Apr-99
Jul-99
Oct-99
Jan-00
Apr-00
Jul-00
Oct-00
e-sellers non e-sellers

258
Figure 11.9
3210 Manufacture of electronic valves and tubes and other electronic components
70
75
80
85
90
95
100
Jan-97
Apr-97
Jul-97
Oct-97
Jan-98
Apr-98
Jul-98
Oct-98
Jan-99
Apr-99
Jul-99
Oct-99
Jan-00
Apr-00
Jul-00
Oct-00
e-sellers non e-sellers
2212 Publishing of newspapers
100
102
104
106
108
110
112
114
116
118
120
Jan-97
Apr-97
Jul-97
Oct-97
Jan-98
Apr-98
Jul-98
Oct-98
Jan-99
Apr-99
Jul-99
Oct-99
Jan-00
Apr-00
Jul-00
Oct-00
e-sellers non e-sellers

259
Figure 11.10
24511 Manufacture of soap and detergents
90
92
94
96
98
100
102
104
106
108
110
Jan-97
Apr-97
Jul-97
Oct-97
Jan-98
Apr-98
Jul-98
Oct-98
Jan-99
Apr-99
Jul-99
Oct-99
Jan-00
Apr-00
Jul-00
Oct-00
e-sellers non e-sellers
3430 Manufacture of parts and accessories for motor vehicles and their engines
100
101
102
103
104
105
Jan-97
Apr-97
Jul-97
Oct-97
Jan-98
Apr-98
Jul-98
Oct-98
Jan-99
Apr-99
Jul-99
Oct-99
Jan-00
Apr-00
Jul-00
Oct-00
e-sellers non e-sellers

260
REFERENCES
Atrostic B.K. and S. Nguyen (2002), Computer Networks and US Manufacturing Plant Productivity, New evidence from the CNUS Data, Centre for Economic Studies, January 2002.
Brynjolfsson, E. and L.M. Hitt (2001), “Computing Productivity: Firm-Level Evidence”, MIT Sloan Working Paper No. 4210-01, Nov. 19.
Clayton T. and K. Waldron (2003), “E-commerce Adoption and Business Impact, A Progress Report”, Economic Trends, ONS, February 2003.
E-business Impact Programme (EBIP) at www.oecd.org/sti/information-economy
Maliranta, M. and P. Rouvinen (2003), “Productivity Effects of ICT in Finnish Business”, Discussion Papers, No. 852, Helsinki: ETLA, Elinkeinoelämän Tutkimuslaitos, The Research Institute of the Finnish Economy.
Muller P. (2003), “ICT and GDP Growth in the United Kingdom, A Sectoral Approach”, London Economics, February 2003.
OECD (2003), ICT and Economic Growth – Evidence from OECD Countries, Industries and Firms, OECD, Paris.
Prestwood D. (2002), “2001 E-commerce Survey of Business”, ONS First Release, 22 August 2002.
Smith M., J. Bailey and E. Brynjofsson (2000), Understanding Digital Markets; Understanding the Digital Economy, ed. Brynjolfsson and Kahin, MIT Press.
Van Leeuwen, G. and H. Van der Wiel (2003), ICT, Innovation and Productivity, CAED Conference 2003, London.

261
CHAPTER 12
PRODUCTIVITY SLOWDOWN AND THE ROLE OF ICT IN ITALY: A FIRM-LEVEL ANALYSIS
Carlo Milana, Istituto di Studi e Analisi Economica (ISAE)
Alessandro Zeli, Instituto Nazionale di Statistica (ISTAT)
Abstract
This paper presents a firm-level analysis of the recent productivity slowdown in Italy. It applies Data Envelopment Analysis (DEA) techniques to firm-level data collected through the annual surveys on the economic accounts of enterprises carried out by the Italian National Statistical Institute (ISTAT). The paper also measures TFP changes that occurred during the years 1996-1999 for 31 industries and breaks these down into technological change (a shift in the production frontier) and changes in relative technical inefficiency (due to modifications in the distance of single firms from the frontier). This decomposition is helpful in interpreting the nature of the observed productivity slowdown. Econometric regressions of firms’ TFP changes for a number of variables, including a component pointing to the ratio of ICT in total capital input, reveal that information and communication technologies appears to have had a positive and significant impact on TFP in all industries during the period examined.

262
12.1 Introduction
Over the past decade, the Italian economy has suffered from stagnant total factor productivity (TFP).1 This is in contrast with the upsurge of productivity growth experienced in other industrialised countries, notably the United States, Canada, Australia and Scandinavian countries.2 The United Kingdom has registered non-negligible TFP growth, even if it decelerated during the second half of the decade.3 In continental Europe, France and Germany have had relatively low productivity growth, but have not shown the stagnation observed in Italy.
Explaining why Italy has been lagging behind other industrialised countries in productivity growth may help define policies oriented towards fostering economic growth and the international competitiveness of domestic firms. It may also be of interest to know to what extent productivity gains or losses are distributed across sectors of the economy and whether these affect the operating surplus of firms.
Moreover, the recent debate on the impact of new information and communication technologies (ICT) on TFP is still open as regards continental European countries. It remains to be confirmed whether ICT is an important factor for enhancing firms’ capacity to improve productivity and net income. A number of recent studies have pointed towards a positive correlation between the intensity of use of ICT and productivity performance. However, these have been confined to the growth accounting framework, i.e. an assessment of the direct contribution of ICT capital as a factor of output growth (see, for example, Daveri, 2000, 2001 and, more recently, Bassanetti, Cruciani, Jona Lasinio and Zollino, 2003, for the case of Italy). A question that is perhaps more relevant, concerns the indirect effect of ICT on output growth via induced technological change and productivity growth. This has thus far remained unexplored.
In particular, the growth accounting methodology misses, by its very nature, the role of ICT in increasing productivity through induced changes in the production technology. In fact, the methodology does not fully consider the role of capital as a vehicle of innovation and technological change.4 Moreover, the empirical weight of ICT capital input is generally relatively low and can only account for a marginal part of overall output growth. More relevant, instead, can be the indirect contribution of ICT to output growth through the changes it induces in the technology and organisation of production.
This paper attempts to measure total factor productivity growth for a large number of industries using micro data of firms. Average TFP growth within industries is measured by taking the weighted average of firms’ TFP growth rates, which can be broken down into changes in the best-practice frontier (technological change), and changes in firms’ distance to that frontier (changes in relative technical efficiency). The influence of ICT on TFP growth is also studied by means of econometric regressions. The elasticity of TFP with respect to ICT is estimated by taking into account the simultaneous influence of other determinants.
1. See, for example, ISAE (2001, pp. 74-79) (2003, pp. 57-64).
2. See Gust and Marquez (2002).
3. Basu, Fernald, Oulton and Srinivasan (2003) offer a detailed discussion of the UK experience.
4. The neoclassical models of growth have been criticised on a similar point by the theoretical literature on endogenous growth that has pointed out beneficial effects from capital accumulated externally and in economic system as a whole.

263
The micro data obtained from the annual surveys of the Italian National Statistical Institute (ISTAT) on the economic accounts of enterprises permit us to analyse productivity performance over time and across industries at the level of firms. The empirical study presented here has been made by taking three steps:
1. Non-parametric techniques derived from Data Envelopment Analysis (DEA) are applied to micro data to construct the best-practice or technological frontiers of production within the industries examined.
2. Malmquist index numbers of total factor productivity growth of single firms within each industry are calculated. These are broken down into technological changes and changes in technical efficiency. Technological changes are measured as shifts in the best-practice frontier within the same industry, whereas changes in technical efficiency are measured by estimating changes in firms’ distance to that frontier.
3. Econometric regressions are used to examine correlations between productivity performance and relevant explanatory variables, including the intensity of use of information and communication technologies (ICT) and other types of capital goods (tangible capital, human capital and stocks of R&D).
The paper is organised as follows. The second section presents the methodology of the analysis. The third section describes the data used. The fourth section presents the empirical results obtained. The fifth section contains conclusive remarks.
12.2 The methodology
12.2.1 Measuring TFP, relative technical efficiency and technological change
The empirical analysis starts with the identification of the best-practice (or technological) frontier of production in each examined industry. This frontier is defined as the set of the most efficient production points in the space of outputs and inputs. One of the methods that can be used to identify this set is Data Envelopment Analysis (DEA), a linear programming technique by which the production frontier is established as the convex shape that is formed by the most efficient production points. Using DEA results, Färe, Grosskopf, Norris, and Zhang (1994) have constructed the Malmquist index of TFP growth, defined by Caves, Christensen and Diewert (1982), and have shown how these indexes can be decomposed into changes in firms’ distance to the efficient frontier (technical efficiency change) and shifts in the frontier itself (technological change).
The DEA technique applies a separate linear programming problem to each of the firms or production units within an industry. Consider N firms in each industry (with N varying across the examined industries). Let the inputs and outputs of the ith firm be respectively represented by the K-order column vector xi and the M-order column vector yi. The input and output data for all N firms
form the K�N input matrix X and the M�N output matrix Y, respectively.
Assuming the general case, which includes variable returns to scale, the output-oriented measure of the ith firm’s technical efficiency is derived from the data envelopment form defined by the following optimisation problem:

264
ii��� ,max (1)
subject to: Mii yY 0����
Ki Xx 0��� � 11’ ���N
N0��
where 1� i<�, with i being a scalar, is an N-order column vector of constants, N1 is an N-order
column vector of ones. The convexity constraint (N1’· = 1) ensures that an inefficient production unit is only "benchmarked" against production units of a similar size.5 The value ( i - 1) is the
proportional increase in output(s) that could be obtained by the ith production unit with the input quantities held constant. The output-oriented measure of technical efficiency (TEi) of the ith
production unit is given by:
iiTE �
1� (2)�
TEi varies between zero and one (0< TEi �1, where TEi = 1 means that the ith production unit is fully
efficient and operates on the best-practice frontier).
Technical efficiency measures can be depicted in Figure 12.1a in the case of constant-returns to scale and in Figure 12.1b in the case of decreasing returns to scale. The technology is represented, for simplicity, by the one-output one-input linear frontier. For the inefficient production unit operating at point P, the Farrell input-oriented measure of TE corresponds to AB/AP, while the output-oriented measure of TE corresponds to CP/CD. As can be seen in Figure 12.1a, the input-and output-oriented measures are equivalent (AB/AP = CP/CD) under constant returns to scale.
Malmquist productivity index numbers can be defined by using the concept of distance functions. The output distance function is defined as:
)}(~
)/(:min{),( xAdydyxd TT �� (3)
where ÃT(x) is the set of all possible levels of output y for a given technology T and the input level x. The optimal value of the scalar d* (= d0(x,y)) permits us to calculate the maximal proportional expansion of the output for a given input level. It is equal to unity if y is on the frontier, otherwise it is less (greater) than one if the output, y, is positioned below (above) the production frontier.6 We note that dT(x,y) refers to technical efficiency, that is:
5. In the case of constant returns to scale, this constraint is not imposed; the weights sum up to a value
different from one and the benchmarking can be undertaken against production units that are substantially larger or smaller than the examined ith production unit.
6. Location of the output level above the frontier is technically unfeasible, although it is possible to virtually construct such an outcome in comparisons of levels of y in one period and the frontier from another period.

265
TEyxd T �),( (4)
Following Caves, Christensen and Diewert (1982), the Malmquist (output-oriented) index of TFP change between period 0 and period 1 is defined as follows:
2
1
001
111
000
110
1100 ,
,
,
,,,, �
�
��
���
xyxy
xyxy
xyxyd
d
d
dTFPM (5)
The measure of change in TFP can be depicted in Figure 12.2a in the case of constant-returns to scale and in Figure 12.2b in the case of decreasing returns to scale. The technology is represented, for simplicity, by the one-output one-input linear frontier. The TFP variation observed between the inefficient production unit operating at point P0 and that operating at point P1 is given by (OA1 /OC1):(OA0/OC0). Dividing the two ratios at the numerator and denominator by the average productivity on the respective frontiers of efficient production, given by B1D0/OB1 � B0C0/OB0 at time 0 and B1D1/OB1 � B0C1/OB0 at time 1, yields
),(
),(::
000
110
00
0
01
1
0
00
0
0
1
01
1
1
0
0
1
1
yxd
yxd
CB
OA
DB
OA
OB
CBOB
OA
OB
DBOB
OA
OB
OAOB
OA
���
),(
),(::
001
111
10
0
11
1
0
10
0
0
1
11
1
1
0
0
1
1
yxd
yxd
CB
OA
DB
OA
OB
CBOB
OA
OB
DBOB
OA
OB
OAOB
OA
���
with strict equalities in the case of constant returns to scale (since, in this case, B1D 0/OB1 = B0C0/OB0 and B1D1/OB1 = B0C1/OB0).
The distance functions cannot be computed without knowing the frontier production set. A number of different methods have been devised to estimate this frontier.
7 The DEA approach outlined
above is one of the convenient alternatives. Generalising to the case of variable returns to scale, the DEA-like approach proposed by Färe, Grosskopf, Norris, and Zhang (1994) for the estimation of the distance functions that are necessary to construct the Malmquist index defined by (5) yields:
�� ixyd max)],([ 111
1 ��
�i (6)
subject to: Mii yY 011 ��� ��
Ki Xx 011 ��� �
1’1 ���N
7. See, for example, Milana and Zeli (2002) for references to the different methods proposed in the
literature.
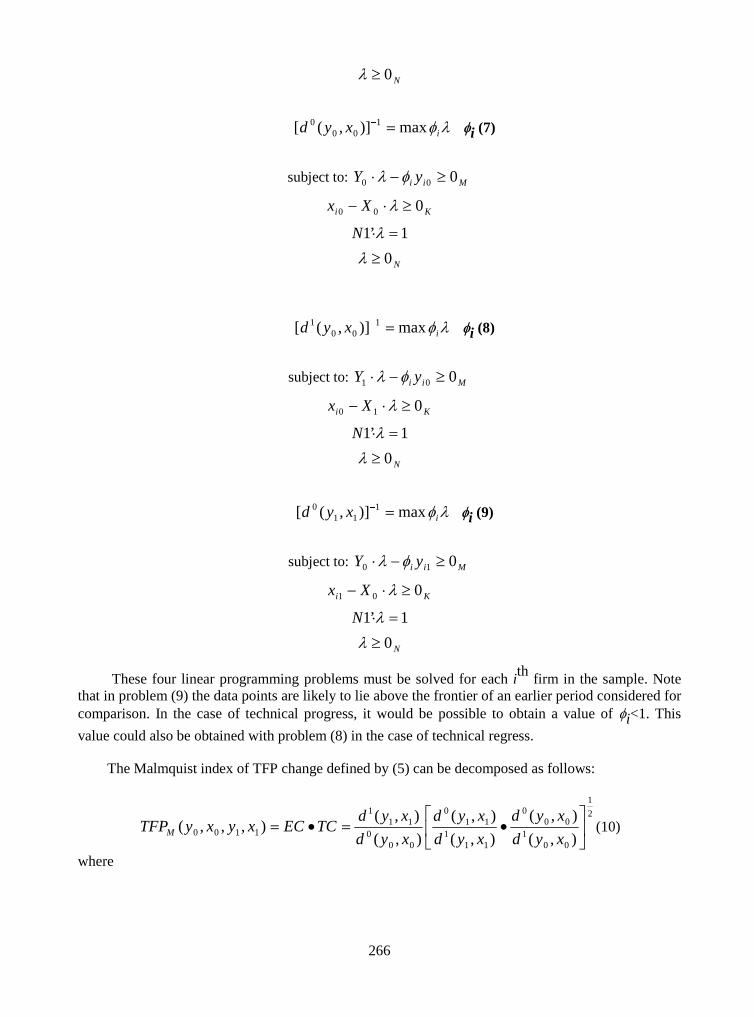
266
N0��
�� ixyd max)],([ 1
000 ��
�i (7)
subject to: Mii yY 000 ��� ��
Ki Xx 000 ��� �
1’1 ���N
N0��
�� ixyd max)],([ 100
1 ��
�i (8)
subject to: Mii yY 001 ��� ��
Ki Xx 010 ��� �
1’1 ���N
N0��
�� ixyd max)],([ 1
110 ��
�i (9)
subject to: Mii yY 010 ��� ��
Ki Xx 001 ��� �
1’1 ���N
N0��
These four linear programming problems must be solved for each ith firm in the sample. Note that in problem (9) the data points are likely to lie above the frontier of an earlier period considered for comparison. In the case of technical progress, it would be possible to obtain a value of �i<1. This
value could also be obtained with problem (8) in the case of technical regress.
The Malmquist index of TFP change defined by (5) can be decomposed as follows:
2
1
001
000
111
110
000
111
1100 ),(
),(
),(
),(
),(
),(),,,( �
�
��
�����
xyd
xyd
xyd
xyd
xyd
xydTCECxyxyTFPM (10)
where

267
)(
),(
0,00
111
xyd
xydEC � (11)
is an index of efficiency change between periods 0 and 1 (which corresponds to the ratio (OA1/B1D1)/(OA0/B0C0) in Figures 12.2a and 12.2b) and:
2
1
001
000
111
110
),(
),(
),(
),(��
��
���
xyd
xyd
xyd
xydTC (12)
is an index of technological change (which is represented by [(B1D1/B1D0)/(B0C1/B0C0 )]1/2 in Figures
2a and 2b).
Figure 12.1a
(a) Constant returns to scale
Figure 12.1b
(b) Decreasing returns to scale
Input
Output
0
D
BAt
Ct
Pt
Input
Output
D
BAt
Ct
Pt
0
Figure 12.2a
(a) Constant returns to scale
Figure 12.2b
(b) Decreasing returns to scale
Input
Output
C0
A0
B0
P0
D0A1
D1C1P1
B10
Input
Output
C0
A0
B0
P0
D0
A1D1C1P1
B10

268
12.2.2 Looking for explanations of TFP change
The two components of TFP change are not independent. In particular, technological change, especially when it is induced by the introduction of new technologies, tends to reduce inefficiency. The theory of X-efficiency may help to explain how technical efficiency (TE) may depend on technological change and investment in new technologies. As Leibenstein (1978, pp. 114-115) noted, there are several reasons why TE might change when there is a change in the production technology. He mentioned the following: (i) Tastes may lead individuals further from the maximising mix of activities under one technology than under another; (ii) Work coordination and discipline may be greater using the new technologies than the old ones; (iii) The old technologies may be equally valid as the new ones, but may be more rigid and detrimental to the synchronisation of new activities; (iv) Personnel selection under the old techniques may be inappropriate under the new techniques; (v) Morale in the work situation may be different with the new techniques; (vi) There may be a different trade-off between effort and increases in labour productivity between the new techniques and the old.
One possible way to start explaining why TFP has changed is to find correlations between this variable and its possible determinants. The following regression has been made on the panel data of the Italian enterprises considered in the ISTAT surveys for the years 1996 and 1999:
eVALC
ROESIZEREGIONFFFTFP
��
�������
)/ln(
ln321ln
7
654321
�
������� (13)
where:
TFP: Malmquist index of total factor productivity change;
F1: First principal component correlated, with a positive sign, with the logarithm of the index of ratio ICT/K (ICT/total capital) and, with a negative sign, with the logarithm of the index of ratio K/L (capital/labour);
F2: Second principal component correlated, with a positive sign, with the logarithm of the index of ratio W/C (cost of skilled labour/total labour costs);
F3: Third principal component correlated, with a positive sign, with the logarithm of the index of ratio R&D/K (stock in R&D/total capital stock);
REGION: Dummy for Central-Northern Italy and Southern Italy;
SIZE: Dummy variable of employment size (100 - 250; >250 employees);
ROE: Index of Return on Equity;
LC/VA: Index of ratio of labour cost on value added;
e: Normally distributed stochastic error.
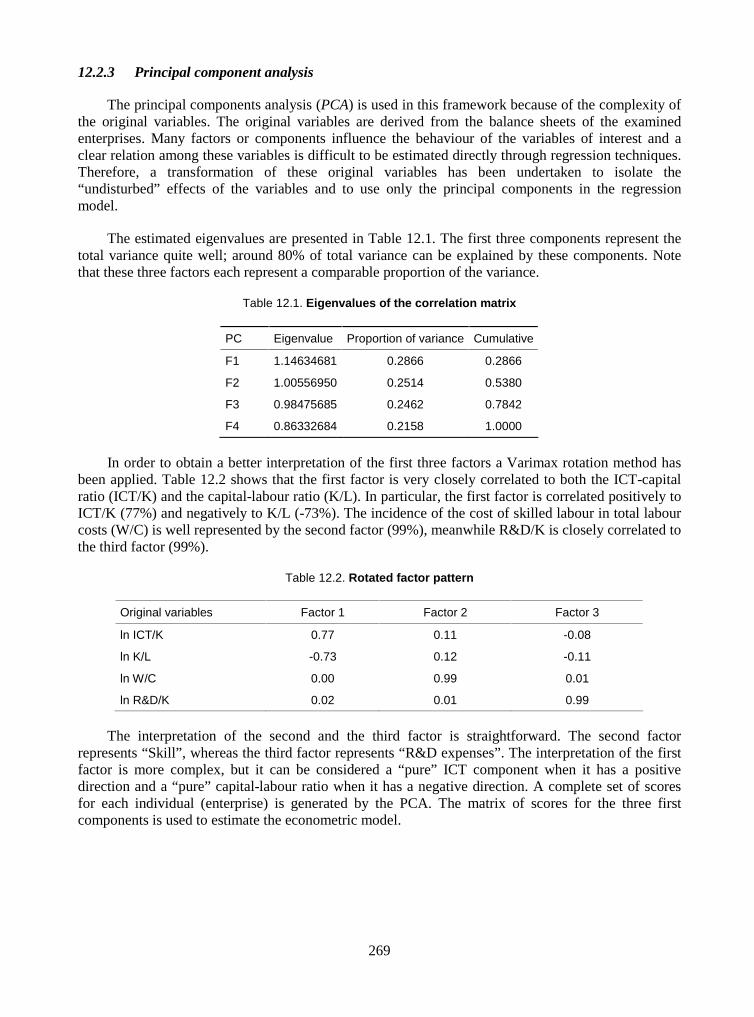
269
12.2.3 Principal component analysis
The principal components analysis (PCA) is used in this framework because of the complexity of the original variables. The original variables are derived from the balance sheets of the examined enterprises. Many factors or components influence the behaviour of the variables of interest and a clear relation among these variables is difficult to be estimated directly through regression techniques. Therefore, a transformation of these original variables has been undertaken to isolate the “undisturbed” effects of the variables and to use only the principal components in the regression model.
The estimated eigenvalues are presented in Table 12.1. The first three components represent the total variance quite well; around 80% of total variance can be explained by these components. Note that these three factors each represent a comparable proportion of the variance.
Table 12.1. Eigenvalues of the correlation matrix
PC Eigenvalue Proportion of variance Cumulative
F1 1.14634681 0.2866 0.2866
F2 1.00556950 0.2514 0.5380
F3 0.98475685 0.2462 0.7842
F4 0.86332684 0.2158 1.0000
In order to obtain a better interpretation of the first three factors a Varimax rotation method has been applied. Table 12.2 shows that the first factor is very closely correlated to both the ICT-capital ratio (ICT/K) and the capital-labour ratio (K/L). In particular, the first factor is correlated positively to ICT/K (77%) and negatively to K/L (-73%). The incidence of the cost of skilled labour in total labour costs (W/C) is well represented by the second factor (99%), meanwhile R&D/K is closely correlated to the third factor (99%).
Table 12.2. Rotated factor pattern
Original variables Factor 1 Factor 2 Factor 3
ln ICT/K 0.77 0.11 -0.08
ln K/L -0.73 0.12 -0.11
ln W/C 0.00 0.99 0.01
ln R&D/K 0.02 0.01 0.99
The interpretation of the second and the third factor is straightforward. The second factor represents “Skill”, whereas the third factor represents “R&D expenses”. The interpretation of the first factor is more complex, but it can be considered a “pure” ICT component when it has a positive direction and a “pure” capital-labour ratio when it has a negative direction. A complete set of scores for each individual (enterprise) is generated by the PCA. The matrix of scores for the three first components is used to estimate the econometric model.

270
12.3 Description of the data
A detailed survey on economic and financial accounts of enterprises is carried out annually in Italy by ISTAT. This survey is intended to cover all enterprises operating in Italy with at least 20 employees until 1997 and at least 100 employees from 1998 to the present date. The survey is conducted by following the guidelines of the 4th EEC Directive scheme under the Italian national Law No. 69 of 26 March 1990 and the national Legislative Decree No. 127 of 9 April 1991 (see, for example, ISTAT, 1998).
8
The survey collects data concerning profit-and-loss accounts and balance sheets. Moreover, information regarding employment, investment, personnel costs and certain regional items is also collected. Although the data collection is aimed at covering the universe of enterprises falling within the established range, there is a non-response problem. Several procedures are used in order to prevent or integrate missing data.
The total population of Italian enterprises with at least 20 employees counted around 68 000 firms in 1997. In that year and previous years, the data collected also included R&D, ICT expenses and capital stocks. The responding enterprises numbered about 27 000. As for small enterprises with less than 20 employees, a sample survey has been carried out annually with some information about ICT obtained at the aggregate level of items. After the year 1997, the statistical burden on enterprises was reduced in order to decrease their administrative costs. Nevertheless, the questionnaire for large enterprises is still very heavy to be filed accurately.
Since 1998, the survey has collected data about all enterprises with at least 100 employees; the number of responding enterprises was consequently reduced to nearly 3 700. Because of this limitation, many series were interrupted, especially those regarding small- and medium-sized enterprises. The sample-based survey, which previously had been carried out for enterprises with less 20 employees, was extended to cover also larger enterprises by increasing the threshold from a maximum of 20 employees to a maximum of 99 employees.
Continuity in the time series was maintained for large enterprises, especially for information relevant for R&D and ICT investment. The questionnaire for the sample surveys of enterprises with less than 100 employees does not ask the interviewees to provide the necessary information to measure and estimate R&D expenses and the acquisition of ICT.
A complete set of homogeneous information about ICT hardware and software in capital stocks at book value and investments in larger enterprises is available for the period 1996-2000. It should, however, be noted that the number of respondent enterprises decreased dramatically from over 27 000 in the surveys carried out in 1996 and 1997 to less than 3 700 in the survey that took place in 2000. Very limited information or none at all about ICT is available for enterprises with less than 100 employees in the ISTAT survey after 1997.
The analysis of productivity growth is carried out using quantities of outputs and inputs. All the relevant variables originally collected in the ISTAT surveys are expressed in monetary values at current prices and must, therefore, be deflated by means of appropriate deflators. The output values (that are approximated by firms’ turnover) have been deflated by sectoral indexes of producer prices. 8. The dataset constructed from the ISTAT annual surveys on economic accounts of enterprises is part of a
larger Statistical Information System on Enterprises (SISSIEI) being developed by ISTAT which intends to integrate all available statistical information on specific statistical units (technically, all the survey data in this system can be linked at the firm level via firm codes).

271
Tangible capital (at book value) has been deflated by the price index for investment goods, whereas the aggregate monetary value of intermediate inputs has been deflated by a price index obtained by aggregation of the market price indexes for each input category.
The book value of ICT capital has been deflated using a specific price index constructed (but not
published) by the national accounts office of ISTAT.9 This deflator has been obtained by aggregation
of the price indexes for “Office machinery and computers”, “Communication equipment”, and “Software”. The book value of R&D has been deflated by the aggregate price index for intermediate inputs used in the production of investment goods. Finally, the cost of labour has been deflated by an index of wages and salaries.
12.4 Empirical results
12.4.1 TFP change and its components
The results obtained by applying the DEA-like Malmquist indexes of TFP change are shown in Table 12.3.10 The main conclusions are the following:
1. On average, during the period 1996-99, TFP slightly decreased (-0.39%), due to a negative effect of technological change (-0.96%) and a positive change in technical efficiency (0.56%). Since negative technological change is often difficult to envisage, this could be interpreted as another type of technical efficiency when the best-practice frontier is assumed to have remained unchanged.
2. During the same period, TFP change varied substantially among the industries in both sign and magnitude. The industries with the greatest increase in TFP were Office, accounting and computing machines (+9.9%), Shipbuilding (+9.7%), Post and Telecommunications (+6.6), Iron and steel (+5.0%). All these industries registered positive growth in both technical efficiency and technological change. Smaller but still positive TFP changes were observed in Chemicals (+2.3%), Non-ferrous metals (+2.15%), Food, beverage, and tobacco (+1.2%), Electricity, gas and water (+1.1%) and Rubber and plastic products (+0.6%). Almost all these changes are the net outcome of negative changes in technical efficiency and positive changes in technology.
3. Negative changes in TFP can be noted in many other industries. Slight decreases were registered by Aircraft and spacecraft (-0.1%), Pulp, paper and paper products (-0.2%), Textiles, apparel and leather (-0.4%), Pharmaceuticals (-0.5%), Machinery and equipment (-1.3%), Wood products (-1.3%), Medical and precision instruments (-1.8%) and Wholesale and retail trade (-2.7%). In these industries, the decrease in TFP is the outcome of negative technological change.
9. We are indebted to Susanna Mantegazza from the national accounts office of ISTAT for providing us with
these price indexes.
10. The computer programme used for DEA estimation is DEAP Version 2.1, which is a programme developed in FORTRAN (Lahey F77LEM/32) by Tim Coelli to be run under MS-DOS 5.0 or higher versions for IBM-compatible PCs (it can be run also under MS Windows 3.1 or higher versions using FILE MANAGER). It is accompanied by a clear and extensive documentation (see Coelli, 1996 for the user’s guide). The regression estimations have been made using SAS package. This software yields rich diagnostic indicators and is particularly useful to process a large number of data.

272
4. The industries that have suffered the greatest decrease in TFP are Real Estate, renting and business services (-6.6%), Health and social work (-6.0%), Computer services and related activities (-4.5%), Petroleum, coal products (-4.31%), Research and Development (-4.3%), Hotels and restaurants (-4.5%), Transport and storage (-3.8%) and Other community and social work (-3.4%). Except for R&D activities, decreases in TFP were mainly due to negative effects of technological change.
12.4.2 Econometric results on correlation between TFP changes, ICT and other variables
The econometric estimates of the parameters of equation (13) that was applied to the panel data described above, are presented for each industry in Table 12.4, along with their respective statistical
tests. The regressions present, generally, a relatively low level of R2, as is common with a large
number of degrees of freedom, where all the variables are normalised and “trend” effects are eliminated. We concentrate our comments only on parameter estimations that concern the correlation between changes in TFP and those in the stock of ICT relative to total capital stock (as represented by Factor 1 in the Principal Component Analysis). The following findings can be drawn from the regression results:
1. ICT is positively correlated to TFP in all industries examined and this correlation appears to be significant in a number of cases.
2. Significant coefficients of ICT (Factor 1) have been obtained in industries that have registered a decline in TFP during the period 1996-1999, for example Textiles and apparels, Pulp and paper products, Fabricated metal products, Precision instruments, Wholesale and retail trade, Hotels and restaurants, Computer services, Research and development, and Health and social work. Significant coefficients of ICT have also been found in industries with positive TFP changes, for example, in Chemicals, Iron and steel, Shipbuilding, Railroad and transport equipment, and Construction.
3. Since the variables are expressed in terms of rates of change (logarithmic values of ratios), the respective estimated coefficients can be interpreted as elasticities. The highest elasticities of TFP with respect to Factor 1 (which is strongly correlated to the proportion of ICT in total capital inputs) have been found in Aircraft and spacecraft (0.40), Construction (0.30**), Chemicals (0.12**), Radio, TV and communication equipment (0.10*), Precision instruments (0.10**), Railroad and transport equipment (0.10**), Computer services and related activities (0.10**), Research and development (0.10**), Other communities, social and personal services (0.10*). The two- and one-star marks indicate that the parameter estimates are, respectively, statistically significant at the 0.05 and 0.1 levels of confidence. We thus found that the impact of ICT on TFP is relatively strong, not only in high-technology industries, but also in certain sectors as Construction, Other community and social services that are not particularly ICT-intensive users.

27
3
Tab
le 1
2.3.
DE
A-l
ike
Mal
mq
uis
t in
dex
es o
f T
FP
ch
ang
e an
d it
s co
mp
on
ents
in It
alia
n in
du
stri
es, 1
996-
99, a
vera
ge
valu
es
Indu
stry
* E
ffici
ency
cha
nge
Tec
hnol
ogic
al c
hang
e T
FP
(1)
(2)
(3)
= (
1) +
(2)
Num
ber
of
firm
s ex
amin
ed
(Rat
e of
cha
nge
in p
erce
ntag
e)
Foo
d, b
ever
age
and
toba
cco
124
-1.0
1 2.
24
1.23
T
extil
es, a
ppar
el a
nd le
athe
r 17
9 0.
90
-1.2
8 -0
.38
Woo
d, w
ood
prod
ucts
and
cor
k 59
-1
.28
-0.0
4 -1
.32
Pul
p, p
aper
, pap
er p
rodu
cts
and
prin
t 74
-0
.88
0.69
-0
.19
Pet
role
um, c
oal p
rodu
cts
and
nucl
ear
14
0.17
-4
.48
-4.3
1 C
hem
ical
s, e
xclu
ding
pha
rmac
eutic
als
70
-0.7
4 3.
06
2.32
P
harm
aceu
tical
s 45
-1
.28
0.82
-0
.46
Rub
ber
and
plas
tic p
rodu
cts
73
-2.7
8 3.
34
0.56
O
ther
non
-met
allic
min
eral
pro
duct
s 89
-1
.01
-0.8
3 -1
.84
Iron
and
ste
el
64
2.82
2.
20
5.02
N
on-f
erro
us m
etal
s 27
-1
.59
3.74
2.
15
Fab
ricat
ed m
etal
pro
duct
s, e
x. m
achi
nery
90
-0
.44
-0.6
6 -1
.09
Mac
hine
ry a
nd e
quip
men
t n.e
.c.
202
1.83
-3
.15
-1.3
2 O
ffice
acc
ount
ing
and
com
putin
g eq
uipm
ent
7 2.
61
7.30
9.
91
Ele
ctric
al m
achi
nery
and
app
arat
us
95
1.41
-1
.41
0.00
R
adio
, TV
and
com
mun
icat
ion
30
0.43
-2
.69
-2.2
6 M
edic
al, p
reci
sion
inst
rum
ents
35
2.
82
-4.5
8 -1
.76
Mot
or v
ehic
les
and
trai
lers
63
1.
87
-1.5
9 0.
26
Shi
pbui
ldin
g an
d re
pair
7 2.
37
7.37
9.
74
Airc
raft
and
spac
ecra
ft 8
1.66
-1
.77
-0.1
1 R
ailro
ad e
quip
men
t and
tran
spor
t equ
ipm
ent
14
0.43
0.
09
0.52
O
ther
man
ufac
turin
g, r
ecyc
ling
24
1.83
-4
.72
-2.8
9 E
lect
ricity
, gas
and
wat
er s
uppl
y 35
1.
54
-0.4
4 1.
10
Con
stru
ctio
n 80
7.
85
-7.0
6 0.
79
Who
lesa
le a
nd r
etai
l tra
de, r
epai
rs
187
-5.1
6 2.
45
-2.7
1 H
otel
s an
d re
stau
rant
s 39
2.
04
-6.1
5 -4
.11
Tra
nspo
rt a
nd s
tora
ge
193
-1.2
3 -2
.55
-3.7
8 P
ost a
nd te
leco
mm
unic
atio
ns
6 4.
22
2.41
6.
63
Rea
l est
ate,
ren
ting
and
othe
r bu
sine
ss s
ervi
ces
134
-0.4
8 -6
.15
-6.6
3 C
ompu
ter
serv
ices
and
rel
ate
rela
ted
activ
ities
+
Pos
t and
tele
com
mun
icat
ions
+ R
&D
43
0.
69
-5.1
6 -4
.47
Res
earc
h an
d de
velo
pmen
t 7
-7.1
1 2.
86
-4.2
4 H
ealth
and
soc
ial w
ork
98
3.50
-9
.47
-5.9
7 O
ther
com
mun
ity, s
ocia
l ser
vice
s 35
2.
57
-5.9
5 -3
.38

27
4
Tab
le 1
2.4.
Eco
no
met
ric
esti
mat
ion
s o
f eq
uat
ion
(13
) o
n f
irm
-lev
el p
anel
dat
a o
f It
alia
n in
du
stri
es, 1
996-
99
N
o. o
f firm
s C
onst
ant
F1
(IC
T/K
) F
2 (S
W/C
L)
F3
(R&
S/K
) R
EG
ION
(D
UM
MY
) S
IZE
(D
UM
MY
) 1n
R
OE
1n
LC
/VA
R
2 ad
just
ed
Foo
d, b
ever
ages
and
toba
cco
124
0.07
1.
11
0.04
(1
.78*
) -0
.01
(-0.
45)
-0.0
0 (0
.04)
-0
.04
(-0.
64)
0.01
(-
0.17
) 0.
03
(0.2
1)
-0.1
5 (-
3.10
**)
5.8
Tex
tiles
, app
arel
and
leat
her
179
-0.0
2 (-
0.49
) 0.
05
(4.0
9**)
-0
.01
(-1.
89*)
0.
00
(-0.
12)
0.01
(0
.25)
0.
01
(0.6
5)
-0.0
0 (-
0.19
) -0
.23
(-6.
85**
) 28
.2
Woo
d, w
ood
prod
ucts
and
cor
k 59
-0
.13
(-1.
21)
0.03
(1
.16)
-0
.01
(-0.
35)
0.00
(0
.05)
0.
11
(0.9
5)
0.00
(0
.10)
0.
01
(1.1
0)
-0.2
0 (-
2.94
**)
8.6
Pul
p, p
aper
, pap
er p
rodu
cts
and
prin
t 74
0.
00
(0.0
8)
0.06
(3
.77*
*)
0.03
(1
.10)
-0
.01
(-0.
69)
-0.0
0 (-
0.00
) -0
.01
(-0.
43)
0.00
(0
.56)
-0
.36
(-4.
19**
) 27
.0
Pet
role
um, c
oal p
rodu
cts
and
nucl
ear
14
0.15
(0
.98)
0.
09
(1.0
6)
-0.2
4 (-
1.86
) 0.
11
(1.0
6)
-0.1
0 (-
0.50
) 0.
00
(0.0
0)
-0.0
7 (-
1.17
) 0.
72
(-4.
81**
) 94
.1
Che
mic
als,
exc
ludi
ng
phar
mac
eutic
als
70
0.04
(0
.33)
0.
04
(2.6
5**)
0.
02
(0.5
6)
0.02
(1
.15)
0.
02
(0.1
1)
-0.0
2 (-
0.59
) -0
.01
(-1.
09)
-0.0
2 (-
0.62
) 9.
8
Pha
rmac
eutic
als
45
0.13
(0
.54)
0.
12
(3.2
0**)
-0
.05
(-1.
40)
0.02
(0
.45)
-0
.16
(-0.
73)
-0.0
2 (-
0.42
) 0.
00
(0.1
1)
-0.1
4 (-
1.44
) 17
.5
Rub
ber
and
plas
tic p
rodu
cts
73
-0.0
3 (-
0.57
) 0.
04
(2.8
6**)
0.
00
(0.2
1)
-0.0
0 (-
0.17
) 0.
06
(1.2
5)
-0.0
1 (-
0.73
) 0.
01
(0.8
2)
-0.2
7 (-
6.67
**)
52.2
Oth
er n
on-m
etal
lic m
iner
al
prod
ucts
89
-0
.16
(-2.
68**
) 0.
06
(2.3
3**)
-0
.00
(-0.
12)
0.01
(0
.31)
0.
11
(1.7
4)
0.03
(0
.80)
0.
01
(0.7
4)
0.21
(-
2.29
**)
14.1
Iron
and
ste
el
64
0.07
(1
.08)
0.
05
(4.0
8**)
0.
00
(0.0
8)
0.00
(0
.32)
0.03
(0
.44)
0.
01
(0.1
8)
-0.0
0 (-
0.23
) -0
.09
(-2.
67**
) 20
.3
Non
-fer
rous
met
als
27
0.24
(3
.55*
*)
0.06
(2
.87*
*)
-0.0
4 (-
1.34
) 0.
04
(1.4
6)
-0.1
8 (-
2.66
**)
-0.0
6 (-
1.68
) 0.
00
(0.1
4)
-0.2
9 (4
.26*
*)
53.2
Fab
ricat
ed m
etal
pro
duct
s, e
x.
mac
hine
ry
90
-0.1
4 (-
2.97
**)
0.05
(3
.05*
*)
0.00
(0
.15)
-0
.00
(-0.
03)
0.12
(2
.13)
0.
02
(0.5
2)
-0.0
1 (-
1.12
) -0
.29
(-3.
42**
) 26
.7
Mac
hine
ry a
nd e
quip
men
t n.
e.c.
20
2 -0
.02
(-1.
39)
0.02
(1
.4)
0.03
(2
.28*
*)
0.02
(1
.32)
-0.0
3 (-
1.03
) 0.
01
(0.5
1)
-0.2
2 (-
4.61
**)
12.1
(Con
tinue
d on
nex
t pag
e)

27
5
Tab
le 1
2.4.
Eco
no
met
ric
esti
mat
ion
s o
f eq
uat
ion
(13
) o
n f
irm
-lev
el p
anel
dat
a o
f It
alia
n in
du
stri
es, 1
996-
99 (
cont
d.)
N
o. o
f firm
s C
onst
ant
F1
(IC
T/K
) F
2 (S
W/C
L)
F3
(R&
S/K
) R
EG
ION
(D
UM
MY
) S
IZE
(D
UM
MY
) 1n
R
OE
1n
LC
/VA
R
2 ad
just
ed
Offi
ce a
nd c
ompu
ting
mac
h. +
el
ectr
ical
mac
hine
ry a
nd
appa
ratu
s ne
c
102
0.15
(1
.99*
*)
0.03
(1
.97*
) 0.
00
(0.1
4)
0.00
(-
0.43
) -0
.13
(-1.
75)
0.01
(0
.33)
-0
.02
(-1.
65)
-0.2
4 (-
5.32
**)
21.7
Rad
io, T
V a
nd c
omm
unic
atio
n eq
uipm
ent
30
-0.1
0 (-
0.79
) 0.
10
(2.4
0**)
-0
.02
(-0.
45)
-0.0
3 (-
0.63
) 0.
05
(0.3
5)
0.05
(0
.76)
-0
.01
(-0.
15)
-0.2
1 (-
2.12
**)
20.9
Med
ical
, pre
cisi
on a
nd o
ptic
al
inst
rum
ents
35
0.
05
(0.3
6)
0.10
(3
.23*
*)
0.05
(0
.66)
-0
.03
(-0.
95)
-0.0
6 (-
0.46
) -0
.01
(-0.
18)
-0.0
1 (-
0.26
) -0
.33
(-4.
57**
) 53
.0
Mot
or v
ehic
les
and
trai
lers
63
-0
.01
(-0.
16)
0.08
(3
.97*
*)
0.04
(1
.26)
0.
01
(0.6
3)
0.00
(0
.06)
0.
03
(0.8
5)
0.02
(1
.60)
-0
.02
(-0.
26)
19.0
Shi
pbui
ldin
g an
d re
pairi
ng
7 0.
18
(1.2
2)
0.04
(0
.35)
0.
53
(2.3
5*)
0.19
(1
.34)
41
.0
Airc
raft
and
spac
ecra
ft 8
0.34
(1
.19)
0.
40
(0.6
7)
-0.1
3 (-
1.29
) 0.
22
(1.5
0)
-0.5
1 (-
1.46
) 0.
38
(1.0
2)
48.0
Rai
lroad
equ
ipm
ent a
nd
tran
spor
t equ
ipm
ent
14
-0.1
1 (-
2.92
**)
0.05
(1
.47)
-0
.09
(-1.
36)
0.09
(0
.83)
0.06
(0
.57)
-0
.03
(-1.
73)
-0.3
8 (-
5.29
**)
78.7
Oth
er m
anuf
actu
ring,
rec
yclin
g 24
-0
.04
(-1.
65)
0.02
(0
.89)
0.
00
(0.1
8)
-0.0
1 (-
0.64
)
-0.0
4 (-
0.91
) 0.
00
(-0.
42)
-0.4
1 (-
4.21
**)
43.4
Ele
ctric
ity, g
as a
nd w
ater
su
pply
35
0.
05
(0.6
4)
0.03
(1
.09)
0.
03
(1.4
5)
-0.0
1 (-
0.23
) 0.
03
(0.4
1)
-0.0
5 (-
0.88
) -0
.02
(-1.
12)
0.02
(0
.34)
16
Con
stru
ctio
n 80
-0
.07
(-0.
37)
0.30
(5
.42*
*)
-0.1
0 (-
1.29
*)
-0.0
1 (-
0.17
) 0.
03
(0.1
5)
0.08
(0
.57)
-0
.06
(-1.
46)
-0.1
1 (-
0.78
) 32
.4
Who
lesa
le a
nd r
etai
l tra
de,
repa
irs
187
-0.0
7 (-
4.19
**)
0.06
(5
.19*
*)
-0.0
1 (-
0.23
) 0.
01
(0.9
0)
0.
00
(0.0
3)
0.01
(0
.55)
-0
.03
(-2.
03**
) 12
.8
Hot
els
and
rest
aura
nts
39
-0.8
(-
1.04
) 0.
07
(2.9
4**)
-0
.20
(-0.
63)
0.02
(1
.20)
0.
02
(0.2
2)
-0.0
2 (-
0.43
) 0.
02
(1.1
9)
-0.2
8 (-
2.41
**)
34.7
Tra
nspo
rt a
nd s
tora
ge
193
-0.1
6 (-
2.95
**)
0.04
(2
.26*
*)
-0.0
1 (-
0.50
) 0.
03
(1.2
4)
0.13
(2
.65*
*)
-0.0
4 (-
0.92
) 0.
01
(0.4
8)
-0.0
4 (-
1.32
) 6.
0
Rea
l est
ate,
ren
ting
and
othe
r bu
sine
ss s
ervi
ces
134
-0.3
1 (-
3.71
**)
0.07
(2
.49*
*)
0.05
(1
.91*
) 0.
03
(1.0
8)
0.15
(1
.67)
0.
07
(1.1
1)
0.03
(1
.63)
0.
27
(-3.
54**
) 15
.9
Com
pute
r se
rvic
es a
nd r
elat
ed
activ
ities
+ P
ost a
nd
tele
com
mun
icat
ions
+ R
&D
54
-0.0
4 (-
0.32
) 0.
01
(4.1
8**)
0.
12
(2.3
7**)
0.
07
(0.9
6)
0.01
(0
.18)
-0
.08
(-0.
67)
0.00
(0
.14)
-0
.31
(-6.
85**
) 53
.6
Hea
lth a
nd s
ocia
l wor
k 98
-0
.10
(-2.
29**
) 0.
09
(5.7
5**)
0.
06
(2.5
3**)
0.
02
(0.5
5)
-0.0
2 (-
0.33
) -0
.01
(-0.
22)
0.00
(0
.01)
-0
.41
(-5.
30**
) 35
.5
Oth
er c
omm
unity
, soc
ial a
nd
pers
onal
35
0.
11
(0.7
9)
0.10
(2
.02*
) 0.
08
(1.1
7)
-0.0
6 (-
1.21
) -0
.13
(-.9
2)
-0.0
6 (-
0.51
) 0.
03
(0.5
6)
-0.0
3 (-
0.38
) 22
.1
Not
e:
t val
ues
in p
aren
thes
is. *
Sig
nific
ant a
t 10%
leve
l of c
onfid
ence
. **
Sig
nific
ant a
t 5%
leve
l of c
onfid
ence
.

276
Conclusion
The analysis of firm-level data suggests that the productivity slowdown observed at the aggregate level of the Italian economy during recent years has been mainly due to negative technological changes, notably declining performance of the best-practice production units, which have not been completely offset by improvements in technical efficiency. This result indicates that the negative TFP changes may have a structural nature. This trend could have been addressed by more robust investment in new information and communication technologies. In fact, the panel regressions indicate that, in all the industries examined, TFP changes are positively affected by increases in ICT intensity. Apart from the adjustment and organisational costs that are generally encountered with the installation of new investment goods, a substantial portion of the productivity stagnation observed during recent years in Italy can be explained by the relatively low accumulation of information and communication technologies.

277
REFERENCES
Bassanetti A., M. Iommi, C. Jona Lasinio, and F. Zollino (2003), “The Slow Italian Growth in the 1990s: Is the Gap in Information Technology the Story?”, presented at the ISTAT-Statistics Finland Workshop “Productivity, Competitiveness and the New Information Economy”, Rome, 26-27 June.
Basu S., J. G. Fernald, N. Oulton and S. Snrinivasan (2003), “The Case of Missing Productivity Growth: Or, Does Information Technology Explain Why Productivity Accelerated in the United States but not the United Kingdom?”, prepared for the NBER Macro Annual Con-ference, April.
Caves D.W., L.R. Christensen and W.E. Diewert (1982), “The Economic Theory of Index Numbers and the Measurement of Input, Output and Productivity”, Econometrica 50: 1393-1414.
Daveri F. (2000), “Is Growth in Europe an ICT-Story Too?”, presented at the XII Villa Mondragone International Economic Seminar, “Knowledge Economy, Information Technologies and Growth”, organised by CEIS, University of Rome “Tor Vergata”, Monte Porzio Catone (Rome), June 26-28.
Daveri F. (2001), “Information Technology and Growth in Europe”, presented at the conference organised by Centro Ricerche Economiche Nord-Sud (CRENoS), University of Cagliari, at Cagliari, Italy, July 6-7. (Available at http://www.crenos.unica.it/news/preliminarcnr.html.)
Färe R., S. Grosskopf, M. Norris, and Z. Zhang (1994), “Productivity Growth, Technical Progress, and Efficiency Changes in Industrialised Countries”, American Economic Review 84: 66-83.
Gust C. and J. Marquez (2002), “International Comparisons of Productivity Growth: The Role of Information Technology and Regulatory Practices”, Labour Economics (forthcoming).
ISAE (2001), Rapporto trimestrale, July, Rome.
ISAE (2003), Rapporto trimestrale, January, Rome.
Leibenstein H. (1978b), General X-Efficiency Theory and Economic Development, Oxford University Press, New York, London, and Toronto.
Milana C. and A. Zeli (2002), “The Contribution of ICT to Production Efficiency in Italy: Firm-Level Evidence Using Data Envelopment Analysis and Econometric Estimations”, STI Working Paper 2002/13, OECD, Paris.

279
CHAPTER 13
IT, PRODUCTIVITY AND GROWTH IN ENTREPRISES: NEW RESULTS FROM INTERNATIONAL MICRO DATA1
B.K. Atrostic, US Census Bureau
Peter Boegh-Nielsen, Statistics Denmark
Kazuyuki Motohashi, Hitotsubashi University and Research Institute of Economy, Trade and Industry
Sang Nguyen, US Census Bureau
Abstract
The relationship between information technology (IT), productivity, and growth has been estab-lished at the aggregate level. However, the mechanism through which the effect operates at the level of specific businesses remains unclear. Statistical agencies have developed indicators of businesses’ readiness to use IT (e.g. the IT infrastructure, diffusion of specific technologies), and some indicators on actual usage (e.g. purposes, frequency of use). The next phase is developing estimates of the impact of IT use. A recent OECD study addressed this question using aggregate data for OECD countries, and micro data for Germany and the United States. A second phase of the OECD study envisions a series of two- and three-country studies making use of newly available micro data for roughly a dozen countries. This paper outlines one such study, a three-country project addressing the impact of IT use in Denmark, Japan, and the United States. Each country recently collected new data at the level of specific businesses on the use of IT by businesses, and has con-ducted preliminary analyses of its own data. Each country also has different underlying market and institutional structures. The next phase of this project will be to develop estimates of the impact of IT use based on these new micro data, developing and testing hypotheses that acknowledge dif-ferences among the countries in market and institutional structures.
1. Disclaimer: This paper was presented at OECD Workshop on ICT and Business Performance OECD,
Paris, 9 December 2002. This paper reports the results of research and analysis undertaken by the authors. It has undergone a more limited review than official publications. Opinions expressed are those of the authors and do not necessarily represent the official position of the US Census Bureau, Statistics Denmark, Hitotsubashi University or Research Institute of Economy, Trade and Industry.

280
13.1 Introduction
The development of statistics on the Information Society – understood as a structured and coherent statistical framework – has been ongoing since the mid-nineties. The statistical framework can be described as a set of building blocks in order to ensure flexibility and adaptability. At the moment the international statistical framework developed by OECD countries consists of the following categories: 1) ICT investment, 2) ICT infrastructure, 3) ICT sector, 4) access to and use of ICT by households and individuals, 5) access to and use of ICT by enterprises, 6) access to and use of ICT by the public sector, 7) e-commerce and 8) skills and education.
It is a characteristic of statistics on the Information Society that due to the continuous develop-ment of ICT technology and the diffusion and use of this technology into all corners of economies and societies, the statistical coverage is never fully developed but under constant design. Existing indicators might become outdated related to changing user needs and new indicators on emerging technologies have to be developed to satisfy new user needs. A recent example is the adoption of the eEurope2005 action plan, challenging the statistical offices of the EU member states to develop indicators related to policy areas as e-learning or e-health.2
If we look at the statistical monitoring of the use of ICT, the development of statistical indicators has taken its starting point in the measurement of readiness, followed by intensity indicators and finally the creation of impacts indicators. At the moment we have a relatively good coverage in terms of indicators and countries covered concerning statistics on the readiness (infrastructure, penetration) and partly also on usage (purposes, frequencies, barriers, etc.).3 We are now entering the phase of developing statistics on the impact of ICT usage.
Measuring the electronic economy touches on almost every aspect of the economy. No single statistical agency has the resources and technical expertise to independently resolve all the measure-ment issues and fill all the information gaps associated with measuring the electronic economy. Cooperation across statistical agencies is required. This paper describes some initial initiatives in the development of measuring impact of ICT usage in enterprises taken by the statistical offices in Denmark, Japan and United States. The paper outlines a common project as part of the second OECD micro data project on IT and growth.4
2. European Commission: eEurope 2005, KOM(2002)263final.
3. For instance for all OECD countries information about telecommunication networks (access paths per 100 inhabitants are available and for 21 countries information about Internet penetration by industry, cf. OECD, 2003).
4. The first OECD microdata project is described in Bartelsman et al (2002). That study used harmonised macro and sectoral data for OECD, a unique cross-country dataset developed for the OECD Growth Project with firm turnover and related measures at the sectoral level (see Colecchia and Schreyer, 2001) and establishment level micro data for the US and German manufacturing sectors. The first microdata project addressed questions of differential uptake of technologies among countries, and differences in aggregate productivity patterns. It explored whether underlying differences among countries in market conditions and institutional frameworks affected their use of technologies, and the effects of that use on growth. The microdata comparison of the German and US manufacturing sectors led to the conclusion that US manufacturing establishments are more likely to experiment with different ways of conducting business than their German counterparts, and US businesses choose a higher mean, higher variance strategy in adopting new technology. This second OECD project follows from the success of the first OECD microdata study, and seeks to build and expand on the first study. The micro data studies complement the many studies based on aggregate data that studied the link between IT use and growth (e.g. Colecchia and Schreyer, 2001; Jorgenson and Stiroh, 2000; Oliner and Sichel, 2000; Triplett and
281
This paper describes the collaboration among Denmark, Japan, and the United States. The three countries differ geographically and in the size of their populations and economies. Denmark is a small European economy, but was a leader among the European Union in collecting data on the use of IT by businesses, with much of its survey serving as the foundation for the model survey adopted by OECD. Japan is a large economy and a major IT producer. The strong growth of the US economy in the late 1990s, widely associated with IT, attracted world-wide interest in the relationship between IT and growth (e.g. Colecchia and Schreyer 2001 and Bartelsman 2002). What all three countries have in common, and the reason for participating in this joint micro data study, is that all three just collected detailed data on the use of IT in one or more major sectors of their economies.
13.2 How IT may affect productivity and growth in enterprises
Computers may affect productivity and growth in enterprises in at least two ways. Computers may be used directly as inputs to the production process, as a specific form of capital. This is the approach taken in many national and industry-level studies, as well studies at the plant or business level - e.g. McGuckin et al, (1998); Brynjolfsson and Hitt (2000); Dunne et al. (2000); Motohashi 2001; and Atrostic and Nguyen (2002). Consider a steel mill. Computers and automated processes are used to control production processes in modern steel mills. Many supporting business processes can also be computerised. For example, computers can be used to maintain a database of customers or shipments, or to do accounting or payroll. Computers may substitute for paper-based systems without changing the underlying business processes.
But computers may also be used to organise or streamline the underlying business processes. When these computers are linked into networks, they facilitate standard business processes such as order taking, inventory control, accounting services, and tracking product delivery, and become electronic business processes (or e-business processes, see Atrostic, Gates, and Jarmin, 2000). These e-business processes occur over internal or external computer networks that allow information from different processes to be readily exchanged. Shipments may be tracked on-line, inventories may be automatically monitored and suppliers notified when pre-determined levels are reached.
Adopting e-business processes automates and connects existing business processes. It can also change the way companies conduct not only these processes but also their businesses. The surge of interest in supply chains exemplifies the potential for computers to affect productivity growth outside of the manufacturing sub-sectors that produce them. These effects are thought to occur through organisational changes. Many core supply chain processes are widely cited as examples of successful e-business processes that, in turn, are expected to shift the location of the process between the participants in the supply chain. Brynjolfsson and Hitt (2000) argue that the effects of organisational changes may rival the effects of changes in the production process. Viewed this way, computer networks are a productivity-enhancing technology.
Bosworth, 2000). With the relationship between IT and productivity and growth established in aggregate data, attention turned to determining whether the relationships held for individual businesses units, and then, to estimating the size of the IT impact and possible causality. The first OECD microdata study examined only data for the US and German manufacturing sectors. One facet of the second OECD micro data project on IT and growth expands the comparative microdata analyses to include about a dozen countries. The expanded analysis is taking place through a series of collaborations, with a small number of countries involved in each collaboration. Each group is developing its own way of reconciling the differences in each country’s existing micro data that are important to comparative studies, such as the sectors covered, the scope of businesses included in each sector, and the specific questions asked (see Chapter 7 for another example of a comparative study).

282
Although the theoretical literature makes clear that IT is a multi-faceted input, the emphasis in much of the literature has been on the IT producing industry, and on relatively simple indicators of whether or not businesses use IT. Relatively few studies (e.g. Greenan and Mairesse 1996 for France, Motohashi 2001 for Japan, Atrostic and Nguyen 2002 for the United States, and Bartelsman et al. 2002 for the US–German comparison) examine how businesses use IT. Many studies focused on one use of IT, e-commerce.
13.3 From measuring e-commerce to measuring e-business processes
In the mid-nineties there was tremendous interest in e-commerce and its expected growth and influence on the future forms of conducting business, especially trading, across existing national borders. As a consequence, the OECD received a mandate in 1998 to define and measure electronic commerce (at the so-called Ottawa Ministerial). In 2000, OECD member countries endorsed two definitions of electronic transactions (electronic orders) based on a narrower and broader definition of the communications infrastructure. According to the OECD definitions, it is the method by which the order is placed or received, not the payment or the channel of delivery, which determines whether the transaction is an Internet transaction (conducted over the Internet) or an electronic transaction (conducted over computer-mediated networks).5
Table 13.1. Estimates of Web, Internet and electronic commerce transactions, percentage of total sales or revenues, 2001 or latest available year
Broad0.5% Canada
Business sector 0.7% Australia (2000-01)
0.3% New Zealand2 (2000-01)
2.0% Norw ay 10.0% Norw ay
Business sector 0.7% Czech Republic 3.3% Czech Republic
(exc luding f inancial sector) 1.0% Denmark3 6.6% Denmark3
1.0% Germany3 4.7% Germany3
0.5% Greece3 0.8% Greece3
0.3% Spain3 2.6% Spain3
3.8% Ireland3 15.1% Ireland3
0.3% Italy3 2.6% Italy3
0.4% Luxembourg3 3.4% Luxembourg3
2.2% Austria3 8.2% A ustria3
1.1% Finland3 11.5% Finland3
2.1% Sw eden3 9.5% Sw eden3
0.6% Canada 1.50% (United States, 1st Q 2003)
0.4% Australia (2000-01) 1.65% (United States, 4th Q 2002)
Retail sector 1.31% (United States, 4th Q 2001)
1.17% (United States, 4th Q 2000)
Narrow Internet commerce, i .e. sales over Electronic commerce, i .e. sales over
the Internet any kind of computer-mediated netw ork Broad
Source: OECD Science, Technology and Industry Scoreboard 2003.
5. See OECD (2002), Measuring the Information Economy, www.oecd.org/sti/measuring-infoeconomy.

283
It is obvious that comparisons of the level of e-commerce across countries are heavily influenced by the definition used, cf. Table 13.1. Comparisons of electronic commerce transactions are hampered by the use of different definitions across countries as by differences in the survey coverage.6 But Table 13.1 shows that e-commerce has until now been relatively small in many countries. Nor has it experienced the growth expected, so the justification of the focus on e-commerce can be questioned.
At the same time, studies have consistently found that computers were associated with strong economic growth, particularly in the United States in the late 1990s. How do computers affect economic activity? It seems unlikely that the primary effect of computers to date is through the relatively small amounts of e-commerce over the Internet, or over other networks. Businesses use computers and computer networks in many other ways, such as managing production, refining supply chains, and conducting back office operations such as accounting. Relatively little is known about these other uses, and the focus of policy-makers, scientists and statistical offices have been directed towards the measurement of e-business. This chapter describes different approaches of measurement taken by the statistical offices of Denmark, Japan and United States.
13.3.1 Denmark
Since 1998, Statistics Denmark has been conducting an annual survey on ICT usage in enterprises using a questionnaire nearly identical with the model questionnaire on ICT usage in enterprises approved by OECD member states in October 2001.7 The questionnaire is intended to provide guidance for the measurement of indicators of ICT, Internet use and electronic commerce and is composed of separate, self-contained modules to ensure flexibility and adaptability to a rapidly changing environment. While the use of “core” modules allows the measurement on an internationally comparable basis, additional modules can be added to respond to evolving or country specific policy needs in this area.
In 2001, Statistics Denmark added a country specific module on integration of Internet sales with IT systems. The reasoning was that the possible automation of business processes is the core element of e-commerce and thus the basic reason for focusing on this issue. Moreover, it might have potential implications for the ways in which enterprises organise themselves and for job creation as well.
The results of the survey show that every third enterprise with Internet sales in Denmark has integrated the sales with at least one type of IT system, see Figure 13.1. This implies that the receipt of orders via the homepage is automatically connected to one or more IT systems.8
6. While e-commerce was 0.9% of US retail trade sales in 2000, it was 18.4% of manufacturing shipments
and 7.7% of merchant wholesale trade sales, assuming that all manufacturing and wholesale e-commerce is entirely B-to-B, and that all retail e-commerce is business-to-consumer. Most B-to-B e-commerce in the United States is conducted over Electronic Data Interchange networks (EDI) rather than the Internet. In 2000, 88% of merchant wholesalers’ e-commerce sales were over EDI. Manufacturing plants primarily using EDI networks for accepting on-line orders accounted for two-thirds of e-commerce shipments of plants responding to the 2000 Annual Survey of Manufactures, while plants primarily using Internet networks accounted for only 5% of e-commerce shipments (E-commerce 2000, www.census.gov/estats).
7. See OECD (2002).
8. The results are presented in Danmarks Statistik Statistiske Efterretninger. Serviceerhverv 2002:16.

284
Figure 13.1. Integration of Internet sales with IT systems, Denmark 2001
Per cent of enterprises w ith Internet sales
0
5
10
15
20
25
30
Execution of orders(delivery,
production, ect.)
Invoicing Other IT-systems Reordering bysuppliers
Source: Statistiske Efterretninger, Serviceerhverv 2002:16, Statistics Denmark.
Twenty five per cent of the enterprises with Internet sales have integrated the receipt of the order with systems effecting the order, i.e. delivery, production. The second frequent type is integration with billing systems (14%) and reordering of products with suppliers (6%). Eleven per cent has integration with other IT systems such as booking systems, mail systems, etc.
13.3.2 Japan
In Japan, METI has been conducting the annual ICT Workplace Survey since the 1970s. This is a firm level survey for about 9 500 computer users in Japan. The survey items cover everything from conditions of the costs of information processing of different types, such as hardware, software, and information processing services, penetration of computers in the workplace, and conditions of use of information processing networks. As part of the plan to augment IT statistics in Japan, this survey was expanded and the 2001 version includes new survey items on e-commerce and e-business processes. The survey for e-commerce is conducted by using both the “broad” and “narrow” definitions of e-commerce developed by the OECD. Data on the uses of e-commerce for each category of B2B buying and selling, and B2C are collected by the type of e-business process. Figure 13.2 shows the rate of firms using B2B or B2C e-commerce for each type of e-business application, and it separates the usage of B2B e-commerce for procurement from the one for selling.

285
Figure 13.2. Firms using B2B or B2C EC by type of e-business process, Japan 2001
0
5
10
15
20
25Ad
verti
sem
ent
Plac
ing
orde
r and
dea
lings
Dea
lings
and
set
tlem
ent
Adve
rtise
men
t
Rec
eivin
g or
der a
nd d
ealin
gs
Dea
lings
and
set
tlem
ent
Prod
uctio
n an
d in
vent
ory
cont
rol
Sale
s an
d in
vent
ory
cont
rol
Phys
ical d
istrib
utio
n m
anag
emen
tAf
ter-s
ales
ser
vice
Clie
nt in
form
atio
n m
anag
emen
t
Tech
nica
l info
rmat
ion
man
agem
ent
B2bB2c
Procurement Sales
The results show that “placing and receiving orders” is the most typical business application for B2B e-commerce, followed by “sales and inventory management”. It should be noted that B2B e-commerce includes transactions via traditional EDI networks, and the diffusion rate of e-commerce via Internet into Japanese firms is much smaller. Figure 13.2 also shows that B2C e-commerce, conducting via Internet, is not very popular among Japanese firms.
The ICT Workplace Survey looks not only at e-commerce and e-business process activities, but also at an extensive variety of firm level IT-related activities, such as hardware and software investment, IT usage by employees and use of communication technology for business. However, it has to be combined with the Basic Survey of Business Structure (BSBSA) to study productivity and information network use. The BSBSA is METI’s firm level survey for all firms with no less than 50 employees and no less than a JPY 30 million amount of capital. It serves as the basis for various kinds of firm level surveys by METI in the sense that firm level surveys for special issues, including the ICT Workplace Survey, use the BSBSA firm list as its sample base. The BSBSA itself also provides data on firm performance, globalisation activities, R&D and other innovation-related variables.
13.3.3 United States
The US Census Bureau collected plant-level data on computer networks in US manufacturing plants through the Computer Network Use Supplement (CNUS) to the 1999 Annual Survey of Manufactures (ASM). The CNUS surveyed some 50 000 manufacturing plants about their use of online purchasing and ordering, the presence of computer networks, the kind of network (EDI, Internet, both), about 25 business processes (such as procurement, payroll, inventory, etc., conducted over computer networks; “e-business processes”), and whether those networked processes are used to interact internally, or with the manufacturing plant’s customers or suppliers. The CNUS focused on the use of computer networks, rather than the presence of computers alone. Early findings were released in an analytic report in June 2001, based on the responses of over 38 000 US manufacturing

286
plants. Detailed tabulations were released in March 2002 (for both releases, see www.census.gov/estats). Because the CNUS were collected as a supplement to the ASM, we can link CNUS data to current and previous information for the same plant collected in the 1999 ASM and the 1997 and 1992 Census of Manufactures (CM). These linkages allow us to examine relationships between the plants’ economic behaviour and their use of computer networks.
The preliminary findings show that manufacturing plants responding to the CNUS were “wired” in mid-2000. Almost 90% had a computer network in place. While over 80% of responding plants had Internet access at the plant, there were opportunities for further integration of e-business processes. Almost half of the plants that accepted orders online did not place orders online. Focusing only on e-shipments and e-purchases excludes a large part of manufacturing plants’ use of e-business processes.
Table 13.2. E-shipments and e-purchases in mid-2000 at US manufacturing plants responding to CNUS survey
Status of e-shipments Status of e-purchases
All plants Make e-shipments Do not make e-shipments Unknown
All plants 38 985 12 069 26 462 454
Make e-purchases 13 233 6 063 7 061 109
Do not make e-purchases 25 237 5 901 19 203 133
Unknown 515 105 198 212
Source: Table B, Manufacturing 1999 and mid-2000, www.census.gov/estats, June 8, 2001.
13.4 New insights on how IT affects productivity and growth
Different methods of obtaining information about the impact of IT on growth and business performance are expected to be introduced in the coming years. One method is the enlargement of the existing model survey with modules on electronic business processes or the design of questions addressing the issue of perceived benefits of using IT. Especially the reliability of the last type of approach can be questioned; another way to proceed is by linking the ICT usage survey data with economic data from other surveys at the firm-level.
As mentioned above, the OECD launched such a project with an aim to report in 2003. This paper describes an initiative taken by the statistical offices in Denmark, Japan and the United States to utilise existing survey data in order to obtain new insights into the question of how IT affects business performance. The project is in its initial phase and the first step has been the identification of a number of key variables. The availability of these variables in each country is given in Table 13.3. As the statistical registers used are not harmonised across countries, it is difficult to conduct comparable analysis for all three countries. However, in order to deepen the understanding of cross country differences and similarities, pair-wise comparisons or even separate analysis for each country, to be presented in this section, are useful.

287
Table 13.3. Data availability in Denmark, Japan, and the United States
Denmark Japan United States
I. Basic statistics
Data source and coverage of year ICT survey (1998-2001) BSBSA (1991, 94-99) CM, ASM (1992, 97, 99)
Accounts stats (1995-1999) ICTWP survey (2000) CNUS (1999)
Coverage of sector All sectors All sectors Manufacturing
Unit of analysis (minimum size) Firm (20+) Firm (50+) Plant (5+)
Number of observations 1.8K 20K (BSBSA) 2K(+ICTWP)
38K
Industry classification NACE JSIC NAICS
Productivity variables
Total shipments/sales/revenues Yes Yes Yes
# of employment Yes Yes Yes
Value added Yes Yes Yes
Other major variables
Skill or worker mix No Yes Yes
ICT investment No Yes Yes
Number of workers with access to:
Computers Yes Yes (1997) No
Internet Yes No Yes
II. E-statistics
Number with e-activity:
E-commerce (yes/no; year)
OECD broad definition Yes/2000- Yes/2000 Yes
OECD narrow definition Yes No Yes
Networks (kind of network)
Wireless No Yes/2000 No
Internet Yes Yes/2000 Yes
Intranet, EDI-“lite” Yes (Intranet) No Yes
EDI Yes Yes/1997 Yes
Other (specify) LAN LAN, WAN LAN, “other”
Relevant software, e.g. fully integrated resource planning software
No No Yes
E-business processes No Yes/91, 94 Yes
Value of e-commerce
Per unit, per workers Yes/2000- Yes/2000 Yes
By type of network
Internet Yes/2000- No No
EDI Yes/2000- No No

288
13.4.1 Data
In Denmark, Statistics Denmark is establishing a database including data from three statistical registers (see Annex A of this chapter for a more detailed description):
� The 1998 questionnaire on the enterprise use of IT. Including 1 832 enterprises.
� The account statistics 1995-1999. Including all enterprises with more than ten employees in manufacturing industry, construction and retail trade.
� The Integrated Database for Labour Market Research (IDA) containing detailed information about each employee and their personal background.
The scope of the project is firstly to profile the enterprises which can be characterised as the first group of users of Internet, intranet and extranet, and the first to carry out e-commerce. Can we identify any links between the uses of Internet, extranet, e-commerce on the one hand and business performance or the characteristics of the employees at micro level on the other hand? The Danish project is hampered by the fact that no data on IT investments are available and instead information about use of Internet and extranet have to be used as indicators for the e-maturity of the enterprise.
The work carried out has consisted of establishing a longitudinal database covering the period 1995-99. The starting point is the 1 800 enterprises included in the ICT usage survey 1998, which was matched with the register of accounts statistics 1995-99 at the firm level. Out of the 1 832 enterprises, only 853 enterprises can be found in the account statistics 1995-99, as the account statistics only covers manufacturing, construction and retail trade.
In Japan, the data for productivity analysis of information networks are based on a combination of the ICT Workplace Survey and the Basic Survey of Business Structure and Activity (BSBSA). However, the relationship between these two data sources is a bit complicated. BSBSA is an extensive survey for all firms with certain cut-off points so that even long panel data have enough observations for analysis. In each year, it covers around 30 000 firms, and panel data from 1994 to 1998 have about 18 000 observations. However, the latest data point as of December 2002, is 1999, and 2000 data will be available soon. The survey items include a broad range of firm activities, such as R&D, overseas production and outsourcing. It also contains financial statement information which allows productivity calculations, and information network variables are available for 1991, 1994 and 1997. Therefore, it is possible to conduct firm level analysis of information network use by using only BSBSA data. Motohashi (2002), for example, looked at the impact of information network use by type of e-business, based on cross-section data from the 1991 BSBSA.
The ICT Workplace Survey provides more detailed and up-to-date information on firm level IT-related activities. Data from this annual survey for 2000 are already available, with detailed variables on IT investments and e-business process, as is mentioned in section 13.3.2. However, since significant changes in sampling framework for the 2000 survey have been implemented, the construction of panel data is difficult. The number of observations in the 2000 survey is around 5 000, but linkage with the previous year gives only 1 000 or less observations. When it is linked with BSBSA panel data from 1994 to 1998, the number of linked firms becomes nearly 3 000. Therefore, the ICT Workplace Survey data can be used as a complement to the BSBSA panel data, in a sense that it supplements up-to-date and detail information on IT.
In this paper, BSBSA panel data from 1994 to 1999 are used, since the ICT Workplace Survey in 2000 gives only IT use variables but no performance variables.

289
In the United States, results reported in this section are mainly from Atrostic and Nguyen (2002) and are based on US manufacturing plants that responded to the 1999 US CNUS survey. These results are not weighted, and do not reflect the entire US manufacturing sector; totals are more likely to be representative of the larger plants in manufacturing (see Manufacturing 1999 and mid-2000 at www.census.gov/estats). In addition, the CNUS data are linked to observations for the same plant in the Annual Survey of Manufactures for 1999, and to the Economic Census for 1992 and 1997.
13.4.2 Cross section analysis of network use and productivity
Table 13.4 shows that labour productivity difference between network users and non-users in Japan and the United States. It should be noted that the definition of value added for both countries is different, due to the difference in the unit of observation. In addition, the timing of observation is different. However, it is interesting to note that manufacturing firms/plants with networks have higher labour productivity in both countries. Moreover, it is found that firms/plants with networks were much larger than those without networks.
Table 13.4. Labour productivity for network users and non-users in Japan and the Unites States
Japan (1997) United States (1999)
With networks Without networks With networks Without networks
Sales/employment 36.5 32.22 284.79 222.39
Value added/employment 7.48 7.14 133.65 103.29
Employment 829.70 363.59 235.70 118.64
To look at the relationship between network use and productivity, a regression analysis is conducted for Japan and the United States. Table 13.5 shows the regression coefficients for dummies of network use in production function estimates, using 1997 BSBSA data for Japan. In the 1997 survey of BSBSA, variables on the use of IT network by type, such as intra and inter firm network, POS/EOS, CAD/CAM, EDI and e-commerce, are available. The Cobb Douglas production function with value added as an independent variable, and the usual factor inputs such as employment and capital stock, as well as a dummy variable for network use as dependent variables is estimated for each type of IT network. In addition, each regression is conducted by controlling for the industry and size class of each firm.
Table 13.5 shows the penetration rate of each type of network, as well as the estimated coefficients and p-values for network use dummies in regression results by type of network. It is found that use of both intra firm and inter firm networks is positively correlated with TFP levels at the firm level. In terms of the types of network, positive and statistically significant coefficients are found for “open network (Internet)”, “CAD/CAM” and “EDI”. The lower panel of Table 13.5 shows the results from the same regression analysis, but only for a group of firms with inter firm networks, in order to show the relative significance of the productivity impact of IT by type of network. It is found that the use of “CAD/CAM” has a positive impact on TFP levels as compared with other types of networks, while the use of “POS/EOS” has a negative impact.
The same type of regression analysis is conducted with the US data. The ordinary least squares (OLS) regressions reported in Table 13.6 show the effect of controlling for other plant characteristics (columns 1-3), and for controlling for prior conditions at the plant (column 4). Estimates based on this measure (columns 1 and 3) show that labour productivity in US manufacturing plants with networks is about 5% higher than in plants without networks. Estimates based on the value-added labour

290
productivity measure (column 2) show that labour productivity is about 11% higher in plants with networks. These OLS estimates are robust to alternative specifications of the underlying Cobb-Douglas production function model.
Table 13.5. Cross section regression of TFP and network use, Japan, 1997
Type of network Penetration rate Repression coeff. (p-value)
(For all firms)
Intra firm network 59.8% 0.080 (0.0%)
Inter firm network 28.3% 0.018 (5.1%)
Open 3.4% 0.039 (8.6%)
POS/EOS 18.5% -0.014 (18.8%)
CAD/CAM 48.3% 0.052 (0.0%)
EDI 20.3% 0.026 (1.4%)
EC 0.9% -0.049 (25.0%)
For firms with inter-firm networks
Open network 10.6% 0.030 (18.4%)
POS/EOS 28.0% -0.028 (6.6%)
CAD/CAM 53.6% 0.053 (0.1%)
EDI 38.0% 0.022 (14.8%)
EC 2.1% -0.052 (28.1%)
Estimates in column (4) control for prior conditions at the plant, and use the predicted probability of having a computer network in 1999 (Pr (CNET)) instead of the actual presence or absence of a network in 1999 (CNET). The coefficients of CNET and Pr (CNET) are not directly comparable. One way to interpret the two-stage estimates is to compare the productivity impacts of computer networks on plants at two points in the predicted probability of having a computer network. An example close to our data compares plants at the 10th and 90th percentiles of the estimated probability of having a computer network. (Recall that about 12% of the plants in our sample do not have a computer network.) The respective estimated probabilities of these plants adopting a computer network (based on probit regressions not reported here) are 0.8422 and 0.9671.Using the estimated coefficient for the “Pr (CNET)” of .505 from the probit regression (column 4 of Table 13.2), we can calculate the expected productivity difference between the two plants: 0.505(0.9671 – 0.8422) = 0.0631. The productivity difference means that a plant moving from the 10th percentile (less likely to have a computer network) to the 90th percentile (more likely to have a computer network) would increase its labour productivity by 6.31%. Many studies find that controlling for prior conditions substantially

291
lessens the estimated impact of IT. However, in this case, the estimate controlling for prior conditions is about two percentage points above the estimates obtained from the OLS models.
Table 13.6. Labour productivity regression results, United States
Dependent variable: labour productivity (t-statistics in parentheses)
OLS estimates Two-stage estimates
Gross output Value-added Gross output Gross output
Independent variables (1) (2) (3) (4)
Intercept 2.678 (159.95)
3.736 (144.57)
2.830 (119.48)
2.357 (32.50)
CNET .046 (5.76)
.105 (7.85)
.033 (3.00)
(--)
Pr(CNET) (--) (--) (--) .505 (6.41)
SKILL .043 (12.28)
.084 (14.12)
.039 (8.40)
.037 (8.12)
Log(K/L97) .091 (39.86)
.186 (49.91)
.088 (28.81)
.084 (26.61)
MULTI .114 (19.30)
.236 (24.17)
.101 (12.58)
.039 (3.31)
Log(M/L) .515 (206.74)
(--) .505 (148.93)
.506 (150.48)
Size2 -.055 (7.92)
-.049 (4.13)
-.052 (5.52)
-.047 (5.09)
Size3 -.084 (12.43)
-.077 (6.72)
-.079 (8.88)
-.073 (8.35)
Size4 -.092 (11.25)
-.097 (6.96)
-.083 (7.77)
-.071 (7.37)
Size5 -.090 (8.74)
-.107 (6.19)
-.070 (5.23)
-.065 (4.88)
Size6 -.017 (1.21)
.012 (0.53)
-.008 (0.460)
-.004 (0.22)
Industry (three-digit NAICS) Yes Yes Yes Yes
R2 .756 .261 .750 .756
Number of plants 29 808 29 671** 17 787*** 17 787
** The number of observations in column (2) is smaller than that in column (1) because a number of plants have value-added equal to zero.
*** The number of observations in columns (3) and (4) are smaller than in column (1) for two reasons. Many plants did not respond to the 1992 computer investment question used to construct the Pr(CNET) measure used in the two-stage regressions of column (4). In addition, the Pr(CNET) measure takes account of the plant’s prior condition, and so could be constructed only for plant in existence in both 1992 and 1999.
Source: Atrostic and Nguyen 2002, based on their calculations from the US CNUS data linked to the ASM and CM.

292
4.3 Use of IT networks and productivity growth
The cross section analysis in the previous section shows the positive association between use of IT networks and productivity levels in both Japan and the United States. In addition, it is also found that the productivity impacts differ by the type of network in Japan. However, there is a problem associated with omitted variables in the regression analysis of the previous section. The productivity premium can be explained not only by IT network use, but also by other factors such as managerial abilities, employees’ skills and other intangible assets in the firm. If these kinds of omitted variables are correlated with the network dummy variable (and it is often the case), regression coefficients with networks have an upward bias. In order to mitigate this kind of problem, there are two standard alternatives. One alternative is to control for prior conditions in a two-stage estimate, as reported in column (4) of the US results. The other alternative is to check the relationship between network use and productivity growth, instead of the productivity level. The reason is that taking differences between two periods helps clean for time invariant omitted variables. The tabulations below calculate rates of growth between two periods for selected variables of interest, such as value added, employment, and labour productivity. The tabulations in Tables 13.7 and 13.8 are not directly comparable with the regressions presented in Table 13.5 for Japan or Table 13.6 for the United States because the tabulations do not control for factors such as inputs other than computers, or industry or size.
Table 13.7 shows the difference in labour productivity growth rates between firms with intra firm networks and firm without them in Denmark and Japan. In both countries, the growth rate is calculated for the period of 1995-97 and 1997-99, which are “before” and “after” the estimate of network use in 1997, respectively. In Denmark, firms with networks achieved higher growth of value added particularly after network introduction, but higher growth in employment at the same time, which leads to lower labour productivity growth. In Japan, firms with network use achieved a less sharp drop in labour productivity growth after network introduction as compared to non-users.
Table 13.7. Labour productivity growth and network use in manufacturing firms
# of
enterprise
Value added growth
95->97
Value added growth
97->99
Employment growth
95->97
Employment growth
97->99
LP growth
95->97
LP growth
97->99
Denmark Median Median Median Median Median Median
-Intranet in 97 568 13.2% 4.3% 3.5% 0.0% 7.0% 5.0%
-Intranet in 97 99 15.1% 8.7% 7.1% 2.3% 7.8% 4.2%
Total 668 13.8% 4.8% 3.8% 0.0% 7.1% 4.8%
Japan Mean Mean Mean Mean Mean Mean
-Intranet in 97 4 628 1.1% -8.8% -0.9% -5.3% 1.9% -3.5%
+Intranet in 97 6 111 3.0% -7.5% 0.3% -4.8% 2.7% -2.7%
Total 10 739 2.2% -8.0% -0.2% -5.0% 2.4% -3.0%

293
Table 13.8 is the same tabulation as Table 13.7 with different kinds of network for Japanese manufacturing firms. It is interesting to see the difference in the pattern of value added and employment growth. For example, firms with an EDI network achieved higher productivity growth after 1997, without higher growth rate of employment, while firms with “EC”, “LAN” or “POS/EOS” achieved both higher labour productivity and employment growth. As for “CAD/CAM”, the network firms show lower labour productivity growth, but this is caused by the skewed industry distribution of this type of network. That is, firms in the machinery industry are the main user of this network, and the machinery industry was faced with the greatest drop in value added in the period from 1997 to 1999. Therefore, it is important to control for industry effects for this type of IT network. More generally, tables such as these cannot account for important factors such as industry and firm size. Multivariate analysis to control for these factors provides better insights in the relationship between IT and outcomes of interest. In addition, it should be noted that the growth rate of value added and labour productivity is not adjusted for inflation. A proper treatment of price changes in both countries should be our next step as well.
Table 13.8. Labour productivity growth and network use by network type in Japan
% of enterprise
Value added growth 95->97
Value added growth 97->99
Employment growth 95->97
Employment growth 97->99
LP growth 95->97
LP growth 97->99
-EDI 8 747 2.0% -8.5% -0.2% -5.0% 2.1% -3.5%
+EDI 1 992 3.1% -6.3% -0.3% -5.1% 3.4% -1.2%
Total 10 739 2.2% -8.0% -0.2% -5.0% 2.4% -3.0%
-EC 10 640 2.2% -8.1% -0.2% -5.0% 2.4% -3.1%
+EC 99 1.9% -2.3% -0.2% -4.4% 2.2% 2.1%
Total 10 739 2.2% -8.0% -0.2% -5.0% 2.4% -3.0%
-LAN 4 134 0.8% -9.1% -0.9% -5.1% 1.7% -3.9%
+LAN 6 605 3.1% -7.4% 0.3% -4.9% 2.8% -2.5%
Total 10 739 2.2% -8.0% -0.2% -5.0% 2.4% -3.0%
-POSEOS 8 470 2.5% -8.7% -0.2% -5.1% 2.7% -3.6%
+POSEOS 2 269 1.0% -5.7% -0.1% -4.7% 1.1% -1.0%
Total 10 739 2.2% -8.0% -0.2% -5.0% 2.4% -3.0%
-CADCAM 6 534 0.7% -6.3% -0.5% -4.8% 1.2% -1.5%
+CADCAM 4 205 4.5% -10.7% 0.3% -5.3% 4.2% -5.5%
Total 10 739 2.2% -8.0% -0.2% -5.0% 2.4% -3.0%

294
13.5 Conclusion and next steps
This paper provides a first description of the project in which each country is developing an analytical database linking its new IT use survey to its underlying core business survey data, and, where relevant, to other statistical registers. With such databases, basic statistics on IT use can be derived, filling in Table 13.3 with data that are as comparable as possible. For example, consider Figure 13.2 for Japan and Table 13.2 for the United States. Figure 13.2 shows that the most common uses of B-to-B e-commerce in Japan was receiving and placing orders and dealings (about 20% of firms engaged in each of these). Table 13.2 for the United States shows that about 30-33% of US manufacturing plants used B-to-B e-commerce for e-purchases and e-shipments. Statistics for the Danish and Japanese manufacturing sectors will be calculated in the next phase. Specific analytical metrics will be chosen for the second portion of the table. In this paper, only pair wise tabulations are provided for the relationship between IT networks and productivity levels and growth. The next step should be tables for all three countries.
Finally, a series of hypotheses about the rate of IT use, and likely variations across industries and sectors in the three countries will be developed. The hypotheses will be based on the comparative summary statistics, and differences among the countries in their market and institutional structures. Multivariate analyses, such as the regression results for Germany and the US presented in the first OECD micro data study, and the US results presented in this paper, will be conducted in parallel as a possible way for key hypotheses.

295
ANNEX A
DESCRIPTION OF THE DANISH DATABASE ON IT IMPACTS
1. The 1998 survey on use of ICT by enterprises
The purpose of the survey is to monitor the use of information technology among enterprises, including electronic commerce and barriers to the use of IT. The statistics form part of Statistics Denmark’s focus on the information society. The Use of ICT in Danish enterprises 1998 survey was carried out in October 1998 and was published in January 1999. The content of the survey is very similar to the model survey on ICT usage by enterprises later agreed by the OECD’s WPIIS.
The survey is based on a voluntary postal questionnaire. The sample consists of more than 1 800 enterprises with a minimum of 20 full-time employees. Most of the industries in the private sector are represented in the population. The omitted industries are agriculture, recycling and electricity, gas and water supplies. Industries that are totally exempt from VAT are not included in the test sample. These are primarily in the financial sector and personal transportation.
As a general rule, the reference year is 1998. However, the enterprises were also asked about expectations regarding 1999, and previous use in 1997 for a number of variables.
Survey variables:
� Enterprises with ICT
� Share of PC users
� Share of enterprises with local network
� Barriers to the use of ICT
� Share of enterprises with Internet access*
� Share of Internet users in enterprise
� Share of enterprises with homepage*
� Share of enterprises with intranet*
� Use of Internet*
� Share of enterprises with EDI
*1997 or before, 1998, 1999 exp., Do not know/not relevant.

296
2. The accounts statistics, 1995-99
The accounts statistics are intended as an indicator of the activity level and of the structure of the Danish business sector. This means that the statistics should be seen as a primary source of financial data for analytical studies of Danish business enterprises, including data required for the evaluation and conception of government policies and decisions affecting the business community. Moreover, the accounts statistics are an essential input to the Danish national accounts statistics, and they provide the bulk of Denmark’s contribution to EUROSTAT’s structural business statistics at European level.
The statistics of business accounts cover construction and retail trade from the reference year 1994 at enterprise level (i.e. for legal units, such as corporations and sole traders) and from the reference year 1995 at establishment (workplace) level. The coverage was extended to manufacturing industries from 1995, to wholesale trade from 1998, and to the remaining part of the service industries from 1999. Prior to the reference year 1999 another type of accounts statistics was published as well (the SLS-E based accounts statistics).
The statistics are essentially aggregations of items of the annual accounts of business enterprises, notably items of the profit and loss account, the balance sheet and the statement of fixed assets. Thus, a wide range of subjects are covered, e.g. turnover, purchases, expenses, profits, assets, liabilities and investment. The statistical register includes more than 100 variables. Results are compiled and published at both enterprise and establishment level, including distributions according to kind of activity, form of ownership, size group and region.
The data collected from all sources are combined in such a way that a complete set of accounting items is computed for each business enterprise and its component units (establishments) in the survey population. The accounts statistics are a reliable indicator of the activity level and of the structure of the Danish business sector. The highest data quality is achieved at the enterprise level, primarily because the firms prepare their annual accounts at that level.
3. The Integrated Database for Labour Market Research (IDA)
The purpose of the Integrated Database for Labour Market Research (IDA) is to provide access to coherent data about persons and establishments at the level of individual persons and individual establishments. The database is suitable for a large number of research projects concerning the labour market, e.g. research into labour force mobility and job creation.
The distinctive feature of the database is that it enables a connection between persons and companies. It is thus possible to characterise persons on the basis of information about the companies, in which they are employed and correspondingly it is possible to describe companies on the basis of information about the employees. There are more than 200 variables in the database, including a vast number of background variables related to the population. Moreover, both persons and companies can be monitored over time. The database contains information about the entire Danish population and all companies with employees

297
IDA contains information from the following statistical registers at Statistics Denmark:
� The Central Database on Salary Information (COR) administered by the Central Customs and Tax Administration.
� The Register of Population Statistics.
� The Educational Classification Module (UKM)/The Register of Education and Training Statistics.
� The Employment Classification Module (AKM).
� The Register of Income Statistics.
� The Register-based Statistics of Establishments and Employment (EBS).
� The Register-based Labour Force Statistics (RAS).
� The Register of Unemployment Statistics.
As the database contains more than 200 variables, a list of them is not included here. The headline variables in the data sets for persons, jobs and establishments/firms are:
Persons
Gender, age etc. Family and household Education Employment and work experience Unemployment Income
Jobs
Job/occupation - full-time/part-time Hourly labour earnings Seniority Change in appointments: Recruitments/resignations
Establishments and firms
Year of establishment Sector, address, etc. Employees and level of labour earnings Identity over time (existing, closed down, newly established)
298
ANNEX B
DESCRIBING U.S. DATA
Annual Survey of Manufactures Computer Network Use Supplement
The Annual Survey of Manufactures (ASM) is designed to produce estimates for the manu-facturing sector of the economy. The manufacturing universe is comprised of approximately 380 000 plants. Data are collected annually from a probability sample of approximately 50 000 of the 200 000 manufacturing plants with five or more employees. Data for the remaining 180 000 plants with less than five employees are estimated using information obtained from administrative sources.
The 1999 Annual Survey of Manufactures Computer Network Use Supplement was mailed to the plants in the ASM sample. The supplement asked about the presence of computer networks, and the kind of network (EDI, Internet, both). It also collected information about manufacturers’ e-commerce activities and use of e-business processes. The questionnaire asked if the plant allowed online ordering and the percentage of total shipments that were ordered online. Information on online purchases was also asked. In addition, information was collected about the plant’s current and planned use of about 25 business processes conducted over computer network (such as procurement, payroll, inventory, etc., “e-business processes”) and the extent to which the plant shared information online with vendors, customers, and other plants within the company. Approximately 83% of the sampled plants responded to this supplement. All CNUS data are on the NAICS basis. See www.census.gov/estats for further details.
Linking the CNUS data to current and previous information for the same plants collected in the 1999 ASM, and the 1997 and 1992 Census of Manufactures (CM), allows us to examine many plant-level relationships among economic variables.

299
REFERENCES
Atrostic, B.K. and Sang Nguyen, “Computer Networks in US Manufacturing”, Working Paper No. 02-01, Center for Economic Studies, US Census Bureau.
Atrostic, B.K., J. Gates and R. Jarmin (2000), “Measuring the Electronic Economy: Current Status and Next Steps”, Working Paper No. 00-10, Center for Economic Studies, US Census Bureau.
Bartelsman, E., A. Bassanini, J. Haltiwanger, R. Jarmin, S. Scarpetta, and T. Schank (2002), The Spread of ICT and Productivity Growth: Is Europe Really Lagging Behind in the New Economy?, OECD, June.
Brynjolfsson, Erik and L.M. Hitt (2000), “Beyond Computation: Information Technology, Organizational Transformation and Business Performance”, Journal of Economic Perspectives, Autumn.
Boegh-Nielsen, Peter (2001), “EC-learnings: How to Measure E-commerce?”, presented at the International Statistical Institute, August.
Colecchia, A. and P. Schreyer (2001), “The Impact of Information Communications Technology on Output Growth”, STI Working Paper 2001/7, OECD, Paris.
Danmarks Statistik (2002), Serviceerhverv 2002:16, Statistiske Efterretninger.
Dedrick and Kraemer (1999), “Compaq Computer: Information Technology in a Company in Transition”, Center for Research on Information Technology and Organizations, University of California at Irvine.
European Commission, eEurope 2005, KOM(2002)263final.
Greenan, N. and J. Mairesse (1996), “Computers and Productivity in France: Some Evidence”, NBER Working Paper No. 5836, National Bureau of Economic Research, Cambridge.
Gupta, N.D. and D. Rothstein (2001), “The Impact of Worker and Establishment-level Characteristics on Male-Female Wage Differentials: Evidence from Danish Matched Employee-Employer Data”, Working Paper 347, Office of Employment Research and Program Development, Bureau of Labor Statistics, US Department of Labor.
Jorgenson, Dale W. and K.J. Stiroh (2000), “Industry-level Productivity and Competitiveness between Canada and the United States”, American Economic Review, May.
Jorgenson, Dale W. (2001), “Information Technology and the US Economy”, American Economic Review, March.
McGuckin, R., M. Streitwieser and M. Doms (1996), “The Effect of Technology Use on Productivity Growth”, CES-WP-96-2, April.
300
Mesenbourg, T. (2001), “Measuring the Electronic Economy”, www.census.gov/estats
METI (2002), “Survey on ICT Workplace 2001”, Preliminary Report, January 2002.
Motohashi (2001), “Economic Analysis of Information Network Use: Organizational and Productivity Impacts on Japanese Firms”, mimeo.
OECD (2002), Measuring the Information Economy, OECD, Paris.
OECD (2003), Science, Technology and Industry Scoreboard 2003., OECD, Paris.
Oliner, Stephen D. and D.E. Sichel (2000), “The Resurgence of Growth in the Late 1990s: Is Information Technology the Story?”, Journal of Economic Perspectives, Autumn.
Stiroh, K. (2001), “Information Technology and the US Productivity Revival: What Do the Industry Data Say?”, Federal Reserve Bank of New York Staff Reports, Number 115, January.
Solow, R. (1997), “We’d Better Watch Out”, New York Review of Books, July 12, 1987.
Triplett, Jack E. and B. Bosworth (2000), “Productivity in the Services Sector”, presentation at the American Economic Association meetings, January 9.

301
CONTRIBUTORS
Nadim Ahmad joined the OECD in 2000, after a four-year spell at the UK Office for National Statistics and Her Majesty’s Treasury. He studied at the University of Salford (UK) where he undertook a statistical doctorate, in collaboration with the UK Ministry of Defence, investigating the system performance of sonar. He has extensive experience of the national accounts and input-output tables in particular, on which he has published a number of articles.
Spyros Arvanitis is a senior research economist in KOF ETH (Swiss Institute for Business Cycle Research, Swiss Federal Institute of Technology Zurich), where he is head of the research group for competition and market dynamics. Dr. Arvanitis holds doctoral degrees from the University of Zurich (economics) and the Swiss Federal Institute of Technology Zurich (chemistry). He has published on economics of innovation, technology diffusion, firm performance and market dynamics.
B.K. Atrostic is a senior economist at the Center for Economic Studies (CES) of the United States Census Bureau. She joined CES in 1999 after conducting microeconomic analyses at other statistical, research, and policy institutions on a range of topics including consumer demand, health care, and tax policy. At CES, she has worked primarily on ICT and its contribution to productivity. She holds a Ph.D. in economics from the University of Pennsylvania in the United States.
John Baldwin is Director of MicroEconomic Analysis at Statistics Canada. He has written widely on topics related to Industrial Economics, Technology and Trade. He is the author of The Dynamics of Industrial Competition and Innovation and Knowledge Creation in an Open Economy, both produced by Cambridge University Press. He holds a Ph.D from Harvard University.
Tony Clayton is Head of New Economy Measurement at the UK Office for National Statistics, which he joined in 2001 to develop work on ICT impacts and measurement to support policy development. Before this he was a director of PIMS Associates in London, consulting on innovation and business performance for major international firms. He has published on various aspects of innovation, has a BSc in physics, and an MA in economics from Sussex University.
Chiara Criscuolo is a researcher at the Centre for Research into Business Activity (CeRiBA), since September 2001. She is currently a PhD student at the Department of Economics at University College London. Her current research interests focus on the performance and productivity of multinational corporations, the relationship between ownership structure and productivity; the role of innovation and ICT for firms’ productivity.
Andrew Devlin is a statistician at the OECD. He joined the OECD in 1998 and in recent years worked on the impact of ICT. Prior to working at the OECD he was a health statistician in the New Zealand Ministry of Health. Andrew has a MSc in statistics from Canterbury University.
Jyothi Gali is a senior research economist with the Productivity Commission. She joined the Commission in 2001 and has undertaken empirical analyses of regional trading agreements and productivity. Before joining the Commission, Jyothi was with the Queensland Department of Primary Industries working on issues relating to the agricultural industry and its structure. Jyothi received a doctor of philosophy in agricultural economics from the University of Queensland in 1998.
Peter Goodridge joined ONS in 2003, with a first class degree from Cardiff University. Peter has worked on price and productivity effects of electronic markets.

302
Paul Gretton heads the Trade and Economic Studies Branch within the Productivity Commission. He has lead a range of projects on matters relating to the assistance to Australian industry, analysis of the effects of trade and policy reform, land degradation and rural adjustment in Australia, and industry productivity and economic growth. This work has been published in a wide range of Productivity Commission inquiry and research reports.
Thomas Hempell is an economist at the Centre for European Economic Research (ZEW Mannheim). After studies of economy and philosophy in Hamburg and Barcelona, he joined the ZEW in 2000, initially to work with the Mannheim Innovation Panel. In 2001, he joined the newly founded ICT Research Group. He has worked on the impacts of ICT on firm productivity, focusing on the role of complementary firm strategies, like innovation, skills, human capital and organisational change.
Dr. Heinz Hollenstein heads the research group “Innovation, Growth and Employment” of the Swiss Institute for Business Cycle Research at the Swiss Federal Institute of Technology Zurich (KOF ETHZ). His research interests cover the economics of innovation and new technology; ICT; “New Workplace Organisation”, evaluation of technology policy, and internationalisation of R&D. He is also a permanent consultant of the Austrian Institute of Economic Research (WIFO), and has been on several policy-oriented expert groups advising ministries of the Swiss Federal State.
George van Leeuwen is researcher at the Methods and Informatics Department of Statistics Netherlands. Previously he worked at the Netherlands Bureau of Economic Policy Analysis (CPB) as a researcher for the CPB project ICT and Labour Productivity. In recent years he has primarily worked on firm-level data analyses of innovation, ICT and firm performance.
Mika Maliranta, Ph.D. (Econ.), is a head of unit at the Research Institute of the Finnish economy (ETLA). He has done research with various types of micro-level data in the fields of productivity, job and worker turnover and firm dynamics. More recent research interests include ICT and the role of skills in technological development.
Carlo Milana graduated in economics at the University of Rome. He is Research Director at ISAE (Istituto di Studi e Analisi Economica) of Rome and was a member of the National Price Committee in the Italian Ministry of Treasure. He was Research Director at ISPE (Istitute di Studi per la Programmazione Economica) in Rome from 1972 to 1998. His major experience is in the fields of productivity, indices of cost of living, accounting for structural changes of the economy, economic policy in industrial economics, foreign and international trade, regulation of prices in public utilities.
Kazuyuki Motohashi is Associate Professor at the Institute of Innovation Research of Hitotsubashi University and Senior Fellow of the Research Institute of Economy, Trade and Industry. Until this year, he worked for the Ministry of Economy, Trade and Industry of the Japanese Government, as well as the Directorate for Science, Technology and Industry of the OECD. He was awarded a Master of Engineering from University of Tokyo, an MBA from Cornell University and a Ph.D. in business and commerce from Keio University.
Sang V. Nguyen is a senior economist at the Center for Economic Studies (CES) of the United States Bureau of the Census. He joined CES in 1982. His research includes studies on mergers and acquisitions, production, costs, inventory demand, energy, productivity and IT. He holds a Ph.D. in economics from the State University of New York, Binghamton, USA.
Dean Parham is an Assistant Commissioner with the Productivity Commission in Canberra, Australia. Over recent years, he has led a stream of work that has examined Australia’s productivity performance, the factors affecting it, and the implications for Australian living standards. This work

303
has been presented and published in numerous Productivity Commission research reports, journal articles and conference papers and volumes.
Dirk Pilat is a senior economist in the Directorate for Science, Technology and Industry of the OECD. He joined OECD in 1994 and initially worked on unemployment, regulatory reform and product market competition. In recent years, he has primarily worked on productivity, the contribution of ICT to economic growth, and the role of firm dynamics. He holds a PhD in economics from the University of Groningen in the Netherlands.
Petri Rouvinen is a research director at ETLA, The Research Institute of the Finnish Economy. He holds a PhD in economics from Vanderbilt University. His research interests include ICT and tech-nology in general, innovation, R&D, globalization, competitiveness, and economic policy. He has served as a referee for and published in several scholarly journals.
David Sabourin is Chief of the Corporations Returns Act and Analysis Section of the Industrial Organization and Finance Division at Statistics Canada. He has co-authored several studies on advanced technology and innovation.
Paul Schreyer is head of the Prices and Outreach Division in the OECD Statistics Directorate. He joined the OECD in 1988, after working for the IFO Institute of Economic Research in Munich and the Institute for Economic Theory at Innsbruck University. He studied at the Universities of Birmingham (UK) and Innsbruck where he obtained a doctorate in economics. He has focused on productivity measurement and analysis, on which he published a number of articles and monographs.
David Smith holds a Masters of Economics from Dalhousie University, and is interested in technology’s impact on both firm performance and industry structure.
Kathryn Waldron joined ONS in 2002 with a first class degree from Birmingham University. Kathryn has worked on e-commerce adoption patterns.
Henry van der Wiel is economist at CPB Netherlands Bureau for Economic Policy Analysis (the Netherlands), where he is head of the project group ICT and Productivity. He has primarily worked on research on technology, innovation and productivity. Recently, he has worked on measuring the effects of ICT and other sources on productivity growth. Since 2003, he is associated with OCFEB, the Dutch Research Centre for Economic Policy. He is a member of various national advisory committees in the area of productivity, innovation and national accounts.
Anita Wölfl is an economist in the OECD Directorate for Science, Technology and Industry. Before joining the OECD, she was research associate at the Halle Institute for Economic Research, Germany. She holds a Masters degree in economics from the University of Regensburg (Germany) and Maastricht (the Netherlands), and a postgraduate certificate from the Advanced Studies Programme for International Economic Policy Research, at the Kiel Institute for World Economics, Germany, 1997.
Alessandro Zeli is a senior statistician in Structural Statistics on Enterprises Department of the ISTAT (Italian Institute of Statistics). He joined Istat in 1996. At the beginning he was involved in survey on economic accounts of SME; in 1998 he was entrusted with the management of the survey on economic accounts of larger enterprises. In recent years he worked on productivity, the estimation of efficiency frontiers and the dynamics of total factor productivity. He holds a Dottorato di Ricerca (Italian PhD level) in economics from the University of Roma “La Sapienza” in Italy.

OECD PUBLICATIONS, 2, rue André-Pascal, 75775 PARIS CEDEX 16
PRINTED IN FRANCE
(92 2004 05 1 P) ISBN 92-64-02103-5 – No. 53421 2004
Cover_a.fm Page 3 Friday, February 20, 2004 3:33 PM