the economic impact of electricity price increases on ... · • for much of the past three...
TRANSCRIPT

The Economic Impact of Electricity Price Increases on Various Sectors of the South African EconomyA Report consolidating the findings of recent research
©2012 Deloitte Touche Tohmatsu Limited. All rights reserved.
Purpose of this study
2
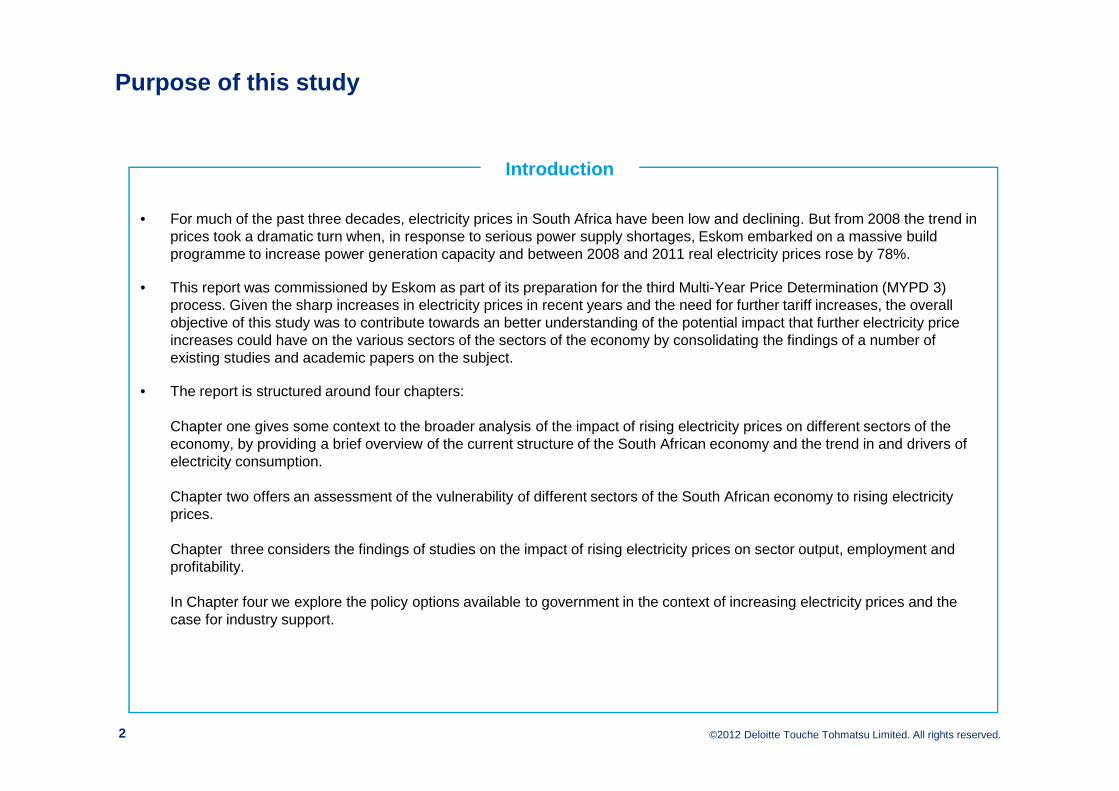
• For much of the past three decades, electricity prices in South Africa have been low and declining. But from 2008 the trend in prices took a dramatic turn when, in response to serious power supply shortages, Eskom embarked on a massive build programme to increase power generation capacity and between 2008 and 2011 real electricity prices rose by 78%.
• This report was commissioned by Eskom as part of its preparation for the third Multi-Year Price Determination (MYPD 3) process. Given the sharp increases in electricity prices in recent years and the need for further tariff increases, the overall objective of this study was to contribute towards an better understanding of the potential impact that further electricity price increases could have on the various sectors of the sectors of the economy by consolidating the findings of a number of existing studies and academic papers on the subject.
• The report is structured around four chapters:
Chapter one gives some context to the broader analysis of the impact of rising electricity prices on different sectors of the economy, by providing a brief overview of the current structure of the South African economy and the trend in and drivers of electricity consumption.
Chapter two offers an assessment of the vulnerability of different sectors of the South African economy to rising electricity prices.
Chapter three considers the findings of studies on the impact of rising electricity prices on sector output, employment and profitability.
In Chapter four we explore the policy options available to government in the context of increasing electricity prices and thecase for industry support.
Introduction

©2012 Deloitte Touche Tohmatsu Limited. All rights reserved.3
Contents
Purpose of the study
Executive Summary
Analysis and Findings
Chapter 1 – The structure of the South African econo my & trend in electricity consumption
Chapter 2 – The vulnerability of sectors of the SA economy to rising electricity costs
Chapter 3 – The Impact of electricity price increases
Chapter 4 – Exploring policy options available and the case for industry support

©2012 Deloitte Touche Tohmatsu Limited. All rights reserved.
Services dominate the SA economy accounting for ove r two-thirds of GDP and employment. However relatively energy-inten sive primary and secondary industries still contribute around 28% of GDP
4
• The South African economy is dominated by services-related activity – 67% of GDP
• Of the five largest sectors of the economy in 2010, four were services-related
• It is however important to note that manufacturing remained the second-largest individual sector contributor at 17.2% of GDP in 2010 and together with other relatively energy-intensive sectors (mining, electricity and other utilities, and agriculture), 28% of GDP.
• Some sectors of the South African economy are by nature, more labour-intensive (high employment to GDP ratios) than others.
• Sectors like construction, agriculture and wholesale\retail make a much larger proportional contribution to employment than to GDP.
• While sectors like finance and business services, contribute 23.5% of GDP in 2010 but accounted for only 14% of employment in 2011.
Key pointsSouth African GDP by sector (2010)
Agriculture, forestry and fishing
2.5%Mining and quarrying
6.0%Manu-facturing
17.2%
Electricity, gas and water2.1%
Construction3.5%
Retai, trade and hospitality
13.7%Transport, storage
and com-munication
10.2%
Finance, real estate and
business services23.5%
General government
services15.1%
Personal services6.2%
Current Structure of SA Economy
1
Some sectors, including construction, agriculture a nd wholesale\retail trade are important in that th ey make a much larger proportional contribution to employment than to GDP
Sectoral contribution to total employment (2011)
Agriculture, forestry and fishing
5%
Mining and quarrying
3%
Manufacturing14%
Electricity, gas and water1%
Construction9%
Retail trade and hospitality
25%Transport, storage and communication
6%
Finance, real estate and
business services14%
General government
services11%
Personal services12%
Source: Frost and Sullivan, Reconstructed: Stats SA
Source: Q3 2011, Quarterly Labour Force Survey - StatsSA

©2012 Deloitte Touche Tohmatsu Limited. All rights reserved.
The extent to which an industry can generate employ ment for unskilled and semi-skilled workers is important in the contex t of South Africa –private households, agriculture and construction to p this list.
5
The demand for skilled, semi-skilled and unskilled labour by sector, 2010
28% 36%18% 10% 10% 11% 7% 7% 5% 6%
61%49%
52%43% 42% 39% 40% 29% 27% 22%
11% 15%
30%
47% 48% 50% 53%65% 69% 72%
0%
20%
40%
60%
80%
100%
Priv
ate
hous
ehol
ds
Agr
icul
ture
, for
estr
y an
dfis
hing
Con
stru
ctio
n
Who
lesa
le a
nd r
etai
l tra
de
Man
ufac
turin
g
Min
ing
and
quar
ryin
g
Tra
nspo
rt, s
tora
ge a
ndco
mm
unic
atio
n
Ele
ctric
ity, g
as a
nd w
ater
supp
ly
Fin
anci
al, i
nsur
ance
, rea
les
tate
and
bus
ines
sse
rvic
es
Com
mun
ity, s
ocia
l and
pers
onal
ser
vice
s
% o
f tot
al s
ecto
r's
empl
oym
ent Skilled
Semi Skilled
Low Skilled
Current Structure of SA Economy
1
• In South Africa, a large proportion of the potential workforce and unemployed have attained only a basic level of education so the extent to which an industry generates or can generate employment for relatively low-skilled workers is also of interest to policymakers.
• Frost and Sullivan (June 2011) argue that the economy would become more energy intensive if it is reoriented towards creating employment for semi-skilled and unskilled workers but it is not clear that this would be the case since the industries that demand the largest proportion of low and semi-skilled labour are labour rather than energy-intensive - agriculture (85%), private households (89%) and construction (70%) and wholesale\retail trade (53%)
Key points
Source: Deloitte Analysis, Quantec
©2012 Deloitte Touche Tohmatsu Limited. All rights reserved.
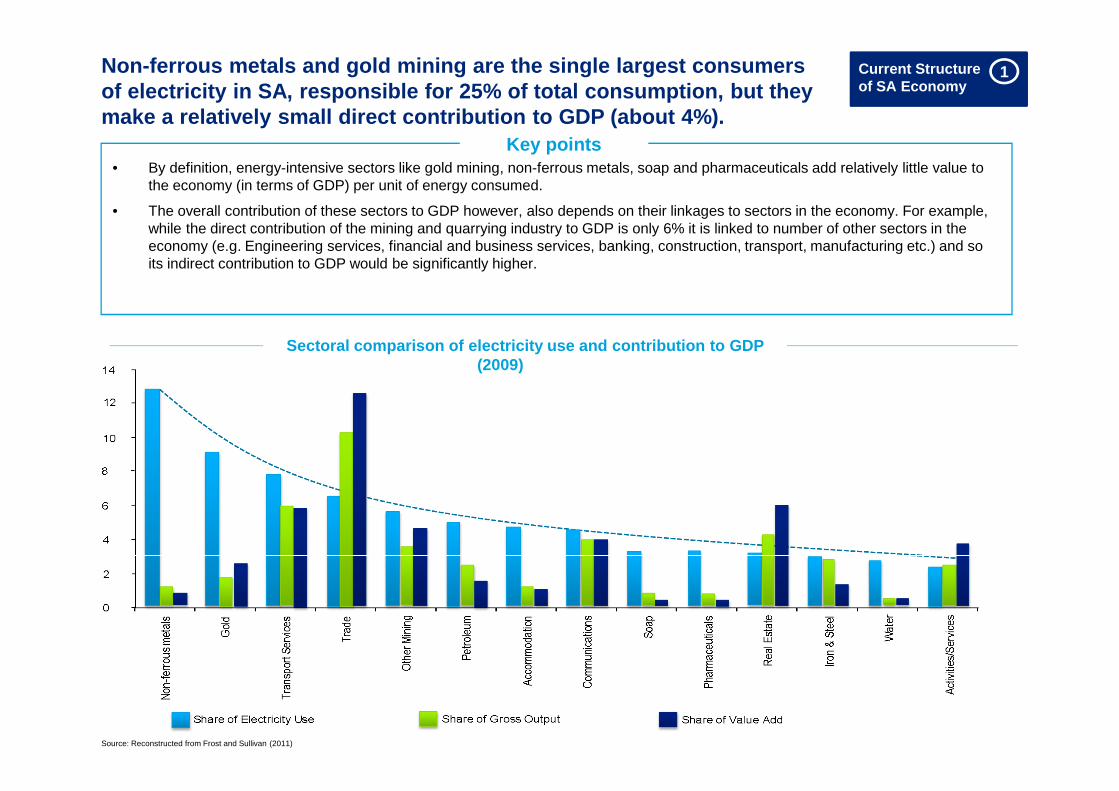
Non-ferrous metals and gold mining are the single l argest consumers of electricity in SA, responsible for 25% of total consumption, but they make a relatively small direct contribution to GDP (about 4%).
Deloitte6
Sectoral comparison of electricity use and contribut ion to GDP (2009)
Current Structure of SA Economy
1
• By definition, energy-intensive sectors like gold mining, non-ferrous metals, soap and pharmaceuticals add relatively little value to the economy (in terms of GDP) per unit of energy consumed.
• The overall contribution of these sectors to GDP however, also depends on their linkages to sectors in the economy. For example, while the direct contribution of the mining and quarrying industry to GDP is only 6% it is linked to number of other sectors in the economy (e.g. Engineering services, financial and business services, banking, construction, transport, manufacturing etc.) and so its indirect contribution to GDP would be significantly higher.
Key points
Source: Reconstructed from Frost and Sullivan (2011)

©2012 Deloitte Touche Tohmatsu Limited. All rights reserved.
Growth in electricity consumption from 1980 to 2008 was largely due to increased demand from a few large manufacturers and from redistributors (municipalities) who primarily suppl y residential and commercial customers
7
Eskom direct sales of electricity to the mining sector (1980-2008)
Eskom direct sales of electricity to the manufacturing sector (1980-2008)
0
5
10
15
20
25
30
35
40
1980 1985 1990 1995 2000 2003 2006 2008
Tho
usan
ds
Rest of Mining
Chrome Mining
Diamond Mining
Copper Mining
Iron Ore Mining
Coal Mining
Platinum Mining
Gold Mining
0
10
20
30
40
50
60
70
1980 1985 1990 1995 2000 2003 2006 2008
Tho
usan
ds
Rest ofManufacturingPrecious & Non-ferrous metalsIron & Steel
Chemicals
Trend in Eskom sales by category of customer (1980-2008)
020406080
100120140160180200
1980 1985 1990 1995 2000 2003 2006 2008
Tho
usan
ds
Residential
Redistributors
Industry
Mining
Agriculture
• In 2008 Gold was still the dominant consumer of electricity in the mining industry.
• Decreases in gold mining consumption since 1990 have been replaced with platinum consumption so that overall, consumption of electricity by the mining sector has remained relatively stable since the 1990s.
• By contrast sales of electricity to the manufacturing sector increased sharply from 1980 to 2008 driven mainly by growth and increased consumption by the non-ferrous metals and iron and steel sub-sectors
Key points
Current Structure of SA Economy
1
Source: (Deloitte , 2009), Eskom Source: (Deloitte , 2009), Eskom
Source: (Deloitte , 2009), Eskom

©2012 Deloitte Touche Tohmatsu Limited. All rights reserved.
At a macroeconomic level, the key drivers of electr icity consumption are income and price. Income is the dominant drive r of electricity consumption in South Africa but as real electricity prices continue to rise they may have more impact
8
Relationship between income (GDP) and electricity consumption in SA , 1993 to 2006
• Economic growth has proven to be one of the main drivers in South Africa and by contrast electricity prices (from 1986 to 2005) had almost no effect (Blignaut & Inglesi-Lotz , 2011).
• But Price elasticity has not been constant over time. When real electricity prices rose sharply in the early 1980’s, the price elasticity of electricity demand in South Africa was significantly negative (meaning that consumers decreased demand significantly in response to price increases). From the mid-1980s to 2007 however, there was a steady decline in real electricity prices and over this period they had increasingly little influence on consumption (Blignaut & Inglesi-Lotz, 2011).
• It seems likely therefore that as real electricity prices rise (as they have done since 2008), consumers will again become more sensitive to price and prices will again play an important role in determining electricity consumption in South Africa
Macroeconomic Drivers of Consumption
Source: (Inglesi-Lotz & Blignaut, 2011 a)
Price and income elasticities of electricity demand, 1986 to 2005
Source: (Blignaut & Inglesi-Lotz, 2011)
Vulnerability of sectors to rising electricity prices
2

©2012 Deloitte Touche Tohmatsu Limited. All rights reserved.
3 3 3 3 3
2113 11 9 6
12 2 2
2
1821 20 19
17
44
32
4
5 77 9
10
12 1313 14
13
15 1516 19 24
21 22 25 23 22
0
20
40
60
80
100
1970 1980 1990 2000 2010
% o
f tot
al G
DP
Community, social and personalservices
Financial, insurance, real estateand business services
Trade and hospitality services
Transport, storage andcommunication
Construction
Manufacturing
Electricity, gas and water
Mining and quarrying
Agriculture, forestry and fishing
At a microeconomic level the two main influences on electricity consumption are the changing structure of the econo my or ‘structural effect’ and the influence of new technologies or t he ‘efficiency effect’
9
Changing structure of the South African economy (1970 – 2010)
• Because the electricity-intensity of production varies considerably from one sector to the next, changes in the structure on an economy can have a significant impact on the trend in energy consumption. As the South African economy has evolved it has become more diversified, more services-based and less dependent on the primary sector (mining and agriculture).
• Despite the increasing contribution of less energy-intensive services to the economy, the electricity intensity of the South African economy more than doubled in the period from 1990 to 2007 (Inglesi-Lotz & Blignaut, 2011 b). This was probably due to the increase in energy-intensive manufacturing activities in the 1990s, particularly investment in the non-ferrous metals sector.
• The decline in the electricity intensity of the economy since 2007 is probably due in part to the impact of the global economic recession in 2008\9 but it could also mark the beginning of a new phase in which growth will increasingly be based on the demand for less energy-intensive services.
The structural effect
Current Structure of SA Economy
1
Source: Deloitte Analysis, StatsSA 2011
Electricity intensity of the South African economy
0
200
400
600
800
1000
1200
kWh
/ GD
P (
2005
pric
es, R
bn)
Source: World Bank Data, 2011; SARB GDP data

©2012 Deloitte Touche Tohmatsu Limited. All rights reserved.
Improving energy efficiency is one of the most econ omical ways of reducing energy consumption and there is evidence o f significant scope for energy-efficiency gains in South Africa
10
• A study comparing the electricity intensity of various sectors of the South African economy to the same industries in the OECD, found that there was significant scope for energy-efficiency gains in South Africa and noted that the importance of encouraging energy-efficiency and demand-side management could not be overstated. (Inglesi-Lotz & Blignaut (2011 b) )
• A decomposition analysis of electricity consumption in South Africa suggests that main drivers of electricity consumption from 1993 to 2006, were output (economic growth) followed by efficiency improvements (technology/substitute) and lastly structuraleffects.
• However the overall increase in efficiency is misleading since the greatest gains in efficiency were in the transport sector and were in fact due to the collapse of the rail freight sector and switch in transport modes from rail (which consumes electricity) to road freight (which consumes petroleum products).
The efficiency effect
Current Structure of SA Economy
1
“Energy efficiency improvements refer to a reduction in the energy used for a given service or level of activity. The reduction in the energy consumption is usually associated with technological changes, but not always since it can also result from better organisation and management or improved economic conditions in the sector (non-technical factors).”
World Energy Council
Policy makers should focus on sector-specific measu res to achieve such improvements given large inter- sectoraldifferences
Drivers of electricity consumption(1993 to 2006)
Source: (Inglesi-Lotz & Blignaut, 2011 a)

©2012 Deloitte Touche Tohmatsu Limited. All rights reserved.
400420440460480500520540560580600
1990
1991
1992
1993
1994
1995
1996
1997
1998
1999
2000
2001
2002
2003
2004
2005
2006
2007
2008
2009
f201
0f2
011
f201
2f2
013
f201
4f2
015
f201
6f2
017
f201
8f2
019
f202
0
toe
per
US
$m 2
005
GD
P
Economic growth is likely to remain the primary dri ver of electricity demand over the next decade since it is unlikely t hat rising prices or increased uptake of energy efficiency measures will be sufficient to offset the positive impact of rising income…
11
Economist Intelligence Unit forecast of the energy intensity of the SA economy (2010 to 2020)
• GDP is forecast to expand at an annual average rate of 4% from 2012 to 2015. Given that the income elasticity of electricitydemand is estimated to be around 1.2 (approximately unit elastic), in the absence of other influences, the demand for electricity would rise at a similar rate to GDP.
• Forecasts of electricity intensity by the CSIR (in Frost and Sullivan 2010), suggest that the electricity intensity of the SouthAfrican economy is likely to continue to decline over the next two decades. While declining energy-intensity would assist in moderating the increase in the demand for electricity, forecasts by the Economist Intelligence Unit (EIU) suggest that the energy intensity of growth in South Africa will continue to rise until 2020.
• It seems likely that as real electricity prices rise (as they have done since 2008), consumers will again become more sensitiveto price and prices will again play an important role in determining electricity consumption in South Africa. However it is too early to identify the impacts of recent prices increases so one can only speculate about the magnitude of the impact.
Outlook for electricity consumption
Current Structure of SA Economy
1
Source: EIU Data, 2011…It is also not clear what impact structural effects will have on demand given the considerable differe nces of opinion around the future trend in the electricity intensity of the South African economy
… or according to the CSIR?

©2012 Deloitte Touche Tohmatsu Limited. All rights reserved.
In an uncanny resemblance to the events and trend i n prices in the late 1970s, real electricity prices rose by 78% between 2008 and 2011.
For much of the past three decades, electricity pri ces in South Africa have been low and declining (in real terms). In 200 8 the trend in prices took a dramatic turn when in response to critical s upply shortages, Eskom embarks on a massive build programme
Trend in average electricity prices realised by Esk om per kWh
Electricity Prices in SA 1
Source: Deloitte Analysis, Eskom data and 2011 annual report

©2012 Deloitte Touche Tohmatsu Limited. All rights reserved.
0
0.05
0.1
0.15
0.2
0.25
US
$/kW
h
0.0
0.1
0.1
0.2
0.2
0.3
Italy
Ger
man
y
Spa
in
Bel
gium
Uni
ted
Kin
gdom
Aus
tria
Net
herla
nds
Por
tuga
l
Fin
land
Sw
eden
Pol
and
Aus
tral
ia
Fra
nce
Uni
ted
Sta
tes
Sou
th A
fric
a
Can
ada
US
$/K
Wh
In 2006 South Africa had the lowest industrial elec tricity tariffs in the world (IEA). And despite a 78% increase in real el ectricity prices between 2008 and 2011, a recent survey reveals tha t South Africa (compared to 15 developed countries) still had one of the lowest average electricity tariffs
Electricity tariff for industrial consumers, 2006
Average electricity price comparison, 2011
Electricity Prices in SA
Source: NUS Consulting, 2011
Source: (International Energy Agency, 2010) . Data for Netherlands, Luxembourg, Finland and Chile was not available for 2006
13
1

©2012 Deloitte Touche Tohmatsu Limited. All rights reserved.14
Contents
Purpose of the study
Executive Summary
Analysis and Findings
Chapter 1 – The structure of the South African economy & trend in electricity consumption
Chapter 2 – The vulnerability of sectors of the SA ec onomy to rising electricity costs
Chapter 3 – The Impact of electricity price increases
Chapter 4 – Exploring policy options available and the case for industry support

©2012 Deloitte Touche Tohmatsu Limited. All rights reserved.15
An industry’s vulnerability to rising electricity p rices depends, most obviously, on its reliance on electricity as an inp ut to production but also on the extent to which it is able to mitigate against the impact of rising electricity prices
Vulnerability of sectors to rising electricity prices
2
Reliance on electricity as an inputThe first group of criteria are indicators of the firm\industry’s reliance on electricity as a factor input
• Direct electricity costs as a proportion of total inputs costs
• Electricity intensity (i.e. electricity consumption per unit of output)
• Direct and indirect electricity costs as a proportion of total inputs costs
Ability to mitigate against rising pricesThe second group of criteria are indicators of the extent to which a firm\industry is able to adapt to rising prices and mitigate against the negative impact on its profitability
• Ability to pass on the cost (i.e. pricing power and price elasticity of demand)
• Scope for electricity efficiency gains
• Potential to substitute electricity with cheaper energy sources
Vulnerability Criteria

©2012 Deloitte Touche Tohmatsu Limited. All rights reserved.
Mining and quarrying
Transport, storage and communication
Wholesale and retail
Manufacturing
Agriculture, forestry
Other services (gov &
Finance, real estate
Construction
1 2 3 4 5 6
%
--
-
-
-
-
-
-
-
-
Mining and quarrying emerges as the sector with the greatest reliance on electricity, with electricity accounting for alm ost 5% of the sectors total input costs
16
• Interestingly, the ratio of electricity costs to total input costs is higher for the transport, storage and communication and wholesale\retail trade sectors than is it for manufacturing which one would typically expect to be more reliant on electricity
• This however is probably because of the considerable variation in reliance on electricity within the manufacturing sector
Value of electricity consumed expressed as a percen tage of intermediate inputs
Source: Chamber of Mines in (Pan-African Investment & Research Services, Eskom, May 2011)
Direct electricity costs as a proportion of total i nput costs
Vulnerability of sectors to rising electricity prices
2
In the Construction industry, which is at the other end of the spectrum, direct electricity costs are less than 0.5% of total input costs.

©2012 Deloitte Touche Tohmatsu Limited. All rights reserved.
* These estimates were calculated on the basis of data provided in the 2002 Supply Use Tables (SUTs) published by Statistics South Africa (Stats SA) in 2005. Sub-industries are ranked according to the share of electricity in their total costs – only data on the 30 most-dependent industries out of the total of 94 have been presented
A more disaggregated view of the share of electrici ty in the cost structure of South African industries was presented in a 2008 report by the HSRC. Of 94 sub-industries, non-ferrous metals is by far the most reliant on electricity
17
• The other manufacturing sub-industries in the top 10 include ’other’ textiles and knitting, general hardware, tyres, soap and pharmaceuticals. The water and electricity supply industries are also among the ten most electricity dependent industries, together with gold mining.
• 24 of the top 30 most reliant industries are manufacturing activities.
• The only service to feature in the top 30 is accommodation, which is quite surprisingly ranked 11th.
• Mining also features quite strongly - all 3 mining categories are among the top 30.
Direct electricity costs as a proportion of total i nput costs
The 30 most electricity–dependant sub-industries(electricity costs % of total costs), 2002
11
76
6 5 5 5 54 4 4
3 3 2 2 2 2 2 2 2 2 2 2 2 2 2 1 1 1 1
0
2
4
6
8
10
12
Non
-fer
rous
met
als
Gen
eral
har
dwar
e
Kni
tting
mill
s
Oth
er te
xtile
s
Tyr
es
Wat
er
Ele
ctric
ity
Gol
d m
inin
g
Soa
p
Pha
rmac
eutic
als
Acc
omm
odat
ion
Fis
h
Oth
er c
hem
ical
s
Tre
ated
met
als
Gea
rs
Lifti
ng e
quip
men
t
Mac
hine
tool
s
Cem
ent
Offi
ce m
achi
nery
Pet
role
um
Str
uctu
ral c
eram
ics
Mea
t
Han
dbag
s
Gra
in m
ills
Acc
umul
ator
s
Oth
er m
inin
g
Bak
erie
s
Oils
Foo
d m
achi
nery
Coa
l
% S
hare
of e
lect
ricty
in c
osts
Manufacturing
Electricity, Gas & Water
Mining
Agriculture, Forestry & Fishing
ServicesConstruction
3
Source: Deloitte analysis, based on Human Sciences Research Council (2008)
Vulnerability of sectors to rising electricity prices
2
©2012 Deloitte Touche Tohmatsu Limited. All rights reserved.
0.5 0.5 0.5 0.5 0.5 0.5
0.3 0.3 0.3 0.3 0.3 0.3 0.3 0.3 0.3 0.30.2 0.2 0.2 0.2 0.2
0.1 0.1 0.1 0.1 0.10.0 0.0 0.0 0.0
00.10.20.30.40.50.60.70.80.9
1
Woo
d
Sug
ar
Tex
tiles
Hou
seho
ld a
pplia
nces
Ele
ctric
ity a
ppar
atus
Clo
thin
g
Foo
twea
r
Pub
lishi
ng
Ele
ctric
al e
quip
men
t
Oth
er m
anuf
actu
ring
Rad
io a
nd te
levi
sion
Pap
er p
acka
ging
Min
ing
mac
hine
ry
Eng
ines
Con
stru
ctio
n
Insu
ranc
e
Str
uctu
ral m
etal
Agr
icul
tura
l mac
hine
ry
Mot
or v
ehic
le p
arts
Pla
stic
Gen
eral
gov
ernm
ent
Bui
ldin
gs
Oth
er p
aper
Bus
ines
s ac
tiviti
es
Pes
ticid
es
Oth
er fo
od
Wire
and
cab
le
Spe
cial
mac
hine
ry
Mot
or v
ehic
les
Rec
orde
d m
edia
ManufacturingElectricity, Gas & WaterMiningAgriculture, Forestry & FishingServicesConstruction
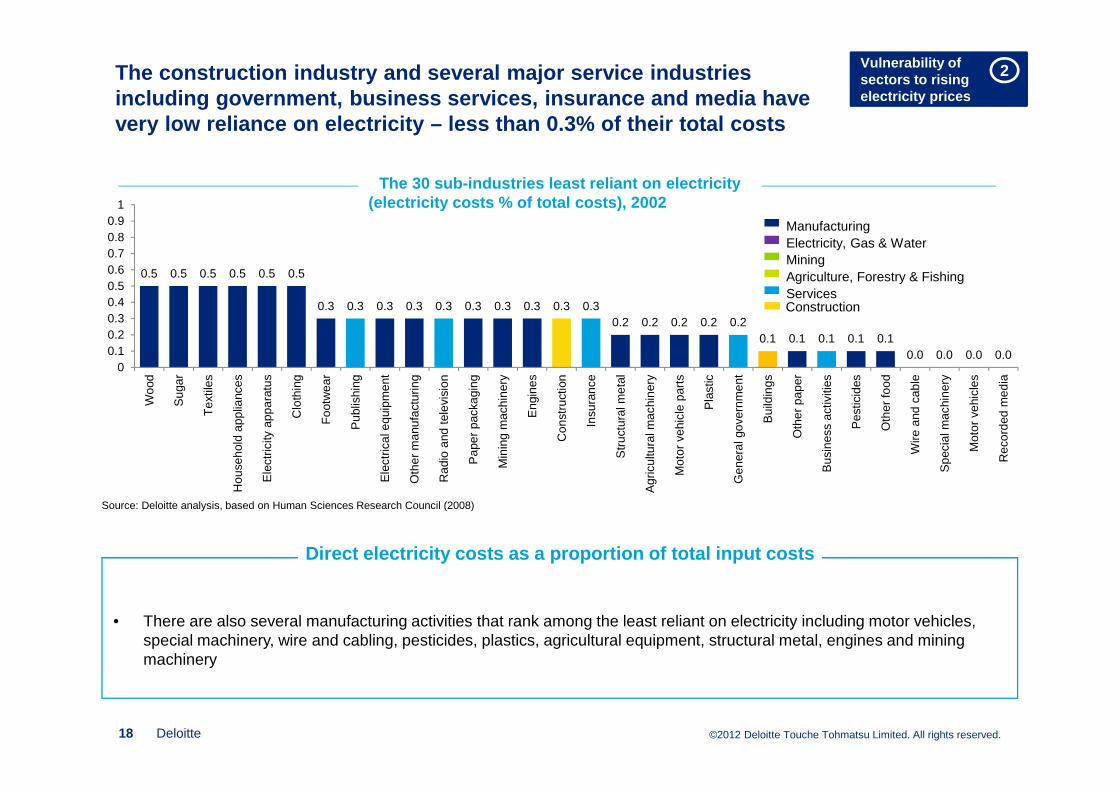
The construction industry and several major service industries including government, business services, insurance and media have very low reliance on electricity – less than 0.3% of their total costs
Deloitte18
• There are also several manufacturing activities that rank among the least reliant on electricity including motor vehicles, special machinery, wire and cabling, pesticides, plastics, agricultural equipment, structural metal, engines and mining machinery
Direct electricity costs as a proportion of total i nput costs
The 30 sub-industries least reliant on electricity (electricity costs % of total costs), 2002
Source: Deloitte analysis, based on Human Sciences Research Council (2008)
Vulnerability of sectors to rising electricity prices
2

©2012 Deloitte Touche Tohmatsu Limited. All rights reserved.
Electricity intensity is another measure of the rel iance of an industry on electricity based on actual consumption rather t han expenditure on electricity.
19
Sectors
Electricity intensity Electricity intensity
GWh/$million RankingOutput share Ranking
Basic metals 1.095 1 7.1% 7
Mining and quarrying 0.634 2 14.6% 2
Non-metallic minerals 0.524 3 1.6% 12
Agriculture and forestry 0.316 4 6.0% 8
Paper, pulp and printing 0.207 5 2.8% 10Chemical and petrochemical 0.203 6 16.3% 1
Transport 0.089 7 12.5% 3
Wood and wood products 0.069 8 1.4% 13
Textile and leather 0.067 9 2.5% 11
Food and tobacco 0.021 10 12.0% 4
Machinery and equipment 0.005 11 2.9% 9
Transport equipment 0.003 12 9.8% 6
Construction 0.002 13 10.5% 5
• There is considerable variation from one manufacturer to the next.
• Basic metals industry (which includes iron and steel and non-ferrous metals) is the most electricity-intensive of the thirteen industries
• But some of the other manufacturing activities including transport equipment, machinery and food in are among the least energy-intensive.
Key pointsElectricity intensity by sector, 2006
Source: (Inglesi-Lotz & Blignaut, 2011)
Vulnerability of sectors to rising electricity prices
2

©2012 Deloitte Touche Tohmatsu Limited. All rights reserved.
23%
50%
43%
77%
40%
29%
10%14%14%
0%
20%
40%
60%
80%
100%
Mining Manufacturing Metals
% o
f Res
pond
ents
Strongly Agree
Agree
Disagree
Strongly Disagree
Did not answer
A survey of large mining and manufacturing firms s uggests that there is some scope for efficiency gai ns but for large manufacturers and mining firms, limited abili ty to pass on increased costs
An firm’s vulnerability to rising electricity price s should also be assessed in terms of its ability to pass on the inc reased cost and the scope for efficiency gains.
20
30%
14%
85%
60% 57%
15%10%
29%
0%
20%
40%
60%
80%
100%
Mining Manufacturing Metals
% o
f Res
pond
ents
Yes
No
Possibly
Did not answer
Would you be able to pass on the cost of increased electricity prices if they rose by 50%?
• In the same survey , when asked about their ability to pass on a 50% price hike, the vast majority of respondents felt they would not be able to pass on the cost – none of the mining companies, only 14% of the metal manufacturers and 30% of the ‘other’ manufacturers.
Ability to pass on the costs
Source: (Deloitte& Eskom, 2009)
Vulnerability of sectors to rising electricity prices
2
Has your firm has been able to realise gains in electricity efficiency?
• In a survey of 31 of Eskom’s Key Industrial Customer, all respondents in the mining sector either agreed or strongly agreed that efficiency gains had been realised as compared to 90% of respondents in ‘other’ manufacturing and 62% in metal manufacturing.
Scope for electricity efficiency gains
Source: (Deloitte& Eskom, 2009)

©2012 Deloitte Touche Tohmatsu Limited. All rights reserved.
A comparison of the electricity intensity of SA ind ustries to their counterparts in the OECD suggests that there is sig nificant scope for efficiency gains
21
Sectors
Electricity intensity GWh/$million
Difference between OECD & SA
South Africa
OECD Difference
Weighted relative to
output difference
Agriculture and forestry
0.316 0.016 1870.90% 1242.4%
Basic metals 1.095 0.111 887.30% 644.2%Chemical and petrochemical
0.203 0.034 494.70% 462.9%
Construction 0.002 0.087 -97.90% -155.9%
Food and tobacco 0.021 0.023 -11.30% -7.8%
Machinery 0.005 0.028 -81.20% -416.9%Mining and quarrying
0.634 0.026 2305.60% 482.1%
Non-metallic minerals
0.524 0.02 2517.70% 3169.7%
Paper, pulp and printing
0.207 0.021 891.50% 1758.6%
Textile and leather 0.067 0.01 548.80% 398.3%Transport equipment
0.003 0.004 -20.10% -21.7%
Transport sector 0.089 0.013 563.40% 505.7%Wood and wood products
0.069 0.027 153.60% 162.5%
Scope for electricity efficiency gains
• This is particularly true in the non-metallic miners, mining and quarrying, agriculture, paper and basic metals sectors
• While a useful starting point, high-level comparisons of electricity intensity across sectors may mask fundamental differences in the characteristics of the industries across countries – e.g. the construction industry in South Africa is far more labour intensive than the industry in OECD
• If South Africa is to remain competitive relative to its OECD counterparts under more stringent trade regimes, including carbon and climate change considerations, improvements in efficiencies will be necessary (Inglesi-Lotz and Blignaut , 2011)
• Electricity efficient technologies can be costly and can take a long time to implement, especially within capital intensive sectors like mining.
• A study by the HSRC (2008) found that the only short term energy saving options available to the mining sector, which did not involve reducing output, were in the hostels or administrative offices
Source: (Inglesi-Lotz & Blignaut, 2011)
Vulnerability of sectors to rising electricity prices
2
Scope for efficiency gains

©2012 Deloitte Touche Tohmatsu Limited. All rights reserved.
Opportunities for fuel-switching as means to avoid rising electricity costs appear to be concentrated in a small number o f sectors by the cost savings can be significant
22
• A survey conducted on behalf the South African National Treasury, of 32 firms across 17 sub-sectors of the economy found that a few firms had implemented fuel switching investments in response to rising electricity prices (DNA Economics, 2011).
• The vast majority of these investments have been made since 2008 when real electricity prices began to rise sharply.
• Most of the firms who were invested in fuel substitution were switching away from grid electricity towards more efficient and less costly low-carbon alternatives including gas, waste and biomass.
Potential to substitute electricity with cost-effective alternatives
Vulnerability of sectors to rising electricity prices
2

©2012 Deloitte Touche Tohmatsu Limited. All rights reserved.
• Of the mining firms, gold are the most reliant on electricity as an input to production (with electricity costs as a percentage of total costs ranging from 6 to 14%), followed by platinum miners and lastly the diversified mining groups.
• A major challenge in trying to assess the impact of rising prices at firm level is that there are many instances where costs between local and off shore activities cannot be distinguished from one another –so attempts to assess exposure to rising costs or impact on profitability will not be robust.
• This problem is further exaggerated in the case of large global diversified mining groups who are involved in a multitude of activities and typically only report financial results at a group level.
• According to the report by RMB-Morgan Stanley (2011) the contribution of utility costs to total costs has rose steadily from 2007 to 2010, probably largely as a result of the sharp and consistent increases in real electricity prices over the period
The share of electricity in total costs varies cons iderably from one type of mining operation to another because of the considerable additional electricity costs associated with underg round mining (gold and platinum)
23
14
12 12
76 7 6
5 5
3
21
7
43 3
0
5
10
15
20
25
Sim
mer
s &
Jac
k M
ines
DR
D G
old
Har
mon
y
Gol
d F
ield
s
Ang
loG
old
Ash
anti
Nor
tham
Pla
tinum
Impa
la P
latin
um
Ang
lo P
latin
um
Aqu
ariu
s P
latin
um
Lonm
in
Mer
afe
Afr
ican
Rai
nbow
Min
eral
s
Exx
aro
Ang
lo A
mer
ican
**
Kum
ba Ir
on O
re
Gold Platinium Diversified MiningGroups
Ele
ctric
ity c
osts
as
% o
f tot
al c
osts
Mining and quarryingShare of electricity in total costs -selected mining companies
Source: (Deutsche Securities (Pty) Ltd, 2010)
Vulnerability of sectors to rising electricity prices
2
©2012 Deloitte Touche Tohmatsu Limited. All rights reserved.
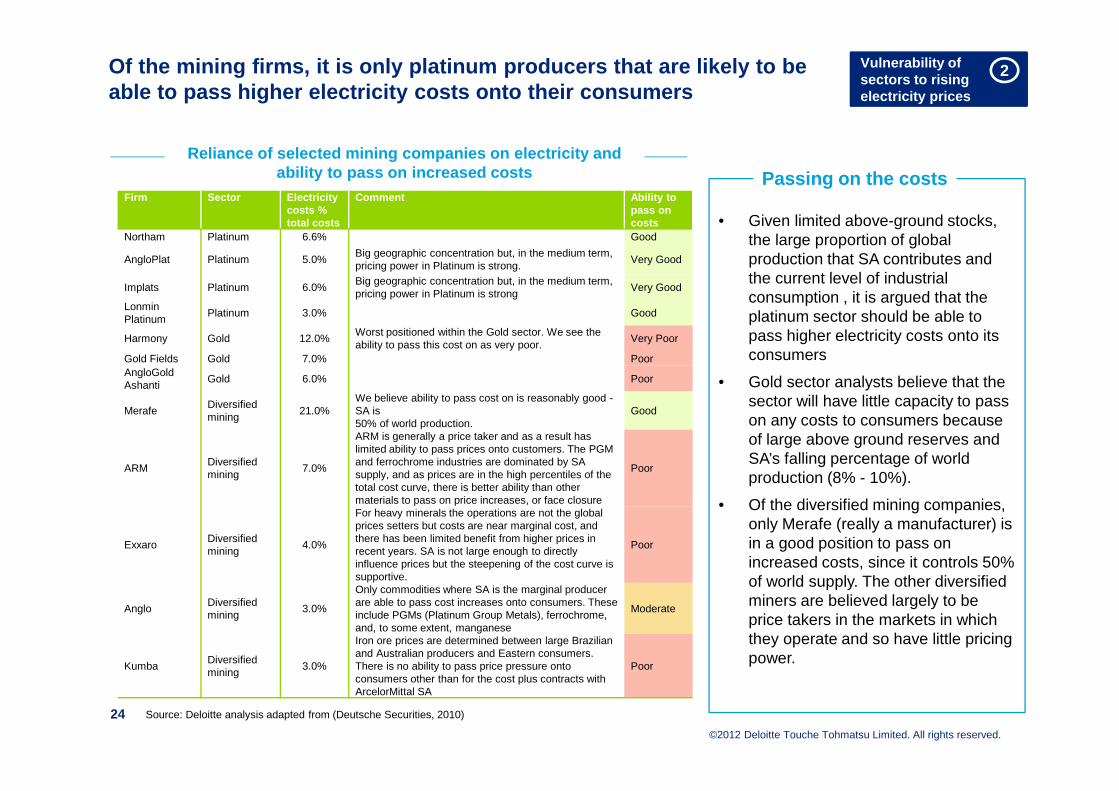
Of the mining firms, it is only platinum producers that are likely to be able to pass higher electricity costs onto their co nsumers
Firm Sector Electricity costs % total costs
Comment Ability to pass on costs
Northam Platinum 6.6% Good
AngloPlat Platinum 5.0%Big geographic concentration but, in the medium term, pricing power in Platinum is strong.
Very Good
Implats Platinum 6.0%Big geographic concentration but, in the medium term, pricing power in Platinum is strong
Very Good
Lonmin Platinum
Platinum 3.0% Good
Harmony Gold 12.0%Worst positioned within the Gold sector. We see the ability to pass this cost on as very poor.
Very Poor
Gold Fields Gold 7.0% PoorAngloGold Ashanti
Gold 6.0% Poor
MerafeDiversified mining
21.0%We believe ability to pass cost on is reasonably good -SA is50% of world production.
Good
ARMDiversified mining
7.0%
ARM is generally a price taker and as a result has limited ability to pass prices onto customers. The PGM and ferrochrome industries are dominated by SA supply, and as prices are in the high percentiles of the total cost curve, there is better ability than other materials to pass on price increases, or face closure
Poor
ExxaroDiversified mining
4.0%
For heavy minerals the operations are not the global prices setters but costs are near marginal cost, and there has been limited benefit from higher prices in recent years. SA is not large enough to directly influence prices but the steepening of the cost curve is supportive.
Poor
AngloDiversified mining
3.0%
Only commodities where SA is the marginal producer are able to pass cost increases onto consumers. These include PGMs (Platinum Group Metals), ferrochrome, and, to some extent, manganese
Moderate
KumbaDiversified mining
3.0%
Iron ore prices are determined between large Brazilian and Australian producers and Eastern consumers. There is no ability to pass price pressure onto consumers other than for the cost plus contracts with ArcelorMittal SA
Poor
24 Source: Deloitte analysis adapted from (Deutsche Securities, 2010)
Reliance of selected mining companies on electricit y and ability to pass on increased costs
• Given limited above-ground stocks, the large proportion of global production that SA contributes and the current level of industrial consumption , it is argued that the platinum sector should be able to pass higher electricity costs onto its consumers
• Gold sector analysts believe that the sector will have little capacity to pass on any costs to consumers because of large above ground reserves and SA’s falling percentage of world production (8% - 10%).
• Of the diversified mining companies, only Merafe (really a manufacturer) is in a good position to pass on increased costs, since it controls 50% of world supply. The other diversified miners are believed largely to be price takers in the markets in which they operate and so have little pricing power.
Passing on the costs
Vulnerability of sectors to rising electricity prices
2

©2012 Deloitte Touche Tohmatsu Limited. All rights reserved.
30
20 20 20
10
3.9
0
5
10
15
20
25
30
35
% o
f Ope
x
80
34
1510 10 9 9 6 5 1
0102030405060708090
% o
f Ope
x
The manufacturing sector is too diverse to make any generalisations about the vulnerability of the sector to rising ele ctricity prices. Basic metal, Cement and Paper producers are among the mos t reliant on electricity…
25
• Basic metals are one of the most heavily reliant on electricity, both in terms of the share of electricity in direct costs and measures of electricity intensity.
• Cement production is also quite heavily reliant on electricity, however the ability of cement producers to pass on increased costs is relatively strong (in a concentrated market the competition will not be willing to absorb price increases unless there is significant surplus capacity)
• Paper and pulp-manufacturing is also a relatively energy intensive activity, but the share of electricity in total costs seems to vary considerably from one plant to the next. Sappi report that electricity costs ranged from 5% to 9% of total costs for three of its plants
• Manufacturers of metal, glass, paper and plastic packaging for food and beverages is surprisingly reliant on electricity as an input with electricity costs for a diversified packaging company, such as Nampak, amounting to 4% of total costs (Deutsche Securities, 2010).
• Electricity is a relatively small portion (around 2.3%) of total costs for major food manufacturers such as Tiger Brands and Pioneer Foods. In addition food producers can pass on higher costs relatively easily.
Manufacturing
Electricity costs as a % of total operational costs - various manufacturers
Source: (Deloitte& Eskom, 2009) Source: (Deloitte& Eskom, 2009)
Vulnerability of sectors to rising electricity prices
2
Electricity costs as a % of total operational costs - metal manufacturers

©2012 Deloitte Touche Tohmatsu Limited. All rights reserved.
Rising electricity prices could have a material imp act on food retailers whose share of electricity costs in total costs ran ges from 3% to 4.3%...
26
Firm Sector Electricity % total costs
Comment Ability to pass on costs
Second-round impact
Lewis Retail 1.0% Moderate High
SparFood Retail
1.0%Franchisees pick up direct electricity cost, making it the exception among food retailers.
Good Low
JD Group Retail 1.6% Moderate High
Truworths Retail 1.8%
We have not included the indirect component via leases –Truworths is one of the more exposed in this regard.
Moderate Moderate
Clicks Retail 1.9% Moderate Moderate
Foschini Retail 1.9%
We have not included the indirect component via leases – Foschini is one of the more exposed in this regard.
Moderate Moderate
Massmart Retail 2.3% Moderate Moderate
Woolies 3.0%Cost of refrigeration makes electricity more significant for foodretailers.
Good Low
Pick n PayFood Retail
3.1%Cost of refrigeration makes electricity more significant for foodretailers.
Good Low
ShopriteFood Retail
4.3%Cost of refrigeration makes electricity more significant for foodretailers.
Good Low
Source: Deloitte analysis adapted from (Deutsche Securities, 2010
Vulnerability of sectors to rising electricity prices
2
• For food retailers, refrigeration is another significant driver of electricity consumption. As such food retailers are generally exposed to a much higher proportion electricity costs in total costs.
• Non-food retailers report that their direct electricity costs are between 1 and 2% of total costs.
• A further source of electricity-related cost pressure in the retail industry is the increase in ‘common charges’ incorporated in lease costs. Clothing retailers such as Foschini and Truworths appear to be most exposed to this category of costs
• Food retailers are in good position to pass on increased electricity costs to their consumers because they face relatively inelastic demand but given the concentrated nature of the retail market most retailers should be in a relatively good position to pass on costs.
(Deutsche Securities, 2010).
RetailersReliance of selected retailers on electricity and a bility to pass on increased costs
…But non-food retailers are exposed to the second-ro und impact of price increases since, consumers with squeezed real incomes are likely to reduce their spe nding on discretionary items

©2012 Deloitte Touche Tohmatsu Limited. All rights reserved.
The construction industry emerges consistently the industry with the lowest reliance on electricity. Firms in finance, i nsurance and banking and telecommunications and media also have very lim ited direct exposure to electricity costs…
Deloitte27
Firm Sector Electricity costs as a % total costs
Absa Banks 1.0%Metropolitan Life Assurance 1.1%Nedbank Banks 0.8%FirstRand Banks 0.8%ABIL General financials 0.7%
Standard Bank Banks 0.7%
Discovery Life Assurance 0.6%Liberty Life Assurance 0.6%Sanlam Life Assurance 0.2%Old Mutual Life Assurance 0.2%
• The construction has very limited direct exposure to rising electricity prices but may be impacted indirectly through lower investment spending and lower demand for new construction.
• Construction companies in South Africa including WBHO, Murray and Roberts Holding, Group Five and the Aveng Group face direct electricity costs of between 0.25% and 0.3% of total costs.
• Firms in the finance, insurance and banking sector are relatively resilient to electricity prices increases since electricity costs only account for between 0.2% and 1.1% their total operating costs .
• That said, the profitability of firms in this sector could be negatively impacted by the second-round impact of higher electricity prices.
• Firms in the telecommunication and media sector also have very limited direct exposure to rising electricity prices, since the proportion of electricity costs in total costs is between 0.1% and 0.8%
• Until this becomes a more material cost, there will probably little response by media and telecommunications firms to rising prices
Key PointsFinance, insurance and banking industry electricity as a % of costs
Source: Deutsche Securities, 2010
Vulnerability of sectors to rising electricity prices
2
Company Percent (%)Telkom 0.76Vodacom 0.43MTN 0.09Naspers Media 0.5%
Telecommunications and media electricity as a % of costs
Source: Based on Deutsche Securities, 2010
Source: Based on Deutsche Securities, 2010

©2012 Deloitte Touche Tohmatsu Limited. All rights reserved.
Summary of Key Findings
28
GWh/$million kWh/R GDP
HSRC, 2008 Pan African
(2011)Deloitte (2009)*
Deutsche Securities
(2010)
Inglesi-Lotz & Blignaut (2011b)
Conningarth (2011)
Deloitte (2009)*
Deutsche Securities
(2010)
Frost & Sullivan
(June 2011)
Agriculture, forestry and fishing 1.1 1.5 0.316 0.16
Mining and Quarrying 2.5 5 8 6.7 0.634* 0.32* No No No
Gold Mining 4.8 10.2 No
Platinum Mining 5.1 To a degree
Other\Diversif ied Mining 2 4.3 No
Coal Mining 1 < 4
Manufacturing 1.5 1.7 0.33*
Other manufacturing (average) 1.3 0.082 To a degree To a degree
Chemicals and petrochemicals 1 to 4 9 6 0.203 Yes
Paper and pulp 0.8 5 to 9 3 to 5 0.207 No
Food and Beverages 1.4 2.3 0.021 To a degree
Cement 2.1 10 to 15 5 Yes
Packaging (paper, glass etc) 0.3 4 To a degree
Metal manufacturing (average) 3.1 17 1.095 Limited No
Ferrochrome 20 21 Yes No
Non-ferrous metals 11
Electricity, gas and water 4.9 Yes
Construction 0.3 0.2 0.4 0.002 To a degree
Services Sectors
Wholesale and Retail Trade 0.6 2 1 to 4 To a degree Yes
Transport, storage and telecommunication
0.3 to 1.2 2.2 0.1 to 1 0.089 0.04 To a degree To a degree
Finance and business services 0.1 to 0.9 1.1 0.8 to 1 0.03 Yes Yes
Real estate and Accomodation 0.7 to 4 1.1 22 To a degree
Community, social and personal services
0.2 to 0.5 1.3
Overall vulnerability
rankingValue of electricity
consumed as % of total intermediate inputs
Electricity costs as % of total operating costs
Able to pass on costs?Electricity IntensityElectricity as % of total operating costs
Vulnerability of sectors to rising electricity prices
2

©2012 Deloitte Touche Tohmatsu Limited. All rights reserved.29
Contents
Purpose of the study
Executive Summary
Analysis and Findings
Chapter 1 – The structure of the South African economy & trend in electricity consumption
Chapter 2 – The vulnerability of sectors of the SA economy to rising electricity costs
Chapter 3 – The impact of electricity price increase s
Chapter 4 – Exploring policy options available and the case for industry support

©2012 Deloitte Touche Tohmatsu Limited. All rights reserved.
Assessing the impact of electricity price increases on sector employment, output and profitability
30
• In the previous section we assessed the relative vulnerability of different sectors, sub-industries and firms in the South African economy to rising electricity prices. But it is also important to consider the impact rising prices would have profitability, output and employment in these sectors.
• There are a few studies that attempt to assess the impact of electricity price increases on the different sectors and firms within the South African economy. These studies typically focus on the impacts on employment, output, and profitability for the various sectors or sub-sectors over various periods of time and under different assumed price increases.
• We discussed the results of two separate empirical analyses of the impact of rising electricity prices on the South African economy:
o Electricity Price Increases, Eskom’s Capital Expend iture Programme and Impact on the SA Economy, conducted by Pan-African Investment & Research Serv ices in May 2011 .The net impact of rising electricity prices and Eskom’s six-year capital investment programme were evaluated in the context of both a dynamic time-series macro-econometric (TSME) framework and a static Computable General Equilibrium (CGE) framework.
o Meeting South Africa's Future Electricity Needs - An Economic Growth and Development conducted by Conningarth economists in 2011As part of the study the vulnerability of sector profits to real electricity price increases were modelled and compared.
Introduction

©2012 Deloitte Touche Tohmatsu Limited. All rights reserved.31
• While the methods and data used in calculating the relative ‘profit vulnerability’ were not clearly articulated in the report, it appears that the analysis was based on data from the 2006 national social accounting matrix for South Africa and that the gross operating surplus of each industry may have been used as a proxy for its profit
• ‘profit vulnerability’ was defined as the real electricity price an industry could absorb before becoming unprofitable
• Some of the industries that exhibit the greatest ‘profit vulnerability’ to electricity price increases are the Cereal & Crop, Gold, Iron Ore, Magnetite, Silver, Asbestos, other non-metallic minerals, Platinum, Stone quarrying, Zinc, Paper & Paper Products, Publishing & Printing, Wood and Wood Products, Manufacturing of Transport Equipment, Rubber, Basic Metals, Meat, Fish and Vegetables industries.
• The analysis of profit vulnerability by Conningarth (2011) implies that in 2006, these industries would have been unable to absorb more than a 50% increase in real electricity tariffs prices before they became unprofitable (some only 10%)
• Had this measure of ‘profit vulnerability’ been acc urate most of these industries would have already c losed down since real electricity prices increased by clo se to 80% between 2008 and 2011
• While it is clear that industries are able to absorb a larger cumulative increases in real electricity prices than these rough estimates of profit vulnerability suggest, they probably still provide us a with a reasonably good indication of which sub-sectors of the economy are more vulnerable to electricity price increases than others
Profit Vulnerability
As part of broader study Conningarth economists expl ored the ‘profit vulnerability’ of different sectors of the economy to increases in real electricity prices
Impact of rising electricity prices on different sectors
3

©2012 Deloitte Touche Tohmatsu Limited. All rights reserved.
The results suggest that electricity intensity in i tself is not a good predictor of ‘profit vulnerability’, some relativel y low-intensity industries such as paper and wood products have slim profit ma rgins and on this basis are vulnerable to price increases
Mining sector profit vulnerability to real price In creases
10 10 10 10 10 10 20 30 40 5090
150 150 150 150 150
200 200
250
400
0
50
100
150
200
250
300
350
400
450
% c
hang
e in
rea
l ele
ctric
ity p
rices
Low electricity intensive manufacturing profit vuln erability
10 10 20 20
150
200
250
350 350
450
0
50
100
150
200
250
300
350
400
450
500
% in
crea
se in
Rea
l Ele
ctric
ity P
rices
Source: (Conningarth Economists, 2011)
Impact of rising electricity prices on different sectors
3
• Within the mining sector, gold, platinum, iron ore, silver, magnetite and asbestos mining are the most vulnerable to electricity price increases
• Manganese and coal mining emerge as the least sensitive to electricity price increases and at 2006 levels of profitability could have absorbed real electricity price increases in excess of 200%
• Among the manufacturing industries with a relatively low electricity intensity, paper and wood products and printing and publishing appear to be the most vulnerable to price increases, presumably because rising electricity prices would only put further pressure on their already slim profit margins
Results

©2012 Deloitte Touche Tohmatsu Limited. All rights reserved.
10 1030
6070
90
150 150 150
200 200
0
50
100
150
200
250
% c
hnag
e in
rea
l ele
ctric
ity p
rices
10
200 200
250 250
350 350
400 400 400
450
550
0
100
200
300
400
500
600
% c
hang
e in
rea
l ele
ctric
ity p
rices
There is considerable variation within industries – the cereals and crops industry that relies heavily on electricity f or irrigation and the dairy industry are more vulnerable to price increas es than most agricultural activities
High Electricity Intensive Manufacturing Sectors Pr ofit Vulnerability to Electricity Price Increases
Agricultural Sectors Profit Vulnerability to Real E lectricity Price Increases
Source: (Conningarth Economists, 2011)
Impact of rising electricity prices on different sectors
3
• Among the electricity intensive group of manufacturing industries that are already relatively exposed to price increases, rubber products, basic metals, meats, fish and vegetables and basic chemicals are the most vulnerable while the structural metal and machinery and equipment industries appear to be less vulnerable
• Aside from the cereals and crops industry that relies heavily on electricity for irrigation and the dairy industry that is also relatively electricity intensive, all the agricultural industries should be able to absorb at least a 200% increase in real electricity prices before they become unprofitable
Results

©2012 Deloitte Touche Tohmatsu Limited. All rights reserved.
Summary of Key Findings
Deloitte34
Profit Vulnerability
Max % increase in real electricity prices that industry can absorb
25% for 3yrs and 6% for 7yrs
25% price increase - low er estimate
25% for 3yrs and 6% for 7yrs
25% price increase - low er estimate
Pan African (2011) TSME Model
Pan African (2011) CGE Model
Pan African (2011) TSME Model
Pan African (2011) CGE Model
Agriculture, forestry and fishing 10% to 550% (320% on average) -0.05% -1.39% -1.77% -1.32%
Mining and Quarrying 10% to 400% (105% on average) -1.83% -1.62% -4.38% -1.76%
Gold Mining 10% -1.60% -1.80%
Platinum Mining 20%
Other\Diversif ied Mining 10% to 250%
Coal Mining 400% -0.20% 0.50%
Manufacturing 10% to 450% (141% on average) -0.23% -5.29% -2.16% -4.55%
Other manufacturing (average)
Chemicals and petrochemicals 60% q-0.1% to -0.6% 0.1% to -0.5%
Paper and pulp 10% 0% 0.40%
Food and Beverages 250% to 350% -1% -0.90%
Cement
Packaging (paper, glass etc)
Metal manufacturing (average) 10% to 200%
Ferrochrome 10%
Non-ferrous metals 10% -4.60% -3.70%
Electricity, gas and water 9.3% 11.1%
Construction -0.30% -0.21% -0.98% 0.63%
Services Sectors
Wholesale and Retail Trade -0.64% -1.37% -1.44% -0.81%
Transport, storage and telecommunication
-0.80% -1.95% -3.02% -1.53%
Finance and business services -0.22% -1.84% -0.71% -1.13%
Real estate and Accomodation -2.00% -1.10%
Community, social and personal services
-2.91% -1.68%
Impact of electricity price increase on output
Impact of electricity price increase on employmentOverall
vulnerability ranking
Impact of rising electricity prices on different sectors
3

©2012 Deloitte Touche Tohmatsu Limited. All rights reserved.35
Contents
Purpose of the study
Executive Summary
Analysis and Findings
Chapter 1 – The structure of the South African economy & trend in electricity consumption
Chapter 2 – The vulnerability of sectors of the SA economy to rising electricity costs
Chapter 3 – The impact of electricity price increases
Chapter 4 – Exploring policy options available and t he case for industry support

©2012 Deloitte Touche Tohmatsu Limited. All rights reserved.
The sharp increases in electricity tariffs since 20 08 have been met with significant public resistance. Some critics contend that “consumers have borne the brunt of a series of unjustifiable e lectricity price increases”
36
• An association representing large industrial electricity consumers, the Energy Intensive Users Group (EIUG) have argued that risingelectricity prices pose a serious threat to growth and that many industries are at “the tipping point” (EIUG, 2011).
• In a 2011 report, the Energy Intensive Users Group maintain “ that South Africa must have a transparent affordable [electricity] price” and argue that the affordable price path is one that balances viability, economic growth, global competitiveness and social development (where viability is defined as a price path that reflects a fair and efficient cost of supply) (EIUG, 2011).
• While the EIUG appear to support the notion that the electricity prices need to rise to a ‘cost-reflective’ level in principle, they argue that lower and more ‘affordable tariffs’ can be achieved by manipulating five aspects of the Eskom’s ‘allowed revenue’ formula–namely the rate of depreciation, the rate of return on assets (WACC), the cost of new capacity, assumptions regarding independent power producers and taxes and levies.
• Following a similar line of argument, Xstrata Alloys (January 2011) and Frost and Sullivan (2011) call for a ‘justifiable’ electricity price path for South Africa which offers viable and affordable tariffs and that balances and supports future supply requirements with developmental objectives. They argue that four options to mitigate high electricity prices should be considered (see below)
Key Points
Exploring thepolicy options available
4
Industry Options to Mitigate High Prices
Lower Eskom’s allowed return on assets
Don’t revalue the asset base (retain historic cost accounting)
Lower the target for renewable energy generation ca pacity in the current integrated resource plan
Allow independent power producers (IPPs) to sell to a system operator and to trade bilaterally

©2012 Deloitte Touche Tohmatsu Limited. All rights reserved.
Option Argument Criticisms and Implications
Lower Eskom’s
return on assets
(ROA)
• A return on assets sensitivity analysis indicates that this is one variable which can be easily adjusted to change the trajectory of the electricity price path.
• Dropping the allowed ROA from 8% to 6% drops the electricity price by 10c/kWh while still allowing Eskom to effectively manage its balance sheet.
• The ROA component should be designed to ensure the sustainability of Eskom by providing for sufficient revenue to maintain and upgrade existing infrastructure and investment in new capacity when required (Danilyuk, 2009).
• The allowed return on assets is not determined arbitrarily but must be referenced to the utility’s actual risk-adjusted weighted average cost of capital (WACC).
• If the ROA is set below the true risk-adjusted cost of capital, the resulting tariff is not cost-reflective, will not allow Eskom to recover the full cost of its assets or provide incentive to invest further. IPPs facing a higher cost of capital also have little incentive to invest.
• Tariffs that do not reflect the true cost of electricity supply lead to a misallocation of national resources and to mismatches between electricity supply and demand (Vedavalli, 1989).
• To assume that equity costs less than it actually costs implies that the shareholders (the state and taxpayers) would be subsidising electricity prices. (Joubert, October 2011).
• In addition as noted in section 2.6.1.2 for the current MYPD2 period NERSA did not in fact calculate Eskom’s allowable revenue on the basis of its published methodology. NERSA determined the “reasonable margin or return” on assets to 8.16%, but instead awarded Eskom a real (pre-tax) Weighted Average Cost of Capital (WACC) of 0.08%, 2.8% and 4.2% for the three respective financial years. This is because Eskom is currently still transitioning to more cost-reflective tariffs and a massive one-off price adjustment would be politically unviable.
Deloitte37
Exploring thepolicy options available
4However each of the options presented by industry r epresentatives suffer from considerable drawbacks. The first optio n, lowering Eskom’s ROA is not consistent with the fundamental principl es of an effective pricing regime – tariffs that are ‘cost-reflective’ tariffs and promote a financially sustainable electricity supply industry .

©2012 Deloitte Touche Tohmatsu Limited. All rights reserved.
The second option, retaining historic cost accounti ng practices, would in all likelihood give rise to more rapid electrici ty price increases over the next few years. Lowering the target for renewab le energy would result in lower tariffs but at the expense of the e nvironment.
Deloitte38
Option Argument Criticisms and Implications
Don’t revalue Eskom’s
assets
• One of the more controversial changes in the pricing methodology has been the reweighting of historical assets to reflect long run marginal cost of electricity. By 2025, the amount of new build capacity in the system would effectively raise the average value of the assets to replacement cost.
• By simply following the natural progression, the price path is lowered significantly.
• Ironically (as noted in section 2.6.1.1), the historic cost method gives rise to higher initial revenues (and therefore higher prices) than the depreciated replacement cost method during a period when large investments are undertaken. Therefore if NERSA retains the historic cost approach to asset valuation, tariff increases, as Eskom expands its build programme in the next few years, will in all likelihood increase more rapidly than if it adopts the depreciated replacement cost method. In addition all the drawbacks of the HC approach in the context of the electricity supply industry (as outlined in section 2.6.1.1) would continue to apply in future.
• It is also important to note that while NERSA have in principle adopted the depreciated replacement cost approach to asset valuation it has not yet been fully implemented. Tariffs currently remain well-below levels that reflect the true depreciated replacement cost of Eskom’s assets because NERSA will only allow Eskom to transition to cost-reflective tariffs over a number of years so as to avoid a one-off adjustment (and massive price shock). In the ‘MYPD2 reasons for decision document’ NERSA implied that to achieve this transition it is phasing in 3 components of the tariff formula – the ROA, the value of the asset base and the depreciation charge. (Joubert, October 2011).
Less Renewables • 33% of the new build plan is committed to renewable energy technologies and almost all to carbon neutral technologies
• From 2022 there is also a significant amount of OCGT capacity added to balance out uncertainty regarding renewable feedstock.
• The high capital costs for renewables combined with high operating costs for OCGT inflates tariffs and increases uncertainty regarding security of supply.
• A slower transition to renewables would allow for a lower tariff and a more thorough evaluation of the efficiency and reliability of renewable technology
• A slower transition to renewables would result in lower electricity prices to the extent that electricity produced from renewable technologies costs more than from conventional technologies. However this may not be true if the external environmental costs of conventional coal-fired power stations are factored in.
• It is government policy to apply multi-criteria to the evaluation and choice of technologies for future electricity infrastructure planning, not only the criteria of lowest cost. (Joubert, October 2011). Environmental sustainability in electricity pricing is recognised as a objectives of the South African government in the official electricity pricing policy, “The production and transport of electricity should be done in a sustainable way and be mindful of the impact on the environment.” ( DME, 2008).
• Environmental costs may soon be internalised through the introduction on taxes on carbon and other greenhouse gas emissions both domestically and internationally.
Exploring thepolicy options available
4

©2012 Deloitte Touche Tohmatsu Limited. All rights reserved.
The argument that the introduction of IPPs would re sult in lower tariffs is the most robust since it has been proven that in creased competition in the electricity supply industry often results in lower prices but this is not always the case since IPPs also face a higher c ost of capital
Option Argument Criticisms and Implications
Allow IPPs to sell to
a independent
system operator
• There are several reasons that introducing IPPs lowers the price path. They are proven to manage their CAPEX and OPEX more efficiently than SOEs, their speed of implementation is faster and lastly, as opposed to Eskom, they are unable to earn a return on work under construction
• By allowing Eskom to complete committed and new nuclear build plans and with IPPs delivering the remainder of new build , it is possible to maintain the price in between the justifiable range of 75c/kWh to 85c/kWh.
• IPPS are unlikely to enter the electricity supply industry until tariffs are cost-reflective and provide the incentive for them to do so.
• It is often argued that IPPs deliver power at least cost and lowest risk. In practice there is wide variation in the outcomes of IPP projects but there are many projects that are viewed as a success by investors and their host countries alike. (Woodhouse, 2005).
• While IPPs in a competitive environment may manage capex and opexmore efficiency than Eskom, they would also face a higher cost of capital which greatly increases the cost of supply in the capital intensive electricity supply industry and this may offset any potential reduction in capital and operating costs due to improved efficiency.
• Allowing a return on works under construction (WUC) is a common practice that has been widely adopted by regulators in countries including the UK, Australia and the US. Although it implies that some revenue is collected before the asset is operational, it is compensated for by reduced revenue over the rest of the operational life of the asset resulting in a similar present value of the total future revenue stream.
• Regardless of whether there is an independent system operator or Eskom acts as a single buyer, the final electricity tariffs consumers’ face will be a blended rate, so while Eskom’s tariffs may be lower due to the avoided capital expenditure, the blended tariff would include the IPP tariffs which will presumably be cost-reflective. (Joubert, October 2011).
Deloitte39
Exploring thepolicy options available
4

©2012 Deloitte Touche Tohmatsu Limited. All rights reserved.
The cost of failing to achieve cost-reflective tari ffs can be enormous and also has distributional implications…
If consumers don’t bear the full cost of electricit y supply, the taxpayer will
• Too often the criticism levied against Eskom or NERSA with respect to electricity prices hikes simply implies that tariff increases can be avoided without considering how the cost of new power capacity will be paid for or who will ultimately bear the burden.
• We found that while debt and equity are used to prefund major capital investment in electricity supply, ultimately tariffs need to cover the full cost of electricity supply, including the provision of an acceptable return on the equity or debt provided by the utility’s shareholders and lenders. So in other words, if electricity consumers don’t bear the full cost of electricity supply, the taxpayer eventually will.
In addition many studies of the impact of rising el ectricity prices fail to acknowledge that load shedding and ‘unserved energy’ (foregone growth) co mes at far greater cost to the economy than rising prices.
• Most studies of the impact of electricity price increases also focus solely on the short-run impact of rising prices on employment and output but fail to note that in the absence of cost-reflective prices, costly mismatches between supply and demand are likely to continue to occur. It has been proven that power outages or ‘unserved energy’ come at far greater cost to the economy than rising electricity prices.
• A study by Deloitte (2008) found that load-shedding had substantial economic impacts across most sectors of the economy and continued at 10% of total power capacity over a year could shave as much as 0.7 percentage points off GDP growth.
Deloitte40
Exploring thepolicy options available
4

©2012 Deloitte Touche Tohmatsu Limited. All rights reserved.
There are however several policy options available to government to mitigate the impact of rising electricity prices ….
Deloitte41
Exploring thepolicy options available
4
Subsidies
Policy Options
Gradual price adjustments
Promoting competition in the electricity
supply industry
Providing targeted
support to vulnerable industries
Accelerated EEDSM
Transition credits

©2012 Deloitte Touche Tohmatsu Limited. All rights reserved.
Any measure that keeps energy prices for consumers below market levels can be deemed an energy subsidy so as long a s electricity tariffs in South Africa remain below cost-reflectiv e levels, consumers of electricity are effectively receiving a subsidy from the government or taxpayer…
• Many Governments, while aware of the enormous costs of maintaining inefficient electricity prices have been reluctant to increase them and continue to provide implicit or explicit electricity subsidies.
• This implicit subsidy not only distorts the efficiency of the electricity market but promotes a transfer of wealth from South African taxpayers to the large consumers of electricity (which include large industrial consumers with substantial foreign shareholding).
42
Exploring thepolicy options available
4
Subsidies
Subsidies
Policy Options
Gradual price adjustments
Promoting competition in the electricity
supply industry
Providing targeted
support to vulnerable industries
Accelerated EEDSM
Transition credits

©2012 Deloitte Touche Tohmatsu Limited. All rights reserved.
Funding subsidies through budget provisions is alwa ys more efficient than cross subsidies, because it better p reserve proper economic price signals (and therefore investment an d consumption decision) and avoid the negative impact on other cu stomers that are not subsidised
• Subsidies no matter how justified socially severely distort demand patterns for energy and associated with significant economic, financial and environmental costs…
• But cross subsidies are particularly insidious because they imply that not only that some customers benefit from tariffs that are below cost-reflective levels but that some consumers must possibly bear tariffs that are higher than cost-reflective levels to fund them.
• While all subsidies are associated with significant drawbacks, the provision of a subsidy can be justified if it enhances access to sustainable modern energy or has a positive impact on the environment, while sustaining incentives for efficient delivery and consumption
• A good subsidy should be targeted, efficient, based on a rigorous analysis of the costs and benefits, practical, transparent and should only be provided for a limited amount of time . As such, we found that temporary and well-targeted subsidies could potentially be provided to vulnerable industries to give them time to adjust to higher electricity prices
43
Exploring thepolicy options available
4
Subsidies
Subsidies
Policy Options
Gradual price adjustments
Promoting competition in the electricity
supply industry
Providing targeted
support to vulnerable industries
Accelerated EEDSM
Transition credits
©2012 Deloitte Touche Tohmatsu Limited. All rights reserved.
More gradual tariff adjustments are often proposed as an obvious way to minimise the impact of rising electricity pr ices on the economy but this policy prolongs energy-inefficient investment and consumption and as a result could increase the risk of load-shedding
• It is often argued that increasing tariffs more gradually is one of the most obvious ways to minimise the short-run impact of rising prices on output and employment
• The basic reasoning is that gradual price increases over a given time path, provide firms with certainty, gives them time to adapt and therefore minimise adjustment costs.
• However, the policy of gradual price adjustments also suffers from some drawbacks. Firstly, if cost-reflective tariffs are to be attained, domestic electricity prices must still rise faster than world electricity prices over the ‘transition period’. Secondly, introducing tariff increases more gradually prolongs the period over which energy-inefficient investment takes place and also moderates the pace of improvements in energy-efficiency.
• Given that South Africa is currently facing power capacity constraints, introducing tariff increases more gradually could prove very costly if limits the extent to which higher prices encourage efficiency-improvements and therefore exacerbates the shortage and results greater load-shedding.
44
Exploring thepolicy options available
4
Gradual Price Adjustment
Subsidies
Policy Options
Gradual price adjustments
Promoting competition in the electricity
supply industry
Providing targeted
support to vulnerable industries
Accelerated EEDSM
Transition credits

©2012 Deloitte Touche Tohmatsu Limited. All rights reserved.
A sudden adjustment to ‘cost-reflective’ prices com bined with transition credits proportional to current consumpt ion is a policy alternative to gradual price adjustments. The advan tage is that it provides an immediate incentive for consumers to be come more energy-efficient but could be costly to administer
• An alternative to gradual price adjustments would be to move electricity prices suddenly to cost-reflective levels and then recycle revenue to consumers in the form of a temporary subsidy or ‘transition credit’ which would be proportional to the consumer’s initial or current energy consumption.
• The advantage of this approach is that it provides an immediate incentive for consumers to investment in more energy-efficient technologies because the credit is only provided on historical consumption and any additional consumption is immediately subject to cost-reflective prices.
• The drawback of this approach (relative to more gradual price increases) is the cost of administering such a program but if it were feasible to administer efficiently, this policy option would have the same benefits as a gradual price adjustment without incurring the costs.
45
Exploring thepolicy options available
4
Transition Credits
Subsidies
Policy Options
Gradual price adjustments
Promoting competition in the electricity
supply industry
Providing targeted
support to vulnerable industries
Accelerated EEDSM
Transition credits

©2012 Deloitte Touche Tohmatsu Limited. All rights reserved.
Subjecting the electricity supply industry to great er competition and private sector involvement has been proven to incre ase efficiency of supply so that electricity demand can be met at a l esser cost (and consequently lower tariffs)
• South Africa has been unsuccessful in attracting private sector involvement but higher tariffs and regulatory reform will encourage participation
• International experience has shown that one way to achieve improved efficiency in the electricity supply industry is to promote commercialisation of state-owned utilities and exposure the industry to greater competition and private sector involvement.
• Despite the stated intentions, South Africa has failed to attract IPPs into the electricity supply industry. Low electricity tariffs and an unfavourable regulatory environment have been identified as some of the main factors that have hindered progress on this front.
• One of the first steps in encouraging IPPs to enter the market it to provide the right price signals by subjecting customers to cost-reflective prices. In addition, the South African government is in the process of creating an independent system operator that would act as a non-conflicted buyer of power, the Independent System and Market Operator Bill was approved by Cabinet on 16 Mar 2011
46
Exploring thepolicy options available
4
Increased Competition
Subsidies
Policy Options
Gradual price adjustments
Promoting competition in the electricity
supply industry
Providing targeted
support to vulnerable industries
Accelerated EEDSM
Transition credits

©2012 Deloitte Touche Tohmatsu Limited. All rights reserved.
Improved incentives for energy-efficiency and deman d side management could contribute to lower electricity pr ices although it has been proven that prices are the primary driver of mitigation behaviour…
• Promoting the accelerated uptake of energy-efficiency and demand side management initiatives reduces the need for additional generating capacity so provided it is more cost-effective than new supply can also be considered a strategy to mitigate against higher electricity tariffs.
• Studies have noted however that South African firms have historically made little use of public or external support energy efficiency and that increased energy prices and not incentives had been the primary driver of mitigation behaviour.
• It has been noted that improved incentives may speed up mitigation behaviour and is it encouraging to note that Eskom has recently revamped its EEDSM business model and in 2011 launched a standard offer programme that promises to promote more rapid uptake of EEDSM.
47
Exploring thepolicy options available
4
Accelerated EEDSM
Subsidies
Policy Options
Gradual price adjustments
Promoting competition in the electricity
supply industry
Providing targeted
support to vulnerable industries
Accelerated EEDSM
Transition credits

©2012 Deloitte Touche Tohmatsu Limited. All rights reserved.
Providing transition credits that are proportional to existing electricity consumption or other carefully targeted subsidies could be a means to accommodate the special characteristi cs of the most vulnerable consumers
• Finally, given that electricity in prices in South Africa have been subsidised implicitly by the taxpayer for a considerable length of time, it can be argued that it is necessary to provide additional ‘transition’ support to industries that have come to rely on low electricity prices as a source of comparative advantage and that are vulnerable to price increases .
• Providing transition credits that are proportional to existing electricity consumption or other carefully targeted subsidies could be a means to accommodate the special characteristics of these particularly vulnerable consumers.
• Identifying the vulnerable sectors for targeted policies would present some significant challenges since there is considerable variation in the vulnerability of different firms and sub-industries within major sectors to electricity price increases
• Policy makers may want to consider supporting only those vulnerable industries that also make a significant contribution to the economy.
48
Exploring thepolicy options available
4
Provide transition support to vulnerable industries
Subsidies
Policy Options
Gradual price adjustments
Promoting competition in the electricity
supply industry
Providing targeted
support to vulnerable industries
Accelerated EEDSM
Transition credits