the economic impact of alternative water pricing policies in alentejo region
TRANSCRIPT

CEFAGE-UE, Universidade de Évora, Palácio do Vimioso, Lg. Marquês de Marialva, 8, 7000-809 Évora, Portugal
Telf: +351 266 706 581 - E-mail: [email protected] - Web: www.cefage.uevora.pt
CCEEFFAAGGEE--UUEE WWoorrkkiinngg PPaappeerr
22001133//0022
TThhee EEccoonnoommiicc IImmppaacctt ooff AAlltteerrnnaattiivvee WWaatteerr PPrriicciinngg PPoolliicciieess iinn
AAlleenntteejjoo RReeggiioonn
Rui Fragoso, Carlos Marques
Universidade de Évora, CEFAGE-UE and ICAAM
1
THE ECONOMIC IMPACT OF ALTERNATIVE WATER PRICING
POLICIES IN ALENTEJO REGION
R. Fragoso1, C. Marques
2
1 Universidade de Évora, CEFAGE-UE, ICAAM-UE, Largo dos Colegias 2, [email protected] 2 Universidade de Évora, CEFAGE-UE, ICAAM-UE, Largo dos Colegias 2, [email protected]
Abstract Considering the important role of irrigation in the socio-economic development of the Alentejo region
in Portugal, this paper aims to assess the economic impact of water pricing in the context of the public
irrigation perimeter of Odivelas in that region. The methodological framework uses the estimation of programming models based on optimality conditions as an alternative to the Positive Mathematical
Programming approach. The model parameters were estimated using the entropy approach and
information priors. The model was formulated on the aggregated scale of the irrigated perimeter,
considering the main regional irrigated crops as well as land, labour, capital and water resources.
Key words: Estimation; Entropy; Positive Mathematical Programming; water management.
JEL classification: Q10; Q25; Q61.
2
THE ECONOMIC IMPACT OF ALTERNATIVE WATER PRICING POLICIES IN
ALENTEJO REGION
1. Introduction
During the twentieth century, the world population grew from 1,600 million to 6,000
million people and improved living standards consequently led to great and rapid growth in
the demand for water (Gleick, 2000). Firstly, in order to respond to this challenge, a supply
side strategy based on new water extraction largely supported by public funding to provide
social goods at any price was followed (Sumpsi et al., 1998). This policy brought great
benefits, such as increasing the supply of clean and reliable water, food production,
hydroelectricity, and rural and economic development. In this process, the agricultural sector
had an important role increasing the area of irrigation from 50 million to over 265 million
hectares.
Nowadays, water for irrigation represents the major consumption of the available
renewable fresh water, reaching over 70%, and demand should continue to grow in the
foreseeable future (Tsur, 2005). To satisfy the existing level of per capita water use, new
withdrawal is needed. However, the expansionist policy followed in the past is no longer
possible, due to the damage caused by contamination of water sources, the destruction of
ecosystems with loss of species and the removal of human populations. In addition, it is
increasingly difficult to find new places to extract water, the marginal cost of supplying water
has been rising and the adverse effects of large water projects are mounting.
In order to respond to these issues, the paradigm of water management has been
changing, with new policies focusing on efficiency improvements, water demand
management and water reallocation among users (Kallis and Nijkamp, 2000). The Dublin
conference in 1992 claimed that water must be treated as an economic good (Gleick, 2000).
Since then, several efforts have been made to eliminate wasteful practices and encourage
efficiency and conservation of water resources. In 2000 the European Union approved the
Water Framework Directive (WFD) (2000/60/European Communities), which defines as a
major goal that all groundwater, surface and coastal water in the European Union should
achieve a “good status” by 2015. The WFD introduced a high degree of novelty to water
policy (Rumm et al., 2006). The most important of these novel aspects are the “good status”
of water bodies as an environmental objective, dynamic implementation with deadlines for
different objectives, adoption of the concept of integrated river basin management and
institutional change and environmental governance (Petersen, 2009).
3
Water is a common resource where use by one user will affect another user’s
enjoyment, and the exclusion of individuals involves high transaction costs (Hardin, 1968).
Under the new paradigm, water must be treated as an economic good. The objective is to
eliminate wasteful practices and encourage efficiency and conservation. However, a purely
market approach cannot be suitable for protecting water resources and ecosystems (Daily,
1997).
Several studies in the literature show that governments use decentralisation of
irrigation water management, price systems, water rights and trading schemes to address
water productivity and equity issues (Dinar and Maria Saleth, 2005; Johansson et al., 2002;
Tiwari and Dinar, 2002; Tsur et al., 2004; and Roe et al., 2005; Veettil et al, 2011). The
relationships between these instruments are important and produce different results according
to the micro-environment of farmers, such as a particular type of irrigation, water governance,
institutional framework and different crop systems (Liao, et al., 2007). Farmers’ willingness
to pay for water is affected by the institutional context (Frija et al., 2008; Herrera et al., 2004;
Speelman et al., 2010a and 2011). When water rights are not well defined, the water price
system is inefficient and will jeopardise the recovery of costs as well as efficient water
allocation, which increases transaction costs and leads to unsuitable valuation of water
resources (Speelman et al., 2010a; and 2010b).
Water policy and particularly water pricing policy is a major issue in Mediterranean
countries, which share a culture for managing scarce water resources and are aware that water
is strategic and vital in challenges to their models of socio-economic development. The
impact of water pricing in the irrigation sector was well studied in the scope of the WFD
(Varela-Ortega et al., 1998; Gomez-Limon and Riesgo, 2004; Noéme and Fragoso, 2004; Roe
et al., 2005; Fragoso and Marques, 2009). These studies assess the impacts of water pricing
policies on water demand, water allocation among irrigated crops, farmers’ income, cost
recovery and demand for labour and inputs other than water in Spain and Portugal. Their
results are similar and highlight that effects of pricing policies in the irrigation sector depend
strongly on local, structural and institutional conditions.
Pricing policies for irrigation water frequently pursue conflicting objectives such as
economic efficiency, cost recovery, equity and resource conservation (Diakite et al., 2009).
The adoption of transparent and clear allocation rules is a way to reduce water demand (Ray,
2007). A water pricing system set at marginal cost is the most efficient option, but water
rights have to be well defined, and water governance issues need to address technical,

4
organizational and political rationality. Area-based or crop-based pricing methods are often
preferred to volumetric-based pricing, because they are easier and cheaper to implement
(Veettil et al, 2011).
This paper sets out from that of Fragoso and Marques (2009) in which they assess
different water pricing policies for irrigation in Odivelas, southern Portugal, using a multi-
period programming approach. They deal with several economic impacts of fixed area-based
tariff, simple volumetric tariff, two-part volumetric tariff and block tariff. Results show that
tariffs set at marginal cost, such as block and volumetric are the most efficient concerning
water protection, and the best option is a two-part tariff corresponding to an average water
cost within the range of 0.037 to 0.049 €/m3. Now the objective is to compare the two most
efficient tariffs set at marginal cost, volumetric and block, in the context of a two-part tariff
scheme.
The paper aims to explore the relationship between the best water allocation and water
recovery cost, and find the pricing scheme that allows maximum total welfare (farmers and
suppliers’ surpluses). In order to obtain more accurate results, an agricultural supply
programming model was developed for the Odivelas conditions based on the approach
proposed by Heckelei and Wolff (2003), for estimation of the optimality conditions of
constrained estimation models as an alternative to the traditional Positive Mathematical
Programming approach. Results are explored in terms of water demand, irrigated area
allocation, and farmers and suppliers’ surpluses.
The paper is organized as follows: The next two sections concern the theoretical
background, and include a few considerations about demand and supply of irrigation water
and pricing policies. Section four deals with the methodological approach. Finally, sections
five and six present the results and main conclusions.
2. Derived demand and supply for irrigation water
Water pricing is based on micro-economic theory, and the three basic elements for
establishing a policy are water value, full water cost and water price (Rogers et al., 1998;
2002). Water value is determined by the demand side and must include benefits to users,
benefits from returned flows, indirect benefits and intrinsic values. The full water cost is
given by the supply side and comprises the operating & maintenance cost, capital cost,
opportunity cost and costs of economic and environmental externalities. Those authors define
as full supply cost the sum of operating & maintenance cost and capital cost. Water price is

5
the amount set by the institutional sector to ensure cost recovery, equity and sustainability,
and may or may not be subsidized. Despite some ambiguity about the meaning of these
concepts, water pricing can be established on both the demand and supply side (Fragoso and
Marques, 2009).
The demand for irrigation water is the derived demand from agricultural products in
markets. In the case of a single farm that grows n crops with a single input – water (q), the
profit is given by:
∑ [ ( ) ] (1)
Where ( ) is an increasing and strictly concave production function for j=1,2,..,n,
which represents crop j yield response; pj is the market price of crop j; and w is the water
price. The necessary conditions for profit maximization are
or ( ( ))
⇒ ( ) ( ) where qj(w) is the crop water input at price w. Thus the farmer’s
water demand is:
( ) ∑ ( ) ∑
( ) (2)
For the case of n crops and k farmers, individual water demand is denoted by qi(w) and
sum i farmers’ demand:
( ) ∑ ( ) ∑ ∑
( )
(3)
The derived demand for water irrigation can also be obtained considering that water is
free of charge and its use is constrained at level x. In this case the problem is to know how
much farmers are willing to pay to have ∆ more units of water. When they use water up to x,
their revenue is pf(x), and the additional volume ∆ of water generates the additional revenue
of p[f(x+∆)-f(x)]. For small enough values of ∆, the added revenue is given by pf’(x), which is
the maximum price farmers are willing to pay to get an additional unit of water for irrigation.
This price is also called the shadow price of water, and its value is positive only if the water
constraint is binding. Thus, the decision of water allocation among j crops can be achieved by
the following problem of profit maximization:
( ) ∑ ( ) , subject to ∑
(4)
In this case the Lagrangian form is given by:
( ) [ ∑ ] (5)
where is the multiplier of the water constraint which represents its shadow price.
6
This approach can be extended to include additional inputs and constraints, such as
variable and unlimited purchased inputs, and primary fixed inputs other than water. To
incorporate non-linear production functions, the above linear programming can be
transformed in a non-linear programming.
In both cases, we can easily have the derived demand for irrigation water by solving
the profit maximization problem for different levels of water constraint x, which allows us to
obtain the different allocations of qj and corresponding shadow prices of the water
constraint.
A positive approach, based on regression analysis, can also be used to obtain the
derived demand for irrigation water, fitting a quantity-price relationship based on observed
data of water prices and quantities. However, this approach has a few problems, as data may
not be available and the variation of water prices is typically small, which leads to low
accuracy of estimates (Tsur, 2005).
The full supply cost of water (TC) can be separated into variable cost (VC) and fixed
cost (FC). The first is directly associated with the water quantity supplied, and usually
includes costs of pumping, conveyance, temporary labour, and operating and maintenance.
The latter does not vary with the supply quantity, and includes costs of depreciation of
infrastructure and equipment, interest payments on the facility, permanent labour, and some
fixed operating and maintenance.
Let us take ( ) ( ) and A ( ) ( ) as the marginal and
average costs of water supply, respectively. Typically VC is an increasing and convex
function, AC has a U-shape, and MC is non-decreasing and crosses AC at its minimal point.
For a water price w, the profit of the water supplier is ( ) hus, the
optimal level of water supply is achieved when [ ( )]
⇔ ( ) , and is given
by ( ) ( ) At this level of supply, the total profit of the supplier is ( )
( ( )) and its operating profit is ( ) ( ( )) If w is lower than AC, the
operating profit does not cover the fixed cost (FC), and the supplier is operating at a loss. In
the short term, the supplier will continue operation since the operating profit is positive.
However, in the long term the supplier will have to be compensated by farmers or the public
budget.
In large irrigation projects the marginal cost of supply is usually constant and water
supply is constrained to the capacity limit x (Tsur, 2005). In this situation AC is typically
7
above MC and any water price at the level of MC represents a loss to the supplier. However, if
water demand crosses the capacity limit x above the MC level, pricing at the AC(x) level and
having the demand constrained to x will allow the supplier to achieve a break-even point.
3. Water pricing
Total welfare (V(w)) is the sum of farmers and suppliers’ surpluses, and for a water
price w and a demand quantity q(w) is given by:
( ) ( ( )) ( ( )) ( )
( ) ( ( ))
( ) ( ( )) ( ( )) ( ( )) (6)
The efficient water price w that allows maximum total welfare is given by the
marginal cost pricing rule, in which ( ( )). The intersection between the non-
decreasing MC function and the downward sloping derived demand function, determines the
marginal cost price w.
Usually in large irrigation projects the interception between these two functions occurs
at the decreasing part of AC function, where MC is below AC (w*<AC(w*)). Thus, the
supplier’s operating profit does not cover the fixed cost, and to maintain the operation in the
long term, the supplier will have to be subsidised.
The long term funding supplier raises the cost recovery issue, which often leads to
average cost pricing. In this case the water price is set at the interception of the derived
demand function and AC. However, despite the supplier being able to recover the total cost of
water, the average cost pricing is not efficient, because it does not maximize the total welfare
of farmers and suppliers. A move from MC to AC pricing can allow the supplier’s profit to
become positive, but the farmer’s profit diminishes, and this loss is greater than the supplier’s
gain, which makes total welfare lower than what is obtained under the MC pricing rule (Tsur,
2005).
Efficient water allocation can be achieved by the marginal cost pricing rule, but its
implementation is a costly operation that requires metering, monitoring, fee collection and
other administrative tasks. For these reasons, several water pricing methods are implemented
throughout the world (Tsur and Dinar, 1997):
Volumetric: Water is charged by direct measurement of water volume consumption;
Ouput/input: Irrigation water charged based on output produced or on input used other
than water;
8
Area: Water is charged by irrigated or irrigation area and fees usually vary according
to the kind and extent of irrigation crop, irrigation method, season of the year, among others;
Block-rate: Under this pricing method, different volumetric rates vary according to
certain threshold values of water consumption;
Two-part tariff: Usually this pricing method involves a volumetric cost marginal
pricing rule and fixed annual charge for the right to access water which can be charged by
irrigation area;
Betterment levy: Water fees are based on the increase in land value from irrigation
provision and are charged per unit of area;
Water markets: Their participants may trade water rights at a particular price during
specific periods of time or trade water quantities at the spot price or for future delivery, and
water is charged on a volumetric or flow basis. There are several kinds of water markets, from
sanctioned markets for water rights in Chile (Herane and Easter, 1998) to spontaneous spot
markets in Brazil (Kemper and Olson, 2000).
Each water pricing method is associated with different levels of welfare and net
benefits, and choice depends particularly on the implementation cost, which varies from
region to region due to climate issues, demography, social structure, water rights, water
facilities, history and economic conditions. The preferred pricing method should be the one
that achieves the highest benefit. In the absence of implementation cost, volumetric methods
are the most efficient. Tsur and Dinar (1997) compared volumetric pricing and per area
pricing, and conclude that the latter yield better results when implementation costs exceed
7.5% of water proceeds.
The derived demand and supply, as well as prices were presented and discussed in this
paper as the main elements of the theoretical background of water pricing policies based on
the work of Tsur (2005; 2000), Dinar (2000), Dinar and Maria-Saleth (2005), Dinar and
Mody (2004) and Tsur and Dinar (1997). In addition to irrigation water pricing, other
considerations in promoting more efficient water policies should be considered, such as the
role of water markets (Olmstead et al., 1997; Easter et al., 1998; Horbulyk and lo, 1998), the
use of water saving technologies (Caswell and Zilberman, 1985; Shah et al., 1995), and the
integrated management of ground and surface water (Tsur, 1990; 1997; Knapp and Olson,
1995).
9
4. Methodological Framework
The impacts of economic policy on the water sector are frequently assessed using a
hydro-economic model structure. Ward (2009) describes a prototype of this kind of
framework for a scale basin which integrated the river basin structure, economic efficiency in
water management, institutional constraints, and water use and its economic benefits.
However, our study is limited to the agricultural sector and pricing policy for irrigation water,
and hence analysis is made at the scale of irrigation area. In these cases, agricultural benefits
from irrigation are usually measured by use of crop budgets, in which farm income is
compared with and without additional water rights and costs.
In order to have a broad and systemic analysis, mathematical programming models
have been largely used. Their structure is well suited to dealing with the economic problem of
making the best use of limited resources (Mills, 1984). The economic agents are perceived as
optimisers, and the basic elements of the neoclassical micro-economic theory can be easily
considered, as well as those of other economic theories, such as the new institutional
transaction cost theory (Buysse et al., 2007).
Recently, renewed interest in mathematical programming applied to the agricultural
sector has been observed. Heckelei and Britz (2005) argue this is mainly due to three factors.
Firstly, a wide variety of other policy tools have been introduced by the Common Agricultural
Policy in addition to supporting prices. Secondly, farmers’ multi-functionality is increasing in
importance. Thirdly, mathematical programming models give the possibility of considering
technical constraints, which often prevents incoherent results. The Positive Mathematical
Programming initially proposed by Howitt (1995) for calibrating models is also greatly
responsible for this renewed interest in mathematical programming models.
Thus, to assess the economic impacts of alternative water pricing policies and to
explore the relationship between the best water allocation and water recovery cost, this study
adopts an analytical framework based on the Positive Mathematical Programming (PMP) and
Econometric Mathematical Programming (EMP) models. These two models were applied to
Odivelas irrigation, which is a representative area of irrigated agriculture in the Alentejo
region, southern Portugal. Recently, EMP models have been a promising tool for agricultural
policy assessment, and in this study they are used to estimate the optimality conditions of
constrained estimation models as an alternative to the traditional PMP approach.
10
4.1. The Positive Mathematical Programming Model
The PMP was developed to overcome the normative character of traditional
mathematical programming models. In the PMP models, maximization of a concave profit
function is considered, and the MC parameters are used in the non-linear terms of the variable
cost function. Thus, these models are able to reproduce exactly the reference or observed
situation and are very useful in assessing policies and providing reliable solutions.
The original PMP version by Howitt (1995) is applied in two phases. First, a linear
model with calibration constraints is built to predict the dual values of resources and
constraints. Second, these dual values are used to calculate calibration parameters which
represent the MC coefficients of a convex cost function, and are incorporated in the non-linear
term of a profit function in a maximization program with linear constraints. The general idea
is to use the dual values of the calibrated model to specify additional non-linear terms of an
objective function that allows reproduction of the observed situation without constraints. An
overview of the main developments of the PMP approach can be seen in Heckelei and Britz
(2005) and Henry de Frahan et al. (2007).
The PMP model for Odivelas irrigation was developed like the original version of
Howitt (1995), considering in the first phase the specification of a linear model constrained to
the reference situation (base year=2008), and in the second phase specification of a quadratic
model without calibration constraints. These models represent the maximization of aggregate
farmers’ surplus, as presented above in expressions (1) and (6). Extending the analysis to
other factors in addition to water, the following linear programming model was established:
[ ] [ ] (7)
Where π is the profit function in the short term, which corresponds to the farm’s gross margin,
gm and l are n×1 vectors of unitary gross margins per activity and non negative variable of
land allocation to crops, respectively; A is the m×n matriz of unitary resource requirements, b
is the m×1 vector of the availability of resources, such as fixed resources (land) and variable
resources (chemicals and services, labour and water), and is the m×1 vector of the
corresponding shadow prices; I0 and are n×1 vectors of observed crop areas in the reference
situation (base year) and the corresponding dual values of calibration constraints; and is a
small number that is introduced in calibration constraints to prevent problems of linear
dependence.
11
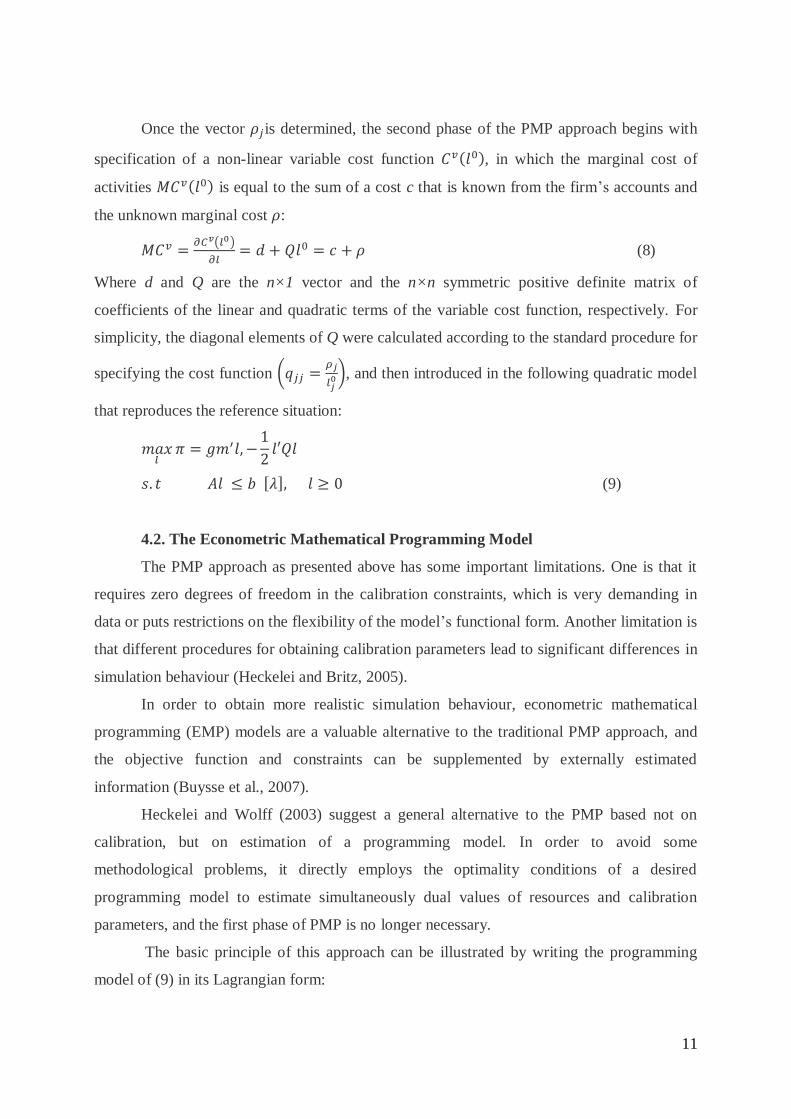
Once the vector is determined, the second phase of the PMP approach begins with
specification of a non-linear variable cost function ( ), in which the marginal cost of
activities ( ) is equal to the sum of a cost c that is known from the firm’s accounts and
the unknown marginal cost :
( )
(8)
Where d and Q are the n×1 vector and the n×n symmetric positive definite matrix of
coefficients of the linear and quadratic terms of the variable cost function, respectively. For
simplicity, the diagonal elements of Q were calculated according to the standard procedure for
specifying the cost function (
), and then introduced in the following quadratic model
that reproduces the reference situation:
[ ] (9)
4.2. The Econometric Mathematical Programming Model
The PMP approach as presented above has some important limitations. One is that it
requires zero degrees of freedom in the calibration constraints, which is very demanding in
data or puts restrictions on the flexibility of the model’s functional form. Another limitation is
that different procedures for obtaining calibration parameters lead to significant differences in
simulation behaviour (Heckelei and Britz, 2005).
In order to obtain more realistic simulation behaviour, econometric mathematical
programming (EMP) models are a valuable alternative to the traditional PMP approach, and
the objective function and constraints can be supplemented by externally estimated
information (Buysse et al., 2007).
Heckelei and Wolff (2003) suggest a general alternative to the PMP based not on
calibration, but on estimation of a programming model. In order to avoid some
methodological problems, it directly employs the optimality conditions of a desired
programming model to estimate simultaneously dual values of resources and calibration
parameters, and the first phase of PMP is no longer necessary.
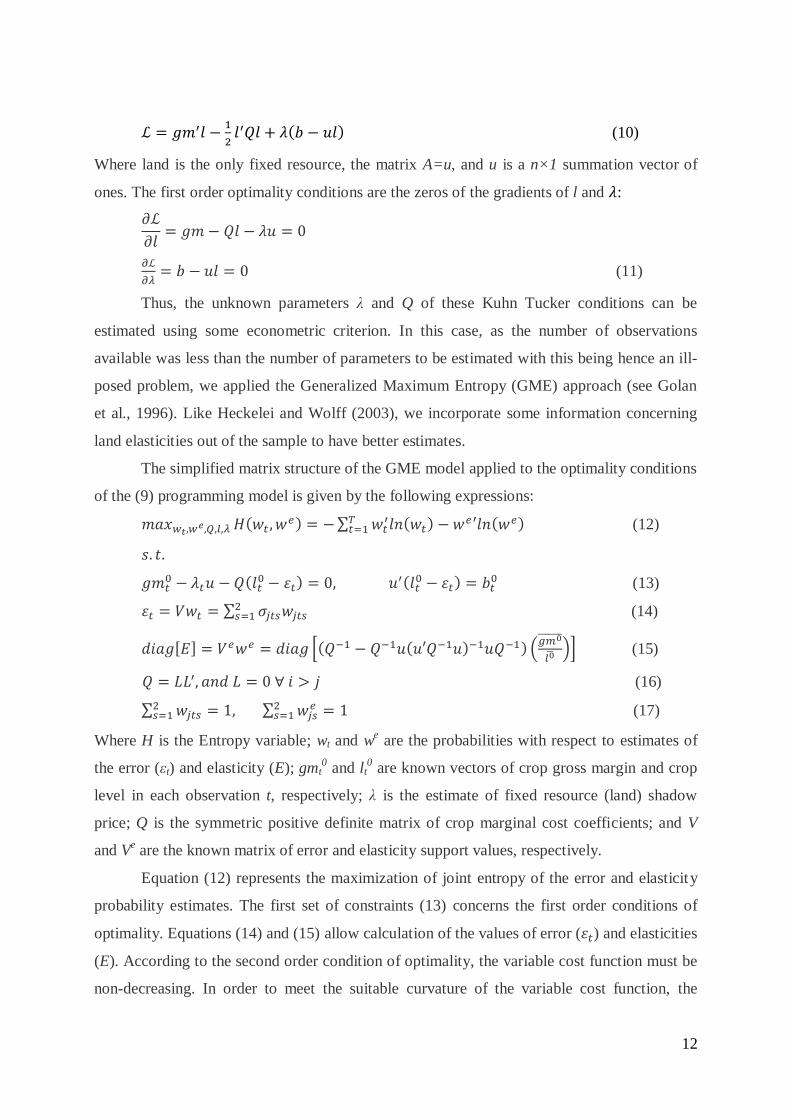
The basic principle of this approach can be illustrated by writing the programming
model of (9) in its Lagrangian form:
12
( ) (10)
Where land is the only fixed resource, the matrix A=u, and u is a n×1 summation vector of
ones. The first order optimality conditions are the zeros of the gradients of l and :
(11)
Thus, the unknown parameters λ and Q of these Kuhn Tucker conditions can be
estimated using some econometric criterion. In this case, as the number of observations
available was less than the number of parameters to be estimated with this being hence an ill-
posed problem, we applied the Generalized Maximum Entropy (GME) approach (see Golan
et al., 1996). Like Heckelei and Wolff (2003), we incorporate some information concerning
land elasticities out of the sample to have better estimates.
The simplified matrix structure of the GME model applied to the optimality conditions
of the (9) programming model is given by the following expressions:
(
) ∑ ( ) ( )
(12)
(
) ( )
(13)
∑ (14)
[ ] [( ( ) ) (
)] (15)
(16)
∑ ∑
(17)
Where H is the Entropy variable; wt and we are the probabilities with respect to estimates of
the error (εt) and elasticity (E); gmt0 and lt
0 are known vectors of crop gross margin and crop
level in each observation t, respectively; λ is the estimate of fixed resource (land) shadow
price; Q is the symmetric positive definite matrix of crop marginal cost coefficients; and V
and Ve are the known matrix of error and elasticity support values, respectively.
Equation (12) represents the maximization of joint entropy of the error and elasticity
probability estimates. The first set of constraints (13) concerns the first order conditions of
optimality. Equations (14) and (15) allow calculation of the values of error ( ) and elasticities
(E). According to the second order condition of optimality, the variable cost function must be
non-decreasing. In order to meet the suitable curvature of the variable cost function, the
13
positive definiteness of Q is based on a Cholesky factorisation, which is present in equation
(16). Finally, we have the set of equations (17), which assure that the sum of error and
elasticity probabilities are equal to one.
The stochastic errors of each observation ( ) have zero mean and a standard deviation
of To apply the GME approach, it was necessary to carry out re-parameterization of the
error term as expected values of a probability distribution ( ). This is calculated based on
known values of standard deviation, which are spread by two support points (the n×n×2 V
matrix).
Incorporation of out of sample information through the use of priors on elasticities
allows us to obtain more accurate estimates for the Q matrix. In our case the elasticity
estimates (E) are given by the product between the n×n Jacobian matrix of the land demand
functions {( ( ) ) } and the mean of observed gross profit divided
by the mean of observed land allocation to crop (
) As for the error estimates, the
elasticities (E) also have to be re-parameterized as the expected values of a probability
distribution (we). In this case, for the central value of prior elasticities two support points
were also considered and the values of standard deviations are bounded in the n×n×2 Ve
matrix.
After estimating the values of wt, we, , Q and λ, the values of Q were incorporated
into the programming model defined in (9), and which was used to simulate alternative water
pricing policies in Odivelas irrigation.
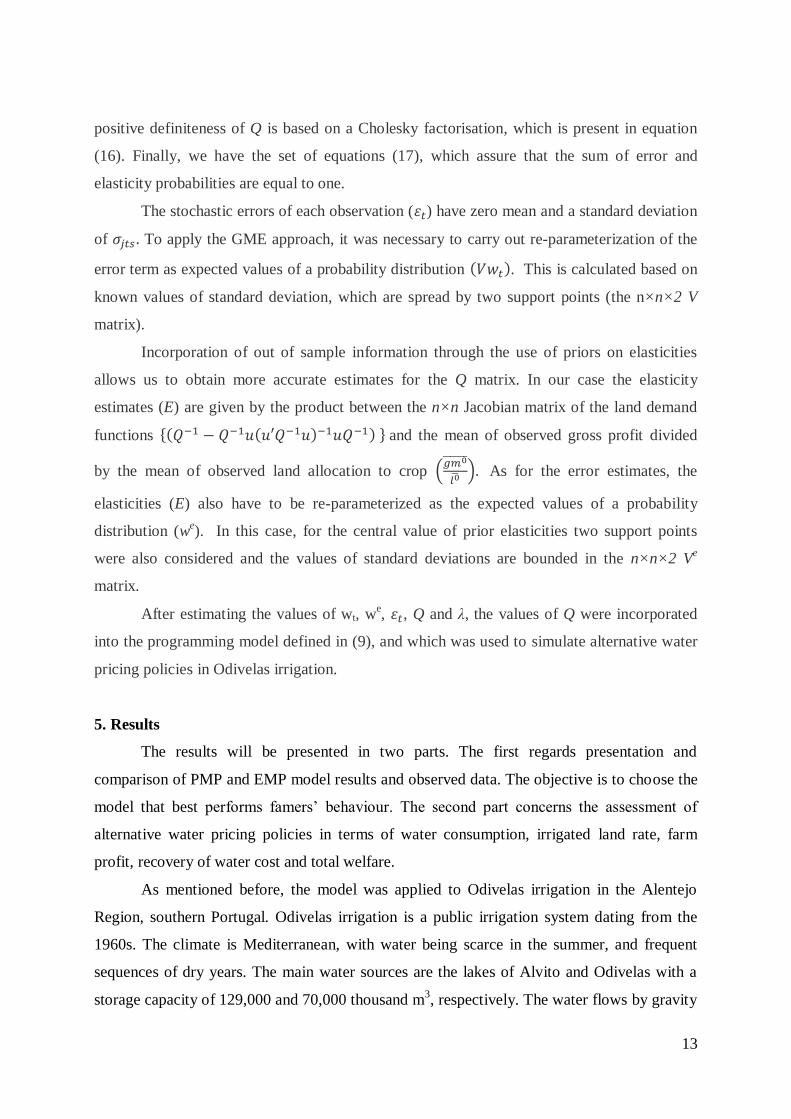
5. Results
The results will be presented in two parts. The first regards presentation and
comparison of PMP and EMP model results and observed data. The objective is to choose the
model that best performs famers’ behaviour. The second part concerns the assessment of
alternative water pricing policies in terms of water consumption, irrigated land rate, farm
profit, recovery of water cost and total welfare.
As mentioned before, the model was applied to Odivelas irrigation in the Alentejo
Region, southern Portugal. Odivelas irrigation is a public irrigation system dating from the
1960s. The climate is Mediterranean, with water being scarce in the summer, and frequent
sequences of dry years. The main water sources are the lakes of Alvito and Odivelas with a
storage capacity of 129,000 and 70,000 thousand m3, respectively. The water flows by gravity
14
in the River Sado, from Alvito to Odivelas from where it is irrigated through a distribution
network over 300 Km in length.
The irrigated area is 12,354 ha, and is divided into three blocks of of 5,545 ha (45%),
1,300 ha (11%) and 5,500 ha (44%). In the first, water is delivered by gravity and in the other
two it is delivered under pressure. The last block of 5,545 ha was only completed in the 21th
century to be integrated in the hydraulic network of the Alqueva project, which is one of the
biggest irrigation systems in Europe. Water fees are charged in a two-part tariff which
includes a fixed rate for all the irrigation area and a volumetric rate proportional to water
consumption.
5.1. PMP and EMP model results
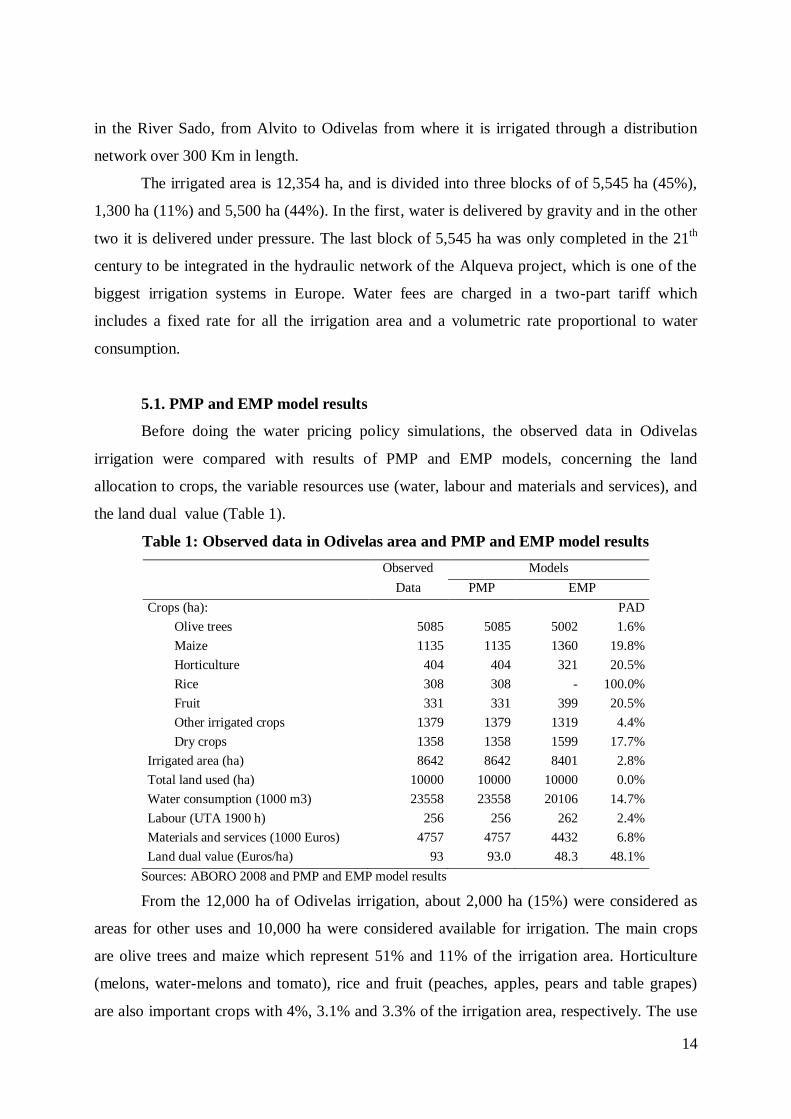
Before doing the water pricing policy simulations, the observed data in Odivelas
irrigation were compared with results of PMP and EMP models, concerning the land
allocation to crops, the variable resources use (water, labour and materials and services), and
the land dual value (Table 1).
Table 1: Observed data in Odivelas area and PMP and EMP model results
Observed Models
Data PMP EMP
Crops (ha): PAD
Olive trees 5085 5085 5002 1.6%
Maize 1135 1135 1360 19.8%
Horticulture 404 404 321 20.5%
Rice 308 308 - 100.0%
Fruit 331 331 399 20.5%
Other irrigated crops 1379 1379 1319 4.4%
Dry crops 1358 1358 1599 17.7%
Irrigated area (ha) 8642 8642 8401 2.8%
Total land used (ha) 10000 10000 10000 0.0%
Water consumption (1000 m3) 23558 23558 20106 14.7%
Labour (UTA 1900 h) 256 256 262 2.4%
Materials and services (1000 Euros) 4757 4757 4432 6.8%
Land dual value (Euros/ha) 93 93.0 48.3 48.1%
Sources: ABORO 2008 and PMP and EMP model results
From the 12,000 ha of Odivelas irrigation, about 2,000 ha (15%) were considered as
areas for other uses and 10,000 ha were considered available for irrigation. The main crops
are olive trees and maize which represent 51% and 11% of the irrigation area. Horticulture
(melons, water-melons and tomato), rice and fruit (peaches, apples, pears and table grapes)
are also important crops with 4%, 3.1% and 3.3% of the irrigation area, respectively. The use
15
of variable inputs such as, water, labour, and material and services are 23,558 thousand m3
(2,358 m3/ha), 256 UTA (486,400 hours or 48.64 hours/ha) and 4,757 thousand euros (476
euros/ha), respectively. The fixed resource allocation results from a land dual value of 93
euros/ha.
As expected, the PMP model reproduces exactly the observed situation. The EMP
model also reflects coherently the observed situation, but with some differences, as shown by
the Percentage of Absolute Deviation (PAD). The land allocation to olive trees (1.6%) and
other irrigated crops (4.4%), the total land used (0%) and the variable input use (6.8%) fit
very well the observed data. Results concerning land allocation to maize (19.8%), horticulture
(20.5%) and fruit (20.5%) present some important deviations, but are in general very
acceptable. The land allocation to rice (100%) and the land dual value (48 euros/ha) are the
poorest results.
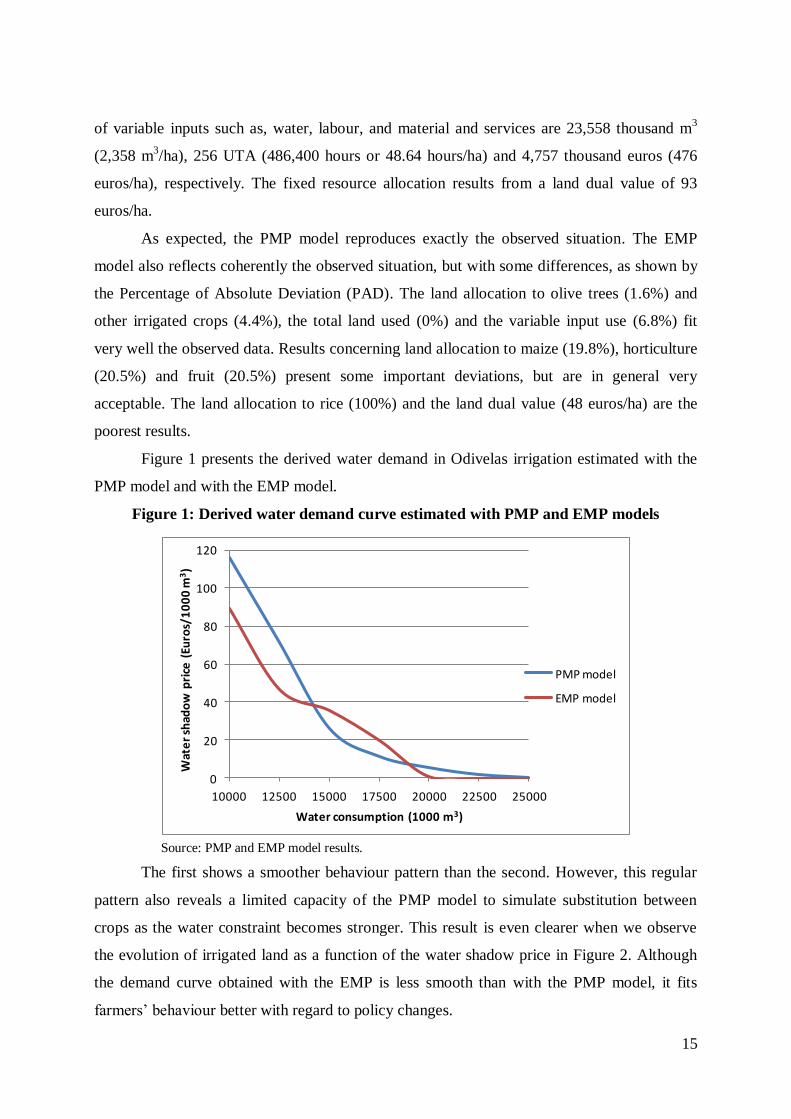
Figure 1 presents the derived water demand in Odivelas irrigation estimated with the
PMP model and with the EMP model.
Figure 1: Derived water demand curve estimated with PMP and EMP models
0
20
40
60
80
100
120
10000 12500 15000 17500 20000 22500 25000
Wat
er
shad
ow
pri
ce (
Euro
s/1
00
0 m
3)
Water consumption (1000 m3)
PMP model
EMP model
Source: PMP and EMP model results.
The first shows a smoother behaviour pattern than the second. However, this regular
pattern also reveals a limited capacity of the PMP model to simulate substitution between
crops as the water constraint becomes stronger. This result is even clearer when we observe
the evolution of irrigated land as a function of the water shadow price in Figure 2. Although
the demand curve obtained with the EMP is less smooth than with the PMP model, it fits
farmers’ behaviour better with regard to policy changes.
16
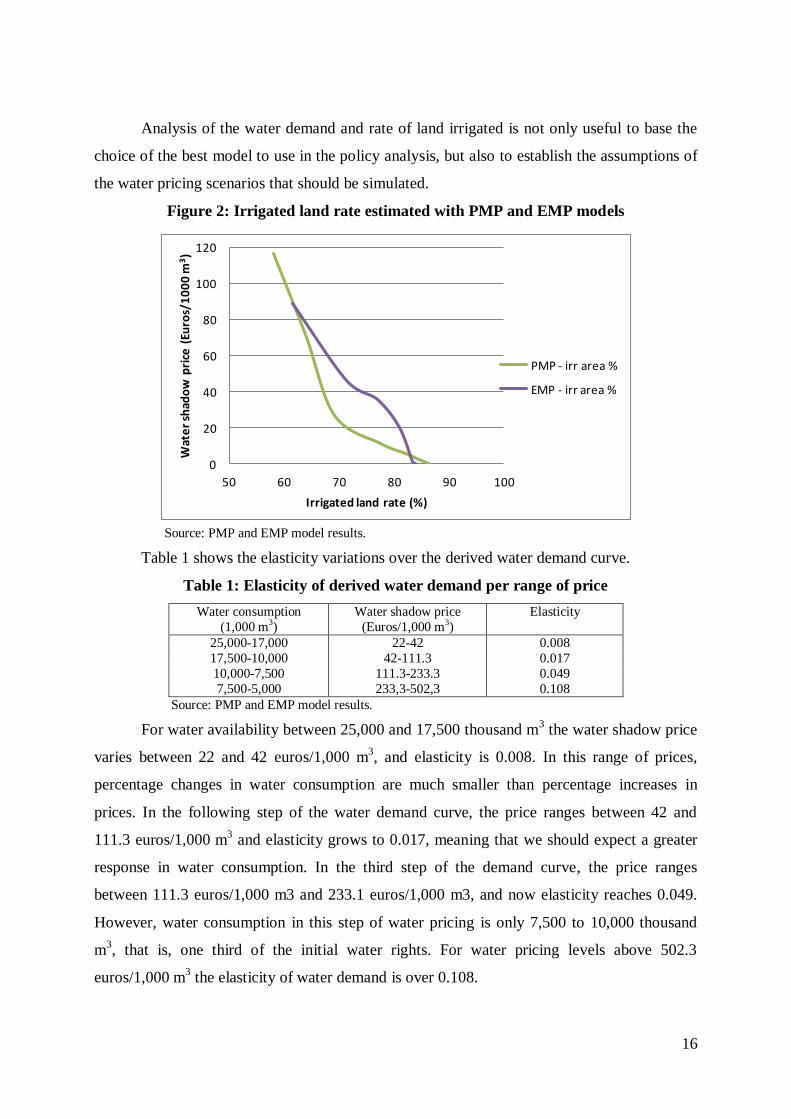
Analysis of the water demand and rate of land irrigated is not only useful to base the
choice of the best model to use in the policy analysis, but also to establish the assumptions of
the water pricing scenarios that should be simulated.
Figure 2: Irrigated land rate estimated with PMP and EMP models
0
20
40
60
80
100
120
50 60 70 80 90 100
Wat
er
shad
ow
pri
ce (
Euro
s/1
00
0 m
3)
Irrigated land rate (%)
PMP - irr area %
EMP - irr area %
Source: PMP and EMP model results.
Table 1 shows the elasticity variations over the derived water demand curve.
Table 1: Elasticity of derived water demand per range of price
Water consumption
(1,000 m3)
Water shadow price
(Euros/1,000 m3)
Elasticity
25,000-17,000 22-42 0.008
17,500-10,000 42-111.3 0.017
10,000-7,500 111.3-233.3 0.049
7,500-5,000 233,3-502,3 0.108
Source: PMP and EMP model results.
For water availability between 25,000 and 17,500 thousand m3 the water shadow price
varies between 22 and 42 euros/1,000 m3, and elasticity is 0.008. In this range of prices,
percentage changes in water consumption are much smaller than percentage increases in
prices. In the following step of the water demand curve, the price ranges between 42 and
111.3 euros/1,000 m3 and elasticity grows to 0.017, meaning that we should expect a greater
response in water consumption. In the third step of the demand curve, the price ranges
between 111.3 euros/1,000 m3 and 233.1 euros/1,000 m3, and now elasticity reaches 0.049.
However, water consumption in this step of water pricing is only 7,500 to 10,000 thousand
m3, that is, one third of the initial water rights. For water pricing levels above 502.3
euros/1,000 m3 the elasticity of water demand is over 0.108.
17
Given these results and the objective of the paper, the water pricing policy simulations
were based on a two-part tariff approach considering two alternative pricing schemes, the
volumetric and block tariff. Both pricing schemes were simulated for the critical average
water costs of 22 euros/1,000 m3, 42 euros/1,000 m
3, 111.3 euros/1,000 m
3, and 233.1
euros/1,000 m3. In the volumetric tariff, water is charged directly by consumption in
euros/1,000 m3. In the block tariff, the water rights are divided into three equal parts, the first
being charged at 50% of the water AC, the second part at 100% and the third part at 150%.
In addition to increases in water pricing levels, increases in the irrigation rate were
also considered. This is a fixed rate that is charged over all the irrigation area in euros/ha, for
which we simulated the following three levels for both pricing schemes: 30 euros/ha; 60
euros/ha; and 90 euros/ha.
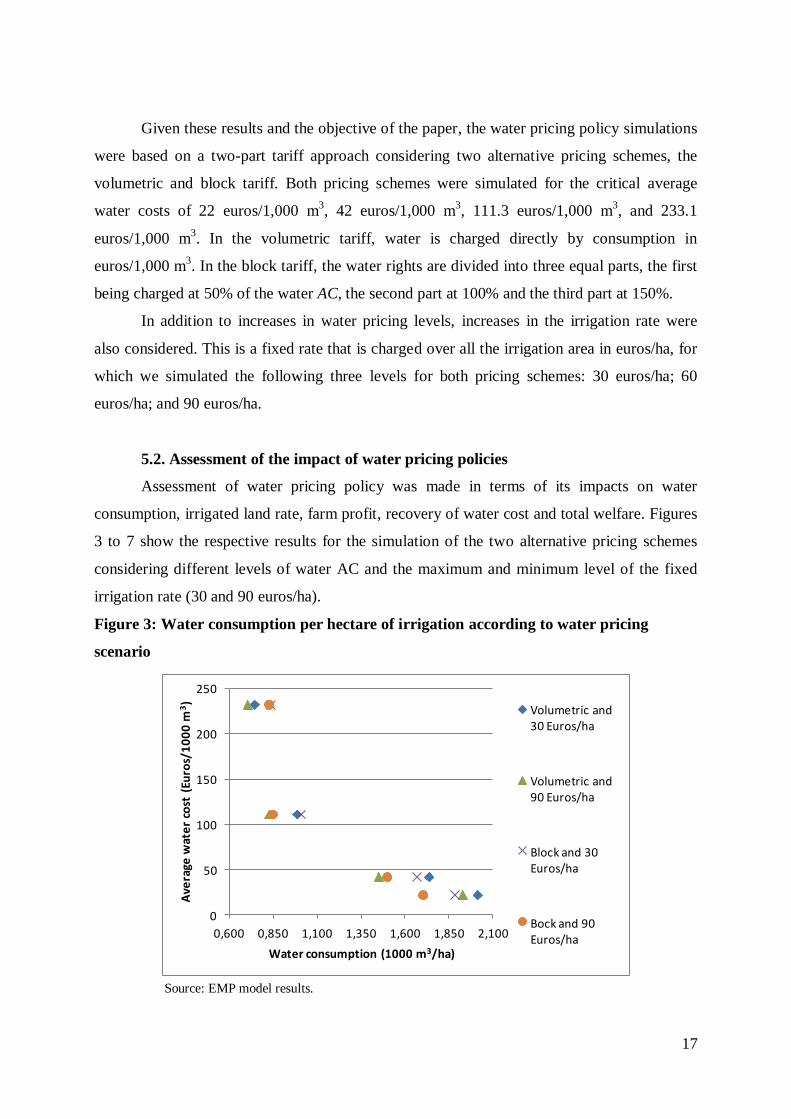
5.2. Assessment of the impact of water pricing policies
Assessment of water pricing policy was made in terms of its impacts on water
consumption, irrigated land rate, farm profit, recovery of water cost and total welfare. Figures
3 to 7 show the respective results for the simulation of the two alternative pricing schemes
considering different levels of water AC and the maximum and minimum level of the fixed
irrigation rate (30 and 90 euros/ha).
Figure 3: Water consumption per hectare of irrigation according to water pricing
scenario
0
50
100
150
200
250
0,600 0,850 1,100 1,350 1,600 1,850 2,100
Ave
rage
wat
er
cost
(Eu
ros/
10
00
m3)
Water consumption (1000 m3/ha)
Volumetric and 30 Euros/ha
Volumetric and 90 Euros/ha
Block and 30 Euros/ha
Bock and 90 Euros/ha
Source: EMP model results.
18
The block tariff achieves the most efficient water allocation. When the farmer’s water
AC is below 50 euros/1,000 m3 this pricing scheme is clearly more efficient than the
volumetric tariff. For a water AC of 22 euros/1,000 m3 the water consumption under the block
tariff is about 1,900 m3/ha and under volumetric tariff more than 2,000 m
3, which means a
water saving of at least 100 m3/ha or 1,000 thousand m
3 for the whole area of Odivelas
irrigation. If water AC rises to 42 euros/1,000 m3 the water saving under block tariff is about
50 m3/ha or 500 thousand m
3 for all the irrigation area. However, for higher levels of water
AC, the differences in allocation efficiency between the two pricing policies are much
smaller.
With respect to the fixed irrigation rate, as expected, results showed that this rate does not
influence water consumption, because it does not directly affect famers’ behaviour.
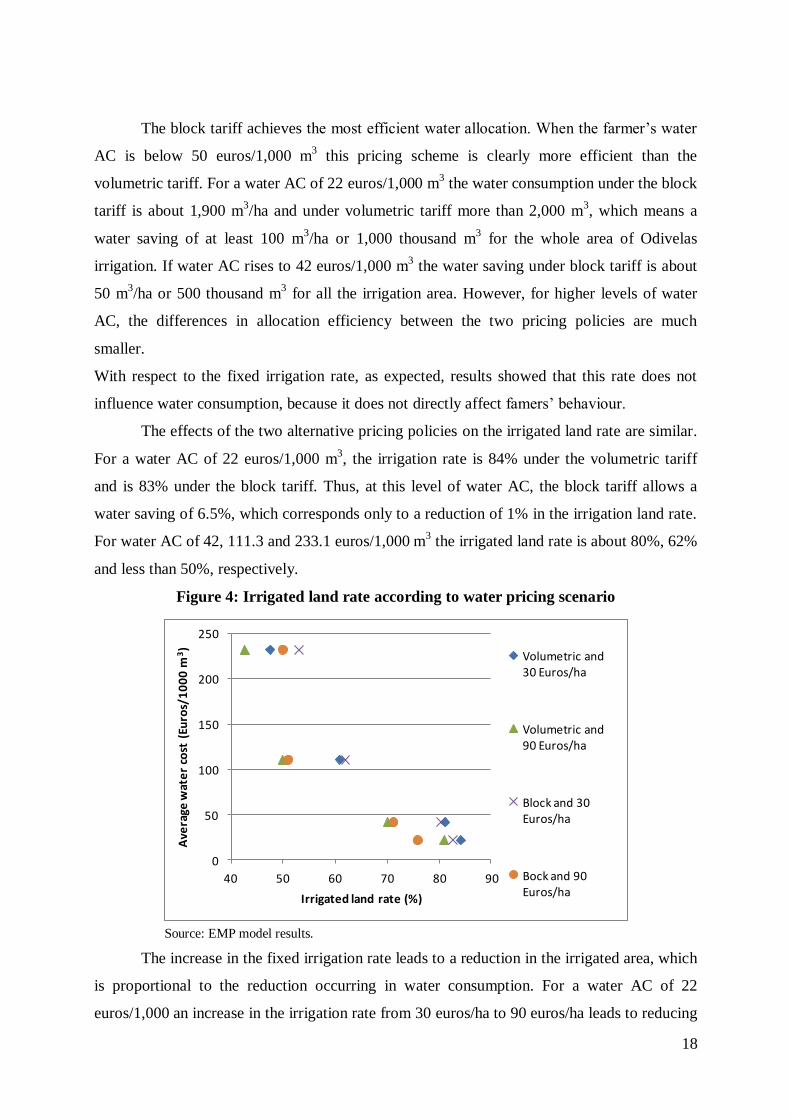
The effects of the two alternative pricing policies on the irrigated land rate are similar.
For a water AC of 22 euros/1,000 m3, the irrigation rate is 84% under the volumetric tariff
and is 83% under the block tariff. Thus, at this level of water AC, the block tariff allows a
water saving of 6.5%, which corresponds only to a reduction of 1% in the irrigation land rate.
For water AC of 42, 111.3 and 233.1 euros/1,000 m3 the irrigated land rate is about 80%, 62%
and less than 50%, respectively.
Figure 4: Irrigated land rate according to water pricing scenario
0
50
100
150
200
250
40 50 60 70 80 90
Ave
rage
wat
er
cost
(Eu
ros/
10
00
m3)
Irrigated land rate (%)
Volumetric and 30 Euros/ha
Volumetric and 90 Euros/ha
Block and 30 Euros/ha
Bock and 90 Euros/ha
Source: EMP model results.
The increase in the fixed irrigation rate leads to a reduction in the irrigated area, which
is proportional to the reduction occurring in water consumption. For a water AC of 22
euros/1,000 an increase in the irrigation rate from 30 euros/ha to 90 euros/ha leads to reducing
19
the irrigated area by 8%. At higher levels of water AC, this reduction is even greater. For a
water AC of 42 and 111.3 euros/1,000 m3, changing the irrigation rate from 30 euros/ha to 90
euros/ha implies a reduction in irrigated land areas of at least 10%, the irrigated land rate in
these cases being 70% and 51%, respectively.
Reductions in irrigated land rate due to increases in water AC or fixed irrigation rate
can be mainly explained by reduction in areas of maize, horticulture and other irrigated crops.
Under both pricing policies, areas of olive trees and fruits are the least sensitive to increases
in water costs. This is related to the high returns these crops show for land and water
resources.
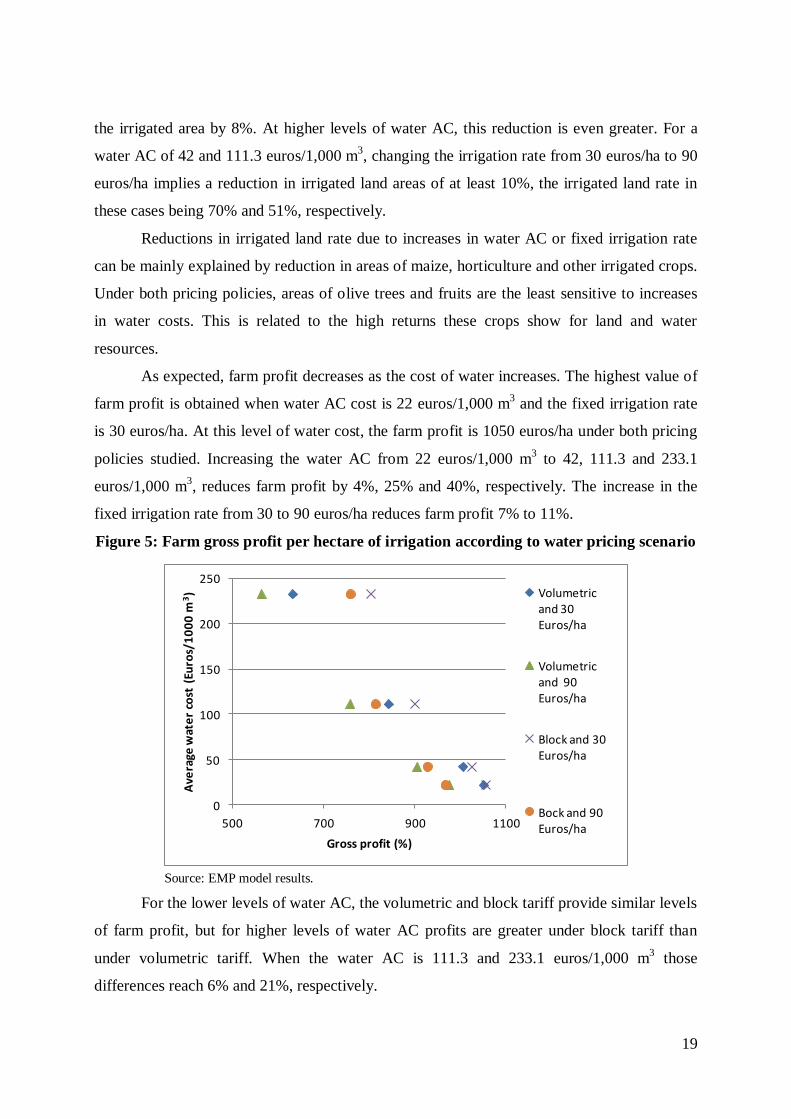
As expected, farm profit decreases as the cost of water increases. The highest value of
farm profit is obtained when water AC cost is 22 euros/1,000 m3 and the fixed irrigation rate
is 30 euros/ha. At this level of water cost, the farm profit is 1050 euros/ha under both pricing
policies studied. Increasing the water AC from 22 euros/1,000 m3 to 42, 111.3 and 233.1
euros/1,000 m3, reduces farm profit by 4%, 25% and 40%, respectively. The increase in the
fixed irrigation rate from 30 to 90 euros/ha reduces farm profit 7% to 11%.
Figure 5: Farm gross profit per hectare of irrigation according to water pricing scenario
0
50
100
150
200
250
500 700 900 1100
Ave
rage
wat
er
cost
(Eu
ros/
10
00
m3)
Gross profit (%)
Volumetric and 30 Euros/ha
Volumetric and 90 Euros/ha
Block and 30 Euros/ha
Bock and 90 Euros/ha
Source: EMP model results.
For the lower levels of water AC, the volumetric and block tariff provide similar levels
of farm profit, but for higher levels of water AC profits are greater under block tariff than
under volumetric tariff. When the water AC is 111.3 and 233.1 euros/1,000 m3 those
differences reach 6% and 21%, respectively.

20
At the baseline level of water costs, that is, when the water AC is 22 euros/1,000 m3
and the fixed irrigation rate is 30 Euros/ha, the recovery of water cost with the volumetric
tariff is 74 euros/ha. If the water AC increases from 22 euros/1,000 m3 to 42, 111.3 and 233.1
euros/1,000 m3 the recovery of water cost can improve by 39%, 89% and 174%, respectively.
Under a fixed irrigation rate of 90 euros/ha, these growths in recovery of water cost are 14%,
38% and 92%, respectively. Only due to the increase in the fixed irrigation rate, can we
expect growth in recovery of water cost between 25% and 47%.
Under the block tariff the recovery of water cost is lower than under volumetric tariff.
For the baseline level of water cost, the recovery of water cost achieves 65 euros/1,000 m3.
For higher values of water AC, that is, 42, 111.3 and 233.1 euros/m3, the recovery of water
cost can grow by 28%, 48% and 95%, respectively. If the fixed irrigation rate increases to 90
euros/ha, we can expect the recovery of water cost to grow between 13% and 56%. Only due
to the increase of fixed irrigation rate from 30 to 90 euros/ha, the recovery of water cost can
increase between 83% when the water AC is 22 euros/1,000 m3 and 46% when it is 233.1
euros/m3.
Figure 6: Water cost recovery per hectare of irrigation according to water pricing
scenario
0
50
100
150
200
250
0 100 200 300
Ave
rage
wat
er
cost
(Eu
ros/
10
00
m3)
Water cost recovery (Euros/ha)
Volumetric and 30 Euros/ha
Volumetric and 90 Euros/ha
Block and 30 Euros/ha
Bock and 90 Euros/ha
Source: EMP model results.
Noéme and Fragoso (2004) estimated a supplier cost in Odivelas irrigation of 479
euros/ha, divided into a variable cost of 157 euros/ha and a fixed cost of 322 euros/ha. These
values referring to 2008 at an inflation rate of 3%, are 539, 177 and 363 euros/ha,
respectively. Comparing them with our model results we can observe that it is possible to
21
recover the variable cost of the supplier under the volumetric tariff in situations where the
water AC is 111.3 euros/1,000 m3, the fixed irrigation rate is 60 euros/ha and the water AC is
233.1 euros/1,000 m3. Under the block tariff, the variable cost of the supplier can only be
recovered when the water AC is 233.1 euros/1,000 m3 and the fixed irrigation rate is 90
euros/ha.
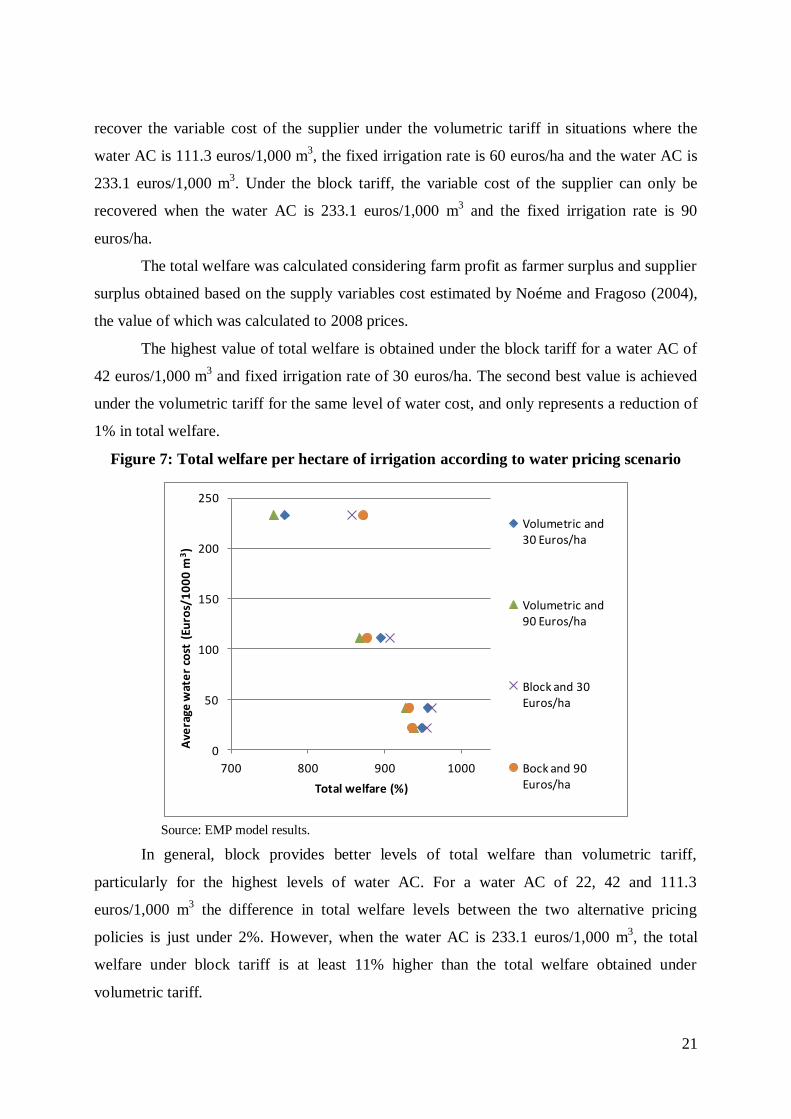
The total welfare was calculated considering farm profit as farmer surplus and supplier
surplus obtained based on the supply variables cost estimated by Noéme and Fragoso (2004),
the value of which was calculated to 2008 prices.
The highest value of total welfare is obtained under the block tariff for a water AC of
42 euros/1,000 m3 and fixed irrigation rate of 30 euros/ha. The second best value is achieved
under the volumetric tariff for the same level of water cost, and only represents a reduction of
1% in total welfare.
Figure 7: Total welfare per hectare of irrigation according to water pricing scenario
0
50
100
150
200
250
700 800 900 1000
Ave
rage
wat
er
cost
(Eu
ros/
10
00
m3)
Total welfare (%)
Volumetric and 30 Euros/ha
Volumetric and 90 Euros/ha
Block and 30 Euros/ha
Bock and 90 Euros/ha
Source: EMP model results.
In general, block provides better levels of total welfare than volumetric tariff,
particularly for the highest levels of water AC. For a water AC of 22, 42 and 111.3
euros/1,000 m3 the difference in total welfare levels between the two alternative pricing
policies is just under 2%. However, when the water AC is 233.1 euros/1,000 m3, the total
welfare under block tariff is at least 11% higher than the total welfare obtained under
volumetric tariff.
22
The increase in fixed irrigation rate from 30 euros/ha to 90 euros/ha has little impact in
terms of total welfare level, the expected reduction being at most 3.1%.
6. Conclusion
In this paper the economic impacts of the two water pricing policies in the irrigation
sector were assessed by exploring the relationship between the best water allocation and
recovery of water cost with the main objective of finding the pricing scheme that allows the
maximum total welfare. The rules of marginal cost and average cost were used to simulate
and compare volumetric and block pricing schemes included in a two-part tariff approach
with a variable and fixed rate.
A methodological framework based on an Econometric Mathematical Programming
approach was developed for the conditions of Odivelas irrigation in the Alentejo Region of
southern Portugal. This approach was used as an alternative to the traditional Positive
Mathematical Programming, and despite an inexact reproduction of the observed data, it
achieves more coherent behavioural responses. The approach was also developed in two
phases. First, econometric estimation of the optimality conditions was carried out and then the
estimated coefficients were included in a non-linear profit function of a simulation model.
This model was used to simulate the two studied alternative pricing policies under various
levels of average water cost and fixed irrigation rate.
The results allow us to conclude that under a two-part tariff approach the block pricing
scheme may be better than the volumetric pricing scheme. The highest value of total welfare
is achieved under the block tariff when the variable rate is 21, 42 and 63 euros/1,000 m3 in the
first, second and third blocks of water rights, and the fixed irrigation rate is set at 30 euros/ha.
The second best level of total welfare is achieved with the volumetric tariff for the same level
of fixed irrigation rate and when the variable rate is 42 euros/1,000 m3. Despite close
proximity between the first and second best solutions, the block tariff achieves the best levels
of total welfare in more simulations and particularly for the highest levels of tariffs.
The block rate tariff promotes more efficient water allocation, at an average water cost
of 50 euros/1,000 m3, that is, at a variable rate of 21, 42 and 63 euros/1,000 m
3 in the first,
second and third block of water rights. This kind of pricing scheme is the one that least
penalizes the irrigated land rate, which reflects the use of irrigation and farm profit. Despite
the effects on the farm of the two alternative policies being very similar, for the highest levels
of tariff the block scheme also allows better levels of farm profit to be achieved. As expected,
23
changing the fixed irrigation rate has a very limited impact on water allocation, the highest
levels of this rate producing negative effects on the irrigation areas.
However, the results also lead us to conclude that a two-part volumetric tariff is the
better option in water pricing policy to achieve the highest recovery of water cost, and hence
reach the best funding structure for the supplier. Recovery of water costs grow with increases
in tariff levels, achieving the highest values at an average water cost of 233.1 euros/m3.
Another important conclusion is the important role of the fixed irrigation rate in promoting
the recovery of water cost.
These conclusions are in accordance with the results of other authors. For example,
Veetil et al. (2011) states that farmers should only pay for water they have used, and this can
only be achieved using a volumetric or block scheme pricing. In addition, complementary
relationships between different water demand management strategies can also reduce
transaction costs. A volumetric pricing scheme with well defined water rights and improved
management of local water governance provides the best results for farmers – followed by
block tariff, but the choice between a volumetric and block pricing scheme depends on some
administrative issues, such as the decentralization of water rights, equity and water
availability (Easter, 1999; Seagraves and Easter, 1983).
The results of the study are clearly relevant for designing a new water pricing policy
and improving those in existence, not only in southern Portugal, but in all the Mediterranean
area, since many of the institutional conditions of Odivelas irrigation are shared by many
other Mediterranean irrigation areas. Further studies should seek to obtain more accurate and
wide-ranging results. In this connection, the framework of Econometric Mathematical
Programming should be refined for local economic and institutional conditions and applied to
other Portuguese and Mediterranean irrigation areas.

24
References
Buysse, J, Van Huylenbroeck, G., and Lauwers, L. (2007). Normative, positive and
econometric mathematical programming as tools for incorporation of multi-
functionality in agricultural policy modelling. Agriculture, Ecosystems and
Environment, 120: 70-81.
Caswell, M., and Zilberman, D. (1985). The Choices of Irrigation Technologies in California.
American Journal of Agricultural Economics, 67: 224-234.
Daily, G.C. (eds.) (1997). Nature’s Services: Societal Dependence on Natural Ecosystems.
Island Press, Washington, DC, USA
Diakite, D., Semenov, A., and Thomas, A. (2009). A proposal for social pricing of water
supply in Cote d’Ivoire. Journal of Development Economics, 88: 258-268.
Dinar, A., and Maria-Saleth, R. (2005). Issues in Water Pricing Reforms: From Getting
Correct Prices to Setting Appropriate Institutions. In Folmer, H. and Tietenberg, T.
(Eds.). International Yearbook of Environmental and Resource Economics New
Horizons in Environmental Economics, Edward Elgar Publishing, Cheltenham, UK.
Dinar, A., and Mody, J. (2004). Irrigation water management policies: Pricing and allocation
principles and implementation experiences. Natural Resources Forum, 28: 112-122.
Dinar, A. (2000). Political Economy of Water Pricing Reforms. In A. Dinar (Eds.). The
Political Economy of Water Pricing Reforms, Oxford University Press, Oxford.
Easter, K., Rosegrant, M., and Dinar, A. (Eds.). (1998). Markets for Water: Potential and
Performance, Kluwer Academic Publishers, Boston.
Easter, K. (1999). The Transition of Irrigation Management in Asia: Have We Turned the
Corner Yet? Paper presented in the 6th
Conference of the International Water and
Resource Economics Consortium, Hawaii.
European Communities (2000). Directive 2000/60/EC of the European Parliament and of the
Council of 23. October 2000 Establishing a Framework for Community Action in the
Field of Water Policy. Official Journal of the European Communities L 327/1 of
22.12.2000.
Fragoso, R, and Marques, C. (2009). Avaliação económica de tarifas de água no uso agrícola:
um estudo de caso no Sul de Portugal. Revista de Economia e Sociologia Rural, 47(3):
699-718.
25
Frija, A., Chebil, A., Speelman, S., and Van Huylenbroeck, G. (2008). Effect of changes in
the institutional structure of irrigation water property rights on the willingness to pay of
farmers for water: case of Tunisia. XIIth Congress of European Association of
Agricultural Economics. EAAE, Ghent, Belgium.
Gleick, P. (2000). The Changing Water Paradigm: A Look at Twenty-first Century Water
Resources Development. IWRA. Water International, 25(1):127-138.
Gomez-Limón, J.A., and Riesgo, L. (2004). Irrigation water pricing: differential impacts on
irrigated farms. Agricultural Economics, 31: 47-66.
Golan, A., Judge, G., and Miller, D. (1996). Maximum Entropy Econometrics, Wiley,
Chichester United Kingdom.
Hardin, G. (1968). The tragedy of commons. Science, 162: 1243-1248.
Hearne, R., and Easter, K. (1998). Economic and Financial Returns from Chile’s Water
Markets. In Easter, K., Rosegrant, M., and Dinar, A. (Eds.). Markets for Water:
Potential and Performance, Kluwer Academic Publishers, Boston.
Heckelei, T. and Britz, W. (2005). Models based on positive mathematical programming:
state of art and further extensions. In: Arfini, F. (ed.) Modelling Agricultural Policies:
State of Art, New Challenges. Monte Universita Parma, Parma: 48-74.
Heckelei, T., and Wolff, H. (2003). Estimation of constrained optimization models for
agricultural supply analysis based on generalized maximum entropy. European Review
of Agricultural Economics, 30(1): 27-50.
Herrera, P.A., van Huylenbroeck, G., Espinel, R.L. (2004). An application of the contingent
valuation method to assess the efficiency of the institutional structure of irrigation
property rights: the case of the peninsula of Santa Elena, Ecuador. International Journal
of Water Resources Development, 20: 537-551.
Henry de Frahan, Buysse, B., Polomé, J., Fernagut, B., Harmignie, O., Lauwers, L., Van
Huylenbroeck, G., and Van Meensel, J. (2007). Positive mathematical programming for
agriculture and environmental policy analysis: review and practice. In: Weintraub, A.,
Bjorndal, T., Epstein, R., and Romero, C. (eds.), Management of Natural Resources: A
Handbook of Operations Research Models, Algorithms and Implementations. Kluwer
Academic Publihers.
Horbulyk, T., and Lo, L. (1998). Welfare Gains from Potential Water Markets in Alberta,
Canada. In Easter, K., Rosegrant, M., and Dinar, A. (Eds.). Markets for Water:
Potential and Performance, Kluwer Academic Publishers, Boston.
26
Howitt, R. (1995). Positive Mathematical Programming. American Journal of Agricultural
Economics, 77(2): 329-342.
Kallis, G., Nijkamp, P. (2000). Evolution of EU water policy: A critical assessment and
hopeful perspective. Journal of Environmental Law and Policy, 3(27): 301–335.
Kemper, K., and Olson, D. (2000). Water Pricing – The Economics of Institutional Change in
Mexico and Ceará, Brazil. In A. Dinar (Eds.). The Political Economy of Water Pricing
Reforms, Oxford University Press, Oxford.
Knapp, K., and Olson, L. (1995). The Economics of Conjunctive Groundwater Management
with Stochastic Surface Supplies. Journal of Environmental Economics and
Management, 28: 340-356.
Johansson, R.C, Tsur, Y., Roe, T.L., Doukkali, R., Dinar, A. (2002). Pricing irrigation water:
a review of theory and practice. Water Police, 4: 173-199.
Liao, Y.S., Giordano, M., de Fraiture, C. (2007). An empirical analysis of the impacts of
irrigation pricing reforms in China. Water Policy, 9: 45-60.
Mills, G. (1984). Optimization in Economic Analysis. George Allen & Unwin Ltd, London.
Noéme, C, and Fragoso, R. (2004). Evaluation of Alternative Policies of Irrigation Water
Price. Application to Large Farms in Alentejo Region. The CIGR Journal of Scientific
Research and Development, Manuscript 04006, Vol. – VI – December.
Olmstead, J., Sunding, D., Parker, D., Howitt, R., and Zilberman, D. (1997). Water Marketing
in the 90s: Entering the Electronic Age. Choices: 24-28.
Petersen, T., Klauer, B., and Manstetten, R. (2009). The environment as a challenge for
governmental responsibility – The case of the European Framework Directive.
Ecological Economics, 68: 2058-2065.
Ray, I. (2007). Get the prices right: a model of water prices and irrigation efficiency in
Maharashtra, India. In Molle, F., Berkoff, J. (eds.), Irrigation water pricing: The gap
between theory and practice. CAB International, Oxfordshire, UK.
Roe, T., Dinar, A., Tsur, Y., Diao, X. (2005). Feedback links between economy wide and
farm-level policies: With application to irrigation water management in Morocco.
Journal of Policy Modeling, 27: 905-928.
Rogers, P., Silva, R., Bhatia, R. (2002). Water is an economic good: How to use prices to
promote equity, efficiency, and sustainability. Water Policy, 4: 1-17.

27
Rogers, P., Bhatia, R., and Huber, A. (1998). Water as a social and economic good: How to
put the principle into practice. Global Water Partnership/Swedish International
Development Cooperation Agency, Stockholm, Sweden.
Rumm, P, von Keitz, S., Schmalholz, M. (Eds.). (2006). Handbuch der EU-
Wasserrahmenrichtline – Inhalte Neureungen und Anregungen für die nationale
Umsetzung. 2ª ed., Erich Schmidt Verlarg, Belin.
Shah, F, Zilberman, D., and Chakravorty, U. (1995). Technology Adoption in the Presence of
an Exhaustible Resource: The Case of Groundwater Extraction. American Journal of
Agricultural Economics, 77(2): 291-299.
Seagraves, J.; and Easter, K. (1983). Pricing irrigation water in developing-countries. Water
Resources Bulletin, 19: 663-672.
Speelman, S., Frija, A., Buysse, J., Van-Huylenbroeck, G. (2011). The importance of
irrigation water rights: lessons from South Africa and Tunisia. Water Policy, 13(5): 1-
14.
Speelman, S., Farolfi, S., Frija, A., D’Haese, M., D’haese, L. (2010a). The impact of the
water rights system on smallholder irrigators’ willingness to pay water in Limpopo
province, South Africa. Environment and Development Economics, 15: 465-483.
Speelman, S., Farolfi, S.,Frija, A., Van-Huylenbroeck, G. (2010b). Valuing improvements in
the rights system in South Africa: a contingent ranking approach. Journal of the
American Water Resources Association, 46(6):1133-1144
Sumpsi, J.M., Garrido, A., Blanco, M., Varela-Ortega, C., Iglesias, E. (1998). Economía et
política de gestión del agua en la agricultura. (Eds. Mundi-Prensa), Secretaría General
Técnica de Desarrollo Rural y Conservación de Naturaleza, MAPA, Madrid.
Tiwari, D., Dinar, A. (2002). Balancing future food demand and water supply: The role of
economic incentives in irrigated agriculture. Quarterly Journal of International
Agriculture, 41(1-2): 77-97.
Tsur, Y. (2005). Economic Aspects of Irrigation Water Pricing. Canadian Water Resources
Journal, 30(1): 31-46.
Tsur, Y., Roe, T.L., Doukkali, R.M., Dinar, A. (2004). Pricing irrigation water: Principles
and cases from developing countries. RFF Press, Washington, DC, USA
Tsur, Y., and Dinar, A. (1997). On the Relative Efficiency of Alternative Methods for Pricing
Irrigation Water and Their Implementation. World Bank Economic Review, 11: 243-
262.

28
Tsur, Y. (1990). The Stabilization Value of Groundwater When Surface Water Supplies are
Uncertain: The Implications for Groundwater Development. Water Resources Research,
26: 811-818.
Varela-Ortega, C., Sumpsi, J.M., Garrido, A., Blanco, M., Iglesias, E. (1998). Water pricing
policies, public decision making and farmers’ response: implications for water policy.
Agricultural Economics, 19: 193-202.
Veettil, P.C., Speelman, S., Frija, A., Buysse, J., Van-Huylenbroeck, G. (2011).
Complementarity between water pricing, water rights and local water governance: A
Bayesian analysis of choice behaviour of farmers in the Krishna river basin, India.
Ecological Economics, 70: 1756-1766.
Ward, F.A. (2009). Economics in integrated water management. Environmental Modelling
and Software, 24: 948-958.