the economic crisis of 2008 - the university of … economic crisis of 2008. past, present, and...
TRANSCRIPT

The Economic Crisis of 2008
Past, Present, and Future
James GwartneyThe Economics and Mathematics of the Global Financial Crisis
University of Tennessee – ChattanoogaJune 7, 2010

The Economic Crisis of 2008: Past, Present, and Future
Three Key Events
• Lessons From Three Key Events• Great Depression of the 1930s• Great Recession of 2008-2009• The Japanese experience of the 1990s
• Stories Matter• Understanding the events of history influences the
nature of future policy
Slide 2 of 75

The Economic Crisis of 2008: Past, Present, and Future
The Story of the Great Depression
• Myth• Caused by 1929 stock market crash• Reflects instability of markets• New Deal government intervention brought depression
to an end
• Reality• Caused by monetary contraction• Smoot-Hawley Tariff Act and tax rate increases• Length and severity increased by New Deal policies• 17% unemployment in 1939
Slide 3 of 75

The Economic Crisis of 2008: Past, Present, and Future
The Great Depression
Slide 4 of 75

The Economic Crisis of 2008: Past, Present, and Future
The Great Depression was a time of high unemployment, soup lines, and banking panics.
Slide 5 of 75

The Economic Crisis of 2008: Past, Present, and Future
Exhibit 1.1: Real GDP, 1929-1940• Real GDP plunged during 1929-1933• After a recovery during 1934-1936, real GDP fell again in 1938
Real GDP Growth
Source: www.bea.gov. Data for 1929 is from Copeland, Morris A. How Large Is Our National Income? Journal of Political Economy. Vol 40 No. 6.
4.0
-8.6-6.5
-13.1
-1.3
10.98.9
13.0
5.1
-3.4
8.1 8.8
-15.0
-10.0
-5.0
0.0
5.0
10.0
15.0
1929 1930 1931 1932 1933 1934 1935 1936 1937 1938 1939 1940
Rea
l GD
P G
row
th R
ate
(per
cent
)
Slide 6 of 75

The Economic Crisis of 2008: Past, Present, and Future
Exhibit 1.2: Rate of Unemployment, 1929-1940• The rate of unemployment rose from 3.2% in 1929 to 8.7% in 1930 and 15.9% in 1931• In 1932-1933, the unemployment rate soared to nearly one-quarter of the labor force• After declining to 14.3% in 1937, the rate of unemployment rose to 19% in 1938 and it
stood at 17% in 1939, a decade after the catastrophic decline began
Unemployment Rate
3.2
8.7
15.9
23.624.9
21.720.1
16.9
14.3
1917.2
14.6
0
5
10
15
20
25
30
1929 1930 1931 1932 1933 1934 1935 1936 1937 1938 1939 1940
Une
mpl
oym
ent R
ate
(per
cent
)
Source: www.bea.gov
Slide 7 of 75

The Economic Crisis of 2008: Past, Present, and Future
Was the Great Depression Caused by the 1929 Stock Market Crash?
Slide 8 of 75

The Economic Crisis of 2008: Past, Present, and Future
Exhibit 1.3: Stock Market, 1928-1930• Stock prices plunged in September-October 1929• But they recovered during the five months from mid-November 1929 through mid-April
of 1930• However, they continued on a downward path during May and for the rest of 1930.
Why?Dow Jones Industrial Average, 1928-1930
Source: www.finance.yahoo.com and www.analyzeindices.com
0
100
200
300
400
Jan-28 Jul-28 Jan-29 Jul-29 Jan-30 Jul-30
DJI
A
Smoot-Hawley Debated and Passed
Slide 9 of 75

The Economic Crisis of 2008: Past, Present, and Future
Exhibit 1.4: Stock Market, 1931-1940• The Dow continued to fall throughout 1931 and 1932• There was a sharp rebound in stock prices during 1933• But the Dow never reached 200 throughout the remainder of the decade
Dow Jones Industrial Average, 1931-1940
Source: www.finance.yahoo.com and www.analyzeindices.com
0
100
200
300
400
1931 1932 1933 1934 1935 1936 1937 1938 1939 1940
DJI
A
Slide 10 of 75
The Economic Crisis of 2008: Past, Present, and Future
Stock Prices and Recessions
• The 1929 decline in stock prices reduced wealth, aggregate demand, and real output
• Stock prices have fallen by 50% or more during other recessions, but the economy still moved toward a recovery within a year or two
• While the decline in stock prices may have triggered the initial economic decline, the length and severity of the Great Depression were the result of other factors
Slide 11 of 75

The Economic Crisis of 2008: Past, Present, and Future
Why Was the Great Depression So Lengthy and Severe?
Slide 12 of 75

The Economic Crisis of 2008: Past, Present, and Future
Causes of the Great Depression
• The length and severity of the Great Depression were the result of four major policy mistakes:• Contraction in the money supply• Large increase in tariffs• Huge tax increases in 1932 and again in 1936• Price controls, perverse regulations, and constant policy
changes during the New Deal era
Slide 13 of 75

The Economic Crisis of 2008: Past, Present, and Future
Causes of the Great Depression
• Factor 1: Contraction of the Money Supply• The supply of money expanded slowly but steadily throughout the 1920s• Even though prices were relatively stable in the 1920s, the Fed increased
the discount rate, four times between January 1928 and August 1929, pushing it from 3.5% to 6%
• After the October stock market crash, the Fed aggressively sold government bonds, which drained reserves from the banking system and reduced the money supply
Slide 14 of 75

The Economic Crisis of 2008: Past, Present, and Future
Exhibit 2.1: Change in the Money Supply, 1925-1940• The money supply fell by 3.9% during 1930, by 15.3% in 1931, and by 8.9% in 1932• The quantity of money at year-end 1933 was 33% less than in 1929• The money supply increased during 1934-1936, but dipped again in 1937
Annual Change of the M1 Money Supply, 1925-1940
Source: Change in the money supply is from December to December. The data is from: Friedman, Milton and Schwartz, Anna J. 1963. A Monetary History of the United States, 1867-1960. Princeton; Princeton University Press.
7.7
0.0
4.5 3.6
-1.5-3.9
-15.3
-8.9 -9.5
13.8 15.0
11.5
-2.2
5.9
10.012.5
-20.0
-10.0
0.0
10.0
20.0
1925 1927 1929 1931 1933 1935 1937 1939
Cha
nge
in M
1 M
oney
Sup
ply
(per
cent
)
Slide 15 of 75

The Economic Crisis of 2008: Past, Present, and Future
Exhibit 2.2: Change in Consumer Prices, 1925-1940• The monetary contraction during 1929-1933 led to deflation• The deflation changed the terms of loans, investments, and other economic activities
that take place across time periods
Annual Change in Consumer Price Index, 1925-1940
Source: www.bls.gov
2.31.1
-1.7 -1.7
0.0
-2.3
-9.0-9.9
-5.1
3.12.2
1.5
3.6
-2.1-1.4
0.7
-12.0
-10.0
-8.0
-6.0
-4.0
-2.0
0.0
2.0
4.0
6.0
1925 1927 1929 1931 1933 1935 1937 1939
Cha
nge
in C
onsu
mer
Pric
e In
dex
(per
cent
)
Slide 16 of 75

The Economic Crisis of 2008: Past, Present, and Future
Monetary Policy and the Great Depression
• Sound monetary policy is about monetary and price stability
• The Fed failed during the 1930s: The initial monetary contraction during 1929-1933 plunged the economy into recession and the second monetary contraction during 1937-1938 stifled the prospects for recovery
• The monetary instability of the 1930s generated uncertainty and undermined the exchange process
Slide 17 of 75

The Economic Crisis of 2008: Past, Present, and Future
Causes of the Great Depression• Factor 2: Smoot-Hawley Tariff Increases of 1930
• Legislation passed in June 1930, increased tariffs by more than 50% on approximately 3,200 imported products
• Like proponents of trade restrictions today, the Smoot-Hawley supporters argued the bill would “save jobs”
• “I want to see American workers employed producing American goods for American consumption”
– Rep. Willis Hawley
Slide 18 of 75

The Economic Crisis of 2008: Past, Present, and Future
Sen. Reid Smoot (R) and Rep. Willis (L) Hawley thought their tariff increases would “save jobs.” Instead, they reduced output and plunged the economy deeper into recession
Slide 19 of 75

The Economic Crisis of 2008: Past, Present, and Future
Causes of the Great Depression• Impact of Smoot-Hawley
• The stock market, which had rebounded to levels prior to the October 1929 crash, moved steadily downward as Congress debated and passed the Smoot-Hawley bill
• Sixty countries responded with higher tariffs on American exports and the volume of trade fell by more than 50%
• Smoot-Hawley reduced the gains from specialization and trade, generated less tariff revenue even though the rates were higher, and plunged the economy further into recession
• The unemployment rate was 7.8% when Smoot-Hawley was passed, but it ballooned to 23.6% just two years later
Slide 20 of 75

The Economic Crisis of 2008: Past, Present, and Future
Causes of the Great Depression
• Factor 3: Tax Increases in the Midst of a Severe Downturn• As the Federal budget fell into deficit in 1931, Congress and the
Hoover Administration instituted a huge tax increase in order to balance the budget
• This tax increase reduced aggregate demand and the incentive to earn and invest, plunging the economy still deeper into recession
Slide 21 of 75

The Economic Crisis of 2008: Past, Present, and Future
Exhibit 3.1: Marginal Income Tax Rates, 1925-1940• The top marginal income tax rate was increased from 25% in 1931 to 63% in 1932 –
other rates were increased by a similar amount• In 1932, real GDP fell by 13.3% and the unemployment rate soared to nearly a quarter
of the labor force
Top and Bottom Marginal Income Tax Rates, 1925-1940
Source: The Tax Foundation, www.taxfoundation.org and the IRS at www.irs.gov
0
10
20
30
40
50
60
70
80
90
1925 1927 1929 1931 1933 1935 1937 1939
Mar
gina
l Inc
ome
Tax
Rat
e (p
erce
nt)
Top Marginal Rate Lowest Marginal Rate
Top Marginal Rate
Lowest Marginal Rate
Slide 22 of 75

The Economic Crisis of 2008: Past, Present, and Future
Exhibit 3.1: Marginal Income Tax Rates, 1925-1940• The top marginal rate was pushed still higher to 79% in 1936, and the tax on the
retained earnings of business was also sharply increased• These tax hikes contributed to the recession of 1937-1938
Top and Bottom Marginal Income Tax Rates, 1925-1940
Source: The Tax Foundation, www.taxfoundation.org and the IRS at www.irs.gov
0
10
20
30
40
50
60
70
80
90
1925 1927 1929 1931 1933 1935 1937 1939
Mar
gina
l Inc
ome
Tax
Rat
e (p
erce
nt)
Top Marginal Rate Lowest Marginal Rate
Top Marginal Rate
Lowest Marginal Rate
Slide 23 of 75

The Economic Crisis of 2008: Past, Present, and Future
Causes of the Great Depression
• Factor 4: Price Controls, Regulations, and Constant Policy Changes• Many history books credit New Deal policies with the eventual end
of the Great Depression
• Some New Deal policies were helpful:• The Federal Deposit Insurance Corporation• Re-evaluation of gold and the expansion in the money supply
during 1934-1936
• But other policies were harmful, and increased the length and severity of the Great Depression
Slide 24 of 75

The Economic Crisis of 2008: Past, Present, and Future
The Agricultural Adjustment Act (AAA)
• Under the AAA, adopted in 1933, the Roosevelt Administration tried to push prices up by reducing supply• Farmers were paid to plow under portions of cotton,
corn, wheat, and other crops• Potato farmers were paid to spray their potatoes with
dye so they would be unfit for human consumption• Cattle, sheep, and pigs were slaughtered
• AAA was declared unconstitutional in 1936
Slide 25 of 75

The Economic Crisis of 2008: Past, Present, and Future
In an effort to push farm prices up, 6 million pigs were slaughtered under the AAA in 1933 alone.
Slide 26 of 75

The Economic Crisis of 2008: Past, Present, and Future
The National Industrial Recovery Act (NIRA)
• Under this legislation passed in June 1933:• More than 500 industries ranging from automobiles and steel to
dog food and dry cleaners were organized into cartels• Government and business leaders set production quotas, prices,
wages, working hours, and distribution methods for each industry• Once approved by a majority of the firms, the regulations were
legally binding on all of the firms in the industry• Businesses that did not comply were fined and subject to jail
sentences• Prior to this legislation, price fixing of this type would have been a
violation of anti-trust legislation
• All of this reduced competition, promoted monopoly pricing, and undermined the market process
Slide 27 of 75

The Economic Crisis of 2008: Past, Present, and Future
Exhibit 4.1: NIRA – Industrial Production, 1932-1936• Industrial output increased sharply during April-July 1933• When the NIRA was implemented in July, industrial output fell by more than 25% over
the next 6 months• Output never reached the June 1933 level again until after the NIRA was declared
unconstitutional in May of 1935U.S. Industrial Production, 1932-1936
.
Source: Historical Statistics of the United States. The base period (equal to 100) was the average of the monthly figures during 1923-1925.
50
75
100
125
1932 1933 1934 1935 1936
Inde
x of
Indu
stria
l Pro
duct
ion NIRA passed NIRA is declared
unconstitutional
Slide 28 of 75

The Economic Crisis of 2008: Past, Present, and Future
Lessons from the Great Depression• Monetary contraction will undermine economic activity such as
investment and thereby retard output and employment
• Trade restrictions will reduce the gains from specialization and exchange• They will not save domestic jobs• Instead they will lead to inefficient use of resources and
reductions in output
• Raising taxes during a recession will reduce output and make matters worse
Slide 29 of 75
The Economic Crisis of 2008: Past, Present, and Future
Lessons from the Great Depression• Constant policy changes will generate uncertainty, retard private
investment, reduce business activity, and thereby prolong the depressed conditions
• Good intentions are no substitute for sound policies• Key decision-makers such as Presidents Hoover and Roosevelt,
Sen. Smoot, Rep. Hawley, other members of congress, and the monetary policy-makers of the 1930s had good intentions, but their actions tragically turned what would have been a recession into the Great Depression
Slide 30 of 75

The Economic Crisis of 2008: Past, Present, and Future
The Great Recession of 2008-2009
Slide 31 of 75

The Economic Crisis of 2008: Past, Present, and Future
The Story of the Great Recession• Myth
• Caused by greed and excessive risk taking• Regulators were asleep at the switch• Markets are inherently unstable• More regulation is the answer
• Reality• Caused by policies that contaminated the mortgage
market• Regulations promoted subprime and low down-
payment mortgages• GSEs eroded incentive for mortgage originators to
evaluate loan quality• Fed policy promoted ARM loans
Slide 32 of 75

The Economic Crisis of 2008: Past, Present, and Future
Key Events of the Great Recession• Housing price increase during 2000-2005, followed by a levelling off
and price decline
• Increase in the default and foreclosure rates beginning in the second half of 2006
• Collapse of major investment banks in 2008
• 2008 collapse of stock prices
Slide 33 of 75
The Economic Crisis of 2008: Past, Present, and Future
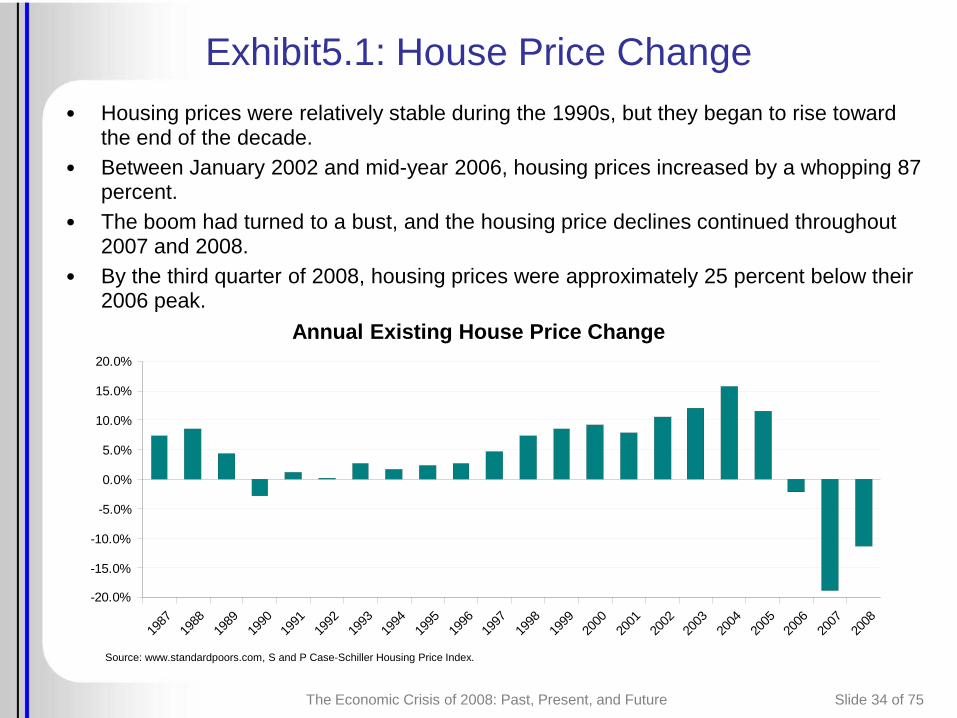
Exhibit5.1: House Price Change• Housing prices were relatively stable during the 1990s, but they began to rise toward
the end of the decade. • Between January 2002 and mid-year 2006, housing prices increased by a whopping 87
percent. • The boom had turned to a bust, and the housing price declines continued throughout
2007 and 2008. • By the third quarter of 2008, housing prices were approximately 25 percent below their
2006 peak.Annual Existing House Price Change
Source: www.standardpoors.com, S and P Case-Schiller Housing Price Index.
1987
1988
1989
1990
1991
1992
1993
1994
1995
1996
1997
1998
1999
2000
2001
2002
2003
2004
2005
2006
2007
2008
-20.0%
-15.0%
-10.0%
-5.0%
0.0%
5.0%
10.0%
15.0%
20.0%
Slide 34 of 75

The Economic Crisis of 2008: Past, Present, and Future
Exhibit 5.2: The Default Rate• The default rate fluctuated, within a narrow range, around 2 percent prior to 2006.• It increased only slightly during the recessions of 1982, 1990, and 2001.• The rate began increasing sharply during the second half of 2006.• It reached 5.2 percent during the third quarter of 2008.
Default Rate
Source: mbaa.org, National Delinquency Survey.
1979
1980
1981
1982
1984
1985
1986
1987
1989
1990
1991
1992
1994
1995
1996
1997
1999
2000
2001
2002
2004
2005
2006
2007
0%
1%
2%
3%
4%
5%
6%
Slide 35 of 75

The Economic Crisis of 2008: Past, Present, and Future
Exhibit 5.3: Foreclosure Rate• The foreclosure rate fluctuated between 0.2% and 0.4% between 1979 to 2005. • This indicates that only 2 to 4 mortgages per 1,000 ended up in foreclosure. • As soon as housing prices levelled off and then began to fall, the foreclosure rate
soared, reaching 1.2% in the 3rd quarter of 2007. • By 2009 the foreclosure rate rose to more than 2% and it was 5% or more in Arizona,
California, Florida, and Nevada.
Foreclosure Rate
Source: www.mbaa.org, National Delinquency Survey.
1979
1980
1981
1982
1984
1985
1986
1987
1989
1990
1991
1992
1994
1995
1996
1997
1999
2000
2001
2002
2004
2005
2006
2007
0.0%
0.2%
0.4%
0.6%
0.8%
1.0%
1.2%
1.4%
Slide 36 of 75

The Economic Crisis of 2008: Past, Present, and Future
Exhibit 5.4: Stock Market Returns• As of mid-December of 2008, stock returns were down by 37 percent since the
beginning of the year. • This is nearly twice the magnitude of any year since 1950. • This collapse eroded the wealth and endangered the retirement savings of many
Americans.
S and P 500 Total Return
Source: www.standardpoors.com
1950
1953
1956
1959
1962
1965
1968
1971
1974
1977
1980
1983
1986
1989
1992
1995
1998
2001
2004
2007
-40%
-30%
-20%
-10%
0%
10%
20%
30%
40%
50%
60%
Slide 37 of 75

The Economic Crisis of 2008: Past, Present, and Future
Four Key Factors Underlie Current Crisis1. Erosion of conventional lending standards
2. Fed policy during 2002-2006
3. Increased leverage lending of GSEs and investment banks
4. Increase in household debt to income ratio
Slide 38 of 75

The Economic Crisis of 2008: Past, Present, and Future
What Caused the Crisis of 2008?FACTOR 1: Beginning in the mid-1990s, government regulations began to erode the conventional lending standards.• Fannie Mae and Freddie Mac hold a huge share of American mortgages.• Beginning in 1995, HUD regulations required Fannie Mae and Freddie
Mac to increase their holdings of loans to low and moderate income borrowers.
• HUD regulations imposed in 1999 required Fannie and Freddie to accept more loans with little or no down payment.
• 1995 regulations stemming from an extension of the Community Reinvestment Act required banks to extend loans in proportion to the share of minority and low-income population in their market area. Conventional lending standards were reduced to meet these goals.
Slide 39 of 75

The Economic Crisis of 2008: Past, Present, and Future
Exhibit 6.1: Fannie Mae and Freddie Mac –Share of Total Mortgages, 1990-2008
• The share of all mortgages held by Fannie Mae and Freddie Mac rose from 25 percent in 1990 to 45 percent in 2001.
• Their share has fluctuated modestly around 45 percent since 2001.
Fannie Mae and Freddie Mac, Share of Outstanding Mortgages
Source: Office of Federal Housing Enterprise Oversight, www.ofheo.gov.
1990
1991
1992
1993
1994
1995
1996
1997
1998
1999
2000
2001
2002
2003
2004
2005
2006
2007
2008
20%
25%
30%
35%
40%
45%
50%
Slide 40 of 75
The Economic Crisis of 2008: Past, Present, and Future
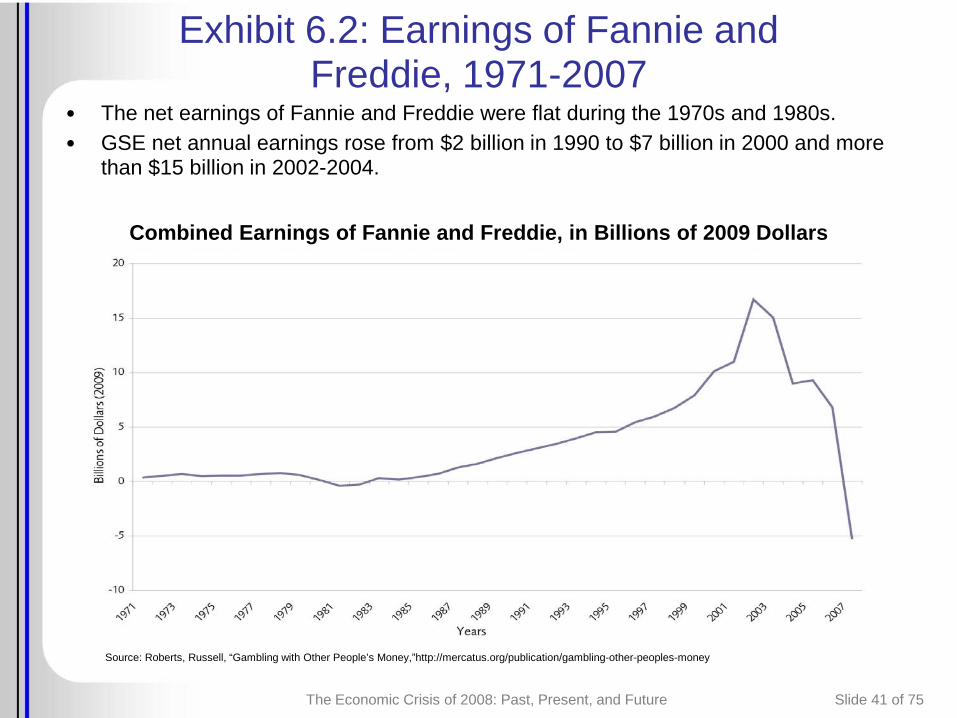
Exhibit 6.2: Earnings of Fannie andFreddie, 1971-2007
• The net earnings of Fannie and Freddie were flat during the 1970s and 1980s.• GSE net annual earnings rose from $2 billion in 1990 to $7 billion in 2000 and more
than $15 billion in 2002-2004.
Combined Earnings of Fannie and Freddie, in Billions of 2009 Dollars
Source: Roberts, Russell, “Gambling with Other People’s Money,”http://mercatus.org/publication/gambling-other-peoples-money
Slide 41 of 75

The Economic Crisis of 2008: Past, Present, and Future
Exhibit 6.3: GSE Mortgages to Borrowers with Incomes Below the Median, 1996-2007
• As the HUD regulations took affect in 1996, GSE mortgages to borrowers with incomes below the median soared.
GSE Mortgage Loans to Below-Median-Income Borrowers
Source: Roberts, Russell, “Gambling with Other People’s Money,”http://mercatus.org/publication/gambling-other-peoples-money
Slide 42 of 75

The Economic Crisis of 2008: Past, Present, and Future
Exhibit6.4: Contamination of the Mortgage Market –Growth of Low Quality Mortgages
• Subprime, Alt-A and home equity loans have increased substantially as a share of the total since 2000.
• In 2006, subprime, Alt-A, and home equity loans accounted for almost half of the mortgages originated during the year.
Subprime, Alt-A, and Home Equity as a Share of Total
Source: Data from 1994-2003 is from the Federal Reserve Board while 2001-2007 is from the Joint Center for Housing Studies at Harvard University
1994 1995 1996 1997 1998 1999 2000 2001 2002 2003 2004 2005 2006 20070%
10%
20%
30%
40%
50%
Subprime (FRB) Subprime (JCHS) Subprime + Alt-A Subprime + Alt-A + Home Equity
Slide 43 of 75

The Economic Crisis of 2008: Past, Present, and Future
Exhibit 6.5: Contamination of the Mortgage Market –Growth of Low Down Payment Loans by GSEs
• The share of Fannie and Freddie mortgages with less than 5 percent down payment soared from 4 percent in 1998 to 12 percent in 2003 to 23 percent in 2007
Share of Fannie and Freddie Mortgages with Down Payment of Less Than 5%, 1998-2007
Source: Roberts, Russell, “Gambling with Other People’s Money,”http://mercatus.org/publication/gambling-other-peoples-money
0
5
10
15
20
25
1998 1999 2000 2001 2002 2003 2004 2005 2006 2007
Per
cent
GS
E M
ortg
ages
Slide 44 of 75

The Economic Crisis of 2008: Past, Present, and Future
What Caused the Crisis of 2008?FACTOR 2: The Fed’s manipulation of interest rates during 2002-2006• Fed's prolonged Low-Interest Rate Policy of 2002-2004 increased
demand for, and price of, housing.• The low short-term interest rates made adjustable rate loans with low
down payments highly attractive.• As the Fed pushed short-term interest rates upward in 2005-2006,
adjustable rates were soon reset, monthly payment on these loans increased, housing prices began to fall, and defaults soared.
Slide 45 of 75

The Economic Crisis of 2008: Past, Present, and Future
Exhibit 7.1: Short-Term Interest Rates• The Fed injected additional reserves and kept short-term interest rates at 2% or less
throughout 2002-2004. • Due to rising inflation in 2005, the Fed pushed interest rates upward.• Interest rates on adjustable rate mortgages rose and the default rate began to increase
rapidly.
Federal Funds Rate and 1-Year T-Bill Rate
Source: www.federalreserve.gov and www.economagic.com
1995
1995
1996
1996
1997
1997
1998
1999
1999
2000
2000
2001
2002
2002
2003
2003
2004
2004
2005
2006
2006
2007
2007
2008
0%
1%
2%
3%
4%
5%
6%
7%
8%
Federal Funds 1 year T-bill
Slide 46 of 75

The Economic Crisis of 2008: Past, Present, and Future
Exhibit 7.2: Taylor Rule and Fed Policy, 1985-present
Actual and Target Federal Funds Rate, 1985-present
Source: Federal Reserve Bank of St. Louis
1985 1987 1989 1991 1993 1995 1997 1999 2001 2003 2005 2007 20090
1
2
3
4
5
6
7
8
9
10
Actual Target
Per
cent
Slide 47 of 75

The Economic Crisis of 2008: Past, Present, and Future
Exhibit 7.3: Further Contamination of The Mortgage Market – Growth of ARM Loans
• Following the Fed's low interest rate policy of 2002-2004, Adjustable Rate Mortgages (ARMs) increased sharply.
• Measured as a share of total mortgages outstanding, ARMs increased from 10% in 2000 to 21% in 2005.
ARM Loans as a Percent of Total Outstanding Mortgages
Source: Office of Federal Housing Enterprise Oversight, www.ofheo.gov.
1990
1991
1992
1993
1994
1995
1996
1997
1998
1999
2000
2001
2002
2003
2004
2005
2006
2007
2008
0%
5%
10%
15%
20%
25%
Slide 48 of 75

The Economic Crisis of 2008: Past, Present, and Future
What Caused the Crisis of 2008?FACTOR 3: An SEC Rule change adopted in April 2004 led to highly leverage lending practices by investment banks and their quick demise when default rates increased.• The rule favored lending for residential housing.• Loans for residential housing could be leveraged by as much as 25 to 1,
and as much as 60 to 1, when bundled together and financed with securities.
• Based on historical default rates, mortgage loans for residential housing were thought to be safe. But this was no longer true because regulations had seriously eroded the lending standards and the low interest rates of 2002-2004 had increased the share of ARM loans with little or no down payment.
• When default rates increased in 2006 and 2007, the highly leveraged investment banks soon collapsed.
Slide 49 of 75

The Economic Crisis of 2008: Past, Present, and Future
Exhibit 8.1: Leverage Ratios• The leverage ratios of loans and other investments to capital assets for various
financial institutions are shown here.• When Bear Stearns was acquired by JP Morgan Chase its leverage ratio was 33 to 1.
Note, this was not particularly unusual for the GSEs and large investment banks.
Leverage Ratios (June 2008)
Source: The Rise and Fall of the U.S. Mortgage and Credit Markets: A Comprehensive Analysis of the Meltdown, Milken Institute
Credit unions
Commercial banks
Savings institutions
Brokers/hedge Funds
Fannie Mae
Freddie Mac
0 20 40 60 80
67.9
21.5
31.6
9.4
9.8
9.1
Slide 50 of 75

The Economic Crisis of 2008: Past, Present, and Future
What Caused the Crisis of 2008?FACTOR 4: Doubling of the Debt/Income Ratio of Households since the mid-1980s.• The debt-to-income ratio of households was generally between 45 and 60
percent for several decades prior to the mid 1980s. By 2007, the debt-to-income ratio of households had increased to 135 percent.
• Interest on household debt also increased substantially.• Because interest on housing loans was tax deductible, households had
an incentive to wrap more of their debt into housing loans.• The heavy indebtedness of households meant they had no leeway to deal
with unexpected expenses or rising mortgage payments.
Slide 51 of 75
The Economic Crisis of 2008: Past, Present, and Future
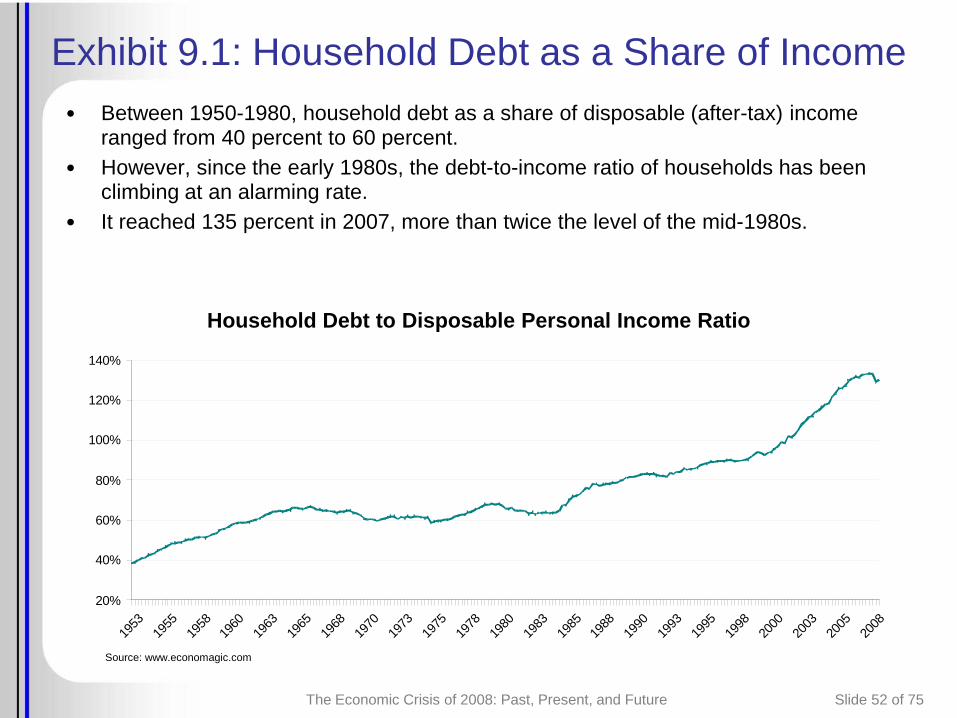
Exhibit 9.1: Household Debt as a Share of Income• Between 1950-1980, household debt as a share of disposable (after-tax) income
ranged from 40 percent to 60 percent.• However, since the early 1980s, the debt-to-income ratio of households has been
climbing at an alarming rate.• It reached 135 percent in 2007, more than twice the level of the mid-1980s.
Household Debt to Disposable Personal Income Ratio
Source: www.economagic.com
1953
1955
1958
1960
1963
1965
1968
1970
1973
1975
1978
1980
1983
1985
1988
1990
1993
1995
1998
2000
2003
2005
2008
20%
40%
60%
80%
100%
120%
140%
Slide 52 of 75
The Economic Crisis of 2008: Past, Present, and Future
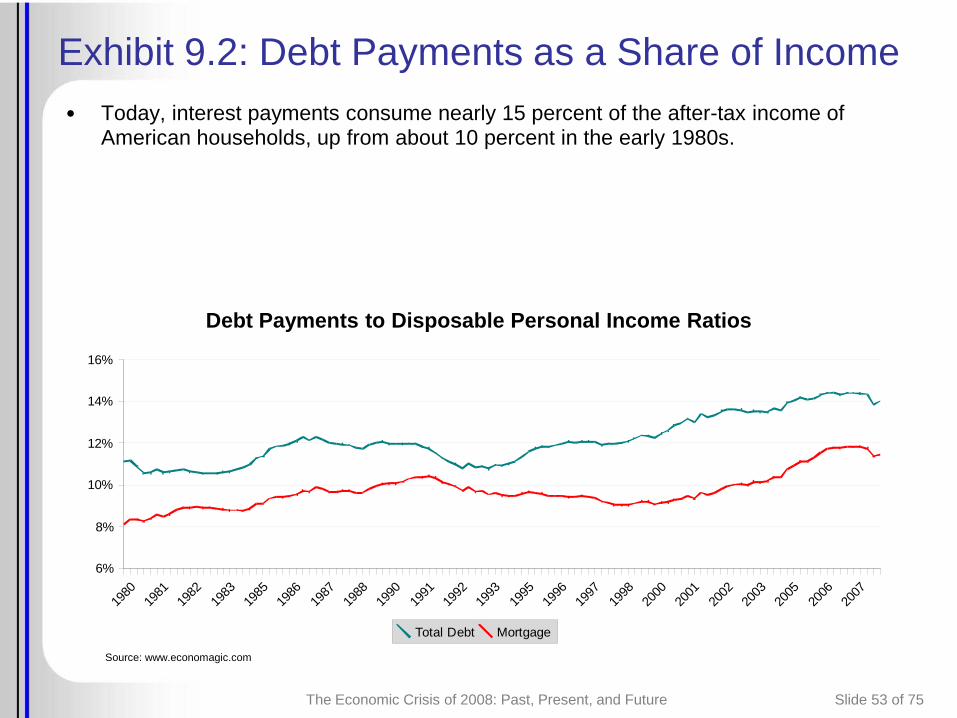
Exhibit 9.2: Debt Payments as a Share of Income• Today, interest payments consume nearly 15 percent of the after-tax income of
American households, up from about 10 percent in the early 1980s.
Debt Payments to Disposable Personal Income Ratios
Source: www.economagic.com
1980
1981
1982
1983
1985
1986
1987
1988
1990
1991
1992
1993
1995
1996
1997
1998
2000
2001
2002
2003
2005
2006
2007
6%
8%
10%
12%
14%
16%
Total Debt Mortgage
Slide 53 of 75

The Economic Crisis of 2008: Past, Present, and Future
Summary of the Great Recession• Regulations that eroded lending standards, the Fed’s interest rate
policy, imprudent leverage lending by banks with the help of security rating firms, and the growth of household debt combined to create the financial crisis of 2008
• The mortgage-backed securities were marketed throughout the world, and as default rates rose, the value of the securities plummeted and the crisis spread around the world
• The default and foreclosure rates rose well before the recession started in December 2007, indicating that it was the housing crisis that caused the recession, not the other way around
Slide 54 of 75

The Economic Crisis of 2008: Past, Present, and Future
Lessons from the Japanese Experience
Slide 55 of 75

The Economic Crisis of 2008: Past, Present, and Future
The Boom and Bust of JapaneseAsset Prices, 1985-1992
• The Japanese economy grew at an annual rate of 6% during the 3 decades following 1960. By 1990, the per-capita income of Japan was similar to the high-income countries of Western Europe and North America
• In the late 1980s, real estate and stock prices in Japan soared, much like housing prices in the U.S. during 2001-2005
• Like the housing boom in the U.S., Japan’s stock and real estate price boom was followed by a bust in the early 1990s
• This price collapse led to a surge in loan defaults, troubles in the banking sector, and a sharp slowdown in the growth of the Japanese economy in the early 1990s
• This sluggishness persisted and the 1990s are now known as Japan’s “lost decade”
Slide 56 of 75

The Economic Crisis of 2008: Past, Present, and Future
Exhibit10.1: Japanese Stock Market, 1984-2008• During the 1980s the Nikkei 225 soared, reaching nearly 39,000 at year-end 1989• But it fell by 46% during the first 9 months of 1990 and has never recovered• By January 2002, it had fallen below 10,000, approximately ¼ the 1989 level• At year-end 2008 the index stood at 8,860
Nikkei 225 Index, 1984-2008.
Source: finance.yahoo.com
0
10,000
20,000
30,000
40,000
1984 1986 1988 1990 1992 1994 1996 1998 2000 2002 2004 2006 2008
Nik
kei 2
25 In
dex
Slide 57 of 75

The Economic Crisis of 2008: Past, Present, and Future
Exhibit10.2: Change in Real GDP, 1987-2008• Growth of real GDP in Japan averaged 5% annually during the 1980s, but only 1%
during 1992-2001• Growth during 2002-2008 has remained sluggish
Change in Japanese Real GDP, 1987-2008.
Source: World Bank, World Development Indicators and OECD Economic Outlook, Dec 2008 No. 84
3.8
6.8
5.3 5.2
3.4
1.00.2
1.12.0
2.7
1.6
-2.0
-0.1
2.9
0.2 0.3
1.4
2.71.9
2.4 2.1
0.5
-4.0
-2.0
0.0
2.0
4.0
6.0
8.0
1987 1989 1991 1993 1995 1997 1999 2001 2003 2005 2007
Cha
nge
in R
eal G
DP
(per
cent
)
Slide 58 of 75
The Economic Crisis of 2008: Past, Present, and Future
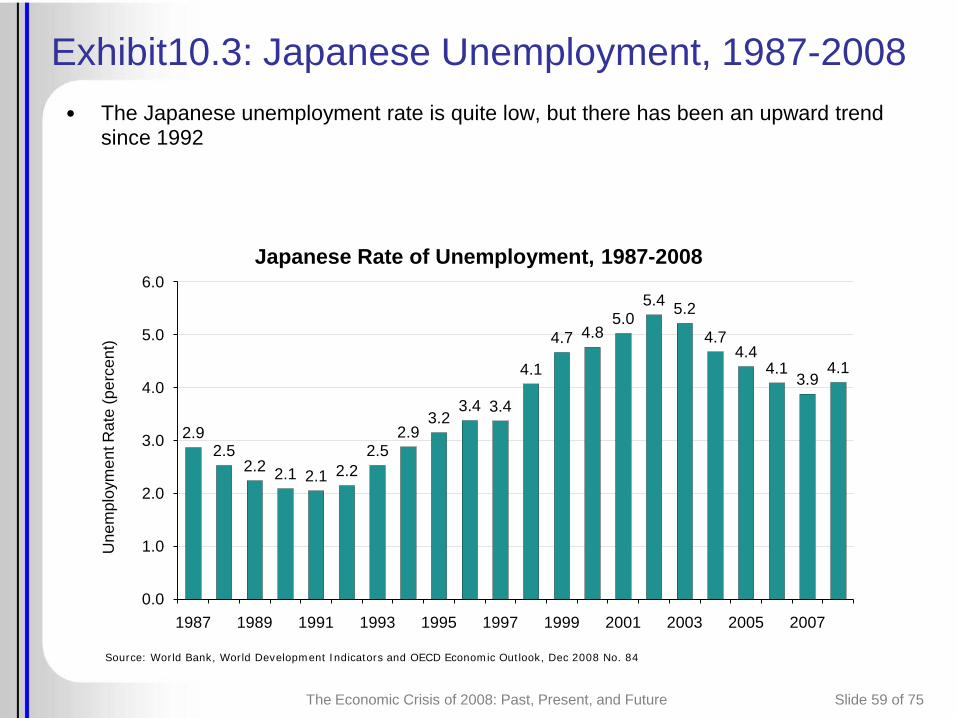
Exhibit10.3: Japanese Unemployment, 1987-2008• The Japanese unemployment rate is quite low, but there has been an upward trend
since 1992
Japanese Rate of Unemployment, 1987-2008.
Source: World Bank, World Development Indicators and OECD Economic Outlook, Dec 2008 No. 84
2.92.5
2.2 2.1 2.1 2.22.5
2.93.2
3.4 3.4
4.1
4.7 4.85.0
5.4 5.2
4.74.4
4.13.9
4.1
0.0
1.0
2.0
3.0
4.0
5.0
6.0
1987 1989 1991 1993 1995 1997 1999 2001 2003 2005 2007
Une
mpl
oym
ent R
ate
(per
cent
)
Slide 59 of 75

The Economic Crisis of 2008: Past, Present, and Future
Japanese Policy Responses During the 1990s
Slide 60 of 75
The Economic Crisis of 2008: Past, Present, and Future
Japanese Fiscal Policy
• Japan responded to the downturn with several “stimulus” programs that substantially increased spending on roads, bridges, and other infrastructure
• Government spending rose from a little more than 30% of GDP in the early 1990s to nearly 40% in the latter part of the decade
• The increased spending was financed with budget deficits
Slide 61 of 75

The Economic Crisis of 2008: Past, Present, and Future
Exhibit11.1: Government Expenditures, 1987-2002• During the 1990s, government spending expanded, soaring to nearly 40% of GDP
during 1999-2002
Japanese Government Expenditures as a Share of GDP, 1987-2002.
Source: OECD Economic Outlook, June 2003 No. 73
31.7 31.1 30.532.1 31.8
32.8
34.7 35.136.1 36.6
35.436.5
38.1 38.6 38.0 38.6
20.0
25.0
30.0
35.0
40.0
1987 1989 1991 1993 1995 1997 1999 2001
Gov
ernm
ent E
xpen
ditu
res
As
a S
hare
of
GD
P (p
erce
nt)
Slide 62 of 75

The Economic Crisis of 2008: Past, Present, and Future
Exhibit11.2: Japanese Budge Deficits, 1987-2002• Japan’s increased government spending was financed by borrowing• Japan began running budget deficits in 1993, and they became larger and larger during
the decade that followed
Japanese Budget Deficits as a Share of GDP, 1987-2002.
Source: OECD Economic Outlook, June 2003 No. 73
0.31.1
1.8 2.0 1.80.8
-2.4
-3.7-4.7 -5.0
-3.8
-5.5
-7.2 -7.4
-6.1-7.1-8.0
-6.0
-4.0
-2.0
0.0
2.0
4.0
1987 1989 1991 1993 1995 1997 1999 2001
Bud
get D
efic
it (-)
or S
urpl
us (+
) As
a S
hare
of G
DP
(per
cent
)
Slide 63 of 75

The Economic Crisis of 2008: Past, Present, and Future
Exhibit11.3: Japanese Net Debt, 1987-2008• Measured as a share of GDP, the net debt of the Japanese Central Government was
14% in 1992, but it rose to 60% in 2000 and 88% in 2008• Japan’s fiscal policy response was highly expansionary – an increase in government
spending, larger budget deficits and an increase in debt• But the economy continued to stagnate
Net Debt of Japanese Central Government as a Share of GDP, 1987-2008.
Source: OECD Economic Outlook, Dec 2008 No. 84 and June 2003 No. 73
0
10
20
30
40
50
60
70
80
90
1987 1989 1991 1993 1995 1997 1999 2001 2003 2005 2007
Net
Gov
ernm
ent D
ebt (
perc
ent o
f GD
P)
Slide 64 of 75
The Economic Crisis of 2008: Past, Present, and Future
Japanese Fiscal Response Summary
• Japan’s fiscal policy response was highly expansionary• Government spending as a share of GDP increased• Budget deficits were large• Net government debt soared
• But the economy continued to stagnate
Slide 65 of 75

The Economic Crisis of 2008: Past, Present, and Future
Japanese Monetary Policy
• In contrast with fiscal policy, Japanese monetary policy was restrictive during the 1990s
• The money supply grew slowly and during 1995-2002 deflation was often present
Slide 66 of 75

The Economic Crisis of 2008: Past, Present, and Future
Exhibit12.1: Japanese Monetary Policy, 1987-2002• In contrast with fiscal policy, Japanese monetary policy was restrictive during the 1990s• The money supply grew slowly and during 1995-2002 deflation was often present
Annual Percentage Change in Japanese M2 Money Supply, 1987-2002.
Source: www.econstats.com and OECD Economic Outlook, June 2003 No. 73
11.510.4 10.6
8.5
2.0
-0.4
1.4
2.9 3.2 2.93.8 3.9
2.62.0
3.42.1
-2.0
0.0
2.0
4.0
6.0
8.0
10.0
12.0
14.0
1987 1989 1991 1993 1995 1997 1999 2001
Cha
nge
in M
2 (p
erce
nt)
Slide 67 of 75

The Economic Crisis of 2008: Past, Present, and Future
Exhibit12.2: Japanese Inflation, 1987-2002• The general level of prices changed little during the 1990s• Deflation was present during 5 of the 8 years between 1995-2002
Annual Percentage Change in Japanese Consumer Price Index, 1987-2002
Source: www.econstats.com and OECD Economic Outlook, June 2003 No. 73
0.1
0.7
2.3
3.1 3.2
1.71.3
0.7
-0.1
0.1
1.7
0.7
-0.3-0.7 -0.7 -0.9
-2
-1
0
1
2
3
4
1987 1989 1991 1993 1995 1997 1999 2001
Cha
nge
in C
onsu
mer
Pric
e In
dex
(per
cent
)
Slide 68 of 75
The Economic Crisis of 2008: Past, Present, and Future
The Aging Population of Japan in the 1990s and the United States Today
Slide 69 of 75

The Economic Crisis of 2008: Past, Present, and Future
Exhibit13.1: Aging of the Japanese Population• The share of the population age 65 and over in Japan nearly doubled during 1990-2010
Percentage of the Japanese Population 65+
Source: Statistical Survey Department of Japan, Statistics Bureau, Ministry of Internal Affairs and Communications; the National Institute of Population and Social Security Research, http://www.ipss.go.jp/index-e.html
12.0
17.3
23.1
0.0
5.0
10.0
15.0
20.0
25.0
1990 2000 2010
Per
cent
of P
opul
atio
n 65
+
Slide 70 of 75

The Economic Crisis of 2008: Past, Present, and Future
Exhibit13.2: Aging of the U.S. Population• The elderly population in the U.S. during 2010-2030 will grow rapidly, but the growth
will be a little slower than was the case in Japan during 1990-2010
Percentage of the U.S. Population 65+
Source: U.S. Census Bureau. The 2020 and 2030 figures for the U.S. are projections.
13.0
16.1
19.3
0.0
5.0
10.0
15.0
20.0
25.0
2010 2020 2030
Per
cent
of P
opul
atio
n 65
+
Slide 71 of 75
The Economic Crisis of 2008: Past, Present, and Future
Impact of Aging Population
• Growth of the elderly population as a share of the total, will tend to reduce productivity and lead to higher taxes for the finance of retirement benefits and health care for the elderly
• This slowed economic growth in Japan during the 1990s, and it is likely to do so in the U.S. in the decade ahead
Slide 72 of 75

The Economic Crisis of 2008: Past, Present, and Future
Lessons from the Japanese Experience
• Expansionary fiscal policy is unlikely to be very effective in promoting recovery from a severe recession generated by reductions in asset prices and wealth
• Restrictive monetary policy will tend to delay and complicate recovery
• Growth of the elderly population as a share of the total is likely to place upward pressure on taxes, reduce productivity, and slow long-term growth
Slide 73 of 75

The Economic Crisis of 2008: Past, Present, and Future
Difference Between Policy Response of Japan and the U.S.
• While there are many similarities between the Japanese economic crisis of 1990 and that of the U.S. in 2008-2009, there is one major difference: monetary policy
• If monetary policy exerts a strong impact, the U.S. experience in the decade ahead may differ substantially from that of Japan during the 1990s
• Even if expansionary monetary policy does lead to a robust recovery, the long and variable lags will make it difficult for the Fed to both promote recovery and then shift back to restraint in a manner that will lead to stability in the decade ahead
• We are in the midst of a very interesting “experiment” in macroeconomics
Slide 74 of 75

The Economic Crisis of 2008: Past, Present, and Future
END
Slide 75 of 75