the economic benefits of new york s …cloud.tpl.org/pubs/local-ny-economic-benefits-rpt2012.pdf ·...
TRANSCRIPT

THE ECONOMIC BENEFITS OF NEW YORK’S ENVIRONMENTAL PROTECTION FUND

This report was made possible by support from The Doris Duke Charitable Foundation and the New York Environmental Leaders Group.
Copyright © January 2012. The Trust for Public Land. All rights reserved.
Cover Photos: Clark Jones, Darcy Kiefel

EXECUTIVE SUMMARY.................................................. 1
INTRODUCTION..............................................................4
ECONOMIC BENEFITS: OPEN SPACE....................... 5 Natural Goods & Services .......................................................7 Tourism & Recreation ......................................................... 10 Visitation & Spending................................................... 10 Wildlife Recreation.......................................................12 Agriculture Industry ............................................................12 Forest Products Industry....................................................... 17
ECONOMIC BENEFITS: SOLID WASTE..................19 Municipal Solid Waste & Recycling.........................................19 Municipal Landfill Closure...................................................20
ECONOMIC BENEFITS: PARKS, RECREATION & HISTORIC PRESERVATION.........................................21 State Parks & Land Stewardship .............................................21 Municipal Parks ..................................................................21 Historic Preservation and Urban Cultural Parks ........................23
Waterfront Revitalization .................................................... 24 Zoos, Botanical Gardens & Aquaria.........................................25
LEVERAGE LOCAL AND FEDERAL FUNDS............ 26
REFERENCES .................................................................. 28
APPENDIX........................................................................32
Table of Contents


T he Environmental Protection Fund (EPF) is New York’s funding source for critical environmental programs. EPF supports a diverse number of programs in the broad
categories of Open Space; Solid Waste; and Parks, Recreation, and Historic Preservation. Projects from these categories do more than preserve New York’s land, air, and water; they produce significant economic benefits to local communities throughout the state. The Trust for Public Land (TPL) conducted an analysis to quantify and characterize these benefits. A summary of the key findings and benefits is below, organized along the lines of the primary EPF categories.
Open Space
• Natural Goods and Services: Natural lands conserved through the EPF provide valuable natural goods and services, such as air pollution removal, water quality protection, and stormwater management. For example, Suffolk and Nassau Counties save an estimated $23.9 million annually in stormwater management and treatment costs because their parks and open space naturally filter stormwater. TPL analyzed EPF conserved lands and found that every $1 invested by the State of New York returns $7 in economic value in natural resource goods and services alone.
• Tourism and Outdoor Recreation Economies: Land conservation, critical maintenance, and trail construction projects funded by the EPF benefit the robust state and local tourism and recreation economies. In 2005, 18.4 million people participated in some form of nonmotorized outdoor recreation in New York. Active outdoor recreation produces $11.3 billion annually in retail sales and services, generates nearly $800 million in annual state tax revenue, and supports 130,000 jobs statewide. A study of three nature preserves in Ulster County found that visitors had a total annual impact of $12.3 million on local economies. These types of benefits are generated in local communities throughout the state because of the EPF.
• Agriculture Industry: Farmland preservation through the EPF is important to the health of the agriculture industry. Farm production and the agri-service and food processing sectors generate a combined $22 billion annually for New York’s economy and employ tens of thousands of workers. When wholesale goods trade, retail food trade, and food service industries are factored in, New York State’s farm-food system comprises over 10 percent of the State’s total gross output of $1.3 trillion. There is, however, a danger of losing New York farmland to development. An estimated loss of $32 million in agricultural output in 2010 due to farmland loss highlights the economic importance of farmland preservation programs.
Executive Summary
Photo courtesy of Hudson River Estuary Program
1

• Forestry Industry: Conserved working forests help sustain New York’s timber harvesting, production, and manufacturing industries. In 2009, forest-related manufacturing contributed $4.5 billion to New York’s economy and provided 38,000 jobs in the state. Funds through the EPF help prevent working forests from being sold, divided, and developed.
Solid Waste
• Municipal Solid Waste and Recycling: Recycling activities are a significant economic contributor with an annual payroll of nearly $1.4 billion statewide. Recycling generates $10 billion in revenues for recycling-related businesses each year. The EPF provides funding for recycling programs that generate jobs and businesses and helps reduce the burden of waste management as the only ongoing state funding source for solid waste projects.
• Municipal Landfill Closure: The EPF provides assistance to local communities to close landfills, which combined with new recycling programs and facilities created by EPF grants has substantial economic benefit to communities. For every job required to operate a landfill or municipal waste combustor, 10 jobs can be created to process recyclable materials and prepare them for market. As an additional benefit, nearby property values are increased by the proper closure of landfills. Closed landfills can also be transformed into public open space, providing further economic benefits.
Parks, Recreation, and Historic Preservation
• State Parks and Land Stewardship: The New York State Park System contributes to the economic vitality of local communities by attracting visitors who spend money in communities near parks. Approximately 56 million annual visitors to State Parks contribute nearly $2 billion to the New York economy in sales and output. This economic contribution exceeds the costs of operating the State Park system by a ratio of five to one. Visitor spending combined with public spending creates an additional 20,000 jobs to those created directly by the park system.
Executive Summary
Photo courtesy of Warren County Soil and Water Conservation District
2

• Municipal Parks: Local parks boost nearby property values which leads to increased property tax revenue for local governments and school districts. Parks also provide important natural services such as managing urban stormwater and removing harmful airborne pollutants. Trees in the Buffalo-Lackawanna area decrease the amount of stormwater to be managed by 18 million cubic feet during an average storm—a service valued at $35.5 million. Central Park generates about $656 million in New York City tax revenues, nearly equivalent to the total annual cost of the city’s entire park system.
• Historic Preservation: Rehabilitating significant cultural buildings provides important construction jobs and creates attractive communities where people want to live and work. Preservation returns vacant and underutilized properties into productive uses and attracts visitors who infuse money into local economies. For every $1 million spent rehabilitating a historic building in New York State, $1.9 million is added to the State’s economy. Every $1 million invested in preservation construction in New York City creates five more construction jobs, and three more permanent jobs than $1 million invested in new construction.
• Waterfront Revitalization: Waterfront projects are catalysts for economic development. EPF investments leverage private investment and spawn new development. A river walk project in Oswego transformed the city’s downtown through increased activity, which reduced building vacancy rates by 50 percent, spurred new construction, and helped draw new visitors to its downtown area.
• Zoos, Botanical Gardens and Aquaria: “Living museums” are important environmental education institutions that attract large numbers of visitors and provide local jobs. A total of 80 zoos, botanical gardens, and aquaria receive EPF support to remain effective environmental education institutions in New York’s urban centers. The Wildlife Conservation Society’s Bronx Zoo and New York Aquarium alone generate approximately $430 million and 2,600 jobs toward the state economy each year.
In conclusion, protecting the state’s environment not only preserves New York’s land, water, and air; it has contributed billions of dollars to the state economy in jobs, taxes, tourism, and other revenue. Expanding funding for the EPF is an essential investment in the state’s long-term prosperity.
Executive Summary
Photo courtesy of Friends of Hudson River Park
3

The Environmental Protection Fund (EPF) is New York’s funding source for essential environmental programs. Established in 1993, the EPF was intended to establish a steady, reliable source of funding to protect open space, address solid waste issues, and support state parks and historic preservation. Since the EPF was established, the scope of programs supported by EPF was broadened to include storm and waste water treatment; farmland preservation; agricultural non-point source pollution control; and zoos, botanical gardens, and aquaria. Exhibit 1 shows the major funding categories of EPF.
The EPF is funded by a portion of revenues from the New York State Real Estate Transfer Tax (RETT). The RETT has historically accounted for 92 percent of total funds appropriated to the EPF. The level of funding to the EPF is decided each year by the Governor and State Legislature. Since the EPF was established in 1993, over $2.2 billion has been appropriated to the Fund, however funds have been taken from the EPF in the past for other uses. According to the Office of the State Comptroller, a total of $914 million has been “swept” to the State’s General Fund, although $406 million of these funds have been replaced with public authority bonds. No funds were swept last year under the first budget of the Cuomo Administration. Lower levels of EPF funding mean fewer economic and environmental benefits to New York State residents and communities. This report quantifies the real and significant economic benefits that EPF has helped create. With adequate funding, the EPF will continue to create and sustain these benefits.
Category Description
Open Space Supports open space land conservation; biodiversity stewardship and research; agricultural and farmland protection; non-point source abatement and control
Solid Waste Supports municipal landfill closure; municipal waste reduction or recycling; and waste prevention
Parks, Recreation & Historic Preservation
Supports state land stewardship, municipal parks; historic preservation; urban cultural parks; waterfront revitalization; and coastal rehabilitation
Source: Friends of New York’s Environment. 2009. The Environmental Protection Fund: Preserving New York’s Natural Heritage & Quality of Life.
Exhibit 1. EPF Supported Categories
Introduction
4

The Environmental Protection Fund allocates funds to the Department of Environmental Conservation (DEC) and to the Office of Parks, Recreation and Historic Preservation (OPRHP) for direct acquisition of land that may include state parks, forest preserves, historic sites and other categories. In addition, the EPF provides grant funds to local governments and nonprofit organizations to purchase land for parks and historic sites and to develop and preserve these sites.1
TPL examined several categories in which open space conservation provides economic benefits. New York receives benefits in the form of natural goods and services, tourism and visitor spending, and stronger agriculture and forest products industries. Conservation of natural lands provides many other benefits that are difficult to quantify. For example, the quality of life of residents in New York is improved because of these protected spaces, but it is difficult to put a dollar value on this benefit. While these benefits fall outside the scope of this report’s analysis, they are important to keep in mind when considering the value of investing in open space.
From 1998 to 2008 the Environmental Protection Fund protected 358,000 acres, including both land protected through conservation easements, and through direct acquisitions.2 A total of $529 million in EPF funds was used to support this conservation activity, or an annual average of $48.1 million. Exhibit 2 shows EPF spending and acres protected for each year. Data were not available for 2009 and 2010.
Economic Benefits: Open Space
1 Open Space Funding from the Environmental Protection Fund. Available at http://www.dec.ny.gov/lands/5071.html. 2 Although this figure appears to significantly diverge from the well-known 1 million acre milestone recorded by the
Pataki Administration during its term (1995-2006), there are several factors at play that account for this difference. The announced 1 million acre figure included funding from many sources beyond EPF, including state bond funds, state environmental settlements, state revolving funds federal funds, local funds; the figures here reflect only lands acquired using EPF funds. In addition, 1 million acre figure includes anticipated projects that had not been completed at the time of the announcement; this report only includes acres protected when a project is completed.
5
Photo courtesy of Pleasant Riders Snowmobile Club

Exhibit 2. Annual EPF Spending on Acquisitions & Easements
Year Spending Acres
1998 $55,500,000 24,000
1999 $25,500,000 27,900
2000 $69,000,000 12,800
2001 $22,100,000 6,420
2002 $21,600,000 13,200
2003 $27,000,000 11,100
2004 $43,700,000 12,400
2005 $53,400,000 19,900
2006 $59,500,000 28,100
2007 $67,400,000 77,100
2008 $83,900,000 125,000
Total $529,000,000 358,000
Average Annual Spending (1998-2008): $48,100,000
Average Annual Acres Conserved (1998-2008): 32,600
Source: NYS Department of Environmental Conservation, NYS Office of Parks, Recreation and Historic Preservation
Economic Benefits: Open Space
6

Natural Goods & Services
Some of the key economic benefits of protected open space come in the form of natural goods and services. Natural lands and water bodies provide important functions that would otherwise be dramatically more costly to reproduce. Protected parks and open space remove pollutants from the air, store carbon, protect and enhance water quality, provide irreplaceable habitat, produce food, and provide other necessary functions.
TPL conducted an analysis of the return on New York’s investment in land conservation through the EPF (See appendix for complete methodology). TPL analyzed the past (i.e., 1998 to 2008) and likely future (i.e., over the next ten years) economic returns generated from EPF spending on land acquisitions and conservation easements. Spatial data were not available for all 358,000 acres conserved through EPF. Given the best available data, TPL was able to map 144,000 acres protected through EPF, or 40 percent of all EPF conserved land during this period. This data comprises a representative sample that allows for the calculation of the return on New York’s investment in land conservation through EPF.
TPL conducted a thorough literature review of the types of goods and services provided by the ecosystem types conserved. We then used the economic values of the different ecosystem types identified in that literature to estimate a per-acre economic value of the goods and services provided.
The analysis found that these ecosystems produce $2.54 billion present value (i.e., adjusted for inflation to today’s dollars) in natural goods and services from date of purchase (starting in 1998) to 2020. When compared to $365 million (present value) in EPF expenditures on these lands, the analysis found that every $1 invested returns $7 in economic value over this time period from natural goods and services alone.
Economic Benefits: Open Space
Photo courtesy of The Nature Conservancy
7

A 2010 TPL study showed parks and open space in Nassau & Suffolk Counties produce significant economic value through the provision of natural goods and services.
The analysis found that each year parks and open space save communities within the two counties $23.9 million annually in stormwater management costs. Parks and protected open space capture precipitation and slow runoff. Pervious surfaces allow stormwater to infiltrate the ground and recharge groundwater. Without these natural services millions of dollars would be required to manage and treat stormwater.
Air pollution removal by vegetation on these lands was also found to have a substantial economic benefit. Air pollution is a significant problem that damages buildings and causes health problems. Trees and shrubs remove harmful pollutants from the air including carbon monoxide, ozone, and nitrogen dioxide. In Nassau and Suffolk Counties, public parkland and protected open space provide an estimated $18.9 million in air pollution removal each year.
Source: The Trust for Public Land, 2010. The Economic Benefits and Fiscal Impact of Parks and Open Space in Nassau and Suffolk Counties, New York.
Natural Goods and Services: Nassau & Suffolk County Parks and Open Space
Economic Benefits: Open Space
8
Photo courtesy of Long Island Pine Barrens Society Photo: Eric Leshinsky

The quality of New York City’s drinking water depends on open space protection in the Catskill/Delaware watershed region. Protected watershed lands guard drinking water sources against pollution through surface runoff or flow through ground water which discharges to reservoirs and streams. Both New York City and the State of New York own land and conservation easements in the watershed, but much of the land remains privately owned and unprotected.
The DEC relies on EPF money to buy land and conservation easements in the watershed region. The State owns approximately 60,000 acres in the watershed area and owns conservation easements on another 32,000 acres.
New York’s 2009 Open Space Conservation plan, the state’s agenda for open space planning and protection, emphasizes protection of the watershed through state land acquisitions: “Special consideration should also be given to protecting and providing access to the region’s water resources, including specific attention to protecting the watershed supplying New York City’s public drinking water.” Such land protection is necessary to ensure a continuing supply of clean drinking water to millions of city residents.
Without open space protection in the Catskill region, New York City would have to spend billions of dollars on water filtration. In 1989 the city’s drinking water failed to meet federal drinking water standards. The loss of quality came as a result of development in the drinking water source watersheds. The city avoided $6 billion in spending on a water filtration plant (that would require an additional $300 million to operate each year) by investing in watershed protection. The city paid $1.5 billion on a variety of measures, including land acquisition, to protect its watersheds. The natural water filtration services provided by protected watershed lands saved the city over $4.5 billion. The benefits of these protections will continue well into the future.
Sources: NYS Department of Environmental Conservation, 2009 New York Open Space Conservation Plan. New Jersey Department of Environmental Protection, 2004. The Economic Value of New Jersey State Parks and Forests.
Natural Goods and Services: New York City Watershed Protection
Economic Benefits: Open Space
9
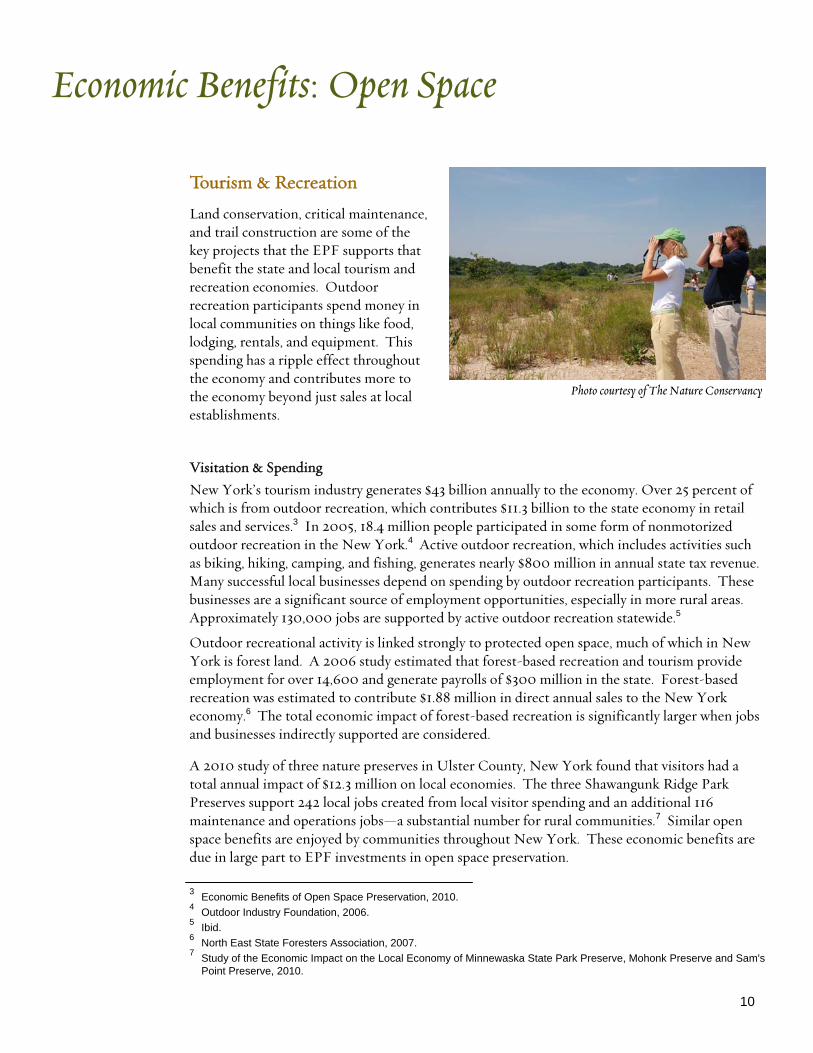
Tourism & Recreation
Land conservation, critical maintenance, and trail construction are some of the key projects that the EPF supports that benefit the state and local tourism and recreation economies. Outdoor recreation participants spend money in local communities on things like food, lodging, rentals, and equipment. This spending has a ripple effect throughout the economy and contributes more to the economy beyond just sales at local establishments.
Visitation & Spending New York’s tourism industry generates $43 billion annually to the economy. Over 25 percent of which is from outdoor recreation, which contributes $11.3 billion to the state economy in retail sales and services.3 In 2005, 18.4 million people participated in some form of nonmotorized outdoor recreation in the New York.4 Active outdoor recreation, which includes activities such as biking, hiking, camping, and fishing, generates nearly $800 million in annual state tax revenue. Many successful local businesses depend on spending by outdoor recreation participants. These businesses are a significant source of employment opportunities, especially in more rural areas. Approximately 130,000 jobs are supported by active outdoor recreation statewide.5
Outdoor recreational activity is linked strongly to protected open space, much of which in New York is forest land. A 2006 study estimated that forest-based recreation and tourism provide employment for over 14,600 and generate payrolls of $300 million in the state. Forest-based recreation was estimated to contribute $1.88 million in direct annual sales to the New York economy.6 The total economic impact of forest-based recreation is significantly larger when jobs and businesses indirectly supported are considered.
A 2010 study of three nature preserves in Ulster County, New York found that visitors had a total annual impact of $12.3 million on local economies. The three Shawangunk Ridge Park Preserves support 242 local jobs created from local visitor spending and an additional 116 maintenance and operations jobs—a substantial number for rural communities.7 Similar open space benefits are enjoyed by communities throughout New York. These economic benefits are due in large part to EPF investments in open space preservation.
Economic Benefits: Open Space
3 Economic Benefits of Open Space Preservation, 2010. 4 Outdoor Industry Foundation, 2006. 5 Ibid. 6 North East State Foresters Association, 2007. 7 Study of the Economic Impact on the Local Economy of Minnewaska State Park Preserve, Mohonk Preserve and Sam's
Point Preserve, 2010.
Photo courtesy of The Nature Conservancy
10
Trails on and through parks and open space attract visitors and support local economies. Trail users spend money on equipment, food, accommodations and transportation. Trails can also increase property values for adjacent residences and businesses. New York has over 16,000 miles of trails throughout the state. A 2008 study of New York trail users found that non-local trail users spend an average of $200 per trail visit.8 The EPF is an important source of land acquisition funds for trail corridors and of funding for trail construction and maintenance projects.
Lands conserved through the EPF continue to generate tax revenue to local communities. New York State pays property taxes on its holdings to towns, villages, and school districts where land is located. The State paid approximately $173.4 million in property taxes to local governments in 2007. Much of this land is reforestation land and forest preserve land, which requires minimal
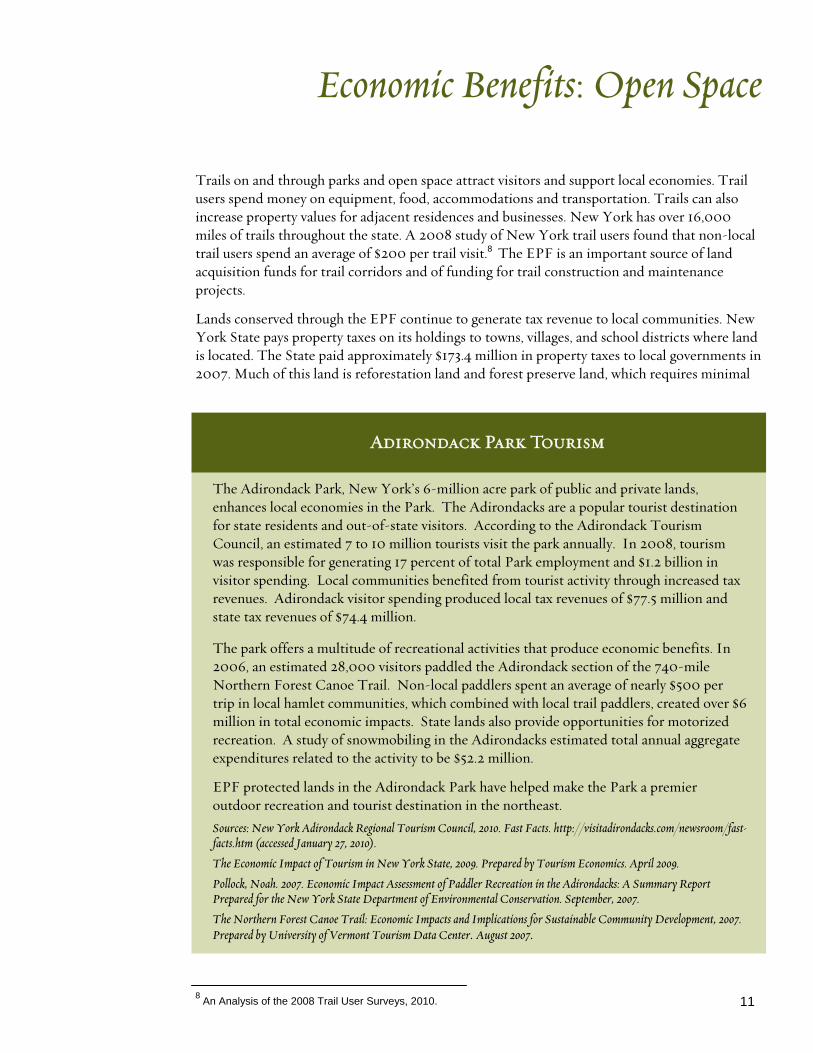
The Adirondack Park, New York’s 6-million acre park of public and private lands, enhances local economies in the Park. The Adirondacks are a popular tourist destination for state residents and out-of-state visitors. According to the Adirondack Tourism Council, an estimated 7 to 10 million tourists visit the park annually. In 2008, tourism was responsible for generating 17 percent of total Park employment and $1.2 billion in visitor spending. Local communities benefited from tourist activity through increased tax revenues. Adirondack visitor spending produced local tax revenues of $77.5 million and state tax revenues of $74.4 million.
The park offers a multitude of recreational activities that produce economic benefits. In 2006, an estimated 28,000 visitors paddled the Adirondack section of the 740-mile Northern Forest Canoe Trail. Non-local paddlers spent an average of nearly $500 per trip in local hamlet communities, which combined with local trail paddlers, created over $6 million in total economic impacts. State lands also provide opportunities for motorized recreation. A study of snowmobiling in the Adirondacks estimated total annual aggregate expenditures related to the activity to be $52.2 million.
EPF protected lands in the Adirondack Park have helped make the Park a premier outdoor recreation and tourist destination in the northeast. Sources: New York Adirondack Regional Tourism Council, 2010. Fast Facts. http://visitadirondacks.com/newsroom/fast-facts.htm (accessed January 27, 2010).
The Economic Impact of Tourism in New York State, 2009. Prepared by Tourism Economics. April 2009.
Pollock, Noah. 2007. Economic Impact Assessment of Paddler Recreation in the Adirondacks: A Summary Report Prepared for the New York State Department of Environmental Conservation. September, 2007.
The Northern Forest Canoe Trail: Economic Impacts and Implications for Sustainable Community Development, 2007. Prepared by University of Vermont Tourism Data Center. August 2007.
Adirondack Park Tourism
Economic Benefits: Open Space
8 An Analysis of the 2008 Trail User Surveys, 2010. 11

spending by municipalities to provide services to compared to developed land. The net positive revenue enjoyed by municipalities can therefore be significant.9
Wildlife Recreation
Fish and wildlife-related recreation such as fishing, hunting, and bird watching is popular in the state and contributes to local economic vitality. In 2006, over 4.5 million residents and visitors participated in fish and wildlife-associated recreation in New York. Of these, 1.2 million fished, 566,000 hunted, and 3.9 million participated in wildlife-watching activities (the sum of anglers, hunters, and wildlife watchers exceeds the total number of participants because many individuals engaged in more than one activity).10 This activity generated over $3.5 billion in state equipment and trip-related expenditures in 2006 alone.11 Open space protection through the EPF is critical to maintaining and growing these benefits.
Agriculture Industry
Farmland preservation helps sustain the agriculture industry and provides an economic stimulus to rural communities. The EPF allocates funds to the Department of Agriculture and Markets, which administers the Farmland Protection Program. The Department provides grants to eligible local governments for up to 75 percent of the cost to purchase the development rights (PDR) on farms. Between 1994 and 2010, $187.5 million in EPF funding was appropriated for the Farmland Protection Program. The Farmland Protection Program has facilitated the purchase of easements for 170 farms covering 32,900 acres.12 Through the program, willing farmers are able to voluntarily sell their property development rights. This often provides critical financial support that allows a farm owner to continue farming.13
According to a 2009 survey, The Farmland Protection Program has been effective in protecting farmland from development. Almost half of participants in the program responded that without the program, their land would have been developed for housing or another use. The program does more than protect land from development. The program also enables farmers to grow their agricultural operations. Nearly a third of program participants use funds from the program to finance the purchase of additional farmland and many also use the funds to upgrade facilities and equipment and hire new staff.14
Economic Benefits: Open Space
12
Photo courtesy of The Nature Conservancy
9 Economic Benefits of Open Space Preservation, 2010. 10 2006 National Survey of Fishing, Hunting, and Wildlife-Associated Recreation. 11 Ibid. 12 Bet on the Farm: Farmland Protection as a Strategy for Economic Growth and Renewal, 2010. 13 Karlin, 2011. 14 New York Farmland Protection Study, 2011.

The impact of EPF funds for preserving farmland is especially significant given the size of the agriculture industry in New York. Farms across the state produce billions of dollars to the New York economy and employ tens of thousands of workers. In 2007 (the most recent census of agriculture), there were 36,400 farms in New York State with total sales of $4.4 billion—17 percent more sales than in 1997 (when adjusted for inflation).15 There are nearly 57,000 key farm operators and almost 60,000 farm laborers.16 In 2009, agricultural production, food manufacturing, and textile-related manufacturing added $8 billion to New York’s economy (see Exhibit 3 below). One recent report calculated that farm production and the agri-service and food processing sectors generate $22 billion annually for New York’s economy. When wholesale goods trade, retail food trade, and food service industries are factored in, New York State’s farm-food system comprises over 10 percent of the State’s total gross output of $1.3 trillion.17
Economic Benefits: Open Space
13
15 The Role of Agriculture in the New York State Economy, 2010. 16 Ibid. 17 Schmitt & Bills, 2007.
Industry Employees Value Added*
Agricultural Production of Goods and Services
n/a $553,000,000
Food Manufacturing 43,000 $7,740,000,000
Textile-Related Manufacturing 2,600 $267,000,000
Total 46,600 $8,000,000,000
Source: U.S. Census Bureau. 2009 Annual Survey of Manufactures (ASM); New York Office of USDA’s NASS. 2011. 2011 Annual Bulletin.
*Value Added is calculated by subtracting the costs of production from the value of shipments (products manufactured plus receipts for services rendered).
Exhibit 3. Value Added by Agricultural Manufacturing & Production to New York Economy – 2009

Exhibit 4. Farmland Loss 1997-2007
Category Year
1997 2002 2007
Farms 38,300 37,300 36,400 Farm loss
(1997 –2007) 1,900 farms
Percent loss 5.0 % Employment* n/a 126,000 117,000 Employment loss
(2002 –2007) 9,320
Percent loss 7.4% Agricultural Land (acres) 7,790,000 7,660,000 7,170,000 Average size of
farms (acres/farm)
204 206 197
Farmland loss (1997-2007) 620,000 acres
Percent loss 7.9 % **Farmland loss to development (1997 –2007)
136,000 acres
Estimated market value of agricultural products sold (adjusted for inflation to 2010 dollars)
$3,850,000,000 $3,750,000,000 $4,680,000,000
Average per farm $101,000 $101,000 $129,000 Average per acre of farmland $495 $490 $655
Sources: U.S. Department of Agriculture. 2007 Census of Agriculture; National Agricultural Statistics Service; Farmland Information Center: New York Statistics Sheet. *Total number of workers hired and total number of farm operators **Agricultural land converted to developed land only
Economic Benefits: Open Space
14

Farmland preservation programs have a major role in protecting the agriculture industry. New York farmers face many challenges including high property taxes and foreign competition. Between 1997 and 2007, New York lost 1,900 farms representing 614,000 acres of lost farmland.18 Of this amount, 136,000 acres of farmland were lost permanently to development. In 2010 it was estimated that there were 7 million acres of farmland in New York and 36,300 farms. This represents an additional loss of 100 farms and nearly 200,000 acres of farmland between just 2007 and 2010.19
Between 1997 and 2007 (years for which data was available) New York lost and an annual average of 13,600 acres of farmland to development. In 2009, the average market value of agricultural products sold per acre was $522. It is therefore possible to estimate a loss of $7.1 million in 2010 from farmland converted to development. During this same period, New York averaged an annual loss of 61,000 acres of farmland taken out of active use (including land that was developed). That loss translates to an estimated $32 million for 2010. 20
Municipalities also save money when farmland is preserved rather than converted to other uses such as housing. In a recent Rochester, NY study, municipal spending for services to residential areas was shown to exceed revenues from that land by over 25 percent. By contrast, the municipal revenues from working and open land exceeded costs by over 80 percent.21
Economic Benefits: Open Space
15
18 The Role of Agriculture in the New York State Economy, 2010. 19 New York Office of USDA's NASS, 2011. 20 Ibid. 21 American Farmland Trust, 2010.
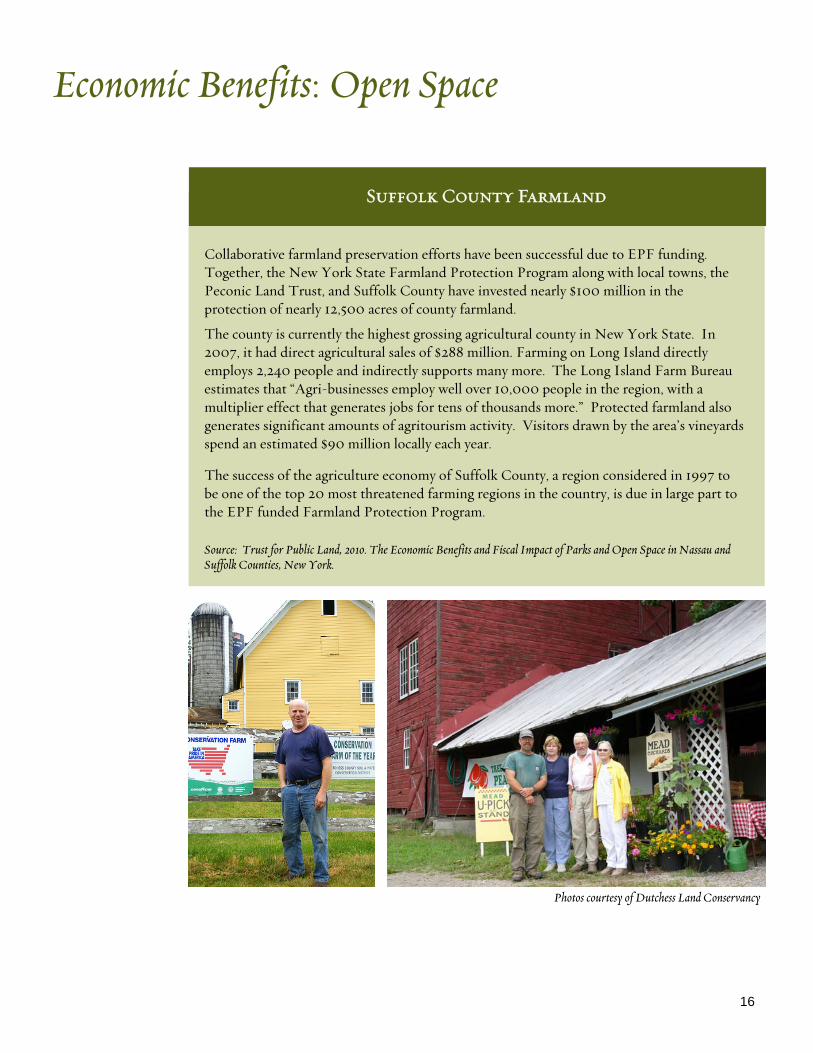
Collaborative farmland preservation efforts have been successful due to EPF funding. Together, the New York State Farmland Protection Program along with local towns, the Peconic Land Trust, and Suffolk County have invested nearly $100 million in the protection of nearly 12,500 acres of county farmland.
The county is currently the highest grossing agricultural county in New York State. In 2007, it had direct agricultural sales of $288 million. Farming on Long Island directly employs 2,240 people and indirectly supports many more. The Long Island Farm Bureau estimates that “Agri-businesses employ well over 10,000 people in the region, with a multiplier effect that generates jobs for tens of thousands more.” Protected farmland also generates significant amounts of agritourism activity. Visitors drawn by the area’s vineyards spend an estimated $90 million locally each year.
The success of the agriculture economy of Suffolk County, a region considered in 1997 to be one of the top 20 most threatened farming regions in the country, is due in large part to the EPF funded Farmland Protection Program. Source: Trust for Public Land, 2010. The Economic Benefits and Fiscal Impact of Parks and Open Space in Nassau and Suffolk Counties, New York.
Suffolk County Farmland
Economic Benefits: Open Space
16
Photos courtesy of Dutchess Land Conservancy

Forest Products Industry
The forestry industry provides a substantial number of jobs and contributes billions of dollars to the State’s economy. New York is 61 percent forested and has approximately 16 million acres of viable timberland.22 A total of 39,000 New Yorkers are employed in forest products manufacturing and logging-related industries. Every 1,000 acres of forestland in New York provides 4.6 jobs—the highest ratio in the northeast.23 The industry’s economic output is significant. In 2009, forest-related manufacturing contributed $4.5 billion to New York’s economy (see Exhibit 5).
EPF investments support the state’s forestry industry by providing funds to buy easement rights to timber lands which allow lands to remain working forests while at the same time allowing the public to enjoy many of these forests. Easements keep the land as forest and prevent the loss of valuable working land to development.24
Economic Benefits: Open Space
17
22 U.S. Department of Agriculture Forest Service, 2009. 23 Forest2Market, 2009. 24 Karlin, 2011.
Exhibit 5. Value Added by Forestry-related Manufacturing & Production to New York
Economy - 2009
Industry Employees Value Added
Forest -related manufacturing
Paper 14,400 $2,380,000,000
Furniture 16,900 $1,620,000,000
Wood products 6,800 $485,000,000
Logging-related industry
Forestry, logging, and supporting activities
900 n/a
Total 39,000 $4,500,000,000
Sources: U.S. Census Bureau. 2009 Annual Survey of Manufactures (ASM), U.S. Census Bureau. 2009 County Business Patterns

The EPF recently funded the acquisition of a conservation easement on 89,000 acres of Adirondack forest that supports timber industry jobs, boosts the state’s recreation and tourism economy and preserves ecologically important land. New York spent $30 million of EPF funds on the easement in a deal brokered by The Nature Conservancy. The deal was widely supported by environmental groups, snowmobile organizations, recreation groups, members of the forestry industry, and over 27 local communities.
The easement adds to the region’s tourism economy by securing some new public access to lands and waterways in the heart of the Adirondacks. The deal has already resulted in a number of new permanent snowmobile trails including critical community connector trails. Snowmobiling is seen as a vital component of many local economies. The easement also supports the state’s forest products industry by maintaining the lands as working forest.
The range of benefits from the project reflects the ability of the EPF to enhance many dif-ferent economic sectors through open space protection. Roger Dziengeleski, Vice Presi-dent and Senior Forester for Finch Paper LLC said, “This agreement ensures that these forests will continue to provide wood for paper and lumber, homes for a wide diversity of wildlife, four-season recreational opportunities for people and clean air and water.”
Source: The Nature Conservancy. 2010. The Nature Conservancy Celebrates Historic Agreement with New York State Protecting 89,000 acres in Adirondacks.
EPF Open Space Conservation Benefits: Adirondack Park Easement
Economic Benefits: Open Space
18
Photo courtesy of Brooklyn Botanic Garden Photo courtesy The Nature Conservancy
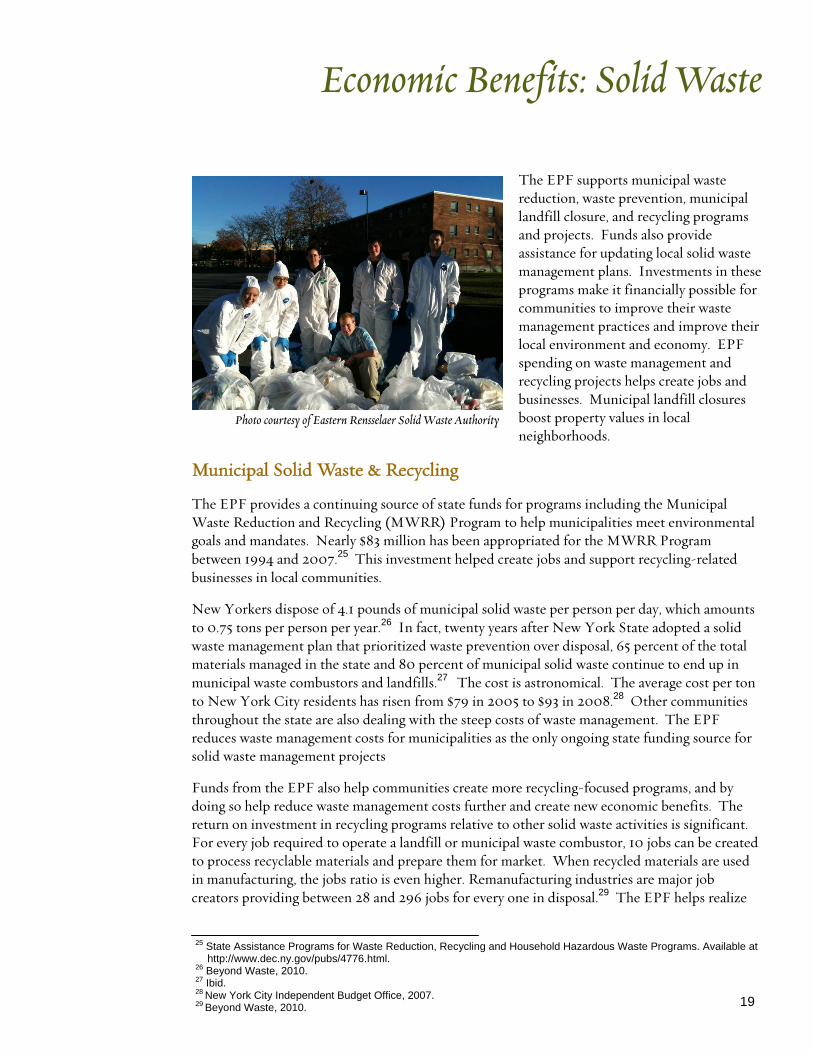
The EPF supports municipal waste reduction, waste prevention, municipal landfill closure, and recycling programs and projects. Funds also provide assistance for updating local solid waste management plans. Investments in these programs make it financially possible for communities to improve their waste management practices and improve their local environment and economy. EPF spending on waste management and recycling projects helps create jobs and businesses. Municipal landfill closures boost property values in local neighborhoods.
Municipal Solid Waste & Recycling
The EPF provides a continuing source of state funds for programs including the Municipal Waste Reduction and Recycling (MWRR) Program to help municipalities meet environmental goals and mandates. Nearly $83 million has been appropriated for the MWRR Program between 1994 and 2007.25 This investment helped create jobs and support recycling-related businesses in local communities.
New Yorkers dispose of 4.1 pounds of municipal solid waste per person per day, which amounts to 0.75 tons per person per year.26 In fact, twenty years after New York State adopted a solid waste management plan that prioritized waste prevention over disposal, 65 percent of the total materials managed in the state and 80 percent of municipal solid waste continue to end up in municipal waste combustors and landfills.27 The cost is astronomical. The average cost per ton to New York City residents has risen from $79 in 2005 to $93 in 2008.28 Other communities throughout the state are also dealing with the steep costs of waste management. The EPF reduces waste management costs for municipalities as the only ongoing state funding source for solid waste management projects
Funds from the EPF also help communities create more recycling-focused programs, and by doing so help reduce waste management costs further and create new economic benefits. The return on investment in recycling programs relative to other solid waste activities is significant. For every job required to operate a landfill or municipal waste combustor, 10 jobs can be created to process recyclable materials and prepare them for market. When recycled materials are used in manufacturing, the jobs ratio is even higher. Remanufacturing industries are major job creators providing between 28 and 296 jobs for every one in disposal.29 The EPF helps realize
Economic Benefits: Solid Waste
Photo courtesy of Eastern Rensselaer Solid Waste Authority
19
25 State Assistance Programs for Waste Reduction, Recycling and Household Hazardous Waste Programs. Available at http://www.dec.ny.gov/pubs/4776.html.
26 Beyond Waste, 2010. 27 Ibid. 28 New York City Independent Budget Office, 2007. 29 Beyond Waste, 2010.

these benefits by enabling communities to close landfills and shift to more recycling-focused programs.
Recycling is a significant industry in New York providing 32,000 jobs in 4,000 recycling related businesses in 2007. These businesses have a combined annual payroll of nearly $1.4 billion. New York recycling, recycling reliant, and reuse and remanufacturing industries generate significant economic benefits by replacing materials manufactured outside of the region with materials collected and processed within the region.30 Recycling activities generate revenues of $10 billion for recycling-related businesses.31
During its 15-year tenure, the Empire State Development’s grant program invested $25.9 million in reuse, remanufacturing and recycling businesses, and leveraged more than $70 million in other funds. Those investments created nearly 700 new jobs and retained more than 800 jobs in the state.32 Jobs in the recycling industry are expected to grow. New York’s recent waste management plan is focused on minimizing waste and maximizing the use of recyclable materials. Its implementation is expected to create 67,000 jobs by 2030.33 EPF investment in recycling programs helps create jobs and other economic benefits in cities, towns, and villages across the state.
Municipal Landfill Closure Non-hazardous municipal landfill closures are funded through the EPF. Numerous studies have documented the external costs generated by landfill use—between $3.05 and $4.39 for each compacted ton disposed of over a landfill’s lifetime.34 More efficient waste management practices and programs combined with landfill closures help reduce this cost.
Landfill closures have a positive impact of nearby property values. Millions in EPF funding supported the closure of Fresh Kills Landfill on Staten Island. One study that examined the closure found an immediate impact on nearby housing sales prices within 600 days of the closure.35 The 2,200 acre landfill is now being turned into a major destination park featuring substantial ecological restoration, recreation opportunities, and public facilities. The park is expected to further increase property values and attract large numbers of visitors.
Economic Benefits: Solid Waste
30 Northeast Recycling Council, 2009. 31 Ibid. 32 Dimino and Warren, 2004. 33 Beyond Waste, 2010. 34 Kinnaman, 2009. 35 Chen, 2011.
20

EPF grants go to projects that enhance and create state and local parks, preserve significant cultural buildings and locations, revitalize waterfront areas, and support the continued operations of zoos, botanical gardens, and aquaria. The State’s investment in these places and institutions creates construction and permanent jobs, attracts private investment, boosts property values, saves municipal infrastructure costs, and generates significant visitor spending. State Parks & Land Stewardship State parks and open space are an economic asset to local communities. Many towns and villages across New York enjoy an economic boost provided by park visitor spending. OPRHP receives EPF money for capital “stewardship” projects and open space land protection. Stewardship projects maintain the New York State Park System as an economic engine through critical maintenance, new construction, and infrastructure improvements. The system encompasses 5,000 buildings, 8,360 campsites, 817 cabins, 53 swimming pools, 76 swimming beaches, 29 golf courses, 27 marinas, 40 boat launch sites, 18 nature centers, more than 1,350 miles of trails, 106 dams, 640 bridges, hundreds of miles of roads, and hundreds of historic structures listed on the State and National Registers of Historic Places.36
The system’s parks and facilities represent a major source of jobs and revenue in New York, however it has a current $1 billion backlog in capital rehabilitation and repair projects.37
Investing in these types of critical projects helps maintain New York’s premier State Park System and creates substantial economic benefits for local governments, businesses, and residents. A recent study of 178 state parks and 35 historic sites operated by OPRHP found that the agency’s direct spending combined with spending by visitors to state parks supports $1.9 billion in output and sales. It also supports 20,000 combined public and private jobs in addition to those provided by OPRHP. These jobs include more than just those near parks at stores and restaurants but also those created by the ripple effects of spending throughout the economy. Jobs generated by the system represent $440 million in employment income. The benefits of the New York State Park System exceed its costs by a ratio of five to one.38 These economic benefits are due in large part to EPF investments in state parks and land stewardship.
Municipal Parks
New York has over 1,040 municipal parks and 250 county parks, as well as many small local recreational areas.39 Local parks provide economic benefits in the form of natural goods and services and increased property values and tax revenues. EPF funding to municipalities for local parks enhances these benefits.
Parks and open space have a positive impact on nearby property values. People are willing to pay a premium to live near these places. Higher property values result in higher property taxes
21
Economic Benefits: Parks, Recreation & Historic Preservation
36 OPRHP, 2011. 37 Wooten, 2011. 38 Heintz et al., 2009. 39 2009 New York Open Space Conservation Plan.

paid to local municipalities. Within Nassau and Suffolk Counties, over $58 million in property tax revenue is derived from properties near parks and protected open space.40
The EPF has provided over $200 million to New York City over the last decade and a half. Much of this money has gone to building parks and trails such as Hudson River Park, the Brooklyn Waterfront Greenway, the Harlem River Greenway, and the Bronx River Greenway.41 The announcement of state funding for the Hudson River Park accelerated the sale of buildings and building lots along the Greenwich Village waterfront. A recent study estimated that the park adds nearly $200 million to property values within two blocks of the Greenwich Village section of the Hudson River Park.42
Central Park is classic example of municipal park benefits. The park attracts more than 25 million visitors each year. Spending outside the park by visitors who came to the park and its attractions and events, directly and indirectly generated more than 1,000 full-time-equivalent jobs and more than $80 million in economic activity throughout New York City. In 2007, Central Park generated about $656 million in New York City tax revenues, nearly equivalent to the total annual cost of the city’s entire park system. These tax revenues were generated by the $17.7 billion that is added to the value of properties near the Park. This “Central Park effect” is equivalent to approximately 8 percent of the total value of all Manhattan real estate.43
Other parks in New York City have similar benefits. An analysis of Prospect Park (Brooklyn), the Highline Park (Manhattan), and Central Park (Manhattan) found that from 2003 to 2011, property values closest to the parks escalated over time at a faster rate in lower priced areas (relative to their neighborhoods bordering the park). It also found that before the construction of the Highline Park in 2003, surrounding residential properties were valued 8 percent lower than the overall median for Manhattan. By 2011 these properties had appreciated beyond borough-wide values.44 Another study found that asking rents for commercial real estate near Bryant Park increased from 115 percent to 225 percent, as compared to increases ranging from 41 percent to 73 percent in the surrounding submarkets.45
Municipalities also bring in direct revenues through parks. Central Park has more than 4,000 days of movie shoots a year. The use of the park as a venue for films, TV, and professional photography generates $135.6 million in economic activity for the city.46 In 2010 concession
Economic Benefits: Parks, Recreation & Historic Preservation
Photo courtesy of The Nature Conservancy
22
40 The Trust for Public Land, 2010. 41 Schwartz, 2010. 42 The Impact of Hudson River Park on Property Values, 2008. 43 Valuing Central Park's Contributions to New York City's Economy, 2009. 44 New York City Economic Development Corporation, 2011. 45 New Yorkers For Parks, 2003. 46 Kreinin-Souccar, 2009.

revenues in New York City parks were $39.8 million.47 Concessions and other businesses operating in Central Park, such as Tavern on the Green and the Central Park Zoo, account for 1,679 full-time jobs and $135.5 million in economic output.48
In addition to these benefits, parks provide places for special events which attract additional visitors. The New York City Marathon culminates in Central Park. In 2008 the race drew almost 150,000 visitors who spent $122 million which had an overall economic impact of over $200 million.49 “The Gates” public art installation which consisted of 7,500 orange gates along 23 miles in Central Park for 14 days drew 620,000 visitors and created a total economic impact of $254 million.50 The largest tennis tournament in the U.S. takes place at facilities in Flushing Meadows Corona Park. The 2011 event attendance was 700,000 with over a third of visitors coming from outside New York State. According to one report, the overall impact of the 2011 tournament was three-quarters of a billion dollars.51 Randall’s Island Park is another park that hosts major sporting events in New York City. A single Rugby tournament at the world-class sports facility was estimated to generate nearly $430,000 in economic activity.52 Randall’s Island Park is one of many municipal parks that have received funding from the EPF.
Parks also provide important natural services in the form of stormwater management and air pollution removal. Tree cover provided by municipal parks has far reaching affects. Canopy cover in the Buffalo-Lackawanna area removes an estimated 400,000 pounds of pollutants each year, at a value of $990,000. The area’s trees decrease runoff by 30 percent and reduce the amount of storm water to be managed by 17.7 million cubic feet during an average storm—a service valued at $35.5 million.53 EPF funding to municipal parks helps communities avoid expensive infrastructure costs to achieve the same results.
Historic Preservation and Urban Cultural Parks
The EPF supports historic preservation projects in communities around the state by funding the acquisition, planning, development, and improvement of historic properties and heritage areas. Historic preservation revitalizes neighborhoods and communities, increases property values, creates jobs, and returns properties to productive uses.54
Economic Benefits: Parks, Recreation & Historic Preservation
23
Photo courtesy of The Trust for Public Land
47 Reddy, 2011. 48 Kreinin-Souccar, 2009. 49 New York City Economic Development Corporation, 2008. 50 New York City Economic Development Corporation, 2005. 51 Kaplan, 2011. 52 Metropolitan New York Rugby Football Union, 2011. 53 American Forests, 2003. 54 New York State Office of Parks, Recreation and Historic Preservation, 2009.

For every $1 million spent rehabilitating a historic building in New York State, $1.9 million is added to the State’s economy. Construction related to preservation creates more jobs than new construction. Every $1 million invested in preservation construction in New York City creates five more construction jobs, and three more permanent jobs than $1 million invested in new construction.55
The New York State Canal System National Heritage Corridor has leveraged $18.9 million in funds to date and awarded $218,000 in grants to communities throughout the Corridor. Visitors to historic and cultural sites in the eastern part of the Erie Canalway National Heritage Corridor generate an estimated $38 million in sales at local businesses, supporting 507 jobs and providing $14 million in wages to local residents.56 Numerous projects in the Corridor were made possible through EPF grants.
New York’s Urban Cultural Park (UCP) program has created significant economic benefits for many communities. Since its UCP designation, Kingston has experienced a major revitalization due to increased tourist activity in the area and the rehabilitation and restoration of historic buildings. Its previously deserted urban areas became more attractive places to live and work because of the new activity.57 People began to move back into the city and the city’s building vacancy rate dropped. The EPF is a significant contributor to the UCP program and enables unique communities like Kingston to thrive.
Waterfront Revitalization
Efforts to revitalize waterfronts across New York are important to the economic health of the state. Stretching over 5,000 miles, New York waterfronts are home to 90 percent of the state’s population and a variety of economic activities.58 The EPF has leveraged significant private investment by providing funds to waterfront projects across the state.
Since 2007, the EPF Local Waterfront Revitalization Program (LWRP) funded 275 projects totaling more than $72 million.59 In one project EPF dollars helped strengthen the Town of Clayton’s historic tourism economy and revitalize its downtown. Clayton renovated its opera house, constructed the Thousand Islands Dock, and began construction of a riverwalk to enhance its status as a historic tourism destination and boating haven.
Economic Benefits: Parks, Recreation & Historic Preservation
24
55 Preservation League of New York State, 2001. 56 Erie Canalway National Heritage Corridor, Economic Impact Report, 2010. 57 Kingston Urban Cultural Park/ Heritage Area. Available at http://www.nps.gov/nr/travel/kingston/urbanpark.htm. 58 New York State Division of Coastal Resources. Available at http://nyswaterfronts.com/aboutus-LWRP.asp.
Photo courtesy of Scenic Hudson

In the City of Oswego, the EPF LWRP provided $1.6 million to create a 1.5 mile walkway along the Oswego River. The esplanade hosts many events and festivals that draw visitors to the city’s downtown. Since it opened, 15 restaurants and four hotels have been developed.60 The revitalization helped the city’s commercial vacancies decline from 72 percent in 1995 to 20 percent in 2005.61 Over 200,000 visitors and residents attend downtown’s Harborfest accounting for $7.5 million in direct spending. Waterfront revitalization efforts also opened up the city to recreational boaters who account for tourism revenues of $42 million for Oswego County.62
Zoos, Botanical Gardens & Aquaria
Institutions serving as living museums not only provide an important educational resource, but also act as economic engines by attracting visitors and providing jobs. There are 80 zoos, botanical gardens, and aquaria that receive EPF support to remain effective environmental education institutions in New York’s urban centers. The Wildlife
Conservation Society’s Bronx Zoo and New York Aquarium alone generate approximately $430 million and 2,600 jobs toward the state economy each year.63 EPF funding helps these institutions continue to provide economic benefits to local economies.
Economic Benefits: Parks, Recreation & Historic Preservation
Photo courtesy of Wildlife Conservation Society
25
Photo courtesy of Scenic Hudson
60 Vazquez, 2010. 61 Pearson. 62 Vazquez, 2010. 63 Wildlife Conservation Society, 2010.
EPF projects leverage funding from other sources including local, private, nonprofit, and federal sources (e.g., the Forest Legacy Program). The ability to attract support from other sources means the state does not have pay the entire cost of a project and therefore maximizes its investment. By leveraging funds EPF is able to sponsor more local projects and create additional economic benefits.
According to Scenic Hudson, the City of Beacon in Dutchess County was able to leverage $5.2 million in county, village, and private funds from a $2.3 million EPF grant for an urban revitalization project. The project cleaned up a former industrial site that will be home to a mixed use development and new public riverfront access that is expected to generate significant visitor spending. The state’s contribution made the project happen while requiring less than a third of the project’s total cost.
Urban projects are not the only types of projects that leverage significant amounts of funding. A farmland preservation project in Ulster County leveraged $1.61 million in county, local, and private funds from a $1.2 million EPF grant. The project preserved 639 acres of prime farmland and allowed local farmers to generate enough capital to sustain their operations. Farmers across the state benefit from funds leveraged by EPF. This helps keeps New York’s agriculture industry healthy and competitive.
Leverage Local and Federal Funds
26
27
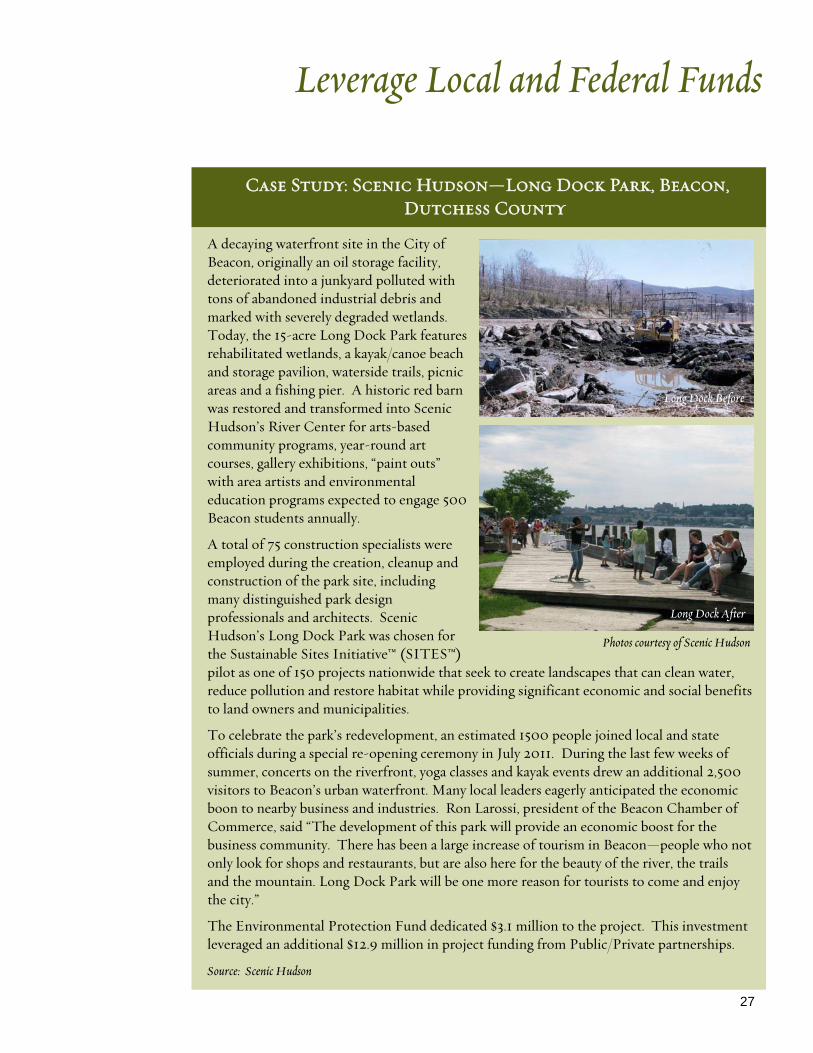
A decaying waterfront site in the City of Beacon, originally an oil storage facility, deteriorated into a junkyard polluted with tons of abandoned industrial debris and marked with severely degraded wetlands. Today, the 15-acre Long Dock Park features rehabilitated wetlands, a kayak/canoe beach and storage pavilion, waterside trails, picnic areas and a fishing pier. A historic red barn was restored and transformed into Scenic Hudson’s River Center for arts-based community programs, year-round art courses, gallery exhibitions, “paint outs” with area artists and environmental education programs expected to engage 500 Beacon students annually.
A total of 75 construction specialists were employed during the creation, cleanup and construction of the park site, including many distinguished park design professionals and architects. Scenic Hudson’s Long Dock Park was chosen for the Sustainable Sites Initiative™ (SITES™) pilot as one of 150 projects nationwide that seek to create landscapes that can clean water, reduce pollution and restore habitat while providing significant economic and social benefits to land owners and municipalities.
To celebrate the park’s redevelopment, an estimated 1500 people joined local and state officials during a special re-opening ceremony in July 2011. During the last few weeks of summer, concerts on the riverfront, yoga classes and kayak events drew an additional 2,500 visitors to Beacon’s urban waterfront. Many local leaders eagerly anticipated the economic boon to nearby business and industries. Ron Larossi, president of the Beacon Chamber of Commerce, said “The development of this park will provide an economic boost for the business community. There has been a large increase of tourism in Beacon—people who not only look for shops and restaurants, but are also here for the beauty of the river, the trails and the mountain. Long Dock Park will be one more reason for tourists to come and enjoy the city.”
The Environmental Protection Fund dedicated $3.1 million to the project. This investment leveraged an additional $12.9 million in project funding from Public/Private partnerships.
Source: Scenic Hudson
Case Study: Scenic Hudson—Long Dock Park, Beacon, Dutchess County
Photos courtesy of Scenic Hudson
Long Dock Before
Long Dock After
Leverage Local and Federal Funds

American Farmland Trust. 2010. Cost of Community Services Studies Fact Sheet.
American Forests. 2003. Urban Ecosystem Analysis Buffalo-Lackawanna Area, Erie County, New York: Calculating the Value of Nature. June 2003.
American Forests and USDA Forest Service. 2003. Urban Ecosystem Analysis Delaware Valley Region: Calculating the Value of Nature. American Forests, Washington, D.C.
Bills, Nelson and Gregory Poe. “Agriculture and the Environment: Trends in New York Land Use and Highlights of the 2008 Farm Bill.” New York Economic Handbook 2009. Ithaca: Cornell University, December 2008.
Chen, Jeffrey C. 2011. Closure, Remediation and Maturation: The Case of Freshkills Landfill. Paper presented at the annual meeting of the European Association of Environmental and Resource Economists, June 29 –July 2, in Tor Vergata, Rome, Italy.
Cuomo, Andrew. 2010. Farm NY Growth through Innovation: The New NY Agenda.
Dimino, Resa and Barbara Warren. 2004. Reaching for Zero: The Citizens Plan for Zero Waste in New York City. Consumer Policy Institute, June 2004.
Environmental Law Institute. 2006. 2005 Status Report on Compensatory Mitigation in the United States.
Erie Canalway National Heritage Corridor, Economic Impact Report – East Region Case Study. Prepared by Camoin Associates. July 2010.
Forest2Market. 2009. The Economic Impact of Privately-Owned Forests. Prepared for the National Alliance of Forest Owners. September 8, 2009.
Heintz, James, Robert Pollin, and Heidi Garrett-Peltier. 2009. The NYS Park System: An Economic Asset to the Empire State. Report Prepared for Parks and Trails New York. March 2009.
Ingraham, Molly and Shonda Gilliland Foster. 2008. The value of ecosystem services provided by the U.S. National Wildlife Refuge System in the contiguous U.S. Ecological Economics. 67:608-618.
Johnston et al. 2001. Estimating Amenity Benefits of Coastal Farmland. Growth and Change. Vol. 32, No. 3, Summer 2001, 305-325.
Kaplan, Daniel. 2011. Sports Business Journal Daily, September 5, 2011, http://www.sportsbusinessdaily.com/Journal/Issues/2011/09/05/Events-and-Attractions/US-Open.aspx (last accessed 11-21-2011).
References
28

Karlin, Rick. 2011. Times Union, January 19, 2011, http://www.timesunion.com/local/article/Loggers-tree-huggers-unite-964662.php (last accessed 9-6-2011).
Kinnaman, Thomas C. 2009. A Landfill Closure and Housing Values. Contemporary Economic Policy. Vol. 27, No. 3, July 2009, 380–389.
Kreinin-Souccar, Miriam. 2009. Crain’s New York Business.com, May 31, 2009, http://www.crainsnewyork.com/article/20090531/SUB/305319976 (last accessed 1-3-2012).
Metropolitan New York Rugby Football Union. 2011. The Impact of Rugby on the New York Metropolitan Region: An Economic Report.
National Park Service. Kingston Urban Cultural Park/Heritage Area. http://www.nps.gov/nr/travel/kingston/urbanpark.htm (accessed August 25, 2011).
National Research Council, 2008. Hydrologic Effects of a Changing Forest Landscape. National Academy of the Sciences: Washington D.C.
New Jersey Department of Environmental Protection. 2004. The Economic Value of New Jersey State Parks and Forests.
New York City Economic Development Corporation. 2005. The Gates, Central Park, New York, 2005.
New York City Economic Development Corporation. 2008. New York City Marathon.
New York City Economic Development Corporation. 2011. Economic Snapshot. August.
New York City Independent Budget Office. 2007. “More Recycling Needed to Help Lower City’s Trash Costs.” Inside the Budget. No. 150, May 1, 2007.
New York State Department of Environmental Conservation. 2010. Beyond Waste: A Sustainable Materials Management Strategy for New York.
New York State Department of Environmental Conservation. Open Space Funding from the Environmental Protection Fund. http://www.dec.ny.gov/lands/5071.html (accessed August 9, 2011).
New York State Department of Environmental Conservation. State Assistance Programs for Waste Reduction, Recycling and Household Hazardous Waste Programs. http://www.dec.ny.gov/pubs/4776.html (accessed September 12, 2011).
New York State Office of Parks, Recreation & Historic Preservation. 2010. An Analysis of the 2008 Trail User Surveys. September 2010.
New York State Office of Parks, Recreation and Historic Preservation. 2009. Historic Preservation at a Crossroads: New York State Historic Preservation Plan 2009-2013.
References
29

New York State Office of the State Comptroller. 2010. Bet on the Farm: Farmland Protection as a Strategy for Economic Growth and Renewal. October 2010.
New York State Office of the State Comptroller. 2010. Economic Benefits of Open Space Preservation. March 2010.
New York State Office of the State Comptroller, 2010. Effective Management of the Environmental Protection Fund. June 2010.
New York State Office of the State Comptroller. 2010. The Role of Agriculture in the New York State Economy. February 2010
New York State Department of Agriculture & Markets. 2009. New York Farmland Protection Study.
New York State Department of State, Division of Coastal Resources. Local Waterfront Revitalization Program (LWRP). http://nyswaterfronts.com/aboutus-LWRP.asp. (accessed August 30, 2011).
New Yorkers for Parks. 2003. Park Expenditures Secondary Impact Analysis. Prepared by Ernst & Young.
North East State Foresters Association. 2007. The Economic Importance and Wood Flows from New York’s Forests.
Northeast Recycling Council. 2009. Recycling Economic Information Study Update: Delaware, Maine, Massachusetts, New York, and Pennsylvania. Prepared by DSM Environmental Services, Inc. February 2009.
Opaluehet et al. 1999. Recreational and Resource Economic Values for the Peconic Estuary System. Prepared for Peconic Estuary Program, Suffolk County Department of Health Services. February 1999.
OPRHP. 2011. Testimony Before the Joint Fiscal Committees of the State Legislature on the FY 2011-12 Executive Budget. February 8, 2011.
Outdoor Industry Foundation. 2006. The Active Outdoor Recreation Economy: A $730 Billion Contribution to the US Economy. Fall 2006.
Pearson, Rebecca. Oswego, New York: A Community Smart Growth Case Study. Prepared for Great Lakes Commission and NOAA Coastal Services Center.
Preservation League of New York State. 2001. New York Profiting Through Preservation.
Reddy, Sumathi, 2011. The Wall Street Journal, Metropolis, December 5, 2011. Audit: Parks Miss Millions in Concession Fees.
Rochester’s Cornerstone Group Wetland Mitigation Bank. 2011. Personal email communication.
References
30

Rosenberger, R. and Loomis J. 2003. Benefit Transfer. In P. Champ, K. Boyle, and T. Brown (Eds.), A Primer on Nonmarket Valuation. (445-482). Norwell, Massachusetts: Kluwer Academic Publishers.
Sala, O.E. and f. M. Paruelo. 1997. “Ecosystem services in grassland.” Pp. 237-252 in Nature’'s services: Societal dependence on natural ecosystems, edited by G. C. Daily. Washington, D.C.: Island Press.
Schmitt, T.M and Bills, N.L. 2007. Agribusiness Contributions and Inter-Industry Linkages in the New York State Economy. Cornell University.
Schwartz, Anne. 2010. Pitting Parks Against Open Space. Gotham Gazette. http://www.gothamgazette.com/article/parks/20100616/14/3293 (June 2010).
Wooten, Michael. WGRZ, August 3, 2011, http://niagarafalls.wgrz.com/news/news/nys-parks-need-1-billion-repairs/57810 (last accessed 10-3-2011).
Study of the Economic Impact on the Local Economy of Minnewaska State Park Preserve, Mohonk Preserve and Sam’s Point Preserve. May 2010.
The Impact of Hudson River Park on Property Values. 2008. Prepared for Friends of Hudson River Park.
The Trust for Public Land. 2010. The Economic Benefits and Fiscal Impact of Parks and Open Space in Nassau and Suffolk Counties, New York.
U.S. Department of Agriculture Forest Service. 2009. Forest Inventory and Analysis Program.
U.S. Department of the Interior, Fish and Wildlife Service, and U.S. Department of Commerce, U.S. Census Bureau. 2006 National Survey of Fishing, Hunting, and Wildlife-Associated Recreation.
Valuing Central Park’s Contributions to New York City’s Economy. 2009. Prepared for the Central Park Conservancy. Prepared by Appleseed Inc. May 2009.
Vazquez, Lorraine, September 23, 2010. Promoting Tourism Through Local Waterfront Revitalization Programs. http://nysac.org/news/nysac-news/promoting-tourism-through-local-waterfront-revitalization-programs/ (accessed September 2, 2011).
Wildlife Conservation Society, February 9, 2010. Save Jobs for NY: Speak Out for Zoos, Gardens & Aquariums. http://www.wcs.org/news-and-features-main/save-jobs-for-ny-zbga.aspx (accessed September 7, 2011).
References
31

The Trust for Public Land (TPL) conducted an analysis of the return on New York’s investment in land conservation through the Environmental Protection Fund (EPF). TPL analyzed the past (i.e., 1998 to 2008) and likely future (i.e., over the next ten years) economic returns generated from EPF spending on land acquisitions and conservation easements. The analysis found that every $1 invested returns $7 in economic value over this time period from natural resource
Investment in Conservation Lands From 1998 to 2008 the EPF protected 358,000 acres, including both land protected through conservation easements and acquisitions. An annual average of $48.1 million in EPF funding was spent to protect these lands. Exhibit A-1 shows spending and acres protected for each year. Data were not available for 2009 and 2010.
Appendix: Return On Investment
Exhibit A-1. Annual EPF Spending on
Year Spending Acres
1998 $55,500,000 24,000
1999 $25,500,000 27,900
2000 $69,000,000 12,800
2001 $22,100,000 6,420
2002 $21,600,000 13,200
2003 $27,000,000 11,100
2004 $43,700,000 12,400
2005 $53,400,000 19,900
2006 $59,500,000 28,100
2007 $67,400,000 77,100
2008 $83,900,000 125,000
Total $529,000,000 358,000
Average Annual EPF spending (1998-2008): $48,100,000
Average Annual Acres Conserved (1998-2008): 32,600
Source: NYS Department of Environmental Conservation, NYS Office of Parks, Recreation and Historic Preservation
32
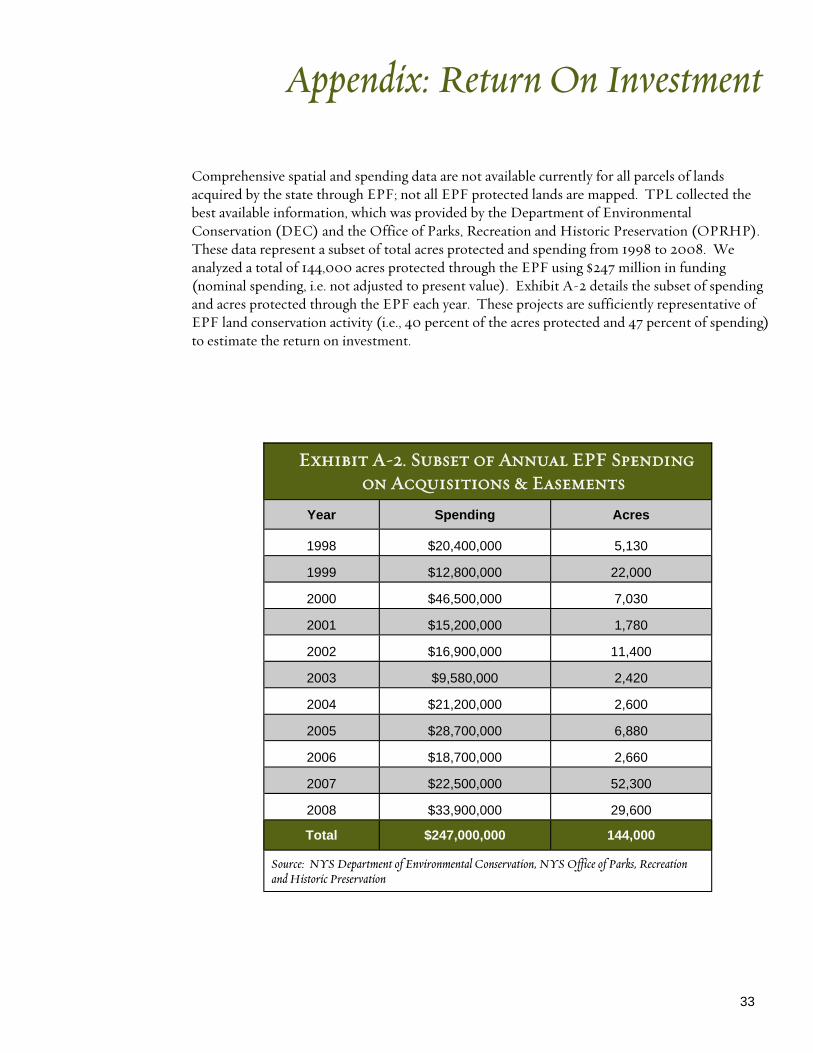
Comprehensive spatial and spending data are not available currently for all parcels of lands acquired by the state through EPF; not all EPF protected lands are mapped. TPL collected the best available information, which was provided by the Department of Environmental Conservation (DEC) and the Office of Parks, Recreation and Historic Preservation (OPRHP). These data represent a subset of total acres protected and spending from 1998 to 2008. We analyzed a total of 144,000 acres protected through the EPF using $247 million in funding (nominal spending, i.e. not adjusted to present value). Exhibit A-2 details the subset of spending and acres protected through the EPF each year. These projects are sufficiently representative of EPF land conservation activity (i.e., 40 percent of the acres protected and 47 percent of spending) to estimate the return on investment.
Appendix: Return On Investment
33
Exhibit A-2. Subset of Annual EPF Spending on Acquisitions & Easements
Year Spending Acres
1998 $20,400,000 5,130
1999 $12,800,000 22,000
2000 $46,500,000 7,030
2001 $15,200,000 1,780
2002 $16,900,000 11,400
2003 $9,580,000 2,420
2004 $21,200,000 2,600
2005 $28,700,000 6,880
2006 $18,700,000 2,660
2007 $22,500,000 52,300
2008 $33,900,000 29,600
Total $247,000,000 144,000
Source: NYS Department of Environmental Conservation, NYS Office of Parks, Recreation and Historic Preservation

Natural Goods and Services
Lands protected through EPF provide a host of natural goods and services, such as water quality protection by wetlands and air pollution removal by forests. We examined the natural goods and services provided by 13 distinct ecosystem types found within these areas. As shown in Exhibit A-3, the most commonly acquired land cover type was deciduous forest at 66 percent.
Exhibit A-3. Acreage Acquired by Land Cover Type
Land Cover Acres Percentage
Deciduous Forest 94,200 66%
Evergreen Forest 17,400 12%
Woody Wetland 10,200 7%
Mixed Forest 8,370 6%
Shrub/ Scrub 3,530 2%
Open Water 3,460 2%
Pasture/ Hay 1,770 1%
Grassland/ Herbaceous 1,740 1%
Developed, Open Space (Parks) 1,080 1%
Emergent Herbaceous Wetland 974 1%
Cultivated Crops 969 1%
Developed 113 0%
Barren Land (e.g., rock outcrops) 19 0%
Total 144,000 100%
Appendix: Return On Investment
34

The natural goods and services provided, and their monetary values, were determined using the benefits transfer methodology. The benefits transfer method is used to estimate economic values for natural goods and services. That is, we use existing data on the economic value of natural goods and services provided by New York’s natural systems. Benefits transfer methodology is a common approach in environmental economics because it is a practical alternative to time-intensive and data-intensive original research.
We followed the steps below in conducting the benefits transfer:64
• Step 1. Define the policy context. This definition should include various characteristics of the policy site, what information is needed, and in what units.
• Step 2. Locate and gather original research outcomes. Conduct a thorough literature review, and obtain copies of potentially relevant studies.
• Step 3. Screen the original research studies for relevance. How well does the original research context correspond to the policy context? What is the quality of the original research?
• Step 4. Select a point estimate or average of a range of point estimates. Convert each to dollars per acre.
• Step 5. Transfer the point estimate or average value estimate. Aggregate the point estimate or average value estimate by multiplying it by the total number of acres, providing a total value for the good or service at the policy site.
Based on existing research we determined the natural goods and services provided and their estimated their values for each land cover types (Exhibit A-3). The following list qualitatively describes some of those goods and services:
• Wetlands hold floodwaters, improve water quality, and support biodiverse habitats.
o A one-acre wetland can typically store about three-acre feet of water, or one million gallons. Trees and other wetland vegetation help slow the speed of flood waters. Water storage and the work of wetland vegetation can lower flood heights and reduce the potentially destructive power of floodwaters.
o Wetlands act as a natural filtration system to improve water quality by absorbing excess nutrients from fertilizers, manure, and sewage. Their role as natural purifiers reduces water treatment and infrastructure costs.
o Wetland habitats support rich food chains and are home to species on a microscopic and macroscopic level—from tiny invertebrates to mammals and fish.
Appendix: Return On Investment
35
64 Rosenberger, R. and Loomis J,, 2003. Benefit Transfer. In P. Champ, K. Boyle, and T. Brown (Eds.), A Primer on Nonmarket Valuation. (445-482). Norwell, Massachusetts: Kluwer Academic Publishers.

• Forests protect water and air quality.
o Forests help purify water by stabilizing soils and filtering contaminants, and regulate the quantity of available water and seasonal flow by capturing and storing water. In fact, forests process nearly two-thirds of the country’s fresh water supply and provide water to about 180 million people across the U.S.65
o The soil stability of forests also reduces erosion and stormwater runoff, defraying the costs of erosion-related damage such as repairing damaged roads and structures and treating contaminated water.
o Forests help to generate cooler temperatures and improved air quality. Trees evaporate water and provide direct shading of buildings and pavement, thereby lowering ambient temperatures in cities as well as reducing ozone production and other smog-related conditions. Trees store and sequester air particulates and atmospheric carbon, reducing the amount of carbon a community produces and contributing to breathable air.
• Grasslands and shrub lands protect water quality and provide pollination services.
o Grasslands and shrub lands capture water minimizing particulate flow to surface water, and filter potential pollutants.
o Grasslands and shrub lands provide habitat for native pollinators.
• Agricultural lands can help to improve water and soil quality.
o Conservation tillage reduces the runoff of soil particles attached to nitrate, phosphorus and herbicides, contributing to improved water quality. Tillage practices can also protect the soil surface from the impact of rain and slow water movement.
o Recent overall declines in soil erosion and improvements in soil quality in the U.S. are partially attributable to increased soil conservation practices such as crop residue management, land retirement, and conservation tillage.
• Open Water
o Water bodies provide flood control and clean drinking water by storing runoff from stormwater, retaining sediment, and recharging groundwater.
o Open water resources provide recreation opportunities and support livelihoods through irrigation for agriculture and drinking water for livestock
Appendix: Return On Investment
65 National Research Council, 2008. Hydrologic Effects of a Changing Forest Landscape. National Academy of the Sciences: Washington D.C.
36

o Water bodies assimilate plant nutrients and are rich in plant varieties that support many plant and animal species including migratory birds.
Based upon the per-acre values (see exhibit A-4), 144,000 acres of conserved land provide $2.54 billion (present value, i.e., the value of past investments in today’s dollars) in total economic value from date of purchase (i.e., beginning in 1998) to 2020 in the form of natural goods and services.
Return on Investment
TPL estimated the return on the present value of $365 million (present value) invested in 144,000 acres of land conservation through the EPF from 1998 to 2008 by comparing this investment to the $2.54 billion in economic value of natural goods and services generated by these lands in the past (i.e. 1998 to 2010) and into the future (i.e., through 2020).
Every $1 invested returns $7 in economic value. These goods and services will continue to be provided well beyond 2020 increasing the total return on investment beyond that calculated in this analysis.
Appendix: Return On Investment
37

Exh
ibit
A-4
. Est
imat
ed A
nn
ual
Per
Acr
e V
alu
e o
f N
atu
ral
Go
od
s an
d S
ervi
ces
by
Lan
d C
ove
r Ty
pe
Land
Cov
er T
ype
Ecos
yste
m S
ervi
ce(s
) A
nnua
l Va
lue
Per
Acr
e*
Sour
ce
Dec
iduo
us F
ores
t W
ater
qua
lity
prot
ectio
n; a
ir po
llutio
n re
mov
al a
nd c
arbo
n se
ques
tratio
n;
stor
mw
ater
sto
rage
; ero
sion
con
trol
$882
N
ew J
erse
y D
epar
tmen
t of E
nviro
nmen
tal P
rote
ctio
n, 2
004
Am
eric
an F
ores
ts a
nd U
SD
A F
ores
t Ser
vice
, 200
3
Eve
rgre
en F
ores
t W
ater
qua
lity
prot
ectio
n; a
ir po
llutio
n re
mov
al a
nd c
arbo
n se
ques
tratio
n;
stor
mw
ater
sto
rage
; ero
sion
con
trol
$882
N
ew J
erse
y D
epar
tmen
t of E
nviro
nmen
tal P
rote
ctio
n, 2
004
Am
eric
an F
ores
ts a
nd U
SD
A F
ores
t Ser
vice
, 200
3
Woo
dy W
etla
nd
Wat
er q
ualit
y pr
otec
tion;
floo
d co
ntro
l; w
ildlif
e ha
bita
t $4
,120
John
ston
et a
l., 2
001
Opa
lueh
et e
t al.,
199
9 E
nviro
nmen
tal L
aw In
stitu
te, 2
006
Roc
hest
er's
Cor
ners
tone
Gro
up W
etla
nd M
itiga
tion
Ban
k,
2011
Mix
ed F
ores
t W
ater
qua
lity
prot
ectio
n; a
ir po
llutio
n re
mov
al a
nd c
arbo
n se
ques
tratio
n;
stor
mw
ater
sto
rage
; ero
sion
con
trol
$882
N
ew J
erse
y D
epar
tmen
t of E
nviro
nmen
tal P
rote
ctio
n, 2
004
Am
eric
an F
ores
ts a
nd U
SD
A F
ores
t Ser
vice
, 200
3
Shr
ub/ S
crub
W
ater
qua
lity
prot
ectio
n; a
ir po
llutio
n re
mov
al a
nd c
arbo
n se
ques
tratio
n;
stor
mw
ater
sto
rage
; ero
sion
con
trol
$882
N
ew J
erse
y D
epar
tmen
t of E
nviro
nmen
tal P
rote
ctio
n, 2
004
Am
eric
an F
ores
ts a
nd U
SD
A F
ores
t Ser
vice
, 200
3
Ope
n W
ater
Fr
esh
wat
er re
gula
tion
and
supp
ly;
habi
tat p
rovi
sion
$2
20
Ingr
aham
& F
oste
r, 20
08
Past
ure/
Hay
Fo
od P
rodu
ctio
n $2
2 U
SD
A, N
AS
S, 2
011
New
Yor
k S
tate
Sur
vey.
Gra
ssla
nd/ H
erba
ceou
s C
arbo
n se
ques
tratio
n $4
S
ala
& P
arue
lo, 1
997
Dev
elop
ed, O
pen
Spa
ce
(Par
ks)
Sto
rmw
ater
rete
ntio
n; a
ir po
llutio
n re
mov
al
$317
Tr
ust f
or P
ublic
Lan
d, 2
010.
Em
erge
nt H
erba
ceou
s W
etla
nd
Wat
er q
ualit
y pr
otec
tion;
floo
d co
ntro
l; w
ildlif
e ha
bita
t $4
,120
John
ston
et a
l., 2
001
Opa
lueh
et e
t al.,
199
9 E
nviro
nmen
tal L
aw In
stitu
te, 2
006
Roc
hest
er's
Cor
ners
tone
Gro
up W
etla
nd M
itiga
tion
Ban
k,
2011
C
ultiv
ated
Cro
ps
Food
Pro
duct
ion
$46
US
DA
, NA
SS
, 201
1 N
ew Y
ork
Sta
te S
urve
y.
Dev
elop
ed
Non
e N
/A
Bar
ren
Land
N
one
N/A
*All
Valu
es in
201
0 do
llars
Appendix: Return On Investment
38


Contact:
Tom Gilbert The Trust for Public Land
Conservation Services 666 Broadway, Ninth Floor
New York, NY 10012 215-343-1110