the economic benefits of fisheries, wildlife and boating resources
TRANSCRIPT

The Economic Benefits of Fisheries, Wildlife and Boating Resources
in the State of Louisiana – 2006
Prepared by Southwick Associates, Inc.
(904) 277-9765
for the Louisiana Department of Wildlife and Fisheries
May 10, 2008

ii
ACKNOWLEDGEMENTS This report was prepared on behalf of the Louisiana Department of Wildlife and Fisheries (LDWF) by Southwick Associates, Inc. This report was authored by Rob Southwick, Dr. Patricia Foster-Turley and Tom Allen. Sara De Lange provided research assistance. Valuable guidance and data assistance were provided by Herb Holloway and David Lavergne of the LDWF. Herb Holloway also provided detailed reviews of preliminary drafts. The authors remain responsible for all contents herein.

iii
TABLE OF CONTENTS
PAGE
ACKNOWLEDGEMENTS
ii
LIST OF TABLES
v
EXECUTIVE SUMMARY
ix
INTRODUCTION
1
ECONOMIC CONCEPTS AND DEFINITIONS
2
METHODS
4
RESULTS
13
CONCLUSIONS
16
LITERATURE CITED
17
APPENDICES
19
Appendix A: Quick Facts About Louisiana’s Fisheries and Wildlife-Related Commerce
19
Appendix B: Demographic Data and Participation Estimates for Hunting, Recreational Fishing, and Non-Consumptive Wildlife-Related Recreation
23
Appendix C: Detailed Annual Expenditure Estimates for Hunting, Recreational Fishing, Non-Consumptive Wildlife-Related Recreation and Boating
31
Appendix D: Tax Revenue Details
39
Appendix E: 2006 Louisiana Commercial Fisheries Landings
49

iv
Page intentionally left blank

v
LIST OF TABLES
TABLE PAGE
Table 1 Pro-rated Number of Boats Registered in Louisiana by Length and Propulsion, 2006…………………………………………………………….
6
Table 2 Total Trip Expenditures by Recreational Boaters in Louisiana, 2006……… 7
Table 3 Total Annual Craft Expenditures by Recreational Boaters in Louisiana, 2006…………………………………………………………………………
7
Table 4 Total Trip and Craft Spending by Recreational Boaters in Louisiana, 2006. 8
Table 5 Commercial Fisheries Landings in Louisiana, 2006……………………….. 9
Table 6 Economic Impacts of Recreational Hunting in Louisiana, 2006…………… 13
Table 7a Economic Impacts of Freshwater Recreational Fishing in Louisiana, 2006... 14
Table 7b Economic Impacts of Saltwater Recreational Fishing in Louisiana, 2006…. 14
Table 7c Economic Impacts of All Recreational Fishing in Louisiana, 2006………... 14
Table 8 Economic Impacts of Non-Consumptive Fish and Wildlife-Associated Recreation in Louisiana, 2006……………………………………………….
15
Table 9 Economic Impacts of Recreational Boating in Louisiana, 2006……………. 15
Table 10 Economic Impacts of Commercial Fisheries in Louisiana, 2006…………… 15
Table 11 Economic Impacts of Alligator Harvests in Louisiana, 2006………………. 15
Table 12 Economic Impacts of Reptile and Amphibian Collection in Louisiana, 2006 16
Table 13 Economic Impacts of Fur Harvests in Louisiana, 2006……………………. 16
Table 14 Total Economic Impacts from Activities Associated with Louisiana’s Fisheries, Wildlife and Boating Resources, 2006………………………….
16
Appendix Table B-1
Demographic Data for Louisiana Hunters, 2006……………………………
24

vi
TABLE PAGE
Appendix Table B-2
Demographic Data for Louisiana Anglers, 2006……………………………
25
Appendix Table B-3
Demographic Data for Louisiana Wildlife Watchers, 2006…………………
26
Appendix Table B-4
Participation Estimates for Louisiana Hunters, 2006………………………..
27
Appendix Table B-5
Participation Estimates for Louisiana Anglers, 2006………………………..
28
Appendix Table B-6
Participation Data for Louisiana Wildlife Viewers, 2006…………………...
29
Appendix Table C-1
Average Daily and Annual Expenditures by Hunters in Louisiana, 2006……………………………………………………………...
32
Appendix Table C-2
Average Daily and Annual Expenditures by Anglers in Louisiana, 2006……………………………………………………………...
32
Appendix Table C-3
Average Daily and Annual Expenditures by Wildlife Watchers in Louisiana, 2006……………………………………………………………..
33
Appendix Table C-4
Expenditures for Specific Items by Louisiana Hunters, 2006……………….
34
Appendix Table C-5
Expenditures for Specific Items by Louisiana Freshwater Anglers, 2006…..
35
Appendix Table C-6
Expenditures for Specific Items by Louisiana Saltwater Anglers, 2006 ……
36
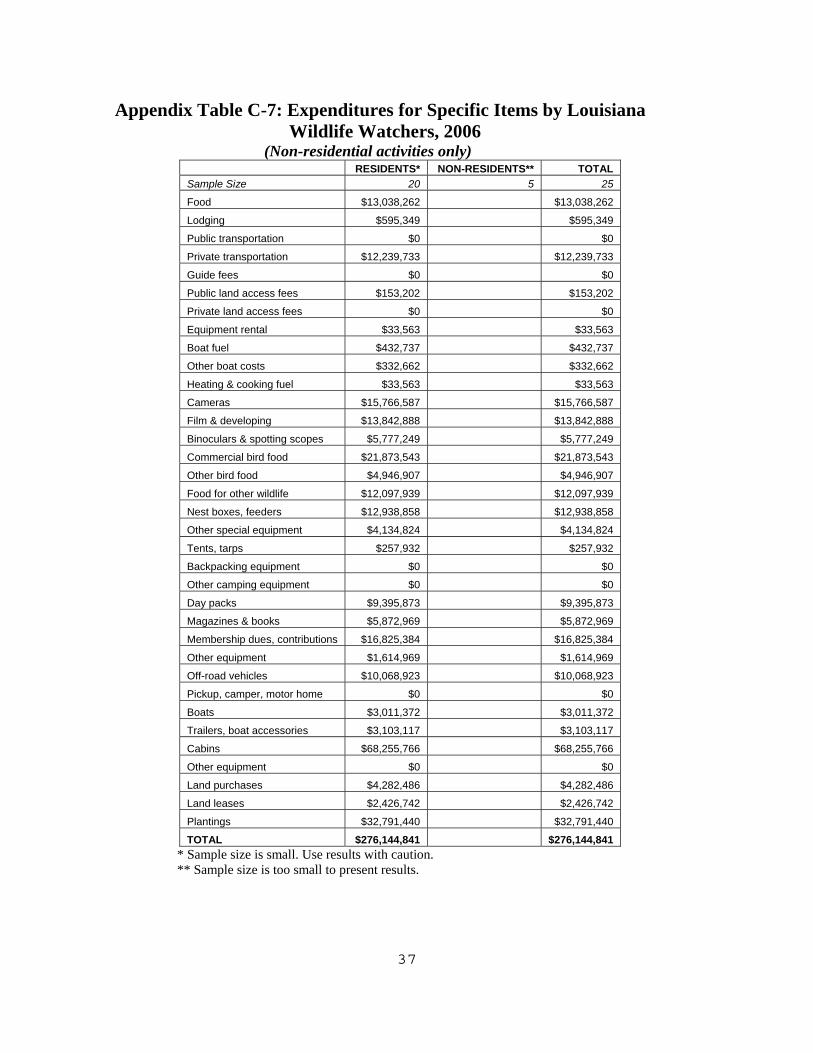
Appendix Table C-7
Expenditures for Specific Items by Louisiana Wildlife Watchers, 2006……
37
Appendix Table C-8
Estimated Expenditures and Participation Estimates for Recreational Boating in Louisiana, 2006………………………………………………….
38
Appendix Table D-1
Freshwater Fishing Tax Impacts from Expenditures by Louisiana Residents in 2006 ($)…………………………………………………………………...
40
Appendix Table D-2
Freshwater Fishing Tax Impacts from Expenditures by Non-Residents in 2006 ($)……………………………………………………………………...
41
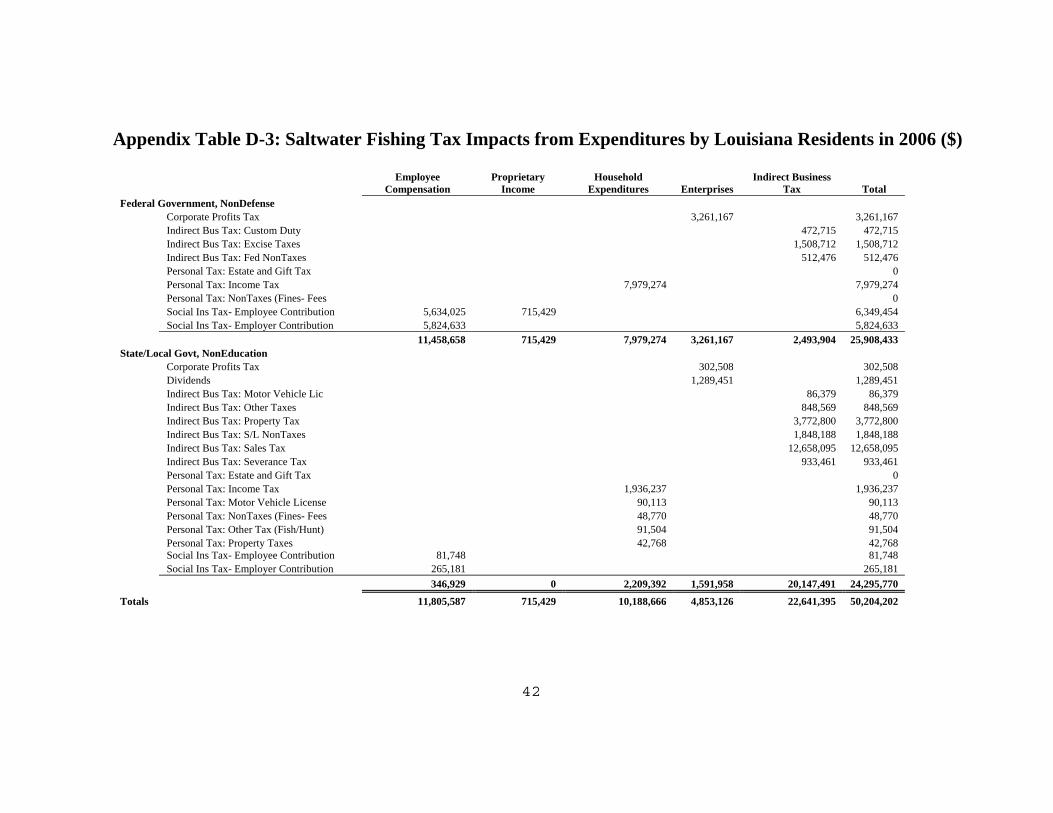
Appendix Table D-3
Saltwater Fishing Tax Impacts from Expenditures by Louisiana Residents in 2006 ($)…………………………………………………………………..
42
Appendix Table D-4
Saltwater Fishing Tax Impacts from Expenditures by Non-Residents in 2006 ($) ……………………………………………………………………..
43

vii
TABLE PAGE
Appendix Table D-5
Hunting Tax Impacts from Expenditures by Louisiana Residents in 2006 ($)……………………………………………………………………………
44
Appendix Table D-6
Hunting Tax Impacts from Expenditures by Non-Residents in 2006 ($)…...
45
Appendix Table D-7
Wildlife Watching Tax Impacts from Expenditures by Louisiana Residents in 2006 ($)…………………………………………………………………...
46
Appendix Table D-8
Wildlife Watching Tax Impacts from Expenditures by Non-Residents in 2006 ($)….......................................................................................................
47

viii
Page intentionally left blank

ix
EXECUTIVE SUMMARY The fish, wildlife and boating resources of Louisiana generate substantial benefits. Hundreds of thousands of people depend on these resources for recreation, employment and as a source of food for their families. These valuable resources, actively managed by the Louisiana Department of Wildlife and Fisheries, not only contribute to the standard of living and economic health of state residents, but also to the common good through state tax revenues. The major activities based on Louisiana’s fish, wildlife and boating resources and their estimated economic contributions in 2006 were:
Retail Sales
Total Economic
Effect
Jobs
Supported
State and Local Tax Revenues
Hunting: $594 million $975 million 13,084 $62.2 million
Recreational Fishing: $1.06 billion $1.71 billion 18,122 $114.1 million
Wildlife Viewing, Photography, and Feeding: 312.4 million $517.1 million
6,199 $32.3 million Recreational Boating: $981.6 million $1.33 billion
14,959 $80.8 million
Commercial Fisheries: $1.8 billion1 $2.4 billion 26,915 $170.5 million
Alligator:
$59.7 million2 $109.2 million 748 $5.7 million
Reptile and Amphibian Collection: $0.72 million2 $0.96 million
11 $67,900
Fur Harvests:
$2.0 million2 $2.8 million
24 $128,000
Net out Duplicate Boat Purchase Expenditures:3 ($200 million) ($293 million)
(3,362) ($19.4 million)
Total $4.61 billion $6.75 billion 76,700 $446.2 million 1 Retail sales for Commercial Fishing include dockside sales of $270.7 million and value
added at the processing, wholesale, retail, and restaurant levels. 2 These values represent the sales proceeds received by the harvesters. Most processing,
distribution, and retailing occur outside of Louisiana. 3 This adjustment removes $200,110,669 of retail sales and adjusts the corresponding
economic impacts to account for double-counting of boat purchases within the boating, recreational fishing, hunting, and wildlife-viewing results.

x
The RESULTS section of this report provides full details on the economic contributions of Louisiana’s fish, wildlife and boating resources to the state economy. Appendix A provides quick facts comparing Louisiana’s fish and wildlife resources to well-known activities and economic institutions. Please note that comparing economic impacts from this report to similar data in previous versions will result in false trends. This report used a different economic model to calculate economic impacts. The most noticeable differences are the tax revenue estimates, with the new model capturing a greater portion of revenues generated from the many rounds of economic activity and the inclusion of local tax revenues. To derive trends, please compare retail sales estimates, as these sources have not changed significantly.

1
INTRODUCTION
This report estimates the 2006 economic contributions of fish and wildlife related commerce and recreation managed by the Louisiana Department of Wildlife and Fisheries. Included in this report are specific economic estimates for the following activities:
Hunting, including species-specific impacts Recreational fishing (freshwater and saltwater) Non-consumptive fish and wildlife recreation (bird watching,
photography, etc.) Recreational boating Commercial fishing, with breakouts for major fisheries Alligator harvests Reptile and amphibian collection, and Fur harvesting
For each of the above activities, estimates are provided for the total revenues or retail sales generated in 2006 and the resulting jobs, income, sales and income tax revenues and total economic (multiplied) effects that are supported by each activity within the Louisiana economy. Some of the economic impacts reported here were obtained from existing reports and updated to 2006. When existing data were not available, the economic impacts were estimated using best available data sources and economic models. The specific methods used are described in the following sections.

2
ECONOMIC CONCEPTS AND DEFINITIONS The economic benefits of outdoor recreation and resource harvests can be estimated by two types of economic measures: economic impacts and economic values. An economic impact addresses the business and financial effects resulting from some activity. Economic value measures the intrinsic value received by the user through participation in the outdoor activity. Technically, economic value measures the difference between what an individual would be willing to pay and what they actually pay for a commodity or activity. The difference is known as “consumer surplus”. Only economic impacts are addressed in this report. There are three types of economic impacts: direct, indirect and induced. A direct impact is created by the initial purchase made by the consumer. For example, when a person buys a shotgun for $395 there is a direct impact to the retailer of $395. Indirect impacts are secondary effects generated from a direct impact. For example, the retailer must purchase a replacement shotgun; a freight company must be paid to deliver the replacement shotgun; the gun manufacturer must purchase additional metals, wood, etc. for production; metal producers must buy inputs, and so on. Therefore, the original expenditure of $395 benefits a host of other related industries. Induced impacts result from the wages and salaries paid by the directly and indirectly impacted industries. The employees of these industries spend their income on various goods and services. These expenditures in turn create a cycle of additional impacts. The sum of the direct, indirect and induced impacts equals the total economic impact. As the original retail transaction goes through round after round of indirect and induced effects, the economic impact of the original purchase is multiplied, benefiting many industries and individuals. Likewise, the reverse is true. If a particular item or industry is removed from the economy, the economic loss is greater than the original lost retail sale. Once the original retail purchase is made, each successive round of spending is smaller than the previous round. When the economic benefits are no longer measurable, the economic impact ends. Definitions: Retail Sales: For hunting, recreational fishing, boating and non-consumptive
recreation, retail sales equals the dollars spent by the participants for related expenses including meals, lodging, travel and equipment.
For commercial activities (commercial fishing, alligator harvests, fur, etc.), the harvester’s revenues (gross revenues), or sales proceeds, are the initial source of dollars. For commercial fishing, this is the “dockside” or “ex-vessel” value.

3
Total Economic Effect: The total cumulative effect in the economy created by successive
rounds of retailer, manufacturer and others' expenditures. These successive rounds of spending generate additional economic benefits with each round. The benefits become smaller and smaller until they can no longer be measured.
Jobs: The total number of jobs supported by the many rounds of spending
described above. In this report, this figure represents the actual number of jobs, or people employed to some level, and not “full time equivalents.”
Income or Earnings: The total wages and salaries paid to employees by all of the industries
enhanced by the total rounds of spending, plus the profits and dividends earned by business owners. Income is sometimes referred to as earnings.
Tax Revenues: The total sales and income tax revenues paid to state and local
governments within Louisiana as a result of the retail sales, wages and salaries described above.
Non-Consumptive Recreation: The viewing of birds, wildlife and fish, including watching,
photography and feeding activities, both around the home (“residential”) and away from home (“non-residential”).

4
METHODS
The methodology discussion is divided into several sections. First, the methodologies used to estimate the economic contributions of recreational fishing, hunting and non-consumptive recreation are presented. The economic estimates for these three activities were generated using the same data source and analytical procedures. Next, the methodologies used to estimate the contributions from other fish and wildlife-related activities are presented. The results are included in the following chapter. Recreational Fishing, Hunting and Non-Consumptive Fish and Wildlife Recreation: The expenditure data used to estimate the economic impacts from recreational fishing, hunting, and non-consumptive recreation were obtained from the U.S. Fish and Wildlife Service’s 2006 National Survey of Fishing, Hunting and Wildlife-Associated Recreation (National Survey). The National Survey is conducted approximately every five years by the U.S. Fish and Wildlife Service and the U.S. Bureau of the Census. It provides data needed by natural resource management agencies, industry and private organizations at the local, state, and national levels to assist in optimally managing natural resources. The 2006 National Survey was funded through excise taxes on hunting and fishing equipment through the Federal Aid in Sport Fish and Wildlife Restoration Acts. The economic impacts from Louisiana recreational fishing were obtained from Sportfishing in America: An Economic Engine and Conservation Powerhouse released by the American Sportfishing Association in 2007. The hunting impacts were obtained from Hunting in America: An Economic Engine and Conservation Powerhouse released by the Association of Fish and Wildlife Agencies in 2007. Both of these reports were developed by Southwick Associates, Inc. using the 2006 National Survey and the methods described below for non-consumptive recreation. Additional analyses were made to generated impact estimates for specific species and for residents and non-residents. Impact estimates specific to marine recreational fishing are available from NOAA Fisheries, but they are older, do not provide comparable impacts for freshwater fishing or hunting, and could not be used for reasonable comparisons to freshwater fishing. Therefore, the NOAA marine recreational data were not used in developing this report. The economic contributions of non-consumptive fish and wildlife recreation (wildlife watching, photography and feeding) were produced as part of this report. Based on the detailed data and economic modeling information available, accurate impact estimates were possible. The method used is separated into two primary stages: 1) Tabulate the expenditures made by recreationists (16 years old and older) from the
2006 National Survey of Fishing, Hunting, and Wildlife-Associated Recreation, and

5
2) Quantify the indirect and induced effects of the consumer spending using the IMPLAN® economic modeling system to estimate jobs, income, tax revenues and total economic impacts.
1. Tabulating Expenditures Wildlife watchers’ expenditures were obtained from the National Survey and separated into resident and non-resident files. Both included information on travel-related categories such as food and lodging, and expenditures for equipment such as guidebooks and binoculars. Together, the resident and non-resident files represent all expenditures made in-state in 2006. Appendices B and C present detailed participation and expenditure estimates. 2. Applying the Economic Model To estimate the economic impacts, the data were analyzed with the IMPLAN® input-output model. This is a change compared to earlier Louisiana economic impact reports produced by Southwick Associates where the RIMS-II economic model was used. The switch was made to take advantage of the greater versatility offered by IMPLAN®, the inclusion of tax multipliers, and to provide results comparable to economic reports produced by other sources based on the more commonly used IMPLAN® model. The IMPLAN® model was developed by MIG, Inc. of Stillwater, Minnesota originally for use by the U.S. Forest Service. Input-output models describe how sales in one industry impact other industries. For example, once a consumer makes a purchase, the retailer buys more merchandise from wholesalers, who buy more from manufacturers, who, in turn, purchase new inputs and supplies. In addition, the salaries and wages paid by these businesses stimulate more benefits. Simply, the first purchase creates numerous rounds of purchasing. Input-output analysis tracks how the various rounds of purchasing benefit other industries and generate economic benefits. The relationships between industries are explained through multipliers. For example, an income multiplier of .09 for industry X would indicate that for every dollar received by the industry under study, nine cents would be paid to the employees of industry X for its products or services. The IMPLAN® model provides multipliers for all major industries in the U.S. and for each state. The IMPLAN® model includes output, earnings and employment multipliers. The output multiplier measures the total economic effect created by the original retail sale. The earnings multiplier measures the total salaries and wages generated by the original retail sale. The employment multiplier estimates the number of jobs supported by the original retail sale. IMPLAN® also estimates federal, state and local tax revenues. Appendix D provides details on tax revenues by activity.

6
To apply the IMPLAN® model, wildlife watching expenditures were matched to the appropriate industry sector. The resulting estimates describe the salaries and wages, total economic effects, and jobs supported by the purchases made by wildlife watchers. This same process is repeated for all reported expenditures. Recreational Boating: There were no existing studies reporting the economic impacts of recreational boating in Louisiana. Therefore, impact estimates were generated as part of this project. The typical annual expenditures per boater were developed using data from the On-line Boating Economic Impact Model (http://marinaeconomics.com) produced by the Recreational Marine Research Center (RMRC) at Michigan State University and funded by the National Marine Manufacturers Association. This online model incorporates the amount spent per boat and per trip for different sized boats. Research conducted by the RMRC indicates that boater expenditures vary little based on a boater’s state of residence. Therefore, no adjustments were made to adjust the national boating expenditures to reflect Louisiana specifically.
Data on the number of Louisiana power boats and sailboats by length in 2006 were provided by the Louisiana Department of Wildlife and Fisheries as of August 10, 2006. The breakdown of boats by size was not available through December 2006. However, the total number of registered boats through December was known. Presuming that the distribution of boats by size remained the same from August to December, the number of boats of different sizes was estimated and appears in Table 1.
Table 1: Pro-rated Number of Boats Registered in Louisiana by Length and Propulsion, 2006. Propulsion Power Sail All Boat Length N N N A) Under 16 feet 141,714 179 141,892 B) 16 - 24 Feet 167,511 610 168,121 C) 25 - 39 Feet 9,027 397 9,424 D) 40+ Feet 965 12 977 All 319,217 1,197 320,414
In previous versions of this report, boat lengths were separated into five different
sizes -- below 16’, 16-20’, 21-27’, 28-40’ and more than 41’ -- not four as in this current assessment. Only four sizes are currently provided by the economic data from RMRC. This change has shifted more boats into the lower size and spending categories, with resulting lower estimates of economic impact for recreational boating as a whole. For this
7
reason, the results from previous versions of this study are not directly comparable with this report.
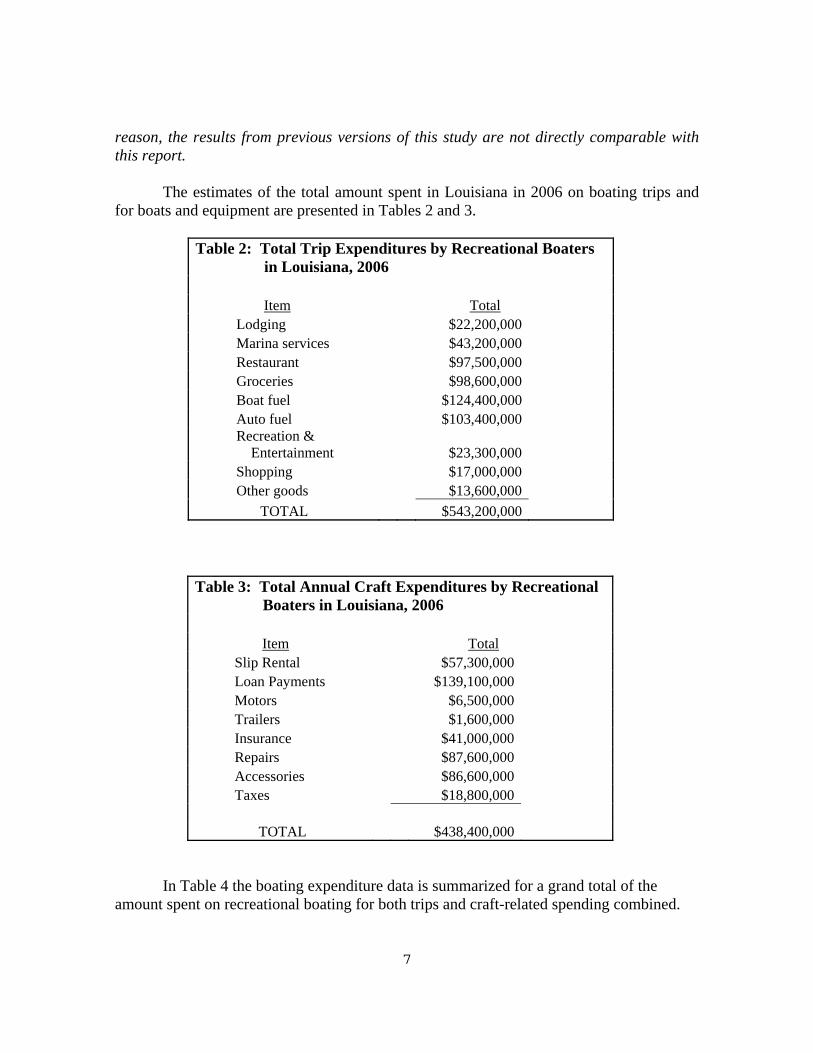
The estimates of the total amount spent in Louisiana in 2006 on boating trips and for boats and equipment are presented in Tables 2 and 3.
Table 2: Total Trip Expenditures by Recreational Boaters in Louisiana, 2006
Item Total
Lodging $22,200,000 Marina services $43,200,000 Restaurant $97,500,000 Groceries $98,600,000 Boat fuel $124,400,000 Auto fuel $103,400,000 Recreation & Entertainment $23,300,000 Shopping $17,000,000 Other goods $13,600,000
TOTAL $543,200,000
Table 3: Total Annual Craft Expenditures by Recreational Boaters in Louisiana, 2006
Item Total
Slip Rental $57,300,000 Loan Payments $139,100,000 Motors $6,500,000 Trailers $1,600,000 Insurance $41,000,000 Repairs $87,600,000 Accessories $86,600,000 Taxes $18,800,000
TOTAL $438,400,000
In Table 4 the boating expenditure data is summarized for a grand total of the amount spent on recreational boating for both trips and craft-related spending combined.

8
Table 4: Total Trip and Craft Spending by Recreational Boaters in Louisiana, 2006 Total Number of boats 320,400 Annual craft spending per boat $1,368.29 Total craft (equipment & boat) spending $438,400,000 Average days per boat 21.4 Total boat days 6,848,800 Average trip spending per boat day $79.31 Total trip spending $543,200,000 Total craft & trip spending per boat per year $3,063.67 Total craft & trip spending $981,600,000
The economic impacts from Louisiana boating were then estimated by inputting boaters’ expenditures into the same IMPLAN® economic modeling system used for the hunting, fishing and wildlife viewing estimates. Using multipliers specific to Louisiana, IMPLAN® estimated the jobs, earnings, multiplier effects and tax revenues created by boaters’ retail spending. Just as for the hunting, fishing and wildlife viewing estimates, adjustments were made by the IMPLAN® process to account for boaters’ expenditures that immediately leave the state and cease to have an impact on Louisiana’s economy. These would include purchases made by boaters from out-of-state catalogs, payments to out-of-state insurance companies, etc. The final economic impacts are presented in Table 9 in the results section. Notes:
1) Boat purchases made as part of a boater’s hunting, fishing, or wildlife-watching activities are also included in those industry impacts presented elsewhere in this report. While this represents a double counting of the same expenditures and economic impacts, these expenditures were not removed from the individual industry impacts, as the choice to remove them from recreational boating or the other industry would be arbitrary, and would reduce the perceived importance of the chosen industry. Thus, the decision was made to leave all boat purchases in the various industry impact estimates, and then “net out” the duplicate boat purchase expenditures from the total impact summations.
9
2) Only vessels registered through LDWF are included in the impact estimates in this report. Due to a lack of data, the recreational boating estimates do not include impacts for non-resident boaters nor larger craft that are documented with the U.S. Coast Guard.
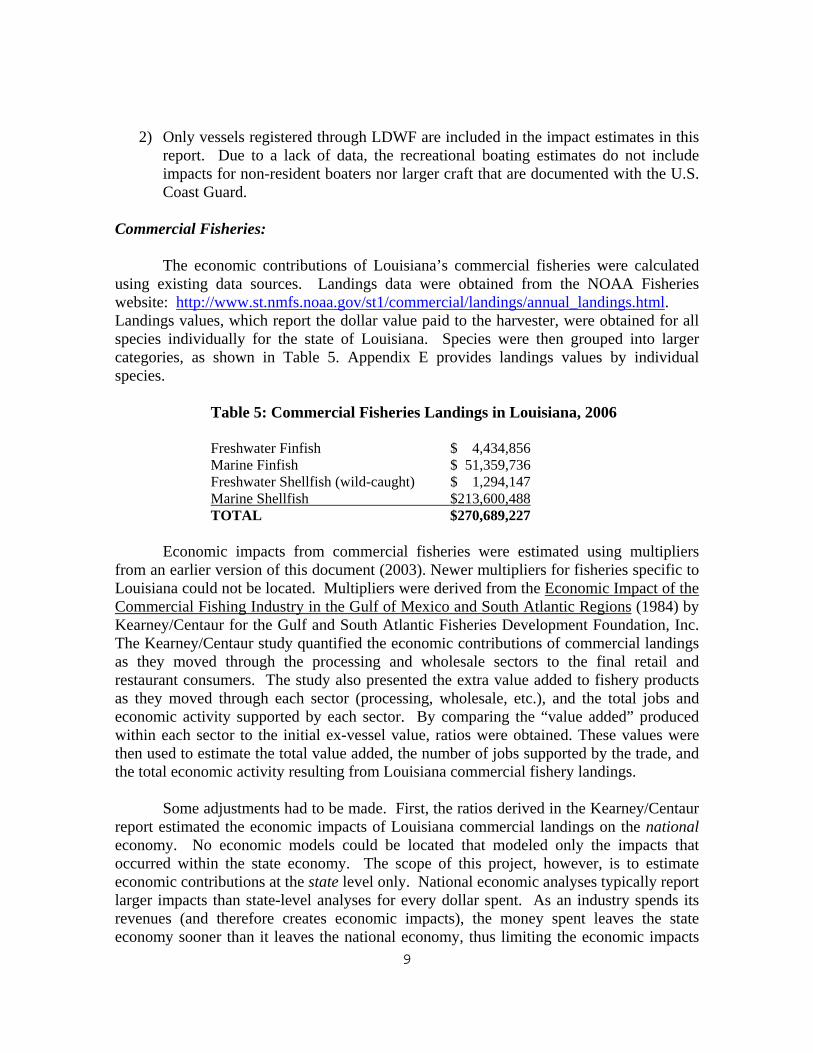
Commercial Fisheries: The economic contributions of Louisiana’s commercial fisheries were calculated using existing data sources. Landings data were obtained from the NOAA Fisheries website: http://www.st.nmfs.noaa.gov/st1/commercial/landings/annual_landings.html. Landings values, which report the dollar value paid to the harvester, were obtained for all species individually for the state of Louisiana. Species were then grouped into larger categories, as shown in Table 5. Appendix E provides landings values by individual species.
Table 5: Commercial Fisheries Landings in Louisiana, 2006 Freshwater Finfish $ 4,434,856 Marine Finfish $ 51,359,736 Freshwater Shellfish (wild-caught) $ 1,294,147 Marine Shellfish $213,600,488 TOTAL $270,689,227
Economic impacts from commercial fisheries were estimated using multipliers from an earlier version of this document (2003). Newer multipliers for fisheries specific to Louisiana could not be located. Multipliers were derived from the Economic Impact of the Commercial Fishing Industry in the Gulf of Mexico and South Atlantic Regions (1984) by Kearney/Centaur for the Gulf and South Atlantic Fisheries Development Foundation, Inc. The Kearney/Centaur study quantified the economic contributions of commercial landings as they moved through the processing and wholesale sectors to the final retail and restaurant consumers. The study also presented the extra value added to fishery products as they moved through each sector (processing, wholesale, etc.), and the total jobs and economic activity supported by each sector. By comparing the “value added” produced within each sector to the initial ex-vessel value, ratios were obtained. These values were then used to estimate the total value added, the number of jobs supported by the trade, and the total economic activity resulting from Louisiana commercial fishery landings. Some adjustments had to be made. First, the ratios derived in the Kearney/Centaur report estimated the economic impacts of Louisiana commercial landings on the national economy. No economic models could be located that modeled only the impacts that occurred within the state economy. The scope of this project, however, is to estimate economic contributions at the state level only. National economic analyses typically report larger impacts than state-level analyses for every dollar spent. As an industry spends its revenues (and therefore creates economic impacts), the money spent leaves the state economy sooner than it leaves the national economy, thus limiting the economic impacts
10
accruing to Louisiana. For example, if a Louisiana shrimp processor sells his catch to a Texas wholesaler, the economic effects on the Louisiana economy end, while the effects continue for the national economy. Not until the shrimp is sold to the final consumer or exported does the impact cease on the national economy. Recognizing this, the national commercial fishery multipliers derived from the Kearney report had to be reduced. These adjustments were made by comparing the state and national impacts of various industries for which data were available (hunting and fishing studies, specifically). The average difference between the state and national multipliers was then used to adjust the economic contributions of Louisiana’s commercial fisheries to reflect state-level impacts versus national-level impacts. Sales and income tax revenues were estimated by first averaging the ratios of tax revenues to retail sales for both recreational fishing and hunting (the only two wildlife-based resource uses for which Louisiana sales and income tax revenue estimates were available), and then applying the average ratio to commercial fishery retail sales to derive the tax dollars from commercial fisheries and related activities. Please note that this underestimates the tax revenues compared to the other activities measured in this report. The other activities rely on the IMPLAN® model to estimate tax revenues, and the IMPLAN® multipliers account for multiple rounds of economic spending in its sales tax estimates. Plus, IMPLAN® estimates include local tax revenues. The tax estimation process used for commercial fisheries does not account for these additional sales and local tax revenues. Table 10 presents the final economic impact estimates for Louisiana’s commercial fisheries. Alligator Harvests: The economic contributions of alligator harvests were quantified by matching 2006 harvest data with information from Alligator Use in the Louisiana Economy: Marsh to Market, prepared by the Louisiana Sea Grant Marine Extension Program (Roberts, 2001). This document examined the economic contribution of both wild and farm harvests, egg collections, and alligator-related tourism (“swamp tours”). The economic impact of alligator-related tourism is not detailed in this report, because such impacts are (theoretically) already included as part of non-consumptive wildlife-related recreation.
Wild and farm harvest values include both hide and meat revenues. Using estimates from the Sea Grant report, ratios were developed by comparing sales (revenues) to total output (multiplied effect) and jobs. These ratios were matched with actual revenues from all farm, wild, and egg sales from the 2006 season as reported by the LDWF. The results were the total estimated economic contributions of the Louisiana alligator trade. The jobs multiplier was adjusted for inflation, recognizing that a greater number of dollars are needed each year to support a job due to inflation’s eroding effects. The Roberts 2001 report did not estimate earnings (salaries, wages and profits) or state sales and income tax revenues. Earnings were estimated by applying the ratio of retail

11
sales-to-earnings from the commercial fishing results to alligator’s retail sales (revenue). For lack of a better estimate, tax revenues were estimated by applying the average ratio of tax revenues to retail sales for recreational fishing and hunting to the sales revenues from the alligator trade. Table 11 lists the economic impact results.
A second method was used to check the validity of the alligator multipliers, specifically for meat. Meat values were crossed with the multipliers used in the commercial fisheries analysis. Compared with the multipliers used in Roberts 2001, both sets of results were very similar. Reptile and Amphibian Collection: The Louisiana economy also benefits from the collection of other reptiles and amphibians for human consumption, laboratory research, and the pet trade. Only exports from Louisiana are regulated. A one percent excise tax is collected on all reptile and amphibian exports. In 2006, the Department of Wildlife and Fisheries collected $7,168.51, translating into a total value of exports of approximately $716,851. The value of shipments within the state is unknown and therefore excluded from this analysis. The economic contributions of these shipments were estimated by using multipliers from the commercial fishing portion of this report, since both activities represent the harvest of a wild resource for commercial sale. Recognizing that commercial harvesting employs a processing sector and most reptile amphibian exports are shipped whole and/or live, better multipliers are needed, but could not be located. Economic multipliers for the reptile and amphibian trade were not available, and generating customized multipliers was beyond the scope of this study. Ratios were developed by comparing commercial fishery sales (industry revenues) to total output (multiplied effect), income and jobs. These ratios were used with the 2006 reptile and amphibian export values reported above. The results were the total estimated economic contributions of the Louisiana reptile and amphibian trade. State sales and income tax revenues were also estimated using the multiplier ratios applied in the commercial fisheries portion of this study. See Table 12 for the results. Fur Harvests: The value of the annual state fur harvest is estimated by the LDWF. To estimate the economic impacts of fur harvesting, multipliers were borrowed from a national economic study of trapping conducted in 1993 titled An Economic Profile of the U.S. Fur Industry (Southwick et al.). No newer sources are available. Ratios were developed by comparing sales (industry revenues) to total output (multiplied effect), income and jobs in the Southwick fur industry study, and adjusting to reflect state-level impacts only (versus national-level impacts). Differences in the impacts from available hunting data were used to make this adjustment. These ratios were then utilized with 2006/2007 fur harvest value

12
data as reported by the LDWF. State sales and income tax revenues were estimated by first averaging the ratios of tax revenues to retail sales for both recreational fishing and hunting (the only two wildlife based resource uses for which Louisiana tax revenue estimates are available), and matching the average ratio to fur harvesting revenues. The results were the estimated economic contributions of the Louisiana fur trade for pelts.
In 2006, under the Coastwide Nutria Control Program (CNCP), $5 was awarded for each nutria tail turned in by approved trappers. Most of the pelts from these nutria were not processed (375,683 CNCP payments, only 4,613 total nutria pelts sold). The economic impact of the CNCP payments was calculated using the IMPLAN® model as “payments to households”, with the assumption that this revenue was used by the trapper for regular household consumption.
Table 13 provides the final impact estimates for pelts and the CNCP calculated separately and in total. The Economic Contributions of Louisiana’s Fisheries, Wildlife and Boating Resources: The total economic contributions of all fishery, wildlife, and boating related activities are estimated by summing the results for each activity described in this report, and are reported in Table 14.

13
RESULTS
The 2006 economic contributions of Louisiana’s fisheries, wildlife and boating resources to the state economy are presented in the tables below. The combined contributions of all activities are presented last. Appendices B and C present detailed participation and expenditure estimates for hunting, recreational fishing, and wildlife-watching activities. Appendix D provides detailed estimates of tax revenues by activity. Table 6: Economic Impacts of Recreational Hunting in Louisiana, 20061
Retail Sales
Total Economic
Effect Earnings Jobs
State and Local Tax Revenues
Federal Tax Revenues
Sample Size
All Hunting: $594,435,590 $975,249,784 $306,067,276 13,084 $62,248,488 $62,343,675 99 Residents Only: $548,607,832 $900,660,868 $278,801,736 11,824 $56,948,353 $56,752,879 92 Non-Residents Only:** - - - - - - 7
Big Game Hunting:† $390,650,265 $644,954,463 $208,505,478 9,057 $41,144,354 $42,089,752 73 Residents Only: $363,517,400 $602,327,071 $193,148,971 8,512 $37,816,342 $38,776,294 69 Non-Residents Only:** - - - - - - 4
Small Game Hunting††: $55,738,226 $91,742,604 $27,112,104 1,165 $6,336,137 $5,677,626 44 Residents Only: $55,738,226 $91,742,604 $27,112,104 1,165 $6,336,137 $5,677,626 44 Non-Residents Only:** - - - - - - -
Migratory Bird Hunting†††: $93,081,184 $153,569,060 $45,848,618 2,043 $10,609,434 $9,628,537 40 Residents Only: $83,492,866 $136,860,793 $40,425,229 1,784 $9,659,621 $8,570,131 37 Non-Residents Only:** - - - - - - 3
Deer Hunting: $307,088,187 $507,147,853 $163,532,350 7,183 $32,295,112 $33,073,824 72 Residents Only: $276,106,394 $457,688,177 $144,368,163 6,300 $28,689,109 $29,122,183 68 Non-Residents Only:** - - - - - - 4
Turkey Hunting: $73,254,800 $120,161,594 $35,655,437 1,533 $8,232,808 $7,486,191 16 Residents Only:* $73,254,800 $120,161,594 $35,655,437 1,533 $8,232,808 $7,486,191 16 Non-Residents Only:** - - - - - - -
* Sample sizes are small -- use results with caution. ** = Sample size is too small to present results. † Big game includes deer, turkey, and hog/feral pig. †† Small game includes rabbits and squirrels. ††† Migratory birds include duck, geese, dove, woodcock, snipe, rail, gallinule, and coot.
1 Some categories in this table contain species also included in other categories, such as “Big Game Hunting,” which includes deer and turkey. Do not sum the categories above. The total hunting impacts from all forms of hunting are presented in the first category -- “All Hunting.”

14
Table 7a: Economic Impacts of Freshwater Recreational Fishing in Louisiana, 2006
Retail Sales
Total Economic
Effect Earnings Jobs
State and Local Tax Revenues
Federal Tax Revenues
Sample Size
All Freshwater Fishing: $591,584,325 $952,934,444 $269,702,722
10,389 $64,078,623 $57,970,693 184
Residents Only: $542,817,586 $869,493,036 $246,933,163
9,388 $59,124,866 $53,330,891 167
Non-Residents Only:* $48,766,739 $83,441,408 $22,769,559
1,001 $4,953,757 $4,639,802 17 * Sample sizes are small. Use results with caution.
Table 7b: Economic Impacts of Saltwater Recreational Fishing in Louisiana, 2006
Retail Sales
Total Economic
Effect Earnings Jobs
State and Local Tax Revenues
Federal Tax Revenues
Sample Size
All Saltwater Fishing: $472,092,061 $757,091,876 $210,847,634 7,733 $49,976,489 $45,605,182 108 Residents Only: $274,280,512 $446,475,424 $133,159,643 4,721 $25,996,470 $27,063,954 91
Non-Residents Only:* $197,811,549 $310,616,452 $77,687,991 3,012 $23,980,019 $18,541,228 17 * Sample sizes are small. Use results with caution.
Table 7c: Economic Impacts of All Recreational Fishing in Louisiana, 2006
Retail Sales
Total Economic
Effect Earnings Jobs
State and Local Tax Revenues
Federal Tax Revenues
All Freshwater and Saltwater Fishing Combined: $1,063,676,386 $1,710,026,320 $480,550,355 18,122 $114,055,112 $103,575,875 Residents Only: $817,098,098 $1,315,968,460 $380,092,806 14,109 $85,121,336 $80,394,845 Non-Residents Only:* $246,578,288 $394,057,860 $100,457,549 4,013 $28,933,776 $23,181,030
* Sample sizes are small. Use results with caution.

15
Table 8: Economic Impacts of Non-Consumptive Fish and Wildlife-Associated Recreation in Louisiana, 2006
All Wildlife Watching Activities: Retail Sales
Total Economic Effect Earnings Jobs
State and Local Tax Revenues
Federal Tax Revenues Sample Size
All Wildlife Watching: $312,430,181 $517,095,925 $158,486,453 6,199 $32,315,089 $30,867,433 79 Residents Only: $276,144,841 $454,825,214 $138,429,565 5,363 $27,121,114 $28,329,883 74 Non-Residents Only**: - - - - - - 5
** = Sample size too small to present results
Table 9: Economic Impacts of Recreational Boating in Louisiana, 2006
Retail Sales Total Economic
Effect Earnings Jobs State and Local Tax Revenues
Federal Tax Revenues
$ 981,600,000 $1,330,206,821 $ 406,944,968 14,959 $ 80,792,761 $ 82,634,436
Table 10: Economic Impacts of Commercial Fisheries in Louisiana, 2006
Dockside
Value Retail Sales
Total Economic
Effect Earnings Jobs
State and Local Tax Revenues
Federal Tax Revenues
Freshwater Finfish $4,434,856 $29,490,809 $39,321,079 $6,322,268 441 $2,794,008 $2,558,114 Marine Finfish $51,359,736 $341,530,860 $455,374,480 $73,217,711 5,107 $32,357,193 $29,625,327
Freshwater Shellfish (wild-caught) $1,294,147 $8,605,791 $11,474,388 $1,844,918 129 $815,327 $746,490 Marine Shellfish $213,600,488 $1,420,395,899 $1,893,861,198 $304,505,826 21,238 $134,570,634 $123,209,052
TOTALS $270,689,227 $1,800,023,359 $2,400,031,145 $385,890,722 26,915 $170,537,161 $156,138,983 Menhaden $33,547,127 $223,080,959 $297,441,278 $47,824,308 3,336 $21,135,055 $19,350,657 Shrimp $144,662,438 $961,973,147 $1,282,630,863 $206,228,719 14,384 $91,138,912 $83,444,200 Oysters $35,851,947 $238,407,501 $317,876,668 $51,110,027 3,565 $22,587,117 $20,680,123 Blue crab $33,079,894 $219,973,963 $293,298,617 $47,158,228 3,289 $20,840,694 $19,081,147 Catfish $2,273,713 $15,119,687 $20,159,583 $3,241,373 226 $1,432,464 $1,311,523
Wild-caught Crawfish $1,289,201 $8,572,901 $11,430,535 $1,837,867 128 $812,211 $743,637
Table 11: Economic Impacts of Alligator Harvests in Louisiana, 2006
Harvest Values
/Retail Sales Total Economic
Effect Earnings Jobs
State and Local Tax Revenues
Federal Tax Revenues
Wild (hides + meat) $11,918,002 $21,900,602 $2,554,993 149 $1,129,131 $1,033,800
Farm (hides + meat) $41,519,817 $75,958,735 $8,901,058 522 $3,933,655 $3,601,543
Egg collection $3,539,835 $6,424,145 $758,873 43 $335,370 $307,055
TOTALS $56,977,654 $104,283,482 $12,214,924 714 $5,398,156 $4,942,399

16
Table 12: Economic Impacts of Reptile and Amphibian Collection in Louisiana, 2006
Export Sales Total Economic Effect Earnings Jobs State and Local Tax Revenues Federal Tax Revenues
$716,851 $955,801 $153,679 11 $67,916 $62,182
Table 13: Economic Impacts of Fur Harvests in Louisiana, 2006
Harvest Values
Total Economic Effect Earnings Jobs
State and Local Tax Revenues
Federal Tax Revenues
Pelts $124,637 $229,144 $61,859 3 $11,808 $7,690 CNCP† Payments $1,878,415 $2,596,407 $626,067 21 $128,067 $131,609
TOTALS $2,003,052 $2,825,551 $687,924 24 $139,875 $139,299 † CNCP=Coastal Nutria Control Program – Payments of $5.00/tail were paid to trappers for 375,683 nutria tails. Table 14: Total Economic Impacts from Activities Associated with
Louisiana’s Fisheries, Wildlife and Boating Resources, 2006 Please note that the sum of the economic contributions for all fish, wildlife, and boating related activities is an estimate developed by summing the impacts for each activity listed above. Different methods were used to develop the estimates for the various activities. This summation is presented to help the reader gain a better understanding of the overall benefits these activities provide to the state economy.
Retail Sales Total Economic Effect Earnings Jobs State and Local Tax Revenues Federal Tax Revenues
$4,611,852,404 $6,747,880,780 $1,678,179,233 76,700 $446,182,653 $422,381,066
CONCLUSIONS
The fisheries, wildlife, and boating resources of Louisiana provide the state economy with important sources of jobs, income, tax revenues, and other benefits. These benefits are particularly important in rural or remote areas where other sources of income may be limited. Outdoor sportsmen and recreationists spend millions which benefit many other industries. Consumers spend millions more purchasing food and other products harvested from Louisiana’s waters. By stimulating more than $4.6 billion in retail sales, over 76,000 jobs, $1.75 billion in salaries and wages, and over $446 million in state and local tax revenues, these activities are of great value not only to industry and local businesses, but to every resident and community in Louisiana.

17
LITERATURE CITED
American Sportfishing Association. (2007). Sportfishing in America: An Economic Engine and Conservation Powerhouse. Alexandria, VA.
International Association of Fish and Wildlife Agencies. (2007). Hunting in America: An Economic Engine and Conservation Powerhouse. Washington, D.C.
Kearney/Centaur, Inc. (1984). Economic Impact of the Commercial Fishing Industry in the Gulf of Mexico and South Atlantic Regions. Gulf and South Atlantic Fisheries Development Foundation, Inc. City: Unknown.
Louisiana Department of Wildlife and Fisheries. (2007). Harvest data for alligators, reptiles and amphibians, and fur. Unpublished. Baton Rouge, LA. (Personal communication: Herb Holloway)
Louisiana Department of Wildlife and Fisheries. (2006). Recreational boat registration data. Unpublished. Baton Rouge, LA. (Personal communication: Herb Holloway)
Minnesota IMPLAN Group (MIG, Inc,). (2005). IMPLAN. Stillwater, MN.
National Marine Fisheries Service. (2007). Commercial Landings data. Fisheries Statistics and Economics Division website.
National Marine Fisheries Service. (2001). Marine Angler Expenditures in the Southeast Region. Fisheries Statistics and Economics Division. Silver Spring, MD.
National Marine Manufacturers Association. (2007). Boating statistics (website). Chicago, IL.
Recreational Marine Research Center. (2004). Unpublished data. Michigan State University, Lansing, MI.
Roberts, Ken. (2001). Alligator Use in the Louisiana Economy: Marsh to Market. LSU AgCenter.
Southwick, Robert and Mario Teisl, Ph.D. An Economic Profile of the U.S. Fur Industry. (1993). Southwick Associates, Alexandria, VA.
U.S. Department of the Interior, Fish and Wildlife Service and U.S. Department of Commerce, Bureau of the Census. 2007. 2006 National Survey of Fishing, Hunting and Wildlife Associated Recreation. U.S. Government Printing Office, Washington, D.C.

18
Page intentionally left blank

19
APPENDICES
Appendix A: Quick Facts About Louisiana’s Fisheries and Wildlife- Related Commerce
Fishing, Wildlife and Boating Combined
Louisiana’s retail sales revenues related to fish, wildlife and recreational boating combined represent 10% of the state’s total retail spending. Louisiana’s annual retail sales from fishing, wildlife and boating are seven times the total box office revenue for Titanic, the top grossing movie of all time. The total economic activity generated by fishing, wildlife and boating in Louisiana represents 5.7% of the state's Gross State Product. One of every 17 jobs in Louisiana can be attributed to fishing, wildlife or boating-related activities. Jobs related to fishing, wildlife, and boating represent 6% of Louisiana's total employment. There are more people employed in fishing, wildlife and boating activities in Louisiana than there are public administration employees. The state and local tax revenues generated annually by all fish, wildlife and boating activities in Louisiana could more than pay for the total cost of building the John James Audubon bridge in New Roads, the longest cable stay bridge in North America. The state and local tax revenue generated annually by all Louisiana’s fish, wildlife and boating activities could pay the salaries of 22% of the teachers in the state. Louisiana’s state and local tax revenues generated annually by all fish, wildlife and boating activities could pay the education costs of 60,000 elementary and secondary students or 90% of all kindergarten students in the state.

20
Marine and Freshwater Fishing The number of people who participate in marine and freshwater fishing in Louisiana could fill the Superdome nearly ten times. One of every seven Louisiana residents participates in marine and/or freshwater fishing. The number of non-residents who travel to Louisiana to participate in marine and freshwater fishing equals the population of Lafayette. Freshwater and marine recreational fishing in Louisiana employ as many people as does the clothing and clothing accessory store industry. One of every 100 jobs in Louisiana can be attributed to freshwater and saltwater fishing.
Marine Fishing
The number of people who participate in marine fishing in Louisiana could fill the Superdome four times. One of every 235 jobs in Louisiana can be attributed to marine fishing. The state and local tax revenue generated by marine fishing activities in Louisiana could pay the salaries of all the public school teachers in Tangipahoa Parish.
Freshwater Fishing
The number of people who participate in freshwater fishing in Louisiana is equal to the population of Nashville, Tennessee. Freshwater fishing activities in Louisiana generate enough jobs to employ all of the residents of St. Helena Parish. The state and local tax revenue generated by freshwater fishing activities in Louisiana could pay the salaries of all the public school teachers in Livingston Parish.

21
Hunting
The number of people who participate in hunting in Louisiana could fill the Superdome nearly four times. One of every 140 jobs in Louisiana can be attributed to hunting. In Louisiana there are more people employed due to hunting than there are utility employees. Hunting activities in Louisiana support enough jobs to employ all of the residents of Madison Parish. The state and local tax revenues generated by hunting activities in Louisiana could pay the salaries of all the public school teachers in Terrebonne Parish.
Migratory Bird Hunting The number of people who participate in migratory bird hunting in Louisiana equals the population of Bossier Parish. Migratory bird hunting in Louisiana supports 1.5 times as many jobs as there are New Orleans Police Department officers.
Wildlife Viewing
Retail sales revenues generated annually wildlife viewing in Louisiana are greater than the total box office revenue for ‘Pirates of the Caribbean: At World's End’, the fourth top grossing movie of 2007. The state and local tax revenue generated by wildlife viewing activities in Louisiana could pay the salaries of nearly all the public school teachers in St. Charles Parish.

22
Commercial Fisheries
Commercial fisheries in Louisiana generate enough jobs to employ all of the residents of Plaquemines Parish. One of every 70 jobs in Louisiana can be attributed to commercial fisheries. The total number of jobs supported by commercial fisheries is equal to 90% of the total student body of LSU.
Boating
Boating activities in Louisiana generate enough jobs to employ all of the residents of West Baton Rouge Parish. One of every 85 jobs in Louisiana can be attributed to boating. The state and local tax revenues generated by boating activities in Louisiana could pay the salaries of all the public school teachers in Calcasieu Parish.
Alligator Harvests
The alligator industry in Louisiana employs half as many people as the New Orleans Police Department. The state and local tax revenue generated by alligator activities in Louisiana could pay the salaries of all the public school teachers in Madison Parish. Louisiana state and local tax revenues generated in one year by alligator activities could pay the public education costs of 740 elementary and secondary students.

23
Appendix B: Demographic Data and Participation Estimates for Hunting, Recreational Fishing, and Non-Consumptive Wildlife-Related
Recreation

24
Appendix Table B-1: Demographic Data for Louisiana Hunters, 2006
ALL HUNTERS Big Game1 Small Game2
Migratory Birds3 Deer Turkey All Hunting
Race (non-white) 7.0% 19.8% 2.0% 7.1% 0.0% * 10.1% Average age 45 40 47 45 43 * 45 Gender (male) 92.5% 92.4% 100.0% 92.5% 100.0% * 94.4% Marital Status (married) 78.8% 74.9% 81.6% 78.6% 76.2% * 75.7% Average household income $56,090 $45,633 $64,267 $55,547 $44,084 * $59,259 Education No High School 8.0% 9.4% 2.0% 8.1% 17.2% * 6.0% Some High School 8.3% 8.9% 3.8% 8.4% 3.8% * 7.7% High School Diploma 33.5% 45.9% 40.2% 33.8% 32.7% * 38.5% 1 – 3 Years College 27.0% 18.5% 20.4% 27.3% 28.7% * 23.7% College Graduate 23.2% 17.2% 33.5% 22.4% 17.5% * 24.1% Sample Size 73 44 37 68 16 92 RESIDENT Race (non-white) 7.9% 19.8% 2.1% 8.0% 0.0% * 11.3% Average age 43 40 47 43 43 * 43 Gender (male) 91.6% 92.4% 100.0% 91.5% 100.0% * 93.7% Marital Status (married) 85.6% 74.9% 80.3% 85.5% 76.2% * 79.8% Average household income $54,992 $45,633 $64,422 $54,365 $44,084 * $58,644 Education No High School 9.0% 9.4% 2.2% 9.1% 17.2% * 6.8% Some High School 9.4% 8.9% 4.1% 9.5% 3.8% * 8.7% High School Diploma 37.7% 45.9% 38.2% 38.2% 32.7% * 41.4% 1 – 3 Years College 19.6% 18.5% 21.9% 19.9% 28.7% * 18.5% College Graduate 24.3% 17.2% 33.6% 23.4% 17.5% * 24.7% Sample Size 69 44 37 68 16 92 NON-RESIDENT Race (non-white) ** ** ** ** Average age ** ** ** ** Gender (male) ** ** ** ** Marital Status (married) ** ** ** ** Average household income ** ** ** ** Education No High School ** ** ** ** Some High School ** ** ** ** High School Diploma ** ** ** ** 1 – 3 Years College ** ** ** ** College Graduate ** ** ** ** Sample Size 4 - 3 4 - 7
* Sample size is small. Use results with caution. ** Sample size is too small to present results. 1 Big Game includes deer, turkey, and feral hogs. 2 Small Game includes rabbit, squirrel, quail, and other small game. 3 Migratory Birds include ducks, geese, coots, doves, woodcock, rail, gallinule, etc.

25
Appendix Table B-2: Demographic Data for Louisiana Anglers, 2006
ALL ANGLERS All Freshwater
All Saltwater
Race (non-white) 19.2% 7.5% Average age 45 42 Gender (male) 76.3% 83.7% Marital Status (married) 68.7% 71.4% Average household Income $52,004 $61,670 Education No High School 7.9% 7.0% Some High School 11.9% 10.2% High School Diploma 37.6% 32.5% 1-3 Year College 24.4% 26.4% College graduate 18.2% 23.9% Sample Size 184 108 RESIDENT Race (non-white) 22.4% 8.8% Average age 45 42 Gender (male) 74.5% 81.2% Marital Status (married) 71.5% 74.1% Average household income $50,646 $60,160 Education No High School 8.7% 8.2% Some High School 13.2% 11.9% High School Diploma 38.7% 33.4% 1-3 Year College 21.0% 26.2% College graduate 18.4% 20.4% Sample Size 167 91 NON-RESIDENT Race (non-white) 0.0% * 0.0% * Average age 46 * 40 * Gender (male) 86.9% * 98.0% * Marital Status (married) 51.0% * 55.4% * Average household income $59,768 * $70,114 * Education No High School 3.0% * 0.0% * Some High School 3.5% * 0.0% * High School Diploma 30.8% * 27.4% * 1-3 Year College 45.6% * 27.9% * College graduate 17.1% * 44.8% * Sample Size 17 17
* = Sample sizes are small. Use results with caution.

26
Appendix Table B-3: Demographic Data for Louisiana Wildlife Watchers, 2006
Nonresidential1 Activity Resident* Nonresident **
Residential Activity
All Participants
Race (non-white) 92.4% 18.2% 16.6% Average age 45 51 51 Gender (male) 48.3% 48.1% 49.3% Marital Status (married) 82.7% 72.2% 72.7% Average Household Income $51,241 $49,250 $51,738 Education No high school 9.0% 6.5% 5.9%
Some high school 0.0% 6.4% 5.8% High school diploma 32.2% 38.0% 36.7% 1-3 Years College 37.1% 21.4% 21.9% College Graduate 21.7% 27.8% 29.6% Sample Size 20 5 71 79
* Sample size is small. Use results with caution . ** = Sample size is too small to present results. 1 Nonresidential = ”away from home”

27
Appendix Table B-4: Participation Estimates for Louisiana Hunters, 2006
Number of participants Big Game1 Small Game2
Migratory Birds3 Deer Turkey All Hunting
Resident 181,674
126,376
93,404
177,803 46,770 * 239,092 Nonresident ** ** ** ** - **
Total 204,414
126,376
100,271
202,330 46,770 * 270,486 Number of days
Resident 3,917,561
1,447,085
1,382,099
3,369,930 552,103 5,791,623 Nonresident ** ** ** ** ** **
Total 4,013,178
1,447,085
1,418,508
3,508,446 552,103 5,979,060 Average Days of Participation Resident 21.6 11.5 14.8 19.0 11.8 24.2 Nonresident ** ** ** ** ** ** Total 19.6 11.5 14.1 17.3 11.8 22.1 Number of observations Resident 69 44 37 68 16 92 Nonresident 4 - 3 4 - 7 Total 73 44 40 72 16 99
* Sample size is small. Use results with caution. ** Sample sizes are too small to report results. 1 Big Game includes deer, turkey, and feral hogs. 2 Small Game includes rabbit, squirrel, quail, and other small game. 3 Migratory Birds include ducks, geese, coots, doves, woodcock, rail, gallinule, etc.

28
Appendix Table B-5: Participation Estimates for Louisiana Anglers, 2006
All
Freshwater
All
Saltwater Number of participants
Resident 472,175 247,545 Nonresident 76,513 * 41,953 * Total 548,688 289,498 Number of days Resident 8,312,206 2,541,387 Nonresident 430,642 * 433,191 * Total 8,742,848 2,974,577 Avg. Days of Participation
Resident 17.6 10.3 Nonresident 5.6 * 10.3 * Total 15.9 10.3 Number of observations
Resident 167 91 Nonresident 17 17 Total 184 108
* Sample sizes are small. Use results with caution.

29
Appendix Table B-6: Participation Data for Louisiana Wildlife Viewers,
2006
Non-Residential (Away-from-Home) Activity Resident* Nonresident** Total Number of observations 20 5 25
Number of participants
193,015 193,015
Observing wildlife
93,744 93,744
Photographing wildlife
48,637 48,637
Feeding wildlife
67,074 67,074
Number of days
3,076,108 3,076,108
Observing wildlife
1,516,635 1,516,635
Photographing wildlife
752,280 752,280
Feeding wildlife
1,101,997 1,101,997
Number of trips
901,580 901,580 Average Days Participation 15.9 15.9 Number of recreationists visiting: Public land 90,237 90,237 Private land 76,004 76,004 Number of recreationists observing, feeding, photographing: Birds 164,983 164,983 Waterfowl 141,734 141,734 Songbirds 104,815 104,815 Birds of prey 52,423 52,423 Other birds 45,404 45,404 Shorebirds 101,686 101,686 Mammals 131,903 131,903 Small land mammals 71,409 71,409 Large land mammals 86,360 86,360 Ocean mammals 5,982 5,982 Other wildlife 97,067 97,067 Fish 69,367 69,367
* Sample size is small. Use results with caution. ** Sample size is too small to present results.

30
Appendix Table B-6: Participation Data for Louisiana Wildlife Viewers, 2006 (continued)
Residential (Around-the-Home) Activity Number of participants 671,455 Feeding birds & wildlife 598,392 Birds 577,586 Other wildlife/fish 260,479 Observing wildlife 490,671 Photographing wildlife 124,909 Visiting parks near home 70,067 Maintaining natural areas around home 161,953 Maintaining plantings around home 155,148 Number of days Observing wildlife 68,078,709 Photographing wildlife 3,381,353 Number of recreationists Birds 467,146 Mammals 412,135 Large mammals 138,540 Small mammals 412,135 Insects or spiders 134,627 Amphibians or reptiles 178,209 Fish & other insects 118,869 Number of Observations 71

31
Appendix C: Detailed Annual Expenditure Estimates for Hunting, Recreational Fishing, Non-Consumptive Wildlife-Related Recreation, and Boating

32
Appendix Table C-1: Average Daily and Annual Expenditures by Hunters in Louisiana, 2006
Big Game1 Small Game2
Migratory Bird3 Deer Turkey* All Hunting
All Hunters: Average daily expenditures $97.34 $38.52 $65.62 $87.53 $132.68 $99.42
Average annual expenditures $1,911.07 $441.05 $928.30 $1,517.76 $1,566.29 $2,197.66 Sample Size = 73 44 40 72 16 99
Resident Hunters:
Average daily expenditures $92.79 $38.52 $60.41 $81.93 $132.68 $94.72 Average annual expenditures $2,000.93 $441.05 $893.89 $1,552.88 $1,566.29 $2,294.54
Sample Size = 69 44 37 68 16 92
Non-Resident Hunters: Average daily expenditures ** ** ** ** ** **
Average annual expenditures ** ** ** ** ** ** Sample Size = 4 0 3 4 0 7
* Sample size is small. Use results with caution. ** Sample sizes are too small to report results. 1 Big Game includes deer, turkey, and feral hogs. 2 Small Game includes rabbit, squirrel, quail, and other small game. 3 Migratory Birds include ducks, geese, coots, doves, woodcock, rail, gallinule, etc. Appendix Table C-2: Average Daily and Annual Expenditures by Anglers
in Louisiana, 2006 Freshwater Anglers
(all species) Saltwater Anglers
(all species) All Anglers
Average daily expenditures $67.64 $185.76 Average annual expenditures $1,077.81 $1,630.73 Sample Size = 184 108
Resident Anglers
Average daily expenditures $65.30 $107.93 Average annual expenditures $1,149.61 $1,108.00
Sample Size = 167 91 Non-Resident Anglers*
Average daily expenditures $112.77 $456.64 Average annual expenditures $634.72 $4,715.02
Sample Size = 17 17 * Sample sizes are small. Use results with caution.

33
Appendix Table C-3: Average Daily and Annual Expenditures by Wildlife Watchers in Louisiana, 2006
Residents Non-Residents All ParticipantsAverage per participant, annually On residential activities (annually) $174.22 On non-residential activities (annually) $1,430.69 ** $1,388.40 Average per participant, per day On non-residential activities, all non-travel expenses (including equipment) $89.77 ** $97.68 On non-residential activities, travel expenses only (food, lodging, etc.) $90.80 ** $119.96 ** Sample size is too small to report results.
34
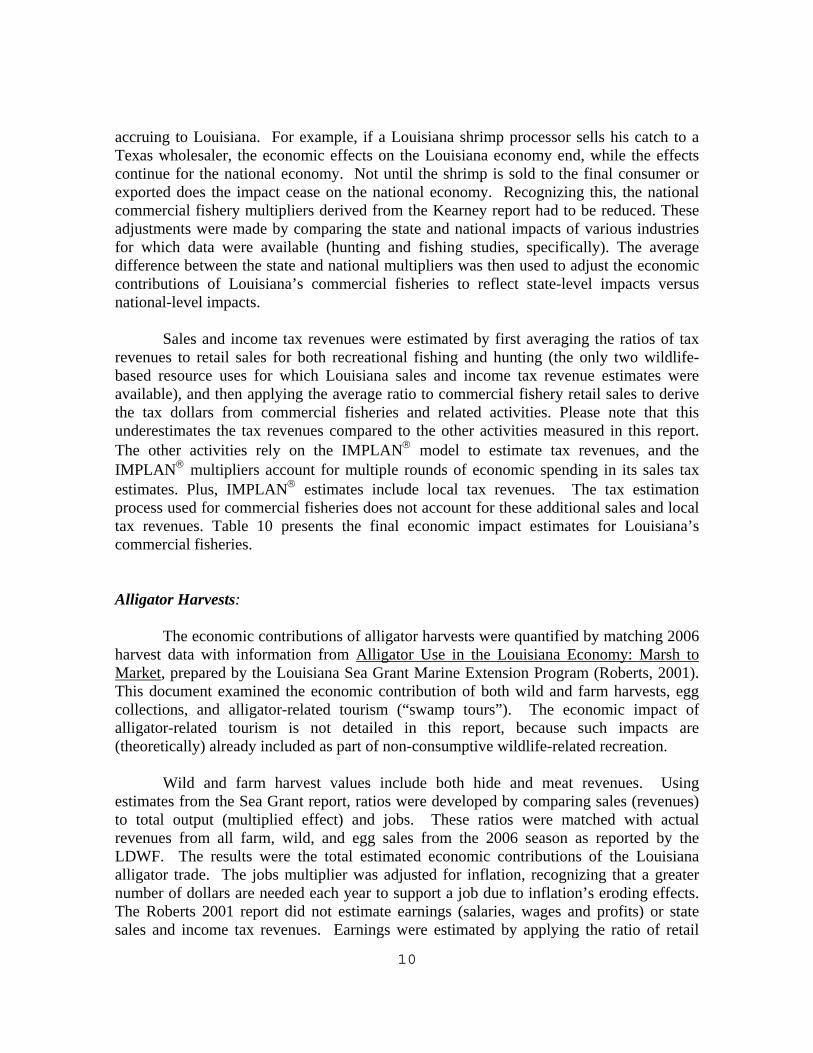
Appendix Table C-4: Expenditures for Specific Items by Louisiana Hunters, 2006
Item RESIDENTS NON-RESIDENTS** TOTAL Sample Size 93 7 100
Food $63,611,395 $68,804,167
Lodging $10,717,499 $14,492,926
Airplane fare $110,494 $110,494
Public transportation $8,017 $8,017
Automobiles/Vans $122,248,909 $126,873,154
Guide fees $974,989 $1,046,827
Public land fees $4,085,590 $4,085,590
Private land fees $18,468,900 $22,454,365
Heat/cooking fuel $5,481,653 $5,496,801
Equipment rentals $1,830,187 $1,830,187
Boat fuel $6,607,985 $7,289,651
Boat launch fees $1,836,940 $1,927,829
Boat mooring $4,298,239 $4,298,239
Rifles $29,752,811 $31,324,706
Shotguns $15,551,904 $15,551,904
Muzzle loaders $8,857,791 $10,020,501
Handguns $3,639,325 $3,639,325
Bows $15,352,908 $15,352,908
Scopes $6,538,017 $6,538,017
Decoys $3,853,211 $3,884,824
Ammo $13,805,760 $14,087,822
Handloading $1,246,283 $1,246,283
Dogs $7,799,414 $7,799,414
Other hunting equipment $4,974,728 $5,251,733
Camping gear $7,755,737 $7,912,927
Binoculars $3,120,110 $3,198,705
Foul weather gear $14,759,330 $14,972,692
Taxidermy $9,896,263 $9,896,263
Other items $3,111,342 $3,111,342
Boats $7,084,686 $7,084,686
Canoes $4,221,473 $4,221,473
Boat motors $1,122,614 $1,122,614
Off-road vehicle $51,039,480 $51,039,480
Other special equipment $2,098,235 $2,491,209
Books $2,920,761 $2,983,322
Dues $17,402,662 $17,447,348
Licenses $5,277,202 $12,467,613
Land purchase $30,157,063 $31,469,577
Land lease $36,987,925 $51,600,655
TOTAL $548,607,832 $594,435,590 ** = Sample size is too small to present results.

35
Appendix Table C-5: Expenditures for Specific Items by Louisiana Freshwater Anglers, 2006
RESIDENTS NON-RESIDENTS* TOTAL Sample Size 167 17 184
Food $39,134,526 $15,703,578 $54,838,105
Lodging $5,081,675 $288,245 $5,369,921
Airfare $235,404 $530,436 $765,841
Public transportation $61,486 $416,308 $477,794
Private transportation $39,318,454 $13,459,280 $52,777,735
Boat fuel $24,887,618 $1,944,028 $26,831,646
Guides $1,751,345 $1,003,356 $2,754,701
Public land use fees $1,829,278 $46,281 $1,875,559
Private land use fees $1,336,241 $0 $1,336,241
Boat launching $2,825,257 $909,122 $3,734,380
Boat mooring $17,791,461 $227,281 $18,018,742
Equipment rental $587,379 $0 $587,379
Bait (live, cut, prepared) $15,355,207 $7,094,625 $22,449,832
Ice $6,825,826 $1,601,368 $8,427,195
Heating & cooking fuel $914,102 $0 $914,102
Rods, reels & components $31,396,916 $1,654,047 $33,050,963
Lines & leaders $8,491,864 $258,452 $8,750,316
Lures, flies & artificial bait $11,227,640 $919,366 $12,147,006
Hooks, sinkers, other terminal tackle $6,138,693 $141,290 $6,279,983
Tackle boxes $2,385,336 $0 $2,385,336
Creels, strings, landing nets, etc. $1,694,907 $0 $1,694,907
Bait buckets, minnow traps, etc. $2,114,336 $22,728 $2,137,064
Depth finder, fish finders, other electronics $5,202,850 $0 $5,202,850
Other fishing equipment $1,242,500 $0 $1,242,500
Camping gear $3,082,918 $78,595 $3,161,512
Binoculars $998,450 $39,297 $1,037,747
Special fishing clothing, foul weather gear $2,896,017 $446,638 $3,342,655
Bass boats $35,363,486 $0 $35,363,486
Other motorized boats $84,816,105 $0 $84,816,105
Canoes, non-motorized boats $1,814,199 $0 $1,814,199
Boat motors, trailers, hitches, etc. $1,844,553 $0 $1,844,553
Pick-ups, campers, motor homes, etc. $29,397,303 $0 $29,397,303
4x4 and off-road vehicles $5,907,593 $0 $5,907,593
Other special equipment $1,049,117 $196,487 $1,245,604
Taxidermy & processing $1,417,868 $0 $1,417,868
Books & magazines $1,647,182 $45,456 $1,692,638
Dues and contributions $1,048,844 $183,097 $1,231,941
Other misc. fishing expenditures $1,964,831 $0 $1,964,831
Land purchased for fishing $137,850,304 $1,354,497 $139,204,801
Land leased for fishing $4,091,393 $0 $4,091,393
TOTAL $543,020,465 $48,563,861 $591,584,325 * Sample size is small. Use results with caution.

36
Appendix Table C-6: Expenditures for Specific Items by Louisiana
Saltwater Anglers, 2006 RESIDENTS NON-RESIDENTS* TOTAL Sample Size 91 17 108
Food $23,450,544 $6,335,183 $29,785,727
Lodging $4,285,554 $2,647,553 $6,933,106
Airfare and public transportation $0 $0 $0
Private transportation $24,422,807 $7,929,277 $32,352,084
Boat fuel $15,061,669 $4,878,324 $19,939,992
Guides $3,702,423 $7,624,539 $11,326,962
Public land use fees $710,264 $133,987 $844,251
Private land use fees $443,435 $0 $443,435
Boat launching $1,527,145 $603,389 $2,130,534
Boat mooring $10,724,186 $591,544 $11,315,730
Equipment rental $3,736,215 $0 $3,736,215
Bait (live, cut, prepared) $9,066,511 $2,601,251 $11,667,762
Ice $3,700,737 $741,688 $4,442,425
Heating & cooking fuel $367,153 $248,286 $615,439
Rods, reels & components $12,721,311 $227,281 $12,948,592
Lines & leaders $3,718,128 $102,265 $3,820,392
Lures, flies & artificial bait $6,180,099 $240,969 $6,421,069
Hooks, sinkers, other terminal tackle $3,066,466 $41,615 $3,108,081
Tackle boxes $1,356,733 $159,096 $1,515,829
Creels, strings, landing nets, etc. $1,170,438 $0 $1,170,438
Bait buckets, minnow traps, etc. $728,032 $22,728 $750,760
Depth finder, fish finders, other electronics $8,201,518 $0 $8,201,518
Other fishing equipment $1,141,625 $10,224,387 $11,366,012
Camping gear $2,809,586 $78,595 $2,888,181
Binoculars $1,025,783 $39,297 $1,065,080
Special fishing clothing, foul weather gear $2,233,112 $333,962 $2,567,073
Motorized boats $57,719,355 $0 $57,719,355
Canoes, non-motorized boats $1,083,842 $0 $1,083,842
Boat motors, trailers, hitches, etc. $2,028,984 $0 $2,028,984
Pick-ups, campers, motor homes, etc. $40,636,179 $0 $40,636,179
Cabins $0 $73,692,897 $73,692,897
4x4 and off-road vehicles $5,907,593 $0 $5,907,593
Other special equipment $1,380,602 $196,487 $1,577,089
Taxidermy & processing $598,055 $2,272,806 $2,870,861
Books & magazines $693,922 $45,456 $739,378
Dues and contributions $1,435,586 $13,847 $1,449,433
Other misc. fishing expenditures $1,577,781 $681,842 $2,259,623
Land purchased for fishing $7,030,851 $75,102,999 $82,133,849
Land leased for fishing $8,636,290 $0 $8,636,290
TOTAL $274,280,512 $197,811,549 $472,092,061 * Sample size is small. Use results with caution.
37
Appendix Table C-7: Expenditures for Specific Items by Louisiana Wildlife Watchers, 2006
(Non-residential activities only) RESIDENTS* NON-RESIDENTS** TOTAL Sample Size 20 5 25
Food $13,038,262 $13,038,262
Lodging $595,349 $595,349
Public transportation $0 $0
Private transportation $12,239,733 $12,239,733
Guide fees $0 $0
Public land access fees $153,202 $153,202
Private land access fees $0 $0
Equipment rental $33,563 $33,563
Boat fuel $432,737 $432,737
Other boat costs $332,662 $332,662
Heating & cooking fuel $33,563 $33,563
Cameras $15,766,587 $15,766,587
Film & developing $13,842,888 $13,842,888
Binoculars & spotting scopes $5,777,249 $5,777,249
Commercial bird food $21,873,543 $21,873,543
Other bird food $4,946,907 $4,946,907
Food for other wildlife $12,097,939 $12,097,939
Nest boxes, feeders $12,938,858 $12,938,858
Other special equipment $4,134,824 $4,134,824
Tents, tarps $257,932 $257,932
Backpacking equipment $0 $0
Other camping equipment $0 $0
Day packs $9,395,873 $9,395,873
Magazines & books $5,872,969 $5,872,969
Membership dues, contributions $16,825,384 $16,825,384
Other equipment $1,614,969 $1,614,969
Off-road vehicles $10,068,923 $10,068,923
Pickup, camper, motor home $0 $0
Boats $3,011,372 $3,011,372
Trailers, boat accessories $3,103,117 $3,103,117
Cabins $68,255,766 $68,255,766
Other equipment $0 $0
Land purchases $4,282,486 $4,282,486
Land leases $2,426,742 $2,426,742
Plantings $32,791,440 $32,791,440
TOTAL $276,144,841 $276,144,841 * Sample size is small. Use results with caution. ** Sample size is too small to present results.

38
Appendix Table C-8: Estimated Expenditures and Participation Estimates for Recreational Boating in Louisiana, 2006
Boat Type and Size
<15' Power
16'-24' Power
25'-39' Power
40'+ Power
<15' Sail
16'-24' Sail
25'-39' Sail
40'+ Sail Total
Number of boats (thousands) 141.7 167.5 9.0 1.0 0.2 0.6 0.4 < 0.1 320.4
Annual craft spending per boat $458 $1,656 $7,465 $25,299 $489 $1,830 $7,440 $18,329
Total craft spending (million $) $64.9 $277.3 $67.4 $24.4 $0.1 $1.1 $3.0 $0.2 $438.4
Average days per boat 16 25 31 43 19 19 31 46
Total boat days (thousands) 2,307.3 4,194.4 276.9 42.0 3.5 11.8 12.5 0.5 6,848.8
Average trip spending per boat
day $57 $86 $149 $185 $52 $52 $63 $114 Total trip spending per boat
per year $936 $2,148 $4,574 $8,040 $1,010 $1,010 $1,964 $5,205
Total trip spending (million $) $132.6 $359.9 $41.3 $7.8 $0.2 $0.6 $0.8 $0.1 $543.2
Total craft & trip spending per
boat per year $1,394 $3,804 $12,039 $33,339 $1,498 $2,840 $9,404 $23,533 Total craft & trip spending
(millions $) $197.5 $637.2 $108.7 $32.2 $0.3 $1.7 $3.7 $0.3 $981.6 Trip spending/Total craft + trip
spending 67% 56% 38% 24% 67% 36% 21% 22% 55%
Percent of spending by
boaters 20% 65% 11% 3% 0% 0% 0% 0% 100%
Percent of boats 44% 52% 3% 0% 0% 0% 0% 0% 100% Percent of boat days by
boaters 34% 61% 4% 1% 0% 0% 0% 0% 100%

39
Appendix D: Tax Revenue Detail

40
Appendix Table D-1: Freshwater Fishing Tax Impacts from Expenditures by Louisiana Residents in 2006 ($)
Employee
Compensation Proprietary
Income Household
Expenditures Enterprises Indirect Business
Tax Total Federal Government, NonDefense Corporate Profits Tax 8,979,819 8,979,819 Indirect Bus Tax: Custom Duty 1,169,601 1,169,601 Indirect Bus Tax: Excise Taxes 3,732,885 3,732,885 Indirect Bus Tax: Fed NonTaxes 1,267,979 1,267,979 Personal Tax: Estate and Gift Tax 0 Personal Tax: Income Tax 15,377,423 15,377,423 Personal Tax: NonTaxes (Fines- Fees) 0 Social Ins Tax- Employee Contribution 10,298,090 1,858,604 12,156,694 Social Ins Tax- Employer Contribution 10,646,490 10,646,490 20,944,580 1,858,604 15,377,423 8,979,819 6,170,465 53,330,891 State/Local Govt, NonEducation Corporate Profits Tax 832,973 832,973 Dividends 3,550,580 3,550,580 Indirect Bus Tax: Motor Vehicle Lic 213,721 213,721 Indirect Bus Tax: Other Taxes 2,099,545 2,099,545 Indirect Bus Tax: Property Tax 9,334,734 9,334,734 Indirect Bus Tax: S/L NonTaxes 4,572,821 4,572,821 Indirect Bus Tax: Sales Tax 31,318,900 31,318,900 Indirect Bus Tax: Severance Tax 2,309,586 2,309,586 Personal Tax: Estate and Gift Tax 0 Personal Tax: Income Tax 3,731,463 3,731,463 Personal Tax: Motor Vehicle License 173,661 173,661 Personal Tax: NonTaxes (Fines- Fees 93,989 93,989 Personal Tax: Other Tax (Fish/Hunt) 176,338 176,338 Personal Tax: Property Taxes 82,425 82,425 Social Ins Tax- Employee Contribution 149,421 149,421 Social Ins Tax- Employer Contribution 484,708 484,708 634,129 0 4,257,876 4,383,553 49,849,307 59,124,866 Totals 21,578,710 1,858,604 19,635,299 13,363,371 56,019,772 112,455,757

41
Appendix Table D-2: Freshwater Fishing Tax Impacts from Expenditures by Non-Residents in 2006 ($)
Employee
Compensation Proprietary
Income Household
Expenditures Enterprises Indirect Business
Tax Total Federal Government, NonDefense Corporate Profits Tax 567,219 567,219 Indirect Bus Tax: Custom Duty 98,767 98,767 Indirect Bus Tax: Excise Taxes 315,225 315,225 Indirect Bus Tax: Fed NonTaxes 107,075 107,075 Personal Tax: Estate and Gift Tax 0 Personal Tax: Income Tax 1,408,381 1,408,381 Personal Tax: NonTaxes (Fines- Fees 0 Social Ins Tax- Employee Contribution 970,626 146,689 1,117,315 Social Ins Tax- Employer Contribution 1,003,464 1,003,464 1,974,090 146,689 1,408,381 567,219 521,068 4,617,447 State/Local Govt, NonEducation Corporate Profits Tax 52,616 52,616 Dividends 224,276 224,276 Indirect Bus Tax: Motor Vehicle Lic 18,048 18,048 Indirect Bus Tax: Other Taxes 177,297 177,297 Indirect Bus Tax: Property Tax 788,276 788,276 Indirect Bus Tax: S/L NonTaxes 386,154 386,154 Indirect Bus Tax: Sales Tax 2,644,738 2,644,738 Indirect Bus Tax: Severance Tax 195,034 195,034 Personal Tax: Estate and Gift Tax 0 Personal Tax: Income Tax 341,755 341,755 Personal Tax: Motor Vehicle License 15,905 15,905 Personal Tax: NonTaxes (Fines- Fees 8,608 8,608 Personal Tax: Other Tax (Fish/Hunt) 16,151 16,151 Personal Tax: Property Taxes 7,549 7,549 Social Ins Tax- Employee Contribution 14,083 14,083 Social Ins Tax- Employer Contribution 45,685 45,685 59,769 0 389,968 276,892 4,209,547 4,936,175
Totals 2,033,858 146,689 1,798,349 844,111 4,730,614 9,553,622
42
Appendix Table D-3: Saltwater Fishing Tax Impacts from Expenditures by Louisiana Residents in 2006 ($)
Employee
Compensation Proprietary
Income Household
Expenditures Enterprises Indirect Business
Tax Total Federal Government, NonDefense Corporate Profits Tax 3,261,167 3,261,167 Indirect Bus Tax: Custom Duty 472,715 472,715 Indirect Bus Tax: Excise Taxes 1,508,712 1,508,712 Indirect Bus Tax: Fed NonTaxes 512,476 512,476 Personal Tax: Estate and Gift Tax 0 Personal Tax: Income Tax 7,979,274 7,979,274 Personal Tax: NonTaxes (Fines- Fees 0 Social Ins Tax- Employee Contribution 5,634,025 715,429 6,349,454 Social Ins Tax- Employer Contribution 5,824,633 5,824,633 11,458,658 715,429 7,979,274 3,261,167 2,493,904 25,908,433 State/Local Govt, NonEducation Corporate Profits Tax 302,508 302,508 Dividends 1,289,451 1,289,451 Indirect Bus Tax: Motor Vehicle Lic 86,379 86,379 Indirect Bus Tax: Other Taxes 848,569 848,569 Indirect Bus Tax: Property Tax 3,772,800 3,772,800 Indirect Bus Tax: S/L NonTaxes 1,848,188 1,848,188 Indirect Bus Tax: Sales Tax 12,658,095 12,658,095 Indirect Bus Tax: Severance Tax 933,461 933,461 Personal Tax: Estate and Gift Tax 0 Personal Tax: Income Tax 1,936,237 1,936,237 Personal Tax: Motor Vehicle License 90,113 90,113 Personal Tax: NonTaxes (Fines- Fees 48,770 48,770 Personal Tax: Other Tax (Fish/Hunt) 91,504 91,504 Personal Tax: Property Taxes 42,768 42,768 Social Ins Tax- Employee Contribution 81,748 81,748 Social Ins Tax- Employer Contribution 265,181 265,181 346,929 0 2,209,392 1,591,958 20,147,491 24,295,770
Totals 11,805,587 715,429 10,188,666 4,853,126 22,641,395 50,204,202

43
Appendix Table D-4: Saltwater Fishing Tax Impacts from Expenditures by Non-Residents in 2006 ($)
Employee
Compensation Proprietary
Income Household
Expenditures Enterprises Indirect Business
Tax Total Federal Government, NonDefense Corporate Profits Tax 2,201,892 2,201,892 Indirect Bus Tax: Custom Duty 257,926 257,926 Indirect Bus Tax: Excise Taxes 823,194 823,194 Indirect Bus Tax: Fed NonTaxes 279,621 279,621 Personal Tax: Estate and Gift Tax 0 Personal Tax: Income Tax 3,496,792 3,496,792 Personal Tax: NonTaxes (Fines- Fees 0 Social Ins Tax- Employee Contribution 2,252,053 499,563 2,751,616 Social Ins Tax- Employer Contribution 2,328,243 2,328,243 4,580,296 499,563 3,496,792 2,201,892 1,360,740 12,139,284 State/Local Govt, NonEducation Corporate Profits Tax 204,249 204,249 Dividends 870,618 870,618 Indirect Bus Tax: Motor Vehicle Lic 47,131 47,131 Indirect Bus Tax: Other Taxes 463,002 463,002 Indirect Bus Tax: Property Tax 2,058,540 2,058,540 Indirect Bus Tax: S/L NonTaxes 1,008,420 1,008,420 Indirect Bus Tax: Sales Tax 6,906,592 6,906,592 Indirect Bus Tax: Severance Tax 509,321 509,321 Personal Tax: Estate and Gift Tax 0 Personal Tax: Income Tax 848,527 848,527 Personal Tax: Motor Vehicle License 39,490 39,490 Personal Tax: NonTaxes (Fines- Fees 21,373 21,373 Personal Tax: Other Tax (Fish/Hunt) 40,098 40,098 Personal Tax: Property Taxes 18,744 18,744 Social Ins Tax- Employee Contribution 32,676 32,676 Social Ins Tax- Employer Contribution 105,999 105,999 138,676 0 968,232 1,074,867 10,993,006 13,174,780 Totals 4,718,972 499,563 4,465,024 3,276,759 12,353,746 25,314,064

44
Appendix Table D-5: Hunting Tax Impacts from Expenditures by Louisiana Residents in 2006 ($)
Employee
Compensation Proprietary
Income Household
Expenditures Enterprises Indirect
Business Tax Total Federal Government, NonDefense Corporate Profits Tax 7,582,874 7,582,874 Indirect Bus Tax: Custom Duty 1,119,432 1,119,432 Indirect Bus Tax: Excise Taxes 3,572,768 3,572,768 Indirect Bus Tax: Fed NonTaxes 1,213,590 1,213,590 Personal Tax: Estate and Gift Tax 0 Personal Tax: Income Tax 17,383,851 17,383,851 Personal Tax: NonTaxes (Fines- Fees 0 Social Ins Tax- Employee Contribution 11,728,347 2,026,881 13,755,228 Social Ins Tax- Employer Contribution 12,125,135 12,125,135 23,853,482 2,026,881 17,383,851 7,582,874 5,905,791 56,752,879 State/Local Govt, NonEducation Corporate Profits Tax 703,391 703,391 Dividends 2,998,235 2,998,235 Indirect Bus Tax: Motor Vehicle Lic 204,553 204,553 Indirect Bus Tax: Other Taxes 2,009,488 2,009,488 Indirect Bus Tax: Property Tax 8,934,333 8,934,333 Indirect Bus Tax: S/L NonTaxes 4,376,676 4,376,676 Indirect Bus Tax: Sales Tax 29,975,517 29,975,517 Indirect Bus Tax: Severance Tax 2,210,520 2,210,520 Personal Tax: Estate and Gift Tax 0 Personal Tax: Income Tax 4,218,340 4,218,340 Personal Tax: Motor Vehicle License 196,321 196,321 Personal Tax: NonTaxes (Fines- Fees 106,252 106,252 Personal Tax: Other Tax (Fish/Hunt) 199,348 199,348 Personal Tax: Property Taxes 93,179 93,179 Social Ins Tax- Employee Contribution 170,174 170,174 Social Ins Tax- Employer Contribution 552,027 552,027 722,201 0 4,813,439 3,701,626 47,711,087 56,948,353
Totals 24,575,683 2,026,881 22,197,289 11,284,500 53,616,878 113,701,232

45
Appendix Table D-6: Hunting Tax Impacts from Expenditures by Non-Residents in 2006 ($)
Employee
Compensation Proprietary Income Household
Expenditures Enterprises Indirect Business
Tax Total Federal Government, NonDefense Corporate Profits Tax 854,964 854,964 Indirect Bus Tax: Custom Duty 101,887 101,887 Indirect Bus Tax: Excise Taxes 325,180 325,180 Indirect Bus Tax: Fed NonTaxes 110,457 110,457 Personal Tax: Estate and Gift Tax 0 Personal Tax: Income Tax 1,703,493 1,703,493 Personal Tax: NonTaxes (Fines- Fees 0 Social Ins Tax- Employee Contribution 1,114,208 228,704 1,342,912 Social Ins Tax- Employer Contribution 1,151,904 1,151,904 2,266,112 228,704 1,703,493 854,964 537,523 5,590,796 State/Local Govt, NonEducation Corporate Profits Tax 79,307 79,307 Dividends 338,049 338,049 Indirect Bus Tax: Motor Vehicle Lic 18,618 18,618 Indirect Bus Tax: Other Taxes 182,896 182,896 Indirect Bus Tax: Property Tax 813,170 813,170 Indirect Bus Tax: S/L NonTaxes 398,349 398,349 Indirect Bus Tax: Sales Tax 2,728,261 2,728,261 Indirect Bus Tax: Severance Tax 201,193 201,193 Personal Tax: Estate and Gift Tax 0 Personal Tax: Income Tax 413,367 413,367 Personal Tax: Motor Vehicle License 19,238 19,238 Personal Tax: NonTaxes (Fines- Fees 10,412 10,412 Personal Tax: Other Tax (Fish/Hunt) 19,534 19,534 Personal Tax: Property Taxes 9,131 9,131 Social Ins Tax- Employee Contribution 16,167 16,167 Social Ins Tax- Employer Contribution 52,443 52,443 68,610 0 471,683 417,356 4,342,487 5,300,135
Totals 2,334,722 228,704 2,175,176 1,272,320 4,880,010 10,890,932

46
Appendix Table D-7: Wildlife Watching Tax Impacts from Expenditures by Louisiana Residents in 2006 ($)
Employee
Compensation Proprietary
Income Household
Expenditures Enterprises Indirect
Business Tax Total Federal Government, NonDefense Corporate Profits Tax 4,150,900 4,150,900 Indirect Bus Tax: Custom Duty 524,358 524,358 Indirect Bus Tax: Excise Taxes 1,673,534 1,673,534 Indirect Bus Tax: Fed NonTaxes 568,463 568,463 Personal Tax: Estate and Gift Tax 0 Personal Tax: Income Tax 8,638,583 8,638,583 Personal Tax: NonTaxes (Fines- Fees 0 Social Ins Tax- Employee Contribution 5,754,467 1,070,430 6,824,896 Social Ins Tax- Employer Contribution 5,949,149 5,949,149 11,703,616 1,070,430 8,638,583 4,150,900 2,766,354 28,329,883 State/Local Govt, NonEducation Corporate Profits Tax 385,040 385,040 Dividends 1,641,247 1,641,247 Indirect Bus Tax: Motor Vehicle Lic 95,816 95,816 Indirect Bus Tax: Other Taxes 941,272 941,272 Indirect Bus Tax: Property Tax 4,184,965 4,184,965 Indirect Bus Tax: S/L NonTaxes 2,050,096 2,050,096 Indirect Bus Tax: Sales Tax 14,040,947 14,040,947 Indirect Bus Tax: Severance Tax 1,035,438 1,035,438 Personal Tax: Estate and Gift Tax 0 Personal Tax: Income Tax 2,096,227 2,096,227 Personal Tax: Motor Vehicle License 97,558 97,558 Personal Tax: NonTaxes (Fines- Fees 52,800 52,800 Personal Tax: Other Tax (Fish/Hunt) 99,061 99,061 Personal Tax: Property Taxes 46,304 46,304 Social Ins Tax- Employee Contribution 83,495 83,495 Social Ins Tax- Employer Contribution 270,850 270,850 354,345 0 2,391,950 2,026,287 22,348,533 27,121,114
Totals 12,057,961 1,070,430 11,030,533 6,177,186 25,114,887 55,450,997

47
Appendix Table D-8: Wildlife Watching Tax Impacts from Expenditures by Non-Residents in 2006 ($)
Employee
Compensation Proprietary
Income Household
Expenditures Enterprises Indirect
Business Tax Total Federal Government, NonDefense Corporate Profits Tax 486,133 486,133 Indirect Bus Tax: Custom Duty 73,083 73,083 Indirect Bus Tax: Excise Taxes 233,249 233,249 Indirect Bus Tax: Fed NonTaxes 79,230 79,230 Personal Tax: Estate and Gift Tax 0 Personal Tax: Income Tax 1,228,731 1,228,731 Personal Tax: NonTaxes (Fines- Fees 0 Social Ins Tax- Employee Contribution 876,162 102,815 978,977 Social Ins Tax- Employer Contribution 905,804 905,804 1,781,966 102,815 1,228,731 486,133 385,561 3,985,206 State/Local Govt, NonEducation Corporate Profits Tax 45,094 45,094 Dividends 192,215 192,215 Indirect Bus Tax: Motor Vehicle Lic 13,354 13,354 Indirect Bus Tax: Other Taxes 131,190 131,190 Indirect Bus Tax: Property Tax 583,281 583,281 Indirect Bus Tax: S/L NonTaxes 285,733 285,733 Indirect Bus Tax: Sales Tax 1,956,961 1,956,961 Indirect Bus Tax: Severance Tax 144,314 144,314 Personal Tax: Estate and Gift Tax 0 Personal Tax: Income Tax 298,162 298,162 Personal Tax: Motor Vehicle License 13,877 13,877 Personal Tax: NonTaxes (Fines- Fees 7,510 7,510 Personal Tax: Other Tax (Fish/Hunt) 14,091 14,091 Personal Tax: Property Taxes 6,586 6,586 Social Ins Tax- Employee Contribution 12,713 12,713 Social Ins Tax- Employer Contribution 41,239 41,239 53,952 0 340,225 237,309 3,114,834 3,746,319
Totals 1,835,917 102,815 1,568,956 723,442 3,500,395 7,731,526

48
Page intentionally left blank
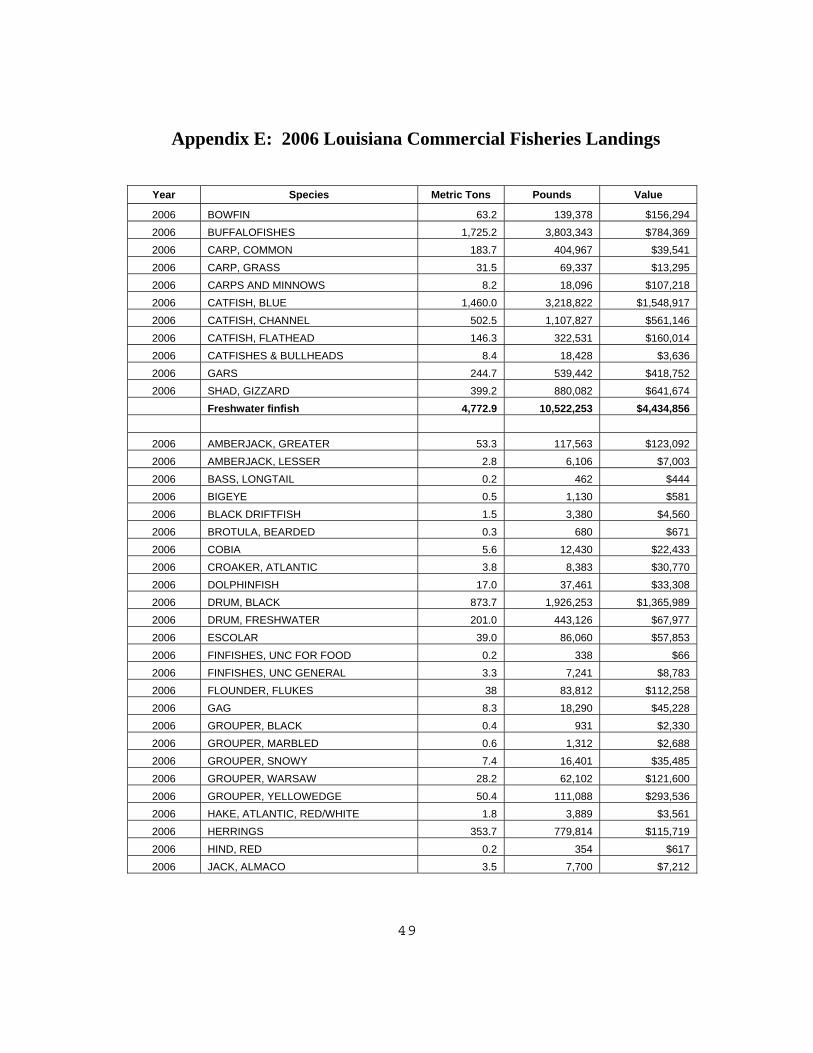
49
Appendix E: 2006 Louisiana Commercial Fisheries Landings
Year Species Metric Tons Pounds Value
2006 BOWFIN 63.2 139,378 $156,294 2006 BUFFALOFISHES 1,725.2 3,803,343 $784,369 2006 CARP, COMMON 183.7 404,967 $39,541 2006 CARP, GRASS 31.5 69,337 $13,295 2006 CARPS AND MINNOWS 8.2 18,096 $107,218 2006 CATFISH, BLUE 1,460.0 3,218,822 $1,548,917 2006 CATFISH, CHANNEL 502.5 1,107,827 $561,146 2006 CATFISH, FLATHEAD 146.3 322,531 $160,014 2006 CATFISHES & BULLHEADS 8.4 18,428 $3,636 2006 GARS 244.7 539,442 $418,752 2006 SHAD, GIZZARD 399.2 880,082 $641,674
Freshwater finfish 4,772.9 10,522,253 $4,434,856
2006 AMBERJACK, GREATER 53.3 117,563 $123,092 2006 AMBERJACK, LESSER 2.8 6,106 $7,003 2006 BASS, LONGTAIL 0.2 462 $444 2006 BIGEYE 0.5 1,130 $581 2006 BLACK DRIFTFISH 1.5 3,380 $4,560 2006 BROTULA, BEARDED 0.3 680 $671 2006 COBIA 5.6 12,430 $22,433 2006 CROAKER, ATLANTIC 3.8 8,383 $30,770 2006 DOLPHINFISH 17.0 37,461 $33,308 2006 DRUM, BLACK 873.7 1,926,253 $1,365,989 2006 DRUM, FRESHWATER 201.0 443,126 $67,977 2006 ESCOLAR 39.0 86,060 $57,853 2006 FINFISHES, UNC FOR FOOD 0.2 338 $66 2006 FINFISHES, UNC GENERAL 3.3 7,241 $8,783 2006 FLOUNDER, FLUKES 38 83,812 $112,258 2006 GAG 8.3 18,290 $45,228 2006 GROUPER, BLACK 0.4 931 $2,330 2006 GROUPER, MARBLED 0.6 1,312 $2,688 2006 GROUPER, SNOWY 7.4 16,401 $35,485 2006 GROUPER, WARSAW 28.2 62,102 $121,600 2006 GROUPER, YELLOWEDGE 50.4 111,088 $293,536 2006 HAKE, ATLANTIC, RED/WHITE 1.8 3,889 $3,561 2006 HERRINGS 353.7 779,814 $115,719 2006 HIND, RED 0.2 354 $617 2006 JACK, ALMACO 3.5 7,700 $7,212

50
Appendix E: 2006 Louisiana Commercial Fisheries Landings (cont.)
Year Species Metric Tons Pounds Value
2006 JACK, BAR 5.7 12,485 $8,389 2006 KING WHITING 4.3 9,559 $4,382 2006 MACKEREL, KING 440.4 970,817 $1,112,246 2006 MACKEREL, SPANISH 3.4 7,476 $5,275 2006 MENHADEN 312,807.50 689,615,455 $33,547,127 2006 MULLET, STRIPED (LIZA) 11.6 25,652 $4,827 2006 OILFISH 2.6 5,762 $4,285 2006 POMPANO, FLORIDA 12.2 26,955 $89,084 2006 PORGY, RED 5.2 11,440 $10,349 2006 PORGY, WHITEBONE 0.2 521 $292 2006 RUNNER, BLUE 7.4 16,391 $8,766 2006 SCAMP 15.5 34,223 $86,896 2006 SCORPIONFISH, SPINYCHEEK 0.2 550 $558 2006 SEATROUT, SAND 7.8 17,213 $16,022 2006 SEATROUT, SPOTTED 0.9 2,042 $4,068 2006 SHARK, BLACKTIP 229 504,780 $140,622 2006 SHARK, SHORTFIN MAKO 2.3 5,138 $3,718 2006 SHARKS 14.5 31,859 $230,274 2006 SHEEPSHEAD 256.4 565,331 $194,652 2006 SNAPPER, BLACK 1.2 2,736 $5,097 2006 SNAPPER, GRAY 13.5 29,666 $61,175 2006 SNAPPER, LANE 7.9 17,325 $33,977 2006 SNAPPER, QUEEN 0.1 173 $239 2006 SNAPPER, RED 747.7 1,648,439 $4,459,621 2006 SNAPPER, SILK 1.5 3,213 $5,740 2006 SNAPPER, VERMILION 165.6 365,082 $762,078 2006 SNAPPER, YELLOWTAIL 0 92 $149 2006 SWORDFISH 208.8 460,345 $904,375 2006 TILEFISH 0.2 511 $450 2006 TILEFISH, GOLDFACE 13 28,710 $41,311 2006 TRIGGERFISH, GRAY 7.4 16,228 $17,339 2006 TRIPLETAIL 1.7 3,780 $3,689 2006 TUNA, ALBACORE 5.1 11,274 $3,963 2006 TUNA, BIGEYE 24.6 54,267 $186,044 2006 TUNA, BLACKFIN 1.9 4,247 $1,311 2006 TUNA, BLUEFIN 14.4 31,767 $123,139 2006 TUNA, LITTLE TUNNY 4.8 10,493 $4,047 2006 TUNA, YELLOWFIN 921.2 2,030,948 $6,721,270 2006 WAHOO 45.2 99,638 $89,126
Saltwater finfish 317,707.6 700,418,889 $51,359,736

51
Appendix E: 2006 Louisiana Commercial Fisheries Landings (cont.)
Year Species Metric Tons Pounds Value
2006 CRAYFISHES OR CRAWFISHES 665.9 1,468,056 $1,289,201 2006 TURTLE, SLIDERS 1.3 2,846 $1,752 2006 TURTLE, SNAPPING 0.5 1,185 $2,233 2006 TURTLE, SOFT-SHELL 0.4 957 $961
Freshwater shellfish and turtles 668.1 1,473,044 $1,294,147
2006 CRAB, BLUE 23,866.6 52,616,202 $32,677,480 2006 CRAB, BLUE, PEELER 53.6 118,235 $271,305 2006 CRAB, BLUE, SOFT 10.6 23,468 $131,109 2006 CRAB, FLORIDA STONE CLAWS 0.7 1,635 $4,183 2006 OYSTER, EASTERN 5,156.40 11,367,733 $35,851,947 2006 SHELLFISH 1.7 3,714 $1,816 2006 SHRIMP, BROWN 21,229.70 46,802,937 $37,781,737 2006 SHRIMP, PINK 7 15,489 $18,015 2006 SHRIMP, SEABOB 408.1 899,773 $363,141 2006 SHRIMP, WHITE 39,569.90 87,235,883 $106,499,545 2006 SQUIDS 0.2 482 $210
Saltwater shellfish 90,304.5 199,085,551 $213,600,488 Totals – All Species 413,453.60 911,499,737 $270,689,227