the economic and social conditions of pakistani basmati
TRANSCRIPT

The Economic and Social Conditions of Pakistani Basmati Rice Farmers
Sofia Valter
Degree project • (30 hp) Swedish University of Agricultural Sciences, SLU Department of Economics Master’s Programme Sustainable Food Systems Uppsala, 2020


iiii
Sofia Valter
Supervisor: Örjan Bartholdson, Swedish University of Agricultural Sciences, Department of Rural Development
Examiner: Mats Gyllin, Swedish University of Agricultural Sciences, Department of Work Science, Business Economics and Environmental Psychology
Credits: 30 hp Level: Advanced level, A2E Course title: Master thesis in Food Science Course code: EX0875 Programme/education: Sustainable Food Systems Course coordinating dept: Department of Economics Place of publication: Uppsala Year of publication: 2020 Keywords: Food security, Household, Income, Livelihood, Pakistan, Punjab, Small Scale
Farmer
Swedish University of Agricultural Sciences Faculty of Natural Resources and Agricultural Sciences Department of Rural Development
The Economic and Social Conditions of Pakistani Basmati Rice Farmers

iii
Summary In most developing countries the lack of resources, high costs, and limited diversified income sources are among the major factors that affect small-scale farming households' ability to earn an income, reproduce and be food secure. By using a strategy of income diversification and the use of cash crops in agricultural production can be a resourceful way for a sustainable livelihood and a reduced risk of income variability for small-scale farmers. This study aims to investigate the status of small-scale farming households' economic conditions for earning an income from agricultural production to obtain food security. Including the determinants of basmati rice production for farmers located in the region of Punjab in rural Pakistan. The study is based on a household survey of 152 households conducted by the international help-organization Oxfam in Punjab, Pakistan. The result showed that agricultural production is the main source of income for farmers. The farmers are growing various crops, raising different kinds of livestock, taking seasonal work, providing other farm-related activities, that result in a higher ability to become food secure. The main activity for the male farmers was agricultural and for the female unpaid domestic work. The women spend 4 hours (per day) more on unpaid work than the male farmers spend on agricultural work. 3 percent of the farmers within this study base all their income on basmati rice production. This concludes a low income and with a low purchasing power, a large household size with several individuals dependent in the household. The farmers that only produce basmati rice are less likely to become food secure than the farmers that diversify agricultural production. When it comes to reaching food security for the small-scale farmers of Punjab, Pakistan, the result specifies that for the farmers that based 50 percent or less on basmati-rice production were more likely to be food secure than the farmers that based all of their income from this source. The diversification of farmers' income from agricultural production, several cattle, and the aspect of female household members undertaking paid work made the farmers more secure in case of fluctuation in the market and in case of spoiled harvest. Keywords: Food security, Household, Income, Livelihood, Pakistan, Punjab, Small Scale Farmer

iv
Sammanfattning Jordbruket är en grundläggande inkomstkälla för småskaliga bönder i utvecklingsländer och har en nyckelroll för att trygga böndernas livsmedelsförsörjning och generera inkomst. Men produktionen räcker sällan för att undvika hunger då begränsade resurser och höga utgifter påverkar möjligheten att försörja hushållet. Dessa faktorer påverkar böndernas förmåga att upprätthålla en hållbar livsstil. Denna studie syftar till att undersöka levnadsförhållandena hos småskaliga bönder från regionen Punjab i Pakistan och deras ekonomiska förutsättning att skapa sig en inkomst från basmatirisproduktion. Studien är baserad på en enkätundersökning av 152 hushåll utfärdad av den internationella hjälporganisationen Oxfam under 2019. Resultatet från denna granskning indikerade att 60 procent av de småskaliga bönderna i Punjab, Pakistan baserade 50 procent eller mindre av den totala inkomsten från basmatirisproduktionen. Bönderna producerade i snitt 5 ton basmatiris per säsong på 2 hektar mark. Riset såldes i snitt för 0,22 euros per kilo och kostnaden för att producera basmatiris var i genomsnitt 570 euro. Nettoinkomsten från basmatirisproduktion resulterade därav i 524 euro per hushåll och år, vilket motsvarar en sjättedel av medelinkomsten i landet. Studiens resultat visar att bönderna odlar fler grödor utöver basmatiris, samt att de föder upp boskap, tar säsongsarbete, samt tillhandahåller andra jordbruksrelaterade verksamheter. Diversifieringen av inkomstkällor resulterar i en tryggare ekonomisk situation för bönderna. 3 procent av bönderna i denna studie baserade hushållets totala inkomst från basmatirisproduktionen. Slutsatsen till denna studie är att de bönder som diversifierar sina inkomstkällor har mindre risk att hamna i fattigdom, hunger och undernäring.

v
Table of Content
1. INTRODUCTION ............................................................................................. 1
1.1. OBJECTIVE AND RESEARCH QUESTIONS .......................................................... 2 1.2. DELIMITATIONS .............................................................................................. 2 1.3. STRUCTURE OF STUDY .................................................................................... 4
2. ANALYTICAL PERSPECTIVES AND CONCEPTS ................................... 5
2.1. SMALL-SCALE FARMERS IN A GLOBAL FOOD SYSTEM ................................... 5 2.2. KEY CONCEPTS ............................................................................................... 6
2.2.1. Small-scale farming ................................................................................ 6 2.2.2. Households .............................................................................................. 7 2.2.3. Livelihood ............................................................................................... 7 2.2.4. Diversification ......................................................................................... 8 2.2.5. Cash-Crops .............................................................................................. 8 2.2.6. Food security ........................................................................................... 8
3. METHOD ......................................................................................................... 10
3.1. APPROACH .................................................................................................... 10 3.2. QUANTITATIVE RESEARCH ............................................................................ 10 3.3. ETHICAL CONSIDERATIONS ........................................................................... 13 3.4. RELIABILITY AND VALIDITY ......................................................................... 13
4 BACKGROUND FOR THE EMPIRICAL STUDY ..................................... 15
4.1. FOOD SECURITY FOR SMALL-SCALE FARMERS IN PUNJAB ........................... 19
5. EMPIRICAL FINDINGS ............................................................................... 21
5.1. AGE & GENDER ............................................................................................. 21 5.2. MAIN ACTIVITIES .......................................................................................... 22 5.3. DAILY ACTIVITIES ......................................................................................... 23 5.4. INCOME FROM BASMATI RICE PRODUCTION .................................................. 24
6. ANALYSIS AND DISCUSSION .................................................................... 29
7. CONCLUSION ................................................................................................ 32
REFERENCES ............................................................................................................ ACKNOWLEDGEMENTS ............................................................................................ APPENDIX 1. PAKISTAN PRODUCER SURVEY .......................................................... APPENDIX 2. SPREADSHEAT SURVEY ANSWERS ..................................................... APPENDIX 3. SURVEY RESULT ON EDUCATION ........................................................

vi
List of tables
Table 1. Structure of the study ................................................................................. 4
Table 2. Mean and median production, cost and selling price for 2018 harvest ... 26
Table 3. Mean and median income information for 2018 harvest ......................... 27
vii
List of figures
Figure 1. Household age-gender pyramid .............................................................. 21
Figure 2. Main activity of respondents .................................................................. 22
Figure 3. Mean number of hours per day pent on primary activity ....................... 23
Figure 4. Income from basmati production ........................................................... 24
Figure 5. Scatter plot on volume of basmati rice production ................................. 25
Figure 6. Scatter plot on land size .......................................................................... 25
Figure 7. Scatter plot on cost of basmati rice production ...................................... 26
Figure 8. Scatter plot on price received per kilogram of rice ................................ 26

Abbreviations Abbreviation Page
GDP Gross Domestic Product 1 FAO The Food and Agricultural Organization of United Nations 6 SDG Sustainable Development Goals 6 UN United Nations 6 NGO Non-Governmental Organization 11

1
1. Introduction In a range of food-producing developing countries, agricultural production for small-scale farmers does not provide enough income to achieve food security and reproduce the households economically (Rapsomanikis 2015). Still, agriculture remains the main source of food and income for 44 percent of the rural households in Pakistan (Ishaq & Memon 2016) and amounts to 25 percent of the national gross domestic product GDP in the country (CIA 2019). However, with a growing population in Pakistan, higher food demand and reduced crop productivity due to climate change increased temperatures and extreme weather conditions, the pressure on an already distressed food system in the country, have resulted in compelled food security issues for small-scale farmers in rural Pakistan (Abdullah et al. 2017). Several studies have been conducted to determinant the economic factors that affect income, food security and the livelihood of small-scale farming households in Punjab, Pakistan (Ghafoor et al. 2010; Asghar & Muhammad 2013; Abbas, Mirza & Afzal 2017; Nazli, Haider & Hamza 2012; Mughal 2018). The agricultural production amount to 79 – 85 percent of the farmers' total income (Ghafoor et al. 2010). The major food crops produced in Pakistan are wheat, rice, cotton, and maize (Shahzadi et al. 2018) and basmati rice production is particularly common within the highly producing province Punjab. This province produces 88 percent of the country’s entire basmati rice production (Grover, Singh & Kumar 2014). Within Punjab, 23 percent of the small-scale farmers are food insecure (Asghar & Muhammad 2013). Food security and agriculture are closely linked as rural households generally depend on food crop production, access to local markets, and livestock for their consumption. Therefore, the importance of the farmers’ production for their own consumption is crucial for the food security of the rural households as well as their incomes (Kang & Mahajan 2006). Small-scale rural farmers face many problems, including price volatility on the agricultural products for domestic sale, low bargaining power on produce, changing government policies in favour of large farmers, and lack of shortage of inputs (Ghafoor et al. 2010). The farmers are therefore repeatedly trapped in a vicious cycle of poverty due to low income from agricultural production, a lack of knowledge on savings and lack of economic

2
power leave them in a weak position to invest in desired farming activities as well as bargaining power and competitiveness with larger agricultural productions (ibid). Several small-scale farmers are adopting a method of income diversification, where farmers grow various crops, raise different kinds of livestock, take seasonal work, provide other farm-related activities, perform wage labor and work in the local community with handcraft or are forced into labor migration (Javed et al. 2015). However, there is a gap in the current literature concerning the impact that the production of distinct crops has on the rural households’ aggregated income. Therefore, this study aims at exploring the effect of income diversification on the households, as well as specifically the economics of basmati rice production on the households of small-scale farmers in Punjab, Pakistan. 1.1. Objective and research questions This research intends to explore the economic conditions of small-scale farmer households in Punjab, Pakistan whose main production is basmati rice. In particular, the study intends to focus on the economic impacts of basmati rice production on rural households in the region of Punjab, Pakistan. The following questions has been formulated to accomplish the mentioned objectives:
• How do small-scale farmers in Punjab, Pakistan support and sustain their households economically?
• How much of their livelihood is covered by basmati rice production and how much is covered by income from other sources?
• What is the income contribution of basmati rice production to the food security of small-scale farmers in the region of Punjab?
1.2. Delimitations This study is part of a collaboration with the international help-organization Oxfam. Through this partnership, this study could take part in a baseline survey that was implemented by Oxfam Pakistan during 2019. Because of distance, security reasons, and language gap, there was no cross-checking of the research approach. However, information about the data collection, processes, and methods used was provided by close collaboration with Oxfam Sweden. The present study is limited to the Punjab province of Pakistan, due to the importance of basmati rice production within the region. The data collected through Oxfam provided 200 survey answers, but due to set definitions on what a small-

3
scale farm is, the top limit of 5 hectares of land, resulting in a survey sample of 151 respondents. The survey sample size is relatively small compared to the total rural populations of the province. Hence, conclusions drawn from this study cannot be generalized but can provide insight into the livelihoods for farmers in the province. The survey is solely based on information about the harvest of 2018; thus, it does not consider alterations that may occur in income dependent on each year’s harvest. It is assumed that the reported costs of production also include any use of external hired labor. However, we have no data to estimate the extent to which external hired labor is used, nor to be able to make estimates about their wage levels. It is assumed that any use of household labor is included in the calculation of net household income. We have no data to estimate the number of workers among each household, nor to estimate the division of household income among household members. No allowance has been made for any in-kind farm income. The costs of production reported by respondents are assumed to include all operational costs of production for the season and to include any tax deductions. It is, however, possible that some of the reported costs for the 2018 season may have included capital investments, and/or that relevant taxes may not have been included. Maunds have been converted to kg based on a ratio of 1:37.5, and an average Pakistani Rupee to Euro exchange rate for 2020 has been used. Alternative conversions (such as a 1:40 ratio, or exchange rates based on the time of sales) would have led to slightly different results. This research has explored the economic conditions and the background of the empirical study intends to present the economic and social context of the basmati smallholders, particularly the determinants of their livelihood opportunities. In order to obtain a more holistic understanding of the rural households’ economic and social livelihood strategies it would be necessary to do an ethnographic field study. I was unable to conduct such as study but recommend it for future research.

4
1.3. Structure of study To finalize the introduction, here is a summary about the upcoming structure of the remaining part of the paper and the structure of the study presented in table 1. Chapter two deals with a review of the analytical perspectives and concepts used for the study. This includes key concepts and definitions on small-scale farmers, livelihoods, households and food security in developing countries. The third chapter deals with a description of the research methodology, which includes data source, method of analysis. Chapter four covers the background of the empirical study, containing information of the province of Punjab, Pakistan. The final parts of the paper incorporate, results of the study are discussed in chapter five, followed by analysis, discussion and conclusion, as well as a suggestion for future research.
Table 1. Structure of the study

5
2. Analytical Perspectives and Concepts In the following chapter a brief introduction to the global food system will be presented, including the significance of small-scale farmers within the system and their economic positions and ability to receive an income to strive for food security.
2.1. Small-Scale Farmers in a Global Food System The global food system is an economic railroad, with trade across borders and regulated by both national and transnational regulations, an assemblage of multiple elements, including inputs, outputs, and relations between the nodes of the commodity food chain (HLPE 2019). Distinct groups of actors are involved in every stage of the commodity chain, from food production to consumption. The chain stretches from giant supermarkets and wholesale companies in the global north, earning billions, while fragmented small-scale farmers in developing countries of the global south often are barely able to earn a living and reproduce their households (Willoughby & Gore 2018). Small-scale farmers in developing countries are food insecure and approximately 3 billion people are struggling to meet their basic needs (Howton 2018). The food system is not simply about food, but about the politics of food relations (McMichael 2013). It is an economic system reliant on international development, poverty reduction, global market expansion, agricultural trade liberalization, corporate concentration, and financialization (Clapp 2016). Through the use of global free trade agreements, the corporation has in recent times moved productions to develop countries, with increased access to cheap labor (Christoplos & Pain 2015). However, global agricultural production is essential for people and prosperity (HLPE 2019). It is largely driven by economic growth with an increasing need for agricultural products for direct human consumption, as animal feed and as ingredients in consumer goods (ibid). Food production has become increasingly globalized and McMichael (2013) divides it into distinct historical eras. This study will focus on the specific era, labelled ‘corporate food regime’ (ibid). I draw on the concept of corporate food regime to be able to describe and analyse the position of basmati production within the basmati rice commodity chain (McMichael 2013). This particular food regime is dependent on corporations embedding and influencing food production and distribution through markets and

6
corporations (ibid). This has resulted in that more than half of the 100 largest economies today are made up of multinational corporations (Mark-Herbert & von Schantz 2007). Furthermore, the asymmetrical economic position of basmati producing small-scale farmers create large difficulties for them to of negotiate living prices for their produce, as it is set by through supply and demand of basmati rice on a global rice market. The farmers are therefore often contacted by middlemen to handle the business, but frequently affects the final income of the farmer (Clapp 2016). However, to reduce global inequality, the world trade organization established a goal to reduce poverty and increase rural and economic development (WTO 2020). Part of this development is the Sustainable Development Goals (SDG) of the United Nation (UN) 1; No Poverty, 2; Zero Hunger, 8; Decent Work and Economic Growth and goal 10; Reduced Inequality are all connected to food security, increased income and better livelihoods of small-scale farmers around the world (UN 2019). 2.2. Key concepts The key concepts used in this research are defined and adapted for the upcoming sections of this research. 2.2.1. Small-scale farming Small-scale agricultural farming can be defined in many ways (Khalil et al. 2017). Various criteria to what a small-scale farm depend on minimum size limits, area of holding and arable land, the quantity of output produced and sold, the value of agricultural production, and quantity of labor used (FAO 2017). A small-scale farm is either based on family production, meaning that families are working on the farm, or there is hired labor working on the farm. The definitions used for small-scale farmers in the United Nations Sustainable Development Goals are based on several factors and indicators for identifying small-scale farming. The reasoning concludes that small-scale farms need to be independent in income and labor from food-producing productivity (ibid). For agricultural surveys and/or integrated household surveys the positive aspects of measuring the land size are the availability and that it is measurable (FAO 2017). It is also widely used in literature for statistics and economic analyses. The adverse of using land size as a measurement for small-scale farmers is that it does not account for the quality of recourses, disparities across regions and not include the socio-economic and agro-ecological characteristics of land distribution (ibid). Previous research is done in the area c.f. Mughal 2014; Rana 2008; Ghafoor et al. 2010; Abid et al. 2011; Abbas et al. 2017; Nazli et al. 2012 uses different declarations on the limitations and characteristics of what a small-scale farm should be. The studies show the physical size is far more popular than

7
economic size among the criteria used for identifying smallholders. The studies include a territory of 25 acres (10 hectares) or less. According to the FAO Glossary of Smallholding Definitions, the limitations for a small-scale farm should be if the farmer manages an area of fewer than 12,4 acres (5 hectares) of the cultivated area without irrigated land (FAO 2017). Given the criteria reviewed in the previous section, a workable definition to be used in the monitoring framework for this research should be based on a combination of the physical size of the farm and that it is only the household members working on the farm with a limitation of 12,4 acres of land. 2.2.2. Households A household may either consist of a single person household or several persons, sometimes including old and young family members, as well as close relatives (HIES 2016). A single person household is one where the individual makes provision for his/her food and other essentials of living, without combining it with any other person and without any usual place of residence elsewhere. A multi-person household is a group of two or more persons who make some common provision for food or other essentials of living and who are without a usual place of residence elsewhere. The persons constituting the group may pool their incomes and have a common budget to a greater or lesser extent; they may be related or unrelated or a combination of both. The general criterion to be used in identifying the members of a multi-person household relates to whether they live and eat together and have no usual place of residence elsewhere (ibid). In order to understand the main source of income of households and their access to productive resources, households can be divided into two broad categories: agricultural and non-agricultural households (Nazli et al. 2012). Agricultural households are farm households who cultivate the land, such as owners who cultivate the land, as are used for this research. But it can also be tenants who rent-in land on fixed rent, and sharecroppers, who cultivate land on a predefined contract for the division of the cost of cultivation and output. Within Punjab, 37 percent of households are landowners, as opposed to 50 percent in the nearby located provinces of KPK and 21 percent in the province of Sindh. Punjab has the largest percentage of households that rely on agricultural waged labor (ibid). Throughout this study, all small-scale framers were handling the basmati rice production without hired labor. The income from the production was used as an income for the entire family within the household. 2.2.3. Livelihood The term livelihood encompasses the assets of comprising all-natural, human, financial, and social capital plus the activities and the access to these i.e. social

8
relations (Ellis 2000). A livelihood opportunity is an economic source for small-scale farmer households to sustain themselves (Chambers & Convey 1992). Not all households share the same capacities, therefore, it is essential to incorporate that all households handle their assets according to their own needs, in complex ways for their present and future needs (Maxwell & Smith 1992). 2.2.4. Diversification Diversification is generally described as a way of adding income-generating activities to the household income (Peters & von Braun 1999). It can be based on one individual’s ability to earn an extra income from multiple sources or for a whole household’s ability to change and/or start with several income sources, for example at the farm level including non-farm activities or expanding the pursuits (ibid). 2.2.5. Cash-Crops To receive enough income, be food secure, and reproduce there is a gradual expansion by small-scale farmers in this region to produce subsistence crops or cash-crops (Abbas et al. 2017). Cash-crops are usually certain crops that are planted for their ability to provide the highest possible yields and quality for the climate and area available (Mughal 2018). The main characteristic of a cash crop is that it is not produced to be consumed by the farmer but to be sold on markets (Marini-Bettòlo 2012). The most commonly produced cash-crops in Pakistan are cotton, wheat, maize, and basmati rice (Shahzadi et al. 2018). 2.2.6. Food security Food security is defined as the provision, consistent and economic access to nutritionally sufficient, culturally accepted, and enough food for each member of the household for healthy productive living (FAO 2008). It is a multidimensional phenomenon covering climate, civil discontent, and social norms along with food production, access, and consumption (Khan & Gill 2010). Therefore, it consists of three parts: availability, accessibility, and utilization of food. A person or an area is considered vulnerable when one or more of the components are uncertain (FAO 2008). The determinants of food security differ at dimensions ranging from global, national, local, and down to individual levels and are deemed to be a multidimensional phenomenon encompassing climate change, civil conflicts, natural disasters, and social norms (Christoplos & Pain 2015). In addition to this, food regimes, division of labor, production, distribution, and consumption, as well as other aspects, affect the structure for a system to be food secure (Harvey 2006). Christoplos and Pain (2015) emphasize that regarding food security and
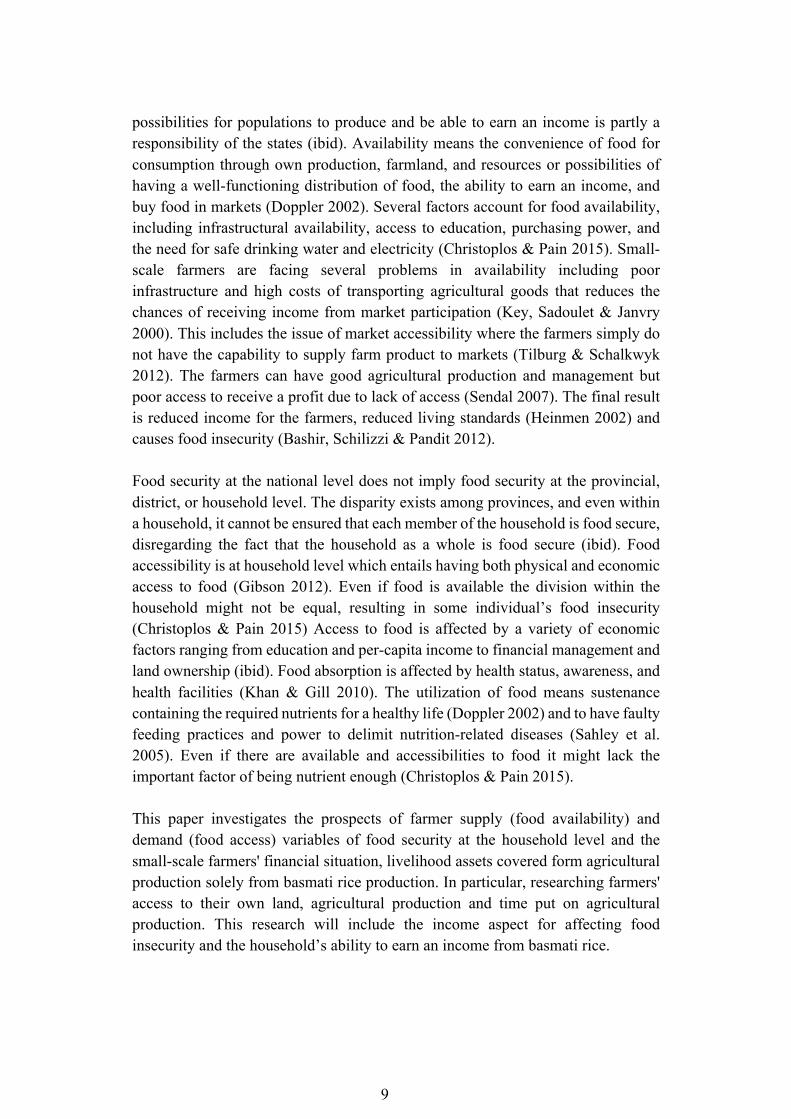
9
possibilities for populations to produce and be able to earn an income is partly a responsibility of the states (ibid). Availability means the convenience of food for consumption through own production, farmland, and resources or possibilities of having a well-functioning distribution of food, the ability to earn an income, and buy food in markets (Doppler 2002). Several factors account for food availability, including infrastructural availability, access to education, purchasing power, and the need for safe drinking water and electricity (Christoplos & Pain 2015). Small-scale farmers are facing several problems in availability including poor infrastructure and high costs of transporting agricultural goods that reduces the chances of receiving income from market participation (Key, Sadoulet & Janvry 2000). This includes the issue of market accessibility where the farmers simply do not have the capability to supply farm product to markets (Tilburg & Schalkwyk 2012). The farmers can have good agricultural production and management but poor access to receive a profit due to lack of access (Sendal 2007). The final result is reduced income for the farmers, reduced living standards (Heinmen 2002) and causes food insecurity (Bashir, Schilizzi & Pandit 2012). Food security at the national level does not imply food security at the provincial, district, or household level. The disparity exists among provinces, and even within a household, it cannot be ensured that each member of the household is food secure, disregarding the fact that the household as a whole is food secure (ibid). Food accessibility is at household level which entails having both physical and economic access to food (Gibson 2012). Even if food is available the division within the household might not be equal, resulting in some individual’s food insecurity (Christoplos & Pain 2015) Access to food is affected by a variety of economic factors ranging from education and per-capita income to financial management and land ownership (ibid). Food absorption is affected by health status, awareness, and health facilities (Khan & Gill 2010). The utilization of food means sustenance containing the required nutrients for a healthy life (Doppler 2002) and to have faulty feeding practices and power to delimit nutrition-related diseases (Sahley et al. 2005). Even if there are available and accessibilities to food it might lack the important factor of being nutrient enough (Christoplos & Pain 2015). This paper investigates the prospects of farmer supply (food availability) and demand (food access) variables of food security at the household level and the small-scale farmers' financial situation, livelihood assets covered form agricultural production solely from basmati rice production. In particular, researching farmers' access to their own land, agricultural production and time put on agricultural production. This research will include the income aspect for affecting food insecurity and the household’s ability to earn an income from basmati rice.
10
3. Method The rationale of this section is to present the design and method for this study to better understand the economic conditions and importance of income from basmati rice production for small-scale farmer households in Punjab, Pakistan. 3.1. Approach The framework of an upcoming study can be based and build upon previous research (Bryman 1989). Including a structured literature review describing or summarising previous facts in the field provides knowledge about the area of research (Backman 2008). The process of locating literature addressing social and economic conditions for basmati farmers in Punjab, Pakistan was obtained through a systematic search of sources within SLU library databases and google scholar. E-books, e-articles, reference databases as Science Direct, Scopus, Emerald, etc. and Web services, FAO website e/articles. The used articles for this research were identified based on a search using the keywords in the research project. Eisenhardt (1989) argues that through the use of case studies the potential to get deeper insights and knowledge about a specific research phenomenon. By studying a group of individuals in a specific area, in this case, small scale farmers in Punjab, Pakistan, the results are can provide a deeper understanding of the farmers in the region and give insights in small scale farmers' situation in several aspects (Creswell & Creswell 2018). The empirical case I chose to look at through the use of previous research and extensive reading is basmati rice-producing small-scale farmers in Punjab, Pakistan. It is then analyzed and supported by a theoretical framework based on food security and previous research made on the economic factors of basmati producing farmers in Punjab, Pakistan. 3.2. Quantitative research Murthy (2009) describes the difference between qualitative and quantitative research, where qualitative research is said to be about discovering and underlying motives of human behaviors, desires, and a concept involving a kind of quality of

11
a variable; whereas the measurement of variables in numeric or absolute terms is referred as quantitative research (ibid). A qualitative approach primarily focuses on developing an understanding of the social phenomenon, seeking to find answers regarding various questions of how people behave, their behavior and attitudes, and how they are affected by different events in their surroundings (Hancock et al. 2007). For this research a quantitative research method is used and through a survey data collection performed through a collaboration with the international non-governmental organization (NGO) Oxfam, Oxfam Sweden and the regional office in Pakistan (Oxfam Pakistan) due to security, language barriers as well as time and cost limitations, but followed closely as the survey data will be updated and followed through Oxfam Sweden. The main empirical source is a survey research design, conducted by Oxfam Pakistan in 2019, which targeted 250 farmers during the time period of September – October 2019. The survey was conducted for the harvest season of 2018 as the harvest regularly starts in September and the farmers had all the needed data from the latest harvest season of 2018. The survey layout includes pre-determined questions formed to find out time spend on agricultural production, volume, selling price, costs, and how many percentages of the farmer's income comes from basmati production. The data was collected through personal interviews based on structured questionnaires with the household head or a household member who felt qualified to answer questions about the household. Both female and male respondents answered the survey, but the aspect of gender is not compared in this study. The questionnaire is presented in Appendix 1. The survey answers were provided in excel data and a report. This study does not intend to generalize, but rather to provide a picture and overview of the food security problem (Jasanoff 2007) and to explore the overarching economic situation of small-scale farmers growing basmati in Punjab, Pakistan. Therefore, the need for a large sample of accurate respondents to the survey, for instance, to reach a sample size of indicators at a 95 percent level of confidence, with a 5 percent margin of error (Bryman 1989) will not be necessary. This study is based on the baseline survey conducted by Oxfam Pakistan after the September 2018 harvest season, with a response rate of 200. Since the focus of this study is on rural small-scale basmati farmers with production under 10 acres of land, not all respondents within the survey sample could be included. This left a sample size of 152 respondents providing accurate information of defined rural small-scale basmati rice farmers within the Punjab province. The sample contained 71 female and 81 male respondents, comprising of 1096 family members in total. The survey data was transferred into an excel spreadsheet (see appendix 2) into the following order. Gender of the respondent, production volume, selling price per kilogram of basmati rice (the price the farmers receive for one kg basmati),

12
production cost for basmati rice (consider that it is only the cost of production for the season, not cost over the year) Land size (acres), the farm size is helpful to see the correlation in production volume, price per kg and land size. Factors that could be included in the study are the volume of produce (i.e. output per unit of land) to understand productivity. Costs of production per unit of land (costs divided with the available land in acres), due to the seasonal income the basmati rice production provides. It is of the essence to understand what percent of the small-scale farmers' income that comes from rice production. One of the questions in the survey covers this area. Therefore, the information will be added to each one of the respondent’s information. The majority of the survey questions were linked to different variables related to livelihood status and household characteristics, i.e. social capital, financial/economic capital, physical capital, activities, and livelihood strategies. The major livelihood components included in the survey were correlated with total household size, primary source of income, secondary source of income, land used for farming, income from basmati rice production, percentage of total income from basmati rice production and cost of basmati rice production. However, some of the survey questions covered information about the household’s level of education, that can be find in appendix 3. This research will not reflect on this factor’s importance to fulfill the aim of this research. However, this data can be used for future research to understand how education affects the Punjabi farmers ability to earn an income and be food secure. Since this research intends to explore the economic conditions of small-scale farmer households, a supplementary literature review is complimented by survey data to receive further insight in the farmers economic situation and livelihood. The literature review complements the Oxfam survey as it mainly covers information about the farmers’ basmati rice production, the income received from it and the costs of production, including how much of the total earnings that the farmers base from the rice production. Therefore, there is a need to find information on the farmers’ other income sources, what agricultural products the farmers sell and what do they produce solely for household consumption, including what costs, they have and on what the farmers invest their income. This information is generated from previous studies of small-scale farmers in Punjab, Pakistan. Within the background chapter of this paper not only the economic conditions of the farmers are researched. Several social factors as farmers social standards, and kinship are mentioned. This is to provide more insight and overview of the farmers’ lives outside the basmati rice production.

13
3.3. Ethical considerations When doing research, the researcher is challenged with multiple ethical considerations, when choosing social environments, survey questions, and methods, since research involves collecting data from people, about people (Creswell & Creswell 2018). Particularly important is the ethical reflection when qualitative research implies closeness to the people in the research. Research participants should be informed if there are ethically sensitive sections or controversial interpretations in the report before they are published (ibid). The ethical considerations need to cover several matters, first of all, to inform the participants in the survey of the purpose of the research, that it is voluntary and that they have the right to cancel their participation if they wish as well the right to be removed from the survey once it is performed (Creswell & Creswell 2018). The importance to adapt the confidentiality requirements needed as the persons in the survey should not be identifiable and could have the possibility to be fully anonymous. For this research, the data collection process was outsourced and made through close collaboration with Oxfam Sweden and Oxfam Pakistan. The ethical considerations are covered by the principles of research ethics that the organization together with the researchers determined upon. The principles are covered by three basic comprehensions, respect, beneficence, and justice. Respect includes the researcher’s responsibility to distinguish the rights of all individuals participating in the research, to make sure that they are not forced under any circumstances and that they are treated with dignity (Dua 2012). The other considerations are beneficence, which includes the researcher’s primary goal is to protect the physical, mental, and social well-being of the participants. Finally, justice where the researcher ensures that the compensations for the participants are comparable with the risks of participating, including that there is a risk of undertaking the study (ibid). 3.4. Reliability and Validity To better understand and investigate what factors make it possible for some small-scale farmers to earn an income and be food secure it is needed to reflect over the possibilities, disadvantages, and advantages with enabling one chosen method and what method will give the most adequate result. Considering that this research does not attempt to achieve a generalization, rather to understand a specific group of smallholders. It can through a case study provide a deeper understanding of a specific area (Creswell & Creswell 2018). Through making a case study of Pakistan, the outcome can be adopted for many other agricultural small-scale
14
farmers. Robson (2002) argues that the case study is rather a strategy than a method. A strategy to better understand all small-scale farmers. Because even if the research will not end up with an exact outcome, it can provide a picture and overview of the problem and therefore give insights for a solution (Jasanoff 2007). The collected data for this research is to be analyzed and compared against previous knowledge and specifics in the field of research and to follow up and cross-check the gathered information. In order to make the research more reliable, the results will be checked against previous research done in the area. Through this triangulation (Robson 2002) or cross-checking (Bryman 1989) and the use of several methods can help to determent the validation of the result (Robson 2002, pp. 175). All the information from the literature review and data collection will be cross-checked by the contact person responsible for the collaboration at Oxfam. The result from this research will be compared with previous research done by the help organisation in this area.

15
4 Background for the empirical study Pakistan has the fifth largest population in the world, approximately 233 million. 116 million live in rural areas within the country (CIA 2019). About 25 percent of Pakistan’s GDP emanates from agriculture (CIA 2019) and employs 44 percent of the total workforce in the country (Ishaq & Memon 2016). Small-scale farmers dominate the agriculture sector; nearly 90 percent of the farmers in Pakistan are small and marginal farmers and about 60 percent of the rural population in Pakistan depends on farming as one of their major sources of income (Ghafoor et al. 2010). Pakistan has four provinces Sindh, Khyber-Pakhtunkhwa, Baluchistan, and Punjab (GOP 2015). Punjab province consists of 18 regions that together contain 52 percent of the total population of Pakistan and has over 50 percent of the countries cultivated land with approximately 70 percent of the cropped area of the country (Pervaiz et al. 2017). Punjab contributes a major share in the agricultural production of the country as it produces nearly 97 percent of the country’s total rice production, 95 percent of the citrus, 83 percent of the cotton, and 80 percent of the wheat (ibid). It is regularly two types of rice that are produced in Punjab due to the area's comparative edge in basmati rice production due to low measurements of fertilizers compared to other rice-producing countries (Kang & Mahajan 2006). Long-grain Pusa Basmati rice utmost for export and the second most typical traditional basmati variety. The agricultural production from the region is both transported nationally and internationally (ibid). In the rural areas of Pakistan, kinship structures where farmers have specific service relations with each other, grant support with agricultural production, often in return for services, loyalty, and political allegiance (Lyon 2004). Kinship has historically existed as mutual rights and obligation, but they diverge immensely depending on social factors, geographical locations, culture, norms, traditions, and at different times. Through kinships, individuals maintain social networks, social bonding, and claim land ownership (ibid). A kinship system is generally categorized by the features of how members of one group overlap with groups of other types, often families formulating networks or alliances that contribute to social security (Johnson 2006). A kinship system can, for example, determine how power is distributed in the family structure, determine close relationships and marriage.

16
(Andersen & Taylor 2008). In Punjab, Pakistan, the family-structure is strong, and a household often contain over 7 individuals but can reach up to 18 individuals, who help out with the daily chores on the farm (Ghafoor et al. 2010). Rural households in this region use marriage arrangements strategically to achieve political potential, social status, larger networks, and income for the rural small-scale farms (Lyon 2012). Conversely, with recent changes in socio-economic conditions in Pakistan, due to an increasing population and rural urbanization, the importance of kinship relations within the rural areas of the country have been negotiated in favour of a more commercial economy (Mughal 2014). According to Ghafoor et al. (2010), the majority of the farmers in Pakistan have farms under 12 acres. The access to land differs between the farmers in Punjab, 50 – 70 percent of the farmers have access to their land (Abbas et al. 2017) and the differences between regions within Punjab varies from the highest of 17 acres in the region of Layyah and the lowest of 1.4 acres of land, in the region of Jhelum, resulting in a total average of 7.2 acres of land in Punjab (Pervaiz et al. 2017). The importance of agricultural production varies between 79 – 85 percent of the farmer's total income (Ghafoor et al. 2010). It is common for the farmers in Punjab to have an average of 4 cows, 4 buffalos, 2 goats, and an unspecified amount of chickens (ibid). Farmers often keep small ruminants for milk, that can be sold in times of need (Chodavarapu, Giertz & Jaeger 2016). Moreover, agricultural products and livestock are sold at local markets, contributing to the total earnings, thus contributing to extra access to food for the households’ own consumption (Ahmed et al. 2017). On the small-scale farms, farmers additionally cultivate sugarcanes, potatoes, tomatoes, onions, orchard trees, oranges, mangos, lemons and date palms (Abbas et al. 2017), besides the production of rice, wheat, cotton and maize in Punjab (Shahzadi et al. 2018). The farmers in Punjab live in basic family houses most commonly made from mud and bricks or with cement and bricks independently on if the houses were small or larger (Pervaiz et al. 2017) and supports the livelihood of the average household size inclosing 7 individuals (Ghafoor et al. 2010). 17 percent of the households have indoor kitchens but generally, food is prepared and cooked outside over fires and outdoor cooking stations build from mud and bricks (Pervaiz et al. 2017). 70 percent of the farmers have an indoor toilet, but others defecated in the open. It is common for the small-scale farmers to have electricity and a study of all the regions of Punjab shows that 98 percent of the farmers had electricity, 64 percent had a cell phone and 56 percent of the families had a TV. Continuing outside of the family house into the farm buildings. In order to understand the different income types of households in rural Punjab, households can be divided into two categories: agricultural and non-agricultural households (Nazli et al. 2012). One-third of Pakistan farmers rely mainly on non-

17
farm activities, while the rest are involved in both on and off-farm activities (Mughal 2014). Within a household 35 percent of the income comes from the farms own agricultural production (Nazli et al. 2012). Agricultural households are farmers that earn their income from cultivation of land, as owner of cultivated land or as tenants that rent land. About 40 percent of the agricultural households have their own land, 10 percent are tenants and 30- 40 percent of the farmers commonly earns an income from off-farm sources. The farmers can adapt wage work that is defined as participation in any wage work related to farm operations or related to livestock care and livestock goods. The most common agricultural wage work by men are land preparation, harvest, post-harvest operations and fertilizers application. The female is commonly earning a wage from planting, weeding and post-harvest preparations. The occupations of non-farm employments are commonly within construction, trade, for example working in shops restaurants, in manufacturing or working with services, as for example health care, transportation. On a national basis, service enterprises dominate the work that farmers who migrate from agricultural production takes on. However, there is provincial disaggregation that shows that trade enterprises are more common in Punjab (Nazli et al 2012). An average of 14 percent of the Pakistani population migrates from the area of birth to other countries to seek income opportunities (Hamid 2010). Figure 1 shows an indication on the income sources for farmers in the regions of KPK, Sindh and Punjab. The household integrated economic survey of Pakistan (2018-19) show that the average monthly income was 245 euros per households in Punjab (PSLM 2019). The income covers both households in rural and urban areas of the province but gives an indicator of the average income for the households. The average monthly consumption expenditures in Punjab 2019 are 210 euros (PSLM 2019). According to Pervaiz et al. 2017 and Nazli et al. 2012 about 60 percent of the farmer's monthly income goes directly to food consumption, 6 percent to education, 5 percent to health products, 8 percent to utility bills, and the rest to other types of costs (ibid). Food, beverages and tobacco are the major cost for the farmers. About 25 percent of the food costs are consumed on cereals, 23 percent on milk and milk products, 14 percent on fruits and 8 percent on vegetables (Nazli et al. 2012) Nevertheless, the costs for the food items are covered by 60 percent of the farmers’ major expenditures. According to Ghafoor et al. (2010) are the farmers also investing in the agricultural production, saving for and purchasing seeds, fertilizers, pesticides, water and livestock (Ghafoor et al. 2010). According to Grover, Singh, and Kumar (2014), are the cost of basmati production covered by 50 percent of labor cost, 19 percent machine cost, while components as pesticides, fertilizers, and manures accounted for about 14 and 13 percent of the variable input cost respectively. Minor costs include unloading, cleaning, transportation, kind payments, and marketing losses. According to Nazli et al. 2012 farmers in Punjab are investing in the future education of their children, but lack of income makes 40

18
percent of rural children leave school prematurely. Additionally, the farmers are saving for future expectations as marriage. However, as low income and high costs of living in Pakistan, there is a lack of attention to save money (Shahid 2010). The factors that are affecting the income and savings of the small-scale farmers are health expenditures, specifically when sanitation and the availability to clean drinking water is scarce (Ghafoor et al. 2010). Public decent hospitals and health facilities seldom exist and force sick and wounded rural people that need treatment to go to private hospitals which are expensive (ibid). The crops are produced for household consumption and partly for sale at the local market or used as exchange goods (Rehman et al. 2008). Markets are regularly used by the farmers to purchase inputs or to sell farm produce to sustain their living standards (ibid). For many of the farmers, access and knowledge of distributing through these markets are limited. Limited market accessibility is one of the major factors that negatively affects small farming households' and is a common cause of food insecurity (Birthal & Joshi 2007). Selling agricultural produce and in this case, basmati rice is often linked with several factors including various stakeholders e.g. processors, traders, and retailers as long distances, transportation costs, and market information (ibid). Consequently, these factors contribute to farmers dependence on traders, processors and input suppliers (Pearce 2003) and result in an immediately needed of finances to fulfill the next cropping season expenditures and make the farmers stuck in a vicious circle of “grow-eat-grow” where the farmers have complications to progress security of income due to the high expenses of using traders and increasing costs (Rukhsana et al. 2016). Incorporating increasing price-setting initiatives on a national level, wider market/price sensitivities and low selling prices during harvest season (Pearce 2003) are factors why these farmers are faced with problems reliant to a shortage of finances, price volatility and low bargaining power (Ghafoor et al. 2010). These farmers constantly struggle with getting out of constant poverty due to a lack of income and savings with no possibility to develop their farming activities (ibid). This shortage of finance forces farmers towards dependence on credit markets often provided by the traders with the condition that at the time of harvest, they will sell their produce to those traders only (Rukhsana et al. 2016). Even if the small-scale farmers can sell their produce, the agricultural expenses include the cost of production, annual purchases of high-yielding seeds, pesticides, fertilizers, and operational machinery (Ghafoor et al. 2010). It also includes costs for the preparation of land, water systems, quality water, and land cultivation. Basmati rice production is additionally challenging due to the lack of governmental support that favours larger agricultural productions (ibid), poor handling, old varieties of seeds, changing environmental factors, diseases (Grover, Singh & Kumar 2014) as well as water shortage and high cost of production (Shahzadi et al. 2018). Shahzadi et

19
al. (2018) argue that basmati trade plays a major role in decreasing the rural poverty for small-scale farmers, especially in the area of Punjab. National and international basmati rice markets are critically affected by the country's high tariffs, water shortage and high cost of production, which results in farmers that cannot get enough income from the production of basmati rice (ibid). 4.1. Food Security for Small-Scale Farmers in Punjab The government of Pakistan has set the goal for all people within the country to have physical and economic access to sufficient, safe and nutritious food to meet their dietary needs and food preferences for an active and healthy life by 2025 (Abdullah et al. 2017). Today the Global Food Security Index 2019 ranks Pakistan as number 78 on the food insecurity index, out of 113 countries (Global Food Security Index 2019), with 20 percent of the population assumed to be highly food insecure and one third suffers from very low food security (Raza, Ali, & Mehboob 2012). It is estimated that 35 percent of the rural population in Pakistan lives in poverty, according to the poverty indicators from the United Nations World Economic Report of 2019, and almost 50 percent of the population is affected by food insecurity (Khan & Gill 2010). Various studies have analyzed food security at the national level in Pakistan. Mehmmod and Sheikh (1991) examined the causes and identified lack of income, low purchasing power, large household size with several individuals dependent in the household, low education, and lack of market accessibility (ibid). A study by Abdullah et al. (2017) documented that the gender of the household head, age, education, remittances, unemployment were elements affecting food security (Abdullah et al. 2017). Therefore, the importance of household saving (Frongillo et al. 1997) and a monthly income are factors that often are important to achieve food security. Livestock chattels were found to improve food security in Pakistan (Bashir et al. 2012). Exclusively to have small ruminants were found to improve household food security with about 30 percent in areas of rural Punjab (Bashir et al. 2012). Rural farmers often protect their food security by having own agricultural production, selling surplus produce and assets like animals, vehicles and jewellery (Ahmed, Ying & Bashir 2015) Farmland size may play an important role in achieving food accessibility and the households who had small and marginal landholding, below 2.5 acres, risked suffering from food insecurity (Khan & Gill 2010). With less access and lower production, the farmers are faced with less to eat and less economic power to purchase food (ibid). Education plays a key role in household food security. Female education is specifically important because food preparation and serving are done by women (Asghar & Muhammad 2013). Correspondingly, higher educational levels as higher secondary and tertiary education did not improve the farmer's agricultural skills (Bashir et al. 2012).

20
Achieving food security at the national level does not necessarily guarantee food security at the provincial, district, or household level. There exists disparity among provinces, districts, and households. Even if a household is food secure it does not ensure that each member of the household is food secure due to discrimination in food distribution within households. Studies show that male household members have a higher responsibility for agricultural production on small-scale farms in Punjab (Chaudhry 2009). As female household members in small-scale farms in rural Pakistan preform other types of income related activities as trade for example and are similarly taking care of the household chores and children. The attitude of participation in agricultural production within the farms for females living in rural farms in Pakistan is rather discouraging (ibid). On the other hand, studies show that the females that participate in agricultural production are more likely to be food secure and have a lower probability to end up in poverty (Asghar & Muhammad 2013). Research shows that 15 percent of the children under 5 years old suffered from malnutrition and about 45 percent of the same age group where stunted (Pervaiz et al. 2017). Younger family members are stronger than elderly family members and can perform harsher agricultural work (Bashir et al. 2012). Younger children are suffering from malnutrition as it shows that families living together with retired or older persons to feed have more difficulties to become food secure than families that have fewer mouths to feed (ibid).

21
5. Empirical findings This study is based on a household survey conducted by Oxfam Pakistan for the harvest season of 2018 in the region of Punjab, Pakistan. This section presents the results of the 152 small-scale basmati rice-producing households from Punjab, Pakistan. 71 female and 81 male respondents participated in the survey and the average household size for the respondents were 7.21 persons. This resulted in that the forthcoming information compromises the livelihoods for about 1096 individuals. Within the result accessible below, information about the whole household survey sample, containing approximately 1096 individuals, is given in the survey questions considering the household age, gender, and education level of all individuals in the household. The information considering the main activities and number of hours spent on different daily activities are exclusively covering the 152 respondents of the survey. This result does not include all members of the households. The data is shown this way to get a basic insight into all individuals that this research covers because the farmer's income from basmati rice production and the livelihood of the farmers affect the whole household, not just the individuals that responded to the survey. 5.1. Age & gender The 152 respondents were initially asked to provide basic information regarding their household members. Figure 1 presents the age and gender of all household members. The data is presented in female and male household members and the percentage of each gender division.
Figure 1. Household age-gender pyramid
19,0%20,2%
23,1%15,8%
9,9%6,8%
4,5%,4%,3%,1%
20.8%24.7%
20.1%14.9%
8.9%7.5%
2.3%.8%
30% 20% 10% 0% 10% 20% 30%0-10
21-30
41-50
61-70
81-90
Figure 1. Household Age-Gender PyramidFemale Male

22
The pyramid structure shows that the majority both of female and male household members were between the ages 0 – 30 years old. The age group from 11 – 20 years are the highest represented by the female household members and the age group of 21 – 30 years olds is the highest represented by the male household members. 5.2. Main activities To get insight into the respondent’s day to day lives. The respondents were asked to report the two main activities that they have been doing in the last 6 months. The main activities that the farmers could choose from was agricultural production, engaged in unpaid domestic work that can, for example, be engaged in the own agricultural products domestic sales or selling on the markets, this activity does not provide a wage or salary but are on the other hand a way of selling the own produce. Other main activities were, engaged in paid domestic work, work for wage or salary, self-employment, unemployment, others, and no response. The replies came from what the respondents saw as their main sources of activities and therefore the main source of income.
Figure 2. Main activity of respondents
While 91 percent of the male respondents reported agriculture to be the main activity, 87 percent of women reported unpaid domestic work as the main activity. The remaining activities constitute a considerably lower percentage of the main activities for the respondents. Considering the total, it becomes clear that the respondents have about 50 / 50 of their main activity reliant on agriculture and engagement in domestic unpaid work. It becomes clear that it is the male respondents that are in charge of the agricultural work, whilst the female is engaged in unpaid domestic work.
2%
91%
47%
87%
44%
4% 4% 4%2% 1% 2%3% 2%2% 1%1% 1% 1%1% 1%1% 1%
0%
20%
40%
60%
80%
100%
Female Male Total
Figure 2. Main Activity of Respondents | N = 152
Agriculture Engaged in unpaid domestic workWork for wage or salary OtherUnemployed Self-employed in the formal sectorNo Response Engaged in paid domestic work

23
5.3. Daily activities Respondents were asked about their daily activities, selecting from the options of leisure time were sleep and resting was included. Paid work that can, for example, be engaged in the own agricultural products domestic sales or selling on the markets, this activity does not provide a wage or salary but are on the other hand a way of selling the own produce. The other activities they could choose from was unpaid work, education, and other activity during the day.
Figure 3. Mean number of hours per day pent on primary activity
The majority of men and women respondents spent the highest number of hours on leisure as either a primary or a secondary activity during the day, i.e. men spent 11.5 hours while women 11.0 hours on average on leisure time. Paid work in terms of the average number of hours spent on women was approximately 3 hours per day and the male result was considerably higher with about 11 hours per day. Women additionally spent 4,9 hours on unpaid work during the day as either a primary or secondary activity while men spent 0.3 hours on average. It was only a minor sum of the male respondents that retorted that they spend a certain time on education (presented in the yellow color in the table for male replies). Resulting in male respondents to spend 0,1 hours per day on education. There is a foremost differentiation concerning the male and female replies. The male spends most of their day achieving two central undertakings, leisure time, and paid work. The women are devoting excluding time to these undertakings, managing unpaid work, and other activities as well.
11,5 11,0
0,3
4,9
11,1 2,9
0,1
0,0
1,0
5,2
4,0
6,0
8,0
10,0
12,0
14,0
16,0
18,0
20,0
22,0
24,0
Male Female
Figure 3. Mean number of hours per day spent on primary activity | N = 152
Leisure Time Unpaid Work Paid Work Education Other

24
5.4. Income from basmati rice production The respondents were asked what proportion of their annual income comes from basmati rice production to measure and estimate the importance of basmati rice production for the farmers to receive income and to find out the proportion of their total annual income that comes from basmati production. From this information conclusions of the small-scale basmati rice farmers' dependence on basmati censures and the determents of this production independently result in food security for the farmers. Figure 4 shows the replies from the 152 small-scale farmers in Punjab, Pakistan on what proportion of income comes from basmati rice production.
Figure 4. Income from basmati production
Results show that the majority of the respondents, i.e. 60 percent, earned less than 50 percent on their annual income through basmati rice production. 3 percent, comprising 4 respondents, based all of their income on basmati rice production, for these farmers the production of these agricultural goods is vital for the farmer's existence. 9 percent, concluding 13 respondents based between 75 – 100 percent of their income on the production. 37 respondents, 24 percent of the farmers answered that their household bases 50 – 74 percent of their income on the production. Finally, 6 respondents, 4 percent of the farmers answered that the rice production stood for none of the household income. In the following section are the mean, median, lowest, and highest response rates of the 2018 basmati rice harvest season presented. Figure 5 – 8 display scattered plots of the spread of production for farmers participating in the Oxfam survey, including an average trend line. The scattered plots show the farmers responses in the order that the survey data was registered in order to recognise the variation in farmer's production, the cost of basmati rice production, income per kilogram of basmati rice. From this information, the gross and net income for the farmers will be calculated. The acre of accessible land will be presented including the calculated information on how much rice the farmers produce per acre of land and the cost per
4%
60%
24%
9%3%
0
0,1
0,2
0,3
0,4
0,5
0,6
0,7
No income formrice
Less than 50% Between 50-74% Between 75-100% Only income
Figure 4. Income from basmati rice production

25
tonnes of produced rice. The 4 percent of the respondents who answered that they did not earn an income from rice production where removed. This was done for the reason that the farmers had a production, price, and volume answer of zero and would indicate that the average production measurements were lower. Therefore, these respondents were removed from the following sample.
Figure 5. Scatter plot on volume of basmati rice production
The mean volume basmati rice produced by the small-scale farmers was 6,5 tonnes, the median volume was 5 tonnes. The span of production went from the lowest of 0,374 tonnes to the highest of 22,440 tonnes of basmati rice.
Figure 6. Scatter plot on land size
The mean, median, lowest and highest access to farm size or acres, in this case, varies majorly between the farmers. As stated before, the dependence of inclusive farm size is one of the most important variables for agricultural production for rural households, with a constant effect on the farmer's food production as well as income. Households with greater access to land and larger farm sizes can often manufacture more food than small farms. The respondents within this research replied access to land between 1 – 12 acres, with a mean of 4,6 acres and a median of 3 acres of land.
0
5000
10000
15000
20000
25000
0 20 40 60 80 100 120 140 160
Kg
of b
asm
ati
Farmers
Figure 5. Volume of basmati rice
0
5
10
15
0 20 40 60 80 100 120 140 160
Acr
es
Farmers
Figure 6. Variation of land size in acres

26
Figure 7. Scatter plot on cost of basmati rice production
The cost of production comes from how much only the basmati rice production cost for the farmers. This includes all expenses from fertilizers, land preparation, machinery, played labor, and preparation of the produce. The total cost varies from 57 euro up to 8265 euros, with a mean cost of 949 euros and a median of 570 euros for the production of basmati rice.
Figure 8. Scatter plot on price received per kilogram of rice
The selling price received per kilogram of basmati rice varies from 0,11 euro up to 0,57 euros per kilogram. With a mean and median selling price of 0,22 euro per kilogram of rice. Table 2 summarizes the mean and median volume of basmati rice produced by the small-scale farmers in tonnes. The farm size is presented in acres, the cost of basmati rice production is presented in Euros and finally, the price is presented in the received price per kilogram of basmati rice. The result shows a median and a mean of what the respondents answered in the survey. To get indicators of the span of responses, the lowest and highest given results are indicated in the table. Table 2. Mean and median volume, farm size, cost and selling price Mean Median Lowest Highest Volume (tonnes) 6,5 5 0,374 22,440
Farm size (acres) 4,6 3 1 12
Costs (euro) 949 570 57 8265
Price (euro/kg) 0,22 0,22 0,11 0,57
Table 2. Mean and median production, cost and selling price for 2018 harvest
0
20004000
6000
800010000
0 20 40 60 80 100 120 140 160
Euro
Farmers
Figure 7. Cost of basmati rice production
0,00
0,20
0,40
0,60
0 20 40 60 80 100 120 140 160
Euro
Farmers
Figure 8. Price recived per kilogram of rice

27
Altogether, the span of volume indicates that access to land will diverge significantly. Due to these factors an indication on the median and mean value are quite difficult to present as the situation for the farmers varies and cannot fully be represented by presenting the mean and median. Therefore, this result will show the gap between the farmers and the importance of basmati rice production for their income. Table 3 presents the gross, net, yield, and cost per unit of land calculated from the given mean and median figures from table 2. The gross income from basmati rice depends on the given inputs of the produced volume of basmati rice, multiplied with the average price received per kilogram of sold rice. The net income is the gross minus the cost of production and the sum of profit for the farmer's basmati rice production for the season. Remember the previously stated information in figure 4, the income from basmati rice production, and that the income from basmati rice does not necessarily stand for the farmer's total income as the average basmati rice farmer in Punjab, Pakistan base 50 percent or lower of their income on basmati rice production. The average yield is an indicator of how much basmati rice the farmers grow per acre of land. The average land size of presented in table 2, then the mean and median volume of production is divided with the land size resulting in the average production per acre of land. The cost per unit of land gives an indicator of what the mean and median cost per acre of land is. The average land size is therefore divided with the mean and median cost of production, providing input in the cost per acre. All figures are described in table 3. Table 3. Mean and median gross and net income from basmati-rice
Mean Median Gross income (euro) 1419 1094
Net income (euro) 469 524
Yield (kg/acre) 1416 1683
Cost per unit of land (euro) 206 190
Table 3. Mean and median income information for 2018 harvest
A closer examination of the circumstances of household earnings results in a mean and median gross and net income. The gross income is based on taking the mean and median volume of production separately multiplied with the mean and median selling price from table 1. The gross income results therefore in a mean of 1419 euros from basmati rice production and a median gross income of 1094 euros.

28
By taking the mean and median total cost of products displayed in table 2, and subtract it with the gross income, the net income for the farmers is presented. The net income results in a mean of 469 euros and a median of 524 euros. From this income, the farmers still have a household and living costs including other expenses. The result indicates a limited difference between the mean and median. The average yield for the harvest of 2018 results in 1,416 tonnes of basmati rice per acre and a median of 1,683 tonnes of basmati rice per acre of land. The difference between the mean and median results are 267 kilograms additional basmati rice per acre presented in the median result. The cost per acre results on a mean of 206 euros and a median of 190 euros per acre of land. The mean results are 16 euros higher than the median result. The mean and median cost per unit of land indicates that the costs do not differ comparably depending on how many acres of land the farmers have access to.

29
6. Analysis and discussion
This chapter aims to analyze the results from the Oxfam survey and cited studies on basmati rice-producing small-scale farmers in Punjab, Pakistan. Including the economic aspects on income from basmati rice production affecting the rural household’s food security. The small-scale farmers reproduce their household economically through the production of agricultural products, mainly production of cash-crops, and by selling livestock and, on a limited scale, earning a waged salary. The Oxfam survey has shown the particular importance of basmati rice production for small-scale farmers. The result from the Oxfam survey shows an agricultural production on an average farm size of 4,6 acres and a median of 3 acres. This is consistent with the results presented by Abid et al. (2011) who show that the majority of the rural population possess landholdings less than 5 acres (ibid). All farmers within the survey were owning the land that they produced on. Commonly farmers are not earning all of the land as landholding is expensive (Ghafoor et al 2010). Therefore, the farmers within the Oxfam survey are earning more than the farmers that are not producing on their own land, because they need to pay the landowners. Agricultural production, specifically the production of cash crops, mainly basmati rice, play, according to the result of the Oxfam survey, a highly important role for small-scale households in Punjab, Pakistan. All of the 152 respondents for the survey obtained at least some of their income from cash crops. However, the dependency on production of basmati rice varied between the responding households. Earlier studies show that production of basmati rice in Punjab stands for an overall production of 35 percent of the total production of small-scale farmers in the region (Kang & Mahajan 2006). The results from the Oxfam survey indicates that the farmers dependency of basmati rice is higher than what is earlier mentioned, as one third of the farmers responded that the income from basmati rice made up between 50 - 100 percent of the household’s total income. Previous studies show that rural households in Punjab commonly depend on off-farm sources for 30 - 40 percent of their income (Rehman et al. 2008), while the rest of the income derives from agricultural production (Ghafoor et al. 2010). The

30
small-scale rural farmers in Punjab, Pakistan mainly earn an income from agricultural production dominated by the male household members. The results from the Oxfam survey show that 91 percent of the male farmers had agriculture as their main activity, while only 2 percent of the female respondents stated that their main activity was agriculture. Female household members contribute to extra income by wage salaries. However, this income is limited since 87 percent of the female respondents stated that unpaid domestic work was their main activity and lacked income. The average net income from the basmati rice production was 524 euros. The sum is one sixth of the total yearly average income for households in Punjab. For 3 percent of the farmers within the Oxfam survey the income from basmati rice was the only income for the household. These farmers are more food insecure than the farmers that obtain income based on agricultural diversification. One of the main reasons for this is that the farmers who practice agricultural diversification are more able to cope with risks, such climate change, civil conflicts and natural disasters (Christoplos & Pain 2015) and thus avoid food insecurity (Bashir, Schilizzi & Pandit 2012). The price of produced rice does not fluctuate depending on the scale of production. The small-scale farmer's total production of rice shows very small variations of volume. The findings show that the farmers with the largest production in acres do not have the highest cost of production. Grover et al. (2014) show the different costs of basmati production; 50 percent is made up of labour costs, 19 percent machine expenses, followed by components as pesticides, fertilizers, and manures. The latter account for about 14 and 13 percent of the variable input cost respectively. These costs can be dependent on the family structure and how many of the family members that can contribute to agricultural production, as well the potential costs of labour, machines, and other equipment. The median cost for basmati rice production was 570 euros and the median cost per unit of land (per acre) was 190 euros. Previous research on food security of small-scale farmers in Punjab, Pakistan, show that many of the farmers are trapped in a cycle of poverty, caused by low income, low levels of savings and lack of economic buffers, which leaves them in a weak economic position, unable to invest in desired farming activities (Ghafoor et al.2010). The result from the Oxfam survey shows that the majority of small-scale farmers are diversifying their agricultural production growing basmati rice as one of the common cash crops to sell. The farmers are also, according to previous research on food security of small-scale farmers in Punjab, Pakistan growing various crops, raising different kinds of livestock, taking seasonal work, providing other farm-related activities as indicated from previous studies i.e. Javed et al. (2015). Nevertheless, the results from this study indicates that the farmers are more able to become food secure if they rely on several agricultural products. The

31
dependence on one cash crop, i.e. basmati rice, combined with low incomes, large household size, several members of the households who do not earn any income, and low education, risk making such households very food insecure. The majority of the household members participating in this research were between 10 and 30 years old. The level of education between the respondents for the survey and the rest of the household members show that the main respondent, often the head of the family, is less educated than the other members in the household. The results of the Oxfam survey show that the female respondents are less educated than the male respondents. 65 percent of the female respondents have no education, compared to 28 percent of the male respondents. Chaudhry (2009) argues that the female household members are more responsible than men to take care of the household, while the agricultural production is regarded as the men’s responsibility (ibid).

32
7. Conclusion This study has aimed to explore the economic conditions of small-scale farmer households in Punjab, Pakistan, and the importance the production of basmati rice plays for these farmers. The research questions focused on how much of the farmer's income that is based on basmati rice production and how the dependence on this product was connected to food security and food insecurity. The result from this study indicates that the small-scale farmers in Punjab, Pakistan are highly dependent on agricultural production as the core source of the household’s total income. The agricultural cash-crop production in the form of basmati rice are not one of the main sources for the farmers to earn an income and to be able to reproduce their household. Few of the farmers are highly dependent on the basmati rice production and the income from it as the main source of income. The average small-scale farmers in the region diversify their agricultural production and base their income on several agricultural produce. The diversification of several agricultural products contributes to higher food security than for the farmers who are solely producing basmati rice as they are less likely to be affected by damaged crops and difficulties to sell their produce. The farmers that rely on an array of agricultural products to obtain an income are less prone to be afflicted by food insecurity than the farmers who solely produce basmati rice. In future research within this area it is essential to investigate the costs of living for the small-scale farmers and how much of their income emanate from all the different agricultural produce, as well as from non-agricultural activities. This would contribute to a deeper understanding of the rural households’ economy, both the aggregated incomes and the income from specific products. I strongly recommend future research focused on the entire range of aspects related to food security and basmati rice production and consumption by the small-scale farmers of Punjab, Pakistan.

References Abbas, R., Mirza, F. I., & Afzal., A. (2017). Farm management capacities contribute to
sustainability of rural livelihoods amongst small farmers in district Layyah, Punjab, Pakistan. Journal of Rural Development and Agriculture, vol. 2, pp. 11–25.
Abdullah, A., Zhou, D., Shah, T., Ali, S., Ahmad, W., Din, I.U., & Ilyas, A. (2017). Factors
affecting household food security in rural northern hinterland of Pakistan. Journal of the Saudi Society of Agricultural Sciences, vol. 18 (2019), pp 201–210.
Abid, M., Ashfaq, M., Hassan, S., Fatima, N. (2011). A resource use efficiency analysis of small
cotton farmers in Punjab, Pakistan. Pakistan Journal of Agricultural Sciences, vol 48, pp 65–71.
Ahmed, U.I., Ying, L., & Bashir, M.K. (2015). Food Insecurity and Coping Strategies by Micro Growers in Punjab, Pakistan. J. Environ. Agri Sci, vol. 3, pp. 31–34.
Ahmed, U.I., Ying, L., Bashir, M.K., Abid, M., & Zulfiqar, F. (2017). Status and determinants of small farming households' food security and role of market access in enhancing food security in rural Pakistan. Plus One, Vol. 12 (10).
Andersen, M.L. & Taylor, H.F. (2008) Sociology Understanding a Diverse Society. Fourth edition.
Media Research Update. Thomson Wadsworth. Backman, J. (2008). Rapporter och uppsatser. Studentlitteratur. Lund. Bashir, M.K., Schilizzi, S., & Pandit, R. (2012). Food security and its determinants at the
crossroads in Punjab, Pakistan. Working Paper 1206, School of Agricultural and Resource Economics. Australia: University of Western Australia, Crawley.
Birthal, P.S., & Joshi, P.K. (2007). Smallholder farmers’ access to markets for high‐value
agricultural commodities in India Case study No. 6–4 of the program: Food policy for developing countries: The role of Government in the global food system. Cornell University Press, Ithaca, NY.
Bryman, A. (1989). Research Methods and Organization Studies. Unwin Hyman Ltd. London. CIA. (2019) The world factbook, Pakistan. Available:
https://www.cia.gov/library/publications/the-world-factbook/geos/pk.html [2020-01-08] Clapp, J. (2016). Food. Second Edition. Polity Books. Kindle Edition. Creswell, J.W., & Creswell, J.D. (2018). Research Design, Qualitative, Quantitative and Mixed
Methods Approaches. Fifth Edition. SAGE Publications, Inc. Christoplos, I., & Pain, A. (2015). New Challenges to Food security, From Climate Change to
Fragile States. Routledge.

Chodavarapu, S., Giertz, A., & Jaeger, P. (2016). Agribusiness in South Asia. Extended Version of the Industry Case Study Done for: South Asia’s Turn Policies to Boost Competitiveness and Create the Next Export Powerhouse.
Dua, R. (2012). Undertaking Research with Ethics - Oxfam Digital Repository. Oxfam GB. ISBN
978-1-78077-222-6. Doppler, W. (2002). Farming and Rural Systems Approaches. Published Lecturing Material,
Hohenheim.
Ellis, F. (2000). Rural livelihoods and diversity in developing countries. UK: Oxford University Press.
FAO. (2017). Building Agricultural Market Information Systems: A Literature Review. Food and Agriculture Organization of The United Nations. Available: http://www.fao.org/3/a-i6858e.pdf [2020-01-08]
FAO. (2008). Deriving Food Security Information from National Household Budget Surveys:
Experiences, Achievements, Challenges. Food and Agricultural Organization of the United Nations, Rome. Available: http://www.fao.org/3/i0430e/i0430e00.htm [2020-02-23]
Frongillo, E. A., Olson, C. M., Rauschenbach, B. S., & Kendall, A. (1997). Nutritional
Consequences of Food Insecurity in a Rural New York State County. Institute for Research on Poverty, University of Wisconsin, Madison.
Ghafoor, A., Hussain, M., Naseer, K., Ishaque M., & Baloch, M.H. (2010). Factors Affecting
Income and Saving of Small Farming Households in Sargodha District of the Punjab, Pakistan. ISSN 1023–1072. Pak. J. Agri., Agril. Engg., Vet. Sci., 2010, 26 (2), pp. 27–35.
Global food security index (2019). Pakistan. Available: https://foodsecurityindex.eiu.com [2020-
02-05] GOP. (2016) Economic survey of Pakistan 2015-16, Ministry of Finance, Government of Pakistan,
Islamabad. Available: http://www.finance.gov.pk/survet_1516.html [2020-05-14] Grover, D.K., Singh, J., Kumar, S., & Singh, J.M. (2014). Relationship Between Wholesale Prices,
Retail Prices, Export Prices (Fob), Prices Realized by Farmers and Details of Contributing Factors for The Price Difference for Basmati Rice in Punjab. Agro-Economic Research Centre Department of Economics and Sociology Punjab Agricultural University Ludhiana. AERC STUDY No. 35.
Hamid, S. (2010). Rural to Urban Migration in Pakistan: The Gender Perspective. Pakistan
Institute of Development Economics Islamabad. PIDE Working Papers 2010: 56.
Heinmen, P.A. (2002). Relationship Making in the New Economy. J. Relationship Mark. pp. 5–61.
HIES (2016). Household integrated economic survey. Government of Pakistan statistics division Pakistan bureau of statistics Islamabad. Available: http://www.pbs.gov.pk/content/household-integrated-economic-survey-hies-2015-16 [2020-03-16]
HLPE (2019). Agroecological and other Innovative Approaches for Sustainable Agriculture and
Food Systems that Enhance Food Security and Nutrition. Available: http://www.fao.org/3/ca5602en/ca5602en.pdf [2020-01-08]
Howton, E. (2018). Nearly Half the World Lives on Less than $5.50 a Day. The World Bank.
PRESS RELEASE NO: 2019/044/DEC-GPV October 17. Available:

https://www.worldbank.org/en/news/press-release/2018/10/17/nearly-half-the-world-lives-on-less-than-550-a-day [2020-01-28]
Javed, S., Nadeem, A.M., Rafique, M.Z., & Kamran, M.A. (2015). Determinants of Income
Diversification among Rural Households of Pakistan. Journal of Economics and Sustainable Development www.iiste.org ISSN 2222–1700 (Paper) ISSN 2222-2855. Vol.6, No.14, 2015.
Kang, M, G., & Mahajan, N. (2006). Agricultural Management, Marketing and Finance Service
(AGSF) Agricultural Support Systems Division Food and Agriculture Organization of the United Nations.
Key, N., E. Sadoulet, & A.D. Janvry (2000). Transactions costs and agricultural household supply response. Am. J. Agri. Econ., 82(2), pp. 245–259.
Khalil, C.A., Conforti, P., Ergin, I., & Gennari, P. (2017). Defining Small Scale Food Producers to Monitor Target 2,3 of the 2030 Agenda for Sustainable Development. FAO Food and Agriculture Organization of the United Nations Statistics.
Khan, R.E.A., & Gill A.R. (2010). Determinants of Food Security in Rural Areas of Pakistan.
SSRN Working Paper Series. Lyon, S.M. (2004). An Anthropological Analysis of Local Politics and Patronage in a Pakistani
Village. Lampeter: Edwin Mellen Press. Lyon, S.M. (2012) Networks and Kinships: Formal Models of Alliance, Descents, and Inheritance
in a Pakistani Punjabi Village. Sage Journals. 31 (1), pp. 45–55. Marini-Bettòlo, G.B. (2012). Towards a Second Green Revolution from Chemical to New
Biological Technologies in Agriculture in the Tropics. Elsevier Science Publisher B.V. Netherlands.
Maxwell, S. & Smith, M. (1992). Household food security: concepts, indicators, and measurements: A technical review. UNICEF.
McMichael, P. (2013). Food Regimes and Agrarian Questions. Agrarian Change and Peasant Studies Series, Practical Action. Fernwood Publishing.
Mughal, M.A.Z. (2014). Calendars Tell History: Social Rhythm and Social Change in Rural
Pakistan. History and Anthropology 25 (5), pp. 592–613. Mughal, M.A.Z. (2018). Rural urbanization, land, and agriculture in Pakistan. Department of
General Studies, King Fahd University of Petroleum & Minerals, Dhahran, Saudi Arabia. VOL. 36, NO. 1, pp. 81–91.
Nazli, H., Haider, S.H., Hausladen, S., Sheikh, A. T., Shafig, H., Shahzad, S., Mehmood, A.,
Shahzad, A., & Whitney, E. (2012). Pakistan Rural Household Panel Survey 2012 Round 1. Pakistan Strategy Support Program (PSSP) Working Paper No. 007. Islamabad, International Food Policy Research Institute.
Pearce, D. (2003). Buyers and Supplier Credit to Farmers. Research Support Program (BASIS-
CRSP) and the World Council of Credit Unions, Inc. (WOCCU). Pervaiz, B., Li, N., Qasim, M., Yaseen, M. & M, Yaseen. (2017). Socio-Economic Characteristics
of Farming Community and Food Security Situation in Punjab, Pakistan. Journal of Agricultural Science; Vol. 9, No. 8.

PSLM / HLPE. (2019). Pakistan Social and Living Standards Measurement Survey. Government of Pakistan, Ministry of Planning Development & Special Initiatives. Pakistan Bureau of Statistics, Mauve Area, G-9/1 Islamabad. (2018-19). Available: http://www.pbs.gov.pk/sites/default/files//pslm/publications/pslm_hies_2018_19_provincial/key_findings_report_of_plsm_hies_2018_19.pdf [2020-05-23]
Rapsomanikis, G. (2015). The economic lives of smallholder farmers, an analysis based on
household data from nine countries. Food and Agriculture Organization of the United Nations Rome, 2015.
Raza, A.S., Ali, Y., & Mehboob, F. (2012). Role of agriculture in Economic Growth of Pakistan.
International Research Journal of Finance and Economics. ISSN 1450-2887. Issue 83.
Rehman, M., Jehanzeb and M.F. Rana. (2008). Livelihood strategies of different categories of households in rural areas of Abbottabad, Pakistan. Sarhad J. Agric. 24 (4), pp. 685–692.
Rukhsana, R., Cui, L.X., Mazhir, N.I., Zeeshan, A., Manzar, W., & Sidra, G. (2016). Economic Analysis of Agriculture Small Loan and its Multidimensional Benefits for Farmers’ Community: An Analytical Study from South Region of Punjab Province, Pakistan. European Journal of Business and Management www.iiste.org ISSN 2222–1905 (Paper) ISSN 2222-2839 (Online) Vol.8, No.6, 2016.
Sahley, C., Groelsema, B., Marchione, T., & Nelson, D. (2005). The Governance Dimensions of
Food Security in Malawi. USAID.
Sendal, A. (2007). Commercializing Small-Scale Vegetables Production in Limpopo Province. Draft Report, 5 November 2007. Polokwane, South Africa: Limpopo Department of Agriculture.
Shahid, M. (2010). Determinants of capital formation: New evidence for Pakistan. M. Phil Thesis, Department of Economics, GC University, Lahore.
Shahzadi, N., Akhter, M., Ali, M., & Misbah, R. (2018). Economic Aspects of Basmati Rice in Pakistan. Rice Research Institute, Kala Shah Kaku, Agriculture Department Punjab, Pakistan. Open access. DOI: 10.4172/2375-4338.1000192.
Tilburg, A.V. & Schalkwyk, H.D.V. (2012). Strategies to Improve Smallholders’ Market Access. Book chapter from Unlocking markets to smallholders: Lessons from South Africa. Mansholt Publication Series, 10. Wageningen Academic Publishers. Netherlands.
UN (2019). Monthly Briefing on the World Economic Situation and Prospects. Available: https://www.un.org/development/desa/dpad/wp-content/uploads/sites/45/publication/Monthly_Briefing_131.pdf [2020-01-30]
Willoughby, R., Gore, T. (2018). Ripe for Change Ending human suffering in supermarket supply
chains. Oxfam Report. DOI 10.21201/2018.1787. ISBN 978-1-78748-178-7.

Acknowledgements I want to give special thanks to my supervisor Örjan Bartholdson for all interesting inputs to this thesis. A huge thanks to Hanna Nelson and Elin Williams at Oxfam Sweden for all the help in maunds. To my family, friends and colleagues thank you for all the support. Without you it would have been impossible.

Appendix 1. Pakistan Producer Survey
District:
Tehsil
Village:
Household number:
|__|__|__|
Respondent’s name
Respondent’s sex 1= Woman
2= Man |__|
Respondent’s relationship with household head (code Q103)
Interviewer’s name
Date (dd/mm/yy): ......./......../.................... Start time: ........: ........AM / PM Finish time: ........: ........AM / PM
Greet the respondent, then give them this introduction: My name is _________. I am working with Oxfam, ____ (partner name/others). We are carrying out a survey to help us understand about work in households and the community. There is no material compensation for participating in the survey and no special support will come to your household as a result of your responses to the questions. Your participation is completely voluntary. I want to assure you that it is fine if you decide not to answer a particular question or wish to discontinue the questionnaire altogether at any point. The records of this research will be kept private. In any publication based on this questionnaire, any information that will make it possible to identify participants will not be included. We are interested in what you think about the questions. Feel free to make any comment; there are no wrong or right answers! Do you have any questions about what I have mentioned so far?
If the respondent agrees, tick this box
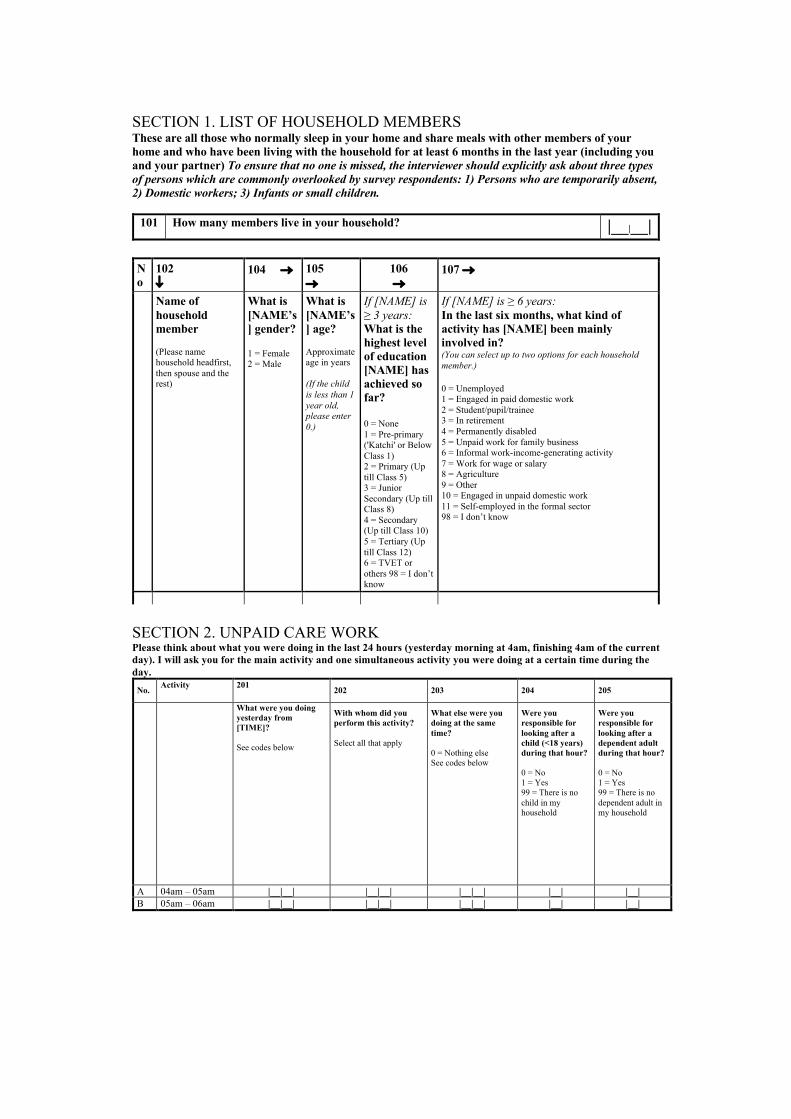
SECTION 1. LIST OF HOUSEHOLD MEMBERS These are all those who normally sleep in your home and share meals with other members of your home and who have been living with the household for at least 6 months in the last year (including you and your partner) To ensure that no one is missed, the interviewer should explicitly ask about three types of persons which are commonly overlooked by survey respondents: 1) Persons who are temporarily absent, 2) Domestic workers; 3) Infants or small children.
101 How many members live in your household? |__|__| No
102 ¯
104 ® 105 ®
106 ®
107 ®
Name of household member (Please name household headfirst, then spouse and the rest)
What is [NAME’s] gender? 1 = Female 2 = Male
What is [NAME’s] age? Approximate age in years (If the child is less than 1 year old, please enter 0.)
If [NAME] is ≥ 3 years: What is the highest level of education [NAME] has achieved so far? 0 = None 1 = Pre-primary ('Katchi' or Below Class 1) 2 = Primary (Up till Class 5) 3 = Junior Secondary (Up till Class 8) 4 = Secondary (Up till Class 10) 5 = Tertiary (Up till Class 12) 6 = TVET or others 98 = I don’t know
If [NAME] is ≥ 6 years: In the last six months, what kind of activity has [NAME] been mainly involved in? (You can select up to two options for each household member.) 0 = Unemployed 1 = Engaged in paid domestic work 2 = Student/pupil/trainee 3 = In retirement 4 = Permanently disabled 5 = Unpaid work for family business 6 = Informal work-income-generating activity 7 = Work for wage or salary 8 = Agriculture 9 = Other 10 = Engaged in unpaid domestic work 11 = Self-employed in the formal sector 98 = I don’t know
SECTION 2. UNPAID CARE WORK Please think about what you were doing in the last 24 hours (yesterday morning at 4am, finishing 4am of the current day). I will ask you for the main activity and one simultaneous activity you were doing at a certain time during the day.
No. Activity 201 202 203 204 205
What were you doing yesterday from [TIME]? See codes below
With whom did you perform this activity? Select all that apply
What else were you doing at the same time? 0 = Nothing else See codes below
Were you responsible for looking after a child (<18 years) during that hour? 0 = No 1 = Yes 99 = There is no child in my household
Were you responsible for looking after a dependent adult during that hour? 0 = No 1 = Yes 99 = There is no dependent adult in my household
A 04am – 05am |__|__| |__|__| |__|__| |__| |__| B 05am – 06am |__|__| |__|__| |__|__| |__| |__|

SECTION 3. INCOME FROM RICE PRODUCTION
SPECIFY UNIT
602 What was the total volume of rice you produced in the most recent harvest season? |__||__||__||__||__|
___________
603 What is the total land area on which you grew rice in the most recent harvest season?
|__||__||__||__||__| ___________
604 Approximately what was the total cost during that
season of producing that rice (for example, the total cost of inputs and any paid labour)?
|__||__||__||__||__| ___________
605 What volume of rice did you sell to [insert company name] in the most recent harvest season?
|__||__||__||__||__| __________
606 What price did you receive per kilogram from [insert
company name]? |__||__||__||__||__| ___________
607 Approximately what proportion of your annual income
comes from rice production? 0 = No income form rice 1 = Less than 50% 2 = Between 50-74% 3 = Between 75-100% 4 = 100%
|__|
SECTION 4. END OF INTERVIEW This is the end of the interview. Explain again that the information will be kept strictly confidential, and that the information will help researchers to strengthen their work in this area. Ask the respondent if he/she has any questions for you. When finished, thank them for his/her time and leave a note with Oxfam’s GRAISEA 2 project coordinator name and phone number for any questions or concerns they may have.

Appendix 2. Spreadsheat Survey Answers


Appendix 3. Survey Result on Education This section is divided into two parts, first the education level of all members of the households, then the respondents’ level of education. Figure 1 shows the level of education of the household members that the respondents for the survey submitted. The education level of the households was categorized into none education, where no formal education although illiteracy is expected. Pre-primary and Primary level education, Junior Secondary, Secondary, university-level education (Tertiary) and finally the technical and vocational education and training (TVET).
The highest percentage of household members, 26 percentage, had no education. 32 percent of the female household members and 21 percent of the male household members. The second most common education is completed in secondary school. Within this level of education, the male respondents push up the total percentage, since 25 percent of the male has a higher educational level. The female household members' second most common education level is a primary school with 21 percent. Both female and male household members have a TVET educational level of 5 percent respectively. Tertiary education represents 8 percent for males and 10 percent for female household members. Figure 2 gives a picture of the education levels of the respondents. Showing a significant percentage, 47 percent of the total, 65 percent of females and 28 percent of the male respondents having no education.
32%21% 26%
3%5%
4%
21%20% 20%
15%16% 15%
16% 25% 21%
10% 8% 8%5% 5% 5%
0%
20%
40%
60%
80%
100%
Female Male Total
Figure 1. Education of household members
None Pre-primary Primary Junior Secondary Secondary Tertiary TVET or Other

The largest group of respondents have no education. 18 percent of the female respondents have primary education, 8 percent have junior secondary education, 6 percent secondary, and finally 3 percent having tertiary education. The male respondents are higher educated, with 1 percent (presented in the red color in the table) having pre-primary education. 13 percent of the respondents received primary education, 13 percent junior secondary, 29 percent secondary, 11 percent tertiary education, and finally, 5 percent of the male respondents having TVET or other types of education. Due to the significant difference between the male and female respondents’ level of education, it is of the essence to notice the difference in the table that shows the total responds rate. The total results show 47 percent of the respondents with no education. one percent (presented in the red color in the table) having pre-primary education, 16 percent primary, 11 percent junior secondary, 18 percent secondary, 7 percent tertiary, and 3 percent TVET or other. The last three educational levels result in a higher percentage due to the male respondents’ higher level of education.
65%
28%47%
18%
13%
16%
8%
13%
11%
6%
29%
18%
3%11%
7%5% 3%
0%10%20%30%40%50%60%70%80%90%
100%
Female Male Total
Figure 2. Education of respondents N = 152
None Pre-primary Primary Junior Secondary Secondary Tertiary TVET or Other

Approved students’ theses at SLU are published electronically. As a student, you have the copyright to your own work and need to approve the electronic publishing. If you check the box for YES, the full text (pdf file) and metadata will be visible and searchable online. If you check the box for NO, only the metadata and the abstract will be visiable and searchable online. Nevertheless, when the document is uploaded it will still be archived as a digital file. If you are more than one author you all need to agree on a decision. You can find more information about publishing and archiving here: https://www.slu.se/en/ subweb/library/publish-and-analyse/register-and-publish/agreement-for-publishing/
☒ YES, I/we hereby give permission to publish the present thesis in accordance with the SLU agreement regarding the transfer of the right to publish a work.
☐ NO, I/we do not give permission to publish the present work. The work will still be archived and its metadata and abstract will be visible and searchable.
Publishing and archiving