the economic and financial crisis (powerpoint) (pdf) · the economic and financial crisis in...
TRANSCRIPT

The Economic and Financial Crisis in Michigan: Survey Evidence from
Michigan Households Lisa D. Cook, MSU

Financial and Economic Crises
My Research Banking, financial crises in developing
countries and emerging markets, e.g., Russia, South Africa, Nigeria
My Practice U.S. Treasury Department (Council on
Foreign Relations), 2000-2001 Senior Adviser on Finance and DevelopmentWorked on international financial crises

Financial and Economic Crises
Lessons from Other Crises Recognized, like a number of other
economists, that
Features of the housing and credit markets were unsustainableMichigan was the epicenter of the crisis –
rising unemployment, declining personal income, defaults on subprime mortgages

Michigan: The Epicenter
Unemployment Rate, 2007-2009
State Oct-07 Oct-08 Oct-09Wyoming 2.7% 3.2% 7.4%Massachusetts 4.4% 5.8% 8.9%Texas 4.4% 5.3% 8.3%Georgia 4.8% 6.9% 10.2%U.S. 4.8% 6.6% 10.2%Illinois 5.4% 6.8% 11.0%California 5.7% 8.0% 12.5%Ohio 5.7% 6.9% 10.5%Michigan 7.4% 9.1% 15.1%Source: www.bls.gov

Michigan: The Epicenter
859095
100105110115120125
Per
cen
t
Year
Per-Capita Personal Income: Michigan as Percent of U.S., 1950-2007
Source: Charles Ballard, MSU, 2009.
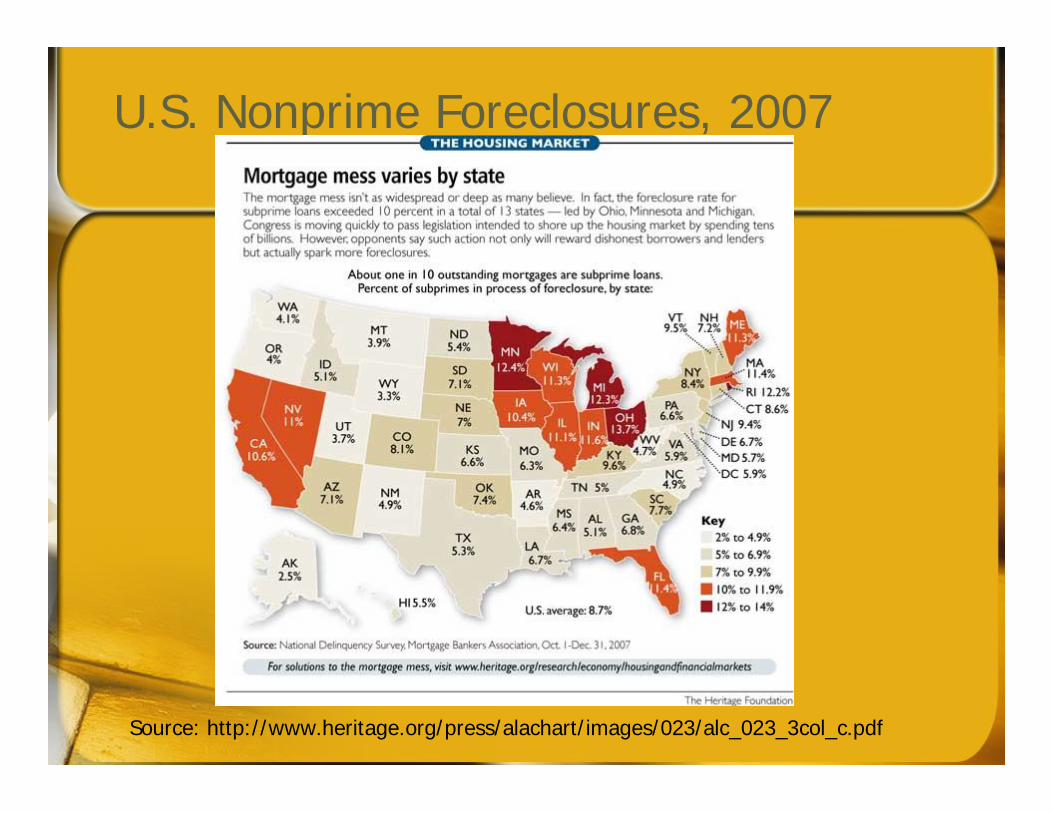
U.S. Nonprime Foreclosures, 2007
Source: http://www.heritage.org/press/alachart/images/023/alc_023_3col_c.pdf

Michigan Foreclosures, October 2009
Source: www.realtytrac.com

MI Foreclosures and Home Prices, 2008-9
Source: www.realtytrac.com

Food Stamp Participation
State FY 2004 FY 2006 Aug-08 Aug-09Percent change vs Aug-
09Aug-08 Jul-09
California 732,239 799,469 962,778 1,226,446 27.4% 1.5%Georgia 353,040 386,192 446,050 598,127 34.1% 2.8%Illinois 476,050 556,293 611,531 712,200 16.5% 0.0%Massachusetts 154,543 227,263 283,818 371,032 30.7% 1.8%Michigan 412,666 515,030 609,359 751,922 23.4% 0.5%Ohio 419,271 480,582 540,411 683,132 26.4% 1.8%Texas 864,342 1,017,313 1,056,145 1,204,415 14.0% 1.4%Wyoming 10,382 10,134 9,448 12,097 28.0% 0.0%
U.S. 10,278,593 11,734,491 13,220,994 16,559,716 25.3% 1.8%
Source: http://www.fns.usda.gov/pd/SNAPmain.htm

Michigan: The Epicenter
Managing financial and economic crises requires timely information
Consumers Adjust current and future income and spending Establish or use savings Reduce household spending
Postpone or eliminate big-ticket purchases Reduce entertainment or dining-out budget

Michigan: The Epicenter
Managing financial and economic crises requires timely information
Policymakers Stabilize economy Reduce uncertainty, restore confidenceUse savings (rainy-day funds) Implement appropriate countercyclical
policies quickly

The Household Survey
I noticed that timely, comprehensive information was not available on the impact of the crisis on Michigan households.
From a macroeconomic perspective, could we collect data on the current situation and future activity (early warning system)?

The Household Survey
With MSU extension, we created a survey that both
Gathered data on current and future situation of households and
Provided resources to help respondents

The Household Survey
Questions Current financial sustainability Current and future changes in job
status, hours worked Past and future bankruptcy and
foreclosure activity Past and future credit-card activity Financial literacy, e.g., budgets and
credit scores

The Household Survey
Web-based Respondents given information on
where to find specific and general resources
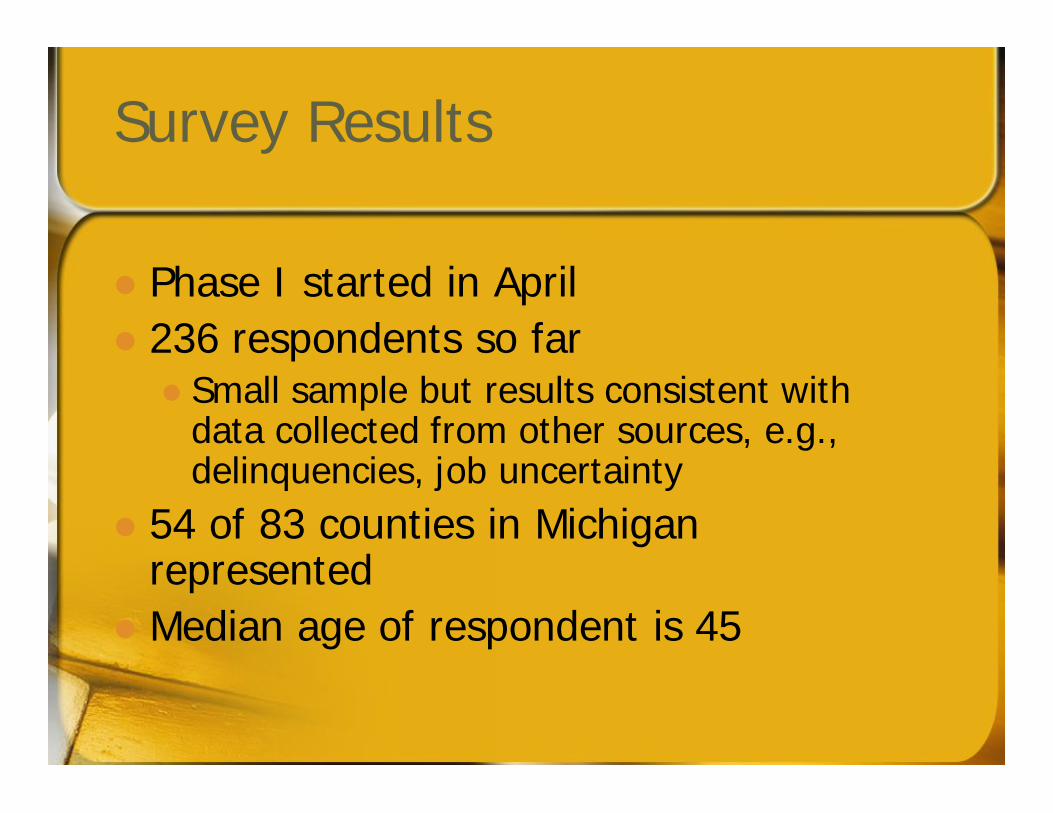
Survey Results
Phase I started in April 236 respondents so far Small sample but results consistent with
data collected from other sources, e.g., delinquencies, job uncertainty
54 of 83 counties in Michigan represented
Median age of respondent is 45
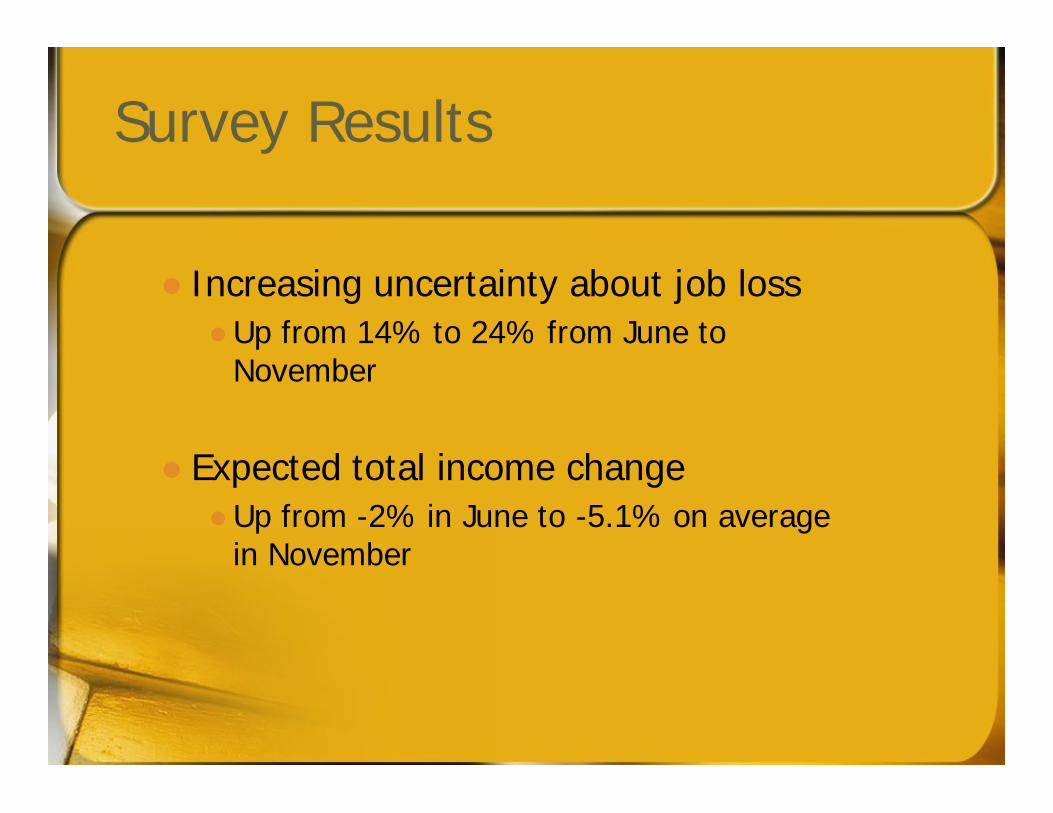
Survey Results
Increasing uncertainty about job lossUp from 14% to 24% from June to
November
Expected total income changeUp from -2% in June to -5.1% on average
in November

Survey Results
Credit cards Slightly fewer are reaching borrowing limit
– 81% vs 75%, June to November Total credit card debt:
Average is up: $5739 to $8342, June to November
Median is down: $3889 to $646, June to November

Survey Results
Mortgage and rent payments:Late house and rent payments in the
last 12 months: 11%-13% between June and November
Financial literacy:Relatively low, given crisisCheck credit score: 60% -- yesHousehold budget: 60% -- yes

Survey: What’s Next
Phase II of survey scheduled to start in mid-December or early January
Key questions to appear on IPPSR’s Michigan State of the State Survey in January to obtain larger and more representative sample of households
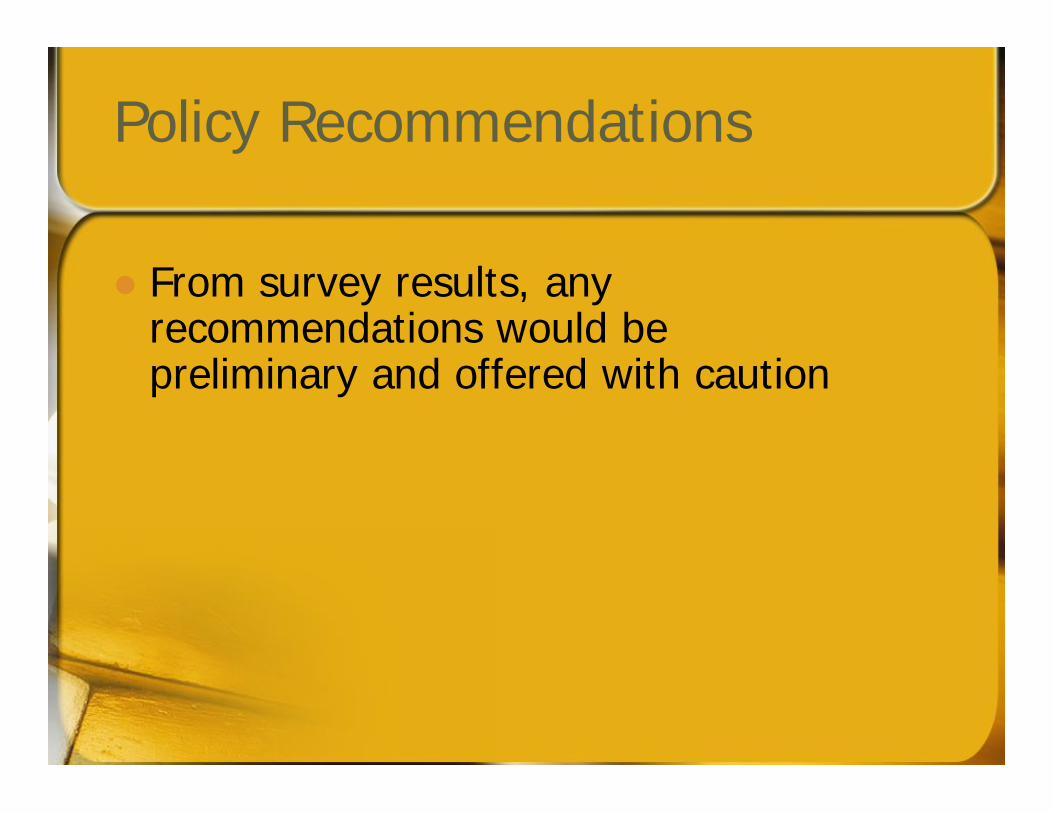
Policy Recommendations
From survey results, any recommendations would be preliminary and offered with caution

Policy Recommendations
Address uncertainty, foreclosuresClassic market failure with market
and societal objectives misalignedGrowing social and economic costs,
e.g., deteriorating neighborhoods, public safety

Policy Recommendations
Address uncertainty, foreclosuresIncentives to keep homeowners in
their homes should outweigh incentives to keep them in default or in foreclosure proceedings with accruing feesPhiladelphia’s Foreclosure Diversion
program as example Estimates of 60%-78% of foreclosures
averted with mediation

Policy Recommendations
Promote financial literacy
Household financial sustainability Forward-looking behavior
SavingsDebt management

Michigan’s Future
Given long-term trends, continue to invest in key areas Education
Surest way to provide buffer against declining personal incomes and future shocks
Infrastructure Innovation
Michigan is the state with the 7th highest number of patents awarded
Should convert success to innovation

Michigan
Thank you for your attention!