the dynamics of complexity, accuracy, and fluency: a
TRANSCRIPT

JALT Journal, Vol. 40, No. 1, May 2018
23
The Dynamics of Complexity, Accuracy, and Fluency: A Longitudinal Case Study of Japanese Learners’ English Writing
Michiyo HokamuraTemple University, Japan
In this study I investigated the development of complexity, accuracy, and fluency (CAF) in the English writing of 2 Japanese university students of elementary-to-low-intermediate English proficiency over the course of 1 academic year. Data were analyzed from a dynamic systems theory (DST) perspective using min-max graphs, moving correlation coefficients, and a Monte Carlo analysis. The findings show that (a) the CAF measures followed nonlinear trajectories in their development, (b) they often did not correlate positively with one another, and (c) they sometimes showed signs of improvement during phases of high intravariability. The findings suggest that to understand the developmental trajectories and processes involved in lan-guage development more deeply, cross-sectional studies of developmental trends of groups should be supplemented with longitudinal studies that examine language development in individual learners.
本研究では日本人大学生(初級から中級下レベル)二名の英文ライティングの熟達度を一年間にわたり、複雑さ、正確さ、流暢さ (complexity, accuracy, and fluency: CAF) の指標から調査を行った。データ分析はダイナミックシステム理論の観点から、ミニマックスグラフ、移動相関係数、モンテカルロ分析を使用して行った。その結果、(a) 両者のCAFの発達軌跡は非線形であり、(b) CAFのすべてが互いに正の相関関係をとることはほぼなかった。さらに (c) 学習者個人内のCAFの軌跡が大きく変動した後に発達の兆候がみられることがあった。本結果から、言語発達の軌跡やそのプロセスをさらに理解するためには、グループ間を比較する横断研究を、個々の学習者を調査する長期的研究で補完することを提案する。
24 JALT Journal, 40.1 • May 2018
Keywords: dynamic systems theory; foreign language writing; longitudinal case study
S econd language acquisition (SLA) research is largely concerned with language development in individual learners, but most SLA studies have been focused on general developmental trends of groups. Nor-
ris and Ortega (2009) argued that our knowledge about the developmental trends of groups needs to be supplemented with illustrations of individual variation to provide a fuller view of developmental trajectories of learn-ing. Understanding language development in individual learners requires the use of longitudinal designs and more dynamic descriptions explaining variability and nonlinearity in individual learner development (Vyatkina, Hirschmann, & Golcher, 2015). Some studies of L2 writing have used com-plexity, accuracy, and fluency (CAF) to measure language development. Most such studies, however, have been cross-sectional and contrastive rather than developmental and longitudinal, focusing on only one or two constructs at a time. As a result they have failed to consider CAF as a dynamic and inter-related set of constantly changing subsystems (Norris & Ortega, 2009). To elucidate language development in individual learners, I investigated the development of CAF in English writing from a dynamic systems theory (DST; Abraham, 1994; Lorenz, 1963; Reynolds, 1987; Thom, 1975) perspective in this longitudinal case study.
Dynamic Systems TheorySystems are sets of interacting variables—also called subsystems—that are themselves parts of a larger system. Dynamic systems are systems that change over time. In many publications the terms chaos, complexity, complex adaptive systems, nonlinear systems, and DST are often used interchangeably to refer to a class of theories that are focused on the development of complex systems over time (de Bot, 2008). In this study the term DST is used to encompass all of these notions.
DST started as a branch of theoretical mathematics, and its initial aim was to model the development of complex systems (de Bot & Larsen-Freeman, 2011; de Bot, Lowie, & Verspoor, 2007). The mathematical tools that had been developed based on DST proved to be useful for the analysis of a vari-ety of problems, such as the movement of the moon under the influence of the sun, the Earth, and other planets. Because there are systems on every level in the physical world, the tools and approaches of DST have found ap-plication in a wide range of fields ranging from epidemiology to economics

25Hokamura
to meteorology, and it has been used to solve practical problems ranging from heartbeat control to drilling holes for oil (de Bot & Larsen-Freeman, 2011). What these fields have in common is that they involve phenomena that do not seem to follow predictable patterns of development and change. DST is now considered more as a set of tools and approaches than as a fixed and all-inclusive theory of change (de Bot, 2008).
SLA as a field is concerned with the development of systems such as individual learners, classes, and ethnic groups, and these systems, too, do not seem to follow predictable patterns of change and development. DST originated and benefited greatly from mathematics and physics. Although there are important differences between SLA and mathematics or physics with respect to the object of inquiry, it has been argued that a DST approach to SLA can provide a framework and the instrumentation needed to merge the social and the cognitive aspects of SLA, showing how the interaction of these aspects can lead to development (de Bot et al., 2007). A DST approach can be applied to SLA research to investigate those systems in a structured way and deepen our understanding of language-learning processes (de Bot, 2008). Dynamic systems have several key characteristics and understanding these characteristics enables researchers to look at dynamic systems in a structured way. In the next section, I describe some of these characteristics.
Key Characteristics of Dynamic Systems The first characteristic of dynamic systems is the nonlinearity of their de-velopment and change. In dynamic systems, the relationship between cause and effect is often nonlinear, that is, there is no proportionate effect for a given cause (de Bot et al., 2007). For example, Meara (2004) simulated the attrition of a lexicon using a simple computer model with a network of 2,500 interconnected words. He studied the effects of switching off some words on other words in the network and showed that switching off one word after another did not lead to a similarly linear decline in the number of words in the lexicon; there was enormous variation in how the network reacted.
The second characteristic of dynamic systems is the interconnectedness of their subsystems. When language is regarded as a dynamic system, subsys-tems such as the lexical system, the phonological system, and the syntactic system are considered to be interconnected, and changes in one subsystem are likely to influence all the other subsystems (de Bot & Larsen-Freeman, 2011).
The third characteristic of dynamic systems is stabilization. A dynamic system sometimes stabilizes itself in an attractor state, which can be defined

26 JALT Journal, 40.1 • May 2018
as “the state the system prefers to be in over other states at a particular point in time” (Steenbeek, Jansen, & van Geert, 2012, p. 66). It takes a con-siderable amount of energy to make a system break away from an attrac-tor state and move on. De Bot and Larsen-Freeman (2011) argued that the phenomenon of fossilization (Selinker, 1972), which is the stabilization of an interlanguage system in a form divergent from the target language system, can be described as the result of an attractor state into which the learner’s interlanguage system has settled.
Finally, variability is considered the driving force of development. In other words, variability in a subsystem is seen as an intrinsic property of developmental processes (de Bot et al., 2007; van Dijk, Verspoor, & Lowie, 2011). Therefore, unstable periods can be considered a sign of change and development in DST.
Research Methods From a DST PerspectiveSeveral approaches and methods have been proposed for conducting re-search from a DST perspective. For example, de Bot and Larsen-Freeman (2011) proposed an approach based on a retrodiction, or “explaining after by before” (p. 20). They suggested that after a change has taken place, researchers can look back and describe what happened and study the pat-terns of development. Furthermore, it is possible to point to tendencies and patterns of development that have been found, trajectories in the system’s development can be observed, and the next state can be explained using the preceding one (de Bot & Larsen-Freeman, 2011). However, the tendencies and patterns are not applicable beyond the particular research context in which they have been studied; thus, when it comes to dynamic systems, researchers should think in terms of what is called particular generaliza-tion (Gaddis, 2002, p. 62) rather than universal generalization. Researchers might acknowledge tendencies or patterns, but they should resist claiming the applicability of their findings beyond specific times and contexts (Lars-en-Freeman & Cameron, 2008).
In the present study I adopted a longitudinal, time series approach, which Larsen-Freeman and Cameron (2008) proposed as a method for research from a DST perspective. This approach enables connections to be made across levels and timescales (Larsen-Freeman & Cameron, 2008) because data are collected at multiple measurement points in chronological order. Furthermore, dense data are available because they are collected at many measurement points. Dense data are required to identify variability, which, as noted above, is the driving force of development in DST (de Bot & Larsen-

27Hokamura
Freeman, 2011; Larsen-Freeman & Cameron, 2008). The data in this study were analyzed using tools and methods developed by van Geert and van Dijk (2002). Van Geert and van Dijk (2002) presented several new tools and methods for visualizing and describing intravariability in individual time-serial data collected through repeated observations and applied them to data on the early language development of an infant learning Dutch, her first language. Van Dijk et al. (2011) and Verspoor, Lowie, van Geert, van Dijk, and Schmid (2011) applied the tools and methods to data on the L2 development of six native Spanish learners of English who had been in the United States for less than 3 months and provided detailed instructions on how to use the tools and methods. These tools and methods are described in the Methods section.
Complexity, Accuracy, and FluencyComplexity, accuracy, and fluency have been used to measure language development in speaking and writing in the field of SLA since the 1990s. Brumfit (1984) made a distinction between fluent and accurate L2 usage to examine the development of L2 speaking in classroom contexts. Ske-han (1989) added complexity to fluency and accuracy and used the three constructs in the measurement of learners’ performance on tasks. Many researchers believe that L2 proficiency consists of multicomponential constructs and that their principal dimensions can be captured by the CAF model (Skehan, 1989). For example, Housen and Kuiken (2009) argued that “CAF emerge as principal epiphenomena of the psycholinguistic mechanism and processes underlying the acquisition, representation, and processing of L2 knowledge” (p. 462). In other words, complexity and accuracy together reflect the current level of language knowledge, whereas fluency represents learners’ control over their linguistic L2 knowledge.
There are many definitions for the components of CAF. In this study com-plexity is defined as “progressively more elaborate language and a greater variety of syntactic patterning” (Foster & Skehan, 1996, p. 303), and accu-racy is defined as “the ability to be free from errors while using language to communicate” (Wolfe-Quintero, Inagaki, & Kim, 1998, p. 33). Fluency is defined as “the number of words or structural units a writer is able to include in their writing within a particular period of time” (Wolfe-Quintero et al., 1998, p. 14). The development of English writing is viewed here as a system, and the elements of CAF are viewed as its subsystems that influence language development.

28 JALT Journal, 40.1 • May 2018
Research on CAF From a DST PerspectiveSeveral studies on the development of CAF have been conducted from a DST perspective to examine language development in ESL and EFL learners. Spoelman and Verspoor (2010) conducted a 3-year longitudinal case study investigating the developmental patterns of accuracy and complexity in a Dutch student learning to write Finnish, a language with a complex morphol-ogy comprising 15 cases. The researchers focused on the use of cases and calculated an overall accuracy rate for the use of this grammatical feature. They also examined three types of complexity—of words, noun phrases, and sentences. The results showed that the development of accuracy and complexity was characterized by peaks and regressions and by progress and backsliding, that there was a complex interaction between these variables, and that there were signs of improvement in intraindividual accuracy and complexity. Polat and Kim (2013) examined the developmental patterns of syntactic complexity, lexical complexity, and accuracy in the English speak-ing skills of a native speaker of Turkish who was an untutored learner. The researchers found that both syntactic complexity and lexical complexity showed high intraindividual variability and that by the end of the 1-year study period, the participant was capable of producing more complex oral output. Accuracy also showed a great deal of variability, but no clear pat-terns of development were observed during the study period.
Baba and Nitta (2014) investigated, over the course of 1 academic year, the development of fluency in the English writing of two Japanese university students. The students wrote in English in class for 10 minutes and fluency was measured as the total number of words written in the allocated time. The students’ fluency increased over the course of the study; however, the changes in fluency were nonlinear: Individual students followed unique de-velopmental paths. The researcher also found that fluctuation periods were observed before and after the developmental trends and there were critical moments at which the two students changed the way they wrote in English. Based on these findings, the researchers argued that “supra” patterns of L2 writing fluency exist and that these patterns contribute to our understand-ing of the writing development process.
Gaps in the LiteratureThe three studies reviewed in the previous section were longitudinal CAF studies on writing or speaking conducted from a DST perspective that have advanced our understanding of language development as a nonlinear pro-cess. However, previous researchers have not investigated how all three CAF
29Hokamura
constructs change over the same period of time or how they interact with one another. Addressing this gap is important because the three constructs need to be examined together to understand their relationships and how they influence one another. Attentional capacity and working memory are limited (Baddeley, 2007; VanPatten, 1990), and if performance in one area (e.g., fluency) requires attention and working memory involvement, com-mitting attentional resources to this area can negatively affect the other areas (Skehan, 1998). Skehan (1998) proposed that tensions exist between complexity and accuracy and between linguistic form (complexity and accu-racy) and fluency. This idea led to the formulation of the trade-off hypothesis (Skehan & Foster, 2001), which predicts that committing attention to one area can cause lower performances in others. Skehan also suggested that higher level performances can occur in two out of the three CAF constructs, but not in all three.
Furthermore, interconnectedness is one key characteristic of dynamic systems. When language development is regarded as a dynamic system, and complexity, accuracy, and fluency are regarded as processes and subsystems underlying the acquisition, representation, and processing of L2 knowledge (Housen & Kuiken, 2009), it then becomes important to investigate the in-teraction between all three CAF constructs.
Finally, Norris and Ortega (2009) argued that the CAF components are developmental in nature, growing and changing constantly, and interacting with one another in often unpredictable ways. Looking at only one or two constructs at a time does not allow the developmental patterns of language acquisition to be investigated adequately. To fill these gaps, the primary pur-pose of this study is to investigate changes in all three CAF components as well as their interactions. The following research questions were examined in this study:
RQ1. How do complexity, accuracy, and fluency change over the course of 1 academic year in the English writing of two Japanese learners?
RQ2. Are there significant peaks in the learners’ CAF development?RQ3. How do complexity, accuracy, and fluency interact over the course
of 1 academic year?
MethodParticipantsTwo Japanese 1st-year university students participated in this study. The two female participants are referred to as Maki and Kumi (pseudonyms).

30 JALT Journal, 40.1 • May 2018
They were chosen from a class of 36 students whom I taught, because they studied diligently and completed all the English writing tasks assigned over the course of 1 academic year (10 months). I obtained their oral consent to use their data for research purposes. Their English proficiency was below Level 3 of the General Tests of English Language Proficiency (G-TELP). Level 3 corresponds to a TOEIC score of between 400 and 600 (General Tests of English Language Proficiency, n.d.). Because the participants did not pass this level, their English proficiency corresponds to a TOEIC score of between 220 and 470 (Educational Testing Service, 2012). The creators of TOEIC claim that learners at this level are capable of minimal communication in ordinary conversations. On the placement test conducted in the first semester, Maki’s scores on the G-TELP were as follows: grammar 55/100, listening 29/100, vocabulary and reading 29/100. Kumi’s test scores were as follows: gram-mar 59/100, listening 25/100, vocabulary and reading 42/100. According to a questionnaire administered in the first semester, the two students had had almost no experience writing essays in English in secondary school.
ProceduresThe participants were students in an English class that met twice a week for 90 minutes each time. The class was focused on English listening, reading, grammar, and vocabulary. Approximately every three classes, the students had 15 minutes to write an impromptu essay either on a familiar topic such as What I did yesterday, My high school, or My winter vacation, or a description of a series of three pictures; thus, the essays were narratives or descriptions. Each student was required to complete 20 essays, of which 15 required writing on a familiar topic and five required describing pictures. The students were told to focus on content and to write as much as pos-sible. They were given a few minutes of planning time before writing and were allowed to use a dictionary while writing. All essays were collected, checked, and returned with comments and corrections. Models of English essays were sometimes shown to the whole class, and English grammar and vocabulary were also explained when the essays were returned. I noticed that the students’ motivation for writing essays in English seemed to have decreased at the end of the first semester. Therefore I began to grade their essays from the first assigned essay in the second semester (the 9th essay) in an effort to motivate them to show their maximum English writing ability.

31Hokamura
Data CodingAll the essays written by the two participants were typed and coded for the four CAF measures shown in Table 1. Two units of analysis were used in this study: the T-unit and the clause. A T-unit is defined as a main clause plus any subordinate clauses (Hunt, 1965). Bardovi-Harlig (1992) explained that a sentence has two (or more) T-units when independent clauses (with subjects and finite verbs) are conjoined as shown in Example 1, but a single T-unit when one or more clauses are embedded in an independent clause as shown in Example 2.
Example 1. There was a woman next door, and she was a singer. 2 T-unitsExample 2. There was a woman next door who was a singer. 1 T-unit
A clause consists of a subject and a finite verb (Hunt, 1965). Finite verbs are verbs that can stand alone in an independent clause. There are two clauses in Examples 1 and 2.
Table 1. Measures of CAF
Category MeasuresComplexity Clauses per T-unit (C/T)
Mean length of clause (MLC)Accuracy Error-free clause ratio (EFCR)Fluency Words per 15 minutes (W/15M)
Measures of complexity used in this study were clauses per T-unit (C/T) and mean length of clauses (MLC). These two measures were used because they reflect different types of complexity: C/T can be used to measure in-creases in the number of subordinate clauses whereas MLC can be used to measure increases in pre- and postmodification within a phrase through the use of adjectives, adverbs, prepositional phrases, or nonfinite clauses, and the reduction of clauses into phrases, which helps to condense information (Norris & Ortega, 2009). Accuracy was measured as the error-free clause ratio (EFCR). The clause was chosen as a unit of analysis for measuring accuracy because essays from beginners and low-intermediate learners sometimes do not contain any correct T-units. A clause is, therefore, a better unit of analysis to investigate change in accuracy in beginners. For example,

32 JALT Journal, 40.1 • May 2018
Ishikawa (1995), who researched the English writing of low-proficiency Japanese learners, argued that the clause can tap into beginning-level writ-ing better than the T-unit because it is a smaller unit than the T-unit and it can, therefore, provide a smaller (i.e., more precise) context for examining language development. The measure of fluency used in this study was the total number of words in the 15-minute writing task (W/15M).
Data Analysis Several techniques developed by van Geert and van Dijk (2002), van Dijk et al. (2011), and Verspoor et al. (2011) were employed to gain insight into the dynamic developmental processes of Japanese students’ English writing. First, moving min-max graphs were used to visualize the degree of variabil-ity. Van Geert and van Dijk (2002) explained this technique in the following way:
This technique shows the data using the bandwidth of ob-served scores. Instead of displaying measurement points as simple dots, the moving min-max graph presents a score range for each measurement occasion. Instead of a single line graph, the data are presented in a bandwidth of scores. This method uses a moving window, a timeframe that moves up one posi-tion (measurement occasion) each time (the size of the win-dow, e.g., five consecutive data points, 1 month, etc. is called its period). Each window partly overlaps the preceding windows, using all the same measurement occasions minus the first and plus the next. For instance, for every set of seven consecutive measurements we calculate the maximum and the minimum values. This is done by way of a predetermined moving win-dow, such that we obtain the following series:max (t1…t7), max (t2…t8), max (t3…t9), etc.min (t1…t7), min (t2…t8), min (t3…t9), etc. (pp. 353-354)
In moving min-max graphs, the wider the bandwidth is, the higher the degree of variability. Van Geert and van Dijk (2002) argued that one could take windows of a size of about 1/10 of the entire data set, but in principle, no fewer than five data points should be used. The window size in this study was five consecutive data points because the entire data set was 20 data points (20 essays).
33Hokamura
The technique described above is exclusively descriptive, so the obser-vations were tested against chance variation by using resampling methods (van Dijk et al., 2011; van Geert & van Dijk, 2002). A Monte Carlo analysis was conducted to test whether the observed peaks defined as the positive distance between minimum and maximum values in the observations could have occurred by chance. In the analysis, the original data were reshuf-fled 5,000 times (i.e., 5,000 resampling simulations), and the peaks were tested for statistical significance. In other words, I obtained 5,000 positive distances between the minimum and maximum values by reshuffling the original data 5,000 times and calculated the probability that the peaks in the original data could have been produced by chance. The analysis was performed in Microsoft Excel, using Poptools, a statistical add-in developed by Hood (2009) that performs random sampling.
Moving correlation coefficients were used to investigate the dynamic patterns of interactions among the CAF measures. Moving correlation coef-ficients can display change in correlation coefficients. Moving windows of correlation coefficients were created in the same way that moving windows in min-max graphs were created (Verspoor et al., 2011). The window size was five consecutive data points. For instance, a correlation coefficient between EFCR and W/15M was calculated for every set of five consecutive measurements so that the following series was obtained:
correlation coefficient between EFCR and W/15M (1st essay…5th essay),correlation coefficient between EFCR and W/15M (2nd essay…6th essay), correlation coefficient between EFCR and W/15M (3rd essay…7th essay), etc.In addition to the moving correlation coefficients, Pearson’s correlation
coefficients were calculated to examine the overall correlations between all the measures and time. Time was a series of 20 data points (20 essays).
ResultsThe first research question, which asked how CAF changes over the course of one academic year, was answered by calculating Pearson correlation coef-ficients among the CAF measures and time and by creating min-max graphs. Table 2 shows the Pearson correlation coefficients. Results obtained for each measure are discussed in detail in the following section.

34 JALT Journal, 40.1 • May 2018
Table 2. Pearson’s Correlations Among Time and All the Measures, Means, and Standard Deviations
Measure 1 2 3 4 5 M SDMaki1.W/15M - .32 .54* -.49* .61** 89.55 23.37 2.CT .32 - -.04 -.24 .26 1.15 0.12 3.MLC .54* -.04 - -.11 .44 6.80 0.96 4.EFCR -.49* -.24 -.11 - .14 0.44 0.21 5.Time .61** .26 .44 .14 - - -Kumi1.W/15M - -.04 -.38 -.19 -.11 120.90 25.78 2.CT -.04 - .02 -.04 .45* 1.35 0.20 3.MLC -.38 .02 - .23 .38 7.71 1.04 4.EFCR -.19 -.04 .23 - .20 0.60 0.14 5.Time -.11 .45* .38 .20 - - -
Note . W/15M = words per 15 minutes; C/T = clauses per T-unit; EFCR = error-free clause ratio; MLC = mean length of clause.*p < .05. **p < .01.
Words per 15 Minutes as a Measure of FluencyThe wide bandwidth in the moving min-max graph for Maki (Figure 1) shows that the variability in fluency was high between the 7th and the 9th essays. After the phase of high variability, a developmental trend towards greater fluency was observed, as she consistently wrote between 80 and 120 words per 15 minutes, after writing between 60 and 100 words per 15 minutes during the earlier phase of the study. The correlation coefficient between time and W/15M (Table 2) was positive and statistically significant (r = .61, p < .01), indicating that her fluency improved during the course of the study. Kumi’s variability (Figure 1) was high during the early phase of the study, but it decreased after the 9th essay. Her W/15M was between 100 and 180 words during the early phase; in the later phase her W/15M decreased slightly to between 90 and 160 words. After the 17th essay her variability decreased slightly again and her W/15M was between 90 and

35Hokamura
150 words. Figure 1 shows that no developmental trend toward better flu-ency was observed for this participant over the course of the study.
Figure 1. A moving min-max graph (window size of five data points) of the developmental pattern of words per 15 minutes (W/15M). W/15M is a measure of fluency.
Error-Free Clause Ratio as a Measure of AccuracyMaki’s moving min-max graph (Figure 2) shows that the variability in ac-curacy was high during the early phase and it decreased after the 9th essay. There were almost no error-free clauses in some of her first nine essays with
Maki
Kumi
Essays
Essays
W/1
5MW
/15M
W/15Mmaxmin
W/15Mmaxmin

36 JALT Journal, 40.1 • May 2018
her EFCR a little above .10. However, after the 12th essay, her EFCR was consistently above .30, so a developmental trend toward better accuracy was observed after the initial phase of high variability. Kumi’s EFCR started with low variability and it increased after the 3rd essay. Her EFCR was be-tween .40 and .80 after the phase of low variability. This range was largely preserved toward the end of the study.
Figure 2. A moving min-max graph (window size of five data points) of the developmental pattern of error-free clause ratio (EFCR). EFCR is a measure of accuracy.
Maki
EFCR
EFCR
EFCRmaxmin
EFCRmaxmin
Kumi
Essays
Essays
37Hokamura
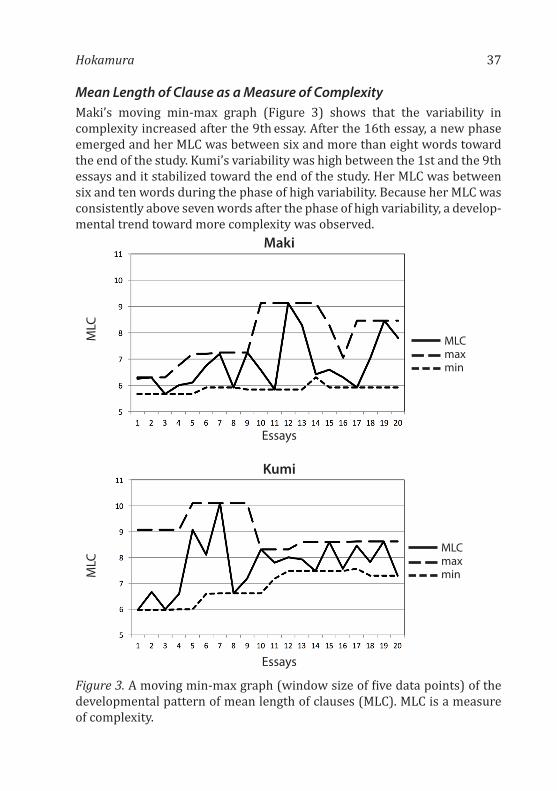
Mean Length of Clause as a Measure of ComplexityMaki’s moving min-max graph (Figure 3) shows that the variability in complexity increased after the 9th essay. After the 16th essay, a new phase emerged and her MLC was between six and more than eight words toward the end of the study. Kumi’s variability was high between the 1st and the 9th essays and it stabilized toward the end of the study. Her MLC was between six and ten words during the phase of high variability. Because her MLC was consistently above seven words after the phase of high variability, a develop-mental trend toward more complexity was observed.
Figure 3 . A moving min-max graph (window size of five data points) of the developmental pattern of mean length of clauses (MLC). MLC is a measure of complexity.
Maki
Kumi
Essays
Essays
MLC
MLC
MLCmaxmin
MLCmaxmin

38 JALT Journal, 40.1 • May 2018
Clauses per T-Unit as a Measure of ComplexityMaki’s C/T was between 1 and 1.4 over the entire course of the study (Fig-ure 4). In other words, she wrote almost no compound sentences, and her variability was low throughout the study. Kumi’s variability in complexity was low during the early phase of the study and her C/T was between 1.1 and 1.6 until the 13th essay. A new phase began after the 16th essay with her C/T ranging between 1.2 and 2 toward the end of the study. The moving min-max graph shows a developmental trend towards greater complexity. Moreover, the correlation between time and C/T (Table 2) was positive and statistically significant (r = .45, p < .05), indicating that her C/T improved during the study. She was writing more and more complex sentences to-wards the end of the study.
Figure 4. A moving min-max graph (window size of five data points) of the de-velopmental pattern of clauses per T-unit (C/T). C/T is a measure of complexity.
Maki
Kumi
Essays
Essays
C/T
C/T
C/Tmaxmin
C/Tmaxmin

39Hokamura
To answer the second research question concerning significant peaks in learners’ CAF development, a Monte Carlo analysis was performed for the measures of CAF that showed peaks (Figures 1, 2, and 3) and for statistically nonsignificant correlations with time (Table 2). A Monte Carlo simulation revealed that the peaks in all the measures were statistically nonsignificant (Maki: EFCR p = .07, MLC p = .07; Kumi: W/15M p = .47, MLC p = .16). These results indicate that the peaks were likely a result of random fluctuations.
To answer the third research question regarding how complexity, accu-racy, and fluency interact over the course of 1 academic year, graphs of mov-ing correlation coefficients between W/15M and the other CAF measures (Figure 5) were created to visualize the changing correlation coefficients. For Maki, the overall correlation coefficient between W/15M and the EFCR (Table 2) was negative and statistically significant (r = -.49, p < .05), and the moving correlation coefficient remained negative throughout the study (Figure 5). The overall correlation coefficient between W/15M and MLC was positive and statistically significant (r = .54, p < .05), and the moving cor-relation coefficient remained largely positive. These results indicate that for Maki, longer essays were associated with longer clauses but more errors. On the other hand, the moving correlation coefficient between W/15M and C/T increased during the early phase of the study, decreased in the later phase, and began to increase again towards the end of the study. These trends show that Maki’s longer essays were associated with more complex sentences at first and with simpler sentences later. Toward the end of the study, her longer essays were again associated with more complex sentences. To summarize, fluency and accuracy in Maki’s writing appear to have been competing with each other throughout the study, but fluency and MLC interacted positively for most of the study. The correlation between fluency and C/T changed throughout the study. Finally, fluency and both MLC and C/T started to in-teract positively with one another in the 14th essay and continued until the end of the study.
For Kumi, the overall correlation coefficients between W/15M and the other measures were negative and statistically nonsignificant (Table 2). Figure 5 shows that the moving correlation coefficient between W/15M and MLC was negative for most of the study. This result indicates that longer texts were associated with shorter clauses. The moving correlation coeffi-cients between W/15M and the EFCR and between W/15M and C/T moved in the opposite directions throughout the study. In other words, longer texts were associated with either more complex sentences and more errors or with fewer complex sentences and fewer errors. To summarize, both the

40 JALT Journal, 40.1 • May 2018
correlations between fluency and accuracy and between fluency and C/T changed throughout the study. However, fluency and MLC appear to have been competing against each other for most of the study.
Figure 5 . A moving correlation (window of five data points) between W/15M and EFCR, between W/15M and MLC, and between W/15M and C/T. W/15M = words per 15 minutes; EFCR = error-free clause ratio; MLC = mean length of clause; C/T = clauses per T-unit.
Maki
Kumi
Essays
Essays
Corr
elat
ion
of C
oeffi
ciem
tsCo
rrel
atio
n of
Coe
ffici
emts
W/15M & EFCRW/15M & MLCW/15M & C/T
W/15M & EFCRW/15M & MLCW/15M & C/T

41Hokamura
DiscussionThe primary purpose of this study was to investigate the development of CAF in the English writing of Japanese college students from a DST perspective. One characteristic of dynamic systems is the nonlinearity of development. The findings of this study support this characteristic: The developmental trajectories of all the measures used in this study were nonlinear. For exam-ple, although Maki’s fluency measure and Kumi’s C/T (one of the complex-ity measures) improved over the course of the study, they never improved linearly. Kumi’s fluency measure, which showed no increasing trend over the course of study, also followed a nonlinear trajectory. These results are consistent with those of previous research (Baba & Nitta, 2014; Polat & Kim, 2013; Spoelman & Verspoor, 2010).
Another characteristic of dynamic systems is the interconnectedness of their subsystems. Although only three CAF constructs were investigated in this study, they were found to be interconnected, influencing one another. For example, for most of the study, Maki’s fluency and accuracy measures competed against each other, whereas her fluency measure and MLC (one of the complexity measures) positively interacted. In contrast, Kumi’s fluency measure and MLC competed against each other for most of the study, and longer texts were associated with negative correlations between the accu-racy measure and C/T.
Another characteristic of dynamic systems is stabilization in attractor states. Attractor states were observed in some of the measures used in this study. For example, Maki’s MLC in the early essays and Kumi’s MLC to-wards the end of the study remained within steady bandwidths. Maki’s C/T throughout the study appeared to remain within steady bandwidths. These observations suggest that the subsystems might have settled into attractor states and stabilized in those states. Maki’s MLC might have been pulled out of the attractor state after the 9th essay, as MLC showed variability from the 9th essay to the end of the study.
Furthermore, after the phase of high variability, Maki’s fluency and ac-curacy measures improved, as did Kumi’s MLC. Maki’s fluency measure showed high variability between the 7th and 9th essays, and a develop-mental trend was observed after the 12th essay. Maki’s accuracy measure showed high variability during the early phase, and then a developmental trend was observed toward the end of the study. Kumi’s MLC showed high variability between the 1st and the 9th essays, and then the variability stabi-lized and a developmental trend was observed toward the end of the study.

42 JALT Journal, 40.1 • May 2018
These findings support the argument that variability is the driving force of development in dynamic systems (de Bot et al., 2007; van Dijk et al., 2011).
Finally, some changes in CAF were observed after the 9th essay, when I started to grade the participants’ essays. A possible explanation for this change is that I told the participants that their essays would be graded based on CAF, and that the grades would influence their final grade in the English class. It is possible that the participants’ concern over the final grade made them work harder to obtain a higher grade for the essays.
CAF constructs are rarely positively correlated with one another over the course of the study, a finding that lends support to the trade-off hypoth-esis (Skehan & Foster, 2001). However, two of the three CAF constructs did sometimes correlate positively. For example, Maki’s fluency and complexity measures positively correlated after the 14th essay. Kumi’s fluency and ac-curacy measures positively correlated after the 14th essay. These findings are consistent with Skehan’s (1998) suggestion that high-level performance can occur in two out of the three CAF constructs. One exception is the CAF meas-ures for Kumi, which positively correlated around the 17th essay (Figure 5). This finding supports Gunnarsson’s (2011) argument that CAF can improve simultaneously when lower level linguistic aspects such as vocabulary, spell-ing, and grammar are being automatized to improve accuracy and fluency, and enough cognitive capacity is freed up to improve complexity. However, because this trend was observed only toward the end of the study, further research is needed to examine the simultaneous development of CAF.
The results showed how all three CAF constructs changed and interacted with one another over the same period in a structured way. As such, the find-ings illuminate the developmental patterns of language acquisition of the two participants. Moreover, the findings indicated that examining individual learners’ developmental trajectory is pedagogically useful. For example, Ma-ki’s C/T remained between 1.0 and 1.4 throughout the study, suggesting that a pedagogical intervention was needed to push her out of the attractor state.
LimitationsThis study has several important limitations. First, each writing task used in the study was limited to 15 minutes. As Weigle (2002) argued, however, writ-ing done under timed conditions may not accurately reflect the writers’ true ability, because writing ability is not a simple construct; rather, it involves numerous processes such as planning, writing, monitoring, and revising. Although the participants were given a few minutes to plan their responses before writing them, it is not clear whether 15 minutes was sufficient for all

43Hokamura
the processes involved in completing a writing task. Second, even though the DST approach highlights the importance of considering a large number of cognitive and social factors in language development, this study focused on only three cognitive variables—complexity, accuracy, and fluency (CAF). The development of English writing was viewed here as a system and the elements of CAF were viewed as its subsystems, which in turn influence language development. However, the development of English writing and its subsystems, CAF, might have been influenced by other subsystems, such as situational, learner, and instructional variables. These variables could include goal orientation, motivation, English proficiency, learning style, physical conditions of the learners, instructional design, and physical envi-ronment as well as various political and social conditions. To give just one example, consider the big difference between Maki’s and Kumi’s outcomes that was observed despite these students’ being in the same class with the same teacher and doing the same thing. This difference may be attributable to the differences in their initial English proficiency, which may have influ-enced the development of CAF. On the placement test conducted in the first semester, their scores were quite different on the vocabulary and reading part. Future research should look at these and other relevant variables that may explain language development.
ConclusionThis study was an investigation of the development of English writing of two Japanese university students over the course of 1 academic year, using the complexity, accuracy, and fluency (CAF) framework. Data were analyzed from a dynamic systems theory (DST) perspective. The findings indicated that the participants’ CAF changed as predicted by the key characteristics of dynamic systems and that the three CAF constructs rarely positively corre-lated with one another over the course of the study. This study underscores the importance of conducting longitudinal studies of individual learners to investigate developmental trajectories and processes of language develop-ment. It also supports the use of all three CAF constructs in the investigation of developmental patterns of L2 language acquisition.
AcknowledgmentsI am grateful to Katerina Petchko and David Beglar for their invaluable feed-back that aided me in writing the manuscript.

44 JALT Journal, 40.1 • May 2018
Michiyo Hokamura is currently doing doctoral research at Temple Univer-sity, Japan. Her interest is in the development of second language writing.
ReferencesAbraham, R. (1994). Chaos, gaia, eros: A chaos pioneer uncovers the three great
streams of history. San Francisco, CA: Harper.Baba, K., & Nitta, R. (2014). Phase transitions in development of writing fluency
from a complex dynamic systems perspective. Language Learning, 64, 1-35. https://doi.org/10.1111/lang.12033
Baddeley, A. (2007). Working memory, thought, and action. Oxford, England: Oxford University Press. https://doi.org/10.1093/acprof:oso/9780198528012.001.0001
Bardovi-Harlig, K. (1992). A second look at T-unit analysis: Reconsidering the sentence. TESOL Quarterly, 26, 390-395. https://doi.org/10.2307/3587016
Brumfit, C. (1984). Communicative methodology in language teaching: The roles of fluency and accuracy. Cambridge, England: Cambridge University Press.
de Bot, K. (2008). Introduction: Second language development as a dynamic process. The Modern Language Journal, 92, 166-178. https://doi.org/10.1111/j.1540-4781.2008.00712.x
de Bot, K., & Larsen-Freeman, D. (2011). Researching second language development from a dynamic systems theory perspective. In M. H. Verspoor, K. de Bot, & W. Lowie (Eds.), A dynamic approach to second language development (pp. 5-23). Amsterdam, the Netherlands: John Benjamins. https://doi.org/10.1075/lllt.29.01deb
de Bot, K., Lowie, W., & Verspoor, M. (2007). A dynamic systems theory approach to second language acquisition. Bilingualism: Language and Cognition, 10, 7-21. https://doi.org/10.1017/s1366728906002732
Educational Testing Service. (2012). Proficiency scale. Retrieved from http://www.toeic.or.jp/library/toeic_data/toeic/pdf/data/proficiency.pdf
Foster, P., & Skehan, P. (1996). The influence of planning and task type on second language performance. Studies in Second Language Acquisition, 18, 299-323. https://doi.org/10.1017/S0272263100015047
Gaddis, J. L. (2002). The landscape of history: How historians map the past. Oxford, England: Oxford University Press.
General Tests of English Language Proficiency. (n.d.). How the G-TELP differs from other tests. Retrieved from http://www.g-telp.jp/english/differs.html

45Hokamura
Gunnarsson, C. (2011). The development of complexity, accuracy and fluency in the written production of L2 French. In A. Housen, F. Kuiken, & I. Vedder (Eds.), Dimensions of L2 performance and proficiency: Complexity, accuracy and fluency in SLA (pp. 247-276). Amsterdam, the Netherlands: John Benjamins.
Hood, G. (2009). Poptools [Computer software]. Canberra, Australia: Pest Animal Control Co-operative Research Centre (CSIRO). Retrieved from http://www.poptools.org
Housen, A., & Kuiken, F. (2009). Complexity, accuracy, and fluency in second language acquisition. Applied Linguistics, 30, 461-473. https://doi.org/10.1093/applin/amp048
Hunt, K. W. (1965). Grammatical structures written at three grade levels. Champaign, IL: The National Council of Teachers of English.
Ishikawa, S. (1995). Objective measurement of low-proficiency EFL narrative writ-ing. Journal of Second Language Writing, 4, 51-69. https://doi.org/10.1016/1060-3743(95)90023-3
Larsen-Freeman, D., & Cameron, L. (2008). Research methodology on language development from a complex systems perspective. The Modern Language Journal, 92, 200-213. https://doi.org/10.1111/j.1540-4781.2008.00714.x
Lorenz, E. N. (1963). Deterministic nonperiodic flow. Journal of the Atmospheric Sciences, 20, 130-141. https://doi.org/10.1175/1520-0469(1963)020<0130:DNF>2.0.CO;2
Meara, P. (2004). Modelling vocabulary loss. Applied Linguistics, 25, 137-155. https://doi.org/10.1093/applin/25.2.137
Norris, J. M., & Ortega, L. (2009). Towards an organic approach to investigating CAF in instructed SLA: The case of complexity. Applied Linguistics, 30, 555-578. https://doi.org/10.1093/applin/amp044
Polat, B., & Kim, Y. (2013). Dynamics of complexity and accuracy: A longitudinal case study of advanced untutored development. Applied Linguistics, 35, 184-207. https://doi.org/10.1093/applin/amt013
Reynolds, C. W. (1987). Flocks, herds, and schools: A distributed behavioral model. Computer Graphics, 21(4), 25-34. https://doi.org/10.1145/37402.37406
Selinker, L. (1972). Interlanguage. International Review of Applied Linguistics in Language Teaching, 10, 209-231. https://doi.org/10.1515/iral.1972.10.1-4.209
Skehan, P. (1989). Individual differences in second language learning . New York, NY: Routledge.
Skehan, P. (1998). A cognitive approach to language learning. New York, NY: Oxford University Press.
46 JALT Journal, 40.1 • May 2018
Skehan, P., & Foster, P. (2001). Cognition and tasks. In R. Peter (Ed.), Cognition and second language instruction (pp. 183-205). Cambridge, England: Cambridge University Press. https://doi.org/10.1017/CBO9781139524780.009
Spoelman, M., & Verspoor, M. (2010). Dynamic patterns in development of accuracy and complexity: A longitudinal case study in the acquisition of Finnish. Applied Linguistics, 31, 532-553. https://doi.org/10.1093/applin/amq001
Steenbeek, H., Jansen, L., & van Geert, P. (2012). Scaffolding dynamics and the emer-gence of problematic learning trajectories. Learning and Individual Differences, 22, 64-75. https://doi.org/10.1016/j.lindif.2011.11.014
Thom, R. (1975). Structural stability and morphogenesis: An outline of a general theory of models. Reading, MA: W. A. Benjamin.
van Dijk, M., Verspoor, M., & Lowie, W. (2011). Variability and DST. In M. H. Verspoor, K. de Bot, & W. Lowie (Eds.), A dynamic approach to second language develop-ment methods and techniques (pp. 55-84). Amsterdam, the Netherlands: John Benjamins. https://doi.org/10.1075/lllt.29.04van
van Geert, P., & van Dijk, M. (2002). Focus on variability: New tools to study intra-individual variability in developmental data. Infant Behavior & Development, 25(4), 340-374. https://doi.org/10.1016/S0163-6383(02)00140-6
VanPatten, B. (1990). Attending to form and content in the input: An experiment in consciousness. Studies in Second Language Acquisition, 12, 287-301. https://doi.org/10.1017/S0272263100009177
Verspoor, M. H., Lowie, W., van Geert, P., van Dijk, M., & Schmid, M. S. (2011). How to sections. In M. H. Verspoor, K. de Bot, & W. Lowie (Eds.), A dynamic approach to second language development methods and techniques (pp. 129-199). Amster-dam, the Netherlands: John Benjamins. https://doi.org/10.1075/lllt.29.08ver
Vyatkina, N., Hirschmann, H., & Golcher, F. (2015). Syntactic modification at early stages of L2 German writing development: A longitudinal learner corpus study. Journal of Second Language Writing, 29, 28-50. https://doi.org/10.1016/j.jslw.2015.06.006
Weigle, S. C. (2002). Assessing writing. Cambridge, England: Cambridge University Press. https://doi.org/10.1017/CBO9780511732997
Wolfe-Quintero, K., Inagaki, S., & Kim, H.-Y. (1998). Second language development in writing: Measures of fluency, accuracy and complexity. Manoa, HI: Second Language Teaching & Curriculum Center, University of Hawaii.