the dynamics of a delay model of hepatitis …kuang/paper/hbv-ehnk.pdf · the dynamics of a delay...
TRANSCRIPT

MATHEMATICAL BIOSCIENCES doi:10.3934/mbe.2009.6.283AND ENGINEERINGVolume 6, Number 2, April 2009 pp. 283–299
THE DYNAMICS OF A DELAY MODEL OF HEPATITIS BVIRUS INFECTION WITH LOGISTIC HEPATOCYTE GROWTH
Steffen Eikenberry
Department of Mathematics and Statistics, Arizona State UniversityTempe, AZ 85287
Sarah Hews
Department of Mathematics and Statistics, Arizona State UniversityTempe, AZ 85287
John D. Nagy
Department of Biology, Scottsdale Community College
Scottsdale, AZ 85256
Yang Kuang
Department of Mathematics and Statistics, Arizona State University
Tempe, AZ 85287
Abstract. Chronic HBV affects 350 million people and can lead to deaththrough cirrhosis-induced liver failure or hepatocellular carcinoma. We ana-
lyze the dynamics of a model considering logistic hepatocyte growth and a
standard incidence function governing viral infection. This model also consid-ers an explicit time delay in virus production. With this model formulation
all model parameters can be estimated from biological data; we also simulatea course of lamivudine therapy and find that the model gives good agreement
with clinical data. Previous models considering constant hepatocyte growth
have permitted only two dynamical possibilities: convergence to a virus freeor a chronic steady state. Our model admits a third possibility of sustained
oscillations. We show that when the basic reproductive number is greater than
1 there exists a biologically meaningful chronic steady state, and the stabilityof this steady state is dependent upon both the rate of hepatocyte regeneration
and the virulence of the disease. When the chronic steady state is unstable,
simulations show the existence of an attracting periodic orbit. Minimum hepa-tocyte populations are very small in the periodic orbit, and such a state likely
represents acute liver failure. Therefore, the often sudden onset of liver failurein chronic HBV patients can be explained as a switch in stability caused bythe gradual evolution of parameters representing the disease state.
1. Introduction. Hepatitis B virus (HBV) causes an enormous amount of humansuffering, particularly in Asia, sub-Saharan Africa, parts of the Arabian Peninsula,the South Pacific, tropical South America, and arctic North America [1]. Currently,about two billion people—roughly 30% of the human population—have been in-fected by HBV. The virus targets the liver, and about 17.5% (350 million) of those
2000 Mathematics Subject Classification. Primary: 34K20, 92C50; Secondary: 92D25.Key words and phrases. hepatitis B, HBV, mathematical model, delay, acute liver failure.This research is partially supported by the NSF grant DMS-0436341 and the grant
DMS/NIGMS-0342388 jointly funded by NIH and NSF..
283
284 S. EIKENBERRY, S. HEWS, J. D. NAGY AND Y. KUANG
who harbor an active HBV infection suffer chronic hepatitis [34]. Up to 0.06%of HBV-infected persons are likely to die from complications associated with thedisease within the year [21]. But mortality is not the only way HBV impacts thehuman population. All who suffer HBV infection experience significant morbidity,ranging from weeks to months of nausea, fatigue, jaundice, and joint pain associ-ated with acute disease to liver cirrhosis or hepatocellular carcinoma characteristicof late-stage chronic infection.
Primarily because of HBV’s significance as a global public health threat, the virusand its associated disease have attracted considerable attention from mathematicaland theoretical biologists [10, 27, 29, 30, 7, 6]. The models typically used to studyHBV dynamics within the host tend to focus on healthy cells, free virus, and in-fected cells. Most of these models formulate viral infection as a mass action processbetween free virions and healthy cells. Some further assume a constant influx ofhealthy cells from an outside source. For example, the following phenomenologicalmodel has been widely used in the study of HBV and other viral diseases, includingHIV:
dx
dt= r − dx− βvx,
dy
dt= βvx− ay,
dv
dt= ky − µv.
(1.1)
The number or mass of healthy cells is represented by x, that of infected cells by y,and that of the free virion load by v. Healthy hepatocytes enter the liver from anoutside source at rate r, and hepatocytes die at rate d.
The mass action term used to model infection of healthy hepatocytes by freevirions is biologically problematic in several ways. Gourley et al. [10] showedthat this assumption causes the basic reproductive number, R0, to depend uponthe homeostatic liver size, r/d. Thus, this model makes the dubious predictionthat individuals with smaller livers should be less susceptible to HBV infection.Furthermore, the mass action constant, β, has no clear biological meaning.
Gourley et al. [10] extended model (1.1) by assuming HBV infection of healthycells is governed not by mass action but by a standard incidence function. Inparticular, the mass action term in (1.1) is replaced by
βvx
T, (1.2)
where T is the total number of liver cells, infected or not. Under their formulationR0 loses its dependence on liver size. Also, β in (1.2) has a clear biological meaning.It can be interpreted either as the maximum rate at which virions infect healthycells, or as the probability that a single virion infects any cell in a healthy liver ina unit interval of time.
A shortcoming of both model (1.1) and the Gourley et al. formulation is theassumption that healthy hepatocytes are replenished at a constant rate. Mathemat-ically, this assumption limits the allowed asymptotic behaviors to only two genericcases [10, 27, 29, 30]: if R0 < 1 then the homeostatic set-point, (r/d, 0, ..., 0), isglobally asymptotically stable, but if R0 > 1 then a persistent chronic steady stateis approached in all cases.
On biological grounds, this assumption of constant hepatocyte influx is clearly in-appropriate. It is well established that liver regeneration following injury is achieved

THE DYNAMICS OF A DELAY MODEL OF HBV INFECTION 285
by widespread hepatocyte proliferation [26, 19, 31], not “reseeding” from an out-side source. Also, as we argue below, complete liver regeneration following partialhepatectomy in animal models implies that hepatocyte proliferation depends onliver mass. Therefore, we propose an alternative model of HBV dynamics in whichhepatocyte proliferation rate is described by a logistic function. We show that thisassumption can produce rich, biologically significant dynamics when R0 > 1. Inparticular, the asymptotic behavior can switch from a stable chronic equilibriumto an attracting periodic orbit, with an unstable chronic equilibrium, and that thisswitch is governed by both the virulence of the infection and the rate at which hep-atocytes regenerate. We argue that the gradual evolution of parameters describingliver regeneration and HBV virulence over the course of chronic infection can leadto a sudden change in disease dynamics as the stability switch is crossed. Since thisswitch can occur for realistic parameter values, the model predicts that the onset ofacute liver failure can be predicted by the sudden onset of oscillations in viral load.
A further advantage of this model is that all parameters can be estimated directlyfrom empirical biological data. To validate our approach, we model a course oflamivudine therapy and find that empirically determined parameter values yielddynamics in close agreement with clinical data.
2. Full model. The liver has a remarkable ability to regenerate following injury.This regeneration is driven by normal hepatocytes, which unlike the terminally dif-ferentiated cells dominating most other tissues, retain an inherent “steminess.” Thatis, mature hepatocytes can still divide and replenish others lost in a fully developedliver. Furthermore, this regeneration occurs at an extremely fast rate. For example,rat livers completely regenerate within a week following experimental hepatectomyof two-thirds of the organ (2/3 PHx) [26]. Regeneration is accomplished by severalcycles of mitosis involving a large fraction of mature hepatocytes, although pro-gressively fewer hepatocytes participate in each subsequent cycle [26, 31]. Preciselyhow these regenerative cycles are initiated and controlled is still under debate, buthemodynamics appears to play a definitive role. A 2/3 PHx exposes hepatocytesto a threefold increase in portal vein blood flow, which appears to lower hepatocyteapoptosis rates [25] and perhaps increases their exposure to growth factors [26].
The results of Lambotte et al. [19] indicate that early changes in hemodynamicsfollowing both 2/3 PHx or a “temporary” partial hepatectomy “prime” hepatocytesfor proliferation. However, regenerative proliferation occurs only when the actualliver mass is reduced. Following a 1/3 PHx, the regenerative response can increasefollowing further resection, at least 10 hours later. Also, regeneration can decreasein response to a liver graft (increase in liver mass) up to 18 hours after the initialresection. These results strongly indicate that hepatocyte proliferative activity iscontrolled by the actual mass of the liver and that hemodynamics play a role inpreparing hepatocytes for proliferation. Therefore, we conclude that the growthsignal for hepatocytes is directly proportional to the total liver cell populationand that signal strength is approximately uniform throughout the entire liver. Wechoose, as a reasonable approximation of the cellular response to such a signal, alogistic term to represent hepatocyte proliferation rate.
Like Gourley et al. [10] we employ a standard incidence function to describevirion infection of healthy cells and explicitly consider a delay between viral infectionand production. These considerations produce the following model:

286 S. EIKENBERRY, S. HEWS, J. D. NAGY AND Y. KUANG
dx
dt= rx(t)
(1− T (t)
K
)− dx(t)− βv(t)
x(t)T (t)
, (2.1)
dp
dt= −dp(t) + βv(t)
x(t)T (t)
− βe−dτv(t− τ)x(t− τ)T (t− τ)
, (2.2)
dy
dt= βe−dτv(t− τ)
x(t− τ)T (t− τ)
− ay(t), (2.3)
dv
dt= ky(t)− µv(t), (2.4)
where
T (t) = x(t) + y(t) + p(t).
To simplify analysis we define
r = r − d,
K =K(r − d)
r,
and rewrite equation (2.1) as
dx
dt= rx(t)
(1− T (t)
K
)− βv(t)
x(t)T (t)
. (2.5)
The number of healthy hepatocytes is x(t), p(t) is the number of healthy cellsthat have been infected but are not yet producing virions (latent infection), y(t) isthe number of infected cells actively producing virions (productively infected cells),and v(t) is the number of free virions.
2.1. Healthy hepatocytes. Equation (2.1) describes the behavior of healthy hep-atocytes, which proliferate according to a signal that takes on a logistic form, withmaximum per-capita proliferation rate r, and homeostatic liver size K. We assumethat hepatocytes die at constant per-capita rate d. They are infected by free virionsat maximum rate β, according to a standard incidence function. In equation (2.5), r
equates to an ecologist’s maximum intrinsic rate of increase, and K is the observedequilibrium mass of a healthy liver.
2.2. Latently infected hepatocytes. Equation (2.2) describes the behavior ofhepatocytes that have been infected, but are not yet actively producing virions. Weassume that all infected cells initially enter a period of latent infection that lastsexactly τ days. Like healthy hepatocytes, latently infected cells die at backgroundrate d. This assumption is based on an implicit assumption that latently infectedcells are not targeted by the immune response. After τ days, latently infected cellsbecome productively infected. Therefore, all cells infected t− τ days ago, where t isthe current time, will either transition to the productive class (proportion 1−e−dτ )or die in the meantime (proportion e−dτ ). Thus, the delay term can be constructeddirectly from the underlying biology, although it is also possible to derive this termmore rigorously using an age-structured approach, as in [10].

THE DYNAMICS OF A DELAY MODEL OF HBV INFECTION 287
2.3. Productively infected hepatocytes. Equation (2.3) describes the behav-iors of hepatocytes that are actively producing virions. The transition from thelatent to productive infection has already been described. Productively infectedhepatocytes die at rate a, where typically a ≥ d since, in addition to backgroundmortality, productive cells are visible to the immune system. Indeed, both inflam-matory and cytotoxic immunity appear to play definitive roles in HBV pathogenesis[12, 16]. Since we are considering only the case in which the immune response issub-optimal, leading to chronic infection, we posit no immune-induced mortalitybeyond a constant rate of attrition.
2.4. Free virions. Equation (2.4) expresses the dynamics of free virions. Theyare produced at rate k per productively infected hepatocyte per unit time, anddisintegrate or are cleared by immune attack at rate µ.
A straightforward calculation gives the following expression for the basic repro-ductive number in model (2.1) – (2.4):
R0 =βke−dτ
aµ.
3. Model properties. In this section we establish the positivity of model (2.1) –(2.4), and we describe the model equilibria and their local stability properties. Weend the section with a computational exploration of the model’s behavior.
3.1. Initial data. As in [10], initial data for the system has the form
x(s) = x0(s) ≥ 0, y(s) = y0(s) ≥ 0, v(s) = v0(s) ≥ 0, p(s) = p0(s) ≥ 0, (3.1)K ≥ T (s) = x(s) + p(s) + y(s) > 0, y(0) > 0, s ∈ [−τ, 0]. (3.2)
and
p0(0) = β
∫ 0
−τ
edsv0(s)x0(s)x0(s) + y0(s) + p0(s)
ds.
The form for p0 follows from the implicit solution for p(t)
p(t) = β
∫ t
t−τ
e−d(t−s)v(s)x(s)x(s) + y(s) + p(s)
ds. (3.3)
The case of T (0) = 0 represents the case of total loss of liver function which ismathematically trivial and of no practical interest.
3.2. Positivity. We show below that the solution of system (2.1) – (2.4), subjectto (3.1), remains bounded (and hence exists for all time) and is nonnegative for allt > 0.
Proposition 1. Each component of the solution of system (2.1) – (2.4), subject to(3.1), remains bounded and nonnegative for all t > 0.
Proof. Notice that system (2.1) – (2.4) is locally Lipschitzian at t = 0. Hence thesolution of system (2.1) – (2.4), subject to (3.1), exists and is unique on [0, b) forsome b > 0. Observe that if x(0) = 0, then x(t) ≡ 0 for all t > 0. Hence we assumebelow that x(0) > 0. Notice also that if v(0)=0, then v′(0) = ky(0) > 0, whichimplies that for small t > 0, we have v(t) > 0. Hence we may simply assume belowthat v(0) > 0.

288 S. EIKENBERRY, S. HEWS, J. D. NAGY AND Y. KUANG
Assume first that there is a b > t1 > 0 such that x(t1) = 0 and x(t) > 0, p(t) >0, y(t) > 0, v(t) > 0 for t ∈ (0, t1). Observe that
dT
dt= rx(t)
(1− T (t)
K
)− dx(t)− dp(t)− ay(t).
It is easy to show that 0 < T (t) ≤ K for t ∈ [0, t1]. In fact, we can see thatdTdt ≥ −(d + a)T (t) for t ∈ [0, t1], which yields
T (t) ≥ T (0)e−(d+a)t1 .
Clearly y(t) ≤ K for t ∈ [0, t1], which implies that v(t) ≤ V ≡ max{v(0), kK/µ}for t ∈ [0, t1]. These observations imply that for t ∈ [0, t1], we have
dx(t)dt
≥ −(d + βV e(d+a)t1/T (0))x(t).
Hencex(t1) ≥ x(0)e−(d+βV e(d+a)t1/T (0))t1 > 0,
a contradiction.Assume now that there is a b > t1 > 0 such that p(t1) = 0 and x(t) > 0, p(t) >
0, y(t) > 0, v(t) > 0 for t ∈ (0, t1). Since p(t) = β∫ t
t−τ
e−d(t−s)v(s)x(s)x(s) + y(s) + p(s)
ds, we
have
p(t1) = β
∫ t1
t1−τ
e−d(t−s)v(s)x(s)x(s) + y(s) + p(s)
ds > 0,
a contradiction.Assume now that there is a b > t1 > 0 such that y(t1) = 0 and x(t) > 0, p(t) >
0, y(t) > 0, v(t) > 0 for t ∈ (0, t1). Equation (2.3) implies that y′(t) ≥ −ay(t) fort ∈ [0, t1] which yields y(t1) > y(0)e−at1 > 0, also a contradiction.
Finally, we assume that here is a b > t1 > 0 such that v(t1) = 0 and x(t) >0, p(t) > 0, y(t) > 0, v(t) > 0 for t ∈ (0, t1). Clearly, this case is similar to the caseof y(t1) = 0 and a contradiction can be obtained.
The above contradictions together show that components of the solution of sys-tem (2.1) – (2.4), subject to (3.1), are nonnegative for all t ∈ [0, b). This togetherwith the uniform boundedness of T (t) and v(t) on [0, b) imply that b = ∞. Thiscompletes the proof of the proposition.
3.3. Steady states. There exist three steady states: E0 = (0, 0, 0, 0),Ef = (K, 0, 0, 0), and E∗ = (x∗, p∗, y∗, v∗). E0 is biologically meaningless except,perhaps, in the context of a developing liver, and Ef represents a healthy, matureliver. E∗ is a state of persistent, chronic HBV infection. Explicitly, E∗ requires
x∗ =KaM
rβke−dτN,
p∗ = −KaM(−aµ + kβe−dτ + aµe−dτ − kβe−2dτ )rβkµe−dτN2
,
y∗ =Kd(aµ− kβe−dτ )M
rβkµN2,
v∗ =MKd(aµ− kβe−dτ )
rβµ2N2,

THE DYNAMICS OF A DELAY MODEL OF HBV INFECTION 289
where
M = (−daµ− aµr + e−dτ (−dµr + dβk + aµr)),
N = (−a− de−dτ + ae−dτ ).
3.4. Stability. Here we focus on the stability of the biologically relevant equilibriaand their bifurcation behavior. In particular, we show that the disease-free state,Ef , is asymptotically stable when R0 < 1, as required by biological intuition. Theequilibrium representing chronic infection, E∗, is treated computationally. Thisanalysis leads to the most important biological result of the research, viz. that E∗
undergoes a clinically relevant bifurcation. That is, for clinically relevant parametervalues this fixed point experiences a stability switch as certain parameters change.This bifurcation should be clinically evident in certain cases as the sudden onset ofoscillations in viral load and liver damage.
3.4.1. Mathematical results. The local asymptotic stability of a steady state canusually be determined from the roots of the characteristic equation, det(P +Qe−λτ−λI). However, due to the form of the standard incidence function, we cannot deter-mine the local stability of E0 with the linearized equations. We do determine thatEf is locally asymptotically stable when R0 < 1 and unstable when R0 > 1. Forour model
P =
r −2rx
K−
βv(y + p)
(x + y + p)2βvx
(x + y + p)2βvx
(x + y + p)2−
βx(x + y + p)
(x + y + p)2
βv(y + p)
(x + y + p)2−d−
βvx
(x + y + p)2−
βvx
(x + y + p)2βx(x + y + p)
(x + y + p)2
0 0 −a 0
0 0 k −µ
,
and
Q =
0 0 0 0
−βe−dτv(y + p)
(x + y + p)2βe−dτvx
(x + y + p)2βe−dτvx
(x + y + p)2−βe−dτx(x + y + p)
(x + y + p)2
βe−dτv(y + p)
(x + y + p)2− βe−dτvx
(x + y + p)2− βe−dτvx
(x + y + p)2βe−dτx(x + y + p)
(x + y + p)2
0 0 0 0
.
At Ef , the characteristic equation is
(r + λ)(d + λ)(λ2 + (a + µ)λ + (aµ− kβe−(d+λ)τ )) = 0, (3.4)
where the roots are λ1 = −r, λ2 = −d, and λ3,4 are given by the solution of
λ2 + (a + µ)λ + (aµ− kβe−(d+λ)τ ) = 0. (3.5)
Observe that λ = 0 when aµ− kβe−dτ = 0. Rewriting this as
kβe−dτ
aµ= 1 = R0
confirms our calculation of R0.

290 S. EIKENBERRY, S. HEWS, J. D. NAGY AND Y. KUANG
Proposition 2. When R0 < 1, the virus-free equilibrium, Ef , is locally asymptot-ically stable.
Proof. We apply the results of Beretta and Kuang [2]. Let (3.5) be written as
D(λ, τ) := λ2 + a(τ)λ + b(τ)λe−λτ + c(τ) + d(τ)e−λτ , (3.6)where a(τ) = a + µ, b(τ) = 0, c(τ) = aµ, and d(τ) = −kβe−dτ .
Since c(τ) + d(τ) 6= 0 and for any τ , b(τ) and d(τ) are not simultaneously zero,we can use the results presented in Section 4 of [2]:
∆ = (2aµ− (a + µ)2)2 − 4(a2µ2 − k2β2e−2dτ )2, (3.7)
and
ω2+ =
12((2aµ− (a + µ)2) +
√∆), ω2
− =12((2aµ− (a + µ)2)−
√∆). (3.8)
Since ∆ < 0, ω2± do not exist. By Theorem 1.4 in [17], there is no stability
switch when R0 < 1. For τ = 0, the characteristic equation becomes λ2 + (a +µ)λ + (aµ − kβ) = 0. Since aµ > kβ when R0 < 1, the virus-free equilibrium islocally asymptotically stable. Since it can’t switch stability, the equilibrium mustbe locally asymptotically stable for any τ , provided R0 < 1.
Proposition 3. When R0 < 1, the virus-free equilibrium, Ef , is globally asymp-totically stable, provided the initial data satisfies (3.1).
Proof. We have that y and v satisfy the differential inequalitydy
dt≤ βe−dτv(t− τ)− ay(t),
dv
dt≤ ky(t)− µv(t).
Therefore, we can apply Theorem 3.2 of [10] and conclude that (y(t), v(t)) → 0 ast →∞ when R0 < 1. It is clear from equations (1.1) and (1.2) that if (y(t), v(t)) → 0then x(t) → K and p(t) → 0. Thus, Ef is globally attractive.
Proposition 4. When R0 > 1 the virus-free equilibrium, Ef , is unstable.
Proof. When R0 > 1, ∆ > 0, ω2+ exists and ω2
− does not. Since that signifies aswitch in stability, Ef must become unstable.
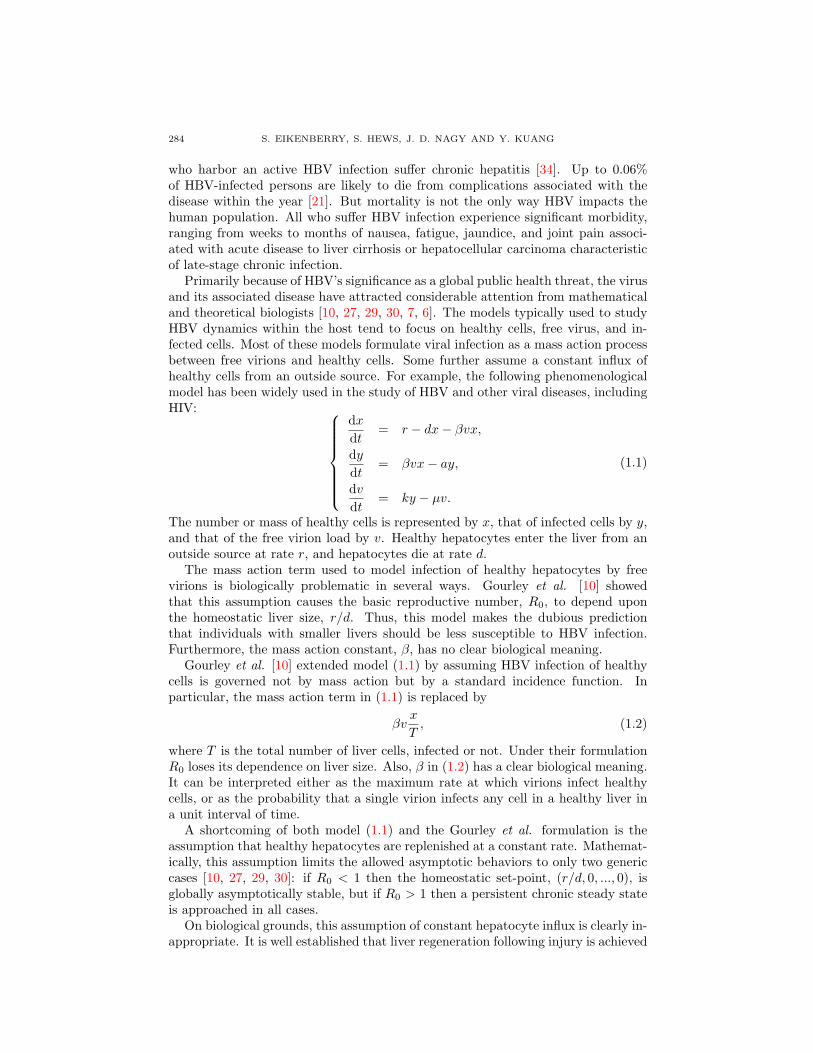
3.4.2. Computational results. Numerical solutions show that the stability of theequilibrium representing chronic infection is determined by r and the parameters a,β, d, k, µ, and τ , which collectively determine R0. The only parameter that doesnot have an effect is K, the homeostatic set point for liver size. In other words,the liver’s ability to recover from damage, along with the virulence of the virus,determine the final disease state—a reasonable conclusion on biological grounds.When the chronic disease steady state becomes unstable, we observe the formationof a stable, periodic orbit, provided R0 > 1. Figure 1 shows bifurcation diagramsusing r, k, β, and a as bifurcation parameters. The observed bifurcations occurfor reasonable values of all parameters (see below). Shown is the stability of the
THE DYNAMICS OF A DELAY MODEL OF HBV INFECTION 291
(a) r (b) β
(c) k (d) a
Figure 1. Bifurcation diagrams for r, k, β, and a. Fixed parame-ters are d = 0.0039, µ = 0.693, τ = 1, and K = 2×10¹¹. The otherparameters used are (a) a = 0.0693, β = 0.0014, and k = 200,(b) r = 0.7, a = 0.0693 , and k = 300, (c) r = 1.0, a = 0.0693,β = 0.0012, (d) r = 0.675, β = 0.0014, and k = 200.
chronic disease steady state and the minimum and maximum values observed forthe periodic orbit.
Bifurcations are observed for realistic values of r, k, and β over a fairly broadrange of other parameter values. However, varying a leads to a bifurcation overa narrower range of other parameters. That is, in order for the death rate ofproductively infected cells, a, to alter the stability of the chronic disease state, thesystem must already be “close” to the bifurcation point. This suggests that as longas hepatocytes retain good regenerative capacity, the liver can survive even whenthe immune response is very weak. It is also likely that the value of a is moreimportant in more virulent infections. Increasing d greatly, indicating a very highrate of natural (i.e., nonpathogenic) hepatic apoptosis or necrosis, can also inducea switch in stability. The switch to a periodic orbit, for every parameter but τ ,occurs as the parameters change to represent a more virulent infection or a weakerliver.
Stability is least sensitive to τ ; that is, reasonable values for τ influence stabilityonly when the chronic steady state is already very close to unstable. However, τhas a unique effect on the bifurcation picture. The chronic steady state switchesfrom stable to unstable, and a periodic orbit arises, as τ increases. But, increasing τfurther causes the steady state to regain stability. This unusual bifurcation pictureis shown in Figure 2.

292 S. EIKENBERRY, S. HEWS, J. D. NAGY AND Y. KUANG
Figure 2. Bifurcation diagram for τ . Note that the chronic steadystate is very “close” to unstable, as determined by the other pa-rameter values, which are fixed at r = 0.55, d = 0.0039, µ = 0.693,τ = 1, K = 2× 10¹¹, a = 0.0693, β = 0.0014, and k = 200.
3.5. Parametrization. A baseline range of values for all parameters can be de-termined from empirical data already in the literature (Table 1). In this model weassume r ≤ 1.0 day−1. This value is consistent with the results of Ciupe et al. [6]and the observation that hepatocyte proliferation can be blocked in cases of severeliver damage [26]. This choice is also supported by experimental liver resection inrats, in which rat livers recover to normal mass within 5–7 days after 2/3 partialhepatectomy. In humans, recovery from similar trauma occurs in 8–15 days [26].
MacDonald [24] measured normal hepatocyte life-span to be between 200 and400 days in, whereas more recent estimates place it between 150 and 450 days [4].Therefore, we assume the half-life of healthy hepatocytes is 180 days (6 months),giving d = .0039 day−1. The latency period of infection is reported to be between 1and 2 days [28], and was assumed by Walley et al. to be 1 day [32]. We use the samevalue. The life-span of infected hepatocytes in chronic HBV infection is reported torange between 10 and 100 days in [30], giving a between .0693 and .00693 day−1.
The adult liver contains approximately 2× 10¹¹ hepatocytes [30]. Therefore wetake K = 2× 10¹¹ cells since, given the tiny value of d, K ≈ K.
A half-life of 1 day for free virus has been widely used in other models [29, 30].In [32], the mean half-life of free virions was estimated to be (1.2± 0.6) days witha median of 1.1 days. However, the authors considered this to be an overestimate,and in [28], it was estimated that the half-life of free virus is only 4 hours. Themaximum rate of daily virion production during acute HBV infection was measuredto be between 200 and 1000 virions per infected cell [32].
Walley et al. [32] estimate the value of R0 for several HBV patients in the acutephase of infection under the assumption of a 1 day half-life for free virions and a 1
THE DYNAMICS OF A DELAY MODEL OF HBV INFECTION 293
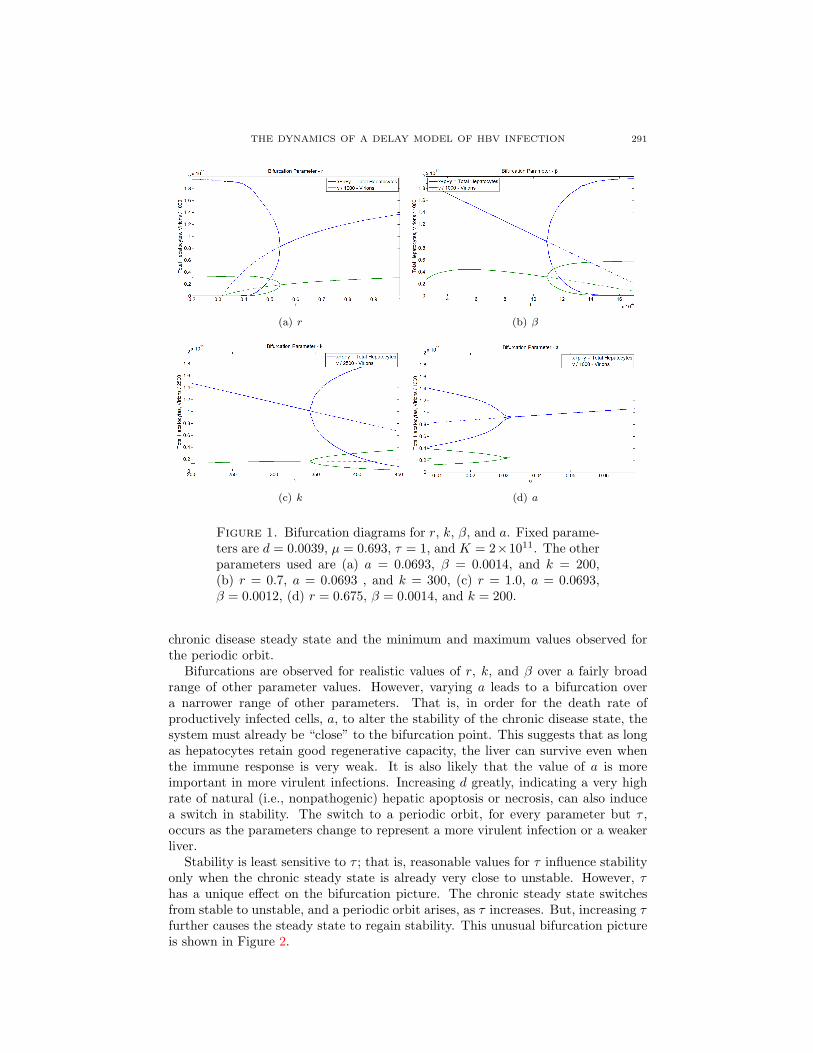
Table 1. Parameters, their symbols and default values used inmodel (2.1) – (2.4).
Param. Meaning Value Reference
a Infected hepatocyte death rate .0693–.00693 day−1 [30]β Rate of virion infection of 3.6× 10⁻⁵–1.8× 10⁻³
hepatocytes cells virion−1 day−1 [32]d Normal death rate for hepatocytes .0039 day−1 [24, 4]k Virion production per infected cell 200–1000 virions cell−1
day−1 [32]K Hepatocyte carrying capacity 2× 10¹¹ cells [30]r Maximum hepatocyte growth rate ≤ 1.0 day−1 [26, 6]τ Latency period of infection 1 day [28, 32]µ Free virion half life .693 day−1 [32]
day latency period. Using these estimates of R0 and the parameter values in Table1, we can derive an estimate for the value of β. From a mean value obtained for3 patients, Whalley et al. estimated R0 = 5, with the maximum R0 = 7.5, whichthey considered to be the most accurate. Therefore, assuming R0 = 7.5, µ = .693,d = .0039, τ = 1, a ∈ [.0693, .00693], and k ∈ [200, 1000], we arrive at β between3.6× 10−5 and 1.8× 10⁻³ cells virion−1 day−1.
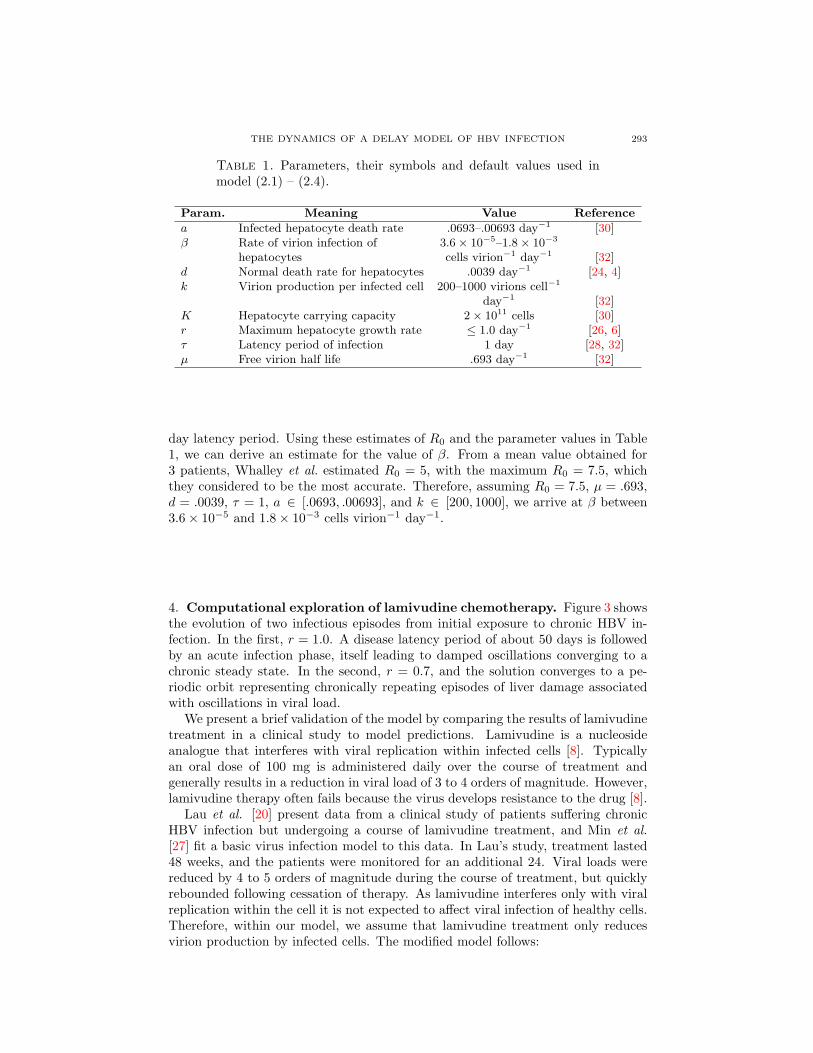
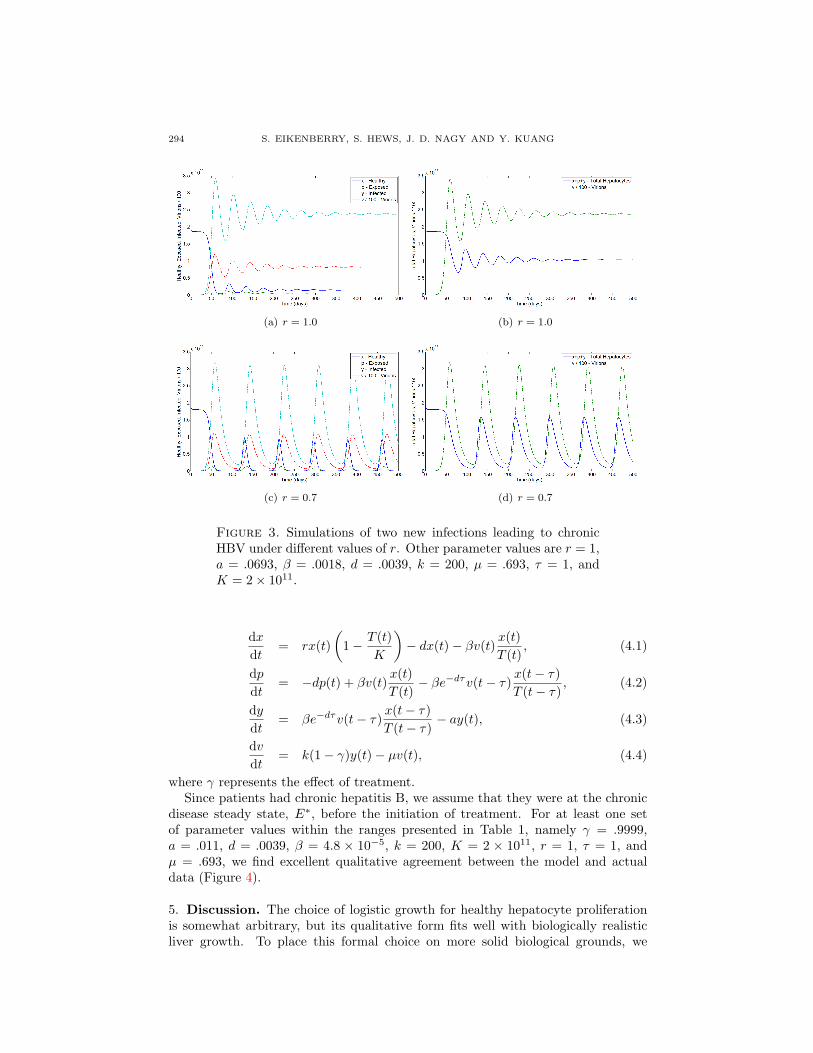
4. Computational exploration of lamivudine chemotherapy. Figure 3 showsthe evolution of two infectious episodes from initial exposure to chronic HBV in-fection. In the first, r = 1.0. A disease latency period of about 50 days is followedby an acute infection phase, itself leading to damped oscillations converging to achronic steady state. In the second, r = 0.7, and the solution converges to a pe-riodic orbit representing chronically repeating episodes of liver damage associatedwith oscillations in viral load.
We present a brief validation of the model by comparing the results of lamivudinetreatment in a clinical study to model predictions. Lamivudine is a nucleosideanalogue that interferes with viral replication within infected cells [8]. Typicallyan oral dose of 100 mg is administered daily over the course of treatment andgenerally results in a reduction in viral load of 3 to 4 orders of magnitude. However,lamivudine therapy often fails because the virus develops resistance to the drug [8].
Lau et al. [20] present data from a clinical study of patients suffering chronicHBV infection but undergoing a course of lamivudine treatment, and Min et al.[27] fit a basic virus infection model to this data. In Lau’s study, treatment lasted48 weeks, and the patients were monitored for an additional 24. Viral loads werereduced by 4 to 5 orders of magnitude during the course of treatment, but quicklyrebounded following cessation of therapy. As lamivudine interferes only with viralreplication within the cell it is not expected to affect viral infection of healthy cells.Therefore, within our model, we assume that lamivudine treatment only reducesvirion production by infected cells. The modified model follows:
294 S. EIKENBERRY, S. HEWS, J. D. NAGY AND Y. KUANG
(a) r = 1.0 (b) r = 1.0
(c) r = 0.7 (d) r = 0.7
Figure 3. Simulations of two new infections leading to chronicHBV under different values of r. Other parameter values are r = 1,a = .0693, β = .0018, d = .0039, k = 200, µ = .693, τ = 1, andK = 2× 10¹¹.
dx
dt= rx(t)
(1− T (t)
K
)− dx(t)− βv(t)
x(t)T (t)
, (4.1)
dp
dt= −dp(t) + βv(t)
x(t)T (t)
− βe−dτv(t− τ)x(t− τ)T (t− τ)
, (4.2)
dy
dt= βe−dτv(t− τ)
x(t− τ)T (t− τ)
− ay(t), (4.3)
dv
dt= k(1− γ)y(t)− µv(t), (4.4)
where γ represents the effect of treatment.Since patients had chronic hepatitis B, we assume that they were at the chronic
disease steady state, E∗, before the initiation of treatment. For at least one setof parameter values within the ranges presented in Table 1, namely γ = .9999,a = .011, d = .0039, β = 4.8 × 10⁻⁵, k = 200, K = 2 × 10¹¹, r = 1, τ = 1, andµ = .693, we find excellent qualitative agreement between the model and actualdata (Figure 4).
5. Discussion. The choice of logistic growth for healthy hepatocyte proliferationis somewhat arbitrary, but its qualitative form fits well with biologically realisticliver growth. To place this formal choice on more solid biological grounds, we

THE DYNAMICS OF A DELAY MODEL OF HBV INFECTION 295
Figure 4. Comparison of model results to clinical results for acourse of lamivudine therapy.
Figure 5. An example of a switch in stability resulting from astepwise reduction in r over the course of 5,000 days (13.7 years).
posit that it represents a growth signal uniformly distributed throughout the liver,that is somehow inversely proportional to liver mass. The concentration of thissignal and the cells’ limited ability to respond to it—proliferation rates have upperlimits set by cell biochemistry—justify, at least heuristically, the choice of a logistic

296 S. EIKENBERRY, S. HEWS, J. D. NAGY AND Y. KUANG
term. Note that this term explicitly excludes normal hepatocyte mortality, althoughfrom a mathematical point of view that detail is irrelevant (compare equation (2.1)with (2.5)). While models using a constant infusion can fit the hepatocyte growthparameter to data, it has little real biological meaning and therefore becomes muchmore difficult to interpret and validate clinically.
As argued by Gourley et al. [10], the use of mass action for viral infection requiresa parameter, namely β in model (1.1), that has a troublesome biological interpreta-tion and also causes the basic reproductive number to depend on healthy liver size[10]. Using a standard incidence function to represent infection dynamics eliminatesthis artifact and gives the infection β a clearer biological meaning, allowing a directestimate of its value from existing literature, as we have done here.
Introduction of logistic proliferation increases the richness of the resulting dy-namics. In addition to the two well known asymptotic behaviors—convergence toa virus-free equilibrium or an equilibrium representing chronic infection—we nowhave the possibility of convergence to a periodic orbit. Sustained oscillations are adynamical possibility that has not been admitted by previous models. As in previ-ous models, the virus free equilibrium in our model, Ef , is both locally and globallyasymptotically stable when R0 < 1 and unstable when R0 > 1. Clinically, then,our model predicts that infection will flair whenever
aµ < βke−dτ . (5.1)
In this model, if relation (5.1) holds then the disease becomes chronic. Dependingupon r and R0, that chronic infection may be either a steady state or oscillatory.Either asymptotic possibility can occur for biologically realistic parameter values.In the parameter region in which E∗ is stable, the model predicts chronic diseasewith a constant viral load. However, when R0 > 1 and E∗ is unstable, oscillations inthe hepatocyte population would arise, which would manifest clinically as repeatedrounds of acute liver damage followed by periods of recovery. In fact, the modelpredicts that most rounds of liver damage would be profound enough to be diag-nosed as acute liver failure (ALF). Clinically, ALF often occurs with little warning,and previously healthy individuals can approach death in a manner of days. ALF ischaracterized by wide-spread hepatocyte necrosis followed by massive immune acti-vation and viral clearance [22]. Following ALF, the liver can spontaneously recover[22, 31]. The periodic behavior in our model largely mimics these cycles of massiveliver failure, viral clearance, and spontaneous recovery.
Since both steady state and oscillatory asymptotic behavior occur in realisticregions of parameter space, it appears possible that a steady state chronic infectioncan suddenly change to oscillations if parameters wander across the stability switchboundary. If this occurs, the bifurcation diagrams suggest that oscillations couldrapidly evolve into increasingly wild swings between ALF and recovery as param-eters continued to wander. Possible mechanisms leading to this sudden onset ofoscillations include gradual degradation in the regenerative capabilities of hepato-cytes (decrease in r), an increase in necrosis or apoptosis of healthy hepatocytescaused by mechanisms besides the virus (increase in d), a weakening of immune re-sponse (decrease in a), and an increase in virus virulence (increase of β or k). Thefirst of these possibilities, reduction in the regenerative capabilities of hepatocytes,has in fact been suggested as a mechanism for the onset of acute liver failure in HBVpatients. It is well established that severe liver damage impairs hepatocyte regen-eration [31]. Also, HBV can inhibit hepatocyte regeneration directly [35]. However,

THE DYNAMICS OF A DELAY MODEL OF HBV INFECTION 297
high levels of proliferative activity have been observed in hepatocytes in fulminanthepatitis [33, 11], suggesting that liver failure is more likely driven by hepatocytenecrosis. Changes in blood flow due to an inflammatory immune response may alsocause apoptosis and ischemic damage [23] that is only indirectly associated with thevirus.
In all, then, a number of mechanisms exist that could cause a change in asymp-totic behavior in chronic HBV. In all cases, changes tending to promote oscillationsare associated with late-stage hepatitis B. Therefore, we predict that the suddenonset of oscillations in liver damage and viral load may herald the rapid deteriora-tion and ALF of patients who die from liver damage directly induced by HBV orthe cytotoxic immune response against it. Figure 5 shows an example of such dete-rioration that can occur from stepwise decay of the basic hepatocyte proliferationrate, r, over the course of a 5,000-day simulation.
In addition to this steady physiological decay, an increase in HBV virulence drivenby selective forces could also cause a switch in stability, leading to the oscillatorybehavior and rapid deterioration in health just described, or vice versa. A futureline of investigation may examine the effect of two competing viral strains to seeif natural selection can induce a stability switch. It could then be determined if,and under what circumstances, the immune response can spontaneously change thedynamics back to a more stable state through its own alterations of the selectivepressures.
Increasing the latency period from the time of hepatocyte infection to activevirion production always increases R0, implying a less virulent infection. Based ona similar result for an HIV model, increasing this delay has been proposed as anovel therapeutic target [36]. However, we have found that modifying the delay, τ ,does not have such a straightforward effect and that modest increases in the delaycan push the dynamics from a chronic equilibrium into more dangerous oscillations;further increases in the delay cause the dynamics to switch back to a less dangerousequilibrium (see Figure 2). Thus, τ influences the dynamics through more than alinear impact on R0, and any novel therapy would have to take this into account. Wenote, however, that changing τ only has a significant effect on the dynamics whenthe other parameters are such that the system is already “close” to the bifurcationpoint. Therefore, we expect that the proposed novel therapies would only have ameaningful effect in later stage diseases.
Two aspects of hepatocyte proliferation and liver recovery from damage fromHBV infection could be examined using extensions of the model studied here. Fol-lowing trauma, liver regeneration tends to overshoot the normal mass. Homeostaticliver size is recovered then by a small wave of hepatocyte apoptosis [26]. This ob-servation implies a possible delay in the growth signal, which could be modeled bydelayed logistic growth, leading to a two delay model.
It is also well known that per-capita hepatocyte proliferation rate is a function ofthe amount of trauma the liver suffers. Above 2/3 HPx, more trauma yields lowerper-capita proliferation rates. In fact, above 90% PHx, hepatocyte proliferationceases as metabolic demands on surviving hepatocytes become too great [31, 11].On the other hand, per-capita proliferation also declines for resection masses below2/3 PHx [31]. So, maximum per-capita hepatocyte recovery occurs when the sur-viving liver is 1/3 its normal mass. Our model could be improved by altering theproliferation function to accommodate this more complex growth response.

298 S. EIKENBERRY, S. HEWS, J. D. NAGY AND Y. KUANG
We have modeled the latency period from infection to virion production witha single discrete delay. In reality, any such delay will vary between individualcells, yielding a distributed delay; the discrete delay we have chosen should beunderstood as the mean of the actual distribution. Confirming that the behaviorand predictions of our model are robust with respect to distributed delays could bedone using techniques similar to those in [5].
The standard incidence infection term with logistic hepatocyte growth can po-tentially generate rich dynamics, rivaling those of ratio-dependent predator-preymodels [13, 18] or simple epidemic models [3, 14, 15]; we will explore this poten-tial in the near future. These characteristics, together with the time delay, presentmany challenging mathematical questions on the global dynamics of model (2.1) –(2.4) with complexity surpassing that of [9].
One major weakness of our model lies in how the immune system is handled.In particular, we ignore the adaptive nature of the immune response. Both thecytotoxic response, represented in part by a, and the humoral, represented by µ,are linear in y and v, respectively. A more realistic form would allow both cytotoxicattack of infected cells and humoral clearance of free virus to increase nonlinearlywith the number of productively infected cells and free virions, respectively. In fact,our simplification of the immune response is probably the primary reason why ourmodel fails to replicate the most common clinical course seen in HBV patients—namely acute, self-limiting disease. Therefore, the next generation model shouldinclude a more realistic model of adaptive immunity.
Acknowledgments. We would like to thank the referees for their valuable com-ments. This work is dedicated to the occasions of Karl Hadeler’s 70th birthday andFred Brauer’s 75th birthday.
REFERENCES
[1] P. M. Arguin, P. E. Kozarsky and C. Reed [eds], “CDC Health Information for InternationalTravel 2008,” Elsevier, Philadelphia, 2007.
[2] E. Beretta and Y. Kuang, Geometric stability switch criteria in delay differential systems
with delay dependent parameters, SIAM J. Math. Anal., 33 (2002), 1144–1165.[3] F. Berezovsky, G. Karev, B. Song and C. Castillo-Chavez, A simple epidemic model with
surprising dynamics, Math. Biosci. Eng., 1 (2004), 1–20.[4] M. Bralet, S. Branchereau, C. Brechot and N. Ferry, Cell lineage study in the liver using
retroviral mediated gene transfer, Am. J. Pathol., 144 (1994), 896–905.[5] C. Castillo-Chavez, K. Cooke, W. Huang and S. A. Levin, On the role of long incubation
periods in the dynamics of acquired immunodeficiency syndrome (AIDS), J. Math. Biol., 27(1989), 373–398.
[6] S. M. Ciupe, R. M. Ribeiro, P. W. Nelson, G. Dusheiko and A. S. Perelson, The role of cellsrefractory to productive infection in acute hepatitis B viral dynamics, Proc. Natl. Acad. Sci.
USA, 104 (2007), 5050-5055.[7] S. M. Ciupe, R. M. Ribeiro, P. W. Nelson and A. S. Perelson, Modeling the mechanisms of
acute hepatitis B virus infection, J. Theor. Biol., 247 (2007), 23–35.[8] G. Ferir, S. Kaptein, J. Neyts and E. De Clercq, Antiviral treatment of chronic hepatisis B
virus infections: The past, present and the future, Rev. Med. Virol., 18 (2008), 19–34.[9] S. A. Gourley and Y. Kuang, A stage structured predator-prey model and its dependence on
maturation delay and death rate, J. Math. Biol., 49 (2004), 188–200.
[10] S. A. Gourley, Y. Kuang and J. D. Nagy, Dynamics of a delay differential equation model ofhepatitis B virus infection, J. Biological Dynamics, 2 (2008), 140–153.
[11] C. D. Gove and R. D. Hughes, Liver regeneration in relationship to acute liver failure, Gut,(Suppl.), 32 (1991), S92–S96.
[12] L. G. Guidotti and F. V. Chisari, Immunobiology and pathogenesis of viral hepatitis, Annu.Rev. Pathol. Mech. Dis., 1 (2006), 23–61.

THE DYNAMICS OF A DELAY MODEL OF HBV INFECTION 299
[13] S. B. Hsu, T. W. Hwang and Y. Kuang, Global analysis of the Michaelis-Menten type ratio-dependent predator-prey system, J. Math. Biol., 42 (2001), 489–506.
[14] T. W. Hwang and Y. Kuang, Deterministic extinction effect of parasites on host populations,
J. Math. Biol., 46 (2003), 17–30.[15] T. W. Hwang and Y. Kuang, Host extinction dynamics in a simple parasite-host interaction
model, Math. Biosci. Eng., 2 (2005), 743-751.[16] M. Iannacone, G. Sitia, Z. M. Ruggeri and L. G. Guiddotti , HBV pathogenesis in animal
models: recent advances on the role of platelets, J. Hepatol., 46 (2007), 719–726.
[17] Y. Kuang, “Delay Differential Equations with Applications in Population Dynamics,” Math-ematics in Science and Engineering 191, Academic Press, Boston, 1993.
[18] Y. Kuang and E. Beretta, Global qualitative analysis of a ratio-dependent predator-prey sys-
tem, J. Math. Biol., 36 (1998), 389–406.[19] L. Lambotte, A. Saliez, S. Triest, E. M. Tagliaferri, A. P. Barker and B. G. Andrzej, Control
of rate and extent of the proliferative response after partial hepatectomy, Am. J. Physiol.
Gastrointest. Liver Physiol., 273 (1997), G905–G912.[20] G. K. K. Lau, T. Piratvisuth, K. X. Luo, P. Marcellin, S. Thongsawat and G. Cooksley et al.,
Peginterferon Alfa-2a, lamivudine, and the combination for HBeAg-positive chronic hepatitisB, New Eng. J. Med., 352 (2005), 2682–2695.
[21] D. Lavanchy, Worldwide epidemiology of HBV infection, disease burden, and vaccine preven-
tion, J. Clin. Virol., 34 (2005), S1–S3.[22] W. M. Lee, Acute liver failure, N. Engl. J. Med., 329 (1993), 1862–1872.[23] M. Liu, C. W. Y. Chan, I. McGilvray, Q. Ning and G. A. Levy, Fulminant viral hepatitis:
molecular and cellular basis, and clinical implications, Expert Rev. Mol. Med., 3 (2001),1–19.
[24] R. A. MacDonald, “Lifespan” of liver cells. Autoradio-graphic study using tritiated thymidine
in normal, cirrhotic, and partially hepatectomized rats, Arch. Intern. Med., 107 (1961), 335–343.
[25] S. Marubashi, M. Sakon, H. Nagano, K. Gotoh, K. Hashimoto, M. Kubota, S. Kobayashi,
S. Yamamoto, A. Miyamoto, K. Dono, S. Nakamori, K. Umeshita and M. Monden, Effect ofportal hemodynamics on liver regeneration studied in a novel portohepatic shunt rat model,
Surgery, 136 (2004), 1028–1037.[26] G. K. Michalopoulos, Liver regeneration, J. Cell. Physiol., 213 (2007), 286-300.
[27] L. Min, Y. Su and Y. Kuang, Mathematical analysis of a basic virus infection model with
application to HBV infection, Rocky Mountain Journal of Mathematics, 38 (2008), 1–13.[28] J. M. Murray, R. H. Purcell, S. F. Wieland, The half-life of hepatitis B virions, Hepatology,
44 (2006), 1117–1121.[29] M. A. Nowak, S. Bonhoeffer, A. M. Hill, R. Boehme, H. C. Thomas and H. McDade, Viral
dynamics in hepatitis B virus infection, Proc. Natl. Acad. Sci. USA, 93 (1996), 4398–4402.[30] M. A. Nowak and R. M. May, “Virus Dynamics,” Oxford University Press, Oxford, 2000.
[31] J. Rozga, Hepatocyte proliferation in health and in liver failure, Med. Sci. Monit., 8 (2002),RA32–38.
[32] S. A. Whalley, J. M. Murray, D. Brown, G. J. M. Webster, V. C. Emery, G. M. Dusheiko andA. S. Perelson, Kinetics of acute hepatitis B virus infection in humans, J. Exp. Med., 193(2001), 847-853.
[33] H. K. Wolf and G. K. Michalopoulos, Hepatocyte regeneration in acute fulminant and non-fulminant hepatitis: A study of proliferating cell nuclear antigen expression, Hepatology, 15
(1992), 707–713.[34] World Health Organization, 2000, Hepatitis B fact sheet No. 204, WHO Website.[35] B. Wu, C. Li, H. Chen, J. Chang, K. Jeng, C. Chou, M. Hsu and T. Tsai, Blocking of G1/S
transition and cell death in the regenerating liver of hepatitis B virus X protein transgenic
mice, Biochem. Biophys. Res. Commun., 340 (2006), 916–928.[36] H. Zou and X. Zou, Impact of delays in cell infection and virus production on HIV-1 dynamics,
Math. Med. Biol., 25 (2008), 99–112.
Received May 10, 2008. Accepted on July 14, 2008.E-mail address: [email protected]
E-mail address: [email protected]
E-mail address: [email protected]
E-mail address: [email protected]