the drought of 2012 - a report of the governor's drought
TRANSCRIPT

March 2013

FOREWORD
The Drought of 2012 in Illinois as described in this report was an outgrowth of several years of
drought in the southwest which began to expand north and easterly to encompass much of the
Midwest. That drought continues to be problematic in states to the west and north of Illinois.
Several meteorologic and hydrologic conditions contributed to the drought in Illinois. These
conditions are described and the resultant impacts are identified. Quantifying the impacts in
useful metrics has been elusive.
This report serves to define the policy and technology issues which arose during the Drought of
2012 and to explain some limitations in governmental responses to those policy and
technological issues.

CONTENTS
INTRODUCTION ....................................................................................................................................... 1
CONDITIONS LEADING UP TO THE DROUGHT ....................................................................................... 1
PROGRESSION OF THE DROUGHT ........................................................................................................ 1
PRECIPITATION .................................................................................................................................... 5
STREAMFLOW CONDITIONS ................................................................................................................. 6
SHALLOW GROUNDWATER WELLS ....................................................................................................... 7
CONFINED GROUNDWATER WELLS ...................................................................................................... 7
WATER QUALITY .................................................................................................................................. 7
WINTER 2012 -2013 ............................................................................................................................. 7
AGRICULTURAL CONDITIONS ................................................................................................................... 9
AGRICULTURAL ISSUES ........................................................................................................................ 9
AGRICULTURAL RECOMMENDATIONS ............................................................................................... 10
WATER SUPPLIES ................................................................................................................................... 10
PUBLIC WATER SUPPLY ISSUES .......................................................................................................... 11
PUBLIC WATER SUPPLY RECOMMENDATIONS ................................................................................... 11
INDUSTRIAL WATER USAGE ............................................................................................................... 11
INDUSTRIAL WATER USAGE ISSUES .................................................................................................... 12
INDUSTRIAL WATER USE RECOMMENDATIONS ................................................................................. 12
PRIVATE WATER USAGE ..................................................................................................................... 12
PRIVATE WATER USAGE ISSUES ......................................................................................................... 13
PRIVATE WATER USE RECOMMENDATIONS ....................................................................................... 13
NATURAL RESOURCE IMPACTS .............................................................................................................. 13
NATURAL RESOURCE ISSUES: ............................................................................................................. 13
NATURAL RESOURCE RECOMMENDATIONS: ...................................................................................... 13
NAVIGATION CONDITIONS..................................................................................................................... 13
NAVIGATION ISSUES .......................................................................................................................... 14
NAVIGATION RECOMMENDATIONS ................................................................................................... 14
ECONOMICS OF THE DROUGHT ............................................................................................................. 14
ECONOMIC IMPACTS ........................................................................................................................ 15
ECONOMIC RECOMMENDATIONS ...................................................................................................... 15
TECHNICAL ISSUES ................................................................................................................................. 15
TECHNICAL ISSUES ............................................................................................................................. 15
TECHNICAL RECOMMENDATIONS ...................................................................................................... 15
POLICY ISSUES ....................................................................................................................................... 16
POLICY ISSUES ................................................................................................................................... 16
POLICY RECOMMENDATIONS ............................................................................................................ 16
REFERENCES .......................................................................................................................................... 17
LIST OF FIGURES
1. Monthly Drought Monitor .......................................................................................... 2
2. Statewide Average Precipitation for 2012 ................................................................... 5
3. Precipitation Deficit for 2012 ...................................................................................... 6
4. Precipitation Departure from Normal for Winter 2013 ................................................ 8
APPENDICES
A. Illinois State Water Survey
B. U. S. Geological Survey
C. Department of Agriculture
D. University of Illinois
E. Illinois Finance Authority
F. Illinois Environmental Protection Agency
G. Interstate Commerce Commission
H. Report of East Central Regional Water Supply Committee
I. Illinois Department of Public Health
J. Department of Natural Resources
K. Authorities and Regulations
1
INTRODUCTION The Governor’s Drought Response Task Force is activated with the Governor’s approval when drought
conditions warrant a unified statewide approach. This task force was activated on June 19, 2012 by the
State Water Plan Task Force with the approval of the Governor’s Office.
Numerous droughts have occurred in Illinois with the most significant occurring in the 1930’s, 1950’s
1988, 2007, and in 2012. Following the Drought of 2007, the State Water Plan Task Force developed
and published a report entitled “State of Illinois, Drought Preparedness and Response Plan “ and
includes recommendations for future preparations for drought. These recommendations have been
partially implemented.
Governmental response to drought conditions is of critical importance to those directly affected by
drought. Agricultural producers, public water supply users, and industrial users depend on the
availability of water to maintain the state’s economy and to sustain our standard of living. When the
water supplies become limited as occurs during drought, restricted usage and competition for usage
become common problems for agency administrators who are tasked with managing the waters of
Illinois. These problems affect secondary impacts, such as water quality (temperature, dissolve oxygen,
nutrient concentrations), aquatic sustainability, exports, jobs, and economic vitality. Each drought is
unique and presents different challenges to government, and offers new opportunities to re-look at the
administrative processes in place to respond to drought.
This report purports to document the Drought of 2012 and its effects, and to identify those areas where
further planning and preparation for future drought should occur. Planning and preparation will be
discussed based on the water supply presently available, the demand for that supply, and the need to
plan for the expected conflicts between supply and demand.
CONDITIONS LEADING UP TO THE DROUGHT Drought conditions persisted in portions of the southwestern states for several years leading up to 2012,
with Texas being a focal point for those conditions. In 2010 and 2011, the drought conditions in the
southwest spread slowly northward. Illinois meteorological conditions in the fall of 2011 were trending
toward dry in the southern most counties, while central Illinois counties were experiencing below
normal precipitation. The winter of 2011 to 2012 produced little snowfall across Illinois, and was
warmer than most winters in Illinois. Spring conditions allowed for planting of crops with high
expectations. Spring precipitation was well below normal, raising fears of drought.
PROGRESSION OF THE DROUGHT The National Drought Monitor reports drought conditions based on precipitation in terms of percent
below normal. When considering Illinois, the National Drought Monitor shows a progression of the
drought from south to north, with the drought conditions in southern Illinois having begun in the fall of
2011, progressively worsening across southern Illinois into March of 2012 with central Illinois showing
moderate drought, then extending to eventually covering all Illinois counties by July 2012. August and

2
September rainfalls moderated drought conditions across much of south central Illinois, while drought
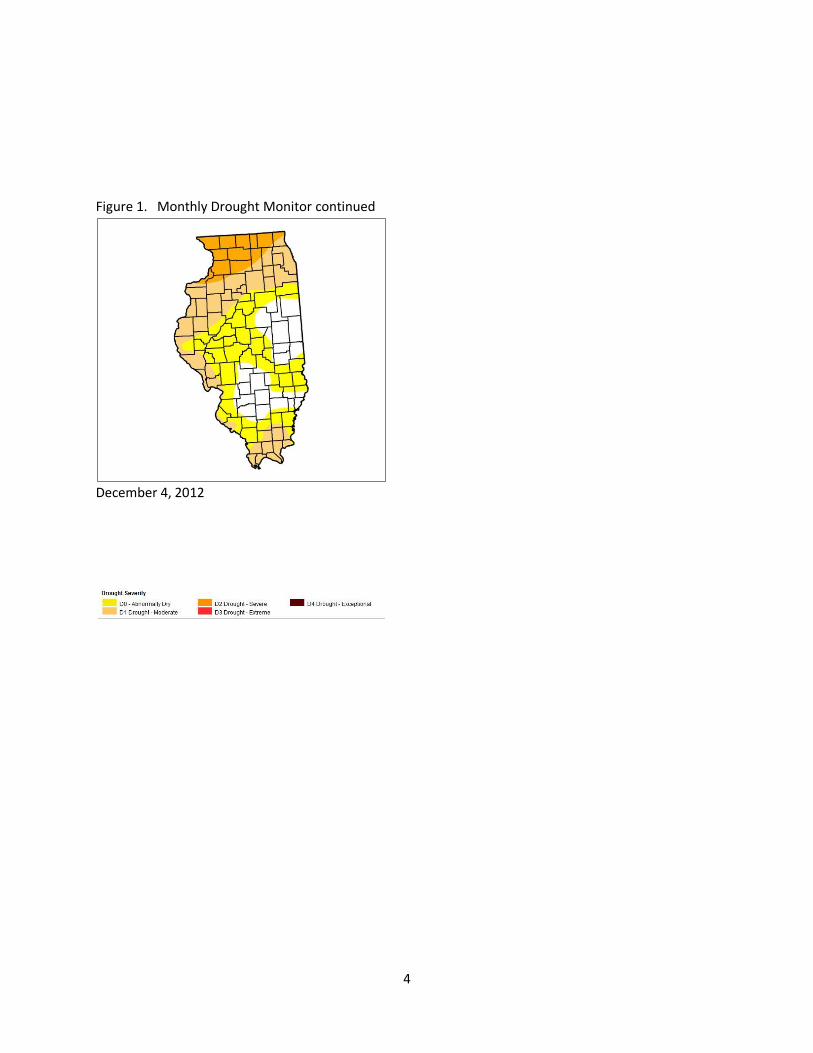
conditions persisted throughout most of Illinois. By December 2012, drought conditions were again
worsening across most of Illinois. The progression of the Drought is shown in Figure 1 and depicts
drought conditions from April thru December 2012.
Figure 1. Monthly Drought Monitor
April 3, 2012
June 5, 2012
May 1, 2012
July 3. 2012

3
Figure 1. Monthly Drought Monitor continued
August 7, 2012
October 2, 2012
September 4, 2012
November 6, 2012
4
Figure 1. Monthly Drought Monitor continued
December 4, 2012
5
PRECIPITATION
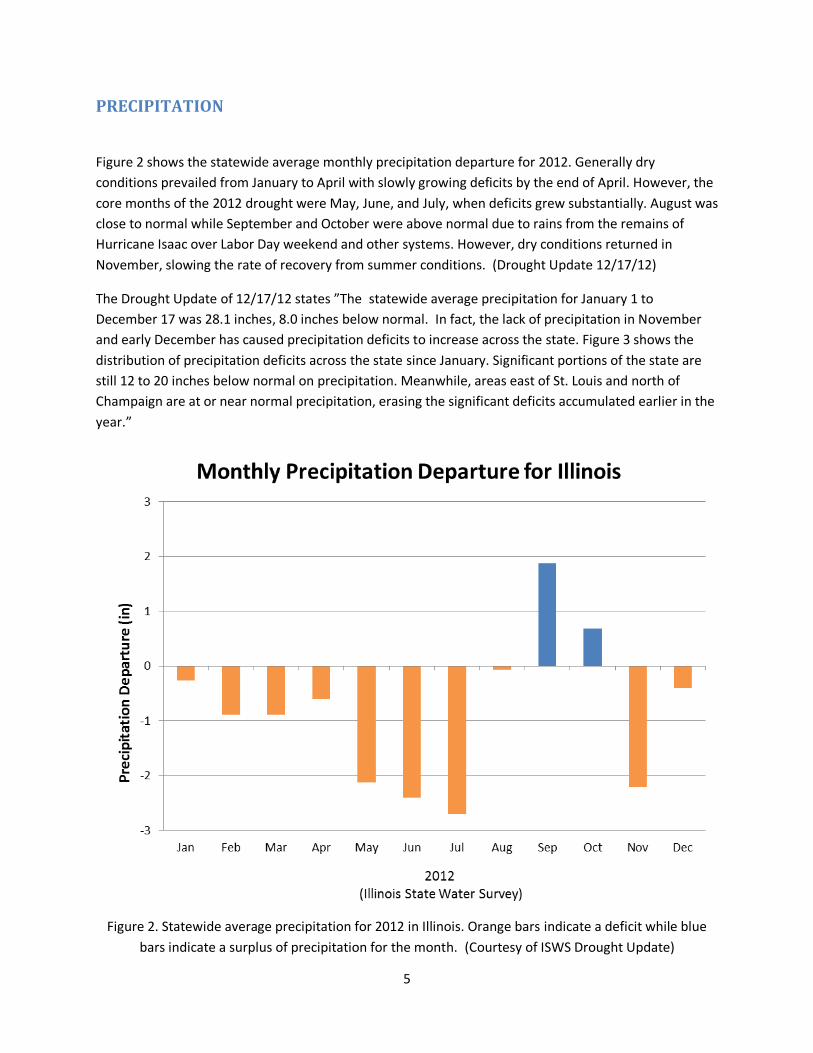
Figure 2 shows the statewide average monthly precipitation departure for 2012. Generally dry
conditions prevailed from January to April with slowly growing deficits by the end of April. However, the
core months of the 2012 drought were May, June, and July, when deficits grew substantially. August was
close to normal while September and October were above normal due to rains from the remains of
Hurricane Isaac over Labor Day weekend and other systems. However, dry conditions returned in
November, slowing the rate of recovery from summer conditions. (Drought Update 12/17/12)
The Drought Update of 12/17/12 states ”The statewide average precipitation for January 1 to
December 17 was 28.1 inches, 8.0 inches below normal. In fact, the lack of precipitation in November
and early December has caused precipitation deficits to increase across the state. Figure 3 shows the
distribution of precipitation deficits across the state since January. Significant portions of the state are
still 12 to 20 inches below normal on precipitation. Meanwhile, areas east of St. Louis and north of
Champaign are at or near normal precipitation, erasing the significant deficits accumulated earlier in the
year.”
Figure 2. Statewide average precipitation for 2012 in Illinois. Orange bars indicate a deficit while blue
bars indicate a surplus of precipitation for the month. (Courtesy of ISWS Drought Update)

6
Figure 3. Precipitation Deficit for 2012
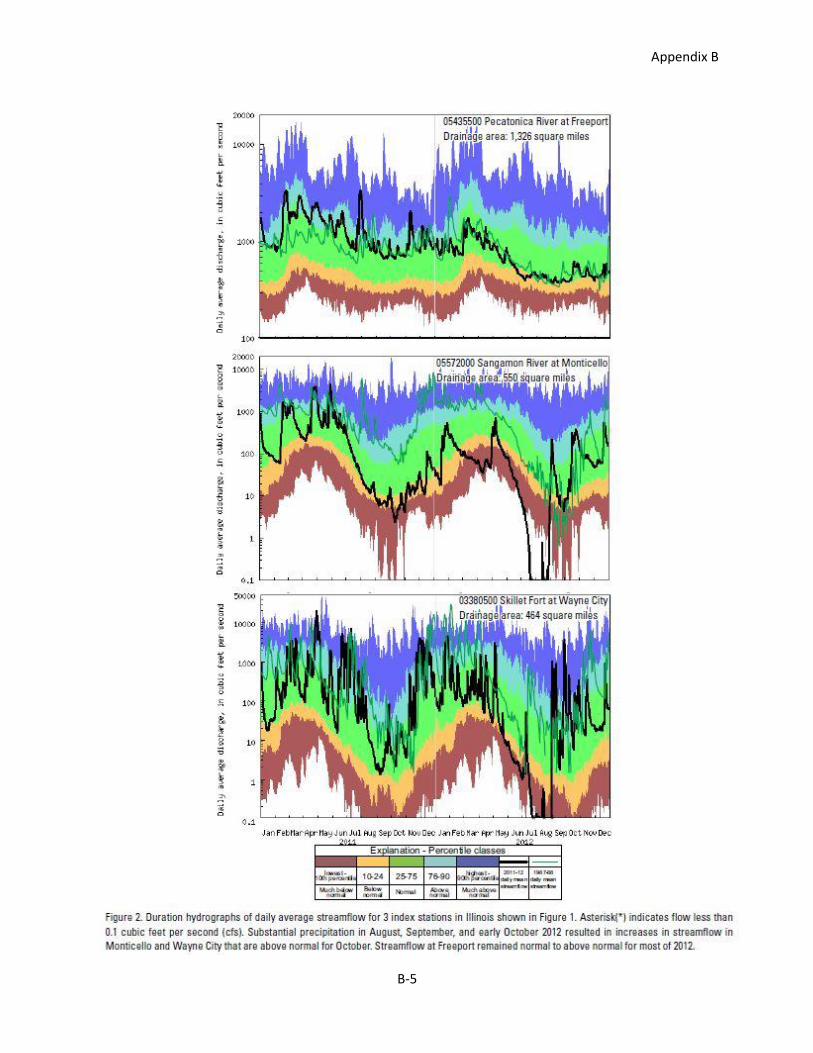
STREAMFLOW CONDITIONS Streamflow was generally decreasing at most stations throughout the state in June, July and August. Of
the 114 stations in Illinois with more than 30 years of continuous record, six stations set new record
lows and 17 tied record lows For example, the long-term streamflow station on the Sangamon River at
Monticello had the lowest 7-day flow (0 cfs for 16 days) in 105 years of record. Substantial precipitation
in much of the state occurred starting in August, and continued through September, and early October,
which resulted in a decrease in the drought severity.

7
SHALLOW GROUNDWATER WELLS Using groundwater wells regularly measured by the Illinois State Water Survey and the U.S. Geological
Survey some impacts of the 2012 Drought can be documented. The 2012 Drought resulted in most
shallow groundwater wells showing steep declines of their levels beginning mid-winter to late spring
and continuing into late summer. Beginning in August, some groundwater levels started to respond to
precipitation events in east-central and southern Illinois, although not in all wells in those areas
responded. Additional groundwater monitoring wells responded to the precipitation in September and
October 2012, although these again were primarily in the east-central and southern Illinois. At least
three wells had their deepest groundwater levels for those wells with 10 or more years of record
(Champaign, Vermilion and Lee counties). Throughout the State of Illinois, very few wells have
recovered to the groundwater levels measured in late December 2011.
CONFINED GROUNDWATER WELLS There are not as many confined aquifer monitoring wells with continuous data sets throughout Illinois.
These wells generally do not show direct responses to a drought, but may respond to increased
pumping because of the drought. As of late December 2012, several of the wells did not recover to
water levels measured at the end of 2011.
WATER QUALITY The drought resulted in several water-quality issues throughout Illinois, including high water
temperatures and low dissolved oxygen levels which stressed fish and other biota, sometimes resulting
in fish kills. High water temperatures also impacted industrial and power plants with water intakes on
rivers and lakes. Ongoing monitoring efforts by the Illinois Environmental Protection Agency (IEPA), the
Illinois State Water Survey (ISWS), the U.S. Geological Survey (USGS), and other agencies were able to
document water-quality impacts of the drought. As a result of the drought, real-time temperature
monitoring was added at several power plants to USGS streamgages. In response to several reports of
harmful algal blooms, a reconnaissance was conducted by the IEPA and the USGS during August through
October 2012 to (1) confirm recent detections of high cyanotoxin concentrations, (2) assess the spatial
extent, concentration, and characteristics of cyanobacterial blooms in Illinois, and (3) provide data to
support state and local agencies in managing water resources to protect human, animal, and ecological
health.
WINTER 2012 -2013 Winter 2013 brought the apparent end of the drought. The precipitation recorded in the winter 2013
was above normal for the entire state as shown in Figure 4. The National Weather Service predicted a
slight chance of above normal precipitation for April and the 3 month period of April, May, and June.
Topsoil throughout Illinois was rated as 81% adequate moisture by the USDA National Agricultural
Statistics Service (USDA NASS) in the Illinois Weather and Crops Report of March 25, 2013. However,
Northwest and West Illinois showed 3% and 10% prospectively very short topsoil moisture. Most
streams in Illinois have returned to normal or above normal flows. There are a few streams in Central
and Eastern Illinois which are still showed below normal stream flows. The water supply reservoirs have

8
recovered. A few reservoirs in Central Illinois have not made a complete recovery. The groundwater
levels are recovering but have not returned to pre-drought levels. Some groundwater wells in
Northwest Illinois have not shown signs of recovery. The U.S. Drought Monitor has removed Illinois from
all categories of drought as of March 19, 2013. However, the very northern counties in Illinois remain
abnormally dry.
The State Water Plan Task Force determined that the statewide Drought of 2012 appears to be over at
the March 21, 2013 meeting. There may be small areas where dry conditions remain. Due to dry
conditions in the plains states, some low water conditions along the Mississippi River were still possible.
Figure 4. Precipitation Departure from Normal for Winter 2013.

9
AGRICULTURAL CONDITIONS Soil moisture conditions in the spring of 2012 allowed farmers in most Illinois counties to get their crops
planted with high expectations for a good yield. 12,800,000 acres of corn and 9,050,000 acres of
soybeans were planted across Illinois at a time when crop prices were high. By June 1, crop conditions
across Illinois were reported to be mostly good, but drier conditions were already becoming a distinct
pattern.
By July, crops throughout Illinois were in various levels of stress due to a shortage of rainfall and many
consecutive days of above normal temperatures. All regions of Illinois sustained major damages to
crops; the most severe was in the southern third of the State. According to the USDA National
Agricultural Statistics Service, statewide 2012 corn and soybean yields were 105 bushels per acre and 43
bushels per acre respectively, down when compared to the 2011 yields of 157 bushels per acre for corn
and 47.5 bushels per acre for soybeans.
Livestock producers were also negatively impacted by the severe drought conditions. Pastures dried up
quickly and producers resorted to feeding stored hay early. Hay growth was significantly curtailed,
greatly reducing the hay crop. Some livestock producers experienced a shortage of well water. These
factors led to some producers liquidating a portion of their entire livestock herd.
The pork industry also encountered higher feed prices due to the 2012 drought. In response, Governor
Quinn directed that the next major State purchase of meat include a 30% increase in the purchase of
pork and that it be procured from Illinois companies.
AGRICULTURAL ISSUES 1. Yields for corn, soybeans and hay were significantly reduced – These lower yields resulted in
reduced commodity exports and increased feed prices for livestock producers.
2. Aflatoxin –The presence of higher than normal levels of aflatoxin in this year’s corn crop
prompted the Illinois Department of Agriculture to request a blending waiver agreement from
the US Food and Drug Administration (FDA). This is the first time the Department has sought
and received authority to oversee the blending of corn that contains aflatoxin. This has allowed
the grain industry to supply livestock producers with a safe supply of corn to feed their livestock
according to FDA aflatoxin guidelines. The blending waiver agreement expires June 1, 2013. An
application was made to FDA to extend the blending waiver to September 1, 2013.
3. Some livestock producers experienced a shortage of well water. These producers were faced
with hauling water on a regular basis throughout the summer and fall to sustain their herds.
Some deepened existing wells or dug new wells.
4. Irrigation water usage - Agricultural irrigation increased in 2012 over previous years and that
may foster the future expansion of irrigation systems in Illinois.
5. Movement of agricultural products via commercial navigation system – Movement of corn,
soybeans, fertilizers, and other agricultural commodities is very dependent upon the inland
waterway systems to successfully arrive at the designated destination. Middle Mississippi River
(St. Louis to Cairo) river stages in December were dropping to levels of great concern to the
agricultural and navigation industries.

10
6. The economic conditions of farmers going into 2013 are expected to be better for those who
had purchased federal crop insurance for 2012 as compared to those without that coverage.
Those who experienced major crop damage without the protection of crop insurance may be
experiencing financial shortfalls or hardships.
7. Poor crop growth resulted in a limited uptake of nutrients (e.g., Nitrogen) in some areas during
the 2012 drought. Agricultural producers will factor in the presence of the remaining nutrients
into their plans for the 2013 crop season to prevent nutrient runoff into water bodies.
AGRICULTURAL RECOMMENDATIONS
1. Federal/State Coordination-Information Flow Federal agencies with drought related responsibilities should employ better practices to achieve a
more timely release of information (e.g., disaster designation status) to their state counterparts.
2. Rural Water Districts Continued federal appropriations to USDA Rural Development are needed regarding the construction of rural water mains to provide a safe, reliable supply of water to rural residents.
3. Planning for Future Droughts Municipalities should be more proactive with public water supply planning to be better positioned to respond to future severe drought events.
4. Water Law/Policy The Drought of 2012 illustrates the need in Illinois for all water related laws and policies to be reexamined for possible improvement. Water ownership and water rights issues are coming to the forefront.
5. Aflatoxin To prevent a lack of consistent testing/certification for aflatoxin levels in corn, a more unified testing and certification process is needed.
6. Nomenclature
Improvements in nomenclature are needed to help producers gain a clearer understanding of
disaster assistance related programs. For example, “Early Release of CRP for Haying and
Grazing” and “Emergency Release of CRP for Haying and Grazing” caused some confusion
in the agricultural community with the 2012 drought.
7. US Farm Bill Work needs to continue on the Farm Bill to ensure that disaster assistance programs are
reauthorized and funded.
WATER SUPPLIES Most public water supply systems in Illinois have adequate supplies to meet the demands of public
usage. Studies have demonstrated that several systems are “at risk” of not being able to meet the water
supply demands of their users for a minimum of 18 months. (Data for Assessing Drought Vulnerability of
11
Illinois Community Surface Water Systems, Hecht and Knapp, 2008) In mid-August – prior to the drought
relief brought by the remnants of Hurricane Isaac – the water levels of most Illinois reservoirs were
declining rapidly similar to that experienced by some of the worst historical droughts Drought
conditions would have needed to continue unabated into 2013 before most of Illinois’ water supply
reservoirs would have had serious concerns about depleted water storage, which normally occur during
the second year of an extended drought episode.
The “at risk” systems which experienced the worst water supply deficits include La Harpe, Decatur, and
Vienna Correctional Center.
1. La Harpe: La Harpe supplies water to 1400 people. The water is diverted from Crooked Creek
into a reservoir. A ground water supply augments the surface supply. The October 17, 2012 report
showed the reservoir was 58” below normal pool on. La Harpe was utilizing 60% groundwater and 40%
lake water.
2. Decatur: Drinking water for the City of Decatur, Illinois (Facility No. 1150150) is supplied by the
Decatur community water supply (CWS). Lake Decatur and ten groundwater wells, serve as the source of
this drinking water. Combined pumpage from the two surface water intakes (IEPA #45004 and #00122)
and the wells exceeds 37.5 million gallons per day, providing water to approximately 34,000 service
connections and an estimated population of 87,000 people. Connected facilities that purchase all their
water from Decatur include the Village of Mt. Zion (1150350). Local industry in Decatur accounts for a
large portion of the water usage.
3. Vienna/Shawnee Correctional Centers: Vienna/Shawnee Correction Center (VSCC) reservoir
supplies water to 4000 people. VSCC experienced record low water levels in their reservoir. Snowfall
in January 2013 started the recovery of their reservoir. By March 20, 2013 the reservoir was full.
PUBLIC WATER SUPPLY ISSUES 1. Decatur problems reoccur during each drought
2. Some communities have water supplies which are not adequate for 18 months
PUBLIC WATER SUPPLY RECOMMENDATIONS 1. Work with Department of Corrections to find source for reservoir augmentation at VSCC.
2. IEPA has requested Decatur to provide weekly status reports on their efforts to obtain additional
sources of drinking water.
3. Additional state-wide water supply planning should be conducted to identify the supply and
demand on surface and groundwater supplies.
INDUSTRIAL WATER USAGE The coal industry depends on a constant water supply to suppress coal dust as coal is mined. These coal
mine operations draw water from numerous sources, including local impoundments, rivers and streams,
and federal reservoir allocations.
12
A coal mine in Washington County experienced shortages of available water in August and requested
access to water from state park lakes. The mine was able to obtain water to sustain their operations
through their own initiatives.
Power plants depend on water supplies to provide cooling water which is essential to the generation of electricity. Closed system plants are those that utilize cooling towers or maintain cooling ponds. Cooling pond plants maintain an adequate water supply to sustain operations for a limited time period. Cooling tower plants still need a small supply of make-up water. Open cycle plants require a continuous supply of cooling water from adjacent waterways, most of which is immediately returned to the water source. Low flow conditions during 2012 resulted in the need to limit make-up flow and/or to decrease power generation at many power generating facilities in order to stay in regulatory compliance and maintain safe unit operation. Nuclear power plants such as Braidwood Station that withdraws water from the Kankakee River reached its low flow threshold specified in their DNR Public Water withdrawal permit and withdrawal of water was temporarily suspended. The Kendall 1200-MW combined cycle combustion gas turbine station draws water from the Illinois River and its withdrawal of that water was severely restricted when the Illinois and Kankakee river flows reached low flow limits set by permit. Three open-cycle fossil fueled plants on the Chicago Sanitary and Ship Canal/Lower Des Plaines River and one on the Mississippi River were required to reduce power production during critical demand periods in response to extremely low river flow conditions, which were further exacerbated by frequent level manipulations by upstream entities. Low river flows coupled with prolonged periods of above average air and water temperatures also challenged power plants to meet their National Pollutant Discharge Elimination System permits (NPDES) discharge temperature limits. Short-term site-specific thermal variances were granted by the Illinois Environmental Protection Agency, based on the showing of sufficient need by individual entities.
INDUSTRIAL WATER USAGE ISSUES 1. Public Water stream regulation of water withdrawals
2. Nuclear power plant dependence on limited water supply
3. Fossil-fueled powered power plants dependence on limited water supplies
4. Coal mining industry dependent on limited water supplies
INDUSTRIAL WATER USE RECOMMENDATIONS 1. Work with industries to identify adequate water supplies required to sustain existing and
projected production levels
2. Work with industries to develop recommended water use restrictions when water supplies are
inadequate to sustain existing production
3. Develop a mechanism to obtain expedient, long-term emergency regulatory relief for IEPA and
IDNR restrictions upon demonstration of no adverse impacts.
PRIVATE WATER USAGE Many agricultural producers were large water users in 2012. Water was used for crop irrigation and for
livestock production. Sources of water included surface water streams and groundwater wells.
13
Irrigation usage on the Vermilion River upstream of Streator depleted the stream flow at Streator such
that no water was reported over the Streator dam. Streator draws water from the Vermilion River
above the dam for replenishment of their water supply lake. With no water in the stream, alternate
water sources were sought. Irrigation utilizing groundwater reduced the groundwater availability for
private users. Several counties received complaints about the irrigations wells depleting private wells.
Numerous private wells in shallow aquifers ran dry. Supplemental water sources were utilized.
Supplemental water demand significantly increased demand on municipal systems. Some municipalities
eliminated bulk water sales as their supplies dwindled.
PRIVATE WATER USAGE ISSUES 1. Competition for groundwater supplies
2. Inadequate supplemental sources
PRIVATE WATER USE RECOMMENDATIONS 1. Illinois should conduct a state-wide assessment of all water uses, including private water uses,
and assess the supply and demand and the challenges of meeting that demand
NATURAL RESOURCE IMPACTS As flows in the rivers and streams of Illinois decreased during the drought, water temperatures rose and
dissolved oxygen levels fell. These river and stream conditions contributed to a significant number of
fish kills which occurred state-wide. Additionally, several mussel beds dried up, leaving the mussels
exposed to high temperatures and predators.
The hazards of wildfire existed in natural areas as dry weather persisted. These natural areas are used
frequently by campers and hikers. In many areas of southern Illinois, the dry conditions led to burn bans
which were implemented by most counties.
NATURAL RESOURCE ISSUES: 1. Fish kills. Mussel loss
2. Low DO, high water temperatures
3. Request from industry for water from State Parks
NATURAL RESOURCE RECOMMENDATIONS: 1. Monitor the variety and abundance of fish, mussels, and other aquatic life in the rivers and lakes
that have experienced drought impacts.
2. Develop resource management plans to address the impacts of drought.
NAVIGATION CONDITIONS National drought conditions grew progressively worse across states along the Mississippi River and
Missouri River. With reduced natural runoff from the Missouri River Basin, and with flows dropping
along the Mississippi River, the Mississippi River from St. Louis, Missouri to Cairo, Illinois began to show
14
signs of navigational stress. Scheduled reductions in Missouri River reservoir releases occurred on
December 1 in accordance with the Missouri River Basin Master Manual. On December 1, 2012 the
Corps reduced reservoir releases from 37,000 cfs to 12,000 cfs. Mississippi River stages were predicted
to fall to -5.5 feet at the St. Louis gage by December 15 which would significantly limit navigation near
Grand Tower and Thebes. A request was made to the Assistant Secretary of the Army to “take all
reasonable measures to sustain navigation” on the Middle Mississippi River. The lowest stage at the
Mississippi River St. Louis gage was -4.52 feet on January 2, 2013.
Utilization of barges to move commodities is very efficient. To replace one barge, the commodities
would fill 16 jumbo hopper rail cars or 70 trucks. It would strain the transportation system to move
these commodities utilizing a different mode. During the low stages on the Mississippi River, barges are
not being loaded to full capacity (11’ -12’ draft). When loading the barges, operators must be cognizant
of future river levels as the travel time for a barge down the river takes days.
Navigation was threatened in the 180 miles stretch of the Mississippi River from St. Louis to Cairo. In
order to maintain navigation on the Mississippi River, the Corps of Engineers begin dredging and rock
removal near Thebes in December 2012. The Corps of Engineers began releasing water from Carlisle
Lake on December 15, 2012 to supplement flows on the Mississippi River. The Corps does not have
authority to release water from the Missouri River reservoirs for navigation on the Mississippi River.
NAVIGATION ISSUES 1. Navigation on the Mississippi River is dependent on flows from states in the Upper Mississippi
River and the Missouri River. When drought affects the Midwest and western states, navigation
can be threatened.
2. Many Illinois exports and imports are dependent upon navigation. Ensuring a reliable navigation
system during drought is not always possible.
NAVIGATION RECOMMENDATIONS 1. Meet with navigation industry to develop plan of action for drought conditions.
2. Meet with all transportation industries to develop plan of action for drought conditions.
ECONOMICS OF THE DROUGHT Numerous economic consequences of the Drought of 2012 have been reported. These consequences
include: reduced crop production, reduced livestock operations, coal industry reduction in mining,
power industry reduction in power generation, water use restrictions in communities which reduced
commercial business opportunities, dependence on federal and state loan programs to ensure economic
vitality of Illinois businesses, and lost opportunities. The Department of Commerce and Economic
Opportunity is working to obtain data to document these economic consequences. This work is on-
going.
The National Drought Mitigation Center reported ethanol production fell in 2012. Numerous ethanol
plants closed throughout the summer and fall. EPA refused to waive the mandated ethanol production.

15
Corn was imported into Illinois from North Dakota for both ethanol production and livestock feed.
Ethanol producers lost $0.36 per gallon in 2012 after making $0.24 per gallon in 2011.
ECONOMIC IMPACTS 1. Financial loss in agricultural community
2. Government program costs
3. Transportation of products
4. Reduction in Illinois exports
ECONOMIC RECOMMENDATIONS 1. Development of a comprehensive plan, by appropriate governmental agencies, to assist those
famers whose acreage is currently uninsured to acquire crop insurance before the next major
drought event occurs.
2. It may be of value for appropriate governmental agencies to assess the current situation related
to the overall efficiency of all major intermodal operations located in close proximity to the
Mississippi River. This evaluation would be conducted with an eye on the likelihood of future
drought events and the need to mobilize alternative methods of transportation as quickly,
efficiently, and cost-effectively as possible.
3. Improve awareness of programs designed to assist with drought recovery.
TECHNICAL ISSUES Regulation of water usage based at low flow conditions has met with opposition from power companies
as it impacts their ability to generate electricity. Some biologists believe that the Q 7,10 flow rate
provides a good indicator of when instream aquatic resources will be at stress levels, and acknowledge
that there may be other important metrics to consider, including temperature and dissolved oxygen. A
more robust metric of reduced withdrawal and for no withdrawals may be possible to develop.
Temperature restrictions on water releases to Illinois rivers and streams are managed by the IEPA.
When water temperatures in the rivers and streams rise due to high air temperatures, meeting the
temperature restriction becomes challenging for compliance. IEPA has a process for issuing provisional
variances, based on adequate showing of need by individual entities.
TECHNICAL ISSUES 1. Use of Q 7,10 flow for initial regulation of water withdrawals
2. Variances during low flow conditions
TECHNICAL RECOMMENDATIONS 1. Convene meeting between regulators and industry to review opportunities for revising low
flow water use restriction and available thermal relief mechanisms.
16
POLICY ISSUES The availability of water for multiple uses during periods of low flows and limited water supply has few
administrative remedies. When riparian owners utilize available water, other users may find themselves
with insufficient water supply to operate. Comprehensive studies and management standards for water
supply, both surface water and groundwater, are needed to help with future consequences of drought.
POLICY ISSUES 1. Limited management authority for governmental units to respond to drought
a. No regulation of limited groundwater resources
b. No regulation of riparian water usage
c. Few identified alternative water supplies for municipalities
2. Uncertainty about government programs available to assist
POLICY RECOMMENDATIONS 1. Develop statewide water use management strategy for drought periods
2. Review Q 7,10 flow rates and associated parameters for low flow regulated usage
3. Develop statewide water supply planning regions and perform a statewide water supply and
demand assessment
4. Review existing governmental authorities to respond to drought emergencies and develop new
authorities where needed
17
REFERENCES
Hecht, J. and H.V. Knapp. 2008. Data for Assessing Drought Vulnerability of Illinois’ Community Surface
Water Systems. Illinois State Water Survey Contract Report 2008-02. Champaign, Illinois.
National Drought Mitigation Center. Droughtscape, the Newsletter of the National Drought Mitigation
Center. Winter 2013. (http://drought.unl.edu/NewsOutreach/DroughtScape.aspx)
State Water Plan Task Force. 2011. State of Illinois Drought Preparedness and Response Plan.
Appendix A
A-1
Response to the 2012 Drought Through much of its history, the Illinois State Water Survey (ISWS), a Division of the Prairie Research Institute at the University of Illinois, has been involved in climate and water supply issues that are central to the analysis and understanding of drought and its impacts. Throughout the progression of the 2012 drought, ISWS scientists, including the State Climatologist, were monitoring the climatic and hydrologic conditions of the State. An initial report on dry conditions was issued by the ISWS in April 2012, and a drought advisory was declared in May 2012. The ISWS presentation to the State Water Plan Task Force on June 19 was a key influence in that group’s recommendation to activate the Drought Response Task Force. Over the course of the drought the ISWS has continued to provide periodic assessments of the climatic and hydrologic conditions during the drought, the most recent of which is attached. Like the drought itself, many of its impacts are slow in developing. To anticipate the extent of impacts and identify their potential threats, it is often necessary to understand similar impacts of past droughts, which is where the ISWS’s experience is most valuable. For example, it is not sufficient by itself to know that a water supply lake is 2 feet below normal; but instead is important to understand if such below-normal behavior has led to problems in similar drought episodes. As part of its standard activities, the WARM (Water and Atmospheric Monitoring) program at the ISWS has collected and maintained long-term records on water supply lake levels, groundwater levels, and soil moisture that are essential to understanding the implications of ongoing drought conditions and providing a prognosis or perspective on the current drought’s progression. As the primary agency in Illinois for research and information on surface water, groundwater, and the atmosphere, the ISWS has continued to collect data, analyze information, and provide advice to State, Federal and regional agencies and also to private citizens during the drought period. Much of the special data collection efforts during this drought were centered on Decatur’s water supply situation; with data being collected and analyzed by ISWS scientists to identify: 1) stream channel losses in the Sangamon River upstream of Lake Decatur, 2) effects of Decatur’s well field on regional water levels in the Mahomet Aquifer, and 3) interactions between groundwater and the Sangamon River, with an ultimate purpose of quantifying how much of the water pumped from the aquifer actually reaches Lake Decatur and supplements the City’s supply. Water budget models of water supply lakes, developed previously as part of the ISWS programmatic studies, have also been used to compare the impacts of the current drought with that of previous historical droughts. These comparisons and projections based on historical drought sequences have been used to identify community systems that potentially would be vulnerable to water supply shortages if drought conditions were to continue. Finally, following past drought episodes the ISWS has produced comprehensive reports documenting those droughts and associated impacts, as it will for the current drought once its recovery is nearly

Appendix A
A-2
complete. These drought reports are essential for maintaining the ISWS’s ability to study and understand Illinois drought characteristics so that we can address future drought episodes. The ISWS also maintains a drought web site on current drought information, drought planning and preparation, and an archive on previous Illinois droughts. Go to: http://www.isws.illinois.edu/hilites/drought/ Additional activities of the ISWS and the State Climatologist during the drought include:
Analyze data on current water availability at water supply systems throughout Illinois and work with IEPA to identify which of these systems are most likely to experience water supply concerns at various stages throughout the drought. Prepare/update hydrologic models of selected community water supply systems that are able to quantify the relationship between observed water levels, water use and its conservation, and the ongoing hydrologic and climatic forces. Use these models to: 1) prepare prognoses of expected water availability and vulnerability if drought conditions are to persist, and 2) simulate conditions with the water supply if the climatic and hydrologic sequences from past extreme droughts were assumed to recur today, thus juxtaposing the historical droughts with the existing community water supply systems. Prepare written reports and briefings for the Illinois Drought Response Task Force (DRTF). These are posted on the Water Survey web site. Prepare informational materials for the public, agencies, and media that describe the vulnerability of water supply systems to drought with specific regard to the ongoing water supply conditions, common misconceptions concerning drought, and comparisons to some of the State’s worst hydrologic droughts of the past. Help with providing documentation for disaster declarations. This ranges from providing statewide precipitation numbers for the Governor’s drought press release to helping farmers with monthly rainfall amounts and the normal monthly values for their area. Regularly talk to the media and give presentations to groups interested in drought. The State Climatologist typically deals with media requests on a daily basis. Presentations have been made to many groups and meeting, including farm and agriculture groups, the Mahomet Aquifer Consortium and other regional water supply planning groups, the American Water Works Association, Illinois Environmental Protection Agency, and other related agencies and associations. Participate in regional and national meetings and webinars as either a panelist or presenter. Provide feedback to the authors of the US Drought Monitor.
Appendix A
January 25, 2013
Summary
Precipitation since the December 17, 2012, Drought Update has been slightly below average in parts of
central and northern Illinois and above average in southern Illinois. Soil moisture, streamflows, and lake
levels, especially in southern Illinois, have shown continued improvement since December. However,
more precipitation is needed for improvement in the deeper soil levels, some lake levels, and shallow
groundwater, particularly in western and northern Illinois where there has been less recovery in the
precipitation deficit. As there has been with most historical drought episodes, there has been
considerable regional and local variability in precipitation amounts and thus in both the drought’s
impact and its current state of recovery. For example, the La Harpe Reservoir in western Illinois, is one
of those pockets where water supply concerns have not yet been allayed. Even with what could be
considered, by most standards, a full recovery in hydrologic conditions later this spring, there could still
be lingering water supply impacts in the summer 2013 in those areas using or influenced by shallow
groundwater.
Precipitation and Temperature
The statewide precipitation was 3.1 inches, 116 percent of the long-term average for the period from
December 17, 2012, to January 24, 2013. Precipitation totals ranged from 2 to 3 inches in northern
Illinois to 2 to 5 in central Illinois to 3 to 7 inches in southern Illinois (Figure 1). In general, amounts were
close to average in northern Illinois, slightly below average across central Illinois, and 1 to 2 inches
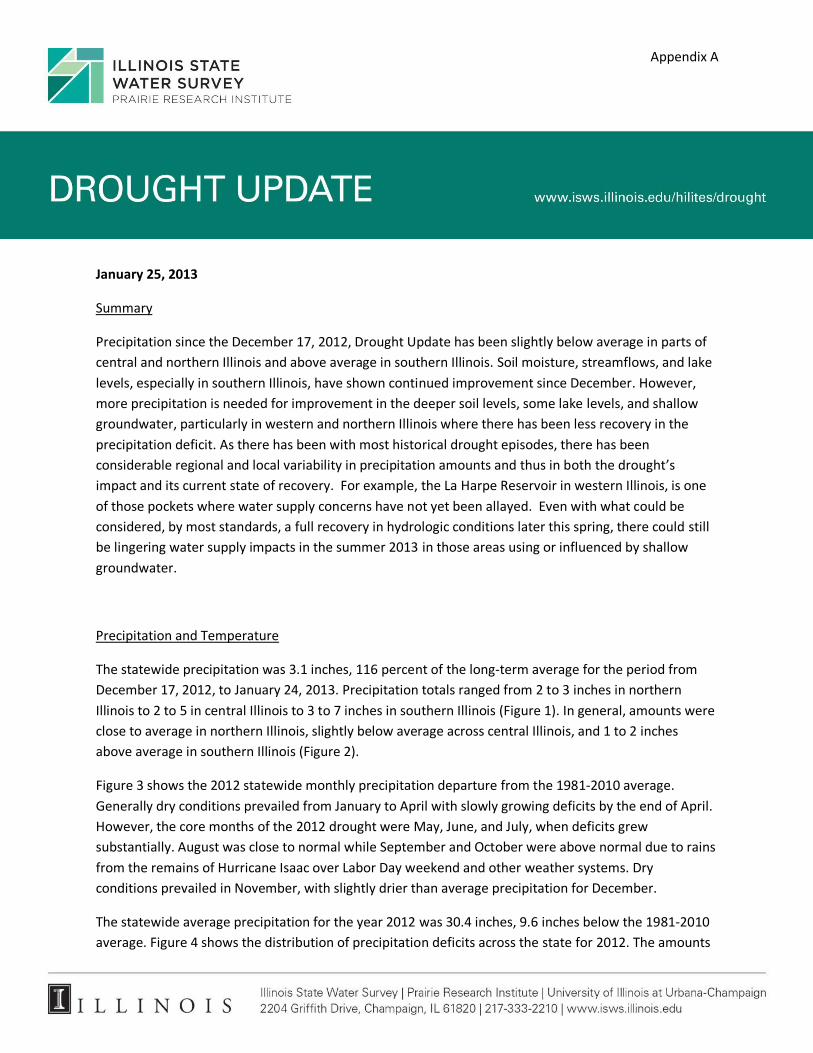
above average in southern Illinois (Figure 2).
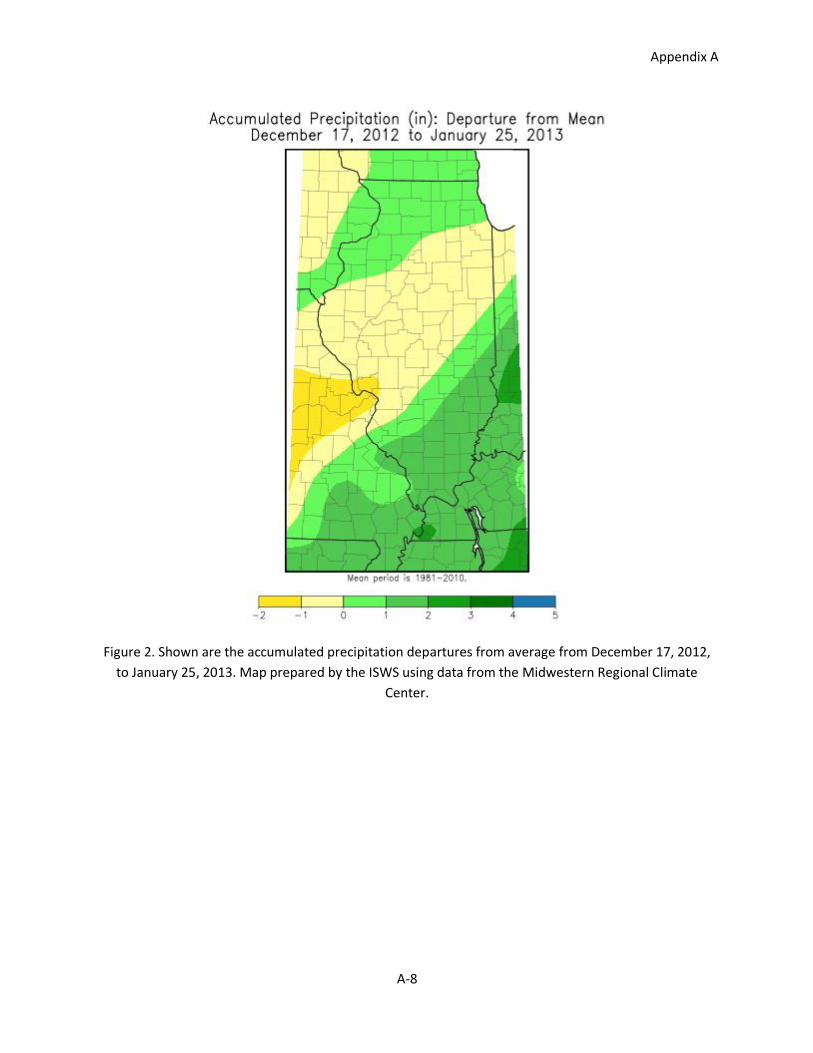
Figure 3 shows the 2012 statewide monthly precipitation departure from the 1981-2010 average.
Generally dry conditions prevailed from January to April with slowly growing deficits by the end of April.
However, the core months of the 2012 drought were May, June, and July, when deficits grew
substantially. August was close to normal while September and October were above normal due to rains
from the remains of Hurricane Isaac over Labor Day weekend and other weather systems. Dry
conditions prevailed in November, with slightly drier than average precipitation for December.
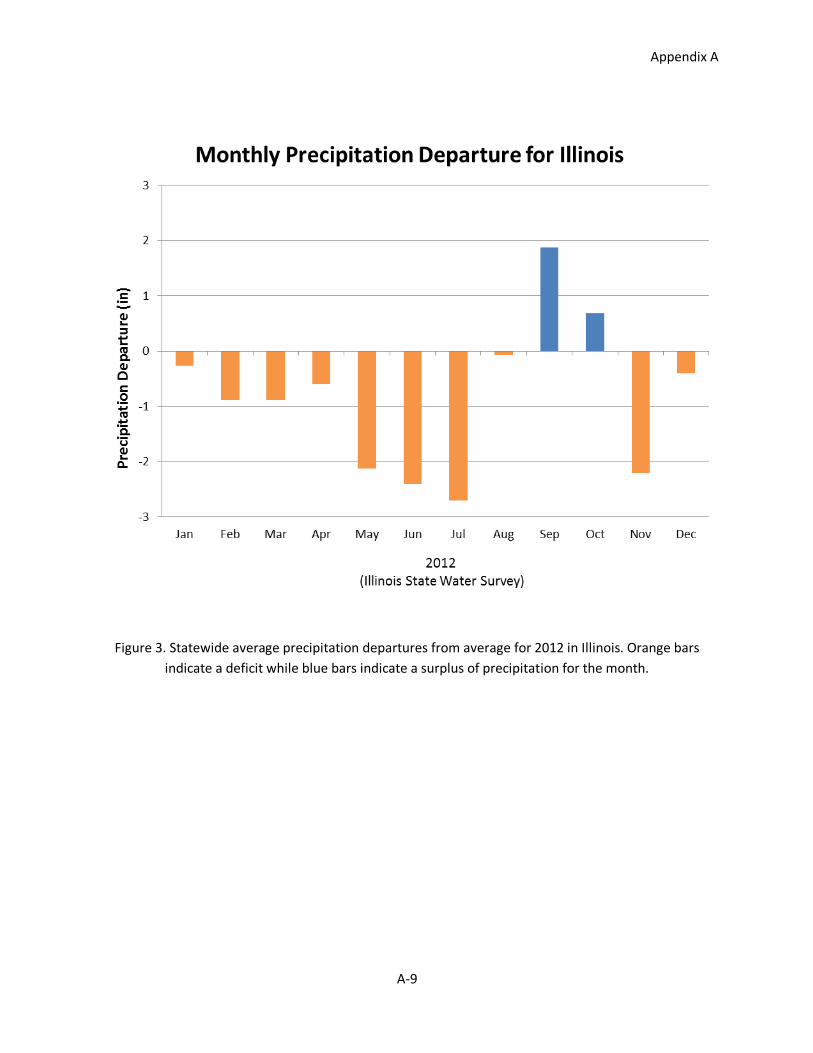
The statewide average precipitation for the year 2012 was 30.4 inches, 9.6 inches below the 1981-2010
average. Figure 4 shows the distribution of precipitation deficits across the state for 2012. The amounts

Appendix A
A-4
are estimated from radar data, and calibrated with available rain gauge data. The result is a higher
resolution precipitation product. Portions of southern, western, and northern Illinois were still 12 to 16
inches below average. Meanwhile, areas east of St. Louis and north of Champaign are at or near normal
precipitation, erasing the significant deficits accumulated earlier in the year. Precipitation in January
2013 has helped ease the deficits in the southern third of the state.
According to the U.S. Drought Monitor for January 22, 2013, Illinois still has 30 percent of the state rated
abnormally dry and another 36 percent in either moderate (D1) to severe drought (D2) – the two lowest
categories of drought.
One area of interest this winter has been the widely noted lack of snow across the northern two-thirds
of the state. While southern Illinois experienced a significant winter storm right after Christmas, the rest
of the state has seen little snow. In fact, snowfall in the northern two-thirds of the state ranged from 1
to 12 inches as of January 25, 2013, and is 10 to 50 percent of average for the winter. For example, as of
January 25, Chicago had reported only 2.8 inches of snow for the snowfall season. While the lack of
snow and lack of snow cover are important issues, the immediate impact on the drought are not evident
because of a few rain events since December 17 have helped to make up the difference in terms of
actual water content.
Soil Moisture
The ISWS maintains a soil moisture network of 19 sites in Illinois. However, the network is not operated
in winter months because of the potential for frozen soils to cause erroneous readings.
Agricultural Conditions
As of December 31, 2012, the USDA reported that the statewide topsoil moisture was rated at 2 percent
“very short” and 28 percent “short”. Subsoil moisture was rated as 20 percent “very short” and 47
percent “short”. In areas without frozen soils, it is likely improvements in soil moisture have occurred
since the December 31 report, especially in southern Illinois. More details can be found in the Illinois
Weather and Crops report published by the USDA.
Water Supply Reservoirs
At this stage in the recovery from the 2012 drought, there is only one community water supply system
that we consider to still be threatened with potential storages, that being the La Harpe system in
Hancock County. The recovery at a number of other reservoirs is still being watched.

Appendix A
A-5
Late winter and spring are seasons when reservoir levels have always rebounded when they are low,
even during the worst droughts and driest such seasons on record. Drought recovery is typically not
considered complete for reservoirs until they have returned to full pool; however, given current
conditions and seasonal tendencies, the ISWS considers that low reservoirs in the State are likely to
nearly if not fully replenish in the next 3-4 months prior to the onset of summer when reservoir levels
may once again be drawn down. Because of this expected recovery, we no longer consider current low
reservoirs levels, where they exist, to pose a threat to water supply. La Harpe Reservoir is the primary
exception, to a great extent because that portion of western Illinois is one of the regions of the State
that have seen the least precipitation and overall recovery over the past few months.
Figures 5-7 show the traces in water levels at three water supply lakes that have been of some concern
over the course of the drought. Many reservoirs have already completely refilled and, for them, the
drought is effectively over. Over the past month the Lake Decatur reservoir has essentially been
replenished and has periodically been releasing water to lower the lake level closer to its normal winter
pool level (see Figure 5). Because of expected water excesses in winter/spring, the ISWS considered the
Decatur system to effectively be recovered by November; however, we also acknowledge that the
groundwater resource that Decatur uses for supplemental supply may likely not fully recover this spring
and thus could enter next summer in a partially-depleted condition.
The water level for the Vienna/Correctional Center reservoir in Johnson County has rebounded
substantially during January (Figure 6). Although the lake is still well below its full pool level (at 380
feet), we expect that there will be considerable additional recovery over the next few months that will
mostly replenish the lake. This expectation is based on the fact that this part of Southern Illinois
receives considerably more rainfall during the winter and early spring that the remainder of Illinois, even
during the driest years. We also note that the January 2013 lake level is considerably higher than the
expected January level during a severe drought similar to that of the 1953-54 drought (Figure 6).
Lake Springfield is still over 3 feet below normal, but has been trending upward over the past month
(Figure 7). Figure 7 also shows that we would, in contrast, expect continued reduction in the lake level
during a more severe drought period. With the lake trending up at this time of the year, we project
continued recovery over the next few months and a high likelihood that the lake will refill later by this
spring. There are a handful of other water supply reservoirs in the Springfield region, most in Macoupin
County, that are experiencing similar conditions, and we expect that most or all of these reservoirs will
replenish by the spring.

Appendix A
A-6
Shallow Groundwater Supplies
Groundwater levels are still declining in northern Illinois, but have experienced moderate improvement
in much of central and southern Illinois. As stated in previous updates, shallow groundwater is usually
the last hydrologic component to see recovery following drought conditions. Even if soil moisture,
reservoirs, and stream levels fully recover in upcoming months, and the drought is declared to be no
more, there may still be lingering effects from groundwater levels that have not fully returned to pre-
drought levels. This may not be much of a concern unless 2013 is also a dry year; in which case the
number of wells having problems could be greater than in 2012. Lingering problems with low
groundwater levels could also affect streams and a handful of surface water supplies. Many streams in
northwestern Illinois and other locations scattered throughout the State receive a good share of their
flow from groundwater. A study of historical flow records indicates that many such streams experience
their lowest flows during the year following a drought – when groundwater levels also often reach their
minimum. Although drought conditions are recovering in Illinois and there has been moderate
improvement in groundwater levels in central and southern Illinois. But the extent of the overall
recovery is weakest in western and northern Illinois, in which regions groundwater levels are still
declining. At this point, we believe that the potential exists for limited groundwater recharge this spring
for these portions of the State and thus even greater problems in 2013 for some water supplies that
depend on shallow groundwater.
Streamflow levels
Over the past month, the regions of Illinois that are still experiencing below-normal streamflow levels
for this time of year are dwindling in size (Figure 8). Specifically, streamflow levels are not as
consistently low as would be expected during a persisting severe drought, another sign of the gradual
hydrological recovery from the drought which bolsters the expectation of full recovery in surface water
levels by the end of the spring. But as noted in the paragraphs above and in previous updates, for
certain regions, such as western and northern Illinois, the degree of drought recovery has been less and
there is a concern that baseflow levels in streams may decline to even lower levels in 2013 if: 1) the
upcoming spring and summer are also dry and 2) the corresponding recharge of shallow groundwater is
limited.

Appendix A
A-7
Figure 1. Shown are the accumulated precipitation amounts from December 17, 2012, to January 25,
2013. Map prepared by the ISWS using data from the Midwestern Regional Climate Center.
Appendix A
A-8
Figure 2. Shown are the accumulated precipitation departures from average from December 17, 2012,
to January 25, 2013. Map prepared by the ISWS using data from the Midwestern Regional Climate
Center.
Appendix A
A-9
Figure 3. Statewide average precipitation departures from average for 2012 in Illinois. Orange bars
indicate a deficit while blue bars indicate a surplus of precipitation for the month.
Appendix A
A-10
Figure 4. Shown are the January 1 to December 31, 2012, rainfall departures from normal, based on the
radar/raingauge data from the Advanced Hydrologic Prediction Service (AHPS) of the NWS and prepared
by the ISWS.
Appendix A
A-11
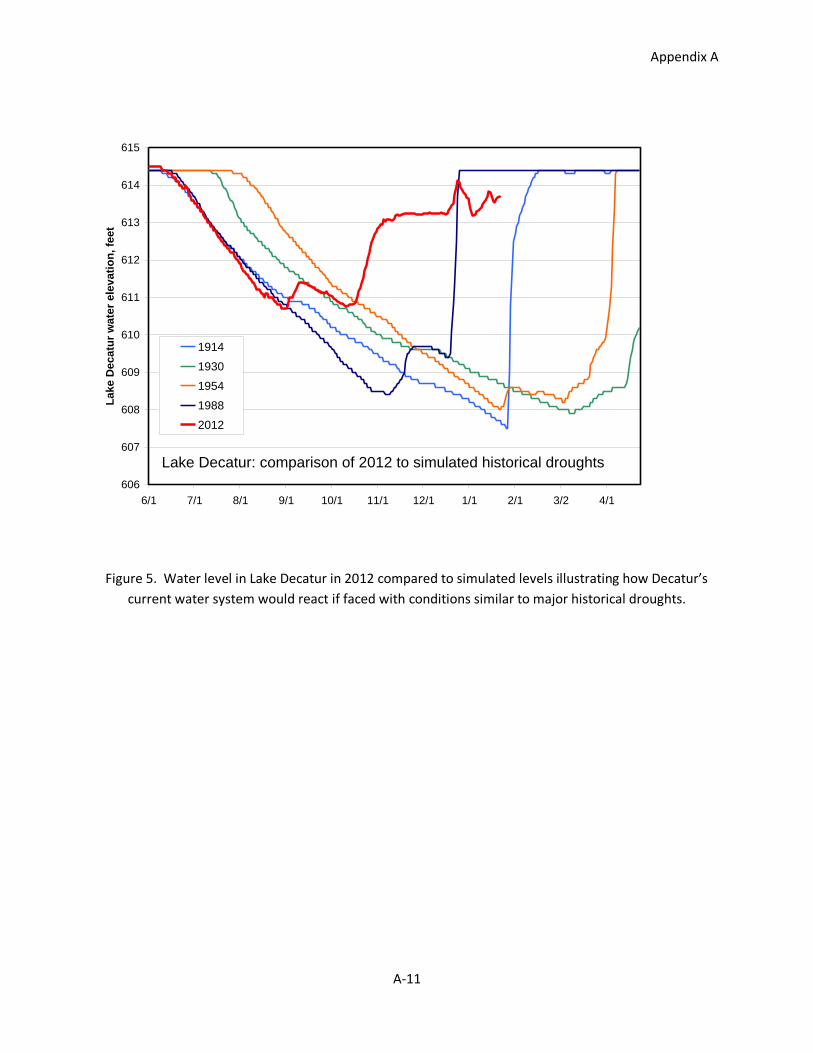
Figure 5. Water level in Lake Decatur in 2012 compared to simulated levels illustrating how Decatur’s
current water system would react if faced with conditions similar to major historical droughts.
606
607
608
609
610
611
612
613
614
615
6/1 7/1 8/1 9/1 10/1 11/1 12/1 1/1 2/1 3/2 4/1
La
ke
De
ca
tur
wa
ter
ele
va
tio
n, fe
et
1914
1930
1954
1988
2012
Lake Decatur: comparison of 2012 to simulated historical droughts

Appendix A
A-12
Figure 6. Water level in the Vienna Correctional Center Lake in 2012 compared to conditions during a
drought similar to the 1953-54 drought of record.
Figure 7. Water level in Lake Springfield in 2012 compared to: a) that from recent drought episodes, and
b) levels expected with major droughts of varying severity or frequency.
362
364
366
368
370
372
374
376
378
380
May July Sep Nov Jan Mar May July Sep Nov
Vie
nn
a C
C L
ake w
ate
r ele
vation
, ft.
2012
1953-54
Comparison of 2012 to simulated levels for the 1953 record drought
Vienna/Shawnee Correctional Center
Lake
542
544
546
548
550
552
554
556
558
560
562
June Aug Oct Dec Feb Apr June Aug Oct Dec Feb
La
ke
Le
ve
l, f
ee
t
1988-19891999-2000201210-Year Drought15-Year Drought25-Year Drought50-Year Drought100-Year Drought
Lake Springfield Level in Recent Droughts
Appendix A
A-13
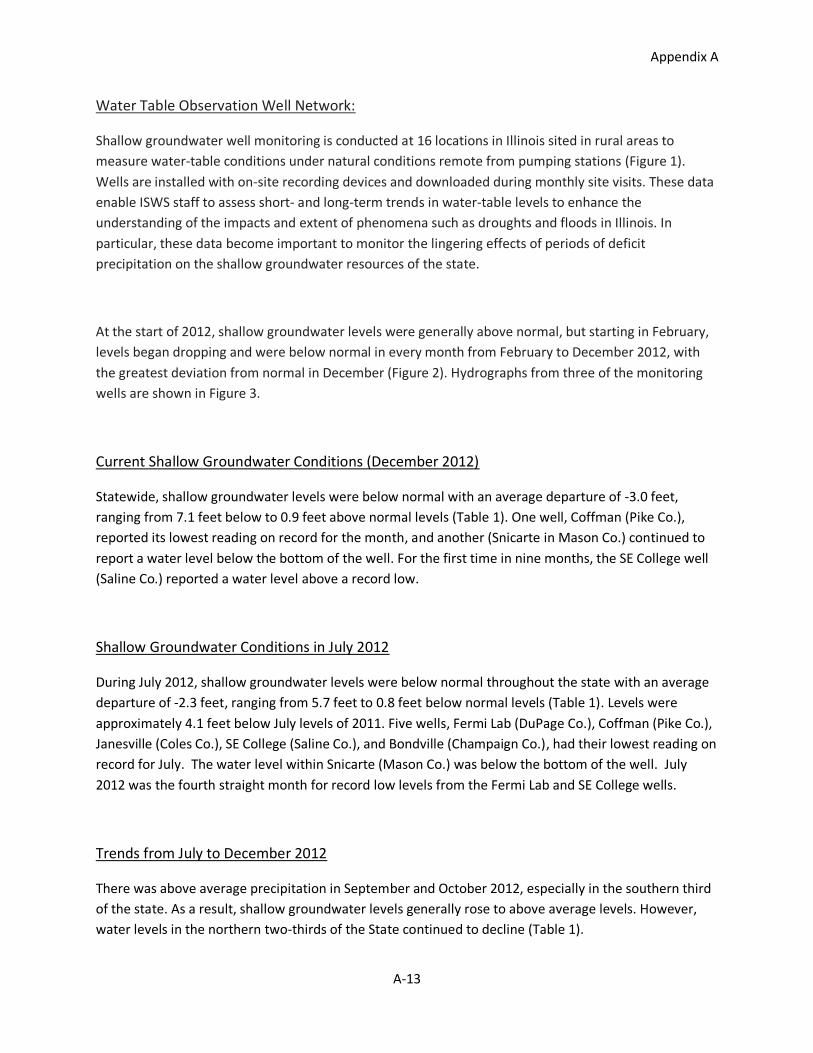
Water Table Observation Well Network:
Shallow groundwater well monitoring is conducted at 16 locations in Illinois sited in rural areas to
measure water-table conditions under natural conditions remote from pumping stations (Figure 1).
Wells are installed with on-site recording devices and downloaded during monthly site visits. These data
enable ISWS staff to assess short- and long-term trends in water-table levels to enhance the
understanding of the impacts and extent of phenomena such as droughts and floods in Illinois. In
particular, these data become important to monitor the lingering effects of periods of deficit
precipitation on the shallow groundwater resources of the state.
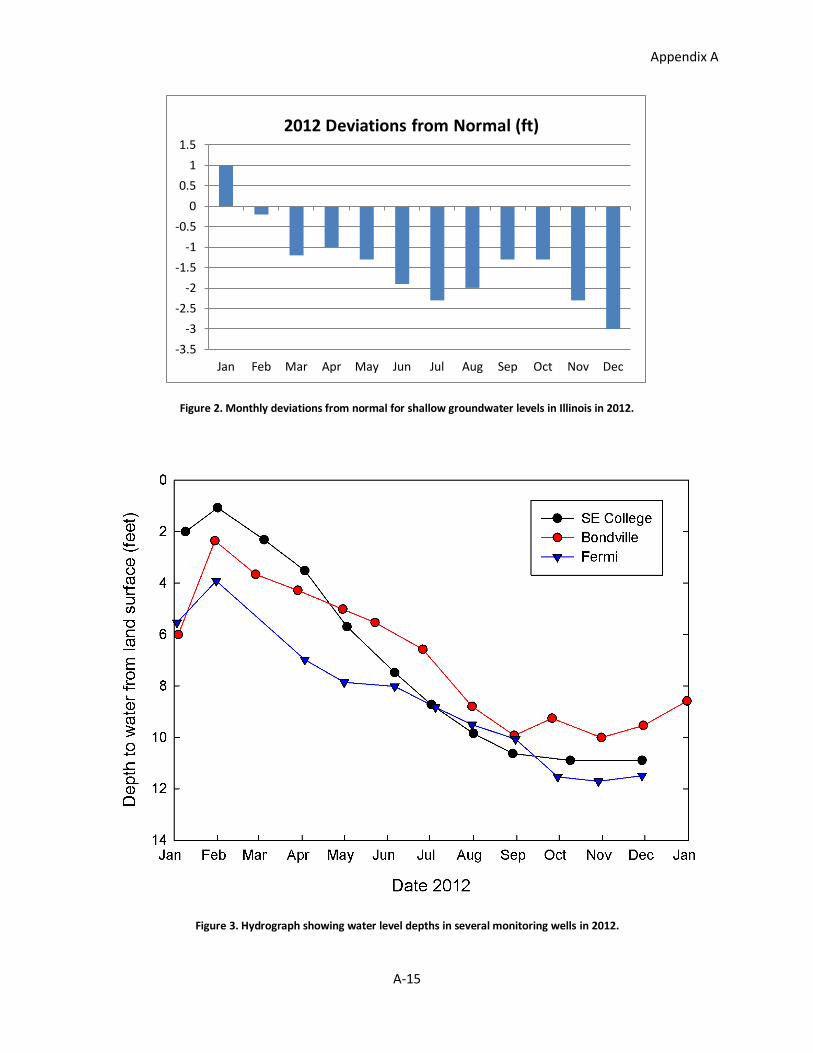
At the start of 2012, shallow groundwater levels were generally above normal, but starting in February,
levels began dropping and were below normal in every month from February to December 2012, with
the greatest deviation from normal in December (Figure 2). Hydrographs from three of the monitoring
wells are shown in Figure 3.
Current Shallow Groundwater Conditions (December 2012)
Statewide, shallow groundwater levels were below normal with an average departure of -3.0 feet,
ranging from 7.1 feet below to 0.9 feet above normal levels (Table 1). One well, Coffman (Pike Co.),
reported its lowest reading on record for the month, and another (Snicarte in Mason Co.) continued to
report a water level below the bottom of the well. For the first time in nine months, the SE College well
(Saline Co.) reported a water level above a record low.
Shallow Groundwater Conditions in July 2012
During July 2012, shallow groundwater levels were below normal throughout the state with an average
departure of -2.3 feet, ranging from 5.7 feet to 0.8 feet below normal levels (Table 1). Levels were
approximately 4.1 feet below July levels of 2011. Five wells, Fermi Lab (DuPage Co.), Coffman (Pike Co.),
Janesville (Coles Co.), SE College (Saline Co.), and Bondville (Champaign Co.), had their lowest reading on
record for July. The water level within Snicarte (Mason Co.) was below the bottom of the well. July
2012 was the fourth straight month for record low levels from the Fermi Lab and SE College wells.
Trends from July to December 2012
There was above average precipitation in September and October 2012, especially in the southern third
of the state. As a result, shallow groundwater levels generally rose to above average levels. However,
water levels in the northern two-thirds of the State continued to decline (Table 1).

Appendix A
A-14
Figure 1. Location of shallow groundwater monitoring wells in Illinois.
Appendix A
A-15
Figure 2. Monthly deviations from normal for shallow groundwater levels in Illinois in 2012.
Figure 3. Hydrograph showing water level depths in several monitoring wells in 2012.
-3.5
-3
-2.5
-2
-1.5
-1
-0.5
0
0.5
1
1.5
Jan Feb Mar Apr May Jun Jul Aug Sep Oct Nov Dec
2012 Deviations from Normal (ft)

Appendix A
A-16
Table 1. Groundwater levels measured in July and December 2012, and deviations from 15-year average
for those months. NA = not available.
Jul-12 Dec-12 Deviation from
normal
Well name Depth to water
(feet)
15-year avg.
Level (feet)
Depth to water
(feet)
15-year avg.
Level (feet) July - Dec
Galena 21.31 -1.81 22.05 -0.96 -0.74
Mt. Morris 18.89 -1.78 25.50 -4.64 -6.61
Crystal Lake 5.80 -1.18 7.2 -1.81 -1.40
Cambridge NA NA NA NA NA
Fermi Lab 9.20* -1.52 10.80 -3.62 -1.60
Good Hope 9.65 -3.91 13.35 -5.9 -3.70
Snicarte NA** NA NA** NA NA
Coffman 18.12* -6.28 19.42* -6.88 -1.3
Greenfield 15.32 -2.94 18.48 -5.59 -3.16
Janesville 8.29* -2.29 4.92 -0.20 3.37
St. Peter 5.49 -1.99 1.36 0.60 4.13
SWS #2 15.53 -1.96 15.30 -1.68 0.23
Boyleston 6.13 -1.41 8.14 -4.61 -2.01
Sparta 9.25 -2.68 8.66 -1.35 0.59
SE College 9.85* -2.92 9.65 -5.51 0.20
Bondville 10.27* -4.96 7.12 -2.60 3.15
AVERAGE
-0.63
* Lowest reading reported in this month for the period of record ** Water level fell below the bottom of the well

Appendix B
B-1
U. S. GEOLOGICAL SURVEY
Drought Summary of USGS Activities in 2012 to Support the State of Illinois Governor’s Drought Response Task Force
Introduction The U.S. Geological Survey (USGS) collects streamflow, groundwater level, and water-quality data for
the State of Illinois and the Nation. Much of these data are collected every 15 minutes (real-time) as a part of the national network, so that water-resource managers can make decisions in a timely and reliable
manner. Much of the USGS real-time data are commonly collected every 15 minutes, and transmitted
hourly. The length of time in the transmission and data routing results in data being available on the Web generally within 30 to 90 minutes. Data are quality checked daily. USGS real-time data includes
streamflow, precipitation and groundwater levels. Coupled with modeling and other water-resource
investigations, the USGS provides data to the State during droughts and other hydrologic events. This
summary focuses on the data collected in 2012, primarily the spring, through October 2012. This is also the time period when the normal hydrologic cycle has the highest streamflows and groundwater levels, to
the lowest.
Streamflow Current (real-time) and historical streamflow data are available on the USGS web site for over 230 USGS
streamgages in Illinois (figure 1) (http://waterwatch.usgs.gov). Generally, the daily, monthly, and annual discharge statistics are provided. Streamflow was generally decreasing at most stations throughout the
State in June, July and August. Of the 114 stations in Illinois with more than 30 years of continuous
record, six stations set new record lows and 17 tied record lows (table 1). For example, the long-term streamflow station on the Sangamon River at Monticello had the lowest 7-day flow (0 cfs for 16 days) in
105 years of record.
Substantial precipitation in much of the State occurred starting in August, and continued through September, and early October, which resulted in a decrease in the drought severity. Illinois had zones of
below normal streamflow based on the 7-Day average streamflow when compared to the historical
streamflow. Streamflow conditions at three index streamgages representing the geographic distribution of climate areas in the State (figure 2) are compared to the previous drought of 1987-88, as well as the
normal streamflow over a 30-year period. In general, the streamflow at these three sites, and many of the
other streamflow sites which have a 30-year period of record or greater, have returned to normal or near normal for this time of year.
Low streamflows may adversely affect the biological integrity of the stream, water supply, and/or
wastewater discharge operations. To supplement USGS real-time streamflow data currently collected at over 230 locations across the State, many of them at streamgages where low flows were confirmed or at
the request of the cooperator. The USGS also collected discrete streamflow information by 15
streamflow measurements at 7 different sites as requested, and are highlighted in table 2 in yellow. All of this additional information was at locations with high areas of concern for water-resource managers and
sites for which historic streamflow information is available for comparison. The USGS collected over 200
low-flow measurements in the midst of the drought that are listed in table 2. These measurements were
regularly updated and made available through the USGS website.
Appendix B
B-2
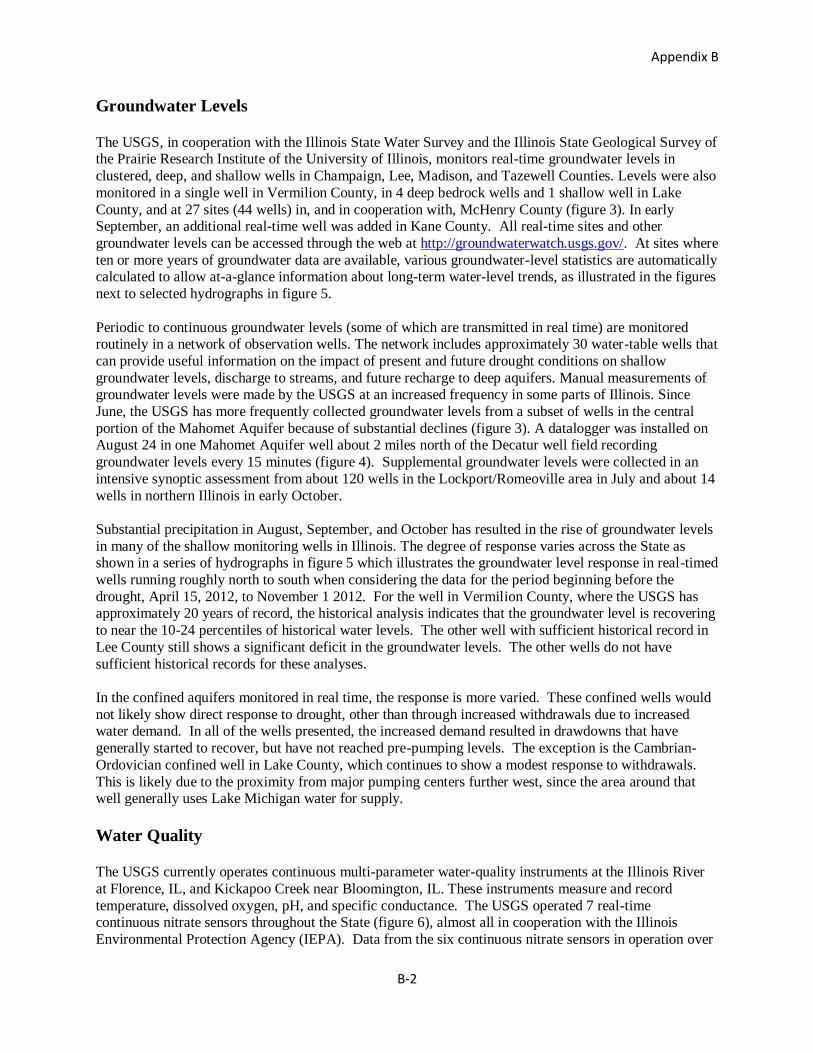
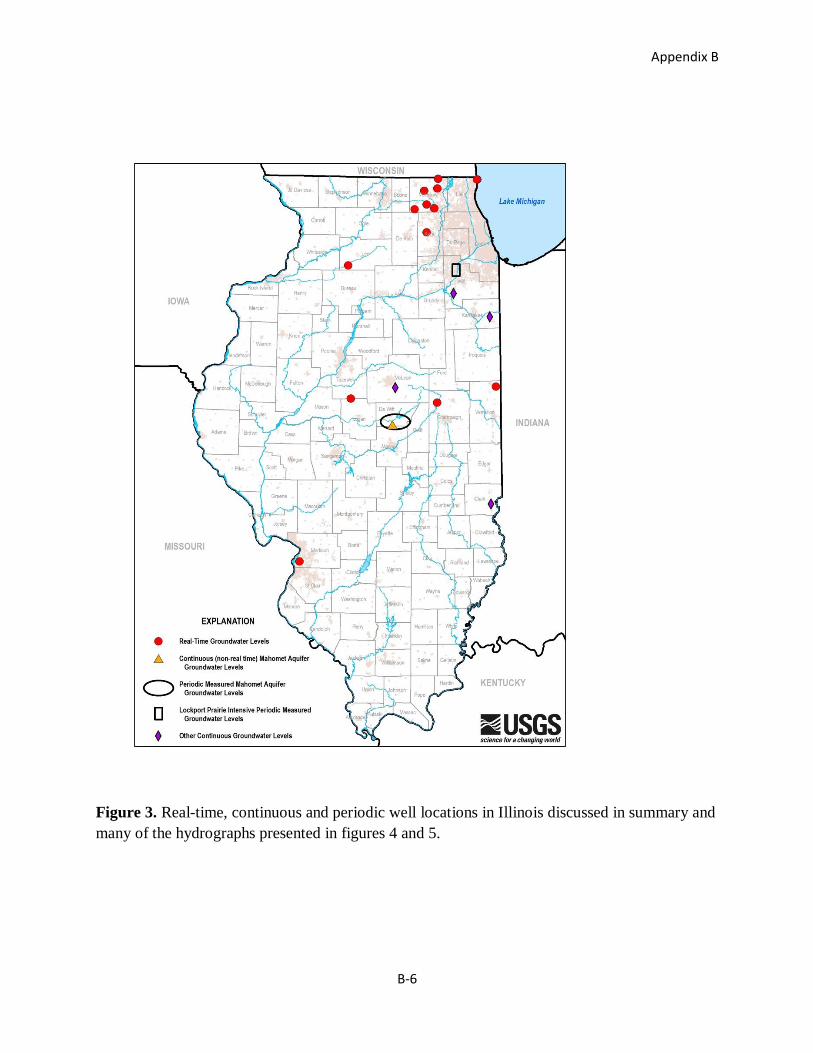
Groundwater Levels The USGS, in cooperation with the Illinois State Water Survey and the Illinois State Geological Survey of the Prairie Research Institute of the University of Illinois, monitors real-time groundwater levels in
clustered, deep, and shallow wells in Champaign, Lee, Madison, and Tazewell Counties. Levels were also
monitored in a single well in Vermilion County, in 4 deep bedrock wells and 1 shallow well in Lake
County, and at 27 sites (44 wells) in, and in cooperation with, McHenry County (figure 3). In early September, an additional real-time well was added in Kane County. All real-time sites and other
groundwater levels can be accessed through the web at http://groundwaterwatch.usgs.gov/. At sites where
ten or more years of groundwater data are available, various groundwater-level statistics are automatically calculated to allow at-a-glance information about long-term water-level trends, as illustrated in the figures
next to selected hydrographs in figure 5.
Periodic to continuous groundwater levels (some of which are transmitted in real time) are monitored routinely in a network of observation wells. The network includes approximately 30 water-table wells that
can provide useful information on the impact of present and future drought conditions on shallow
groundwater levels, discharge to streams, and future recharge to deep aquifers. Manual measurements of groundwater levels were made by the USGS at an increased frequency in some parts of Illinois. Since
June, the USGS has more frequently collected groundwater levels from a subset of wells in the central
portion of the Mahomet Aquifer because of substantial declines (figure 3). A datalogger was installed on August 24 in one Mahomet Aquifer well about 2 miles north of the Decatur well field recording
groundwater levels every 15 minutes (figure 4). Supplemental groundwater levels were collected in an
intensive synoptic assessment from about 120 wells in the Lockport/Romeoville area in July and about 14
wells in northern Illinois in early October.
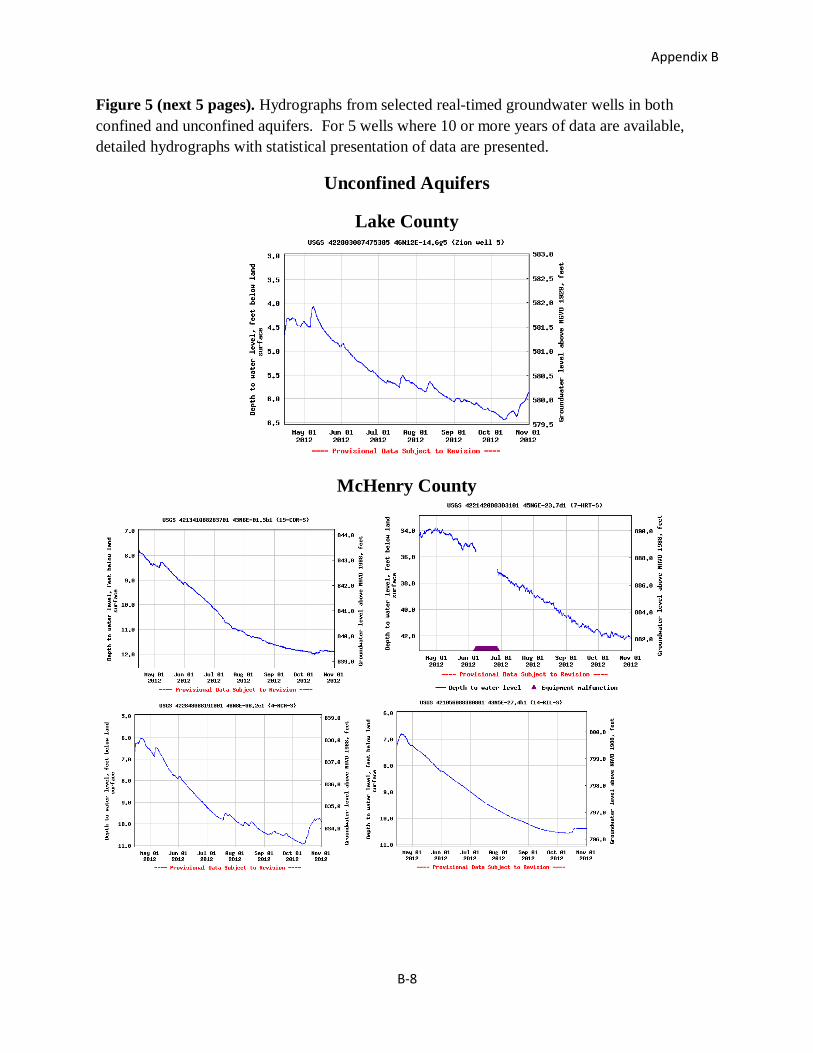
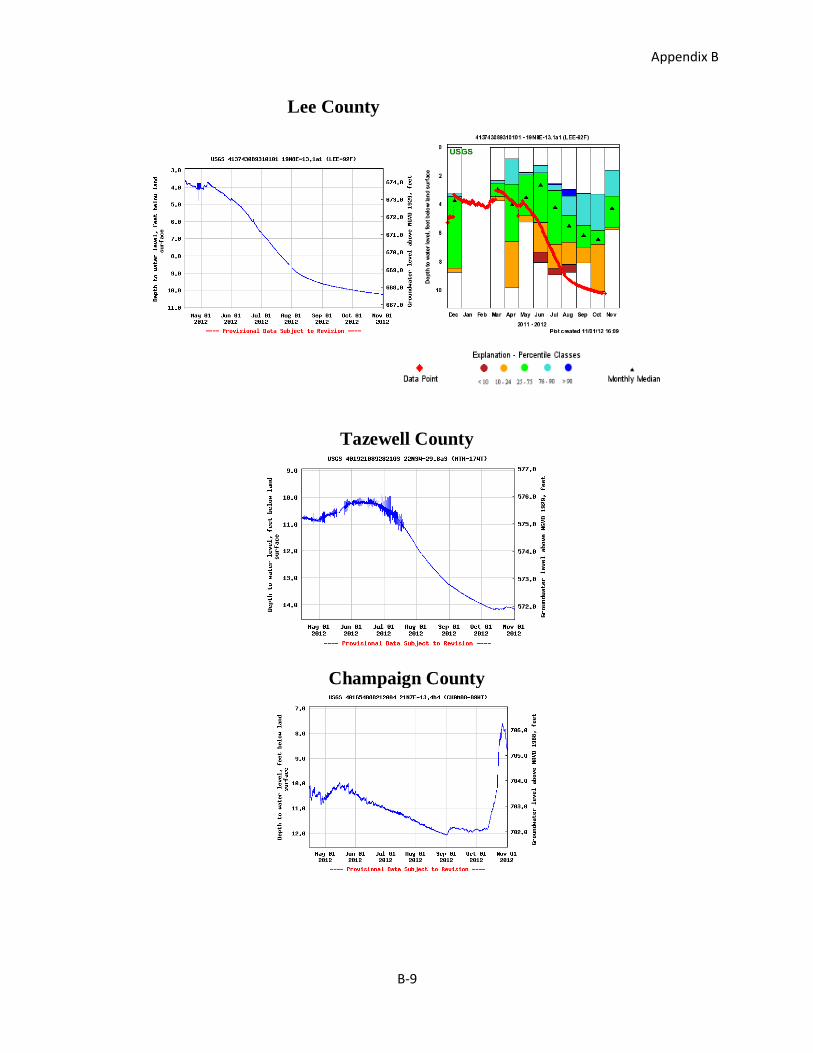
Substantial precipitation in August, September, and October has resulted in the rise of groundwater levels
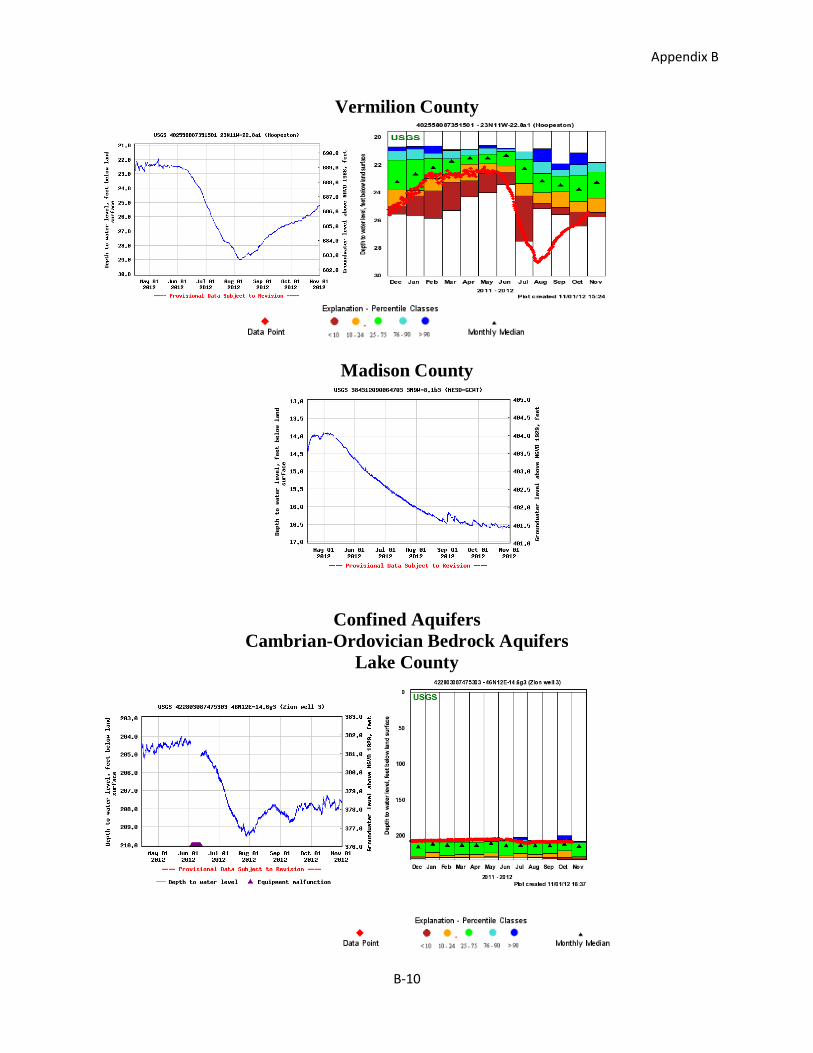
in many of the shallow monitoring wells in Illinois. The degree of response varies across the State as shown in a series of hydrographs in figure 5 which illustrates the groundwater level response in real-timed
wells running roughly north to south when considering the data for the period beginning before the
drought, April 15, 2012, to November 1 2012. For the well in Vermilion County, where the USGS has approximately 20 years of record, the historical analysis indicates that the groundwater level is recovering
to near the 10-24 percentiles of historical water levels. The other well with sufficient historical record in
Lee County still shows a significant deficit in the groundwater levels. The other wells do not have
sufficient historical records for these analyses.
In the confined aquifers monitored in real time, the response is more varied. These confined wells would
not likely show direct response to drought, other than through increased withdrawals due to increased water demand. In all of the wells presented, the increased demand resulted in drawdowns that have
generally started to recover, but have not reached pre-pumping levels. The exception is the Cambrian-
Ordovician confined well in Lake County, which continues to show a modest response to withdrawals.
This is likely due to the proximity from major pumping centers further west, since the area around that well generally uses Lake Michigan water for supply.
Water Quality The USGS currently operates continuous multi-parameter water-quality instruments at the Illinois River
at Florence, IL, and Kickapoo Creek near Bloomington, IL. These instruments measure and record
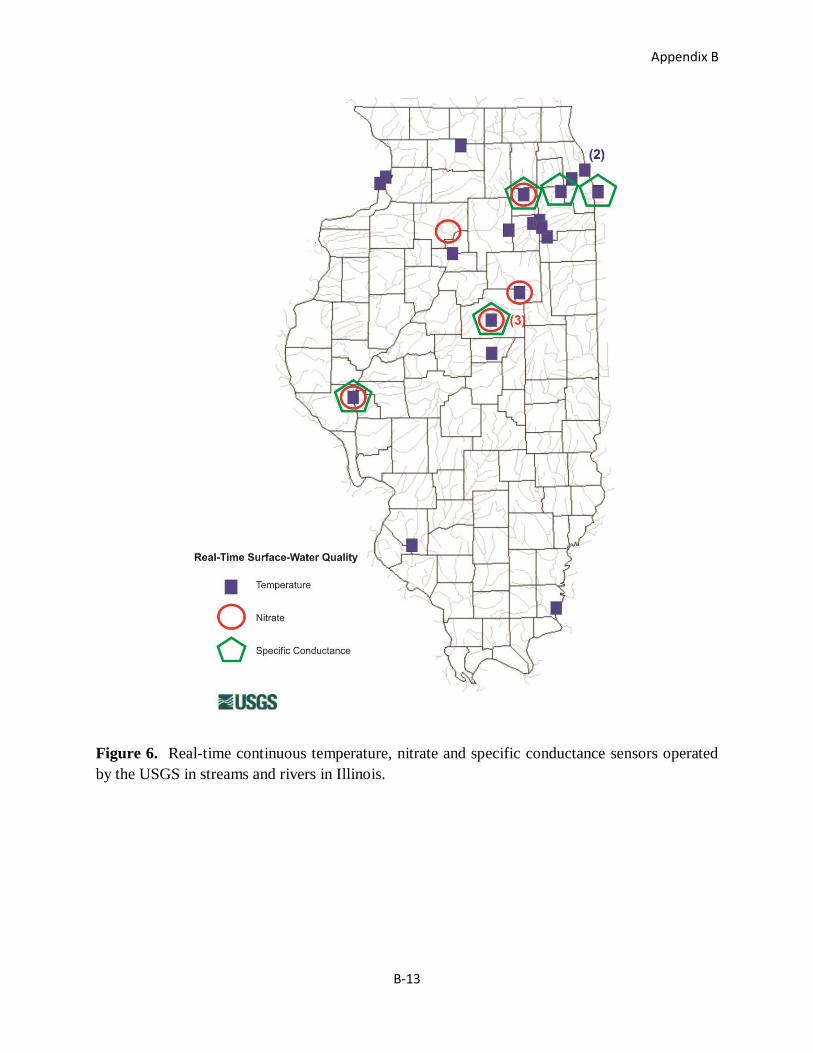
temperature, dissolved oxygen, pH, and specific conductance. The USGS operated 7 real-time continuous nitrate sensors throughout the State (figure 6), almost all in cooperation with the Illinois
Environmental Protection Agency (IEPA). Data from the six continuous nitrate sensors in operation over

Appendix B
B-3
the summer documented low nitrate concentrations from June through mid-October 2012, with temporary
increases in concentration in response to precipitation events in early September. Real-time water temperature readings may be of particular interest during drought conditions. The USGS currently
collects water temperature at 18 surface-water sites (figure 6) and 5 groundwater wells. All of the real-
time water-quality data are available through the web at http://waterwatch.usgs.gov/wqwatch/.
Hot and dry climatic conditions can promote excessive aquatic plant growth resulting in levels of blue-
green algae (or cyanobacteria) that can adversely affect the health of water users and recreationalists.
These algal blooms can contain toxins and may foul the taste and odor of raw and finished drinking water. The IEPA and the USGS sampled 13 lake and stream sites throughout Illinois (figure 7) for the presence
blue-green algae and related toxins in response to the drought. Based on the analyses completed thus far,
three of the sites contained levels of the microcystin toxin considered to be high or very high risk to humans (above the 20 ug/L World Health Organization criteria), with the highest result at 4,800 ug/L.
The lake samples at West Lake (1700 ug/L) and Camp Walter Scott (1500 ug/L) also had significant
concentrations of Microcystin. Additional analyses of these samples are still ongoing for additional
toxins. Real-time monitoring of in-situ blue-green algae can provide early warning signs of impending problematic conditions and monitoring of existing growth conditions. The IEPA is following up on
future activities with other State agencies.
Precipitation The USGS provided a Web-based tool displaying provisional precipitation data that are collected
throughout Illinois, as well as individual data for each USGS rain gage. These data used in the Web-based tool are transmitted to the USGS from Federal, State, and local agencies at about 130 sites, and are posted
as color-coded amounts for selected time periods on a Google Map platform
(http://il.water.usgs.gov/gmaps/precip). There is an option to display NEXRAD imagery from the National Weather Service for comparison with raingage totals. The data can be sorted by precipitation
totals, enabling water-resource managers to pinpoint areas that have received short-term rainfall relief
from the drought. The USGS, in cooperation with State and local cooperators, also operates, maintains,
and publishes precipitation data from a network of 56 real-time precipitation gages. Approximately 15 of those gages are part of the public accessible, real-time network in DuPage County, run in conjunction
with the County.
National Resources Available The USGS collects national data sets for streamflow, groundwater, precipitation, and water quality, which
provide Illinois with comparable data outside the State boundary. This allows users a regional comparison
of data. Streamflow data collected by the USGS on a national scale is maintained in the WaterWatch and
viewer. The WaterWatch viewer (http://waterwatch.usgs.gov/) shows the below normal 7-Day average streamflow when compared to historical streamflow for the day of the year. Comparisons to surrounding
States can help Illinois evaluate the extent of drought conditions. Also, among the USGS-maintained
national databases is the Drought Monitoring Viewer (http://vegdri.cr.usgs.gov/viewer/viewer.htm). This satellite-derived imagery captures on-the-ground information weekly about the relation between climate
variables and vegetation health. The interactive nature of the system allows the users to locate and further
investigate an area of interest.

Appendix B
B-4
Figure 1. Map of real-time streamflow data with all current streamgages shown and only those
with sufficient historical record provided with color-coding for the percentile of flow for
November 3, 2012 with the locations of the streamgages where hydrographs are presented and
discussed in figure 2.
Appendix B
B-5
Appendix B
B-6
Figure 3. Real-time, continuous and periodic well locations in Illinois discussed in summary and
many of the hydrographs presented in figures 4 and 5.

Appendix B
B-7
Figure 4. Two hydrographs for one of the wells the USGS has monitored groundwater levels
since 2005. The upper hydrograph provides the historical groundwater measurements since
1992. The decline of groundwater levels in 2012 is shown. The lower hydrograph provides the
continuous groundwater levels from a datalogger installed in the well on August 24 just before
the City of Decatur began pumping from their supplementary well field, to the current recovery
upon cessation of pumping near the end of October.
Appendix B
B-8
Figure 5 (next 5 pages). Hydrographs from selected real-timed groundwater wells in both
confined and unconfined aquifers. For 5 wells where 10 or more years of data are available,
detailed hydrographs with statistical presentation of data are presented.
Unconfined Aquifers
Lake County
McHenry County
Appendix B
B-9
Lee County
Tazewell County
Champaign County
Appendix B
B-10
Vermilion County
Madison County
Confined Aquifers
Cambrian-Ordovician Bedrock Aquifers
Lake County

Appendix B
B-11
Confined Deep Sand and Gravel Aquifers
McHenry County
Confined Glacial Aquifer
Lee County

Appendix B
B-12
Confined Mahomet Glacial Aquifer
Tazewell County
Champaign County
Appendix B
B-13
Figure 6. Real-time continuous temperature, nitrate and specific conductance sensors operated
by the USGS in streams and rivers in Illinois.

Appendix B
B-14
Figure 7. Lakes and rivers sampled by the IEPA and the USGS for blue-green algal toxins in
late August and early September 2012.

Appendix B
B-15
Table 1. Summary of recent 7-Day average streamflow conditions [2012-05-18 to 2012-10-31}
["--", no data; ">", greater than all historical minimum values]
USGS USGS Drain.
2012-05-18 to 2012-10-31
Historical annual
station station area minimum 7-day flows
number name [mi2] No. No. Min. No.
of Lowest 7-day average flow
of (year) of
days years [ft3/s] years
with Stream flow
[ft3/s]
with
zero zero
flows Date Rank flows
5572000 SANGAMON RIVER AT MONTICELLO, IL
550 16 7/31/2012 0 1 105 0.07 0
-1988
5543500 ILLINOIS RIVER AT MARSEILLES, IL
8259 0 10/12/2012 1500 1 93 1670 0
-2006
5579500 LAKE FORK NEAR CORNLAND, IL
214 0 10/12/2012 0.7 1 65 0.96 0
-1988
5591200 KASKASKIA RIVER AT COOKS MILLS, IL
473 0 7/17/2012 1.66 1 43 2.66 0
-1988
3336900 SALT FORK NEAR ST. JOSEPH, IL
134 0 8/13/2012 2.74 1 42 3 0
-1977
3336645 MIDDLE FORK
VERMILION RIVER ABOVE OAKWOOD, IL
432 0 8/4/2012 1.61 1 34 5.13 0
-1981
3338780 NORTH FORK VERMILION RIVER
NEAR BISMARCK, IL
262 0 7/31/2012 2.67 1 24 2.69 0
-1991
5590950 KASKASKIA RIVER AT CHESTERVILLE, IL
358 0 7/14/2012 5.49 1 18 5.97 0
-1999
5551675 BLACKBERRY CREEK NEAR MONTGOMERY,
IL
55 0 8/11/2012 0.21 1 14 0.35 0
-2005
5551000 FOX RIVER AT SOUTH ELGIN, IL
1556 0 7/13/2012 214 1 13 234 0
-1991
5548105 NIPPERSINK CREEK
ABOVE WONDER LAKE, IL
84.5 0 9/22/2012 5.17 1 9 7.01 0
-1994
5541710 AUX SABLE CREEK NEAR MORRIS, IL
172 0 10/1/2012 1.03 1 6 4.47 0
-2008
5579630 KICKAPOO CREEK NEAR BLOOMINGTON,
IL
14.8 4 8/12/2012 0 1 6 0.01 0
-2008
5527910 NORTH MILL CREEK NEAR MILBURN, IL
28.4 0 8/8/2012 0.8 1 4 0.93 0
-2008
5536162 PLUM CREEK NEAR CRETE, IL
18.7 0 7/14/2012 0.45 1 4 0.69 0
-2010
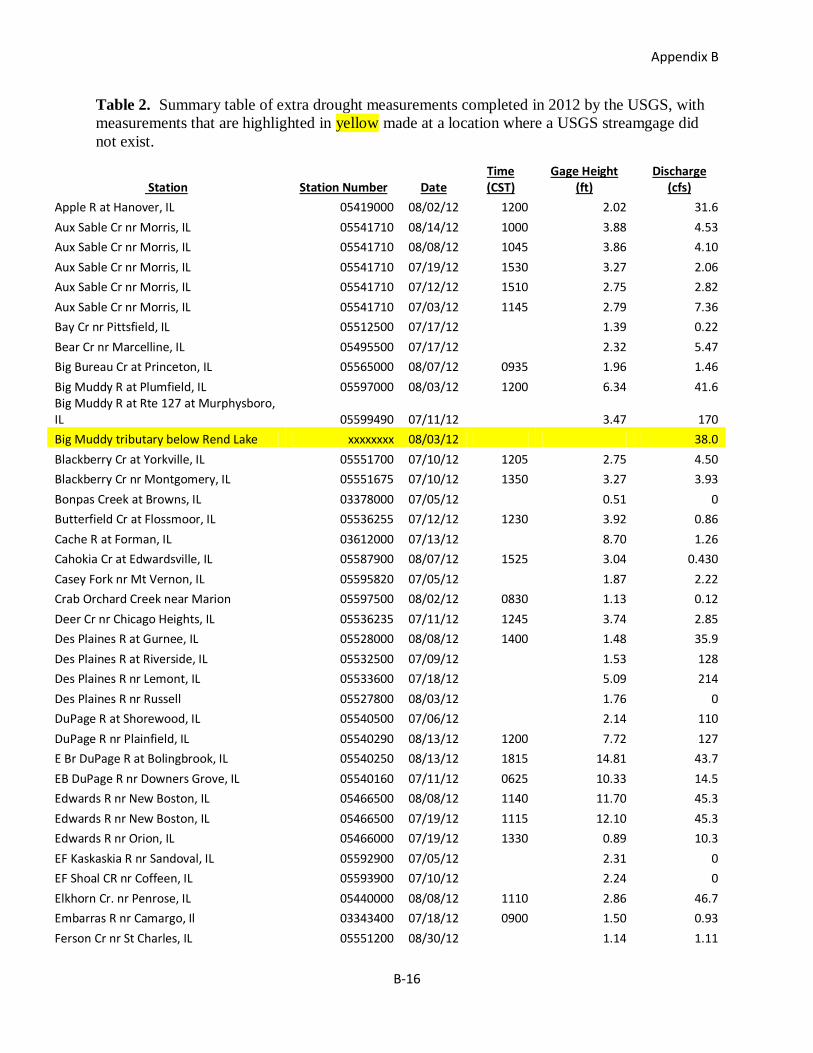
Appendix B
B-16
Table 2. Summary table of extra drought measurements completed in 2012 by the USGS, with
measurements that are highlighted in yellow made at a location where a USGS streamgage did
not exist.
Station Station Number Date Time (CST)
Gage Height (ft)
Discharge (cfs)
Apple R at Hanover, IL 05419000 08/02/12 1200 2.02 31.6
Aux Sable Cr nr Morris, IL 05541710 08/14/12 1000 3.88 4.53
Aux Sable Cr nr Morris, IL 05541710 08/08/12 1045 3.86 4.10
Aux Sable Cr nr Morris, IL 05541710 07/19/12 1530 3.27 2.06
Aux Sable Cr nr Morris, IL 05541710 07/12/12 1510 2.75 2.82
Aux Sable Cr nr Morris, IL 05541710 07/03/12 1145 2.79 7.36
Bay Cr nr Pittsfield, IL 05512500 07/17/12
1.39 0.22
Bear Cr nr Marcelline, IL 05495500 07/17/12
2.32 5.47
Big Bureau Cr at Princeton, IL 05565000 08/07/12 0935 1.96 1.46
Big Muddy R at Plumfield, IL 05597000 08/03/12 1200 6.34 41.6 Big Muddy R at Rte 127 at Murphysboro, IL 05599490 07/11/12
3.47 170
Big Muddy tributary below Rend Lake xxxxxxxx 08/03/12 38.0
Blackberry Cr at Yorkville, IL 05551700 07/10/12 1205 2.75 4.50
Blackberry Cr nr Montgomery, IL 05551675 07/10/12 1350 3.27 3.93
Bonpas Creek at Browns, IL 03378000 07/05/12
0.51 0
Butterfield Cr at Flossmoor, IL 05536255 07/12/12 1230 3.92 0.86
Cache R at Forman, IL 03612000 07/13/12
8.70 1.26
Cahokia Cr at Edwardsville, IL 05587900 08/07/12 1525 3.04 0.430
Casey Fork nr Mt Vernon, IL 05595820 07/05/12
1.87 2.22
Crab Orchard Creek near Marion 05597500 08/02/12 0830 1.13 0.12
Deer Cr nr Chicago Heights, IL 05536235 07/11/12 1245 3.74 2.85
Des Plaines R at Gurnee, IL 05528000 08/08/12 1400 1.48 35.9
Des Plaines R at Riverside, IL 05532500 07/09/12
1.53 128
Des Plaines R nr Lemont, IL 05533600 07/18/12
5.09 214
Des Plaines R nr Russell 05527800 08/03/12
1.76 0
DuPage R at Shorewood, IL 05540500 07/06/12
2.14 110
DuPage R nr Plainfield, IL 05540290 08/13/12 1200 7.72 127
E Br DuPage R at Bolingbrook, IL 05540250 08/13/12 1815 14.81 43.7
EB DuPage R nr Downers Grove, IL 05540160 07/11/12 0625 10.33 14.5
Edwards R nr New Boston, IL 05466500 08/08/12 1140 11.70 45.3
Edwards R nr New Boston, IL 05466500 07/19/12 1115 12.10 45.3
Edwards R nr Orion, IL 05466000 07/19/12 1330 0.89 10.3
EF Kaskaskia R nr Sandoval, IL 05592900 07/05/12
2.31 0
EF Shoal CR nr Coffeen, IL 05593900 07/10/12
2.24 0
Elkhorn Cr. nr Penrose, IL 05440000 08/08/12 1110 2.86 46.7
Embarras R nr Camargo, Il 03343400 07/18/12 0900 1.50 0.93
Ferson Cr nr St Charles, IL 05551200 08/30/12
1.14 1.11
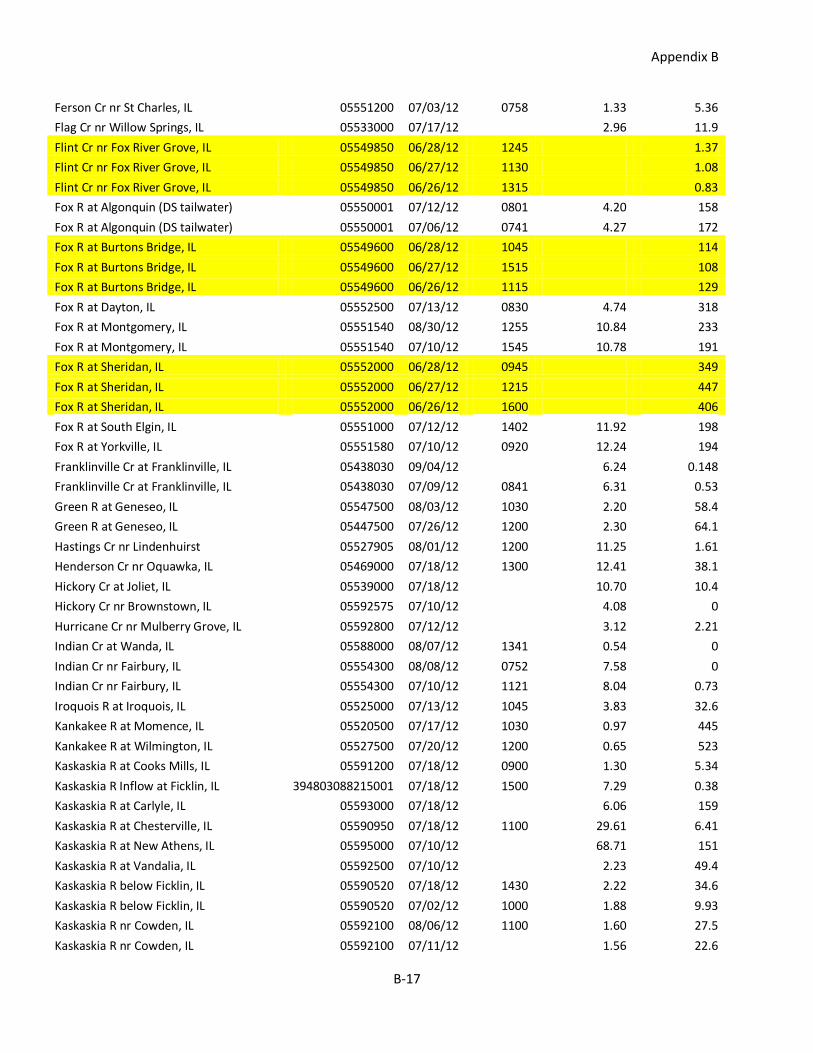
Appendix B
B-17
Ferson Cr nr St Charles, IL 05551200 07/03/12 0758 1.33 5.36
Flag Cr nr Willow Springs, IL 05533000 07/17/12
2.96 11.9
Flint Cr nr Fox River Grove, IL 05549850 06/28/12 1245 1.37
Flint Cr nr Fox River Grove, IL 05549850 06/27/12 1130 1.08
Flint Cr nr Fox River Grove, IL 05549850 06/26/12 1315 0.83
Fox R at Algonquin (DS tailwater) 05550001 07/12/12 0801 4.20 158
Fox R at Algonquin (DS tailwater) 05550001 07/06/12 0741 4.27 172
Fox R at Burtons Bridge, IL 05549600 06/28/12 1045 114
Fox R at Burtons Bridge, IL 05549600 06/27/12 1515 108
Fox R at Burtons Bridge, IL 05549600 06/26/12 1115 129
Fox R at Dayton, IL 05552500 07/13/12 0830 4.74 318
Fox R at Montgomery, IL 05551540 08/30/12 1255 10.84 233
Fox R at Montgomery, IL 05551540 07/10/12 1545 10.78 191
Fox R at Sheridan, IL 05552000 06/28/12 0945 349
Fox R at Sheridan, IL 05552000 06/27/12 1215 447
Fox R at Sheridan, IL 05552000 06/26/12 1600 406
Fox R at South Elgin, IL 05551000 07/12/12 1402 11.92 198
Fox R at Yorkville, IL 05551580 07/10/12 0920 12.24 194
Franklinville Cr at Franklinville, IL 05438030 09/04/12
6.24 0.148
Franklinville Cr at Franklinville, IL 05438030 07/09/12 0841 6.31 0.53
Green R at Geneseo, IL 05547500 08/03/12 1030 2.20 58.4
Green R at Geneseo, IL 05447500 07/26/12 1200 2.30 64.1
Hastings Cr nr Lindenhuirst 05527905 08/01/12 1200 11.25 1.61
Henderson Cr nr Oquawka, IL 05469000 07/18/12 1300 12.41 38.1
Hickory Cr at Joliet, IL 05539000 07/18/12
10.70 10.4
Hickory Cr nr Brownstown, IL 05592575 07/10/12
4.08 0
Hurricane Cr nr Mulberry Grove, IL 05592800 07/12/12
3.12 2.21
Indian Cr at Wanda, IL 05588000 08/07/12 1341 0.54 0
Indian Cr nr Fairbury, IL 05554300 08/08/12 0752 7.58 0
Indian Cr nr Fairbury, IL 05554300 07/10/12 1121 8.04 0.73
Iroquois R at Iroquois, IL 05525000 07/13/12 1045 3.83 32.6
Kankakee R at Momence, IL 05520500 07/17/12 1030 0.97 445
Kankakee R at Wilmington, IL 05527500 07/20/12 1200 0.65 523
Kaskaskia R at Cooks Mills, IL 05591200 07/18/12 0900 1.30 5.34
Kaskaskia R Inflow at Ficklin, IL 394803088215001 07/18/12 1500 7.29 0.38
Kaskaskia R at Carlyle, IL 05593000 07/18/12
6.06 159
Kaskaskia R at Chesterville, IL 05590950 07/18/12 1100 29.61 6.41
Kaskaskia R at New Athens, IL 05595000 07/10/12
68.71 151
Kaskaskia R at Vandalia, IL 05592500 07/10/12
2.23 49.4
Kaskaskia R below Ficklin, IL 05590520 07/18/12 1430 2.22 34.6
Kaskaskia R below Ficklin, IL 05590520 07/02/12 1000 1.88 9.93
Kaskaskia R nr Cowden, IL 05592100 08/06/12 1100 1.60 27.5
Kaskaskia R nr Cowden, IL 05592100 07/11/12
1.56 22.6
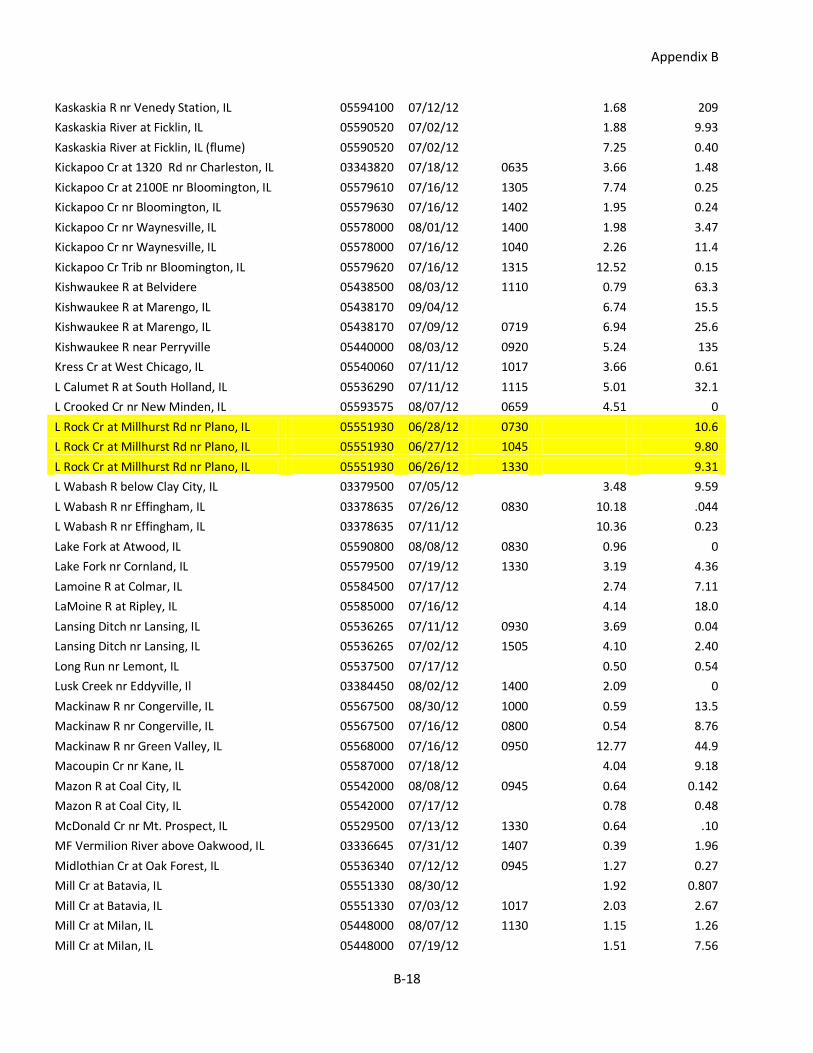
Appendix B
B-18
Kaskaskia R nr Venedy Station, IL 05594100 07/12/12
1.68 209
Kaskaskia River at Ficklin, IL 05590520 07/02/12
1.88 9.93
Kaskaskia River at Ficklin, IL (flume) 05590520 07/02/12
7.25 0.40
Kickapoo Cr at 1320 Rd nr Charleston, IL 03343820 07/18/12 0635 3.66 1.48
Kickapoo Cr at 2100E nr Bloomington, IL 05579610 07/16/12 1305 7.74 0.25
Kickapoo Cr nr Bloomington, IL 05579630 07/16/12 1402 1.95 0.24
Kickapoo Cr nr Waynesville, IL 05578000 08/01/12 1400 1.98 3.47
Kickapoo Cr nr Waynesville, IL 05578000 07/16/12 1040 2.26 11.4
Kickapoo Cr Trib nr Bloomington, IL 05579620 07/16/12 1315 12.52 0.15
Kishwaukee R at Belvidere 05438500 08/03/12 1110 0.79 63.3
Kishwaukee R at Marengo, IL 05438170 09/04/12
6.74 15.5
Kishwaukee R at Marengo, IL 05438170 07/09/12 0719 6.94 25.6
Kishwaukee R near Perryville 05440000 08/03/12 0920 5.24 135
Kress Cr at West Chicago, IL 05540060 07/11/12 1017 3.66 0.61
L Calumet R at South Holland, IL 05536290 07/11/12 1115 5.01 32.1
L Crooked Cr nr New Minden, IL 05593575 08/07/12 0659 4.51 0
L Rock Cr at Millhurst Rd nr Plano, IL 05551930 06/28/12 0730 10.6
L Rock Cr at Millhurst Rd nr Plano, IL 05551930 06/27/12 1045 9.80
L Rock Cr at Millhurst Rd nr Plano, IL 05551930 06/26/12 1330 9.31
L Wabash R below Clay City, IL 03379500 07/05/12
3.48 9.59
L Wabash R nr Effingham, IL 03378635 07/26/12 0830 10.18 .044
L Wabash R nr Effingham, IL 03378635 07/11/12
10.36 0.23
Lake Fork at Atwood, IL 05590800 08/08/12 0830 0.96 0
Lake Fork nr Cornland, IL 05579500 07/19/12 1330 3.19 4.36
Lamoine R at Colmar, IL 05584500 07/17/12
2.74 7.11
LaMoine R at Ripley, IL 05585000 07/16/12
4.14 18.0
Lansing Ditch nr Lansing, IL 05536265 07/11/12 0930 3.69 0.04
Lansing Ditch nr Lansing, IL 05536265 07/02/12 1505 4.10 2.40
Long Run nr Lemont, IL 05537500 07/17/12
0.50 0.54
Lusk Creek nr Eddyville, Il 03384450 08/02/12 1400 2.09 0
Mackinaw R nr Congerville, IL 05567500 08/30/12 1000 0.59 13.5
Mackinaw R nr Congerville, IL 05567500 07/16/12 0800 0.54 8.76
Mackinaw R nr Green Valley, IL 05568000 07/16/12 0950 12.77 44.9
Macoupin Cr nr Kane, IL 05587000 07/18/12
4.04 9.18
Mazon R at Coal City, IL 05542000 08/08/12 0945 0.64 0.142
Mazon R at Coal City, IL 05542000 07/17/12
0.78 0.48
McDonald Cr nr Mt. Prospect, IL 05529500 07/13/12 1330 0.64 .10
MF Vermilion River above Oakwood, IL 03336645 07/31/12 1407 0.39 1.96
Midlothian Cr at Oak Forest, IL 05536340 07/12/12 0945 1.27 0.27
Mill Cr at Batavia, IL 05551330 08/30/12
1.92 0.807
Mill Cr at Batavia, IL 05551330 07/03/12 1017 2.03 2.67
Mill Cr at Milan, IL 05448000 08/07/12 1130 1.15 1.26
Mill Cr at Milan, IL 05448000 07/19/12
1.51 7.56
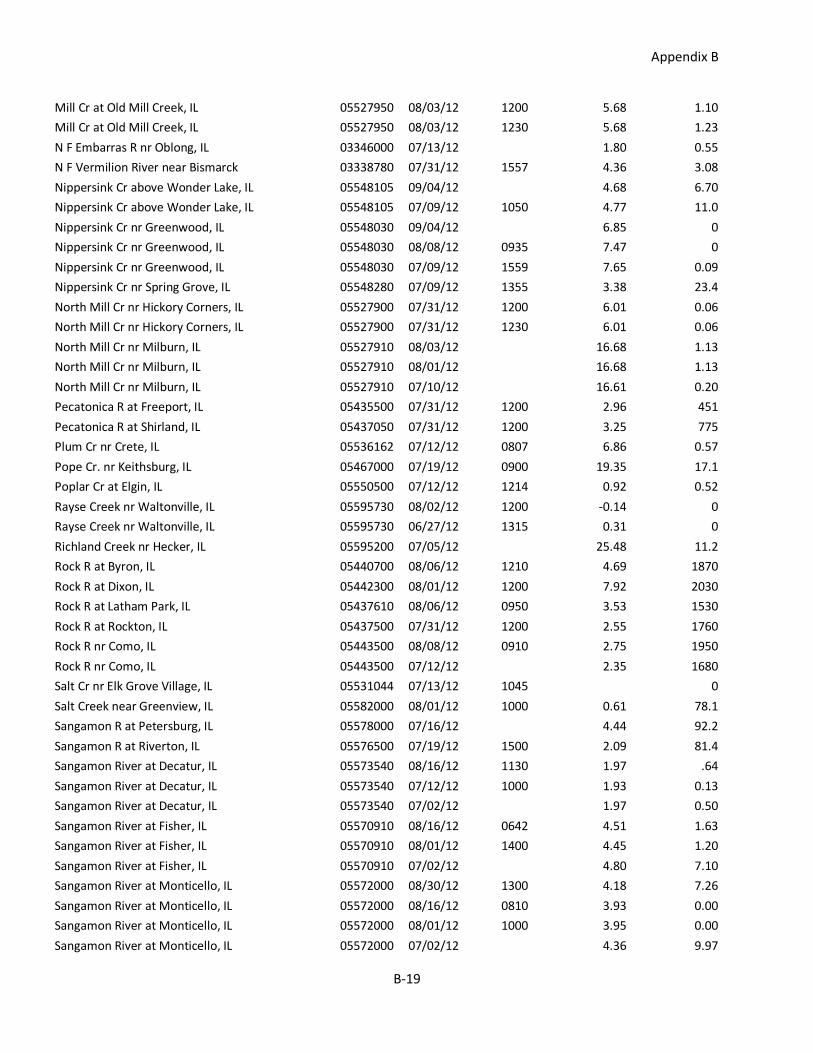
Appendix B
B-19
Mill Cr at Old Mill Creek, IL 05527950 08/03/12 1200 5.68 1.10
Mill Cr at Old Mill Creek, IL 05527950 08/03/12 1230 5.68 1.23
N F Embarras R nr Oblong, IL 03346000 07/13/12
1.80 0.55
N F Vermilion River near Bismarck 03338780 07/31/12 1557 4.36 3.08
Nippersink Cr above Wonder Lake, IL 05548105 09/04/12
4.68 6.70
Nippersink Cr above Wonder Lake, IL 05548105 07/09/12 1050 4.77 11.0
Nippersink Cr nr Greenwood, IL 05548030 09/04/12
6.85 0
Nippersink Cr nr Greenwood, IL 05548030 08/08/12 0935 7.47 0
Nippersink Cr nr Greenwood, IL 05548030 07/09/12 1559 7.65 0.09
Nippersink Cr nr Spring Grove, IL 05548280 07/09/12 1355 3.38 23.4
North Mill Cr nr Hickory Corners, IL 05527900 07/31/12 1200 6.01 0.06
North Mill Cr nr Hickory Corners, IL 05527900 07/31/12 1230 6.01 0.06
North Mill Cr nr Milburn, IL 05527910 08/03/12
16.68 1.13
North Mill Cr nr Milburn, IL 05527910 08/01/12
16.68 1.13
North Mill Cr nr Milburn, IL 05527910 07/10/12
16.61 0.20
Pecatonica R at Freeport, IL 05435500 07/31/12 1200 2.96 451
Pecatonica R at Shirland, IL 05437050 07/31/12 1200 3.25 775
Plum Cr nr Crete, IL 05536162 07/12/12 0807 6.86 0.57
Pope Cr. nr Keithsburg, IL 05467000 07/19/12 0900 19.35 17.1
Poplar Cr at Elgin, IL 05550500 07/12/12 1214 0.92 0.52
Rayse Creek nr Waltonville, IL 05595730 08/02/12 1200 -0.14 0
Rayse Creek nr Waltonville, IL 05595730 06/27/12 1315 0.31 0
Richland Creek nr Hecker, IL 05595200 07/05/12
25.48 11.2
Rock R at Byron, IL 05440700 08/06/12 1210 4.69 1870
Rock R at Dixon, IL 05442300 08/01/12 1200 7.92 2030
Rock R at Latham Park, IL 05437610 08/06/12 0950 3.53 1530
Rock R at Rockton, IL 05437500 07/31/12 1200 2.55 1760
Rock R nr Como, IL 05443500 08/08/12 0910 2.75 1950
Rock R nr Como, IL 05443500 07/12/12
2.35 1680
Salt Cr nr Elk Grove Village, IL 05531044 07/13/12 1045
0
Salt Creek near Greenview, IL 05582000 08/01/12 1000 0.61 78.1
Sangamon R at Petersburg, IL 05578000 07/16/12
4.44 92.2
Sangamon R at Riverton, IL 05576500 07/19/12 1500 2.09 81.4
Sangamon River at Decatur, IL 05573540 08/16/12 1130 1.97 .64
Sangamon River at Decatur, IL 05573540 07/12/12 1000 1.93 0.13
Sangamon River at Decatur, IL 05573540 07/02/12
1.97 0.50
Sangamon River at Fisher, IL 05570910 08/16/12 0642 4.51 1.63
Sangamon River at Fisher, IL 05570910 08/01/12 1400 4.45 1.20
Sangamon River at Fisher, IL 05570910 07/02/12
4.80 7.10
Sangamon River at Monticello, IL 05572000 08/30/12 1300 4.18 7.26
Sangamon River at Monticello, IL 05572000 08/16/12 0810 3.93 0.00
Sangamon River at Monticello, IL 05572000 08/01/12 1000 3.95 0.00
Sangamon River at Monticello, IL 05572000 07/02/12
4.36 9.97

Appendix B
B-20
Sangamon River near Oakford, IL 05583000 08/01/12 0800 2.77 223
Sawmill Cr nr Lemont, IL 05533400 07/17/12
7.75 0.03
SB Kishwaukee at DeKalb, IL 05439000 08/30/12 1130 2.32 .043
SB Kishwaukee at DeKalb, IL 05439000 07/02/12 0705 2.75 6.79
SB Kishwaukee nr Fairdale, IL 05439500 07/02/12 0850 2.12 45.1
Senachwine Cr nr Chillicothe, IL 05559700 07/13/12
0
SF Saline R at Carrier Mills, IL 03328000 08/02/12 1000 2.78 2.57
SF Sangamon R nr Rochester, IL 05576000 07/20/12 0530 4.66 1.14
Shoal Cr nr Breese, IL 05594000 08/07/12 0815 1.56 86.5
Shoal Cr nr Pierron, IL 05593945 08/08/12
42.72 33.2
Shoal Cr nr Pierron, IL 05593945 07/05/12
42.37 11.7
Shoal Creek nr Breese, IL 05594000 07/05/12
1.08 12.5
Silver Cr nr Freeburg, IL 05594800 08/02/12 1200 0.02 7.40
Silver Cr nr Freeburg, IL 05594800 07/05/12
0.04 9.87
Silver Cr nr Troy, IL 05594450 07/18/12
4.26 0.55
Sinsiniwa R nr Menominee, IL 05414820 08/02/12 1200 4.66 14.1
Spoon R at London Mills, IL 05569500 07/18/12
1.96 72.4
Spoon R at Seville, IL 05570000 07/18/12
4.69 81.7
Spring Br at 87th St. nr Naperville, IL 05540275 08/06/12
2.65 0.92
Spring Cr at Springfield, IL 05577500 07/20/12 0811 1.25 0
St Joseph Cr at Rte 34 at Lisle, IL 05540195 07/11/12 0721 3.23 0
Sugar Cr at Milford,IL 05525500 07/10/12 0900 2.57 7.99
Sugar Cr nr Springfield, IL 05576250 07/20/12 0650 10.01 19.7
Thorn Cr nr Glenwood, IL 05536215 07/11/12 1400 2.98 19.5
Thorn Cr nr Thornton, IL 05536275 07/11/12 1545 2.64 16.3
Tinley Cr nr Palos Park, IL 05536500 07/12/12 1100 2.27 0.44
Tyler Cr at Elgin, IL 05550300 07/12/12 1023 5.23 2.68
Vermilion R above Streator, IL xxxxxxxx 07/12/12 1030 x.xx 10.2
Vermilion R at Danville, IL 03339000 07/19/12 0700 1.83 39.5
Vermilion R at Pontiac, IL 05554500 07/12/12 0730 2.36 1.50
Vermilion R below Streator Dam, IL xxxxxxxx 07/12/12 1300 x.xx 0.88
Vermilion R nr Leonore, IL 05555300 07/12/12 0910 2.86 12.4
W Br DuPage R nr Naperville, IL 05540130 08/13/12 1045 4.86 42.6
WB DuPage R nr Warrenville, IL 05540095 07/11/12 0840 7.20 21.1
WB DuPage R nr West Chicago, IL 05539900 07/11/12 1214 3.39 9.74

Appendix B
B-21

Appendix B
B-22
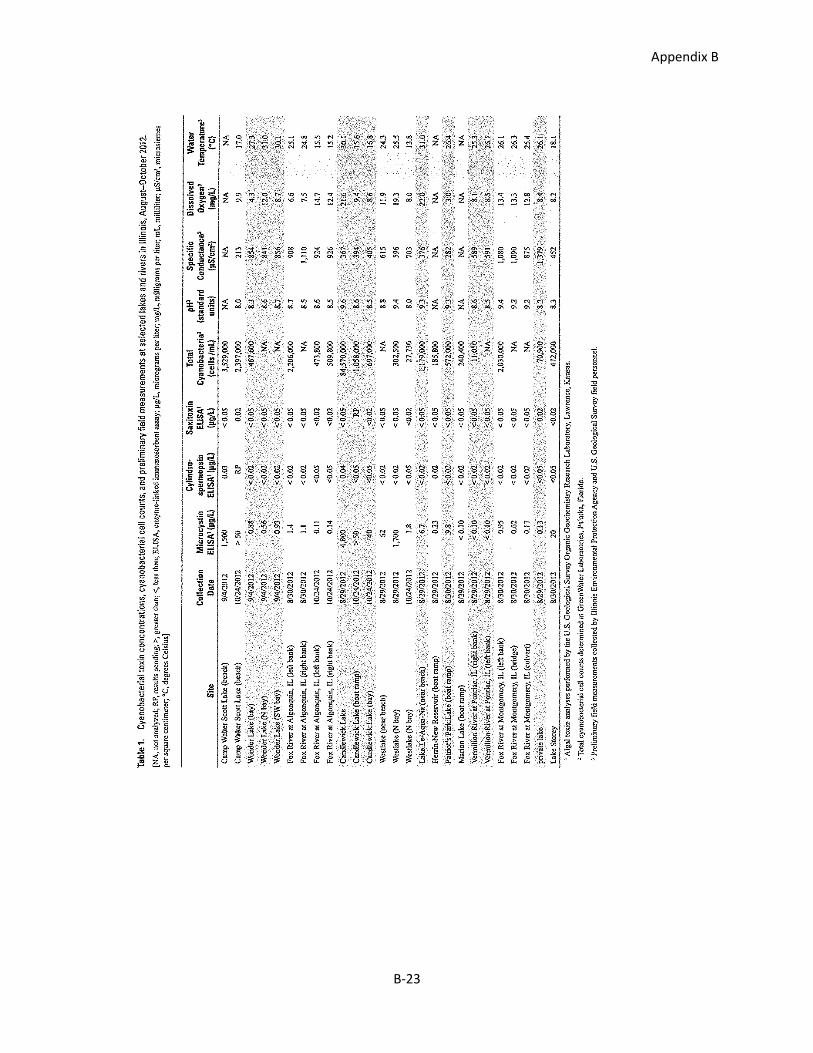
Appendix B
B-23

Appendix B
B-24
Appendix C
C-1
ILLINOIS DEPARTMENT OF AGRICULTURE
Agricultural Report Drought of 2012
The Drought of 2012 brought far-reaching impacts to the agricultural industry and virtually all facets of
agriculture were touched by the event. The following identifies the agriculture related issues caused by
the drought, those issues which persist currently and those issues that may continue to be problematic
in the immediate future.
Crops
All regions of Illinois sustained major damages to crops; the most severe was in the southern third of the
State. According to the USDA National Agricultural Statistics Service, statewide 2012 corn and soybean
yields are estimated to be down 36% and 9%, respectively, as compared to 2011.
Aflatoxin levels in harvested corn have been a concern since the chemicals that produce aflatoxin exist
in higher concentrations during hot, dry summers. The Illinois Department of Agriculture, Grain and
Feed Association of Illinois, Illinois Corn Growers Association, Illinois Pork Producers, Illinois Beef
Association, Illinois Poultry Council and the Illinois Milk Producers Association worked together to raise
awareness of the potential aflatoxin problem in corn and the needed steps to ensure a safe supply of
corn for production agriculture and commerce. Accordingly, the IDA issued written guidance to grain
elevators, grain processors and feel mills on procedures to properly handle aflatoxin affected corn. The
Department also petitioned the US Food and Drug Administration to temporarily allow the blending of
corn containing more than 20 parts per billion of aflatoxin with corn found to have lower or negative
levels of aflatoxin for livestock feed exclusively. The FDA approved the Department’s request and the
blended corn can conditionally be fed to mature poultry, breeding swine, finishing swine exceeding 100
pounds, plus to breeding and finishing cattle. The Department continues to closely monitor aflatoxin
affected corn around Illinois.
Livestock
Livestock producers were also negatively impacted by the severe drought conditions. Pastures dried up
quickly and producers resorted to feeding stored hay early. Hay growth was significantly curtailed,
greatly reducing the hay crop. Consequently, some producers liquidated all or some of their beef cattle
herds. Producers accessed the Department’s Hay and Straw Directory to locate new sources of hay. A
shortage of hay this winter in Illinois could cause hay prices to escalate. Illinois’ pork producers were hit
particularly hard by the drought as well. In response, Governor Quinn directed that the next major State
purchase of meat include a 30% increase in the purchase of pork and that it be exclusively State raised
and produced. The higher pork purchase will have relatively little effect on other State meat purchases.
Some livestock producers experienced a shortage of well water. These producers had to haul water on a
regular basis throughout the summer and fall to sustain their herds. Some deepened existing wells or
Appendix C
C-2
dug new wells. Some wells are going dry for the first time in November. Well water supplies could be
stretched very thin this winter without adequate rainfall.
Commercial Navigation
The drought has also had a dramatic effect on water levels in the lower Mississippi River in Illinois. The
low water level is adversely impacting the shipment of commodities (agricultural/other) to the Gulf of
Mexico and to ports beyond. The middle Mississippi from St. Louis to Cairo is particularly problematic
due to low water and “rock pinnacles”. In some instances, barge operators have had to use the “light
load” technique to safely and successfully navigate the river. Implementation of flow restrictions on the
Missouri River, an annual practice, could exacerbate the problem. Since the drought in many of the
states west of Illinois is forecasted to extend into 2013, the Corps of Engineers believes that this portion
of the river could suffer record low water levels this winter, thereby disrupting commercial navigation. If
the river is closed or restrictions are placed on barge loadings, other modes of transportation may have
to be relied upon for the timely shipment of commodities to their destinations.

Appendix D
D-1
DROUGHT RELATED PROGRAMS AND ACTIVITIES
UNIVERSITY OF ILLINOIS EXTENSION 2012
In early June 2012, University of Illinois Extension Specialists recognized that conditions were developing that had the potential to lead to a drought and began to take action to help producers identify ways to minimize the impact if the drought should in fact develop. Owing to the fact that the problem was developing during a time period when farmers are busy with other activities on the farm, the Extension Specialists put most of their effort into developing programs that producers could view at home at night, including news releases and web page displays. Field meetings at University of Illinois Research Centers or at farmer fields were kept to a minimum. The first news release provided producers with an understanding of the impact of drought at different stages of growth for corn and soybean. As the drought progressed and it became obvious that some fields would have little if any production, the emphasis of the educational materials shifted to salvaging the crop for livestock feed. Producers were cautioned to be on the alert for high nitrate in corn grown on fields that would have little if any grain production. They were warned that ensiling high nitrate corn could result in toxic gases being released from the silo, a situation that could cause human illness or even death and/ or if fed, high nitrate silage could result in animal health problems. Attached please find copies of the list of news release articles and of the hits on the web pages. As the season progressed further into the fall, drought affected corn developed toxins that presented a threat to the feed, food, and ethanol industries. Some of that corn is still isolated in on farm structures, awaiting a solution to allow them to use the product. As each new challenge developed from the drought, University of Illinois Extension was ready to respond with research based information. Extension also responded to concerns related to the impact of the drought on lawn and garden problems. The full extent of the damage to some of the perennial plants may not be realized until next year. Extension will be prepared to provide guidance if and when those situations arise. While the drought cycle appears to be broken in some areas of Illinois, there are other areas where subsoil moisture has not been replenished. If those areas do not receive adequate moisture to replenish the subsoil between now and planting season next year, a repeat of the devastation to crops is possible. Drought related problems that producers will face in 2013 because of the 2012 drought include volunteer plants in field which were not harvested in 2012, with many of those volunteer plants carrying genetics for herbicide resistance; inability to accurately predict nutrient carryover, especially of N; and complicated marketing decisions.
Appendix E
E-1
Illinois Finance Authority Drought Assistance Financing
As crops come in from the field, we are beginning to see the true economic impact of the 2012 drought. Illinois lending institutions are a key resource to help farmers bounce back from this period of hardship and plan for next year. And the Illinois Finance Authority (IFA) is here to help.
The IFA has already helped finance more than 500 agricultural projects across Illinois through its guarantee, loan and bond programs. IFA programs that help farmers achieve lines of credit, carry over debt, and restructure existing debt, include:
Agricultural Restructuring Debt Guarantee Program provides 85% guarantee with a term up to 30 years on a local bank loan up to $500,000 used to consolidate existing debt and spread payments out over a longer period;
Working Capital Guarantee Program provides 85% guarantee with a commitment up to 3 years on a local bank loan up to $250,000 used for input costs related to planting and raising agricultural crops;
Agricultural Loan Participation Program provides IFA purchase of up to $500,000 of a customer’s bank loan to reduce interest rate with a loan term up to 10 years;
Rural Development Loan Program provides loans under a relending program from the U.S. Department of Agriculture-Rural Development from $50,000 to $250,000 for economic development financing in communities with less than 25,000 population
These programs are designed with the needs of Illinois farmers and agricultural lenders in mind.
Other activities outside of financing, IFA has been busy in promoting and communicating the
efforts of the Drought Relief Task Force through various media tools. Director Meister has
performed several news interviews via radio, television and on-site which span across the State
from Northern Illinois to Southern Illinois. A clip tracker of IFA media surrounding the drought
relief effort follows this overview.

Appendix E
E-2
Two key partners with Illinois Finance Authority Drought Relief efforts have been the Illinois
Bankers Association and the Community Bankers Association of Illinois. Both groups have been
instrumental by serving as liaisons and, in effect, members of the IFA sales team by engaging
bankers and lenders through information and opportunities to increase the lenders’ level of
knowledge and understanding of Ag programs. We have also invited input from both Groups on
ways to further improve IFA Ag programs to reach their full potential as tools to support and
stabilize Illinois farms and agribusinesses.
IFA has met with each associations Agriculture committees and attended their annual Ag
Banking Conference over the past several months. Illinois Bankers Associations and Community
Bankers Association of Illinois partnership will continue to be a valuable asset in long term
success in expanding the pipeline of Lenders to market IFA drought financing programs.
Continued efforts, IFA is committed in support of the Illinois Drought Relief Task Force over the
next several months include:
Calling on Ag bankers, related association leaders and legislators to introduce IFA
programs,
Direct mailings of programs available for Drought financing options,
Post IFA program information on partner websites,
Send e-blasts to member groups,
Updated brochures to share with customers,
Website content regularly updated,
E-blasts for ongoing dialogue; and with continued efforts in
Media placement: such as articles in Ag Week about banker-government alliance
News conferences in target markets as appropriate
Interviews with select editorial boards and radio and TV stations in ag communities
IFA is committed to continued agriculture financing to help farmers and communities affected
by the 2012 drought.

Appendix E
E-3
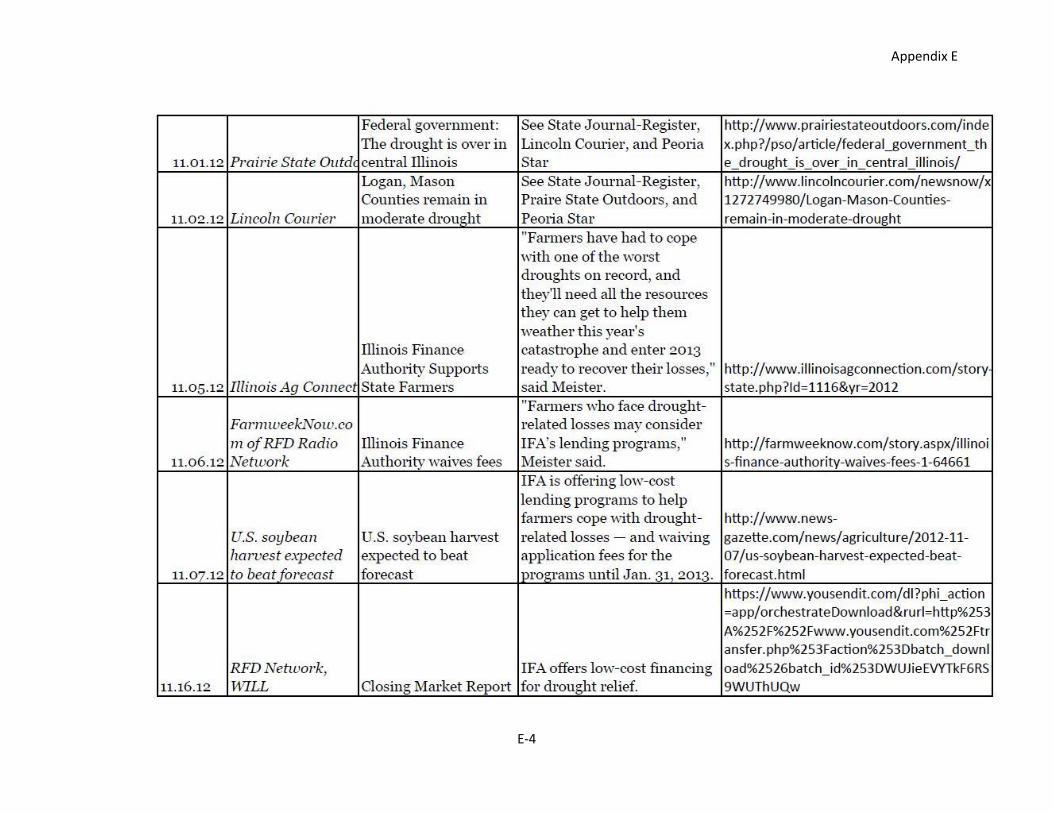
Appendix E
E-4

DROUGHT REPORT
During the State Water Plan Task Force (SWPTF) meeting on June 19, 2012, the membership of the SWPTF agreed that it was time to activate the Drought Response Task Force (DRTF). The Illinois Environmental Protection Agency (Illinois EPA) was selected as co-chair with the Illinois Department of Natural Resources (DNR). Coordination was done with the Governor’s Office through Department/Agency directors to initiate the Governor’s DRTF.
Prior to activation of the DRTF, the Illinois EPA’s Division of Public Water Supplied (DPWS) had already begun contacting community water systems (CWS) using surface water sources in each of our seven regional offices starting in March 2012. A tracking spreadsheet was used to record water level conditions at each of the CWS (128) using surface water (161 intakes). The systems using impounded reservoirs and side channel intakes on streams are the most vulnerable during the initial phases of hydrologic droughts. The Illinois State Water Survey (ISWS) had recently evaluated several of these systems (i.e. Decatur and Springfield) to show that they are at risk during droughts. Illinois EPA began developing weekly reports for the Governor’s Office highlighting relevant information from the detailed report. After the DRTF was initiated the detailed and weekly summary report was also shared with the Office of Water Resources at DNR and the ISWS. A public water supply report was also given at each of the DRTF meetings. Moreover, we updated the United States Environmental Protection Agency on a routine basis.
The CWS that were the most stressed during the drought included:
Decatur (Macon County);
LaHarpe (Hancock County);
Vienna Correctional Center (VCC); and
Vienna (Johnson County). Illinois EPA and DNR coordinated outreach and assistance to LaHarpe and VCC. DNR
developed updated bathymetric surveys for reservoirs at these systems. DNR also helped facilitate excavation around one of the intakes at VCC. Illinois EPA has had extensive meetings and conducted technical reviews to assist Decatur with their short and long-term issues. Recent rainfalls have alleviated Decatur’s short-term issues, but it is recommended that they continue down the path of implementing long-term plans due to being an at risk system.
Illinois EPA staff encouraged water use restrictions be implemented at CWS, and also offered emergency permits to deal with drought situations. A fact sheet was developed and posted on the Drought.Illinois.gov web site to provide examples of where communities were implementing restrictions to conserve water http://www2.illinois.gov/gov/drought/Pages/WaterConservation.aspx.
Groundwater level trends from north to south have shown declines below normal, but some recovery. We will have a better idea next spring what the impacts to CWS using groundwater are attributable to the drought.
DNR digitized the state-wide map of the seven day ten year low flow (7Q10) streams. This information was shared with the Illinois EPA’s Clean Water Act programs that base effluent limits in discharge permits on the 7Q10. There were numerous facilities that could not meet the thermal standards and sought provisional variances over the summer.
It is recommended that a conference be convened that focuses on at risk CWS to discuss long-term drought planning and implementation.

Appendix G
G-1
2012 DROUGHT RESPONSE TASK FORCE SUMMARY REPORT
INVESTOR-OWNED WATER UTILITIES ILLINOIS COMMERCE COMMISSION WATER ENGINEERING PROGRAM
There was one drought-related incident for investor-owned water utilities in 2012. Illinois-
American Water Company reported that they experienced a drought-related water incident at its
Cairo District. Due to low Ohio River levels in Cairo, the Cairo District water intake pumps had
lost prime. A partially closed gate valve in the water intake was found to be the cause, and the
valve was re-opened. Illinois-American Water Company has restored water service to
customers in its Cairo District. A boil water order was issued due to a temporary interruption in
water service. The boil water order has been lifted.
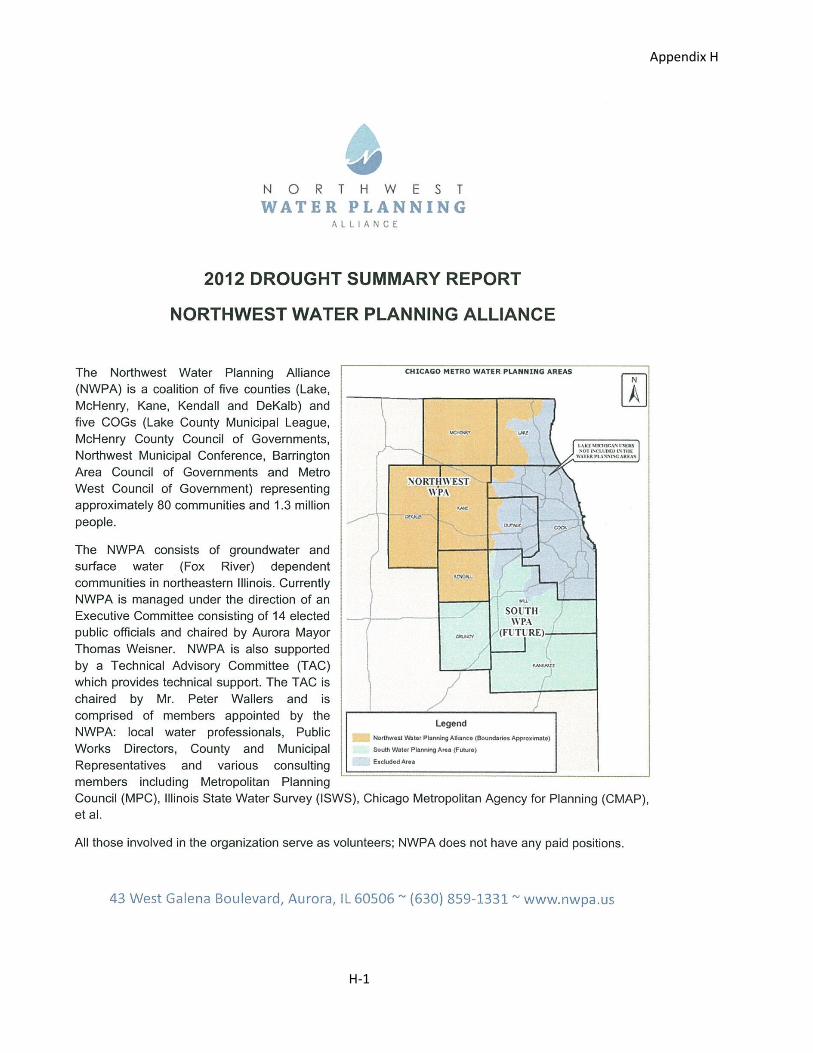
Appendix H
H-1

Appendix H
H-2

Appendix H
H-3
Appendix H
H-4

Appendix H
H-5
Appendix H
H-6

Appendix H
H-7
Appendix I
I-1
REPORT OF ACTIVITIES OF THE EAST CENTRAL ILLINOIS REGIONAL WATER SUPPLY PLANNING COMMITTEE IN RELATION TO THE DROUGHT OF 2012
The East Central Illinois Regional Water Supply Planning Committee (RWSPC) met May 18, July 13, and September 14 and heard reports on the actions of its Drought Response Subcommittee (DRS) each time. Meetings also included updates from the
Illinois State Water and Geological Surveys on current conditions of ground and surface water supplies.
The DRS produced two reports (attached) that were delivered to a list of stakeholders. The first report provided information on the likelihood and characteristics of droughts in
East Central Illinois. The second produced a list of municipalities with “at-risk” supplies and why they were considered at risk. Both reports relied heavily on work done and data provided by the surveys.
The DRS thought that one of the potentially most useful things it could do would be to develop a model drought (or other water supply emergency) ordinance that a
community or district could adopt as a pre-event preparation, so the community would have in mind what it would do if such an emergency were to arise. Similarly, it worked on developing a model ordinance that could coordinate community government
authority to respond to a water emergency in an area served by a private utility, which does not have authority to restrict its customers’ usage.
A draft of the second type of ordinance has been submitted to the Champaign County Regional Plan Commission, which will review, adapt and hopefully submit it to the
County Board for adoption. Since Illinois American Water serves several communities and unincorporated areas, the DRS thought it would be important to work regionally to avoid having regulations in place for one community, but not for another where both
are served by Illinois American. The RWSPC is actively pursuing funding to be able to update its adopted Water Supply
& Demand Reports from 2009. The original report recommended updates on 5 year intervals, but the executive order that initiated development of the report didn’t fund future updates, and in fact didn’t deliver the original amount committed to develop the
report. The drought highlighted the importance of water supply planning and the RWSPC is committed to acquiring funding and updating the report.
The RWSPC also sees education and outreach on water supply planning issues as major focuses for their efforts. Pamphlets, DVDs, and other materials are being distributed and committee members all make themselves available to present relevant information
upon request.

Appendix I
I-2
EAST-CENTRAL ILLINOIS WATER SUPPLIES VULNERABLE TO DROUGHTS OF RECORD
DROUGHT SUBCOMMITTEE of the REGIONAL WATER SUPPLY PLANNING COMMITTEE (RWSPC)
Recent rainfall has eased the drought situation somewhat, but precipitation for the year remains considerably below normal.
The Drought Subcommittee has compiled a list of water supplies judged by the Illinois State Water Survey to be vulnerable to
the possible recurrence of droughts of record. Droughts of record are identified from the historical records and are not
predictions for the next twelve months. Nevertheless, we know that climate conditions that have occurred in the past can
recur in the future. It is prudent to assess the risks and be prepared.
SURFACE WATER
Springfield
Lake Springfield was completed in 1935 and provides water for 133,000 people (2008). Lake water also is used to generate
municipal electricity.
The drought of record occurred from June 1894 through December 1895 (19 months).
Nature of the risk: Inadequate water supply, i.e., there is greater than a 50 per cent probability that the system will be unable to
meet projected water use with recurrence of a drought of record. Most of the city's electricity generating units would need to
be shut down. The city's higher priority potable water supply is considered marginal to at-risk, i.e. there is less than 10 per cent
probability that the system will fail to meet demands.
Bloomington
Lake Bloomington, completed in 1930, and Lake Evergreen, completed in 1971, provide water for 72,330 people (2008).
The drought of record occurred from July 1939 through March 1941 (20 months).
Nature of the risk: At-risk water supply, i.e., there is a 0-50 per cent probability that the system will be able to meet projected
water use with recurrence of a drought of record. By 2020, the system will be inadequate to meet demand, i.e., there will be
greater than a 50 per cent probability that the system will be unable to meet projected water use with recurrence of a drought
of record.
Decatur
Lake Decatur was completed in 1922 and provides water for 90,243 people (2008). Private companies such as Archer Daniel
Midland and Tate and Lyle also withdraw water from Lake Decatur.
The drought of record occurred from 15 July 1930 through 20 April 1931 (280 days).
Nature of the risk: At-risk water supply, i.e., there is 10-50 per cent probability that the system will be unable to meet projected
water use with recurrence of drought of record. By 2020 the system will be inadequate to meet demand, i.e., there will be
greater than a 50 per cent probability that the system will be unable to meet projected water use with recurrence of a drought
of record.
Danville
Lake Vermilion was completed in 1971 and provides water for 55,000 people (2008).
The drought of record occurred from 1930 through 1931.
Nature of the risk: The system is currently adequate, but is projected to become at-risk by 2040, i.e., there will be a 10-50 per
cent probability that the system will be unable to meet projected water use with recurrence of a drought of record.
GROUNDWATER
The impacts of drought on recharge to aquifers are less well-documented or understood.
i) Groundwater supplies developed from buried aquifers are relatively immune to droughts. However, the Mahomet
Aquifer does appear to respond to droughts, e.g., the historical record shows step-wise declines in head at Petro North during
droughts, but the mechanisms for the response have not been clearly established.
None of the current groundwater users obtaining water from the Mahomet Aquifer is considered at risk of future water
shortage during a worst case drought.

Appendix I
I-3
Impacts from increased pumping during droughts include reductions in stream baseflow and reductions in head in wells
constructed in the Mahomet and shallower aquifers. Reductions in stream baseflow indicate that surface and groundwater
systems are linked and pumping groundwater can reduce surface water availability.
ii) Water levels in wells finished in unconfined portions of the Mahomet Aquifer, e.g., Havana Lowlands, drop during
droughts, but water shortages can be avoided by ensuring that wells and pumps are sufficiently deep.
iii) Shallow aquifers do not have water stored in overlying deposits from which they can draw during times of drought.
Therefore, water levels in such aquifers are more sensitive to climatic conditions and will decline in response to dry weather.
The situation can be exacerbated by the effects of well interference.
Alluvial valley aquifers often are in hydraulic communication with the streams occupying the valleys in which the aquifer is
situated. If streamflow is affected by drought, well yields can also be affected adversely.
Groundwater flow models are a good way to assess groundwater susceptibility to drought conditions, but it is simply not
practical for the ISWS to develop detailed flow models for each of these supplies.
The ISWS has prioritized community groundwater supplies at risk to drought conditions based on a number of criteria [note:
drought severity is not defined]: well depth; proximity to surface waters; well density; population served; and uncertainties.
Private groundwater supplies from shallow aquifers and in areas where no aquifer exist are also susceptible to drought
conditions. In 2006, the following communities in East-Central Illinois were deemed potentially vulnerable to drought
conditions [well number; depth (ft); population served]:
CASS:
Chandlerville; 3; 65; 704
4; 60; 704
IROQUOIS:
Milford; 7; 78; 1369
8; 80; 1369
LOGAN:
Broadwell; 1, 48; 150
2; 53; 150
4; 52; 150
Illinois American Water – Lincoln; 11; 50; 15200
12; 50; 15200
14; 54; 15200
16; 52; 15200
18; 54; 15200
Mount Pulaski; 4; 34; 1800
5; 32; 1800
6; 39; 1800
McLEAN:
Heyworth; 1; 62; 2431
2; 59; 2431
3; 50; 2431
MENARD:
Athens; 3; 53; 4350
4; 57; 4350
Tallula; 3; 52; 900
4; 52; 900
SANGAMON:
Curran Gardner PWD; 1; 50; 4800
4; 55; 4800
5; 44; 4800
Appendix I
I-4
Dawson; 1; 36; 2220
2; 54; 2220
3; 41; 2220
5; 54; 2220
Pleasant Plains; 2; 60; 1236
3; 61; 1236
4; 61; 1236
TAZEWELL:
Groveland Township Water District; 1; 84; 2430
2; 85; 2430
Lake Windermere Estates subd; 1; 32; 300
3; 55; 300
WOODFORD:
Roanoke; 3; 52; 1994
5; 51; 1994
TOTAL GROUNDWATER: 38 wells serving some 40,000 people are at-risk public water supply systems. Other towns may need
to be added due to heavy drought demands for nearby users, such as Weldon near Decatur's DeWitt wellfield. Some 110,000
people in the region have private water supplies and many of these also are at risk.
TOTAL SURFACE AND GROUNDWATER: Water supplies for some 400,000 people in the region are inadequate or at-risk during
a drought of record and with population growth there could be 50, 000 more by 2040.
CONCLUSIONS
Unless more adequate water supplies are provided, about half a million people could be at risk of water shortages during a
worst-case drought by 2050. If temperature increases, water demand could increase further, putting additional strains on water
supplies.
Water shortages can be prevented by preparing for droughts in advance and by activating drought response plans when they
occur. The costs of action can be weighed against the costs of no action.
Conservation measures are most effective for systems that are only marginally vulnerable to drought, but should never be
viewed as a substitute when an additional or augmented source of supply is needed. For most communities classified as
inadequate or at-risk, the development of supplemental sources of water and interconnection with larger systems having
surplus yield are seen as solutions to resolve drought vulnerability issues.
References
Roadcap, G.S., Knapp, H.V., Wehrmann H.A. and Larson, D., 2011. Meeting East-Central Illinois Water Needs to 2050:
Potential Impacts on the Mahomet Aquifer and Surface Reservoirs, Illinois State Water Survey Contract report 2011-08,
Champaign, IL, http://www.isws.illinois.edu/pubdoc/CR/ISWSCR2011-08.pdf.
State Water Plan Task Force, 2011. State of Illinois Drought Preparedness and Response Plan,
http://www.isws.illinois.edu/hilites/drought/archive/2011/docs/St_Ill_Drought_Plan_2011.pdf
Winstanley, D. et al., 2006. Drought Planning for Small Community Water Systems, Illinois State Water Survey Contract
Report ISWS 2006-01, Champaign, IL, http://www.isws.illinois.edu/pubdoc/CR/ISWSCR2006-01.pdf.
Winstanley, D. et al., 2006. The Water Cycle and Water Budgets in Illinois: A Framework for Drought and Water-Supply
Planning, Illinois State Water Survey Report I/EM 2006-02, Champaign, IL,
http://www.isws.illinois.edu/pubdoc/IEM/ISWSIEM2006-02.pdf.
Wittman Hydro Planning Associates, Inc., 2008. Water demand Scenarios for East-central Illinois Planning Region: 2005-
2050." Report prepared for the East-Central Illinois regional Water Supply Planning Committee,
http://www.rwspc.org/documents/EC-IL-Demand-Report-082308_corrected.pdf.
Personal contact with Dr. George Roadcap, Illinois State Water Survey.
Members of the RWSPC Drought Subcommittee

Appendix I
I-5
Will Smith: [email protected]
Steve Wegman: [email protected]
Frank Dunmire: [email protected]
Derek Winstanley: [email protected]

Appendix J
J-1
IDPH Drought Response Task Force 3rd Quarter 2012 Report 1. Local Health Departments reported that low water tables had the following impacts on
shallow private water wells:
a. There was an overall trend of increased permits for new wells and deepening existing
wells.
b. There was a noticed increase of well servicing calls to lower pumps.
c. Numerous private well owners are hauling bulk water from alternate supplies. Several
municipal water supplies are not selling bulk water and others are restricting sales.
2. Lee and Whiteside County report agricultural irrigation has been associated with drops in
local aquifers resulting in localized instances of a few shallow private wells running dry.
Irrigation generally ceases in September.
3. The Department’s Division of Food Drugs and Dairies has determined the need to resume
aflatoxin sampling for milk. The mycotoxins found in grain are more predominant during
a drought season and many corn fields being harvested for silage. Dairy cows that eat
feed containing 20 parts per billion or greater of aflatoxins may produce milk that
exceeds the tolerance level for aflatoxins. The guideline for allowing milk into the
supply is a level less than 0.5 parts per billion. Aflatoxins are carcinogenic to animals
and possibly humans, and thus shall be monitored closely. Therefore, sampling and
testing will be conducted in September 2012 and January 2013.
Final reports for the sampling and testing conducted statewide in September 2012 have
been completed. Of the 315 total samples collected and tested, only two samples
screened received a positive result for Aflatoxin M-1 with a result of >0.0005 mg/L.
Sampling and testing will be conducted again in January 2013.
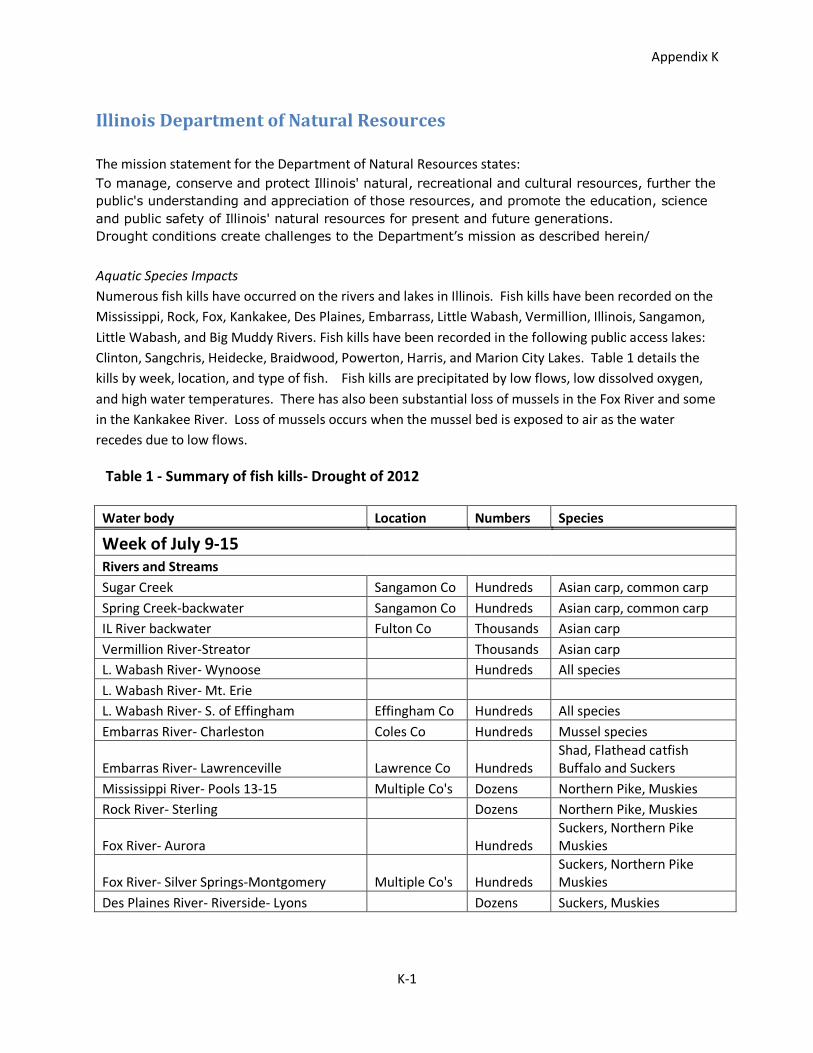
Appendix K
K-1
Illinois Department of Natural Resources
The mission statement for the Department of Natural Resources states:
To manage, conserve and protect Illinois' natural, recreational and cultural resources, further the
public's understanding and appreciation of those resources, and promote the education, science
and public safety of Illinois' natural resources for present and future generations.
Drought conditions create challenges to the Department’s mission as described herein/
Aquatic Species Impacts
Numerous fish kills have occurred on the rivers and lakes in Illinois. Fish kills have been recorded on the
Mississippi, Rock, Fox, Kankakee, Des Plaines, Embarrass, Little Wabash, Vermillion, Illinois, Sangamon,
Little Wabash, and Big Muddy Rivers. Fish kills have been recorded in the following public access lakes:
Clinton, Sangchris, Heidecke, Braidwood, Powerton, Harris, and Marion City Lakes. Table 1 details the
kills by week, location, and type of fish. Fish kills are precipitated by low flows, low dissolved oxygen,
and high water temperatures. There has also been substantial loss of mussels in the Fox River and some
in the Kankakee River. Loss of mussels occurs when the mussel bed is exposed to air as the water
recedes due to low flows.
Table 1 - Summary of fish kills- Drought of 2012
Water body Location Numbers Species
Week of July 9-15
Rivers and Streams
Sugar Creek Sangamon Co Hundreds Asian carp, common carp
Spring Creek-backwater Sangamon Co Hundreds Asian carp, common carp
IL River backwater Fulton Co Thousands Asian carp
Vermillion River-Streator Thousands Asian carp
L. Wabash River- Wynoose Hundreds All species
L. Wabash River- Mt. Erie
L. Wabash River- S. of Effingham Effingham Co Hundreds All species
Embarras River- Charleston Coles Co Hundreds Mussel species
Embarras River- Lawrenceville Lawrence Co Hundreds Shad, Flathead catfish Buffalo and Suckers
Mississippi River- Pools 13-15 Multiple Co's Dozens Northern Pike, Muskies
Rock River- Sterling Dozens Northern Pike, Muskies
Fox River- Aurora Hundreds Suckers, Northern Pike Muskies
Fox River- Silver Springs-Montgomery Multiple Co's Hundreds Suckers, Northern Pike Muskies
Des Plaines River- Riverside- Lyons Dozens Suckers, Muskies

Appendix K
K-2
Water body Location Numbers Species
Public Lakes
Clinton Lake Dewitt Co. Thousands
Hybrid striped bass, Largemouth bass, Channel and Floathead catfish, Shar
Sangchris Lake Christian Co Thousands
Striped bass, Largemouth bass, White bass, Shad Channel and Flathead Catfish
Heidecke Lake Grundy Co Dozens
Braidwood Lake Dozens
La Salle Lake Hundreds
Powerton Lake Tazewell Co Thousands
Largemouth and Smallmouth bass, Hybrid Striped bass, Channel and Flathead Catfish, Shad
Sugar Creek Lake - Shawnee Forest Thousands Largemouth bass, Channel Catfish, Bluegill
Harris Pond, Kendal Co FPD Kendall Thousands Largemouth bass, Bluegill Crappie
Private lakes and ponds
13 ponds Statewide
Week of July 16-22
Rivers and Streams
Fox River Multiple Co's Hundreds Mussel species
Kankakee River Multiple Co's Dozens Mussel species
Sangamon River- Decatur Macon Co Hundreds Asian carp
Public Lakes
None
Private lakes and ponds
15 ponds Statewide
Week of July 23-29
Rivers and Streams
Big Muddy River- below Rend Lake
Asian carp, Common Carp, Buffalo, Gar, Drum A few sport fish
Private lakes and ponds
4 ponds Statewide

Appendix K
K-3
Water body Location Numbers Species
Week of July 30-Aug 6
Rivers and Streams
Whitley Creek Moultrie
Private ponds
6 ponds Statewide
Rivers and Streams
None
Week of Aug 7-13
Private lakes and ponds
Echo Lake Lake Co Largemouth bass, Bluegill Carp, Channel catfish
8 ponds Statewide
Week of Aug 14-20
Rivers and Streams
None
Public Lakes
Marion City Lake Thousands
Largemouth bass, Bluegill Redear sunfish, Crappie sp., Channel and bullhead catfish
Private lakes and ponds
A few ponds were reported Statewide
Week of Aug 21-27
Rivers and Streams
Kaskaskia River Clinton Co Hundreds None listed
Public Lakes
Horseshoe Lake Alexander Co Hundreds Asian carp, Buffalo sp.
Private Lakes and ponds
A few ponds were reported Statewide
Week of Sept 25-Oct 1
Rivers and Streams
Illinois River- Anderson Lake Fulton Hundreds Asian carp
Illinois River- Crabtree Creek Fulton Thousands Asian carp
Public Lakes
None
Private lakes and ponds
None

Appendix K
K-4
Land Management Concerns
Illinois Department of Natural Resources manages and maintains 324 state-owned and leased state
parks, fish and wildlife areas, state forests, state trails, natural areas and recreational sites; with 45
million visits annually. These sites contribute nearly $1 billion in visitor spending and support 8,500 jobs
statewide. Outdoor recreation opportunities such as boating, camping, fishing, hunting, picnicking,
sightseeing, wildlife observation, swimming and trail use create a $3.2 billion annual economic impact in
Illinois, supporting 33,000 jobs statewide.
Recreation impacts started with fire bans at all State Parks. The ban included charcoal grills and all open
fires. Wildland fire potential was assessed as above normal over the entire state for the month of
August. With rains increasing soil moisture, these bans were lifted on a case-by-case basis.
Recreational opportunities have been hindered by low water levels in the lakes and rivers. Submerged
trees and debris have been exposed on the periphery of lakes. Warm water temperatures discourage
boating and swimming during the extremely hot days.
Filling of water fowl hunting sites was problematic at some locations. The ground for the water fowl
sites was abnormally dry so it required additional water. A few of the sites rely on small streams and
surface water reservoirs which did not have adequate water to fill these sites. Pumping costs to fill
these sites were higher than normal.
Industrial Impacts
Coal Industry
The coal industry utilizes large volumes of water to process the coal. One coal company in Randolph
County was running out of water in their reservoir. The company has requested authority to utilize
water in IDNR ponds. Without a source to augment their water supply, the coal mine will shut down
resulting in layoffs and reducing exports from Illinois. Due to the low water levels in the rivers and the
resulting limitations on the amount of coal that can be loaded on a barge the transportation cost of coal
has increased. Another coal company has reduced coal production due to lesser demand from their
client.
Power Industry
Steam electric power plants utilize surface water to operate the plant equipment. With above normal
temperatures for the entire year to date, the water temperatures of the surface waters have been well
above normal. Under their NPDES permits for release to the rivers, power plants cannot release water
above specified temperatures based on the time of year. Starting in March, the temperatures in the
receiving rivers were higher than water temperatures allowed by the permits for their releases.
Therefore, IEPA granted several power plants temporary variances to release the heated water into the
rivers where temperatures were already elevated, due to prolonged warm weather and low flow
conditions. Even with this regulatory relief, many plants needed to reduce electrical output to continue
to remain in compliance with environmental/regulatory restrictions.

Appendix K
K-5
Water withdrawals from Public Waters are limited at low flows to protect the in-stream habitat through
the Office of Water Resources permit process. The Illinois and Kankakee Rivers dropped to flows below
the withdrawal limits of some power plants for a short time period. When practicable based on site land
use restraints, the power plants with cooling ponds have on-site storage reservoirs; for example the
Braidwood plant has a 30 day supply in their reservoir. There is an alternate site for water augmentation
at Braidwood, but it adds only 1 week of water supply. Kendall Station has a seven to14 day reservoir
reserve depending upon load conditions. Other power plants, however, do not have these types of
reserves, and therefore need to be able to utilize river water in order to continue operations.
Reducing power outputs of power plants because of water that is too hot or of insufficient quantity
limits the amount of power that can be produced with potential electrical distribution impacts to Illinois
residents and industry. Many power plants within Illinois were required to reduce their power output
because of water that was too hot or of insufficient quantity in 2012. Several generating units in Illinois
were required to be shut down for days, and in some cases, weeks, in the face of these drought
conditions, in order to continue to meet regulatory limitations on either temperature or water use or
both.
Ethanol Production
Ethanol production uses an unknown quantity of water. Industrial usage of water in Decatur accounts for 75% of the total water usage from Lake Decatur and ADM is the largest single user of the water supply. The first level of water restriction for Lake Decatur is for industry to lower their use of the water supply by 10%. The 10% reduction in supply can be absorbed by ADM without severe impacts to their operations. The next level of water restrictions for Lake Decatur is for industry to lower their water usage by 15%. At the 15% reduction level in water usage ADM reports layoffs will be necessary and production of ethanol will be moved to plants outside Illinois. Both ADM and City of Decatur are seeking alternate water sources including groundwater and surface supplies to augment Lake Decatur. State-wide production of ethanol in 2012 was influenced by lack of water and by the cost of corn
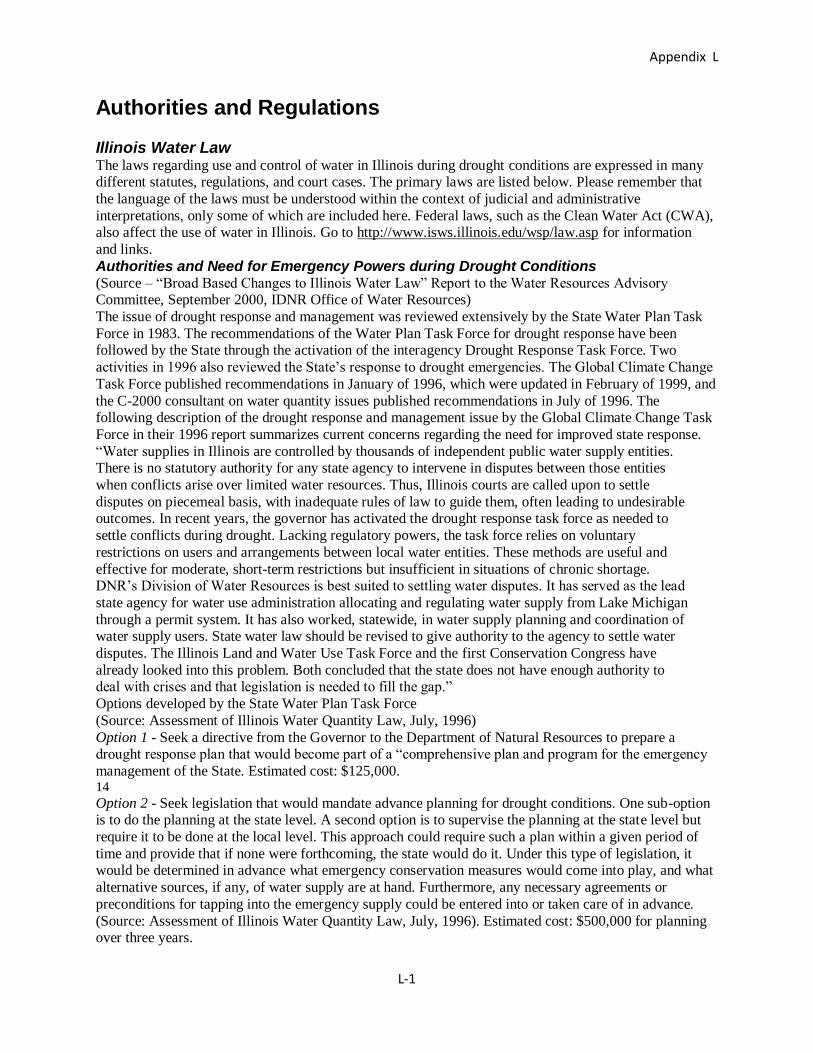
Appendix L
L-1
Authorities and Regulations Illinois Water Law The laws regarding use and control of water in Illinois during drought conditions are expressed in many different statutes, regulations, and court cases. The primary laws are listed below. Please remember that
the language of the laws must be understood within the context of judicial and administrative
interpretations, only some of which are included here. Federal laws, such as the Clean Water Act (CWA), also affect the use of water in Illinois. Go to http://www.isws.illinois.edu/wsp/law.asp for information
and links.
Authorities and Need for Emergency Powers during Drought Conditions (Source – “Broad Based Changes to Illinois Water Law” Report to the Water Resources Advisory Committee, September 2000, IDNR Office of Water Resources)
The issue of drought response and management was reviewed extensively by the State Water Plan Task
Force in 1983. The recommendations of the Water Plan Task Force for drought response have been followed by the State through the activation of the interagency Drought Response Task Force. Two
activities in 1996 also reviewed the State’s response to drought emergencies. The Global Climate Change
Task Force published recommendations in January of 1996, which were updated in February of 1999, and
the C-2000 consultant on water quantity issues published recommendations in July of 1996. The following description of the drought response and management issue by the Global Climate Change Task
Force in their 1996 report summarizes current concerns regarding the need for improved state response.
“Water supplies in Illinois are controlled by thousands of independent public water supply entities. There is no statutory authority for any state agency to intervene in disputes between those entities
when conflicts arise over limited water resources. Thus, Illinois courts are called upon to settle
disputes on piecemeal basis, with inadequate rules of law to guide them, often leading to undesirable outcomes. In recent years, the governor has activated the drought response task force as needed to
settle conflicts during drought. Lacking regulatory powers, the task force relies on voluntary
restrictions on users and arrangements between local water entities. These methods are useful and
effective for moderate, short-term restrictions but insufficient in situations of chronic shortage. DNR’s Division of Water Resources is best suited to settling water disputes. It has served as the lead
state agency for water use administration allocating and regulating water supply from Lake Michigan
through a permit system. It has also worked, statewide, in water supply planning and coordination of water supply users. State water law should be revised to give authority to the agency to settle water
disputes. The Illinois Land and Water Use Task Force and the first Conservation Congress have
already looked into this problem. Both concluded that the state does not have enough authority to deal with crises and that legislation is needed to fill the gap.”
Options developed by the State Water Plan Task Force
(Source: Assessment of Illinois Water Quantity Law, July, 1996)
Option 1 - Seek a directive from the Governor to the Department of Natural Resources to prepare a drought response plan that would become part of a “comprehensive plan and program for the emergency
management of the State. Estimated cost: $125,000. 14
Option 2 - Seek legislation that would mandate advance planning for drought conditions. One sub-option is to do the planning at the state level. A second option is to supervise the planning at the state level but
require it to be done at the local level. This approach could require such a plan within a given period of
time and provide that if none were forthcoming, the state would do it. Under this type of legislation, it would be determined in advance what emergency conservation measures would come into play, and what
alternative sources, if any, of water supply are at hand. Furthermore, any necessary agreements or
preconditions for tapping into the emergency supply could be entered into or taken care of in advance.
(Source: Assessment of Illinois Water Quantity Law, July, 1996). Estimated cost: $500,000 for planning over three years.

Appendix L
L-2
Option 3 - Develop appropriate legislation to deal with water emergencies. (Source: The Illinois
Response to Climate Change, Report of the Task force on Global Climate Change, January, 1996 and Climate Change Developments: Kyoto and Beyond, February, 1999). This recommendation was
expanded in the C-2000 “Assessment of Illinois Water Quantity Law” report which stated; “seek more
comprehensive legislation that would give a state water management agency authority to (1) declare the
existence of a drought, (2) issue conservation and anti-waste measures that would apply during the emergency, and (3) expedite the location of, and access to, additional temporary supplies during the
emergency. The statute could authorize general regulatory measures that would apply at times other than
emergencies for areas that experience frequent drought problems. Estimated cost: $150,000 to draft rules and prepare initial response plan and program.
Suggested draft legislation for option number 3.
Option number 3 can be implemented by amending the water resources powers already exercised by the Department of Natural Resources Office of Water Resources. Amend Section 5-10 of the
Department of Natural Resources Act of the Civil Administrative Code by adding at the end of
Section 5-10e [20ILCS 801/5-10e] the following sections:
f) To declare, following consultation with the Illinois Environmental Protection Agency, that a water shortage emergency exists when available sources of surface and groundwater in a
watershed, aquifer, or urban county are insufficient to supply public water utilities, self-supplied
commercial and industrial users, and self-supplied domestic users; g) To restrict water withdrawals and water use within a region enclosing aquifers, watersheds, or
urban counties affected by a water shortage emergency and authorize inter-basin or inter-system
transfers of water; h) To conduct rule making, investigation and adjudicative hearings, issue subpoenas and
administrative orders, and seek judicial enforcement of orders for declaration, administration,
and termination of a water shortage emergency.
Rules to implement this authority must consider interagency input into the determination of facts supporting a water emergency declaration. Rules must also consider the significance of all water
conservation activities and drought response activities, either authorized, approved and/or underway by
all water users, and inter-system transfers of water can only be authorized under this legislation on a temporary basis and only during a water shortage emergency.
Option 3 is the preferred option by the Department of Natural Resources (in September 2000). 15
Instream Flow Protection (Source – “Broad Based Changes to Illinois Water Law” Report to the Water Resources Advisory
Committee, September 2000, IDNR Office of Water Resources)
The issue of instream flow protection has been investigated extensively by the State Water Plan Task Force (1983) and by the Interagency Instream Flow Protection Committee mandated under Public Act 86-
191 (1991). The C-2000 consultant’s report on water quantity issues also discussed the public concern
for this issue, along with legal issues and legal options for further consideration. The issue of protecting critical flows in rivers and streams was the number three priority recommendation of the Land and Water
Management Committee of Conservation Congress III.
The Interagency Instream Flow Protection Committee summarized the instream flow protection issue in
its 1991 report as follows: “The protection of minimum instream flows within the rivers and streams of Illinois is a significant
water resources management issue that has been widely recognized since the mid 1970’s. With each
new drought and burst of economic development and growth in Illinois, numerous additional demands for the offstream use of the State’s surface water resources occur. The development of these
resources occurs across the State and can cause significant negative impacts to streams of any size
and at any location. Without the provision for the protection of some levels of minimum streamflows, the resource values, uses, and benefits of these aquatic resources are significantly
impaired. In addition, it is now becoming recognized that most of the streams in Illinois cannot meet

Appendix L
L-3
the demands of all users at all times. Therefore, developers of the surface water resources of the State
of Illinois must recognize the need to cease withdrawals at various times to protect the values of instream uses. They must also recognize that most water supply developments in Illinois will require
that additional storage or alternative sources of supply be developed as a necessary part of any secure
water resources development project.”
Recommendations of the Water Plan Task Force Option 1. Seek legislation either that establishes minimum or required streamflows or that specifically
authorizes an agency to establish such flows beyond the existing statutory law. (Reference to existing law
is the Rivers, Lakes and Streams Act where DNR has “natural conditions” protection authority over the public waters of Illinois - 2,503 miles of streams out of a statewide total of 33,000 miles. Source: C-2000
Assessment of Illinois Water Quantity Law, July, 1996) The 18 key issues and questions identified in the
Interagency Instream Flow Protection Committee report could be addressed in the rule-making process following passage of the recommended legislation. Cost: $125,000 to draft initial rules plus one new staff
position.
Suggested draft legislation for option number 1 would strike just two words in the existing Rivers,
Lakes and Streams Act. Amendment to Section 23 of the Rivers, Lakes and Streams Act [615 ILCS 5/23] to Establish and
Preserve Minimum Flows in Streams
§23. It shall be the duty of the Department of Natural Resources to maintain stream gauge stations, … and to establish by regulations water levels below which water cannot be drawn down behind
dams from any stream or river in the State of Illinois, in order to retain enough water in such streams
to preserve the fish and other aquatic life in the stream, and to safeguard the health of the community. 16
Option 2. Draft a new instream flow protection act that will regulate downstream releases from new
reservoirs as well as direct stream withdrawals by new users. Legislation to implement this regulatory
program for new water users and impoundments will authorize the development of aquatic life protection
rules for submittal and approval to the Illinois Pollution Control Board. Option 1 was the preferred option by the Department of Natural Resources (in September 2000).
Groundwater Management and Regulation (Source – “Broad Based Changes to Illinois Water Law” Report to the Water Resources Advisory
Committee, September 2000, IDNR Office of Water Resources)
The issue of groundwater management and regulation was reviewed extensively by a subcommittee of the
State Water Plan Task Force in 1989 and by the water law consultant in the C-2000 water law studies published in 1996. Draft legislation was introduced in 1989 and 1990 based on the recommendations of
the State Water Plan Task Force, and although these legislative initiatives generated significant debate
and issue resolution, the initiatives eventually failed when the Farm Bureau and Municipal League mutually agreed to lift their support from any administration bill for groundwater management. The
groundwater regulatory and management issues defined by the Water Plan Task Force subcommittee and
by the C-2000 water law consultant are basically identical, and are as follows: 1) Current state laws (Water Use Act of 1983 and the Water Authorities Act) do not provide for adequate
or proper management of groundwater developments in Illinois.
2) A major issue in the development of groundwater resources is the resolution of well interference
issues. This issue mainly occurs when the development of a high capacity well negatively impacts on the operation of a nearby smaller well, most generally in use by a rural household.
3) Political aspects of competition among and between urban and rural users of ground water. This issue
was manifested in the drought of 1988 and 1989 between irrigators and rural homeowners in Kankakee County and between Municipalities and newly formed Water Authorities that were created to provide
protection for rural areas located over the Mahomet aquifer system.
4) The level of government that should have the ultimate power to regulate groundwater resources. Rural areas and agricultural interests support local control based on the position that state government would
tend to favor municipal and industrial users over rural interests.
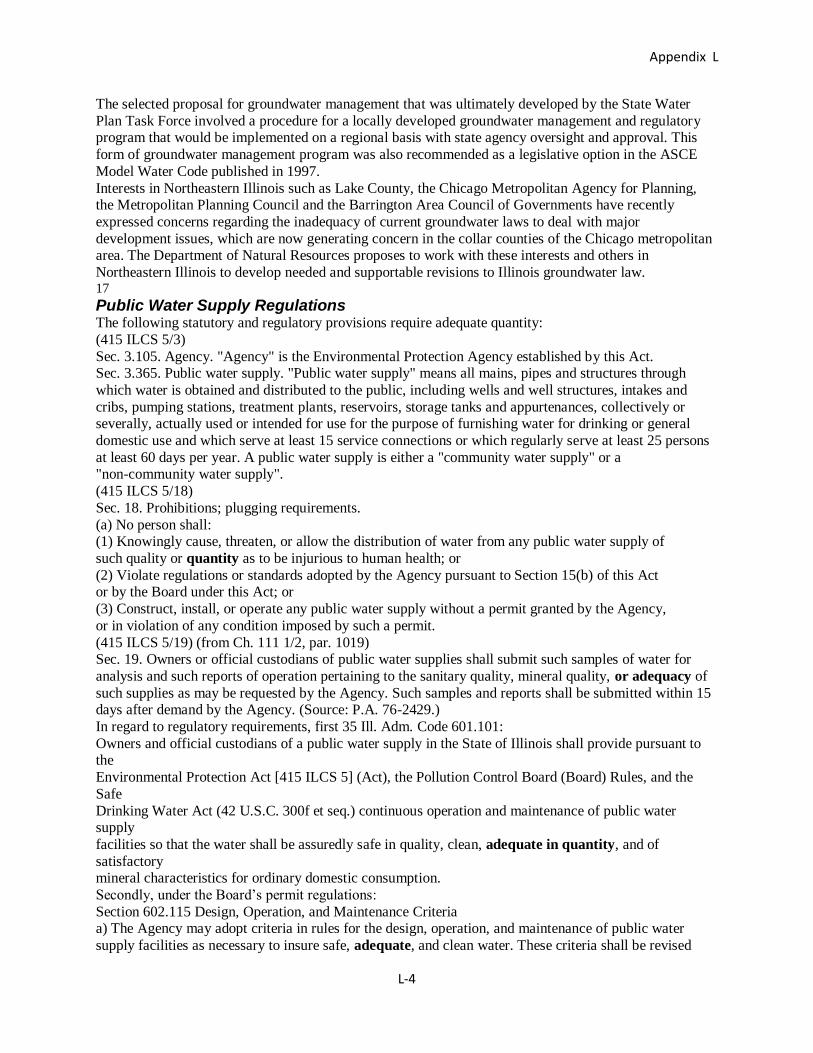
Appendix L
L-4
The selected proposal for groundwater management that was ultimately developed by the State Water
Plan Task Force involved a procedure for a locally developed groundwater management and regulatory program that would be implemented on a regional basis with state agency oversight and approval. This
form of groundwater management program was also recommended as a legislative option in the ASCE
Model Water Code published in 1997.
Interests in Northeastern Illinois such as Lake County, the Chicago Metropolitan Agency for Planning, the Metropolitan Planning Council and the Barrington Area Council of Governments have recently
expressed concerns regarding the inadequacy of current groundwater laws to deal with major
development issues, which are now generating concern in the collar counties of the Chicago metropolitan area. The Department of Natural Resources proposes to work with these interests and others in
Northeastern Illinois to develop needed and supportable revisions to Illinois groundwater law. 17
Public Water Supply Regulations The following statutory and regulatory provisions require adequate quantity:
(415 ILCS 5/3)
Sec. 3.105. Agency. "Agency" is the Environmental Protection Agency established by this Act. Sec. 3.365. Public water supply. "Public water supply" means all mains, pipes and structures through
which water is obtained and distributed to the public, including wells and well structures, intakes and
cribs, pumping stations, treatment plants, reservoirs, storage tanks and appurtenances, collectively or severally, actually used or intended for use for the purpose of furnishing water for drinking or general
domestic use and which serve at least 15 service connections or which regularly serve at least 25 persons
at least 60 days per year. A public water supply is either a "community water supply" or a "non-community water supply".
(415 ILCS 5/18)
Sec. 18. Prohibitions; plugging requirements.
(a) No person shall: (1) Knowingly cause, threaten, or allow the distribution of water from any public water supply of
such quality or quantity as to be injurious to human health; or
(2) Violate regulations or standards adopted by the Agency pursuant to Section 15(b) of this Act or by the Board under this Act; or
(3) Construct, install, or operate any public water supply without a permit granted by the Agency,
or in violation of any condition imposed by such a permit.
(415 ILCS 5/19) (from Ch. 111 1/2, par. 1019) Sec. 19. Owners or official custodians of public water supplies shall submit such samples of water for
analysis and such reports of operation pertaining to the sanitary quality, mineral quality, or adequacy of
such supplies as may be requested by the Agency. Such samples and reports shall be submitted within 15 days after demand by the Agency. (Source: P.A. 76-2429.)
In regard to regulatory requirements, first 35 Ill. Adm. Code 601.101:
Owners and official custodians of a public water supply in the State of Illinois shall provide pursuant to the
Environmental Protection Act [415 ILCS 5] (Act), the Pollution Control Board (Board) Rules, and the
Safe
Drinking Water Act (42 U.S.C. 300f et seq.) continuous operation and maintenance of public water supply
facilities so that the water shall be assuredly safe in quality, clean, adequate in quantity, and of
satisfactory mineral characteristics for ordinary domestic consumption.
Secondly, under the Board’s permit regulations:
Section 602.115 Design, Operation, and Maintenance Criteria a) The Agency may adopt criteria in rules for the design, operation, and maintenance of public water
supply facilities as necessary to insure safe, adequate, and clean water. These criteria shall be revised
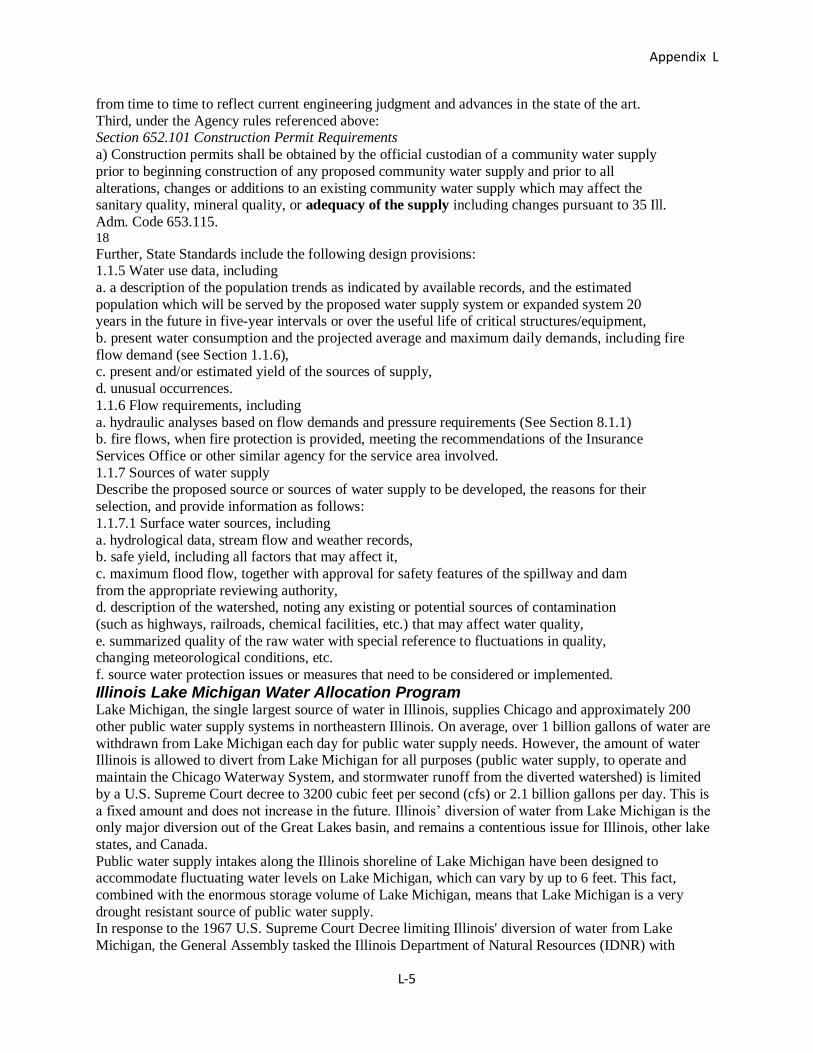
Appendix L
L-5
from time to time to reflect current engineering judgment and advances in the state of the art.
Third, under the Agency rules referenced above: Section 652.101 Construction Permit Requirements
a) Construction permits shall be obtained by the official custodian of a community water supply
prior to beginning construction of any proposed community water supply and prior to all
alterations, changes or additions to an existing community water supply which may affect the sanitary quality, mineral quality, or adequacy of the supply including changes pursuant to 35 Ill.
Adm. Code 653.115. 18
Further, State Standards include the following design provisions: 1.1.5 Water use data, including
a. a description of the population trends as indicated by available records, and the estimated
population which will be served by the proposed water supply system or expanded system 20 years in the future in five-year intervals or over the useful life of critical structures/equipment,
b. present water consumption and the projected average and maximum daily demands, including fire
flow demand (see Section 1.1.6), c. present and/or estimated yield of the sources of supply,
d. unusual occurrences.
1.1.6 Flow requirements, including
a. hydraulic analyses based on flow demands and pressure requirements (See Section 8.1.1) b. fire flows, when fire protection is provided, meeting the recommendations of the Insurance
Services Office or other similar agency for the service area involved.
1.1.7 Sources of water supply Describe the proposed source or sources of water supply to be developed, the reasons for their
selection, and provide information as follows:
1.1.7.1 Surface water sources, including
a. hydrological data, stream flow and weather records, b. safe yield, including all factors that may affect it,
c. maximum flood flow, together with approval for safety features of the spillway and dam
from the appropriate reviewing authority, d. description of the watershed, noting any existing or potential sources of contamination
(such as highways, railroads, chemical facilities, etc.) that may affect water quality,
e. summarized quality of the raw water with special reference to fluctuations in quality, changing meteorological conditions, etc.
f. source water protection issues or measures that need to be considered or implemented.
Illinois Lake Michigan Water Allocation Program Lake Michigan, the single largest source of water in Illinois, supplies Chicago and approximately 200
other public water supply systems in northeastern Illinois. On average, over 1 billion gallons of water are
withdrawn from Lake Michigan each day for public water supply needs. However, the amount of water Illinois is allowed to divert from Lake Michigan for all purposes (public water supply, to operate and
maintain the Chicago Waterway System, and stormwater runoff from the diverted watershed) is limited
by a U.S. Supreme Court decree to 3200 cubic feet per second (cfs) or 2.1 billion gallons per day. This is
a fixed amount and does not increase in the future. Illinois’ diversion of water from Lake Michigan is the only major diversion out of the Great Lakes basin, and remains a contentious issue for Illinois, other lake
states, and Canada.
Public water supply intakes along the Illinois shoreline of Lake Michigan have been designed to accommodate fluctuating water levels on Lake Michigan, which can vary by up to 6 feet. This fact,
combined with the enormous storage volume of Lake Michigan, means that Lake Michigan is a very
drought resistant source of public water supply. In response to the 1967 U.S. Supreme Court Decree limiting Illinois' diversion of water from Lake
Michigan, the General Assembly tasked the Illinois Department of Natural Resources (IDNR) with

Appendix L
L-6
developing an ongoing program to equitably allocate Illinois' supply of Lake Michigan water. The
importance of wise, long-term water resource planning and the large investments that must be made to secure new water supply sources requires that the objectives of an allocation program clearly address the 19
problems to be solved. In Illinois' case, the objectives must also address the specific requirements of the
U.S. Supreme Court Decree. The objectives, or goals, of Illinois' allocation program can be summarized as follows:
To make the greatest amount of Lake Michigan water available for domestic water supply.
To use Lake Michigan water allocations as a tool to preserve groundwater resources for communities
in northeastern Illinois who will not have access to a Lake Michigan water supply.
To make long-term allocations so that communities receiving an allocation for the first time can
secure the needed financing to construct regional water distribution systems.
To carefully consider the competing needs of all water users in the region so that allocations promote
the efficient development of water supplies in the region in light of long-range needs and objectives.
To require all users of Lake Michigan water to conserve and manage this resource.
Allocation Process - A successful water allocation program must combine a technically defensible
methodology with an administrative process that follows legally defensible procedures and treats all
applicants fairly. To achieve this goal, Illinois' allocation process consists of the following key elements:
An active public participation program.
An identification of available water supply sources.
A long-range water demand forecasting methodology.
Formal allocation hearings on all requests.
Issuance of an Allocation Order.
Ongoing monitoring of water use and consumption by all permittees.
Formal process to make adjustments in allocations.
The "Rules and Regulations for the Allocation of Water from Lake Michigan" describe the allocation
process and contain the criteria used to evaluate applications for a water allocation and water conservation
practices and other permit conditions required of allocation permit holders
http://www.dnr.illinois.gov/WaterResources/Pages/Permits.aspx. Water allocations are made through a hearing and order procedure. Entities receiving an allocation of Lake Michigan water receive an
allocation permit.
Lake Michigan Diversion Status/Allocation Outlook Illinois is currently in compliance with the Supreme Court Decree. As of Water Year 2007 (the latest
year in which Illinois’ diversion has been certified by the U.S. Army Corps of Engineers), Illinois’ 40-
year running average diversion is 3171 cubic feet per second (cfs), which is 29 cfs below the Court limit of 3200 cfs. The cumulative deviation (a water bank) is 774 cfs-years. Unofficial estimates of Illinois’
diversion through Water Year 2010 continue the trend of staying below the Court limit and increasing the
cumulative deviation.
The IDNR has noted an overall decrease in per capita use within the Lake Michigan service area. This is especially apparent in the City of Chicago, where water use has declined by over 200 million gallons per
day over the past 15 to 20 years.
In 2008, the IDNR issued a new water allocation order extending water allocations out to the year 2030. With a continued emphasis on conservation and efficient use, there is reason to be optimistic that the
future water supply needs within the Lake Michigan water service area can be met while staying in
compliance with the Court Decree. The IDNR also anticipates that there will be some continued interest
in expanding the Lake Michigan water service area where it can be shown to be cost effective. Lake

Appendix L
L-7
20
Michigan water will continue to play a very important role in ensuring that the entire northeastern Illinois
region has an adequate supply of water.
Water Withdrawal Reporting Illinois Water Inventory Program (IWIP). Documentation of annual water withdrawals (water use) for all of Illinois began in 1978 by the Illinois State Water Survey (ISWS) under a cooperative agreement with
the U.S. Geological Survey (USGS). For each water-using facility inventoried, the database includes
locations and amounts of water withdrawn from surface water and groundwater sources, as well as significant amounts of water purchased from other facilities. All public water supplies and major self
supplied
industries, irrigation, fish and wildlife, and conservation uses (withdrawals > 100,000 gallons per day) are inventoried. Data can be summarized geographically by county, township, and drainage basin,
as well as by various water use and water source categories for inclusion in the National Water Use Data
System.
Current uses of the data collected through the IWIP program include:
Determination of community water supply usage
Determination of aquifer-wide withdrawals
Assessment of groundwater-level observations with respect to groundwater withdrawals (for example,
comparisons of potentiometric surface maps of the Cambrian-Ordovician aquifer system and
pumpage from that aquifer system)
Water use projections
Comparisons of aquifer withdrawals to estimated aquifer recharge
Regional and site-specific groundwater flow modeling
Determination of groundwater withdrawals for the U.S. Army Corps of Engineers’ Lake Michigan
Diversion Accounting Program
Impact of high-capacity wells on neighboring wells
As of January 1, 2010, annual reporting of withdrawals from wells and surface water intakes that pump at
a rate of 70 gallons per minute or greater (100,000 gallons per day) is mandatory in Illinois, according to
Public Act 096-0222. A notable exception to the mandated reporting is the use of high-capacity well and intake use in agricultural irrigation. Agricultural irrigators are exempt from reporting for the first five
years of the act (until January 1, 2015). However, individual farm irrigators with good records of
irrigation water use are encouraged to report their annual water use prior to that date so their operations may serve as benchmark farms to aid in developing irrigation estimation coefficients. The Act may be
viewed at http://www.ilga.gov/legislation/publicacts/fulltext.asp?Name=096-0222.