the dove health alliance
TRANSCRIPT
8/2/2019 The Dove Health Alliance
http://slidepdf.com/reader/full/the-dove-health-alliance 1/12
The Dove Health Alliance
The Vision :
The Dove Health Alliance is a California nonprofit Private Operating Foundation with the vision ofencouraging greater awareness and practice of the discipline of Energy Medicine through research,education, and practical application.
Our nonprofit status offers all researchers an opportunity to pursue innovative research with the highestlevel of integrity without conflict of interest. At the same time, the foundation seeks to work cooperativelywith the commercial sector to rapidly bring useful technologies and innovative healing modalitiesdeveloped by participating scientists to the marketplace. Our highly respected Board of Advisors and ourfirst rate Scientific Review Committee will ensure that projects funded by the Dove Health Alliance willmake a significant contribution to the field of Energy Medicine.
The Mission:
The mission of the Dove Health Alliance is "to discover, validate, and disseminate the principles andpractices of energy medicine on personal, societal and environmental levels."
We plan to fulfill this mission through a series of specific objectives, namely:
1. To define the effectiveness of the existing and emerging healing methods and therapeutic,instrumentation used in Energy Medicine, through research, development, and clinical testing.
2. To develop new technologies and effective methodologies for monitoring and treating the state ofhealth of the human body. This includes the assessment of electromagnetic and subtle energyinformation fields around and within the human body.
3. To formulate acceptable theories and comprehensive models that define the efficacy of specificcomplementary medical modalities and create a sound scientific foundation for Energy Medicine.
4. To assist the emergence of the field of Energy Medicine by researching the interrelationshipsbetween living systems, healing processes, and the nature of consciousness. 5. To promote education and publish the results of our research for the public benefit.
| Vision & Mission | The Management Team | Overview of Research Program | Contact Us |
British girls suffer the lowest self esteem in the world, after Japan. Almost ¾ (74%) of girls aged 8 – 12 are so dissatisfied with their bodies that they would like to changesomething about their appearance.
The Dove team is committed to help girls build positive self-esteem and a healthy bodyimage, with a goal of reaching 5 million girls worldwide by 2010.
The Dove Self Esteem Fund has reached over 5 million girls worldwide and is committedto continuing to help girls build positive self-esteem and a healthy body image.
For information on the Dove range of products call the customer careline free on 0800 085 1548in the UK and 1850 404060 in Ireland.
8/2/2019 The Dove Health Alliance
http://slidepdf.com/reader/full/the-dove-health-alliance 2/12
Innovations
We have developed Dove Hair Therapy with patented Micro Moisture Serum™and Fibr eActives™to effectively reconstruct hair from the inside as well as protecting and smoothing it onthe outside. Our Hair Therapy line caters to each hair type and in 2011, will introduce theNourishing Oil Care range with weightless Nutri-Oils for damaged hair.
Key facts
Dove has evolved and grown in many ways over the year and no longer just caters to skincare. The Dove brand comprises of skin care for both men and women, lip care,deodorants, as well as hair care.
Dove is the UK's top Bar Soap brand and 45% of the population bought a Dove productin 2010. In fact, 10.1 million women use Dove every week in the UK.
From our range
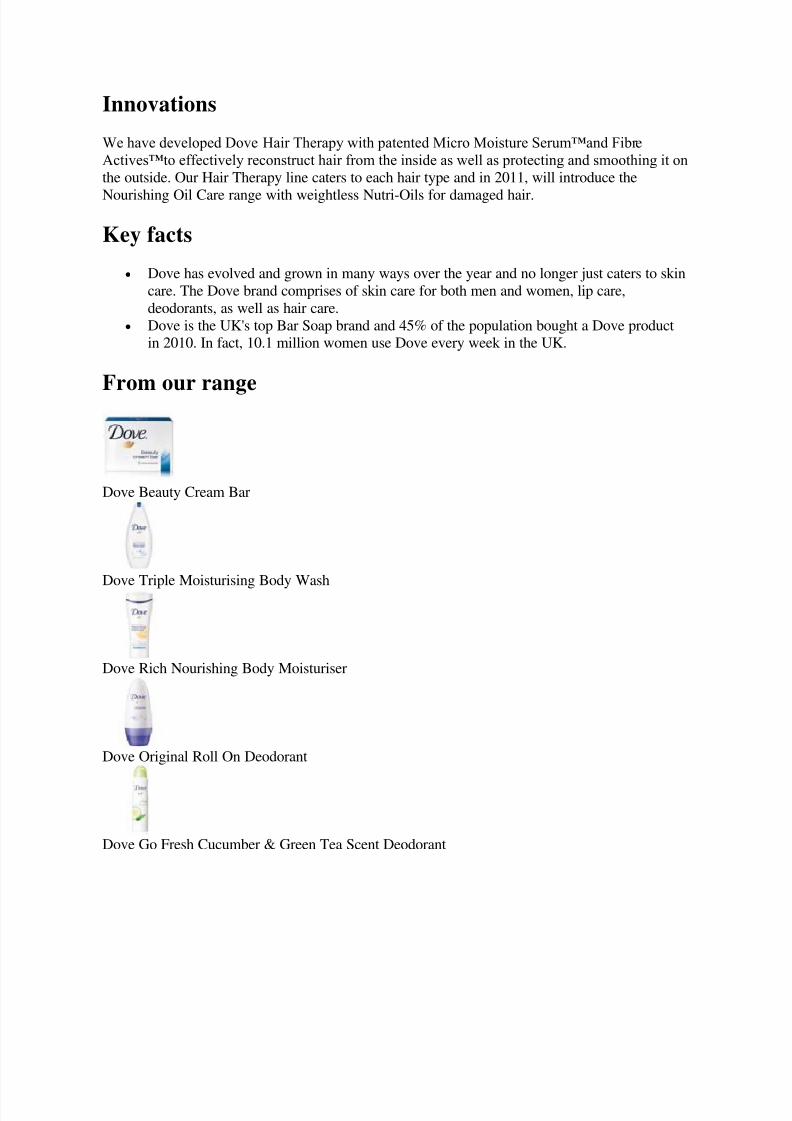
Dove Beauty Cream Bar
Dove Triple Moisturising Body Wash
Dove Rich Nourishing Body Moisturiser
Dove Original Roll On Deodorant
Dove Go Fresh Cucumber & Green Tea Scent Deodorant
8/2/2019 The Dove Health Alliance
http://slidepdf.com/reader/full/the-dove-health-alliance 3/12
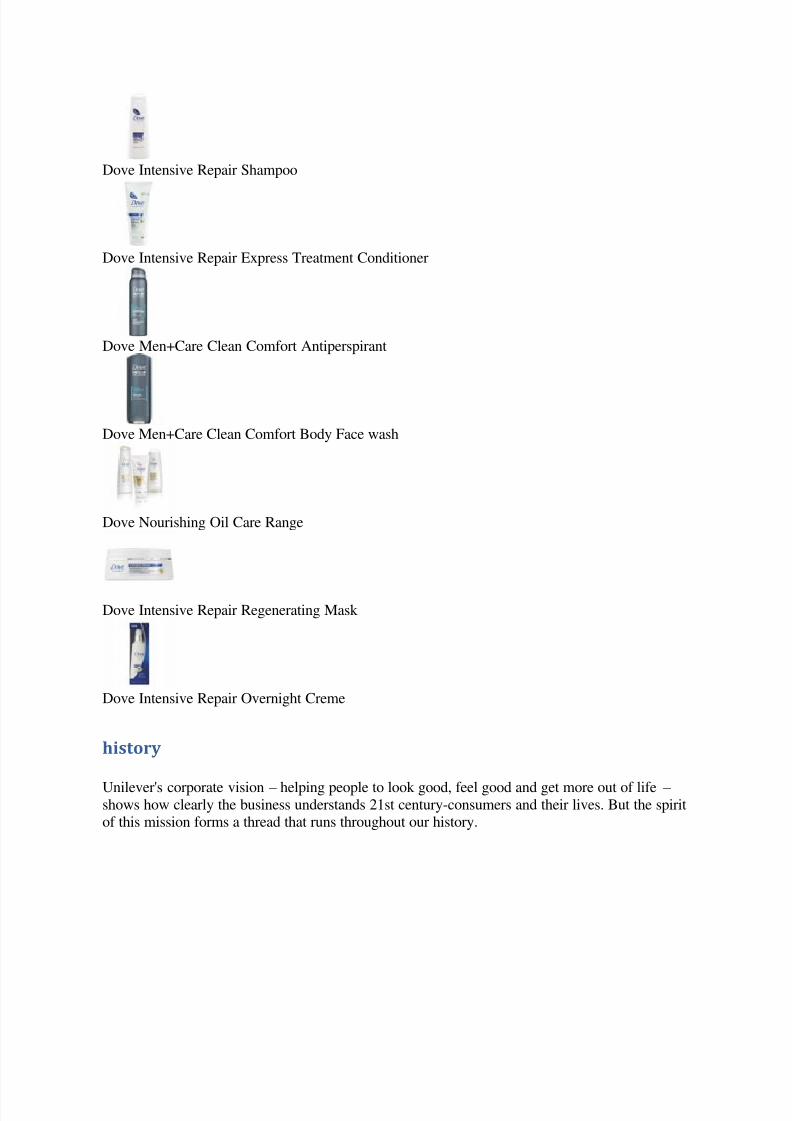
Dove Intensive Repair Shampoo
Dove Intensive Repair Express Treatment Conditioner
Dove Men+Care Clean Comfort Antiperspirant
Dove Men+Care Clean Comfort Body Face wash
Dove Nourishing Oil Care Range
Dove Intensive Repair Regenerating Mask
Dove Intensive Repair Overnight Creme
history
Unilever's corporate vision – helping people to look good, feel good and get more out of life – shows how clearly the business understands 21st century-consumers and their lives. But the spiritof this mission forms a thread that runs throughout our history.
8/2/2019 The Dove Health Alliance
http://slidepdf.com/reader/full/the-dove-health-alliance 4/12
Helping people get more out of life
In the 1890s, William Hesketh Lever, founder of Lever Bros, wrote down his ideas for SunlightSoap – his revolutionary new product that helped popularise cleanliness and hygiene in VictorianEngland. It was 'to make cleanliness commonplace; to lessen work for women; to foster healthand contribute to personal attractiveness, that life may be more enjoyable and rewarding for thepeople who use our products'.
This was long before the phrase 'Corporate Mission' had been invented, but these ideas havestayed at the heart of our business. Even if their language – and the notion of only women doinghousework – has become outdated.
In a history that now crosses three centuries, Unilever's success has been influenced by the majorevents of the day – economic boom, depression, world wars, changing consumer lifestyles andadvances in technology. And throughout we've created products that help people get more out of life – cutting the time spent on household chores, improving nutrition, enabling people to enjoyfood and take care of their homes, their clothes and themselves.
Balancing profit with responsible corporate behaviour
In the late 19th century the businesses that would later become Unilever were among the mostphilanthropic of their time. They set up projects to improve the lot of their workers and createdproducts with a positive social impact, making hygiene and personal care commonplace and
improving nutrition through adding vitamins to foods that were already daily staples.Today, Unilever still believes that success means acting with 'the highest standards of corporatebehaviour towards our employees, consumers and the societies and world in which we live'.Over the years we've launched or participated in an ever-growing range of initiatives to sourcesustainable supplies of raw materials, protect environments, support local communities and muchmore.

8/2/2019 The Dove Health Alliance
http://slidepdf.com/reader/full/the-dove-health-alliance 5/12
Through this timeline you'll see how our brand portfolio has evolved. At the beginning of the21st century, our Path to Growth strategy focused us on global high-potential brands and ourVitality mission has taken us into a new phase of development. More than ever, our brands arehelping people 'feel good, look good and get more out of life' – a sentiment close to LordLeverhulme's heart over a hundred years ago.
Building on this heritage, our priorities now are inspiring people to take small everyday actionsthat can add up to a big difference for the world – from laundry brands that help minimise wastedwater and packaging to nutritious, easily prepared and affordable meals and snacks.

8/2/2019 The Dove Health Alliance
http://slidepdf.com/reader/full/the-dove-health-alliance 6/12
Timeline
19thcentury
Although Unilever wasn't formed until 1930, the companies that joined forces tocreate the business we know today were already well established before the start of the 20th century.
1900s Unilever's founding companies produced products made of oils and fats, principallysoap and margarine. At the beginning of the 20th century their expansion nearlyoutstrips the supply of raw materials.
1910sTough economic conditions and the First World War make trading difficult foreveryone, so many businesses form trade associations to protect their sharedinterests.
1920sWith businesses expanding fast, companies set up negotiations intending to stopothers producing the same types of products. But instead they agree to merge - andso Unilever is created.
1930s Unilever's first decade is no easy ride: it starts with the Great Depression and endswith the Second World War. But while the business rationalises operations, it alsocontinues to diversify.
1940sUnilever's operations around the world begin to fragment, but the business continuesto expand further into the foods market and increase investment in research anddevelopment.
1950sBusiness booms as new technology and the European Economic Community lead torising standards of living in the West, while new markets open up in emergingeconomies around the globe.
1960sAs the world economy expands, so does Unilever and it sets about developing newproducts, entering new markets and running a highly ambitious acquisitionprogramme.
1970sHard economic conditions and high inflation make the 70s a tough time foreveryone, but things are particularly difficult in the fast-moving consumer goods(FMCG) sector as the big retailers start to flex their muscles.
1980sUnilever is now one of the world's biggest companies, but takes the decision to focusits portfolio, and rationalise its businesses to focus on core products and brands.
1990sThe business expands into Central and Eastern Europe and further sharpens its focuson fewer product categories, leading to the sale or withdrawal of two-thirds of itsbrands.
The 21st century
The decade starts with the launch of Path to Growth, a five-year strategic plan, andin 2004 further sharpens its focus on the needs of 21st century consumers with itsVitality mission. In 2009, Unilever announces its new corporate vision – working tocreate a better future every day with brands that help people look good, feel goodand get more out of life.
8/2/2019 The Dove Health Alliance
http://slidepdf.com/reader/full/the-dove-health-alliance 7/12
8/2/2019 The Dove Health Alliance
http://slidepdf.com/reader/full/the-dove-health-alliance 8/12
Areas of innovation
Unilever is recognised as a world leader in R&D, both in terms of innovation (new products andmixes) and renovation (refreshing existing products).
How we work
We employ more than 6000 R&D professionals in six global research centres, 13 global productdevelopment centres and regional development & country implementation centres.
Responsible innovation
We believe our products make a real contribution to an individual’s wellbei ng and that of theircommunity, while having the least possible adverse effect on the environment at every stage inthe product lifecycle.
Balance Sheet ofHindustan Unilever
------------------- in Rs. Cr. -------------------
Mar '11 Mar '10 Mar '09 Dec '07
12 mths 12 mths 15 mths 12 mths
Sources Of Funds
Total Share Capital 215.95 218.17 217.99 217.75 2
8/2/2019 The Dove Health Alliance
http://slidepdf.com/reader/full/the-dove-health-alliance 9/12
Equity Share Capital 215.95 218.17 217.99 217.75 2
Share Application Money 0.00 0.00 0.00 0.00
Preference Share Capital 0.00 0.00 0.00 0.00
Reserves 2,417.30 2,364.68 1,842.85 1,220.82 2,50
Revaluation Reserves 0.67 0.67 0.67 0.67
Networth 2,633.92 2,583.52 2,061.51 1,439.24 2,7
Secured Loans 0.00 0.00 144.65 25.52
Unsecured Loans 0.00 0.00 277.30 63.01
Total Debt 0.00 0.00 421.95 88.53
Total Liabilities 2,633.92 2,583.52 2,483.46 1,527.77 2,7
Mar '11 Mar '10 Mar '09 Dec '07
12 mths 12 mths 15 mths 12 mths
Application Of Funds
Gross Block 3,759.62 3,581.96 2,881.73 2,669.08 2,4
Less: Accum. Depreciation 1,590.46 1,419.85 1,274.95 1,146.57 1,061
Net Block 2,169.16 2,162.11 1,606.78 1,522.51 1,4
Capital Work in Progress 299.08 273.96 472.07 185.64 11
Investments 1,260.68 1,264.08 332.62 1,440.81 2,5
Inventories 2,811.26 2,179.93 2,528.86 1,953.60 1,5
Sundry Debtors 943.20 678.44 536.89 443.37 4
Cash and Bank Balance 281.91 231.37 190.59 200.11 17
Total Current Assets 4,036.37 3,089.74 3,256.34 2,597.08 2,158
Loans and Advances 1,099.72 1,068.31 1,196.95 1,083.28 1,150
Fixed Deposits 1,358.10 1,660.84 1,586.76 0.75 2
Total CA, Loans & Advances 6,494.19 5,818.89 6,040.05 3,681.11 3,555
Deffered Credit 0.00 0.00 0.00 0.00
Current Liabilities 6,264.21 5,493.97 4,440.08 4,028.41 3,36
Provisions 1,324.98 1,441.55 1,527.98 1,273.90 1,4
Total CL & Provisions 7,589.19 6,935.52 5,968.06 5,302.31 4,79
Net Current Assets -1,095.00 -1,116.63 71.99 -1,621.20 -
Miscellaneous Expenses 0.00 0.00 0.00 0.00
Total Assets 2,633.92 2,583.52 2,483.46 1,527.76 2,79
Contingent Liabilities 663.00 468.49 417.26 494.46 4
Book Value (Rs) 12.19 11.84 9.45 6.61
Profit & Loss accountof Hindustan Unilever
------------------- in Rs. Cr. -------------------
Mar '11 Mar '10 Mar '09 Dec '07
8/2/2019 The Dove Health Alliance
http://slidepdf.com/reader/full/the-dove-health-alliance 10/12
12 mths 12 mths 15 mths 12 mths
Income
Sales Turnover 20,598.89 18,462.34 21,927.23 14,937.88 13,189
Excise Duty 908.98 693.22 1,422.95 1,057.32 9
Net Sales 19,689.91 17,769.12 20,504.28 13,880.56 12,24
Other Income 439.48 199.73 276.54 428.37
Stock Adjustments 295.08 19.47 434.33 162.06 1
Total Income 20,424.47 17,988.32 21,215.15 14,470.99 12,88
Expenditure
Raw Materials 10,494.33 9,003.97 11,380.05 7,542.78 6,68
Power & Fuel Cost 274.74 244.34 301.37 198.89 1
Employee Cost 961.27 936.30 1,152.12 767.81 6
Other Manufacturing Expenses 551.25 412.19 297.34 204.10 18
Selling and Admin Expenses 4,366.30 3,737.52 3,857.48 2,561.12 2,328
Miscellaneous Expenses 672.61 656.57 985.31 691.49 54
Preoperative Exp Capitalised 0.00 0.00 0.00 0.00
Total Expenses 17,320.50 14,990.89 17,973.67 11,966.19 10,568
Mar '11 Mar '10 Mar '09 Dec '07
12 mths 12 mths 15 mths 12 mths
Operating Profit 2,664.49 2,797.70 2,964.94 2,076.43 1,80
PBDIT 3,103.97 2,997.43 3,241.48 2,504.80 2,
Interest 0.24 6.98 25.32 25.50
PBDT 3,103.73 2,990.45 3,216.16 2,479.30 2,3
Depreciation 220.83 184.03 195.30 138.36
Other Written Off 0.00 0.00 0.00 0.00
Profit Before Tax 2,882.90 2,806.42 3,020.86 2,340.94 2,17
Extra-ordinary items -3.06 43.97 48.53 1.67
PBT (Post Extra-ord Items) 2,879.84 2,850.39 3,069.39 2,342.61 2,177
Tax 573.87 648.36 572.94 417.14
Reported Net Profit 2,305.97 2,202.03 2,500.71 1,769.06 1,85
Total Value Addition 6,826.17 5,986.92 6,593.62 4,423.41 3,88
Preference Dividend 0.00 0.00 0.00 0.00
Equity Dividend 1,410.60 1,417.94 1,634.51 1,976.12 1,3Corporate Dividend Tax 231.36 238.03 277.79 355.50 1
Per share data (annualised)
Shares in issue (lakhs) 21,594.72 21,816.87 21,798.76 21,774.63 22,067
Earning Per Share (Rs) 10.68 10.09 11.47 8.12
Equity Dividend (%) 650.00 650.00 750.00 900.00
Book Value (Rs) 12.19 11.84 9.45 6.61
8/2/2019 The Dove Health Alliance
http://slidepdf.com/reader/full/the-dove-health-alliance 11/12
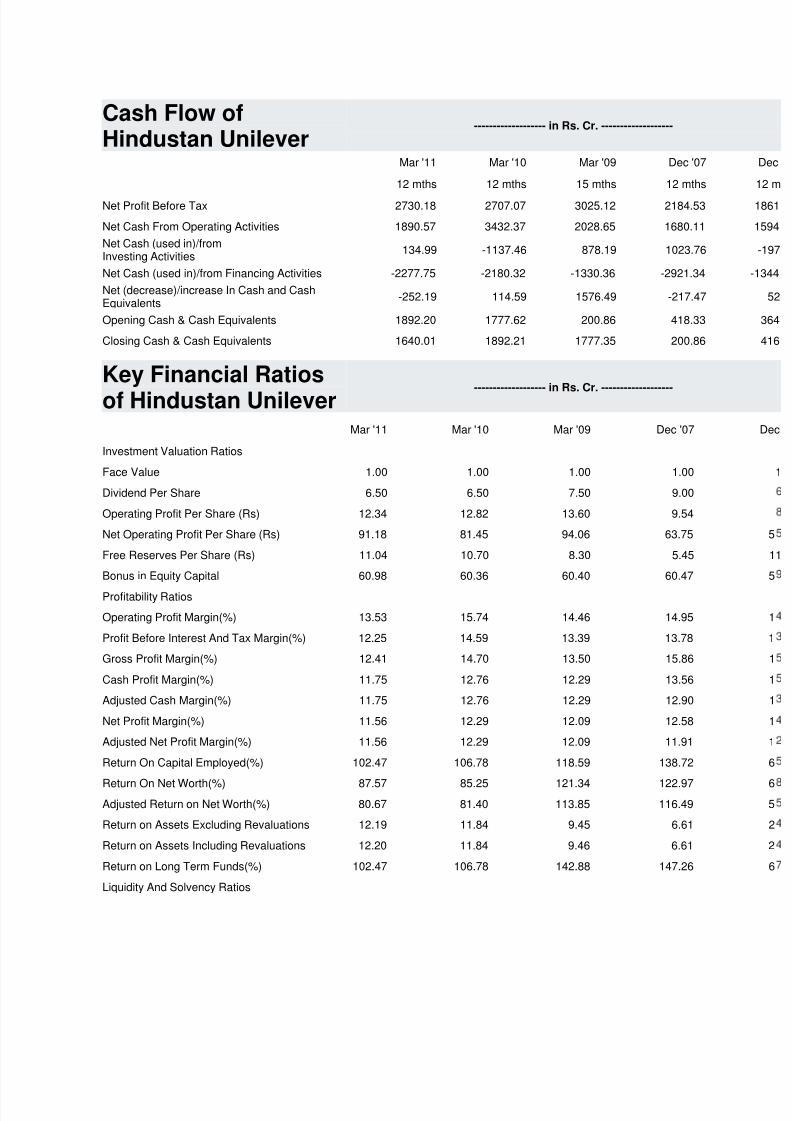
Cash Flow ofHindustan Unilever
------------------- in Rs. Cr. -------------------
Mar '11 Mar '10 Mar '09 Dec '07
12 mths 12 mths 15 mths 12 mths
Net Profit Before Tax 2730.18 2707.07 3025.12 2184.53 186
Net Cash From Operating Activities 1890.57 3432.37 2028.65 1680.11 1594Net Cash (used in)/fromInvesting Activities 134.99 -1137.46 878.19 1023.76
Net Cash (used in)/from Financing Activities -2277.75 -2180.32 -1330.36 -2921.34 -1344Net (decrease)/increase In Cash and CashEquivalents -252.19 114.59 1576.49 -217.47
Opening Cash & Cash Equivalents 1892.20 1777.62 200.86 418.33 364
Closing Cash & Cash Equivalents 1640.01 1892.21 1777.35 200.86 416
Key Financial Ratiosof Hindustan Unilever------------------- in Rs. Cr. -------------------
Mar '11 Mar '10 Mar '09 Dec '07
Investment Valuation Ratios
Face Value 1.00 1.00 1.00 1.00
Dividend Per Share 6.50 6.50 7.50 9.00
Operating Profit Per Share (Rs) 12.34 12.82 13.60 9.54
Net Operating Profit Per Share (Rs) 91.18 81.45 94.06 63.75 5
Free Reserves Per Share (Rs) 11.04 10.70 8.30 5.45 1
Bonus in Equity Capital 60.98 60.36 60.40 60.47 Profitability Ratios
Operating Profit Margin(%) 13.53 15.74 14.46 14.95
Profit Before Interest And Tax Margin(%) 12.25 14.59 13.39 13.78 1
Gross Profit Margin(%) 12.41 14.70 13.50 15.86
Cash Profit Margin(%) 11.75 12.76 12.29 13.56
Adjusted Cash Margin(%) 11.75 12.76 12.29 12.90
Net Profit Margin(%) 11.56 12.29 12.09 12.58
Adjusted Net Profit Margin(%) 11.56 12.29 12.09 11.91
Return On Capital Employed(%) 102.47 106.78 118.59 138.72 6Return On Net Worth(%) 87.57 85.25 121.34 122.97
Adjusted Return on Net Worth(%) 80.67 81.40 113.85 116.49 5
Return on Assets Excluding Revaluations 12.19 11.84 9.45 6.61 2
Return on Assets Including Revaluations 12.20 11.84 9.46 6.61 2
Return on Long Term Funds(%) 102.47 106.78 142.88 147.26 6
Liquidity And Solvency Ratios
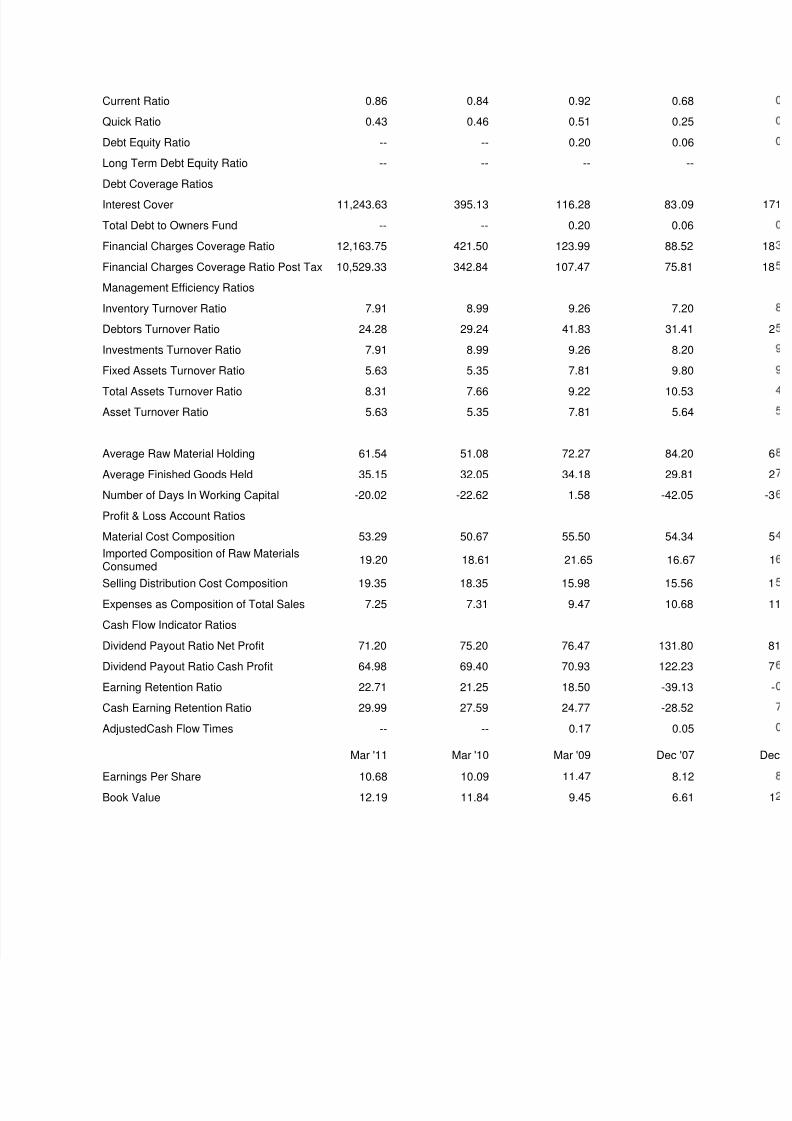
8/2/2019 The Dove Health Alliance
http://slidepdf.com/reader/full/the-dove-health-alliance 12/12
Current Ratio 0.86 0.84 0.92 0.68
Quick Ratio 0.43 0.46 0.51 0.25
Debt Equity Ratio -- -- 0.20 0.06
Long Term Debt Equity Ratio -- -- -- --
Debt Coverage Ratios
Interest Cover 11,243.63 395.13 116.28 83.09 1
Total Debt to Owners Fund -- -- 0.20 0.06
Financial Charges Coverage Ratio 12,163.75 421.50 123.99 88.52 18
Financial Charges Coverage Ratio Post Tax 10,529.33 342.84 107.47 75.81 18
Management Efficiency Ratios
Inventory Turnover Ratio 7.91 8.99 9.26 7.20
Debtors Turnover Ratio 24.28 29.24 41.83 31.41
Investments Turnover Ratio 7.91 8.99 9.26 8.20
Fixed Assets Turnover Ratio 5.63 5.35 7.81 9.80
Total Assets Turnover Ratio 8.31 7.66 9.22 10.53
Asset Turnover Ratio 5.63 5.35 7.81 5.64
Average Raw Material Holding 61.54 51.08 72.27 84.20
Average Finished Goods Held 35.15 32.05 34.18 29.81
Number of Days In Working Capital -20.02 -22.62 1.58 -42.05 -
Profit & Loss Account Ratios
Material Cost Composition 53.29 50.67 55.50 54.34 Imported Composition of Raw MaterialsConsumed 19.20 18.61 21.65 16.67
Selling Distribution Cost Composition 19.35 18.35 15.98 15.56
Expenses as Composition of Total Sales 7.25 7.31 9.47 10.68 11
Cash Flow Indicator Ratios
Dividend Payout Ratio Net Profit 71.20 75.20 76.47 131.80
Dividend Payout Ratio Cash Profit 64.98 69.40 70.93 122.23 7
Earning Retention Ratio 22.71 21.25 18.50 -39.13
Cash Earning Retention Ratio 29.99 27.59 24.77 -28.52
AdjustedCash Flow Times -- -- 0.17 0.05
Mar '11 Mar '10 Mar '09 Dec '07
Earnings Per Share 10.68 10.09 11.47 8.12
Book Value 12.19 11.84 9.45 6.61