the domestic energy sub-model in mdm-e3 -...
TRANSCRIPT

U K E N E R G Y R E S E A R C H C E N T R E The Domestic Energy Sub-Model in MDM-E3 Working Paper May 2007: REF UKERC/WP/ESM/2007/008
Terry Barker
University of Cambridge, Cambridge Econometrics
Katie Jenkins
University of Cambridge
This document has been prepared to enable results of on-going work to be made available rapidly. It has not
been subject to review and approval, and does not have the authority of a full Research Report.
UK Energy Research Centre

T H E U K E N E R G Y R E S E A R C H C E N T R E
The UK Energy Research Centre's (UKERC) mission is to be the UK's pre-eminent centre of research, and source of authoritative information and leadership, on sustainable energy systems.
UKERC undertakes world-class research addressing the whole-systems aspects of energy supply and use while developing and maintaining the means to enable cohesive research in energy.
To achieve this we are establishing a comprehensive database of energy research, development and demonstration competences in the UK. We will also act as the portal for the UK energy research community to and from both UK stakeholders and the international energy research community.
The Energy Systems and Modelling (ESM) Theme of UKERC
The UKERC’s ESM research activities are being undertaken by the Policy Studies Institute (PSI) and the Cambridge Centre for Climate Change Mitigation Research (4CMR) at the University of Cambridge, with collaboration from Cambridge Econometrics.
UK Energy Research Centre

Contents
ACKNOWLEDGEMENTS ................................................................II
ABSTRACT .................................................................................II
1. INTRODUCTION AND OVERVIEW ............................................... 3
2. HOUSEHOLD THERMAL ENERGY SERVICES.................................. 9
3. DESCRIPTION OF APPLIANCES ................................................ 11
3.1 SPACE HEATING............................................................... 11
3.2 WATER HEATING.............................................................. 13
3.3 ELECTRIC APPLIANCES...................................................... 14
3.4 COOKING APPLIANCES...................................................... 14
4. OFF-MODEL ANALYSIS AND DATA COLLECTION ......................... 15
4.1 BACKGROUND DATA ......................................................... 16
4.2 DATA FOR ENERGY APPLIANCES......................................... 16 4.2.1 Space heating .................................................. 16
4.2.2 Water heating .................................................. 18
4.2.3 Cooking Appliances ........................................... 18
4.2.4 Electrical appliances .......................................... 19
4.3 DATA FOR THERMAL CHARACTERISTICS................................. 20 4.3.1 Double glazing ...................................................... 21
4.3.2 Draught proofing ................................................... 21
4.3.3 Cavity wall insulation ............................................. 22
4.3.4 Loft insulation ....................................................... 22
4.3.5 Hot-water tank insulation........................................ 22
REFERENCES................................................................................. 23
ANNEX A: Data Sources for Version 1 and 2 of the Domestic Energy Sub-model .......................................................................................... 25
ANNEX B: MDM-E3 Fuel Type Classification ....................................... 26
UK Energy Research Centre I

Acknowledgements
The authors would like to acknowledge the help of Dr Simon Dresner (PSI) and Angela Druckman (CES, University of Surrey) for their guidance and advice on data collection.
Abstract
One of the objectives of the research under the UKERC’s quantitative modelling effort is the review and development of models of energy use by the domestic sector. The aim of this paper is to describe version 3 of the Domestic Energy Sub-model, which models household energy use in the UK as a sub-model within the UK multisectoral dynamic model of the UK energy-environment-economy (E3) system maintained by Cambridge Econometrics MDM-E3. The paper does so by describing the structure of the model and development of different versions of the sub-model, with an outline of the appliances and thermal characteristics of domestic buildings included.
The paper then goes on to explain how households use thermal energy services and describes the characteristics of the buildings and appliances which are included in the model. Finally the paper describes the data collection methodology used to update the model’s dataset from 1995 to 2004 for version 3. Such a description allows the reader to see how the model is structured and how the results of the model are generated, based on the historical data.
UK Energy Research Centre UKERC/WP/ESM/2007/008 II
1. Introduction and Overview
One of the objectives of the research under the Energy Modelling Theme of the UKERC is the review and development of models of energy use by the domestic sector. This paper describes the sub-model of household energy use in the UK, which is a component of Cambridge Econometrics’ Multisectoral Dynamic Model of the UK energy-environment-economy (E3) system, MDM-E3. The general model is a regional econometric model of the UK economy, which has been extended to incorporate six simulation sub-models for energy markets and atmospheric emissions, the electricity supply industry, CHP, domestic energy use (depending on the thermal properties of dwellings and the ownership and use of energy appliances within them), transport energy use and emissions, and waste arisings and emissions. The model solutions are dynamic, integrated and consistent across the sub-models.
The energy sub-model in MDM-E3 has 13 types of energy use (one of which is domestic energy use), 11 basic types of energy and 14 types of atmospheric emissions. It explains energy use by means of co-integrating econometric equations, estimated on annual data over the last 30 years, explaining domestic energy use in total and by energy carrier. The domestic energy sub-model can provide an alternative explanation to the econometric equations in the energy sub-model and is the focus of consideration here.
The domestic energy sub-model was originally developed by Johnstone (1994) and incorporated into MDM by Barker and Johnstone (1993). It was further developed by Bryden in a project “The Solar Millennium” commissioned by Forum for the Future from Cambridge Econometrics (Ekins et al., 2001). The description presented here relies heavily on this earlier work, and essentially consolidates and extends it for later information and newer econometric techniques. The main differences in the three versions of the sub-model are shown in Table 1.1.
The sub-model is a simulation model of the demand for delivered energy by the domestic sector. It is technology based with energy demand modelled by five income groups (quintiles) owning 41 types of energy appliance and 14 types of insulation. Its basic structure is shown in Figure 1.1.
UK Energy Research Centre UKERC/WP/ESM/2007/008 3
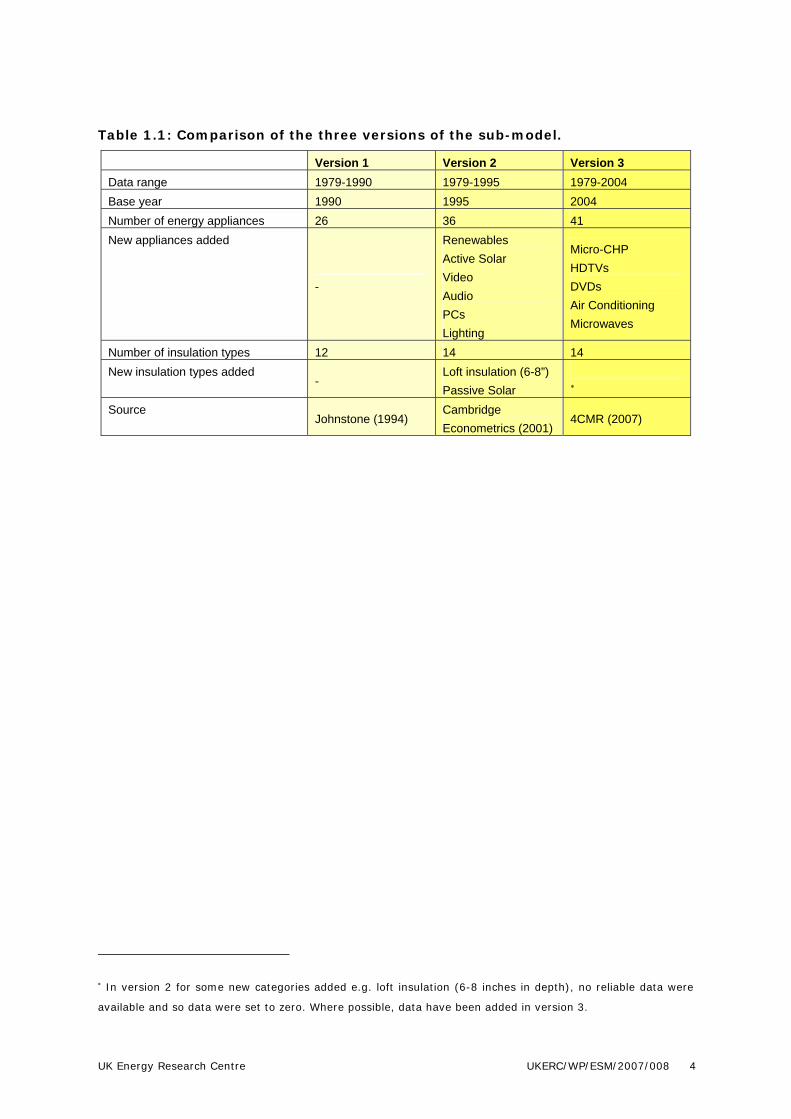
Table 1.1: Comparison of the three versions of the sub-model.
Version 1 Version 2 Version 3 Data range 1979-1990 1979-1995 1979-2004 Base year 1990 1995 2004 Number of energy appliances 26 36 41 New appliances added Renewables
Micro-CHP Active Solar
HDTVs Video
DVDs - Audio
Air Conditioning PCs
Microwaves Lighting
Number of insulation types 12 14 14 New insulation types added Loft insulation (6-8”)
- ∗Passive Solar Source Cambridge
Johnstone (1994) 4CMR (2007) Econometrics (2001)
∗ In version 2 for some new categories added e.g. loft insulation (6-8 inches in depth), no reliable data were
available and so data were set to zero. Where possible, data have been added in version 3.
UK Energy Research Centre UKERC/WP/ESM/2007/008 4

Figure 1.1: Structure of the MDM-E3 Domestic Energy Sub-model
Source: Adapted from Ekins et al. (2001)
The integration of the two types of modelling, the bottom-up technological approach used in this sub-model and the top-down econometric approach used in the rest of MDM-E3, is described in detail in Johnstone (1994). Figure 1.2 shows the main links between the domestic energy appliance sub-model and the energy and economic segments in MDM-E3. There are several stages to feedback:
1. The base cost of appliances and contractors’ charges used in the technological sub-model are adjusted using the price indices forecast in the economic model.
2. The prices of fuels employed in the decision rules in the technological sub-model are obtained from the energy sub-model.
3. The income levels employed in the determination of income-related ownership rates and internal temperature demand in the technological sub-model are derived from the economic forecasts of real households’ disposable income by quintile.
4. Supplementary expenditure on appliances and insulation generated by energy efficiency programmes are solved in the technological model and added to expenditures in the economic model.
5. Subsidies of appliances and insulation are added to government expenditure.
UK Energy Research Centre UKERC/WP/ESM/2007/008 5

6. There are three options for linking the household energy demand estimated in the energy sub-model with that simulated in the technological sub-model: (i) simulated demand is calibrated to estimated demand, (ii) estimated demand is calibrated on simulated demand, and (iii) the two solutions are run independently.
Figure 1.2: Links between the Domestic Energy Sub-model and rest of MDM-E3
Source: Solar Millennium Report (2001)
Within each class of energy appliance in the sub-model, energy consumption is determined by a set of decision rules related to several factors including: conversion efficiency (the ratio of available to delivered energy) and thermal efficiency (the ratio of delivered energy to useful energy), discussed in more detail in section 2; estimated functions related to factors such as ownership rates of appliances and insulation, internal temperature and available subsidies; and technological relationships which adjust base consumption rates. There is a different treatment of each set of appliances (space heating, water heating, electrical appliances, and cooking appliances), described in turn in section 3.
The results of the sub-model are useful as an input to calculations of average home energy ratings (SAP ratings) for each quintile, based on the methodology in Shorrock and Walters (1998). The Standard Assessment Procedure rates the energy efficiency of a dwelling on a scale of 1 to 120 (previously 1 to 100), where 1 indicates very poor energy efficiency and 120 extremely high. The rating depends on a number of factors including space and water heating costs, and standardised assumptions about occupancy, heating patterns, internal temperatures and climatic conditions.
UK Energy Research Centre UKERC/WP/ESM/2007/008 6

The energy appliances are divided into four broad categories of end use; space heating, water heating, electrical appliances and cooking appliances, and are listed in Table 1.2. They are characterised by cost, type of input fuel, fuel use, energy efficiency, working life and ownership level. Appliance energy use is also affected by the thermal efficiency of the housing stock, which depends on the ownership of the thermal characteristics listed in Table 1.3. These are characterised by cost, thermal efficiency, working life and ownership level. On the basis of the ownership rates of appliances and insulation types, desired household temperature, appliance efficiency and thermal efficiency, the total household energy consumption by fuel can be simulated.
Table 1.2: The classification of energy appliances in version 3 of the sub-model
1 Central Heating Gas 24 Cooking Gas (Oven/Hob) 2 Electricity 25 Electricity (Oven/Hob) 3 Oil 26 Microwave 4 Solids 5 Renewables 27 Electrical Washing Machine 6 Active Solar 28 Dryer 7 New CGB1 39 Dish Washer 8 Retrofit CGB1 30 Television 9 Micro-CHP 31 HDTV 32 Video 10 Partial Heating Gas 33 DVD 11 Electricity 34 Audio 12 Oil 35 PC 13 Solids 36 Air Conditioning 14 Renewables 37 Lighting 15 Active Solar 38 Freezer 39 Fridge 16 Water Heating Gas 40 Fridge-Freezer 17 Electricity 41 Miscellaneous 18 Oil 19 Solids 20 Renewables 21 Active Solar 22 New CGB1 23 Retrofit CGB1
Note(s): 1 CGB: condensing gas boiler. 2 New appliances are in bold
UK Energy Research Centre UKERC/WP/ESM/2007/008 7
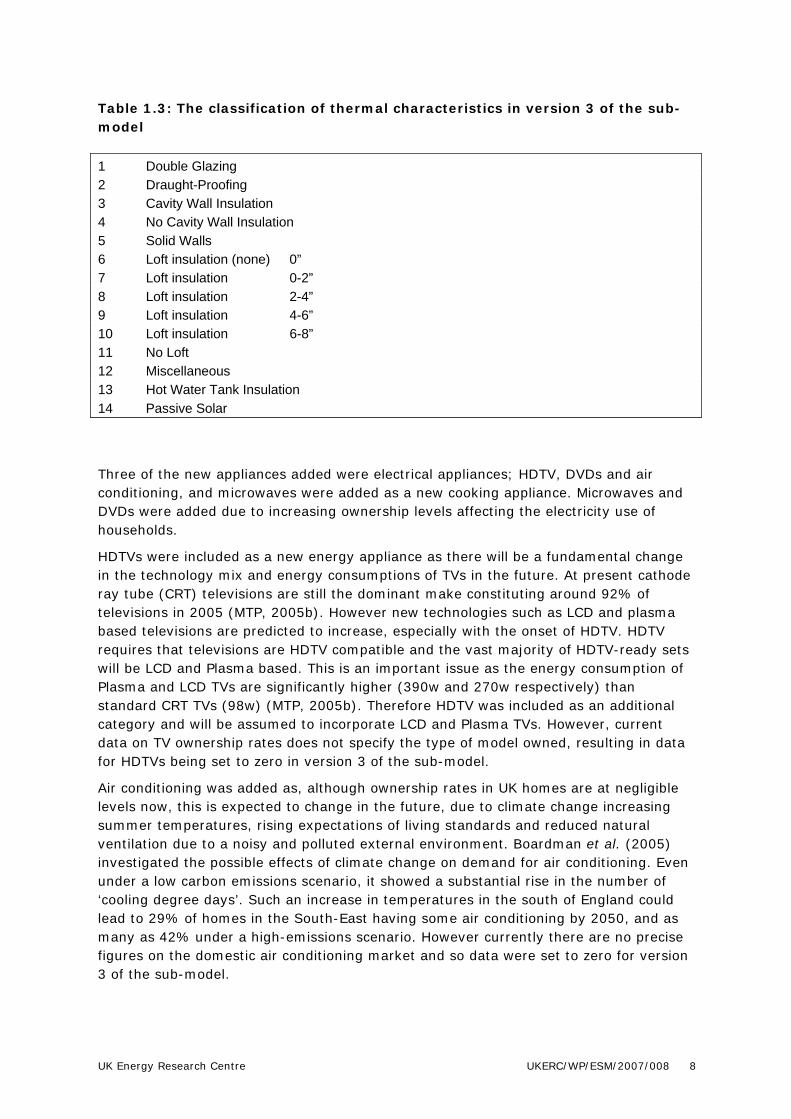
Table 1.3: The classification of thermal characteristics in version 3 of the sub-model
1 Double Glazing 2 Draught-Proofing 3 Cavity Wall Insulation 4 No Cavity Wall Insulation 5 Solid Walls 6 Loft insulation (none) 0” 7 Loft insulation 0-2” 8 Loft insulation 2-4” 9 Loft insulation 4-6” 10 Loft insulation 6-8” 11 No Loft 12 Miscellaneous 13 Hot Water Tank Insulation 14 Passive Solar
Three of the new appliances added were electrical appliances; HDTV, DVDs and air conditioning, and microwaves were added as a new cooking appliance. Microwaves and DVDs were added due to increasing ownership levels affecting the electricity use of households.
HDTVs were included as a new energy appliance as there will be a fundamental change in the technology mix and energy consumptions of TVs in the future. At present cathode ray tube (CRT) televisions are still the dominant make constituting around 92% of televisions in 2005 (MTP, 2005b). However new technologies such as LCD and plasma based televisions are predicted to increase, especially with the onset of HDTV. HDTV requires that televisions are HDTV compatible and the vast majority of HDTV-ready sets will be LCD and Plasma based. This is an important issue as the energy consumption of Plasma and LCD TVs are significantly higher (390w and 270w respectively) than standard CRT TVs (98w) (MTP, 2005b). Therefore HDTV was included as an additional category and will be assumed to incorporate LCD and Plasma TVs. However, current data on TV ownership rates does not specify the type of model owned, resulting in data for HDTVs being set to zero in version 3 of the sub-model.
Air conditioning was added as, although ownership rates in UK homes are at negligible levels now, this is expected to change in the future, due to climate change increasing summer temperatures, rising expectations of living standards and reduced natural ventilation due to a noisy and polluted external environment. Boardman et al. (2005) investigated the possible effects of climate change on demand for air conditioning. Even under a low carbon emissions scenario, it showed a substantial rise in the number of ‘cooling degree days’. Such an increase in temperatures in the south of England could lead to 29% of homes in the South-East having some air conditioning by 2050, and as many as 42% under a high-emissions scenario. However currently there are no precise figures on the domestic air conditioning market and so data were set to zero for version 3 of the sub-model.
UK Energy Research Centre UKERC/WP/ESM/2007/008 8

The other new energy appliance added was Micro-generation, or Micro-CHP. One of the previous limitations of the model was that domestic energy choices available were simple and unrealistic and so Micro-CHP was added as a new technology option. Micro-CHP has the potential to deliver significant energy savings at the customer side of the meter. Although units are now on sale in the UK, current activity is more akin to a market trial, with actual installations in 2005 in the region of hundreds (Slowe, 2006). However, there is a large potential market for Micro-CHP and there is confidence that products will be ready to market more vigorously by 2007 or 2008. Due to limited data on Micro-CHP data were set to zero in version 3 of the sub-model.
2. Household Thermal Energy Services
The importance of distinguishing between the fuel, the appliance, and the household energy service (e.g. space heating, light) when discussing energy demand can be illustrated by distinguishing between delivered energy, available energy and useful energy. Energy delivered is simply a measure of energy units delivered to the dwelling. Available energy refers to the amount of energy which the appliance is able to process into the particular energy service demanded. It is determined by the amount of delivered energy and the conversion efficiency of the appliance. Useful energy, which is primarily relevant for thermal energy uses (space and water heating), is a measure of the energy which is actually used in the provision of such services. It is determined by the amount of energy available and the thermal efficiency of the material in question (EEO, 1990).
Figure 2.1 is a graphical representation of the relationship between delivered energy, available energy, and useful energy.
UK Energy Research Centre UKERC/WP/ESM/2007/008 9

Figure 2.1: The relationship between delivered energy, available energy and useful energy in the domestic sector
Source: Barker & Johnstone (1993)
The upper right quadrant depicts two heat-generating systems with different levels of conversion efficiency, with household 2 (HH2) being relatively more efficient. The greater the efficiency the more available energy is provided for a given input of delivered energy. Conversion efficiency for a given heat-generating system tends to increase (d[ae]/d[de] > 0) until the capacity of the system is reached (EEO, 1990). These values for available energy can then be transformed into values for useful energy depending on the thermal efficiency, with household 2 once again being more efficient.
The shape of this function depends upon the specific thermal conductance characteristics of the material but, beyond a certain point, it is quite likely that an increasing proportion of heat is diffused from the dwelling or hot water cylinder (d[ue]/d[ae] <0) as the internal temperature becomes increasingly greater than the external temperature (EEO, 1990). Transposing the values for useful energy in the lower left quadrant the relationship between delivered energy and useful energy can then be depicted in the lower right quadrant, showing energy efficiency.
Therefore it is necessary to define precisely the factors that the final thermal energy service is dependent upon: the thermal conductance of the dwelling, the amount of incidental thermal gain and loss, the quantities of different types of fuel consumed, and the efficiency of the heating appliances used. So, for example, assuming given levels of incidental thermal gains, space and water heating will depend upon the ambient
UK Energy Research Centre UKERC/WP/ESM/2007/008 10
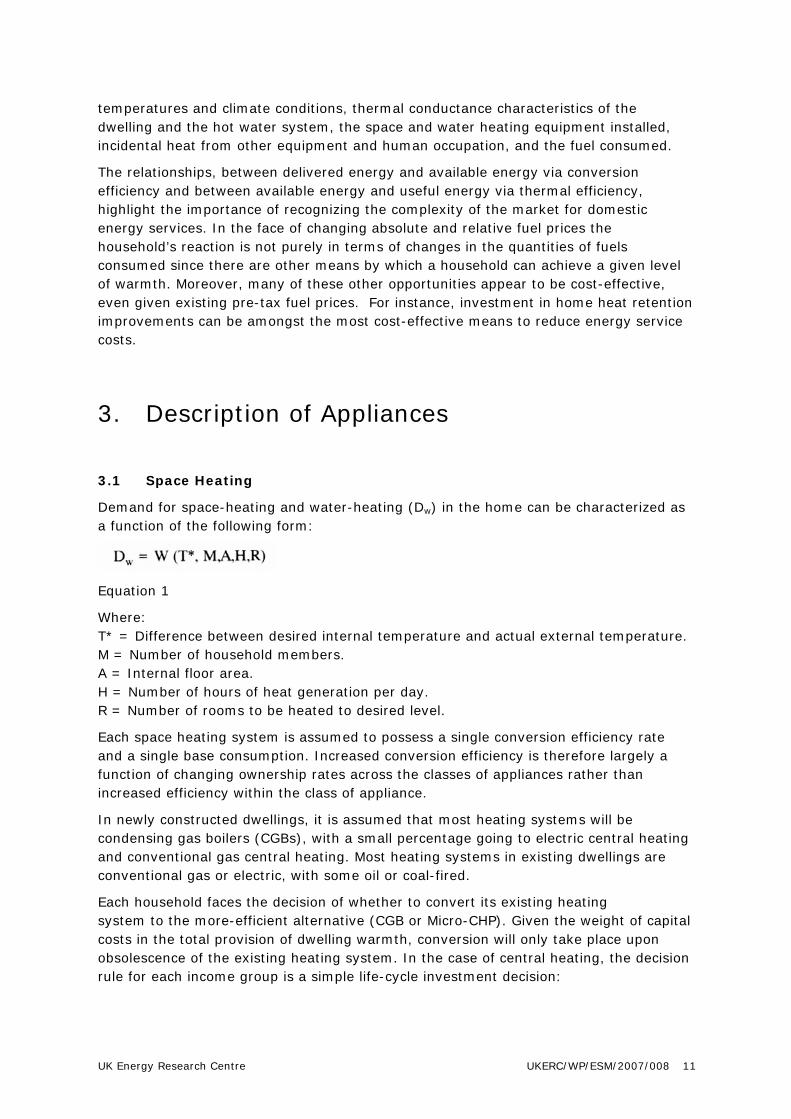
temperatures and climate conditions, thermal conductance characteristics of the dwelling and the hot water system, the space and water heating equipment installed, incidental heat from other equipment and human occupation, and the fuel consumed.
The relationships, between delivered energy and available energy via conversion efficiency and between available energy and useful energy via thermal efficiency, highlight the importance of recognizing the complexity of the market for domestic energy services. In the face of changing absolute and relative fuel prices the household’s reaction is not purely in terms of changes in the quantities of fuels consumed since there are other means by which a household can achieve a given level of warmth. Moreover, many of these other opportunities appear to be cost-effective, even given existing pre-tax fuel prices. For instance, investment in home heat retention improvements can be amongst the most cost-effective means to reduce energy service costs.
3. Description of Appliances
3.1 Space Heating
Demand for space-heating and water-heating (Dw) in the home can be characterized as a function of the following form:
Equation 1
Where: T* = Difference between desired internal temperature and actual external temperature. M = Number of household members. A = Internal floor area. H = Number of hours of heat generation per day. R = Number of rooms to be heated to desired level.
Each space heating system is assumed to possess a single conversion efficiency rate and a single base consumption. Increased conversion efficiency is therefore largely a function of changing ownership rates across the classes of appliances rather than increased efficiency within the class of appliance.
In newly constructed dwellings, it is assumed that most heating systems will be condensing gas boilers (CGBs), with a small percentage going to electric central heating and conventional gas central heating. Most heating systems in existing dwellings are conventional gas or electric, with some oil or coal-fired.
Each household faces the decision of whether to convert its existing heating system to the more-efficient alternative (CGB or Micro-CHP). Given the weight of capital costs in the total provision of dwelling warmth, conversion will only take place upon obsolescence of the existing heating system. In the case of central heating, the decision rule for each income group is a simple life-cycle investment decision:
UK Energy Research Centre UKERC/WP/ESM/2007/008 11

Equation 2
Where: NPVCGB = net present value of investment in CGB MCCGB = marginal cost of CGB WLi = working life of appliance i FUi = fuel consumption of appliance i PRi = price of fuel associated with appliance i DR = discount rate
If the net present value of the investment is positive then the household will purchase the more efficient CGB or Micro-CHP unit. In effect the rule is equivalent to perfect foresight, but the high ratio of capital costs to running costs generates a significant lag in consumer response. Conversion rates are further constrained by imposed minimum ownership levels for each class of appliance, and the ownership levels are calibrated on historical data. Any available subsidies act to reduce the marginal cost of the CGB and hence boost conversion, though the lag in consumer response is not overcome.
The treatment of partial heating systems is rather different, since changes in the level of ownership are assumed not to be a function of the cost effects of relative conversion efficiencies, but are instead related to income levels. A logistic function is employed, where ownership levels are a function of real household disposable income and imposed minimum and maximum ownership rates.
Equation 3
The parameters in the equation are estimated on historical data, and are kept constant in the forecast period, when the equation is solved for the ownership rate.
Within each category of space heating system simultaneous decisions are taken with respect to thermal efficiency. Thermal efficiency is expressed in terms of relative u-values, a measure of the ability of the dwelling fabric to retain the heat which is generated within the home by the heating appliances (in watts per square metre per degree differential between internal and external temperatures, W/m2K, therefore a high u-value suggests a high heat loss and a low u-value suggests a low heat loss). The effect of ventilation is captured by a measure of air changes per hour, which is normalised such that it can be expressed in equivalent units to u-values. Passive solar design of new dwellings could be expressed in terms of negative u-values, for which reason it has been included in the classification of thermal characteristics. In addition to the structural characteristics of the dwelling, fabric heat loss is largely a function of the level of investment in loft insulation, cavity wall insulation and double glazing.
UK Energy Research Centre UKERC/WP/ESM/2007/008 12

The household is faced with a decision rule for each thermal characteristic similar to that employed for heating appliances. The basic rule is again a calculation of net present value based on internal temperature (assumed to be a function of income), capital and running costs, available subsidies effectively lowering the capital cost, dwelling characteristics and relevant technological parameters.
Equation 4
Where: NPVimp = net present value of investment in improved insulation MCimp = marginal cost of improved insulation WLj = working life of insulation type j DR = discount rate FU = consumption for heating PR = fuel price ITE = internal temperature effect Aj = area of dwelling affected UV = effect of u-value improvement imp,j
If the net present value of the investment is positive then the household will improve its thermal efficiency by investing (irreversibly) in the relevant thermal efficiency characteristic. However, this basic rule must be adjusted slightly to take account of the differing characteristics of each insulation type. For example, double glazing ownership is taken to be a function of income as well as efficiency. The proportion of dwellings with solid walls and no lofts are estimated on the basis of historical trends. For non-solid walls, the decision is whether or not to invest in cavity wall insulation. For dwellings with lofts, the decision is whether to move from less than full insulation (0”, 0-2”, 2-4” or 4-6”) to full (6-8”) insulation.
The ownership rates of thermal characteristics of dwellings are then used to calculate the thermal efficiencies of the dwellings which own each type of space heating appliance. Overall energy consumption per dwelling with each type of appliance can be determined on the basis of thermal efficiency, base energy consumption and internal temperature demand.
3.2 Water heating
Water heating consumption is also determined on the basis of ownership levels, base energy consumption and thermal efficiency. As is the case with space heating, changes in conversion efficiency are reflected in changes in ownership levels across classes of appliance rather than within each class of appliance. Given the difficulties involved in distinguishing between fuels consumed in space heating and in water heating and the
UK Energy Research Centre UKERC/WP/ESM/2007/008 13

prevalence of combined central space-water heating systems, changes in water heating ownership levels are taken to be a function of changes in the corresponding central heating ownership levels, the proportion of combined systems, and the proportion of independent water heating systems.
There is potential for improved thermal efficiency in water heating, through investment in hot water tank insulation and pipe lagging. The decision rule is analogous to the rule described above for investment in other forms of insulation.
3.3 Electric appliances
The sub-model distinguishes between 15 specific electrical appliances (Table 1.2). Ownership levels are mainly based on historical data from the Expenditure and Food Survey (previously the Family Expenditure Survey). Future ownership levels are estimated using a logistic function similar to equation 4, with real households’ disposable income taken to be the explanatory variable and a maximum ownership rate imposed.
Unlike space heating systems, improved efficiency is not a result of changing ownership rates of classes of appliances but is a function of improved efficiency of appliances. Thus, upon obsolescence of an existing appliance, the household is faced with a decision rule based upon the difference in capital costs and running costs between the more and less energy-efficient alternatives, and any available subsidy effectively lowering the price of the more efficient alternative. If the net present value of the more efficient alternative is higher than that of the less efficient alternative, the household will invest in the more efficient alternative.
Equation 5
Where:
NPVeff = net present value of investment in efficient alternative MCeff = marginal cost of efficient alternative WLi = working life of appliance i FU = base fuel consumption REi = relative efficiency of efficient alternative DR = discount rate
3.4 Cooking appliances
Total ownership of cooking appliances is assumed to be a function of income levels. The sub-model distinguishes between electric and gas cooking appliances. Observation of the data shows that the proportions of electric and gas hobs and ovens have changed very little in recent years, however ownership rates of microwaves have increased significantly.
UK Energy Research Centre UKERC/WP/ESM/2007/008 14

4. Off-Model Analysis and Data Collection
The domestic energy sub-model requires a large amount of data, disaggregated by type of appliance or insulation, occasionally by both, often by five income groups, and possibly as a time series. Unlike data for UK energy demand, sourced from DUKES, there is no one standard source of detailed data on domestic energy demand. The required data are drawn from a large number of publications, listed in the references. To ensure consistency in the data used in the sub-model the base year was set to 2004, with additional data collected from 1996-2004. In some instances new reports were available which updated previous reports used and where possible data was sourced from here, however in some instances completely new sources of data were used. The time series data and data disaggregated by income group were particularly difficult to collect and where this was the case it was necessary to impute the required disaggregation by quintile or extrapolate the data set for missing years.
The principal sources of data on ownership and efficiency of energy appliances used in version 3 of the sub-model were:
The Expenditure and Food Survey for data by income group
Publications from the Building Research Establishment
The DTI’s UK Domestic Energy Consumption Report
Publications from the Environmental Change Unit, University of Oxford
Reports from the Market Transformation Programme
The General Household Survey
The principal sources of data on ownership and thermal efficiency of insulation types used in version 3 of the sub-model were:
Publications of the Building Research Establishment
The English House Condition Survey
Reports from Defra
The sections below describe the data collection in more detail, looking firstly at the background requirements and sources, then at the sources and methodology used to collect the data for each type of energy appliance and insulation.
UK Energy Research Centre UKERC/WP/ESM/2007/008 15

4.1 Background data
The sub-model requires data for a number of ‘drivers’ of domestic energy demand, in order to estimate their impacts on both ownership and efficiency of appliances and insulation.
Temperature and fuel prices data are used in the energy sub-model of MDM-E3, and are sourced from DUKES. UK average real households’ disposable income is a variable in the economic model, and data are taken from the National Accounts. Disposable income by income group is used only in the domestic sub-model, and sourced from the Expenditure and Food Survey (Previously called the Family Expenditure Survey). The number of households is based on data in Economic Trends and the UK government’s household estimates and projections to 2020.
4.2 Data for Energy Appliances
4.2.1 Space heating
Ownership rates of central heating were updated for gas, electricity, solid and oil heating using data from the DTI UK Domestic Energy Consumption Report (DTI, 2006) and the BRE Domestic Energy Factfile (Utley and Shorrock, 2006) to extend data from 1996 to 2004. Data on ownership by income quintile group were taken from the EFS/FES.
Data for partial heating ownership rates were taken from DTI (2006) and Utley & Shorrock (2006). No data on income groups were available for partial heating and so income quintiles were extrapolated from earlier data.
Data on Condensing Gas Boilers (CGBs) as a percent of total gas central heating were taken from Shorrock and Utley (2003, Table 23). Previously no data had been included for this category, and ownership rates are still very low, however, from 1st April 2005 all new boilers should be replaced with high efficiency CGBs and therefore ownership rates can be expected to rise dramatically. The percentage breakdown by retrofit or new CGBs was taken from data available from the Market Transformation Programme (2005a). Total ownership and boiler installation data were available, with retrofit CGB assumed to be the difference between total CGB and boiler installations. Data was included from 1997 to 2001 and then extrapolated from 2002-2004. Ownership by income quintile data was assumed to be the same as that for gas central heating as no additional information was available.
In most cases updating data for total costs of central heating appliances was very difficult due to a number of factors originally identified in version 2 of the sub-model. Firstly, changes in model types and ranges, production methods, and technology meant that like could not be compared with like. Secondly, many new houses built have heating systems installed as standard fittings and included in the cost of the dwelling. Thirdly, the cost of retro-fitting central heating systems can vary greatly depending on the model used. Costs vary according to the house size, shape and any physical problems that have to be overcome in fitting a system. Hence the standard costs used for the 1995 base year in version 2 of the sub-model were adjusted to 2004 prices. Marginal costs (that is the extra cost required to purchase an energy efficient alternative), were also adjusted from 1995 to 2004 prices. The exceptions were gas
UK Energy Research Centre UKERC/WP/ESM/2007/008 16
central heating, with data available on total and marginal costs from ECI (2000a) and Micro-CHP with costs available from COGEN Europe (2005) converted to 2004 prices. The marginal cost for Micro-CHP is calculated as the additional cost of installing Micro-CHP compared to a standard Gas boiler.
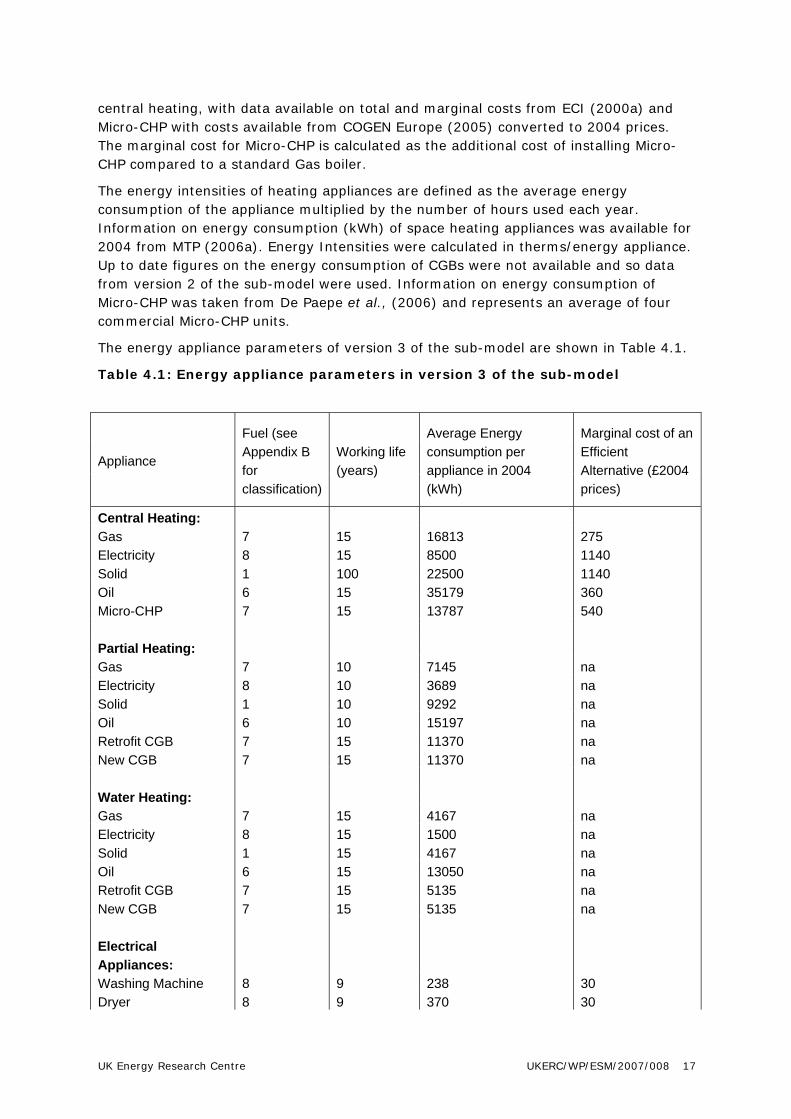
The energy intensities of heating appliances are defined as the average energy consumption of the appliance multiplied by the number of hours used each year. Information on energy consumption (kWh) of space heating appliances was available for 2004 from MTP (2006a). Energy Intensities were calculated in therms/energy appliance. Up to date figures on the energy consumption of CGBs were not available and so data from version 2 of the sub-model were used. Information on energy consumption of Micro-CHP was taken from De Paepe et al., (2006) and represents an average of four commercial Micro-CHP units.
The energy appliance parameters of version 3 of the sub-model are shown in Table 4.1.
Table 4.1: Energy appliance parameters in version 3 of the sub-model
Fuel (see Appendix B for classification)
Average Energy consumption per appliance in 2004 (kWh)
Marginal cost of an Efficient Alternative (£2004 prices)
Working life (years)
Appliance
Central Heating: Gas 7 15 16813 275 Electricity 8 15 8500 1140 Solid 1 100 22500 1140 Oil 6 15 35179 360 Micro-CHP 7 15 13787 540
Partial Heating: Gas 7 10 7145 na Electricity 8 10 3689 na Solid 1 10 9292 na Oil 6 10 15197 na Retrofit CGB 7 15 11370 na New CGB 7 15 11370 na
Water Heating: Gas 7 15 4167 na Electricity 8 15 1500 na Solid 1 15 4167 na Oil 6 15 13050 na Retrofit CGB 7 15 5135 na New CGB 7 15 5135 na
Electrical Appliances: Washing Machine 8 9 238 30 Dryer 8 9 370 30
UK Energy Research Centre UKERC/WP/ESM/2007/008 17

Dishwasher 8 9 309 31 TV 8 10 168 11 HDTV 8 10 465 na Video 8 7 56 11 DVD 8 7 47 na Audio 8 9 30 na PC 8 6 195 na Air Conditioning 8 10 600 240 Lighting 8 6 720 0 Freezer 8 11 409 43 Fridge 8 11 254 31 Fridge/freezer 8 11 518 47 Misc, electric appl. 8 0 180 na
Cooking Appliances: Gas (Oven/Hob) 7 15 771 50 Electricity (Oven/Hob) 8 12 484 50 Microwave 8 7 112 50
Up to date information on working lives of heating appliances were not available and so data was assumed the same as that used in version 2 of the sub-model.
4.2.2 Water heating
Reliable data had previously not been available for water heating. In many cases water heating is a function of ownership of the central heating system, and is not often a stand-alone system. In version 2 of the sub-model it was assumed that all new houses and the majority of new installations in old houses would not have separate water heating systems and data were therefore assumed to have remained the same from 1990-1996.
Although data on water heating appliances is still limited a report by ECI (2000a, Appendix M) did have water heating ownership, by fuel type, for the year 1996. The new UK averages for 1996 differed significantly from the original data for ownership of electricity and gas water heating, due the data in version 2 of the sub-model remaining constant from 1990-1996. Data was therefore updated for 1996 and new trends interpolated between 1990 and 1996. Data was assumed to have remained constant from 1996 to 2004. Data for CGBs were assumed to be the same as that for heating as no additional information was available.
Ownership rates by income quintile were determined on the basis of the percentage of ownership of same fuel central heating systems, the percentage of combined space-water heating systems and the percentage of independent systems by fuel.
Information on energy intensity of water heating was taken from MTP (2007). Up to date figures on the energy consumption of CGBs were not available and so data from version 2 of the sub-model were used.
Up to date information on working lives were not available and so data was assumed the same as that used in version 2 of the sub-model.
UK Energy Research Centre UKERC/WP/ESM/2007/008 18
4.2.3 Cooking Appliances
Cooking appliances include hobs and ovens powered by gas or electricity. As in the previous version, there is still limited data on the breakdown of cooking appliance by fuel type. Ownership rates of electrical cooking appliances were available from DTI (2006) from 1979-2004. Limited data was also available on ownership of gas cookers from the Market Transformation Programme (2006b) for 2000-2004, and ECI (2000b) for 1998. Data had previously remained static from 1979 to 1996 and so the entire data set was updated to new UK averages and the ownership of gas fuelled cookers extrapolated back to 1979. No data was available by income group and so the original income quintile data was used, adjusted to the new UK averages.
Unlike previously, ownership of microwave ovens was included as a separate appliance. This was in order to take account of the increasing ownership rates of microwaves, which differed significantly from the ownership rates of conventional electric ovens and hobs. Data on UK averages were available from DTI (2006), and income quintile data taken from the FES/EFS for 1997-2004.
Information on energy consumption of cooking appliances in 2004 was obtained from MTP (2006) and information on hours used were taken from the Carbon Footprint website (2007), generated from manufacturers data.
Information on working lives of cooking appliances were taken from Cooper (2005), from a report on product life spans, which updated previous estimates used in version 2 of the sub-model.
4.2.4 Electrical appliances
Lighting was assumed to comprise of standard general lighting service bulbs, with an average of 24 bulbs per house. The conversion efficiency of lighting, measured in terms of light provided (lumens) per watt (lm/W), was assumed to be the same as that used in version 2 of the sub-model estimated from the ECI report, DELight (1998, Table 2-I). Standard bulbs were assumed to have an efficiency of 6-18 lm/W and Compact Fluorescent Light bulbs (CFLs) of 42-82. Assuming that 100% efficiency is equivalent to 340 lm/W, standard bulbs have an efficiency of 1.8-5.3% and CFLs of 12-24%.
CFLs produce the same amount of light as an incandescent light bulb whilst consuming around 75-80% of the electricity, and are therefore a very viable energy-efficient alternative. The costs of CFLs are now very cheap with many types no more expensive than the standard inefficient equivalent. Information on the costs of CFLs were taken from the Energy Saving Trust (2007) and Shorrock et al. (2005).
Appliance ownership data for wet and brown appliances were taken from the FES/EFS and disaggregated into income quintiles annually1. This was done for wet appliances (washing machines, dryers and dishwashers) and brown appliances (TVs, Videos, DVDs,
1 Ownership rates do not currently take account of over saturation of products i.e. households owning more
than one of the same appliance.
UK Energy Research Centre UKERC/WP/ESM/2007/008 19
Audio, and PCs) with data supported by results from the General Household Survey (ONS, 2005).
DVDs were added as a new appliance, however data were only available from 2002 to 2004, with data on incomes taken from the FES/EFS, and supported by the General Household Survey. Since the introduction of DVD players in the late 1990s ownership rates have increased dramatically from around 13% in 2000 to around 66% in 2004. This rise in sales also reflects a corresponding decline in the ownership of video recorders since 2001.
UK ownership rates of cold appliances (fridges, freezers, fridge-freezers) were taken from DTI (2006). Cold appliance data were completely updated from 1979 to 2004 due to anomalies in the old data and inconsistencies with the new data. Averages for UK ownership rates were also supported by Boardman et al. (1995).
Data on ownership by income was calculated annually from 1979-2004 from the FES/EFS. Data for fridges were only available from 1979 to 1999 (after which they were not included in the survey), and data for freezers and fridge-freezers from 1979 to 1996 (after which these two appliances were combined). Therefore data by income quintile was extrapolated from earlier data for these years.
Information on energy consumption of electrical appliances were taken from MTP (2006), Boardman et al. (2005), and various MTP briefing notes available online. Information on hours used were available from the Carbon Footprint (2007). Energy intensities of cold appliances were also supported by data from Tables B8-11 of Shorrock et al. (2005).
Appliance costs were based on average prices of mid-range products currently on the market sourced from online retailers. The EU energy labelling system by manufacturers and retailers of wet and cold appliances were used to estimate costs of the energy efficient alternative, considering an upgrade to an A rated appliance as the standard for the energy efficient alternative. The Energy Saving Trust Energy saving recommended labelling system was used to investigate marginal costs of energy efficient brown appliances. Some marginal costs of energy efficient appliances were also available from Shorrock et al. (2005, Appendix A), and converted to 2004 prices.
Information on electrical appliances working lives were taken from Cooper (2005).
4.3 Data for thermal characteristics
Data on the working lives of insulation were updated from Defra (2006), and supported by Table A1 of Shorrock et al. (2005). Costs of thermal measures were available from Shorrock et al. (2005), supported by the Energy Saving Trust (2007). Information on the U-values of no insulation and full insulation measures were updated from Defra (2007). Information was also available from Shorrock and Utley (2003, page 30) on the u-values of new dwellings.
The average heat loss through windows, ventilation, roofs and walls were taken from Table 19 of Shorrock and Utley (2003) for 1979-2001, with data extrapolated to 2004. There were slight discrepancies in the old data set and so data was updated to the new
UK Energy Research Centre UKERC/WP/ESM/2007/008 20

UK averages. No information on ownership by income quintile was available and so trends were extrapolated from the earlier data.
Up to date information on the area (m2) of thermal characteristics were not available, and so data for double glazing, draught proofing, cavity wall insulation and loft insulation were assumed to be the same as used in version 2 of the sub-model, taken from Pezzey (1984) and Shorrock and Pezzey (1992).
Insulation parameters for version 3 of the sub-model are shown in Table 4.2
Table 4.2: Insulation parameters in version 3 of the sub-model
U-value no insulation (W/m
U-value full insulation (W/m
Marginal cost of full insulation (£2004)
Area of dwelling (m
Working life (years)
Insulation Type 2) 2 2K) K)
Double glazing 20 84 2.8 1.55 4320 Draught proofing 20 335 1.4 0.5 118 Cavity wall insulation 40 345 1.1 0.42 324 Cavity wall no insulation 80 345 1.1 0.42 324 Solid walls 80 345 2.1 0.35 1414 Loft insulation 0” 40 210 2.3 0.2 295 Loft insulation 0-2” 40 210 2.3 0.2 240 Loft insulation 2-4” 40 210 2.3 0.2 215 Loft insulation4-6” 40 210 2.3 0.2 184 Loft insulation 6-8” 40 210 2.3 0.2 145 No loft 80 210 0 0 0 Hot water tank jacket 10 0 1 0.3 24 Miscellaneous 0 0 0 0 0
4.3.1 Double glazing
UK ownership rates for double glazing were taken from Table 33 of Utley & Shorrock (2006). Data from the EHCS (1996, 2001, 2003 and 2004) were used to provide ownership rates by income quintile, but were only available for these years. However as the breakdown by income quintile group differed significantly from the original data it was decided that this newer data would give a more accurate reflection and was extrapolated for missing years between 1979-2004.
4.3.2 Draught proofing
UK ownership rates of draught proofing were available from Table 38 of Utley & Shorrock (2006), however this data also included ownership of double glazing, as double glazing usually makes draught proofing unnecessary by providing an air tight seal. To avoid double counting, double glazing ownership was removed from the ownership figures to give households with additional draught proofing only. Figures
UK Energy Research Centre UKERC/WP/ESM/2007/008 21

were therefore re-estimated from 1979-2004, for full and partial draught proofing. This meant that as double glazing ownership increases the need for additional draught proofing decreases. Income quintile data was adjusted to UK averages and extrapolated from original data.
4.3.3 Cavity wall insulation
Annual UK ownership rates for cavity wall insulation were taken from Table 28 of Utley & Shorrock (2006). Original data from 1979 to 1996 for houses with no cavity wall insulation differed significantly from that of the new data set and so data were updated assuming the recent data to be more accurate. Income quintiles were adjusted to the revised UK averages and extrapolated from the original data, supported by the EHCS (2001 and 2004). Data on houses with solid walls were also updated from 1996 to 2004 from Table 28 of Utley & Shorrock (2006), with the number of households with solid walls taken to be the difference between the total number of households and those with the potential for cavity wall insulation.
4.3.4 Loft insulation
Annual UK ownership rates for loft insulation were taken from Table 23 of Utley & Shorrock (2006), for six categories, including no insulation and no loft. No loft was assumed to be the difference between the total number of houses and the potential houses which could have loft insulation. Income quintile data was extrapolated from previous trends and supported by the EHCS (1996, 2001, 2003 and 2004).
The category 4-6” previously only had data from 1991 onwards and no breakdown by income quintile group. This was updated to 2004 with income quintile data taken from the EHCS (1996, 2001, 2003 and 2004) and trends extrapolated back to 1991. The category 6-8” was not previously included in the analysis and so ownership by income quintile was added from 1996 to 2004 with data taken from the EHCS (1996, 2001, 2003 and 2004), and interpolated for missing years.
4.3.5 Hot-water tank insulation
Annual UK ownership rates for hot water tank insulation were taken from Table 43 of Utley & Shorrock (2006), with income quintile data extrapolated from previous trends and supported by the EHCS (1996, 2001, 2003 and 2004). Version 3 of the sub-model does not take into account different thicknesses of hot-water tank insulation due to a lack of detailed data, however BRE reported that 74% of houses had insulation of 3” or more in 2004.
UK Energy Research Centre UKERC/WP/ESM/2007/008 22

References
Barker, T. & Johnstone, N. (1993) Equity and efficiency in policies to reduce carbon emissions in the domestic sector. Energy and Environment, 4, 335-361.
Boardman, B., Darby, S., Killip, G., Hinnells, M., Jardine, C. N., Palmer, J. & Sinden, G. (2005) 40% House. Environmental Change Institute, University of Oxford.
Boardman, B., Favis-Mortlock, D., Hinnells, M., Lane, K., Milne, G., Palmer, J., Small, E., Strang, V. & Wade, J. (1995) DECADE- Domestic Equipment and Carbon Dioxide Emissions. 2nd Year Report. Environmental Change Institute, University of Oxford.
Building Research Establishment (2006) Energy use in homes - A series of reports on domestic energy use in England - Thermal Insulation. London, BRE.
Carbon Footprint (2007) Household Energy Consumptions. Available at: http://www.carbonfootprint.com/energy_consumption.html.
COGEN Europe (2005) Micro-CHP Fact Sheet United Kingdom. COGEN Europe.
Cooper, T. (2005) Slower Consumption: Reflections on Product Life Spans and the 'Throwaway Society’. Journal of Industrial Ecology, 9, 51-67.
De Paepe, M., D'Herdt, P. & Mertens, D. (2006) Micro-CHP systems for residential applications. Energy Conservation and Management, 47, 3435-3446.
Defra (2006) The first draft Illustrative Mix of measures for the Energy Efficiency Commitment 2008-11. Defra, London.
Defra (2007) Energy, cost and carbon saving calculations for the draft EEC 2008-11 Illustrative Mix. Defra, London.
DTI (2006) Energy Consumption in the United Kingdom. Department of Trade and Industry, London.
Ekins, P., Cotton, R., Russell, A. & Hargreaves, C. (2001) Sustainable Energy for the UK: the Economic and Environmental Implications to 2020 of a Sustainable Energy Strategy for the UK. London, Final Report of the Solar Millennium Project of Forum for the Future.
Energy Efficiency Office (1990) Energy Use and Energy Efficiency in the UK Domestic Sector. HMSO, London.
Energy Saving Trust (2007) Savings Assumptions. Available at: http://www.est.org.uk/myhome/assumptions/.
Environmental Change Institute (ECI) (2000a) Lower Carbon Futures. University of Oxford.
UK Energy Research Centre UKERC/WP/ESM/2007/008 23

Environmental Change Institute (ECI) (2000b) Country Pictures. University of Oxford.
Environmental Change Unit (1998) DELight. University of Oxford.
Johnstone, N. (1994) The integration of Bottom-up and Top-down Modelling of CO2 emissions: Description of a Sectoral Analysis Department of Applied Economics, University of Cambridge, Discussion Paper no. 10.
Market Transformation Programme (2005a) The domestic heating boiler energy model: Methods and Assumptions. Briefing Note BNDH11, MTP.
Market Transformation Programme (2005b) Televisions: Future Stock and Energy Trends. Briefing Note BNTV01, MTP.
Market Transformation Programme (2006a) Sustainable Products 2006: Policy Analysis and Projections. Market Transformation Programme.
Market Transformation Programme (2006b) Assumptions underlying the energy projections of cooking appliances. Market Transformation Programme.
Market Transformation Programme (2007) Water heaters: proposed energy labelling directives. BNDH17, MTP.
ONS (1996, 2001, 2003 & 2004,) English House Condition Survey. London, Office of National Statistics.
ONS (2005) General Household Survey, 2004. In Office for National Statistics (Ed.), Available at: http://www.statistics.gov.uk/StatBase/Product.asp?vlnk=5756.
ONS (annual) Expenditure and Food Survey (Previously the Family Expenditure Survey). The Stationery Office, London.
Pezzey, J. (1984) An economic assessment of some energy conservation measures in housing and other buildings. Building Research Establishment.
Shorrock, L. D., Henderson, J. & Utley, J. I. (2005) Reducing Carbon Emissions from the UK Housing Stock. London, BRE.
Shorrock, L. D. & Utley, J. I. (2003) Domestic Energy Factfile 2003. London, BRE.
Shorrock, L. D. & Walters, G. A. (1998) Domestic Energy Factfile 1998. Building Research Establishment.
Slowe, J. (2006) Micro-CHP to increase energy efficiency: Emerging technologies, products and markets. Energy efficiency in domestic appliances and lighting conference.
Utley, J. I. & Shorrock, L. D. (2006) Domestic Energy Fact File 2006. London, BRE.
UK Energy Research Centre UKERC/WP/ESM/2007/008 24

Annex A: Data Sources for Version 1 and 2 of the Domestic energy sub-model
DECADE (1994) DECADE - Domestic Equipment and Carbon Dioxide Emissions. 1st Year Report. Energy and Environment Programme, Environmental Change Unit, Oxford.
DECADE (1995) DECADE - Domestic Equipment and Carbon Dioxide Emissions. 2nd Year Report. Energy and Environment Programme, Environmental Change Unit, Oxford.
DECADE (1997a) DECADE - Transforming the UK Cold Market. Energy and Environment Programme, Environmental Change Unit, Oxford.
DECADE (1997b) 2MtC: DECADE - Domestic Equipment and Carbon Dioxide Emissions. 4th Year Report. Energy and Environment Programme, Environmental Change Unit, Oxford.
DoE (1991) English House Condition Survey HMSO.
DoE (1995) Projections of Households in England to 2016. HMSO.
DTI (1997) Energy Consumption in the United Kingdom: A Statistical review of delivered and primary energy consumption by sub-sector, end-use and factors effecting change. TSO.
Energy Efficiency Office (1990) Energy Use and Energy Efficiency in the UK Domestic Sector. HMSO, London.
Energy Saving Trust (1997) Energy Efficiency and Environmental Benefits to 2010. Energy Saving Trust.
ETSU (1990a) Efficiency in Domestic Appliances. HMSO.
ETSU (1990b) Energy Use and Energy Efficiency in the UK Domestic Sector. HMSO.
Gas Consumers' Council (Various Years) Expenditure on Fuels, London, GCC.
Shorrock, L. G. & Henderson, G. (1990) Energy Use in Buildings and Carbon Dioxide Emissions. Building Research Establishment.
UK Energy Research Centre UKERC/WP/ESM/2007/008 25
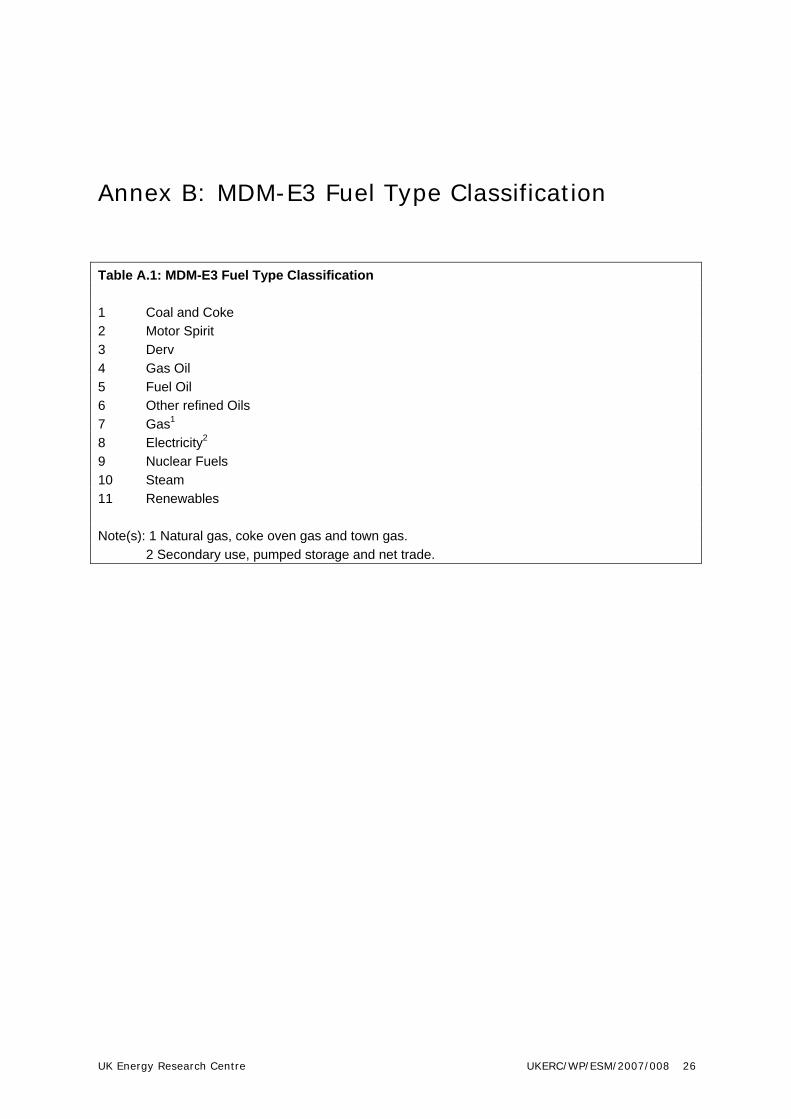
Annex B: MDM-E3 Fuel Type Classification
Table A.1: MDM-E3 Fuel Type Classification 1 Coal and Coke 2 Motor Spirit 3 Derv 4 Gas Oil 5 Fuel Oil 6 Other refined Oils 7 Gas1 8 Electricity2 9 Nuclear Fuels 10 Steam 11 Renewables Note(s): 1 Natural gas, coke oven gas and town gas. 2 Secondary use, pumped storage and net trade.
UK Energy Research Centre UKERC/WP/ESM/2007/008 26

Biographical Details of Authors
Dr Terry Barker Dr Terry Barker is Director of the Cambridge Centre for Climate Change Mitigation Research (4CMR), Department of Land Economy, University of Cambridge, and Chairman of Cambridge Econometrics. He directs the work of the Centre in contributing to the UKERC’s ESMT, working mainly on the applications of the models to UK energy policies. He is the Leader for the Integrated Modelling Research Programme in the Tyndall Centre for Climate Change Research. He was a Coordinating Lead Author (CLA) in the IPCC Third Assessment Report (2001) for the chapter covering mitigation and the world energy industries. He is now a CLA in the Fourth Assessment Report (due in 2007) for the chapter on mitigation from a cross-sectoral perspective, covering the macroeconomic costs of mitigation at national, regional and global levels in the short and medium term (to 2030). See http://www.landecon.cam.ac.uk/4CMR/4CMR.htm. Contact details: Cambridge Centre for Climate Change Mitigation Research (4CMR), Department of Land Economy, University of Cambridge, 19 Silver Street, Cambridge, CB3 9EP. [email protected] Katie Jenkins Katie Jenkins is a Research Assistant and Deputy Centre Manager at 4CMR. She has previously worked on a meta-analysis of the full costs of climate change and as Dr Barker’s assistant for his work on the IPCC AR4 WGIII report. She is currently involved in the FP6 Integrated Project ADAM ‘Adaptation and Mitigation Strategies: Supporting European Climate Policy’ and is the programme coordinator for the Tyndall Phase II Integrated Modelling Programme. Her research interests include adaptation and mitigation strategies, renewable energies and the impacts of extreme weather events on the economy. Contact details: Cambridge Centre for Climate Change Mitigation Research (4CMR), Department of Land Economy, University of Cambridge, 19 Silver Street, Cambridge, CB3 9EP. [email protected]
UK Energy Research Centre