the diversity of california's registered nursing workforce
TRANSCRIPT

The Diversity of California’s Registered Nursing Workforce May 7, 2012 Conducted for the California Board of Registered Nursing Prepared by: Renae Waneka, MPH Joanne Spetz, PhD University of California, San Francisco 3333 California Street, Suite 265 San Francisco, CA 94118

Nursing Diversity in California | Key Findings
University of California, San Francisco | 2
Contents Key Findings ....................................................................................................................................................... 3
Current Statewide Data ................................................................................................................................. 3
Statewide Population Projections .................................................................................................................. 9
Regional Highlights....................................................................................................................................... 11
Conclusions .................................................................................................................................................. 14
Regional Chart Book ........................................................................................................................................ 1-1
Bay Area ...................................................................................................................................................... 1-1
Central Coast ............................................................................................................................................... 2-1
Central Valley .............................................................................................................................................. 3-1
Greater Sacramento .................................................................................................................................... 4-1
Los Angeles Area ......................................................................................................................................... 5-1
Northern California ..................................................................................................................................... 6-1
Inland Empire .............................................................................................................................................. 7-1
Southern Border ......................................................................................................................................... 8-1
Appendix ......................................................................................................................................................... 9-1
Methods ...................................................................................................................................................... 9-1
Regions ........................................................................................................................................................ 9-2

Nursing Diversity in California | Key Findings
University of California, San Francisco | 3
Key Findings The ability of California Registered Nurses (RNs) to provide culturally competent care to Californians is associated with the language skills and diversity of the RN workforce. Moreover, diversity in the RN profession reflects progress in providing opportunities for young people to obtain postsecondary education and enter the health professions. This analysis focuses on trends in the diversity of California RNs, statewide and by region, and compares this diversity to that of the population of California as a whole. Data from the California Board of Registered Nursing (BRN) Surveys of RNs (2008 & 2010), the BRN Annual Schools Report (2001-2010), the California Department of Finance county-level population projections (2008), the California Office of Statewide Health Planning and Development, and the 2010 Census were used for this analysis. Methods used for the analysis are provided in the Appendix.
Below is a description of the major findings from this analysis. Charts for each of the eight regions within the state are included after the key findings.
Current Statewide Data Chart 1 shows the overrepresentation of White and Filipino RNs and the underrepresentation of Black and Hispanic RNs in comparison to both the patient population and the general population in California. Oftentimes, Filipinos are grouped with other Asians. Separating these ethnic groups shows that non-Filipino Asian RNs are not overrepresented to the same degree as Filipino RNs. Non-Filipino Asian RNs are overrepresented in comparison to the patient population but underrepresented in comparison to the general population.
Chart 1. Racial Composition, California

Nursing Diversity in California | Key Findings
University of California, San Francisco | 4
With the majority of White RNs older than 44 years of age, and larger numbers of younger RNs in other racial groups, these data show an increased diversity among younger nurses.
Chart 2. Racial Composition of RNs by Age, California, 2010
Regardless of race, 92% of California nurses under the age of 55 work in nursing. Native Americans (84%), non-Filipino Asians (89%) and those of other undisclosed races (89%) had less than 90% of their nurses younger than 55 years of age working in nursing. More than 90% of Black and Hispanic RNs younger than 55 years of age work in nursing, indicating that unemployed Black and Hispanic nurses cannot bridge the gap between Blacks and Hispanics in the nursing workforce and those in the general population.
Table 1. Share of California RNs Less than 55 Years of Age Working in Nursing, by Race, 2010
Race Share of RNs Working in Nursing
White 92% Black 94% Hispanic 94% Filipino 96% Asian 89% Native American 84% Other 89% Total 92% Source: BRN Survey of RNs, 2010

Nursing Diversity in California | Key Findings
University of California, San Francisco | 5
Since the majority of California RNs work in the acute care setting, taking a closer look at this setting shows a greater share of Hispanic and Black acute care patients than nurses working in that setting.
Chart 3. Racial Distribution of Acute Care Patients and RNs Employed in Acute Care, California, 2008
Student data from RN programs provide insight into the diversity of new nurses. Since 2005, there has been increasing diversity among graduates of RN programs, suggesting an increase in diversity among nurses over time. Table 2 and Chart 4 show increased racial diversity, regardless of the type of RN program. Entry-level Master’s (ELM) programs have had the greatest increase in diversity since 2005, but these programs graduate fewer new nurses than either Associate (ADN) or Bachelor (BSN) degree programs.
Table 2. Racial Composition of California’s RN Program Graduates, 2001-2010
2001 2002 2003 2004 2005 2006 2007 2008 2009 2010
Native American 1% 1% 1% 1% 1% 1% 1% 1% 1% 1% Asian 11% 10% 12% 12% 11% 12% 14% 16% 15% 17% Black 8% 7% 9% 8% 8% 7% 6% 6% 6% 5% Filipino 11% 12% 12% 11% 13% 14% 14% 14% 14% 14% Hispanic 21% 21% 21% 20% 22% 19% 19% 17% 17% 17% White 48% 49% 47% 48% 46% 47% 46% 42% 41% 41% Other race
4% 5% 4%
Ethnic Minorities 52% 51% 53% 52% 54% 53% 54% 58% 59% 59% Source: BRN Annual School Report, 2001-2010

Nursing Diversity in California | Key Findings
University of California, San Francisco | 6
Chart 4. Ethnic Minorities among California’s RN Program Graduates by Degree Earned, 2001-2010
Looking at new student enrollments shows that the shares of Hispanic and Black nurses have remained about the same over the past ten years, while the shares of Filipino, non-Filipino Asian and students of other undefined races have increased.
Table 3. Racial Composition of New Student Enrollments in California’s RN Programs, 2001-2010
2001 2002 2003 2004 2005 2006 2007 2008 2009 2010 Native American 1% 1% 1% 1% 1% 1% 1% 1% 1% 1% Asian 11% 12% 15% 14% 12% 14% 17% 16% 17% 16% Black 10% 7% 9% 8% 6% 8% 8% 7% 6% 6% Filipino 12% 13% 11% 12% 14% 15% 15% 14% 15% 15% Hispanic 21% 20% 20% 20% 21% 19% 18% 18% 18% 18% White 45% 46% 44% 46% 46% 43% 41% 41% 39% 41% Other race
4% 4% 4%
Ethnic Minorities 55% 54% 56% 54% 54% 57% 59% 59% 61% 59% Source: BRN Annual School Report, 2001-2010

Nursing Diversity in California | Key Findings
University of California, San Francisco | 7
The five-year average completion rates by race indicate that a smaller share of Blacks and Hispanics that started nursing programs completed those programs. Addressing these lower completion rates may help further increase the diversity among nursing graduates.
Chart 5. Average RN Program Completion Rate by Race, 2006-2010
Although the racial composition of RNs may not match the population, English language abilities of the general population and the ability of RNs to speak other languages indicate whether nurses can provide some aspects of culturally competent care, regardless of race.
Data from the 2010 Census indicate that 29% of all Californians speak Spanish at home and that 54% of these Spanish speakers also speak English very well.1 On average, younger Spanish speakers have better English language skills than their older counterparts2
1 These data are based on estimates generated by the American Community Survey (ACS), which generates publicly available language use estimates based on 2010 Census data.
, suggesting that Spanish language skills among RNs may become less of a concern in providing culturally competent care to Hispanics over time.
2 Of Spanish speakers in California, 77% of those 5 to 17 years of age speak English very well, while 48% of those 18-64 years of age and 33% of those 65 years of age and older have similar English language skills (Census, 2010).

Nursing Diversity in California | Key Findings
University of California, San Francisco | 8
Overall, 31% of California RNs speak Spanish (32% in 2008 and 30% in 2010). Almost all of the California RNs who identify as Hispanic speak Spanish (>98% in 2008 and 2010), leaving the remaining Spanish speakers as non-Hispanic. While Hispanic nurses (8%) are underrepresented in comparison to the Hispanic population (38%), 33% of RNs are either Hispanic or speak Spanish (34% in 2008 and 31% in 2010), which may address some of the gap in culturally competent care that exists between the nursing workforce and the general population.
Chart 6. Share of California RNs that Speak Spanish, 2008 & 2010
In addition to Spanish, Tagalog and other Asian languages are commonly spoken by RNs. Since Filipino RNs are overrepresented compared to the general population and the patient population, recruiting RNs who speak Tagalog is not a priority. However, non-Filipino Asians are underrepresented in comparison to the general population, indicating that proficiency in Asian languages other than Tagalog may improve culturally competent care for Asian patients.
Data from the 2010 Census data indicate that 10% of Californians speak an Asian or Pacific Island language at home and that 51% of them also speak English very well.3 On average, those of younger age groups have better English language skills than their older counterparts4
3 These data are based on estimates generated by the American Community Survey (ACS), which generates publicly available language use estimates based on 2010 Census data.
, suggesting that Asian or Pacific Island language skills among RNs may become less of a concern in providing culturally competent care to Asians over time. However, only 6% of California RNs speak an Asian language other than Tagalog, and almost all of them are non-Filipino Asians (>99% in 2008 and 2010). These data suggest that increasing the share of RNs with non-Filipino Asian language skills may improve culturally competent care for non-Filipino Asian patients.
4 Of Asian or Pacific Island language speakers in California, 75% of those 5 to 17 years of age speak English very well, while 52% of those 18-64 years of age and 25% of those 65 years of age and older have similar English language skills (Census, 2010).

Nursing Diversity in California | Key Findings
University of California, San Francisco | 9
The data shown thus far illustrate that Hispanic and Black RNs are currently underrepresented in comparison to the population. Racial composition of new nurses graduating from California’s RN programs suggests that these disparities will continue over the next several years. Spanish language skills of non-Hispanic RNs may provide some culturally competent care for Hispanic patients. However, younger Hispanics also speak English very well, suggesting that Spanish language skills among RNs may become less important over time. Even so, other aspects of providing culturally competent care will continue to be important, and the difference in racial composition between the population and the nursing workforce remains.
Statewide Population Projections Current data show that Hispanics and Blacks are underrepresented in the nursing workforce. Projecting the racial composition of RNs and the general population over the next 40 years allows us to show how these populations may change over time and whether additional steps to increase the diversity of the nursing workforce should be prioritized.
Population projections5
provided by the California Department of Finance suggest that the number of Hispanics in California is expected to grow dramatically over the next forty years. Starting in 2015, the number of Hispanics in California is expected to equal and then surpass the number of Whites in the state. The number of non-Filipino Asians is also expected to grow at a moderate rate, while the number of Whites is expected to slowly decline.
Chart 7. Projected Racial Composition of California’s Population, 2000-2050
5 Native Americans and those of other undefined racial/ethnic groups comprise less than 5% of the current general population and nursing workforce. Since these racial/ethnic groups show little change within the next 40 years, these groups were excluded from the charts and tables in this section of the report.

Nursing Diversity in California | Key Findings
University of California, San Francisco | 10
The RN workforce in California is expected to become more diverse, with White nurses comprising less than half of the workforce by 2030. However, these projections suggest that there will continue to be greater diversity in the general population than among California nurses.
Since these projections use past changes in diversity among nursing school graduates and graduation rates by race to predict future diversity, it is possible that diversity among nursing school graduates may change in ways not reflected in the data. It is also possible that factors not included in the model will add increased diversity to the nursing workforce.
Chart 8. Projected Racial Composition of California RNs, 2008-2050
Nursing Diversity in California | Key Findings
University of California, San Francisco | 11
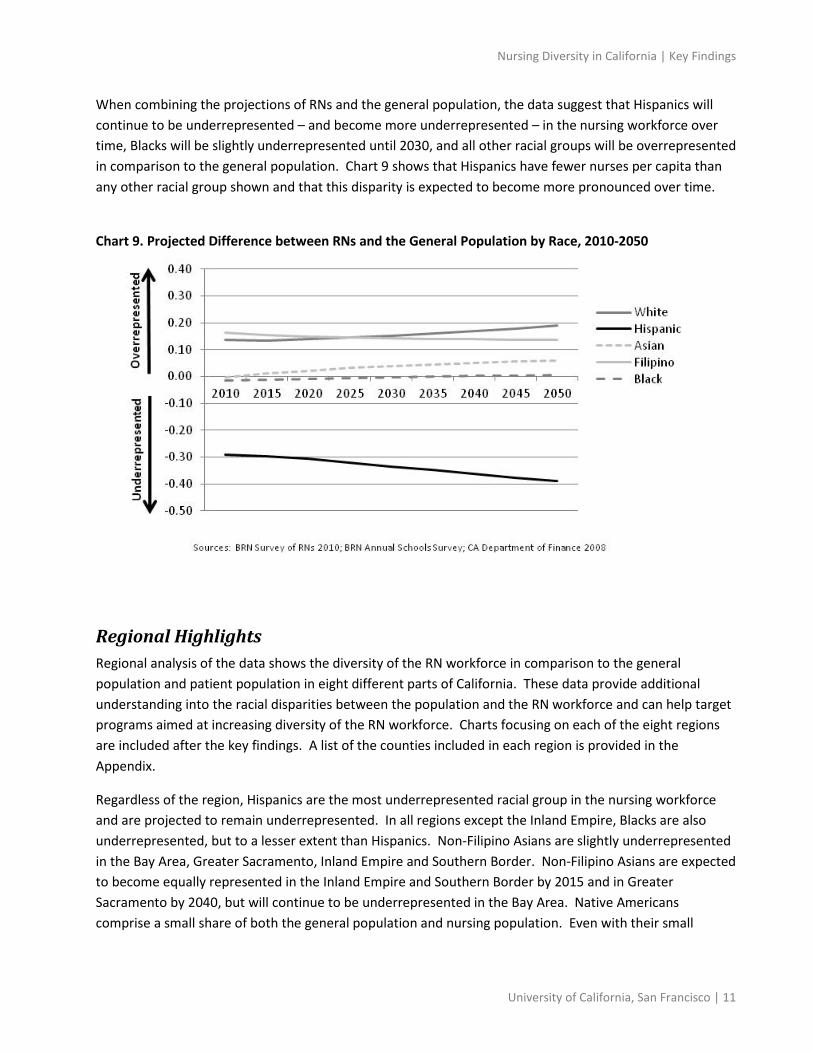
When combining the projections of RNs and the general population, the data suggest that Hispanics will continue to be underrepresented – and become more underrepresented – in the nursing workforce over time, Blacks will be slightly underrepresented until 2030, and all other racial groups will be overrepresented in comparison to the general population. Chart 9 shows that Hispanics have fewer nurses per capita than any other racial group shown and that this disparity is expected to become more pronounced over time.
Chart 9. Projected Difference between RNs and the General Population by Race, 2010-2050
Regional Highlights Regional analysis of the data shows the diversity of the RN workforce in comparison to the general population and patient population in eight different parts of California. These data provide additional understanding into the racial disparities between the population and the RN workforce and can help target programs aimed at increasing diversity of the RN workforce. Charts focusing on each of the eight regions are included after the key findings. A list of the counties included in each region is provided in the Appendix.
Regardless of the region, Hispanics are the most underrepresented racial group in the nursing workforce and are projected to remain underrepresented. In all regions except the Inland Empire, Blacks are also underrepresented, but to a lesser extent than Hispanics. Non-Filipino Asians are slightly underrepresented in the Bay Area, Greater Sacramento, Inland Empire and Southern Border. Non-Filipino Asians are expected to become equally represented in the Inland Empire and Southern Border by 2015 and in Greater Sacramento by 2040, but will continue to be underrepresented in the Bay Area. Native Americans comprise a small share of both the general population and nursing population. Even with their small

Nursing Diversity in California | Key Findings
University of California, San Francisco | 12
numbers, the data show that they are slightly underrepresented in Northern California and the Southern Border and are expected to remain so.
Table 4. Current and Future Underrepresentation of Racial Groups in RN Workforce in Comparison to the General Population, by Region Region Underrepresented
Current Future Bay Area Hispanic
Asian Black
Hispanic Asian Black (until 2030)
Central Coast Hispanic Black
Hispanic Black
Central Valley Hispanic Black
Hispanic Black
Greater Sacramento Hispanic Black Asian
Hispanic Black Asian (until 2040)
Los Angeles Area Hispanic Black
Hispanic Black (until 2025)
Northern California Hispanic Native American Black
Hispanic Native American Black
Inland Empire Hispanic Asian
Hispanic Asian (until 2015)
Southern Border Hispanic Native American Asian Black
Hispanic Native American Asian (until 2020) Black (until 2020)
Although the racial composition of RNs may not match the population, English language abilities of the general population and the ability of RNs to speak other languages indicate whether nurses can provide some aspects of culturally competent care, regardless of race.
While the share of RNs who speak Spanish is greater than the share of Hispanics in most regions, the share of RNs who speak Spanish is 20% less than the share of Hispanics in the Los Angeles Area and 11% less than the share of people in the area who speak Spanish at home. Even though slightly more than half of those in the region who speak Spanish at home also speak English well, the disparity between Spanish language skills among RNs and Spanish-speaking Hispanics remains pronounced in the Los Angeles Area.
In addition to Spanish, skills in non-Filipino Asian languages may help RNs provide culturally competent care to their patients. While many non-Hispanic RNs speak Spanish, very few non-Asian RNs speak an Asian language. Regional analysis of these data suggest that increasing non-Filipino Asian language skills of RNs in the Bay Area, Greater Sacramento and the Inland Empire could improve culturally competent care for non-Filipino Asian patients in these areas.

Nursing Diversity in California | Key Findings
University of California, San Francisco | 13
The five-year average RN program completion rates by race show that Blacks have lower average completion rates in the Central Coast, Central Valley, Greater Sacramento, and Los Angeles Area than RN students of other races. However, more than 95% of Blacks completed RN programs in Northern California, the Inland Empire, and the Southern Border. Average completion rates for Hispanics are above 95% in the Central Valley and Northern California.
Table 5. Average RN Program Completion Rates by Race, by Region, 2006-2010 Region Native
American Asian Black Filipino Hispanic White
Bay Area 91% 100% 92% 100% 85% 100% Central Coast NA* 100% 57% 84% 71% 88% Central Valley 100% 100% 74% 100% 96% 89% Greater Sacramento 100% 68% 63% 74% 66% 83% Los Angeles Area 100% 100% 73% 83% 86% 90% Northern California 100% 75% 100% 71% 100% 100% Inland Empire 73% 91% 96% 100% 85% 89% Southern Border 98% 95% 99% 100% 82% 93% *Not Available
Over the last five years, the Central Valley and Northern California saw increases in the share of Hispanics entering their RN programs. With an increase in the share of Hispanics enrolled in RN programs in the Central Valley and more than 95% of Hispanics graduating from programs in the region, these data suggest that Hispanics may become better represented in the Central Valley over time. However, Hispanics have become less represented among new RN students in most regions (Bay Area, Central Coast, Los Angeles Area, Inland Empire and Southern Border). These data coupled with less than 95% of Hispanics graduating from programs in these regions suggest that initiatives to recruit and retain Hispanics in RN programs in these regions could improve the representation of Hispanics in the RN workforce.
Table 6. Change in Representation of Racial Groups among New Students in RN Programs*, 2006-2010 Region Native
American Asian Black Filipino Hispanic White
Bay Area Increasing Decreasing Central Coast Decreasing Decreasing Increasing Decreasing Increasing Central Valley Decreasing Increasing Greater Sacramento Decreasing Decreasing Increasing Los Angeles Area Increasing Decreasing Increasing Decreasing Northern California Increasing Increasing Increasing Inland Empire Increasing Increasing Increasing Decreasing Decreasing Southern Border Increasing Increasing Decreasing *Blank cells indicate no change in racial representation.

Nursing Diversity in California | Key Findings
University of California, San Francisco | 14
Conclusions Statewide data suggest that Hispanics are currently – and will continue to be – the most underrepresented racial group in the nursing workforce as compared to the general population. With employment rates over 90% for Hispanic RNs younger than 55, recruiting unemployed RNs to return to work would fail to close the gap between the share of Hispanics in the nursing workforce and the general population. Although many non-Hispanic RNs report having Spanish language skills, the share of California RNs with these skills is 5% less than the share of Hispanics in the state. The greatest need for RNs with Spanish language skills is in the Los Angeles Area, where the share of RNs that speak Spanish is 20% less than the Hispanic population in the region. While Spanish language skills may be valuable in providing some aspects of culturally competent care to Hispanic patients, there is an increasing gap between Hispanics in the nursing workforce and the general population.
Although there is increased diversity among RNs younger than 45 years of age, the share of Hispanic RNs in this age group remains low in comparison to the general population. Student data from RN programs indicate that the share of Hispanic students enrolling in RN programs has changed little over the past ten years and that the share of Hispanics graduating from these programs has been decreasing due to completion rates lower than those of most of their peers. These data suggest that the share of Hispanic RNs will continue to decline unless interventions encouraging enrollment of Hispanics into RN programs and improving success rates of these students are implemented.
The share of Hispanics in the general population, and therefore the patient population, is expected to grow considerably over the next 40 years. Even though the data suggest that the English language skills of Spanish-speaking Californians will improve over time, Spanish language skills and other aspects of providing culturally competent care will likely be important for RNs in the future. Finding ways to increase the share of Hispanic RNs and emphasizing skills in multiple languages may help nurses become more adept at caring for their patients. While Hispanic RNs are the most underrepresented racial group, regional analysis shows that Black and non-Filipino Asian RNs were slightly underrepresented in some parts of California as well.
Projections of RNs and the general population indicate continued underrepresentation of Blacks in the Central Coast, Central Valley, Greater Sacramento, and Northern California over the next forty years, while Blacks will become more equally represented in the Bay Area, Los Angeles Area and Southern Border by 2030. Student data from RN programs indicate that the share of Black students enrolling in RN programs has been declining and that the share of Blacks graduating from these programs has been decreasing due to completion rates lower than those of their peers. These data suggest that the share of Black RNs will continue to decline unless interventions that encourage enrollment and improve success rates of Blacks in RN programs are implemented. While Blacks are expected to become more equally represented throughout California due to limited growth in the Black population over the next forty years, strategies to improve success among Black students in RN programs could accelerate the rate at which they become more equally represented in the nursing workforce.
Data on the population of Non-Filipino Asians suggest that Asians will be underrepresented among RNs in the Inland Empire for the next few years and will continue to be underrepresented in the Bay Area.

Nursing Diversity in California | Key Findings
University of California, San Francisco | 15
Student data from RN programs indicate that the share of Asian students enrolling in RN programs has been increasing and that the share of Asians graduating from these programs has been increasing due to higher completion rates than most of their peers. These data suggest that the share of Asian RNs will continue increasing. However, these increases will not keep pace with the growth of the Asian population in the Bay Area, suggesting that strategies to increase the share of Asian RNs in the Bay Area may help address the gap in representation between RNs and the general population.

Nursing Diversity in California | Bay Area
University of California, San Francisco | 1-1
Regional Chart Book
Bay Area The Bay Area represents Alameda, Contra Costa, Marin, Napa, San Francisco, San Mateo, Santa Clara, Santa Cruz, Solano and Sonoma counties.
Current Data Chart 1 shows the overrepresentation of White and Filipino RNs and the underrepresentation of Black, Hispanic and Asian RNs in comparison to both the patient population and the general population.
Chart 1. Racial Composition, Bay Area
With the majority of White RNs over 45 years of age, Chart 2 shows greater diversity among younger RNs.
Chart 2. Racial Composition of RNs by Age, Bay Area, 2010

Nursing Diversity in California | Bay Area
University of California, San Francisco | 1-2
Regardless of race, 91% of Bay Area nurses under the age of 55 work in nursing. More than 90% of White and Filipino RNs younger than 55 years of age work in nursing. Blacks (79%), Hispanics (86%), Native Americans (74%), non-Filipino Asians (89%) and those of other undisclosed races (89%) had less than 90% of their nurses younger than 55 years of age working in nursing. Increasing employment rates among Black and Hispanic RNs in the region could help shrink the gap between Blacks and Hispanics in the nursing workforce and those in the general population.
Table 1. Share of Bay Area RNs Less than 55 Years of Age Working in Nursing, by Race, 2010
Race Share of RNs Working in Nursing
White 91% Black 79% Hispanic 86% Filipino 95% Asian 89% Native American 74% Other 88% Total 91% Source: BRN Survey of RNs, 2010
Since the majority of RNs work in the acute care setting, taking a closer look at this setting shows a greater share of Hispanic and Black acute care patients than nurses working in that setting.
Chart 3. Racial Distribution of Acute Care Patients and RNs Employed in Acute Care, Bay Area, 2008

Nursing Diversity in California | Bay Area
University of California, San Francisco | 1-3
Student data from RN programs provide insight into the diversity of new nurses. Table 2 shows an increase in diversity among graduates of RN programs since 2007, suggesting an increase in diversity among nurses over time.
Table 2. Racial Composition of the Bay Area’s RN Program Graduates, 2001-2010
2001 2002 2003 2004 2005 2006 2007 2008 2009 2010
Native American 1% 1% 1% 1% 1% 1% 0% 0% 1% 1% Asian 15% 16% 21% 16% 18% 18% 20% 24% 19% 19% Black 7% 7% 7% 8% 7% 7% 6% 6% 6% 6% Filipino 12% 14% 12% 14% 16% 15% 13% 14% 16% 16% Hispanic 11% 13% 12% 13% 12% 11% 11% 11% 11% 11% White 56% 49% 47% 48% 47% 49% 49% 40% 43% 43% Other race
5% 5% 5%
Ethnic Minorities 44% 51% 53% 52% 53% 51% 51% 60% 57% 57% Source: BRN Annual School Report, 2001-2010
Chart 4 shows that the increase in racial diversity occurred in Associate (ADN) degree and Entry-level Master’s (ELM) programs, while Bachelor (BSN) degree programs have become less diverse since 2005. While the greatest share of 2010 RN program graduates in the Bay Area completed ADN programs (47%), 41% of students completed BSN programs, indicating that continued decreases in diversity among BSN graduates could negatively impact the racial diversity of future RNs in the region.
Chart 4. Ethnic Minorities among the Bay Area’s RN Program Graduates by Degree Earned, 2001-2010

Nursing Diversity in California | Bay Area
University of California, San Francisco | 1-4
Since 2004, there has been increased diversity among new student enrollments in the Bay Area. Table 3 shows an overall increase in the share of Asians among new RN students since 2005 but a decrease in Hispanics during the same time period. The share of Filipinos, Blacks and Whites remained about the same over the same six-year time period.
Table 3. Racial Composition of New Student Enrollments in California’s RN Programs, 2001-2010
2001 2002 2003 2004 2005 2006 2007 2008 2009 2010 Native American 0% 1% 1% 1% 1% 0% 1% 1% 1% 1% Asian 17% 18% 24% 21% 16% 18% 25% 21% 17% 19% Black 9% 8% 8% 7% 5% 6% 7% 8% 6% 5% Filipino 15% 16% 11% 12% 16% 18% 14% 13% 16% 16% Hispanic 13% 14% 11% 11% 18% 13% 12% 11% 12% 11% White 47% 44% 44% 48% 44% 43% 42% 41% 43% 44% Other race
5% 6% 3%
Ethnic Minorities 53% 56% 56% 52% 56% 57% 58% 59% 57% 56% Source: BRN Annual School Report, 2001-2010
The five-year average completion rates by race indicate that a smaller share of Native Americans, Blacks and Hispanics that started nursing programs completed those programs. If completion rates continue as they have, increased diversity among new students in RN programs may not be reflected in graduations. Addressing these lower completion rates may help further increase the diversity among RN graduates.
Chart 5. Average RN Program Completion Rate by Race, Bay Area, 2006-2010

Nursing Diversity in California | Bay Area
University of California, San Francisco | 1-5
Although the racial composition of RNs may not match the population, language abilities of RNs indicate whether nurses can provide some aspects of culturally competent care, regardless of race.
Data from the 2010 Census indicate that 18% of people in the Bay Area speak Spanish at home and that 53% of these Spanish speakers also speak English very well.1 On average, younger Spanish speakers have better English language skills than their older counterparts2
Overall, 24% of Bay Area RNs speak Spanish (25% in 2008 and 23% in 2010). Almost all of the 4% of Bay Area RNs who identify as Hispanic speak Spanish (>97% in 2008 and 2010), leaving the remaining Spanish speakers as non-Hispanic. While Hispanic nurses (4%) are underrepresented in comparison to the Hispanic population (24%), 26% of RNs are either Hispanic or speak Spanish (28% in 2008 and 24% in 2010), which may address some of the gap in culturally competent care that exists between the nursing workforce and the general population. However, the data also show that a smaller share of non-Hispanic RNs spoke Spanish in 2010 than 2008, which could signal a trend in decreasing Spanish language skills among non-Hispanic RNs.
, suggesting that Spanish language skills among RNs may become less of a concern in providing culturally competent care to Hispanics over time.
Chart 6. Share of Bay Area RNs that Speak Spanish, 2008 & 2010
In addition to Spanish, Tagalog and other Asian languages are commonly spoken among RNs. Since Filipino RNs are overrepresented compared to the general population and the patient population in the Bay Area, recruiting RNs who speak Tagalog is not a priority for this region. However, non-Filipino Asians are underrepresented in comparison to the general population and slightly underrepresented in comparison to the patient population, indicating that proficiency in Asian languages other than Tagalog may improve culturally competent care for Asian patients.
1 These data are based on estimates generated by the American Community Survey (ACS), which generates publicly available language use estimates based on 2010 Census data. Bay Area estimates do not include Marin or Napa counties, since there were insufficient data for those counties to produce estimates. 2 Of Spanish speakers in the Bay Area, 78% of those 5 to 17 years of age speak English very well, while 47% of those 18-64 years of age and 40% of those 65 years of age and older have similar English language skills (Census, 2010).

Nursing Diversity in California | Bay Area
University of California, San Francisco | 1-6
Data from the 2010 Census indicate that 17% of people in the Bay Area speak an Asian or Pacific Island language and that 51% of them also speak English very well.3 On average, those of younger age groups have better English language skills than their older counterparts4
, suggesting that Asian or Pacific Island language skills among RNs may become less of a concern in providing culturally competent care to Asians over time. However, only 7% of Bay Area RNs speak an Asian language other than Tagalog, and almost all of them are non-Filipino Asians (>99% in 2008 and 2010). These data suggest that increasing the share of RNs with non-Filipino Asian language skills may improve culturally competent care for non-Filipino Asian patients.
The data shown thus far illustrate that Hispanic, Black and Asian RNs are currently underrepresented in comparison to the population of the Bay Area. Racial composition of new nurses graduating from the Bay Area’s RN programs shows that the share of Asian RNs increased in the past few years, while the share of Black RNs remained relatively constant and the share of Hispanic RNs decreased during the same time period. Asian RNs may be able to provide some aspects of culturally competent care, regardless of their language skills. However, if the share of Asian patients who speak an Asian language is greater than the share of RNs who speak an Asian language, there may be a continued gap in providing culturally competent care for these patients. Spanish language skills of non-Hispanic RNs may provide some culturally competent care for Hispanic patients, but the difference in racial composition between the population and the nursing workforce remains. The data suggest that disparities among Blacks and Hispanics will continue over the next several years.
3 These data are based on estimates generated by the American Community Survey (ACS), which generates publicly available language use estimates based on 2010 Census data. 4 Of Asian or Pacific Island language speakers in the Bay Area, 74% of those 5 to 17 years of age speak English very well, while 52% of those 18-64 years of age and 23% of those 65 years of age and older have the similar English language skills (Census, 2010).

Nursing Diversity in California | Bay Area
University of California, San Francisco | 1-7
Population Projections Current data show that Hispanics, Blacks and Asians are underrepresented in the nursing workforce. Projecting the racial composition of RNs and the general population over the next 40 years allows us to show how these populations may change over time and whether additional steps to increase the diversity of the nursing workforce should be prioritized.
Population projections5
Chart 7. Projected Racial Composition of the Bay Area’s Population, 2000-2050
provided by the California Department of Finance suggest that the number of Hispanics in the Bay Area is expected to grow dramatically over the next forty years. Starting in 2035, the number of Hispanics in the region is expected to equal and then surpass the number of Whites in the region. The number of non-Filipino Asians is also expected to grow at a moderate rate, while the number of Whites is expected to decline.
The RN workforce in the Bay Area is expected to become more diverse, with White nurses comprising less than half of the workforce by 2035. However, these projections suggest that there will continue to be greater diversity in the general population than among Bay Area nurses.
5 Native Americans and those of other undefined racial/ethnic groups comprise less than 5% of the current general population and nursing workforce in the region. Since these racial/ethnic groups show little change within the next 40 years, these groups were excluded from the charts and tables in this section of the report.

Nursing Diversity in California | Bay Area
University of California, San Francisco | 1-8
Since these projections use past changes in diversity among nursing school graduates and graduation rates by race to predict future diversity, it is possible that diversity among nursing school graduates may change in ways not reflected in the data. It is also possible that factors not included in the model will add increased diversity to the nursing workforce.
Chart 8. Projected Racial Composition of Bay Area RNs, 2010-2050
When combining the projections of RNs and the general population, Chart 9 shows that Hispanics and, to a lesser extent, non-Filipino Asians will continue to be underrepresented in the nursing workforce. Blacks will be slightly underrepresented until 2030, and Whites and Filipinos will be overrepresented in comparison to the general population.
Chart 9. Projected Racial Representation of RNs in Comparison to the General Population, Bay Area, 2010-2050

Nursing Diversity in California | Central Coast
University of California, San Francisco | 2-1
Central Coast The Central Coast represents Monterey, San Benito, San Luis Obispo and Santa Barbara counties.
Current Data Chart 1 shows the overrepresentation of White, Filipino and Asian RNs and the underrepresentation of Hispanic and Black RNs in comparison to both the patient population and the general population in the Central Coast.
Chart 1. Racial Composition, Central Coast
With the majority of White RNs older than 44 years of age, and larger numbers of younger RNs in other racial groups, these data show an increased diversity among younger nurses.
Chart 2. Racial Composition of RNs by Age, Central Coast, 2010

Nursing Diversity in California | Central Coast
University of California, San Francisco | 2-2
Regardless of race, 92% of Central Coast nurses under the age of 55 work in nursing. RN employment rates are lowest among Asians (83%) and those of other undisclosed races (80%). All other racial groups have at least 90% of their actively licensed RNs working in nursing, indicating that unemployed Black and Hispanic nurses cannot bridge the gap between Blacks and Hispanics in the nursing workforce and those in the general population.
Table 1. Share of Central Coast RNs Less than 55 Years of Age Working in Nursing, by Race, 2010
Race Share of RNs Working in Nursing
White 92% Black 100% Hispanic 91% Filipino 96% Asian 83% Native American 100% Other 80% Total 92% Source: BRN Survey of RNs, 2010
Since the majority of California RNs work in the acute care setting, taking a closer look at this setting shows a greater share of Hispanic, Asian and Black acute care patients than nurses working in that setting.
Chart 3. Racial Distribution of Acute Care Patients and RNs Employed in Acute Care, Central Coast, 2008

Nursing Diversity in California | Central Coast
University of California, San Francisco | 2-3
Student data from RN programs provide insight into the diversity of new nurses. Table 2 shows fluctuation in the share of ethnic minorities among graduates of RN programs over the past ten years. Even though diversity among graduates has increased since 2006, the share of ethnic minorities in 2010 is about the same as it was in 2001. There has, however, been an increase in the share of Asians represented in the region and a decrease in the share of Hispanics over the ten-year period.
Table 2. Racial Composition of the Central Coast’s RN Program Graduates, 2001-2010
2001 2002 2003 2004 2005 2006 2007 2008 2009 2010
Native American 1% 2% 2% 1% 0% 2% 0% 2% 1% 2% Asian 2% 8% 8% 8% 1% 4% 8% 2% 5% 9% Black 4% 2% 4% 1% 4% 2% 1% 0% 3% 2% Filipino 11% 7% 6% 4% 9% 5% 2% 12% 6% 10% Hispanic 23% 20% 25% 22% 18% 14% 23% 17% 17% 18% White 59% 61% 56% 65% 68% 72% 65% 63% 69% 58% Other race
3% 1% 1%
Ethnic Minorities 41% 39% 44% 35% 32% 28% 35% 37% 31% 42% Source: BRN Annual School Report, 2001-2010
The diversity of new students enrolling in RN programs has fluctuated over the ten-year period shown in Table 3. While the diversity of new students has decreased since 2007, the share of ethnic minorities in 2010 is about the same as it was in 2001. There has, however, been a slight decrease in the share of Native Americans and Hispanics and a slight increase in the share of Filipinos over the ten-year period.
Table 3. Racial Composition of New Student Enrollments in the Central Coast’s RN Programs, 2001-2010
2001 2002 2003 2004 2005 2006 2007 2008 2009 2010 Native American 2% 1% 1% 3% 2% 0% 1% 0% 0% 0% Asian 6% 8% 7% 4% 2% 5% 10% 2% 8% 7% Black 1% 1% 1% 3% 3% 3% 2% 2% 2% 1% Filipino 7% 4% 5% 5% 6% 7% 8% 10% 10% 9% Hispanic 24% 26% 29% 17% 21% 23% 28% 19% 15% 20% White 61% 60% 57% 68% 67% 61% 51% 64% 65% 63% Other race
3% 0% 0%
Ethnic Minorities 39% 40% 43% 32% 33% 39% 49% 36% 35% 37% Source: BRN Annual School Report, 2001-2010
Nursing Diversity in California | Central Coast
University of California, San Francisco | 2-4
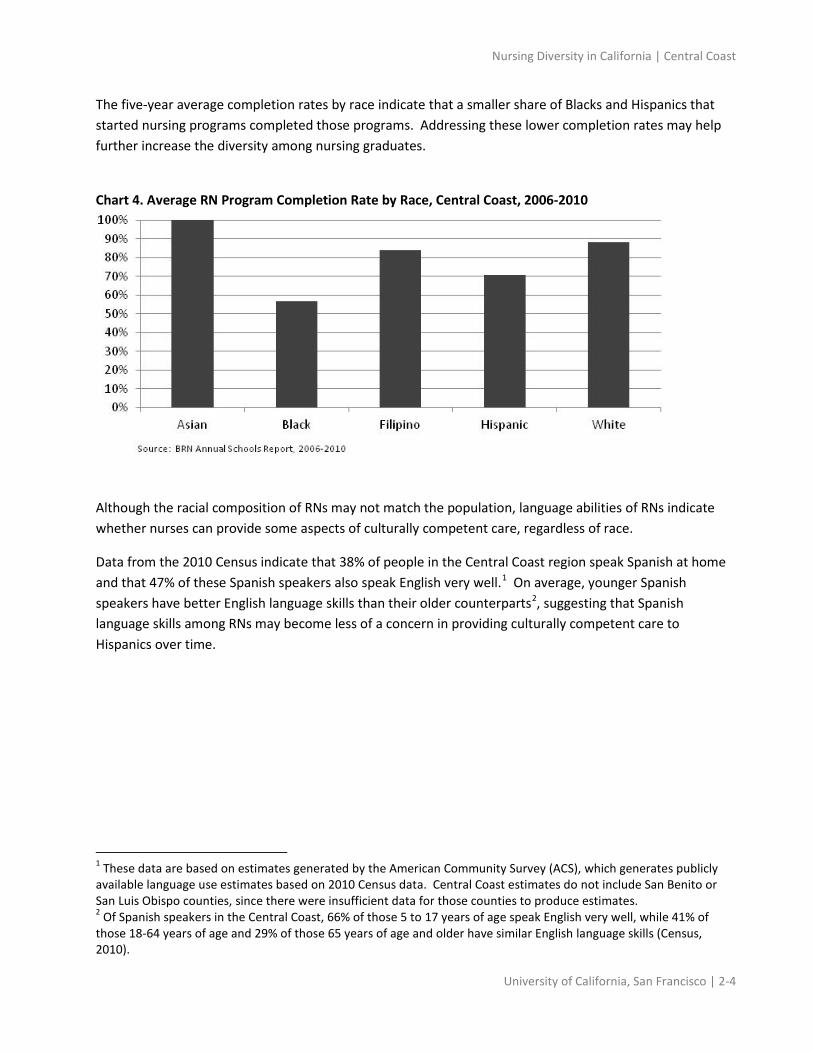
The five-year average completion rates by race indicate that a smaller share of Blacks and Hispanics that started nursing programs completed those programs. Addressing these lower completion rates may help further increase the diversity among nursing graduates.
Chart 4. Average RN Program Completion Rate by Race, Central Coast, 2006-2010
Although the racial composition of RNs may not match the population, language abilities of RNs indicate whether nurses can provide some aspects of culturally competent care, regardless of race.
Data from the 2010 Census indicate that 38% of people in the Central Coast region speak Spanish at home and that 47% of these Spanish speakers also speak English very well.1 On average, younger Spanish speakers have better English language skills than their older counterparts2
1 These data are based on estimates generated by the American Community Survey (ACS), which generates publicly available language use estimates based on 2010 Census data. Central Coast estimates do not include San Benito or San Luis Obispo counties, since there were insufficient data for those counties to produce estimates.
, suggesting that Spanish language skills among RNs may become less of a concern in providing culturally competent care to Hispanics over time.
2 Of Spanish speakers in the Central Coast, 66% of those 5 to 17 years of age speak English very well, while 41% of those 18-64 years of age and 29% of those 65 years of age and older have similar English language skills (Census, 2010).

Nursing Diversity in California | Central Coast
University of California, San Francisco | 2-5
Overall, 49% of Central Coast RNs speak Spanish (47% in 2008 and 52% in 2010). All of the Central Coast RNs who identify as Hispanic speak Spanish, leaving the remaining Spanish speakers as non-Hispanic. While Hispanic nurses (6%) are underrepresented in comparison to the Hispanic population (42%), 50% of RNs are either Hispanic or speak Spanish (47% in 2008 and 52% in 2010), which may address some of the gap in culturally competent care that exists between the nursing workforce and the general population.
Chart 5. Share of Central Coast RNs that Speak Spanish, 2008 & 2010
Data from the 2010 Census also indicate that 4% of people in the Central Coast speak an Asian or Pacific Island language at home and that 56% of them also speak English very well.3 While only 1% of Central Coast RNs speak an Asian language other than Tagalog, non-Filipino Asians are overrepresented in the RN workforce in the region and the small share of Asians in this region speaks English well4
. These data suggest that recruiting RNs with Asian language skills is not a high priority for this region.
The data shown thus far illustrate that Hispanic and Black RNs are currently underrepresented in comparison to the population. The racial composition of new nurses graduating from the Central Coast’s RN programs and lower graduation rates among Hispanic and Black RN students suggest that these disparities will continue over the next several years. Spanish language skills of non-Hispanic RNs may provide some culturally competent care for Hispanic patients, but the difference in racial composition between the population and the nursing workforce remains.
3 These data are based on estimates generated by the American Community Survey (ACS), which generates publicly available language use estimates based on 2010 Census data. 4 Of Asian or Pacific Island language speakers in California, 60% of those 5 to 17 years of age speak English very well, while 57% of those 18-64 years of age and 47% of those 65 years of age and older have the similar English language skills (Census, 2010).

Nursing Diversity in California | Central Coast
University of California, San Francisco | 2-6
Population Projections Current data show that Hispanics and Blacks are underrepresented in the nursing workforce. Projecting the racial composition of RNs and the general population over the next 40 years allows us to show how these populations may change over time and whether additional steps to increase the diversity of the nursing workforce should be prioritized.
Population projections5
Chart 6. Projected Racial Composition of the Central Coast’s Population, 2000-2050
provided by the California Department of Finance suggest that the number of Hispanics in the Central Coast is expected to grow dramatically over the next forty years. Before 2020, the number of Hispanics in the Central Coast is expected to equal and then surpass the number of Whites in the region.
5 Native Americans and those of other undefined racial/ethnic groups comprise less than 5% of the current general population and nursing workforce in the region. Since these racial/ethnic groups show little change within the next 40 years, these groups were excluded from the charts and tables in this section of the report.

Nursing Diversity in California | Central Coast
University of California, San Francisco | 2-7
Chart 7 shows small increases in diversity of the Central Coast’s RN workforce over the next 40 years, with Whites still comprising more than 60% of the workforce in 2050. These projections suggest that there will continue to be greater diversity in the general population than among nurses in the Central Coast.
Since these projections use past changes in diversity among nursing school graduates and graduation rates by race to predict future diversity, it is possible that diversity among nursing school graduates may change in ways not reflected in the data. It is also possible that factors not included in the model will add increased diversity to the nursing workforce.
Chart 7. Projected Racial Composition of Central Coast RNs, 2010-2050

Nursing Diversity in California | Central Coast
University of California, San Francisco | 2-8
When combining the projections of RNs and the general population, the data suggest that Hispanics will continue to be underrepresented in the nursing workforce, Blacks will be slightly underrepresented, and all other racial groups will be overrepresented in comparison to the general population. Chart 8 shows that Hispanics are less represented in the RN workforce than in the general population and that this disparity is expected to become more pronounced over time.
Chart 8. Projected Difference between RNs and the General Population by Race, Central Coast, 2010-2050

Nursing Diversity in California | Central Valley
University of California, San Francisco | 3-1
Central Valley The Central Valley represents Alpine, Amador, Calaveras, Fresno, Inyo, Kern, Kings, Madera, Mariposa, Merced, Mono, San Joaquin, Stanislaus, Tulare and Tuolumne counties.
Current Data Chart 1 shows the overrepresentation of White, Asian and Filipino RNs and the underrepresentation of Black and Hispanic RNs in comparison to both the patient population and the general population.
Chart 1. Racial Composition, Central Valley
With the majority of White RNs older than 44 years of age, and larger numbers of younger RNs in other racial groups, these data show an increased diversity among younger nurses.
Chart 2. Racial Composition of RNs by Age, Central Valley, 2010

Nursing Diversity in California | Central Valley
University of California, San Francisco | 3-2
Regardless of race, 96% of California nurses under the age of 55 work in nursing. All racial groups shown have at least 90% of their RNs younger than 55 working nursing. All Black RNs in this age group work in nursing, while 98% of Hispanics do the same. These data indicate that unemployed Black and Hispanic nurses cannot bridge the gap between Blacks and Hispanics in the nursing workforce and those in the general population.
Table 1. Share of Central Valley RNs Less than 55 Years of Age Working in Nursing, by Race, 2010
Race* Share of RNs Working in Nursing
White 96% Black 100% Hispanic 98% Filipino 98% Asian 91% Other 100% Total 96% *No Native American RNs less than 55 years of age were reported in this region. Source: BRN Survey of RNs, 2010
Since the majority of RNs work in the acute care setting, taking a closer look at this setting shows a much greater share of Hispanic acute care patients than nurses working in that setting and a slightly greater share of Blacks.
Chart 3. Racial Distribution of Acute Care Patients and RNs Employed in Acute Care, Central Valley, 2008

Nursing Diversity in California | Central Valley
University of California, San Francisco | 3-3
Student data from RN programs provide insight into the diversity of new nurses. There has been an overall increase in diversity among RN graduates in the Central Valley since 2001, suggesting an increase in diversity among nurses over time. Table 2 and Chart 4 show increased racial diversity, regardless of the type of RN program.
Table 2. Racial Composition of the Central Valley’s RN Program Graduates, 2001-2010
2001 2002 2003 2004 2005 2006 2007 2008 2009 2010
Native American 1% 2% 2% 2% 1% 2% 0% 1% 1% 1% Asian 12% 8% 8% 11% 8% 10% 10% 17% 11% 12% Black 3% 4% 3% 5% 4% 6% 2% 2% 4% 4% Filipino 5% 6% 6% 6% 7% 10% 6% 7% 8% 8% Hispanic 17% 20% 19% 16% 23% 22% 22% 20% 22% 20% White 63% 60% 62% 59% 57% 51% 60% 48% 50% 52% Other race
4% 3% 4%
Ethnic Minorities 37% 40% 38% 41% 43% 49% 40% 52% 50% 48% Source: BRN Annual School Report, 2001-2010
Chart 4. Ethnic Minorities among the Central Valley’s RN Program Graduates by Degree Earned, 2001-2010

Nursing Diversity in California | Central Valley
University of California, San Francisco | 3-4
Looking at new student enrollments shows an increase in diversity since 2005. The share of Hispanic nurses has been increasing since 2006, while the share of Filipino RNs has been declining over the same time period.
Table 3. Racial Composition of New Student Enrollments in the Central Valley’s RN Programs, 2001-2010
2001 2002 2003 2004 2005 2006 2007 2008 2009 2010 Native American 1% 2% 1% 1% 1% 1% 1% 1% 1% 1% Asian 10% 11% 8% 8% 9% 12% 13% 10% 12% 11% Black 5% 3% 5% 4% 3% 5% 4% 5% 5% 5% Filipino 5% 6% 8% 7% 5% 10% 9% 5% 7% 5% Hispanic 21% 19% 20% 22% 22% 18% 20% 20% 21% 22% White 57% 58% 58% 57% 60% 54% 53% 51% 50% 50% Other race
7% 5% 6%
Ethnic Minorities 43% 42% 42% 43% 40% 46% 47% 49% 50% 50% Source: BRN Annual School Report, 2001-2010
The five-year average completion rates by race indicate that Hispanic students in the Central Valley had an average completion rate of 96%, a higher rate than Black and White students in the region. These data suggest that increased Hispanic enrollments will likely lead to comparable shares of Hispanic RN graduates.
Chart 5. Average RN Program Completion Rate by Race, Central Valley, 2006-2010
Although the racial composition of RNs may not match the population, language abilities of RNs indicate whether nurses can provide some aspects of culturally competent care, regardless of race.
Data from the 2010 Census indicate that 34% of people in the Central Valley speak Spanish at home and that 54% of these Spanish speakers also speak English very well.1
1 These data are based on estimates generated by the American Community Survey (ACS), which generates publicly available language use estimates based on 2010 Census data. Central Valley estimates do not include Alpine, Amador,
On average, younger Spanish speakers

Nursing Diversity in California | Central Valley
University of California, San Francisco | 3-5
have better English language skills than their older counterparts2
Overall, 36% of Central Valley RNs speak Spanish (36% in 2008 and 2010). All of the Central Valley RNs who identify as Hispanic speak Spanish (10% in 2008 and 12% in 2010), leaving the remaining Spanish speakers as non-Hispanic. While Hispanic nurses (11%) are underrepresented in comparison to the Hispanic population (47%), 36% of RNs are either Hispanic or speak Spanish (36% in 2008 and 37% in 2010), which may address some of the gap in culturally competent care that exists between the nursing workforce and the general population.
, suggesting that Spanish language skills among RNs may become less of a concern in providing culturally competent care to Hispanics over time.
Chart 6. Share of Central Valley RNs that Speak Spanish, 2008 & 2010
Data from the 2010 Census also indicate that 5% of people in the Central Valley speak an Asian or Pacific Island language at home and that 55% of them also speak English very well.3 Since 6% of Central Valley RNs speak an Asian language other than Tagalog, and the small share of non-Filipino Asians in the region speaks English well4
, the data suggest that recruiting RNs with Asian language skills is not a high priority for this region.
Calaveras, Inyo, Madera, Mariposa, Mono or Tuolumne counties, since there were insufficient data for those counties to produce estimates. 2 Of Spanish speakers in the Central Valley, 76% of those 5 to 17 years of age speak English very well, while 47% of those 18-64 years of age and 37% of those 65 years of age and older have similar English language skills (Census, 2010). 3 These data are based on estimates generated by the American Community Survey (ACS), which generates publicly available language use estimates based on 2010 Census data. 4 Of Asian or Pacific Island language speakers in the Central Valley, 72% of those 5 to 17 years of age speak English very well, while 54% of those 18-64 years of age and 30% of those 65 years of age and older have the similar English language skills (Census, 2010).

Nursing Diversity in California | Central Valley
University of California, San Francisco | 3-6
The data shown thus far illustrate that Hispanic and Black RNs are currently underrepresented in comparison to the population. Increases in the share of Hispanics among new students in the Central Valley’s RN programs over the past few years and high completion rates among Hispanic nursing students in the region during the same time period suggest that the number of new Hispanic RNs in the region may increase over the next several years. While increases in the share of Black RNs in Central Valley RN programs may help address the disparity in this group as well, RN program completion rates for Blacks have historically been lower than those for Hispanics. The data suggest increased diversity in the region over time, but the racial composition of new nurses graduating from the Central Valley’s RN programs suggests that racial disparities will continue over the next several years. Spanish language skills of non-Hispanic RNs may provide some culturally competent care for Hispanic patients, but the difference in racial composition between the population and the nursing workforce remains.
Population Projections Current data show that Hispanics and Blacks are underrepresented in the nursing workforce. Projecting the racial composition of RNs and the general population over the next 40 years allows us to show how these populations may change over time and whether additional steps to increase the diversity of the nursing workforce should be prioritized.
Population projections5 provided by the California Department of Finance suggest that the number of Hispanics in the Central Valley is expected to grow dramatically over the next forty years. Chart 7 shows that the number of Hispanics in the Central Valley has already surpassed the number of Whites in the region.6
Chart 7. Projected Racial Composition of the Central Valley’s Population, 2000-2050
5 Native Americans and those of other undefined racial/ethnic groups comprise less than 5% of the current general population and nursing workforce in the region. Since these racial/ethnic groups show little change within the next 40 years, these groups were excluded from the charts and tables in this section of the report. 6 The forecasts used here are based on the 2000 Census. The California Department of Finance expects to update these forecasts with the 2010 Census sometime in 2013, after the Census releases its county-level statistics.

Nursing Diversity in California | Central Valley
University of California, San Francisco | 3-7
The RN workforce in California is expected to become more diverse over the next 40 years, as the share of White and Filipino nurses decrease and the share of Asian and Hispanic nurses increase. However, these projections suggest that there will continue to be greater diversity in the general population than among California nurses.
Since these projections use past changes in diversity among nursing school graduates and graduation rates by race to predict future diversity, it is possible that diversity among nursing school graduates may change in ways not reflected in the data. It is also possible that factors not included in the model will add increased diversity to the nursing workforce.
Chart 8. Projected Racial Composition of Central Valley RNs, 2008-2050

Nursing Diversity in California | Central Valley
University of California, San Francisco | 3-8
When combining the projections of RNs and the general population, the data suggest that Hispanics will continue to be underrepresented in the nursing workforce, Blacks will remain slightly underrepresented, Native Americans will be equally represented by 2015, and all other racial groups will be overrepresented in comparison to the general population.
Chart 9. Projected Difference between RNs and the General Population by Race, Central Valley, 2010-2050

Nursing Diversity in California | Greater Sacramento
University of California, San Francisco | 4-1
Greater Sacramento Greater Sacramento represents El Dorado, Placer, Sacramento, Sutter, Yolo and Yuba counties.
Current Data Chart 1 shows the overrepresentation of White and Filipino RNs and the underrepresentation of Black and Hispanic RNs in comparison to both the patient population and the general population. Oftentimes, Filipinos are grouped with other Asians. Separating these ethnic groups shows that non-Filipino Asian RNs are not overrepresented to the same degree as Filipino RNs. Non-Filipino Asians RNs are equally represented in the patient population but underrepresented in comparison to the general population.
Chart 1. Racial Composition, Greater Sacramento
With the majority of White RNs older than 44 years of age, and larger numbers of younger RNs in other racial groups, these data show an increased diversity among younger nurses.
Chart 2. Racial Composition of RNs by Age, Greater Sacramento, 2010

Nursing Diversity in California | Greater Sacramento
University of California, San Francisco | 4-2
Regardless of race, 94% of Greater Sacramento nurses under the age of 55 work in nursing. Only 87% of Hispanic RNs under the age of 55 work in nursing, while all other races have more than 90% of their nurses under age 55 working in nursing. Even though Hispanic RNs in the region have the largest share of younger RNs not working in nursing, getting all of these RNs to work in nursing would not bridge the gap between Hispanic RNs and the general population. Table 1. Share of Central Valley RNs Less than 55 Years of Age Working in Nursing, by Race, 2010
Race Share of RNs Working in Nursing
White 92% Black 95% Hispanic 87% Filipino 100% Asian 94% Native American 100% Other 100% Total 94% Source: BRN Survey of RNs, 2010
Since the majority of RNs work in the acute care setting, taking a closer look at this setting shows a greater share of Hispanic, Asian and Black acute care patients than nurses working in that setting.
Chart 3. Racial Distribution of Acute Care Patients and RNs Employed in Acute Care, Greater Sacramento, 2008

Nursing Diversity in California | Greater Sacramento
University of California, San Francisco | 4-3
Student data from RN programs provide insight into the diversity of new nurses. Overall racial diversity among RN program graduates in Greater Sacramento was at its highest (41% of graduates) in 2008 and 2010. While the shares of Asians and those of other undefined races have increased over time, the shares of other ethnic minorities have declined.
Table 2. Racial Composition of the Greater Sacramento’s RN Program Graduates, 2001-2010
2001 2002 2003 2004 2005 2006 2007 2008 2009 2010
Native American 2% 1% 1% 1% 1% 2% 2% 0% 1% 0% Asian 9% 6% 8% 10% 9% 8% 11% 10% 12% 12% Black 5% 5% 6% 4% 4% 5% 3% 5% 3% 5% Filipino 5% 6% 7% 8% 7% 9% 9% 11% 5% 6% Hispanic 7% 12% 11% 7% 10% 8% 9% 8% 8% 7% White 72% 71% 66% 71% 70% 68% 65% 59% 69% 59% Other race
7% 2% 12%
Ethnic Minorities 28% 29% 34% 29% 30% 32% 35% 41% 31% 41% Source: BRN Annual School Report, 2001-2010
Table 3 shows that diversity among new students in RN programs increased from 2004 to 2008 but decreased dramatically over the last two years. These data in combination with the five-year average completion rates by race, shown in Chart 4, suggest a decrease in racial diversity in the region over the next two years. Table 3. Racial Composition of New Student Enrollments in Greater Sacramento’s RN Programs, 2001-2010
2001 2002 2003 2004 2005 2006 2007 2008 2009 2010
Native American 2% 3% 1% 1% 1% 1% 1% 0% 1% 1% Asian 11% 11% 8% 11% 11% 13% 15% 11% 14% 7% Black 9% 5% 5% 5% 5% 6% 6% 4% 6% 5% Filipino 6% 8% 9% 6% 9% 9% 11% 18% 9% 7% Hispanic 9% 8% 12% 11% 9% 10% 8% 10% 11% 6% White 63% 66% 65% 66% 65% 62% 59% 53% 54% 69% Other race
4% 4% 5%
Ethnic Minorities 37% 34% 35% 34% 35% 38% 41% 47% 46% 31% Source: BRN Annual School Report, 2001-2010

Nursing Diversity in California | Greater Sacramento
University of California, San Francisco | 4-4
Chart 4. Average RN Program Completion Rate by Race, Greater Sacramento, 2006-2010
Although the racial composition of RNs may not match the population, language abilities of RNs indicate whether nurses can provide some aspects of culturally competent care, regardless of race.
Data from the 2010 Census indicate that 13% of people in Greater Sacramento speak Spanish at home and that 58% of these Spanish speakers also speak English very well.1 On average, younger Spanish speakers have better English language skills than their older counterparts2
1 These data are based on estimates generated by the American Community Survey (ACS), which generates publicly available language use estimates based on 2010 Census data. Greater Sacramento estimates do not include El Dorado, Sutter or Yuba counties, since there were insufficient data for those counties to produce estimates.
, suggesting that Spanish language skills among RNs may become less of a concern in providing culturally competent care to Hispanics over time.
2 Of Spanish speakers in Greater Sacramento, 76% of those 5 to 17 years of age speak English very well, while 54% of those 18-64 years of age and 39% of those 65 years of age and older have similar English language skills (Census, 2010).

Nursing Diversity in California | Greater Sacramento
University of California, San Francisco | 4-5
Overall, 23% of Greater Sacramento RNs speak Spanish (24% in 2008 and 21% in 2010). Almost all of the Greater Sacramento RNs who identify as Hispanic speak Spanish (93% in 2008 and 94% in 2010), leaving the remaining Spanish speakers as non-Hispanic. While Hispanic nurses (3%) are underrepresented in comparison to the Hispanic population (21%), 29% of RNs are either Hispanic or speak Spanish (31% in 2008 and 27% in 2010), which may address the gap in culturally competent care that exists between the nursing workforce and the general population.
Chart 5. Share of Greater Sacramento RNs that Speak Spanish, 2008 & 2010
Data from the 2010 Census indicate that 8% of people in Greater Sacramento speak an Asian or Pacific Island language at home and that 53% of them also speak English very well.3 On average, those of younger age groups have better English language skills than their older counterparts4
, suggesting that Asian or Pacific Island language skills among RNs may become less of a concern in providing culturally competent care to Asians over time. However, only 5% of Greater Sacramento RNs speak an Asian language other than Tagalog, and almost all of these RNs are non-Filipino Asian (>99% in 2008 and 2010). These data suggest that increasing the share of RNs with non-Filipino Asian language skills may improve culturally competent care for non-Filipino Asian patients.
The data shown thus far illustrate that Black and Hispanic RNs are underrepresented in comparison to the general population in Greater Sacramento. Racial composition of new nurses graduating from Greater Sacramento’s RN programs and recent RN student enrollments in these programs suggest that these disparities will continue over the next several years. Spanish language skills of non-Hispanic RNs may
3 These data are based on estimates generated by the American Community Survey (ACS), which generates publicly available language use estimates based on 2010 Census data. 4 Of Asian or Pacific Island language speakers in Greater Sacramento, 70% of those 5 to 17 years of age speak English very well, while 54% of those 18-64 years of age and 30% of those 65 years of age and older have the similar English language skills (Census, 2010).

Nursing Diversity in California | Greater Sacramento
University of California, San Francisco | 4-6
provide some culturally competent care for Hispanic patients, but the difference in racial composition between the population and the nursing workforce remains.
Population Projections Current data show that Hispanics and Blacks are underrepresented in the nursing workforce. Projecting the racial composition of RNs and the general population over the next 40 years allows us to show how these populations may change over time and whether additional steps to increase the diversity of the nursing workforce should be prioritized.
Population projections5
provided by the California Department of Finance suggest that the number of Hispanics in Greater Sacramento is expected to grow dramatically over the next forty years. The number of Whites in the region is also expected to grow and remain greater than the number of Hispanics. The number of non-Filipino Asians is also expected to grow at a moderate rate, while those of other racial groups are expected to show small increases over time.
Chart 6. Projected Racial Composition of the Greater Sacramento’s Population, 2000-2050
The RN workforce in Greater Sacramento is expected to become more diverse, with increases in the share of Hispanics, Blacks and non-Filipino Asians and decreases in the shares of White and Filipino nurses. However, these projections suggest that there will continue to be greater diversity in the general population than among nurses in the region.
5 Native Americans and those of other undefined racial/ethnic groups comprise less than 5% of the current general population and nursing workforce in the region. Since these racial/ethnic groups show little change within the next 40 years, these groups were excluded from the charts and tables in this section of the report.

Nursing Diversity in California | Greater Sacramento
University of California, San Francisco | 4-7
Since these projections use past changes in diversity among nursing school graduates and graduation rates by race to predict future diversity, it is possible that diversity among nursing school graduates may change in ways not reflected in the data. It is also possible that factors not included in the model will add increased diversity to the nursing workforce.
Chart 7. Projected Racial Composition of Greater Sacramento RNs, 2008-2050
When combining the projections of RNs and the general population, the data in Chart 8 suggest that Hispanics will continue to be underrepresented – and become more underrepresented – in the nursing workforce over time, Blacks will be slightly underrepresented, non-Filipino Asians and Native Americans will become more equally represented over time, and all other racial groups will be overrepresented in comparison to the general population.
Chart 8. Projected Difference between RNs and the General Population by Race, Greater Sacramento, 2010-2050

Nursing Diversity in California | Los Angeles Area
University of California, San Francisco | 5-1
Los Angeles Area The Los Angeles Area represents Los Angeles and Ventura counties.
Current Data Chart 1 shows the overrepresentation of White, Asian and Filipino RNs and the underrepresentation of Black and Hispanic RNs in comparison to both the patient population and the general population.
Chart 1. Racial Composition, Los Angeles Area
With the majority of White RNs older than 44 years of age, and larger numbers of younger RNs in other racial groups, these data show an increased diversity among younger nurses.
Chart 2. Racial Composition of RNs by Age, Los Angeles Area, 2010

Nursing Diversity in California | Los Angeles Area
University of California, San Francisco | 5-2
Regardless of race, 92% of Los Angeles Area nurses under the age of 55 work in nursing. Whites (89%) and Asians (89%) have less than 90% of their nurses younger than 55 years of age working in nursing. All Black and 94% of Hispanic RNs younger than 55 years of age work in nursing, indicating that unemployed Black and Hispanic nurses cannot bridge the gap between Blacks and Hispanics in the nursing workforce and those in the general population.
Table 1. Share of Los Angeles RNs Less than 55 Years of Age Working in Nursing, by Race, 2010
Race Share of RNs Working in Nursing
White 89% Black 100% Hispanic 94% Filipino 95% Asian 89% Other 91% Total 92% Source: BRN Survey of RNs, 2010
Since the majority of RNs work in the acute care setting, taking a closer look at this setting shows a greater share of White, Hispanic and Asian acute care patients than nurses working in that setting.
Chart 3. Racial Distribution of Acute Care Patients and RNs Employed in Acute Care, Los Angeles Area, 2008

Nursing Diversity in California | Los Angeles Area
University of California, San Francisco | 5-3
Student data from RN programs provide insight into the diversity of new nurses. Table 2 shows that the share of ethnic minorities among RN program graduates has remained about the same since 2006, but the share of Hispanics and Blacks – the two racial groups most underrepresented in the nursing workforce in comparison to the population – has decreased, while the share of non-Filipino Asians has increased. As shown in Chart 4, the increase in diversity in Bachelor (BSN) degree programs since 2006 was offset by the lack of changes in Associate (ADN) programs and the declining diversity in Entry-level Master’s (ELM) programs.
Table 2. Racial Composition of the Los Angeles Area’s RN Program Graduates, 2001-2010
2001 2002 2003 2004 2005 2006 2007 2008 2009 2010
Native American 1% 1% 0% 0% 0% 1% 0% 0% 0% 0% Asian 10% 11% 9% 13% 13% 13% 16% 17% 19% 21% Black 13% 10% 16% 14% 14% 10% 9% 9% 9% 7% Filipino 15% 15% 16% 14% 16% 17% 19% 18% 19% 17% Hispanic 29% 26% 29% 30% 31% 26% 24% 22% 21% 22% White 33% 37% 30% 29% 25% 32% 32% 30% 27% 30% Other race
3% 4% 3%
Ethnic Minorities 67% 63% 70% 71% 75% 68% 68% 70% 73% 70% Source: BRN Annual School Report, 2001-2010
Chart 4. Ethnic Minorities among the Los Angeles Area’s RN Program Graduates by Degree Earned, 2001-2010

Nursing Diversity in California | Los Angeles Area
University of California, San Francisco | 5-4
Looking at new student enrollments, Table 3 shows a slight increase in the share of ethnic minorities over the past ten years. During this time, the shares of Hispanic and Black nurses have declined, while the shares of Filipino and non-Filipino Asian have increased.
Table 3. Racial Composition of New Student Enrollments in the Los Angeles Area’s RN Programs, 2001-2010
2001 2002 2003 2004 2005 2006 2007 2008 2009 2010 Native American 1% 1% 0% 0% 0% 0% 1% 0% 0% 0% Asian 10% 11% 15% 14% 11% 15% 18% 18% 20% 18% Black 15% 11% 15% 12% 11% 12% 11% 9% 9% 8% Filipino 15% 16% 15% 17% 22% 19% 20% 19% 18% 18% Hispanic 28% 28% 27% 26% 23% 25% 23% 22% 23% 22% White 32% 32% 28% 31% 33% 29% 28% 28% 26% 30% Other race
3% 4% 3%
Ethnic Minorities 68% 68% 72% 69% 67% 71% 72% 72% 74% 70% Source: BRN Annual School Report, 2001-2010
The five-year average completion rates by race indicate that a smaller share of Blacks, Filipinos and Hispanics that started nursing programs completed those programs. Addressing lower completion rates may help further increase the diversity among nursing graduates.
Chart 5. Average RN Program Completion Rate by Race, Los Angeles Area, 2006-2010
Although the racial composition of RNs may not match the population, language abilities of RNs indicate whether nurses can provide some aspects of culturally competent care, regardless of race.
Data from the 2010 Census indicate that 39% of people in the Los Angeles Area speak Spanish at home and that 53% of these Spanish speakers also speak English very well.1
1 These data are based on estimates generated by the American Community Survey (ACS), which generates publicly available language use estimates based on 2010 Census data.
On average, younger Spanish speakers

Nursing Diversity in California | Los Angeles Area
University of California, San Francisco | 5-5
have better English language skills than their older counterparts2
Overall, 28% of Los Angeles Area RNs speak Spanish (30% in 2008 and 27% in 2010). Almost all of the Los Angeles Area RNs who identify as Hispanic speak Spanish (>99% in 2008 and 2010), leaving the remaining Spanish speakers as non-Hispanic. While Hispanic nurses (9%) are underrepresented in comparison to the Hispanic population (47%), the 28% of RNs who are either Hispanic or speak Spanish may address some of the gap in culturally competent care that exists between the nursing workforce and the general population.
, suggesting that Spanish language skills among RNs may become less of a concern in providing culturally competent care to Hispanics over time.
Chart 6. Share of Los Angeles Area RNs that Speak Spanish, 2008 & 2010
Data from the 2010 Census indicate that 10% of people in the Los Angeles Area speak an Asian or Pacific Island language and that 49% of them also speak English very well.3 On average, those of younger age groups have better English language skills than their older counterparts4
, suggesting that Asian or Pacific Island language skills among RNs may become less of a concern in providing culturally competent to Asians over time. Since 10% of California RNs speak an Asian language other than Tagalog, the data suggest that recruiting RNs with Asian language skills is not a high priority for this region.
The data shown thus far illustrate that Black and Hispanic RNs are underrepresented in comparison to the general population in the Los Angeles Area. Racial composition of new nurses graduating from the Los Angeles Area’s RN programs and recent RN student enrollments in these programs suggest that these
2 Of Spanish speakers in the Los Angeles Area, 79% of those 5 to 17 years of age speak English very well, while 47% of those 18-64 years of age and 27% of those 65 years of age and older have similar English language skills (Census, 2010). 3 These data are based on estimates generated by the American Community Survey (ACS), which generates publicly available language use estimates based on 2010 Census data. 4 Of Asian or Pacific Island language speakers in the Los Angeles Area, 78% of those 5 to 17 years of age speak English very well, while 50% of those 18-64 years of age and 23% of those 65 years of age and older have the similar English language skills (Census, 2010).

Nursing Diversity in California | Los Angeles Area
University of California, San Francisco | 5-6
disparities will continue over the next several years. Spanish language skills of non-Hispanic RNs may provide some culturally competent care for Hispanic patients, but the difference in racial composition between the population and the nursing workforce remains.
Population Projections Current data show that Hispanics and Blacks are underrepresented in the nursing workforce. Projecting the racial composition of RNs and the general population over the next 40 years allows us to show how these populations may change over time and whether additional steps to increase the diversity of the nursing workforce should be prioritized.
Population projections5
provided by the California Department of Finance suggest that the number of Hispanics in the Los Angeles Area is expected to double in the next forty years, while the number of Whites is expected to decline. The number of non-Filipino Asians is also expected to grow at a moderate rate, while the number of Blacks is expected to slowly decline.
Chart 7. Projected Racial Composition of the Los Angeles Area’s Population, 2000-2050
The RN workforce in the Los Angeles Area is expected to become more diverse, with increasing shares of Asians and Hispanics and decreasing shares of Whites and Filipinos. However, these projections suggest that there will continue to be greater diversity in the general population than among nurses in the region.
5 Native Americans and those of other undefined racial/ethnic groups comprise less than 5% of the current general population and nursing workforce in the region. Since these racial/ethnic groups show little change within the next 40 years, these groups were excluded from the charts and tables in this section of the report.
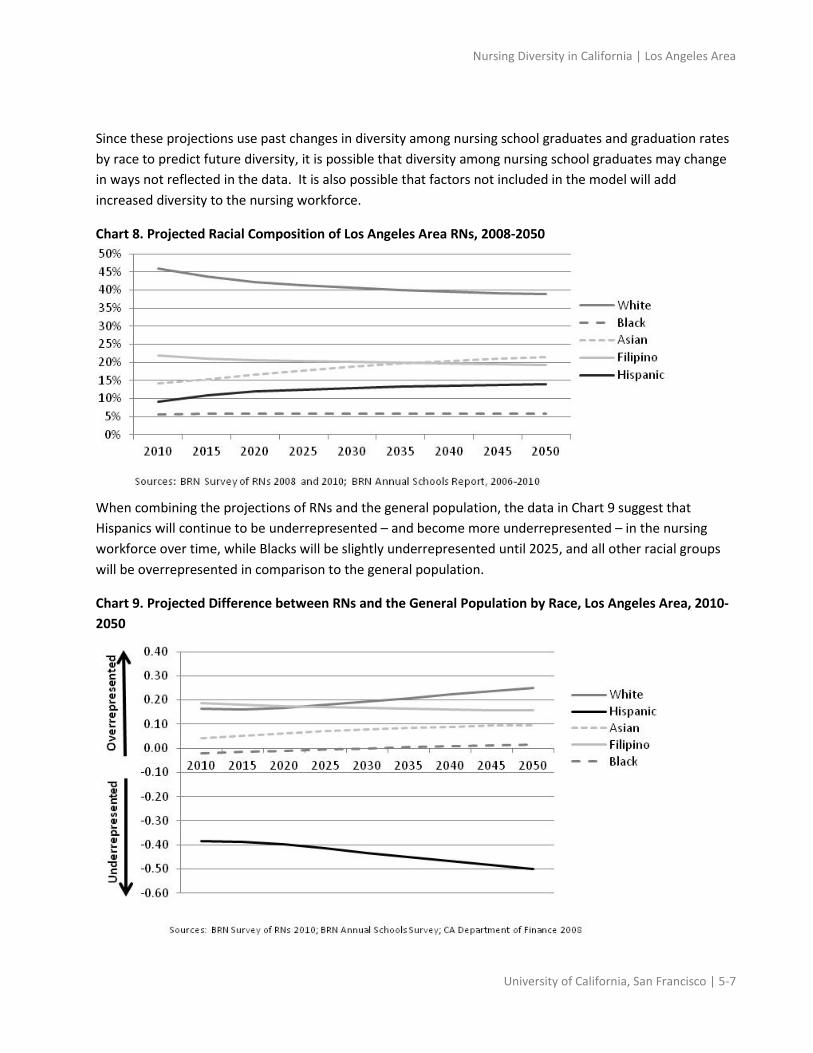
Nursing Diversity in California | Los Angeles Area
University of California, San Francisco | 5-7
Since these projections use past changes in diversity among nursing school graduates and graduation rates by race to predict future diversity, it is possible that diversity among nursing school graduates may change in ways not reflected in the data. It is also possible that factors not included in the model will add increased diversity to the nursing workforce.
Chart 8. Projected Racial Composition of Los Angeles Area RNs, 2008-2050
When combining the projections of RNs and the general population, the data in Chart 9 suggest that Hispanics will continue to be underrepresented – and become more underrepresented – in the nursing workforce over time, while Blacks will be slightly underrepresented until 2025, and all other racial groups will be overrepresented in comparison to the general population.
Chart 9. Projected Difference between RNs and the General Population by Race, Los Angeles Area, 2010-2050

Nursing Diversity in California | Northern California
University of California, San Francisco | 6-1
Northern California Northern California represents Butte, Colusa, Del Norte, Glenn, Humboldt, Lake, Lassen, Mendocino, Modoc, Plumas, Shasta, Siskiyou, Sierra, Tehama, Trinity and Nevada counties.
Current Data Chart 1 shows the slight overrepresentation of White and Filipino RNs and the underrepresentation of Black, Hispanic and Native American RNs in comparison to both the patient population and the general population. Non-Filipino Asian RNs are overrepresented in comparison to the patient population but underrepresented in comparison to the general population.
Chart 1. Racial Composition, Northern California
While the majority of White RNs in Northern California are older than 44 years of age, most younger nurses in the region are also White, indicating little change in diversity among younger nurses in the region.
Chart 2. Racial Composition of RNs by Age, Northern California, 2010

Nursing Diversity in California | Northern California
University of California, San Francisco | 6-2
Regardless of race, 95% of Northern California area nurses under the age of 55 work in nursing. All Black and Hispanic RNs younger than 55 years of age work in nursing, indicating that the unemployed RNs in these racial groups cannot bridge the gap between Blacks and Hispanics in the nursing workforce and those in the general population. Only 70% of Native Americans younger than 55 years of age work in nursing, indicating that increased employment rates of these nurses could help address the disparity between the share of Native Americans in the nursing workforce and those in the general population in the region.
Table 1. Share of Northern California RNs Less than 55 Years of Age Working in Nursing, by Race, 2010
Race Share of RNs Working in Nursing
White 95% Black 100% Hispanic 100% Filipino 87% Asian 100% Native American 70% Other 90% Total 95% Source: BRN Survey of RNs, 2010
Since the majority of California RNs work in the acute care setting, taking a closer look at this setting shows a greater share of Hispanic, Asian and Black acute care patients than nurses working in that setting.
Chart 3. Racial Distribution of Acute Care Patients and RNs Employed in Acute Care, Northern California, 2008

Nursing Diversity in California | Northern California
University of California, San Francisco | 6-3
Student data from RN programs provide insight into the diversity of new nurses. Since 2005, increases in Asian and Hispanic RN graduates led to an overall increase in diversity among graduates of RN programs in Northern California. While these data suggest an increase in diversity among nurses over time, the region is less diverse in 2010 than it was in 2001.
Table 2. Racial Composition of the Northern California’s RN Program Graduates, 2001-2010
2001 2002 2003 2004 2005 2006 2007 2008 2009 2010
Native American 4% 2% 7% 0% 4% 8% 4% 3% 4% 3% Asian 4% 3% 5% 6% 0% 0% 2% 2% 1% 5% Black 4% 0% 0% 0% 1% 0% 0% 4% 0% 1% Filipino 2% 2% 2% 0% 0% 2% 0% 2% 1% 1% Hispanic 11% 5% 7% 2% 4% 9% 4% 10% 8% 7% White 76% 89% 80% 92% 92% 81% 89% 78% 81% 80% Other race
2% 5% 4%
Ethnic Minorities 24% 11% 20% 8% 8% 19% 11% 22% 19% 20% Source: BRN Annual School Report, 2001-2010
Table 3 shows an increase in the share of ethnic minorities among new students enrolling in nursing programs in the region over the past ten years, and thus, a decrease in the share of Whites. During this time, the share of Native Americans and those of other undefined races grew, while the share of Asians, Blacks and Filipinos showed a slight increase, and the share of Hispanics decreased slightly.
Table 3. Racial Composition of New Student Enrollments in the Northern California’s RN Programs, 2001-2010
2001 2002 2003 2004 2005 2006 2007 2008 2009 2010 Native American 1% 0% 3% 6% 4% 3% 4% 4% 6% 5% Asian 6% 1% 3% 4% 0% 3% 0% 3% 4% 8% Black 0% 0% 2% 3% 1% 1% 2% 2% 2% 1% Filipino 0% 1% 0% 0% 3% 1% 2% 1% 1% 1% Hispanic 9% 6% 9% 4% 5% 5% 11% 7% 7% 8% White 84% 91% 82% 84% 86% 88% 80% 67% 76% 70% Other race
16% 4% 6%
Ethnic Minorities 16% 9% 18% 16% 14% 12% 20% 33% 24% 30% Source: BRN Annual School Report, 2001-2010

Nursing Diversity in California | Northern California
University of California, San Francisco | 6-4
The five-year average completion rates by race indicate that a smaller share of Asians and Filipinos that started nursing programs completed those programs. However, there are so few nursing students of these racial groups in Northern California that these data may not be indicative of future success among Asians and Filipinos in nursing programs. The high graduation rate of Hispanics and Native Americans, coupled with increased enrollment for these groups, indicates that Hispanics and Native Americans may increase their share in the nursing workforce in the coming years.
Chart 4. Average RN Program Completion Rate by Race, Northern California, 2006-2010

Nursing Diversity in California | Northern California
University of California, San Francisco | 6-5
Although the racial composition of RNs may not match the population, language abilities of RNs indicate whether nurses can provide some aspects of culturally competent care, regardless of race.
Overall, 62% of Northern California RNs speak Spanish (56% in 2008 and 69% in 2010). None of the Asian or Black RNs in the region reported having Spanish language skills. All of Northern California RNs who identify as Hispanic speak Spanish, leaving the remaining Spanish speakers as non-Hispanic. While Hispanic nurses (3%) are underrepresented in comparison to the Hispanic population (15%), 62% of RNs are either Hispanic or speak Spanish, which helps address the gap in culturally competent care that exists between the nursing workforce and the general population.1
Chart 5. Share of Northern California RNs that Speak Spanish*, 2008 & 2010
While many Asian and Filipino RNs in Northern California speak Tagalog or another Asian language, there are so few Asians and Filipinos in both the nursing workforce and the general population in the region that data on these language skills among Asian nurses may be unreliable and are not included.
The data shown thus far illustrate that Hispanic, Native American and Black RNs are currently underrepresented in comparison to the population. Racial composition of RNs entering and graduating from Northern California’s RN programs suggests increasing diversity among the nursing workforce in the region. Since a large share of the non-Hispanic nursing workforce speaks Spanish, these nurses may provide some culturally competent care for Hispanic patients, but the difference in racial composition between the population and the nursing workforce remains.
1 Due to the small population in the counties in the Northern California region, data estimates on the share of the region’s population that speaks a language other than English at home are not available.

Nursing Diversity in California | Northern California
University of California, San Francisco | 6-6
Population Projections Current data show that Hispanics, Native Americans and Blacks are underrepresented in the nursing workforce. Projecting the racial composition of RNs and the general population over the next 40 years allows us to show how these populations may change over time and whether additional steps to increase the diversity of the nursing workforce should be prioritized.
Population projections2
provided by the California Department of Finance suggest growth in the number of Whites and Hispanics in Northern California over the next forty years, while other racial groups show a small amount of growth over the same time period. Whites are expected to remain the largest share of the population in the region.
Chart 6. Projected Racial Composition of the Northern California’s Population, 2000-2050
The share of White RNs in Northern California is expected to decrease over the next forty years, while the share of RNs in other racial groups is expected to grow slightly, suggesting that there will continue to be greater diversity in the general population than among Northern California nurses.
2 Those of other undefined racial/ethnic groups comprise less than 5% of the current general population and nursing workforce in the region. Since this racial/ethnic group shows little change within the next 40 years, this group was excluded from the charts and tables in this section of the report.

Nursing Diversity in California | Northern California
University of California, San Francisco | 6-7
Since these projections use past changes in diversity among nursing school graduates and graduation rates by race to predict future diversity, it is possible that diversity among nursing school graduates may change in ways not reflected in the data. It is also possible that factors not included in the model will add increased diversity to the nursing workforce.
Chart 7. Projected Racial Composition of Northern California RNs, 2008-2050
When combining the projections of RNs and the general population, the data suggest that Hispanics, Native Americans and Blacks are, and will continue to be, underrepresented in the nursing workforce in comparison to the general population in the region, while Whites, Filipinos and Asians will be overrepresented. Chart 8 shows that Hispanics will become more underrepresented over time.
Chart 8. Projected Difference between RNs and the General Population by Race, Northern California, 2010-2050

Nursing Diversity in California | Inland Empire
University of California, San Francisco | 7-1
Inland Empire The Inland Empire represents Orange, Riverside and San Bernardino counties.
Current Data Chart 1 shows the overrepresentation of Filipino RNs, the slight overrepresentation of Black and Native American RNs, and the underrepresentation of Asian and Hispanic RNs in comparison to both the patient population and the general population. White RNs are equally represented in the patient population and overrepresented in comparison to the general population.
Chart 1. Racial Composition, Inland Empire
With the majority of White RNs older than 44 years of age, and larger numbers of younger RNs in other racial groups, these data show an increased diversity among younger nurses.
Chart 2. Racial Composition of RNs by Age, Inland Empire, 2010

Nursing Diversity in California | Inland Empire
University of California, San Francisco | 7-2
Regardless of race, 92% of Inland Empire nurses under the age of 55 work in nursing. Almost all Hispanics younger than 55 work in nursing (95%) while only 87% of Asian RNs younger than 55 work in nursing. These data indicate that increasing employment rates among Asian nurses could help bridge the gap between Asians in the nursing workforce and those in the general population but the same cannot occur for Hispanics.
Table 1. Share of Inland Empire RNs Less than 55 Years of Age Working in Nursing, by Race, 2010
Race Share of RNs Working in Nursing
White 92% Black 100% Hispanic 95% Filipino 92% Asian 87% Native American 100% Other 72% Total 92% Source: BRN Survey of RNs, 2010
Since the majority of RNs work in the acute care setting, taking a closer look at this setting shows a greater share of Hispanic, Black and White acute care patients than nurses working in that setting.
Chart 3. Racial Distribution of Acute Care Patients and RNs Employed in Acute Care, Inland Empire, 2008

Nursing Diversity in California | Inland Empire
University of California, San Francisco | 7-3
Student data from RN programs provide insight into the diversity of new nurses. Since 2005, there has been increasing diversity among graduates of RN programs, suggesting an increase in diversity among nurses over time. Table 2 and Chart 4 show increased racial diversity in Associate (ADN) and Entry-level Master’s (ELM) programs but declining diversity in Bachelor (BSN) degree programs. RN graduates of Asian, Filipino and other undisclosed races represent the greatest increases in diversity since 2005.
Table 2. Racial Composition of the Inland Empire’s RN Program Graduates, 2001-2010
2001 2002 2003 2004 2005 2006 2007 2008 2009 2010
Native American 0% 1% 1% 1% 0% 0% 1% 1% 0% 0% Asian 15% 9% 13% 11% 10% 10% 15% 11% 14% 19% Black 5% 6% 6% 8% 5% 6% 7% 6% 6% 6% Filipino 7% 8% 7% 7% 7% 12% 9% 12% 12% 14% Hispanic 19% 22% 21% 20% 22% 21% 20% 20% 18% 18% White 54% 55% 52% 52% 56% 51% 48% 47% 40% 40% Other race
3% 9% 2%
Ethnic Minorities 46% 45% 48% 48% 44% 49% 52% 53% 60% 60% Source: BRN Annual School Report, 2001-2010
Chart 4. Ethnic Minorities among the Inland Empire’s RN Program Graduates by Degree Earned, 2001-2010

Nursing Diversity in California | Inland Empire
University of California, San Francisco | 7-4
Looking at new student enrollments, Table 3 shows increasing shares of Asian and Filipino nurses and declining shares of Hispanic and White student enrollments over the past ten years. These data coupled with the lower five-year average completion rates of Hispanic and White students shown in Chart 5 suggest further declines in the share of new White and Hispanic RNs entering the workforce. Addressing these lower completion rates may help increase the diversity among nursing graduates.
Table 3. Racial Composition of New Student Enrollments in the Inland Empire’s RN Programs, 2001-2010
2001 2002 2003 2004 2005 2006 2007 2008 2009 2010 Native American 1% 1% 1% 1% 1% 1% 1% 1% 1% 0% Asian 12% 12% 15% 15% 10% 13% 17% 17% 21% 17% Black 10% 6% 6% 6% 4% 9% 6% 6% 6% 5% Filipino 7% 7% 8% 6% 10% 12% 12% 11% 15% 19% Hispanic 21% 21% 23% 24% 27% 21% 19% 18% 19% 17% White 48% 52% 48% 49% 48% 44% 46% 46% 36% 38% Other race
2% 3% 4%
Ethnic Minorities 52% 48% 52% 51% 52% 56% 54% 54% 64% 62% Source: BRN Annual School Report, 2001-2010
Chart 5. Average RN Program Completion Rate by Race, Inland Empire, 2006-2010

Nursing Diversity in California | Inland Empire
University of California, San Francisco | 7-5
Although the racial composition of RNs may not match the population, language abilities of RNs indicate whether nurses can provide some aspects of culturally competent care, regardless of race.
Data from the 2010 Census indicate that 31% of people in the Inland Empire region speak Spanish at home and that 55% of these Spanish speakers also speak English very well.1 On average, younger Spanish speakers have better English language skills than their older counterparts2
Overall, 35% of Inland Empire RNs speak Spanish (37% in 2008 and 33% in 2010). All of the Inland Empire RNs who identify as Hispanic speak Spanish, leaving the remaining Spanish speakers as non-Hispanic. While Hispanic nurses (13%) are underrepresented in comparison to the Hispanic population (42%), 35% of RNs are either Hispanic or speak Spanish (37% in 2008 and 33% in 2010), which may address some of the gap in culturally competent care that exists between the nursing workforce and the general population.
, suggesting that Spanish language skills among RNs may become less of a concern in providing culturally competent care to Hispanics over time.
Chart 6. Share of Inland Empire RNs that Speak Spanish, 2008 & 2010
In addition to Spanish, Tagalog and other Asian languages are commonly spoken among RNs. Since Filipino RNs are overrepresented compared to the general population and the patient population, recruiting RNs who speak Tagalog is not a priority for this region. However, non-Filipino Asians are underrepresented in comparison to the general population in the Inland Empire.
1 These data are based on estimates generated by the American Community Survey (ACS), which generates publicly available language use estimates based on 2010 Census data. 2 Of Spanish speakers in the Inland Empire, 76% of those 5 to 17 years of age speak English very well, while 49% of those 18-64 years of age and 35% of those 65 years of age and older have similar English language skills (Census, 2010).

Nursing Diversity in California | Inland Empire
University of California, San Francisco | 7-6
Data from the 2010 Census indicate that 8% of people in the Inland Empire speak an Asian or Pacific Island language at home and that 52% of them also speak English very well.3 On average, those of younger age groups have better English language skills than their older counterparts4
, suggesting that Asian or Pacific Island language skills among RNs may become less of a concern in providing culturally competent to Asians over time. However, only 3% of California RNs speak an Asian language other than Tagalog, and all of them are non-Filipino Asians (100% in 2008 and 2010). These data suggest that increasing the share of RNs with non-Filipino Asian language skills may improve culturally competent care for non-Filipino Asian patients in the region.
The data shown thus far illustrate that Hispanic and non-Filipino Asian RNs are currently underrepresented in comparison to the population. Racial composition of students entering and graduating from RN programs in the Inland Empire suggests increases in Asian RNs and decreases in Hispanic RNs over the next few years. Spanish language skills of non-Hispanic RNs may provide some culturally competent care for Hispanic patients, but the difference in racial composition between the population and the nursing workforce remains.
3 These data are based on estimates generated by the American Community Survey (ACS), which generates publicly available language use estimates based on 2010 Census data. 4 Of Asian or Pacific Island language speakers in the Inland Empire, 74% of those 5 to 17 years of age speak English very well, while 52% of those 18-64 years of age and 26% of those 65 years of age and older have the similar English language skills (Census, 2010).

Nursing Diversity in California | Inland Empire
University of California, San Francisco | 7-7
Population Projections Current data show that Hispanics and non-Filipino Asians are underrepresented in the nursing workforce. Projecting the racial composition of RNs and the general population over the next 40 years allows us to show how these populations may change over time and whether additional steps to increase the diversity of the nursing workforce should be prioritized.
Population projections5
provided by the California Department of Finance suggest that the number of Hispanics in the Inland Empire is expected to grow dramatically over the next forty years and exceed the number of Whites in the region within the next couple of years. While the number of Whites in the region is expected to decline, other races show increased representation in the population over time.
Chart 7. Projected Racial Composition of the Inland Empire’s Population, 2000-2050
5 Native Americans and those of other undefined racial/ethnic groups comprise less than 5% of the current general population and nursing workforce in the region. Since these racial/ethnic groups show little change within the next 40 years, these groups were excluded from the charts and tables in this section of the report.

Nursing Diversity in California | Inland Empire
University of California, San Francisco | 7-8
The RN workforce in the Inland Empire is expected to become more diverse, with White nurses comprising less than half of the workforce by 2015 and Asians and Hispanics increasing their shares in the workforce. However, these projections suggest that there will continue to be greater diversity in the general population than among nurses in the Inland Empire.
Since these projections use past changes in diversity among nursing school graduates and graduation rates by race to predict future diversity, it is possible that diversity among nursing school graduates may change in ways not reflected in the data. It is also possible that factors not included in the model will add increased diversity to the nursing workforce.
Chart 8. Projected Racial Composition of Inland Empire RNs, 2008-2050

Nursing Diversity in California | Inland Empire
University of California, San Francisco | 7-9
When combining the projections of RNs and the general population, the data suggest that Hispanics will continue to be underrepresented – and will become more underrepresented – in the nursing workforce over time, Asians will be slightly underrepresented until 2015, and all other racial groups will be overrepresented in comparison to the general population.
Chart 9. Projected Difference between RNs and the General Population by Race, Inland Empire, 2010-2050

Nursing Diversity in California | Southern Border
University of California, San Francisco | 8-1
Southern Border The Southern Border represents Imperial and San Diego counties.
Current Data Chart 1 shows the overrepresentation of White and Filipino RNs and the underrepresentation of Black and Hispanic RNs in comparison to both the patient population and the general population. Oftentimes, Filipinos are grouped with other Asians. Separating these ethnic groups shows that non-Filipino Asian RNs are not overrepresented to the same degree as Filipino RNs. Non-Filipino Asian RNs are overrepresented in comparison to the patient population but underrepresented in comparison to the general population.
Chart 1. Racial Composition, Southern Border
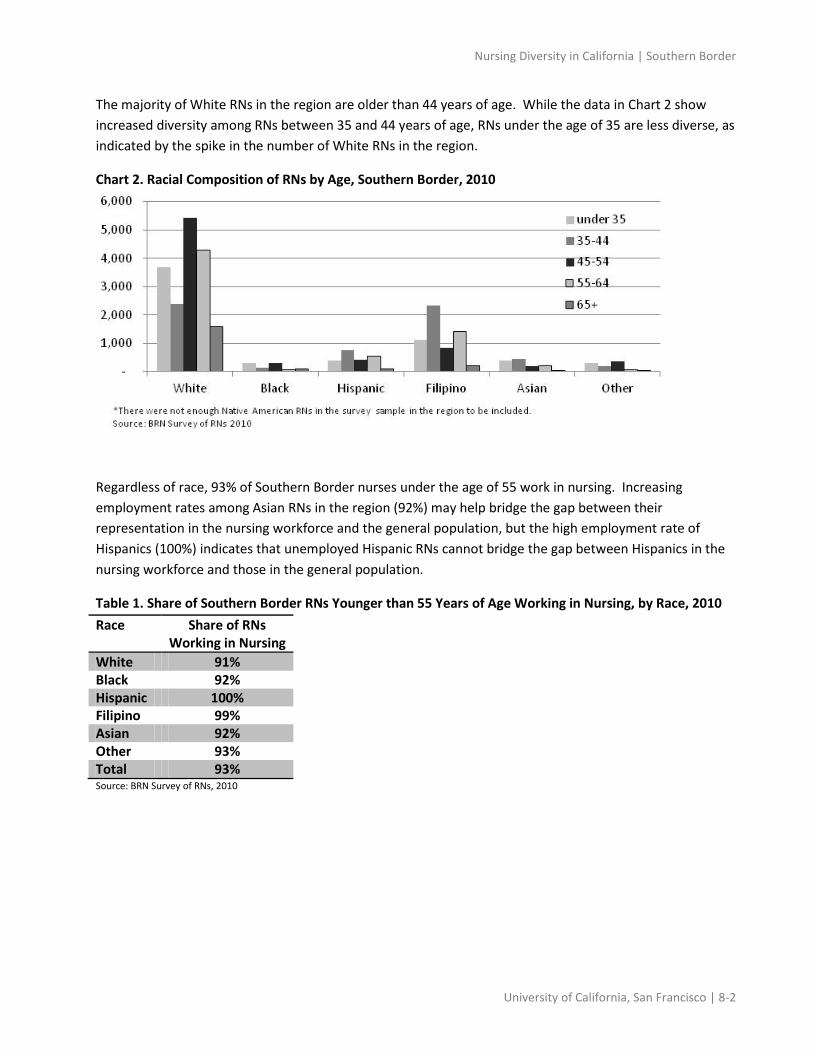
Nursing Diversity in California | Southern Border
University of California, San Francisco | 8-2
The majority of White RNs in the region are older than 44 years of age. While the data in Chart 2 show increased diversity among RNs between 35 and 44 years of age, RNs under the age of 35 are less diverse, as indicated by the spike in the number of White RNs in the region.
Chart 2. Racial Composition of RNs by Age, Southern Border, 2010
Regardless of race, 93% of Southern Border nurses under the age of 55 work in nursing. Increasing employment rates among Asian RNs in the region (92%) may help bridge the gap between their representation in the nursing workforce and the general population, but the high employment rate of Hispanics (100%) indicates that unemployed Hispanic RNs cannot bridge the gap between Hispanics in the nursing workforce and those in the general population.
Table 1. Share of Southern Border RNs Younger than 55 Years of Age Working in Nursing, by Race, 2010 Race Share of RNs
Working in Nursing White 91% Black 92% Hispanic 100% Filipino 99% Asian 92% Other 93% Total 93% Source: BRN Survey of RNs, 2010

Nursing Diversity in California | Southern Border
University of California, San Francisco | 8-3
Since the majority of RNs work in the acute care setting, taking a closer look at this setting shows a greater share of Hispanic, Asian and Black acute care patients than nurses working in that setting.
Chart 3. Racial Distribution of Acute Care Patients and RNs Employed in Acute Care, Southern Border, 2008
Student data from RN programs provide insight into the diversity of new nurses. The diversity among RN program graduates in the region has fluctuated over the past ten years. During this time, there were increases in the share of Asian and White graduates, a slight increase in the share of Filipino graduates, and declines in the shares of both Black and Hispanic graduates. While there has been increasing diversity among graduates of RN programs since 2004, the trend over the ten-year period shows that diversity in the region was slightly lower in 2010 than in 2001.
Table 2. Racial Composition of the Southern Border’s RN Program Graduates, 2001-2010
2001 2002 2003 2004 2005 2006 2007 2008 2009 2010
Native American
1% 1% 1% 4% 1% 1% 1% 1% 1% Asian 5% 4% 6% 3% 4% 9% 7% 8% 11% 11% Black 10% 8% 4% 4% 6% 5% 5% 5% 3% 4% Filipino 15% 17% 17% 13% 14% 13% 20% 20% 19% 17% Hispanic 27% 27% 20% 21% 22% 15% 19% 16% 19% 17% White 43% 44% 52% 57% 51% 57% 48% 48% 44% 46% Other race
2% 3% 3%
Ethnic Minorities 57% 56% 48% 43% 49% 43% 52% 52% 56% 54% Source: BRN Annual School Report, 2001-2010

Nursing Diversity in California | Southern Border
University of California, San Francisco | 8-4
Chart 4 shows that Associate degree (ADN) programs have had an overall decrease in racial diversity over the past ten years, while both Bachelor (BSN) and Entry-level Master’s (ELM) degree programs had increases in diversity.
Chart 4. Ethnic Minorities among the Southern Border’s RN Program Graduates by Degree Earned, 2001-2010
Looking at new student enrollments shows that since 2005 the share of Hispanics enrolling in RN programs has declined, while the share of Blacks has remained about the same, and the shares of Filipinos and non-Filipino Asians have increased slightly.
Table 3. Racial Composition of New Student Enrollments in the Southern Border’s RN Programs, 2001-2010
2001 2002 2003 2004 2005 2006 2007 2008 2009 2010 Native American 0% 0% 1% 2% 1% 1% 1% 1% 1% 1% Asian 8% 5% 7% 6% 12% 11% 9% 10% 12% 14% Black 4% 4% 5% 5% 3% 4% 6% 4% 4% 5% Filipino 21% 20% 15% 14% 12% 14% 22% 20% 19% 15% Hispanic 18% 16% 21% 21% 25% 16% 19% 18% 16% 18% White 48% 54% 51% 52% 47% 53% 43% 45% 45% 44% Other race
2% 2% 4%
Ethnic Minorities 52% 46% 49% 48% 53% 47% 57% 55% 55% 56% Source: BRN Annual School Report, 2001-2010

Nursing Diversity in California | Southern Border
University of California, San Francisco | 8-5
With a declining share of new student enrollments and an 82% average completion rate, the share of Hispanics RNs in the region is expected to decline over the next two years. Addressing these lower completion rates may help further increase the diversity among nursing graduates.
Chart 5. Average RN Program Completion Rate by Race, Southern Border, 2006-2010

Nursing Diversity in California | Southern Border
University of California, San Francisco | 8-6
Although the racial composition of RNs may not match the population, language abilities of RNs indicate whether nurses can provide some aspects of culturally competent care, regardless of race.
Data from the 2010 Census indicate that 25% of people in the Southern Border region speak Spanish at home and that 55% of these Spanish speakers also speak English very well.1 On average, younger Spanish speakers have better English language skills than their older counterparts2
Overall, 39% of Southern Border RNs speak Spanish (40% in 2008 and 38% in 2010). Almost all of the Southern Border RNs who identify as Hispanic speak Spanish (95% in 2008 and 98% in 2010), leaving the remaining Spanish speakers as non-Hispanic. While Hispanic nurses (7%) are underrepresented in comparison to the Hispanic population (35%), 40% of RNs are either Hispanic or speak Spanish (41% in 2008 and 39% in 2010), which may help bridge the gap in culturally competent care that exists between the nursing workforce and the general population.
, suggesting that Spanish language skills among RNs may become less of a concern in providing culturally competent care to Hispanics over time.
Chart 6. Share of Southern Border RNs that Speak Spanish, 2008 & 2010
In addition to Spanish, Tagalog and other Asian languages are commonly spoken among RNs. Since Filipino RNs are overrepresented compared to the general population and the patient population in the Southern Border, recruiting RNs who speak Tagalog is not a priority for this region. However, non-Filipino Asians are underrepresented in comparison to the general population in the Southern Border, indicating that proficiency in Asian languages other than Tagalog may improve culturally competent care for Asian patients in the region.
1 These data are based on estimates generated by the American Community Survey (ACS), which generates publicly available language use estimates based on 2010 Census data. 2 Of Spanish speakers in the Southern Border, 70% of those 5 to 17 years of age speak English very well, while 52% of those 18-64 years of age and 32% of those 65 years of age and older have similar English language skills (Census, 2010).

Nursing Diversity in California | Southern Border
University of California, San Francisco | 8-7
Data from the 2010 Census indicate that 8% of people in the Southern Border region speak an Asian or Pacific Island language and that 53% of them also speak English very well.3 On average, those of younger age groups have better English language skills than their older counterparts4
, suggesting that Asian or Pacific Island language skills among RNs may become less of a concern in providing culturally competent to Asians over time. However, only 3% of Southern Border RNs speak an Asian language other than Tagalog, and all of them are non-Filipino Asians (100% in 2008 and 2010). These data – and the underrepresentation of non-Filipino Asians in the nursing workforce in comparison to the general population in the region – suggest that increasing the share of RNs with non-Filipino Asian language skills may improve culturally competent care for non-Filipino Asian patients.
The data shown thus far illustrate that Hispanic, Asian and Black RNs are currently underrepresented in comparison to the population. Racial composition of new nurses graduating from RN programs in the Southern Border suggests that the share of Asian RN graduates may increase over the next couple of years while the disparities among Blacks and Hispanics may become more pronounced. Spanish language skills of non-Hispanic RNs may provide some culturally competent care for Hispanic patients, but the difference in racial composition between the population and the nursing workforce remains.
3 These data are based on estimates generated by the American Community Survey (ACS), which generates publicly available language use estimates based on 2010 Census data. 4 Of Asian or Pacific Island language speakers in the Southern Border region, 75% of those 5 to 17 years of age speak English very well, while 54% of those 18-64 years of age and 31% of those 65 years of age and older have the similar English language skills (Census, 2010).

Nursing Diversity in California | Southern Border
University of California, San Francisco | 8-8
Population Projections Current data show that Hispanics, Asians and Blacks are underrepresented in the nursing workforce. Projecting the racial composition of RNs and the general population over the next 40 years allows us to show how these populations may change over time and whether additional steps to increase the diversity of the nursing workforce should be prioritized.
Population projections5
provided by the California Department of Finance suggest that the number of Hispanics in California is expected to grow dramatically over the next forty years and surpass the number of Whites in the region by 2050. The number of Whites is expected to grow at a moderate rate, the number of Filipinos and non-Filipino Asians is expected to grow slowly, and the number of Blacks is expected to decline slightly.
Chart 7. Projected Racial Composition of the Southern Border’s Population, 2000-2050
5 Those of other undefined racial/ethnic groups comprise less than 5% of the current general population and nursing workforce in the region. Since this racial/ethnic group show little change within the next 40 years, it was excluded from the charts and tables in this section of the report.

Nursing Diversity in California | Southern Border
University of California, San Francisco | 8-9
The RN workforce in the Southern Border is expected to become more diverse, with an increase in the share of Hispanic, Asian and Black RNs and a decrease in the share of White nurses. However, these projections suggest that there will continue to be greater diversity in the general population than among Southern Border nurses.
Since these projections use past changes in diversity among nursing school graduates and graduation rates by race to predict future diversity, it is possible that diversity among nursing school graduates may change in ways not reflected in the data. It is also possible that factors not included in the model will add increased diversity to the nursing workforce.
Chart 8. Projected Racial Composition of Southern Border RNs, 2008-2050

Nursing Diversity in California | Southern Border
University of California, San Francisco | 8-10
When combining the projections of RNs and the general population, the data suggest that Hispanics will continue to be underrepresented – and become more underrepresented – in the nursing workforce over time, Native Americans will remain slightly underrepresented, Blacks will be slightly underrepresented until 2020, and all other racial groups will be overrepresented in comparison to the general population.
Chart 9. Projected Difference between RNs and the General Population by Race, Southern Border, 2010-2050

Nursing Diversity in California
University of California, San Francisco | 9-1
Appendix
Methods The following methods were used in this report.
1. Registered Nurses (RNs) a. Current nurses were defined as actively licensed RNs residing in California or in the
applicable region. Data from the BRN Survey of RNs 2008 and 2010 were used to determine characteristics of the current population of nurses.
b. For the forecasting of the future nursing workforce, all actively licensed RNs with California addresses in 2011 were used as a baseline (obtained from BRN licensing records). Data from the BRN Survey of RNs 2010 were used as a baseline data for the regional analysis. New student enrollments estimated by the nursing programs in the BRN Annual Schools Report were used to estimate the number of new nurses entering the workforce through 2014. Starting in 2015, it was assumed that there would be no annual growth in new nurses graduating from California nursing programs. From there, the average graduation rates of new nurses by race and by region from the BRN Annual Schools Report were used to estimate the number of new nurses by race. The forecasting model also assumes that nurses retire at age 65 and that they stay in the same region. While the movement of nurses into and out of California impacts the nursing workforce, these nurses are a small share of the total nursing workforce and were not factored into the model.
2. Acute care patients a. Publicly available patient discharge data from the California Office of Statewide Health
Planning and Development (OSHPD) was used for the racial composition of patients. Data from 2008 were the most recently available at the time of the analysis.
b. Source: http://www.oshpd.ca.gov/HID/Products/PatDischargeData/FrequencyTables/CountyFreq/index.html
3. General population a. The racial composition of the population by county from the 2010 Census was used for the
current population. i. Data on non-Hispanic Filipinos were not available at a county level. Therefore,
these data were estimated based on the share of non-Hispanic Filipinos provided in the 2000 Census.
b. Language abilities were available through the American Community Survey (ACS) population estimates that were generated from the 2010 Census data.
i. Source: factfinder2.census.gov, Table B16004: Age by Language Spoken at Home by Ability to Speak English for the Population 5 Years and Over
c. The California Department of Finance provides county-level population projections based on data from the 2000 Census. Projections based on the 2010 Census will be available from CA Department of Finance sometime in 2013.

Nursing Diversity in California
University of California, San Francisco | 9-2
Regions The regions below match those created for reporting data collected from the BRN Survey of Registered Nurses.
Region Counties
Bay Area Alameda, Contra Costa, Marin, Napa, San Francisco, San Mateo, Santa Clara, Santa Cruz, Solano, Sonoma
Central Coast Monterey, San Benito, San Luis Obispo, Santa Barbara
Central Valley Alpine, Amador, Calaveras, Fresno, Inyo, Kern, Kings, Madera, Mariposa, Merced, Mono, San Joaquin, Stanislaus, Tulare, Tuolumne
Greater Sacramento El Dorado, Placer, Sacramento, Sutter, Yolo, Yuba Los Angeles Area Los Angeles, Ventura
Northern California Butte, Colusa, Del Norte, Glenn, Humboldt, Lake, Lassen, Mendocino, Modoc, Nevada, Plumas, Shasta, Sierra, Siskiyou, Tehama, Trinity
Inland Empire Orange, Riverside, San Bernardino Southern Border Imperial , San Diego