the distribution of victoria’s sign language users reports/the... · the distribution of...
TRANSCRIPT

1
The Distribution of Victoria’s Sign Language Users Analysis From The 2001, 2006 And 2011 Census © 2013 Prepared for the Victorian Deaf Society by Dr Louisa Willoughby with the assistance of Ms Catherine Cook

1
Copyright © 2013 Louisa Willoughby and The Victorian Deaf Society
The National Library of Australia Cataloguing-in-Publication entry
Author: Willoughby, Louisa. Title: The distribution of Victorian sign language users [electronic resource] : analysis from the 2001, 2006 and 2011 census / Louisa Willoughby. ISBN: 978-0-949467-00-3
Subjects: Sign language--Statistics. Deaf--Means of communication--Victoria--Statistics. Victoria--Population--Statistics. Dewey Number: TO BE SUPPLIED
This work is copyright. It may be reproduced in whole or part for studying or training purposes subject to the inclusion of an acknowledgement of the source and no commercial usage or sale. Reproduction for purposes other than those indicated above requires permission from the Victorian Deaf Society

Contents List of Figures and Tables ............................................................................ 2
Introduction .............................................................................................. 3
A note on data and terms ......................................................................... 3
Key trends in community size, Victoria and Australia ...................................... 5
Age distribution of sign language users ......................................................... 8
Geographic distribution of Victoria’s signing population ................................. 12
The Metropolitan Population ................................................................... 12
The regional population .......................................................................... 14
Change from 2001 to 2011 ...................................................................... 17
Conclusion .............................................................................................. 19
Bibliography ............................................................................................ 20
Appendix 1: Sign Language Users and Total Population in the Melbourne Statistical Area, 2011 ............................................................................... 22
Appendix 2: Sign Language Users and Total Population outside the Melbourne Statistical Area, 2011 ............................................................................... 23
Appendix 3: Change in the Melbourne Statistical Area Populations, 2001-2011 25
Appendix 4: Change in the Non-Melbourne Statistical Area Populations, 2001-2011 ...................................................................................................... 26
List of Figures and Tables Table 1: Victoria Auslan users 2001-2011 ............................................................................. 5 Table 2: Australian sign language users 2001 to 2011..................................................... 5 Table 3: Age profile of signing and general population - Victoria ................................. 8 Figure 1: Age profile of signing and general population – Victoria .............................. 9 Figure 2: Signing population per 10,000 of general population - Victoria .............. 11 Figure 3: Signing Population distribution- Melbourne ..................................................... 13 Table 4: Top ten metropolitan signing populations by ratio in 2011 ......................... 13 Figure 4: Signing Population Distribution- Victoria ........................................................... 15 Table 5: Top ten regional signing populations by ratio in 2011 (populations of 19 and over only) ................................................................................................................................. 15 Table 6: Top LGAs for increase in signers – 2001-2011................................................. 17

Introduction This report outlines the age and geographic distribution of sign language users living in Victoria at the time of the 2011 census, and compares this distribution to reports from previous census. The report explores the distribution of population both within Melbourne and across regional Victoria and identifies a number of key trends in settlement patterns which have important consequences for service delivery.
A note on data and terms Data in this report comes from the 2001, 2006 and 2011 Australian Census of Population and Housing (hereafter “the census”). Specifically, it relates to the question Does the person speak a language other than English at home?, and counts the number of people who said that at home they speak ‘‘Auslan’’ (Australian Sign Language), ‘‘sign language,’’ or any other terms (such as ASL) that allowed the language to be identified as a Deaf sign language.
A particular advantage of census data for profiling the Deaf population is that the census is distributed to every household so it may uncover a number of sign language users who are not part of the Deaf community in their state. Census data also gives a way to quickly and easily count the number of sign language users living in a particular area and to compare their numbers with the number of people living in the general population. Yet despite these advantages, the phrasing of census questions and mode of data collection means that we must approach data on the distribution of the Victorian Deaf community with caution
As Ozolins and Bridge(1999, p. 8) note, underreporting of sign languages on Australian census forms is likely to be common because of the phrasing of the question respondents are asked – “does the person speak a language other than English at home?”. Since sign languages are not spoken per se, it is reasonable to presume that many signers would not have listed their language in response to this question. Similar issues arise with the specification “at home”, because many Deaf people who still live with their parents may use Auslan (or another sign language) as their preferred language but use English and lip reading to communicate with their hearing families. Kipp et al (1995, p. 26)have noted that the “at home” specification leads to speaker numbers being undercounted for most migrant languages, as large numbers of community members use English at home but their heritage language in a variety of other settings. This problem is more acute for Deaf individuals, however, because in over

90% of cases they are born into hearing families with no knowledge of Auslan.
While these factors may lead to the number of sign language users being undercounted, the absence of a question on hearing disabilities means there is no way of knowing how many sign language users are deaf themselves and how many are hearing family members who use Auslan in the home environment. These figures are thus not synonymous with the total number of Deaf Australians, although analysis of 2006 census data (Access Economics, 2008; Willoughby, 2011a) suggests that census figures provide a reasonably accurate profile of the adult Deaf community. The issue of the extent to which the census provides a reliable age profile of the Victorian Deaf community will be explored in more detail in the following section.
The reader also needs to be aware that in municipalities with very small signing populations (generally less than 7 people), the ABS will randomize data to ensure that confidentiality is preserved, making these figures unreliable. The numbers of sign language users may also be updated over time as the ABS conducts new parses1 of Census data. The results presented here should thus not be seen as a final definitive statement as to the number of sign language users in a particular area, but do provide a clear estimate of population size. As with all statistics, reliability is also partly a question of the population group one has in mind or the purpose for which the statistics will be used. Thus the number of people using Auslan at home may be more or less than the number of people requiring regular access to Auslan interpreters or assistance from Deafness services. Home use of the language is, however, widely used as a measure of people’s preferred language and gives the most accurate data currently available profiling the size of the Australian Deaf community.
1 The ABS continually updates census data with the aim of better coding ambiguous or hard to read answers.

Key trends in community size, Victoria and Australia The 2011 Australian census recorders 2,783 sign language users living in Victoria, and 9,720 for Australia as a whole. Table 1 outlines changes in the size and composition of the Victoria signing population from 2001 to 2011, compared to the total population:
SIGNING
TOTAL
SIGNERS PER 10,000 2001 1,235 4,599,322 2.72
2006 2,098 4,880,903 4.32 2011 2,783 5,307,053 5.24
Table 1: Victoria Auslan users 2001-2011
Comparing the number of signers recorded in 2011 with those recorded in 2006 and 2001 uncovers several significant differences, which cannot be accounted for by natural growth alone. As Table 1 shows, the total number of signers more than doubled between 2001 and 2011. These increases are well above what could be expected from natural growth (especially since Johnston 2004 has hypothesised that the signing population in Australia is declining) and is likely a reflection of growing community pride in Auslan as a language and strong public awareness campaigns by Australian Deaf Societies since 2001 reminding members to list Auslan on the census.
Strong gains in the proportion of sign language users were also seen at the national level, as shown in Table 2:
STATE SIGNERS 2001
SIGNERS 2006
SIGNERS 2011
INCREASE 2001-11
New South Wales 1,720 1,923 2,583 863 Northern Territory 51 55 72 21 Queensland 1,071 1,412 2,221 1,144 South Australia 427 602 847 420 Tasmania 219 190 293 74 Victoria 1,254 2,107 2,783 1,529 Western Australia 460 560 808 348 TOTAL AUSTRALIA 5,306 6,944 9,723 4,417
Table 2: Australian sign language users 2001 to 2011
According to census data, the number of people signing at home increased by 124% between 2001 and 2011. All states and territories recorded growth in their signing population in this period, but the increase occurred at different rates across states: Tasmania's growth is relatively low, with a growth rate of only 33% (and a loss recorded between 2001 and 2006) compared to more than doubling in Victoria and Queensland. Since 2006, Victoria has recorded a higher signing population than NSW, despite lagging that state in general population by nearly 1.6 million.

Queensland is also now home to a signing population numbering several thousand, only slightly smaller than the signing community in NSW despite a general population of 2.5 million fewer people.
One possible explanation for the strong state-based differences seen above is that they are the result of different opportunities to learn sign languages in each state. For example, in Queensland the number of children reportedly using Auslan at home virtually doubled between 2006 and 2011, during the period in which the Queensland government implemented the Transition to Auslan in Deaf education (see http://education.qld.gov.au/studentservices/staff/workshops/auslan.html). It seems highly likely that the Transition to Auslan program has thus had the effect of both motivating more families to use some Auslan at home and raising pride in the language, such that mothers, fathers and siblings of Deaf children are listing Auslan as a home language as well. The degree to which Auslan is used in education has varied quite markedly from state to state in Australia over the past 30 years (Komesaroff, 2008) and this may be influencing the degree to which young deaf children and their families are adopting Auslan from state to state and region to region. However, it should be noted that Johnston (2004) did not note widespread state differences in his comprehensive review of figures available on the number of Auslan users in Australia.
The rate of growth is in the signing population between 2001-11 is too sharp to be accounted for solely by natural increase. When figures on Auslan use in the 2001 census were released, there was a strong feeling in the Deaf community that the census estimate was much too low, especially since previous estimates had often assumed a community size of between 9,000 and 15,000 (Flynn, 1987; Hyde & Power, 1992; Ozolins & Bridge, 1999). For the 2006 and 2011 censuses, the State Deaf Societies thus ran public awareness campaigns to get Deaf people to list Auslan on the census. In Victoria, this resulted in a particularly sharp increase in the number of sign language users between 2001-06, whereas in NSW and WA the greatest increase occurred between 2006-11. While these awareness campaigns were very much targeted at members of the Deaf community, they may have had a spillover effect of making hearing family members, Auslan interpreters and others with connections to the Deaf community more likely to list Auslan on the census as well. However, given that numbers are still quite similar to previous estimates of the size of community, it seems reasonable to assume that the majority of people listing Auslan on the census are in fact Deaf themselves.

In concluding this section, it should be noted that the apparent increase in the number of sign language users in census data should not be seen as negating Johnston’s hypothesis that the number of native Auslan users is in decline. This seemingly contradictory trend can be explained if we consider the changing ways in which families and schools are using sign languages. For many years, advocates of oral communication for Deaf children have argued that using any sign language at all with a Deaf child would harm their development of speech. However, experience is showing many families that this need not be the case, and that there are benefits to using some signing alongside speech with their deaf children (Gregory, Bishop, & Sheldon, 1995; Meadow-Orlans, Mertens, & Sass-Lehrer, 2003). The idea that Auslan can be a useful resource for communication has also seen many schools with Deaf facilities offer Auslan as a LOTE for all students – whether Deaf or hearing – while at the same time often educating the deaf students primarily through oral English (see e.g. Department of Education and Early Childhood Development, 2012). In both cases, these trends give oral deaf children some access to Auslan, but do not lead to the development of fluency in the language in childhood. Whether these nascent Auslan users go on to develop strong fluency as adults will be down to a number of factors, including the difficulties they encounter using oral language in the workplace or higher education, exposure to the Deaf community and degree to which they adopt a Deaf identity.
Ultimately what is important for Deafness organisations to realise is that alongside recent increases in people claiming to use a sign language in national censuses, there is evidence that the population of Deaf people who do not use any oral language alongside a sign language is both declining and aging (Johnston, 2004). Since this has important implications for service demand and delivery, organisations would be well placed to monitor the demographic of the signing population in future censuses (and in other population surveys) ensure that this information is fed back into the strategic planning and policy development level of the organisation.

Age distribution of sign language users In 2011, Victoria recorded 2,783 sign language users, out of a total state population of just over 5.3 million. This equates to an average of 5.24 sign language users per 10,000 Victorian residents. However, as will become clear, the proportion of sign language users varied markedly across different age groups.
In order to explore the age profile of the Victorian signing population, census data was first sub-divided into the following age groups:
• 0-14 (children) • 15-24 (youth) • 25-44 (younger working age) • 45-64 (older working age) • 65+ (seniors)
Both the general population and sign language users have a similar age profile: the largest age group is the 25-44 year olds, followed in both cases by 45-64 year old and 0-14 year olds in third place. The number of youths is larger than the number of seniors in the signing population, but marginally lower in the general population. Table 3 gives the number of people in each classification, and Figure 1 gives a visual representation of this data.
AGE GROUPS SIGN LANGUAGE USERS # %
GENERAL POPULATION # %
0-14 614 22% 996507 19% 15-24 417 15% 720588 14% 25-44 959 35% 1530102 28% 45-64 634 22% 1322755 25% 65+ 159 6% 737118 14% TOTAL 2783 100% 5307070 100% Table 3: Age profile of signing and general population – Victoria 2011
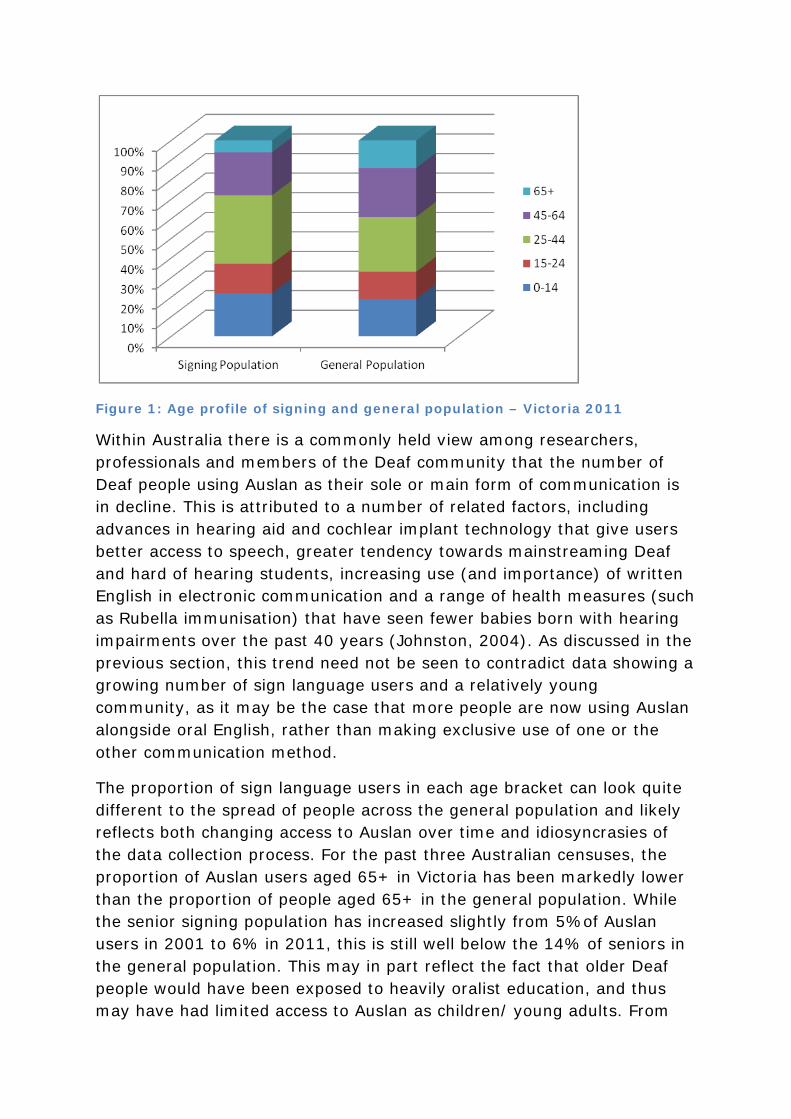
Figure 1: Age profile of signing and general population – Victoria 2011
Within Australia there is a commonly held view among researchers, professionals and members of the Deaf community that the number of Deaf people using Auslan as their sole or main form of communication is in decline. This is attributed to a number of related factors, including advances in hearing aid and cochlear implant technology that give users better access to speech, greater tendency towards mainstreaming Deaf and hard of hearing students, increasing use (and importance) of written English in electronic communication and a range of health measures (such as Rubella immunisation) that have seen fewer babies born with hearing impairments over the past 40 years (Johnston, 2004). As discussed in the previous section, this trend need not be seen to contradict data showing a growing number of sign language users and a relatively young community, as it may be the case that more people are now using Auslan alongside oral English, rather than making exclusive use of one or the other communication method.
The proportion of sign language users in each age bracket can look quite different to the spread of people across the general population and likely reflects both changing access to Auslan over time and idiosyncrasies of the data collection process. For the past three Australian censuses, the proportion of Auslan users aged 65+ in Victoria has been markedly lower than the proportion of people aged 65+ in the general population. While the senior signing population has increased slightly from 5%of Auslan users in 2001 to 6% in 2011, this is still well below the 14% of seniors in the general population. This may in part reflect the fact that older Deaf people would have been exposed to heavily oralist education, and thus may have had limited access to Auslan as children/ young adults. From

this they may have internalised a very negative attitude to Auslan making them less likely to adopt the language later in life, or to report using the language even if they regularly do so. Another pressing issue for this age group is that low literacy skills may have impeded their abilities to accurately complete their own census form. These seniors would have completed their schooling in or before the early 1960s, at a time when deaf education in Australia was rudimentary. Recent studies of the needs of Australian Deaf seniors have noted the difficulty members of this age group can have filling out even basic, Deaf-friendly survey documents (Matairavula, 2009; Willoughby, 2011b)and it is thus hypothesized that a number of older Auslan users may have relied on a family member to fill out the census form, who did not list Auslan as the senior’s home language.
In 2001, 37% of Auslan users in Victoria were aged 25-44, whereas the corresponding proportion for the general population was 30%. This generation of speakers, born between 1957-76 in many ways represent a peak for Auslan in Australia: born at a time rubella epidemics had led to increased rates of congenital deafness they came of age at a time of growing Deaf pride and acceptance of the role sign languages might play in Deaf education(Ladd, 2003), and before technological changes such as cochlear implants or electronic communication began to lessen the involvement of some deaf people in the Deaf community. In 2011 the 24-45 generation is still slightly over-represented among Auslan users, however the difference is not so stark: 35% of Auslan users are in this bracket as opposed to 28% of the general population. One reason for this change of course is that in the intervening 10 years many from this generation have crossed over in to the next age bracket, and indeed the proportion of sign language users aged 45-64 has increased slightly from 20% in 2001 to 22% in 2011.
While the proportion of children and youth using Auslan is broadly in line with proportions in the general population, it seems likely that for this age group, as well as for the 25-44 age group there is some inflation due to the presence of signing families with both Deaf and hearing members. We have already discussed the issue that parents and siblings of Deaf children may list Auslan on the census, but the converse is also true, i.e. that Deaf adults will report (quite rightly) that their hearing CODAs (children of Deaf adults) use Auslan as a home language. Thus figures on the signing population of children are best read alongside information about the number of students currently enrolled in Deaf facilities or receiving support from a teacher of the Deaf.

Figure 2: Signing population per 10,000 of general population – Victoria 2011

Geographic distribution of Victoria’s signing population Of the 2,783 people who reported using a sign language at home in 2011, 2098, or 75.4% live in the Melbourne statistical area. It might be thought that the increased ease with which interpreters and others services can be accessed in metropolitan areas would make sign language users more likely to live in Melbourne than members of the general population. Yet in fact the proportion of signers in Melbourne is only marginally above figures for the total population (73.8%).
Informal discussion with Vicdeaf case managers suggests many sign language users living in regional Victoria have been able to gain work as agricultural labourers and working in canneries, and these job opportunities (together with family support networks) may well act as a ‘pull factor’ encouraging deaf people to remain in regional areas despite problems of isolation and lack of access to services. As will shall see, the signing population in regional areas is also concentrated in certain regional centres. Geelong, Bendigo, Ballarat and Shepparton are home to sizeable signing communities (40+ signers). This section will outline current trends of where sign language users live in Melbourne and regional Victoria2. Changes in distribution between 2001-11 will be explored in the following section.
The Metropolitan Population in 2011, 2,098 signers lived in Melbourne. The signing population is concentrated in an arc through starting in the outer western suburbs, and heading through the mid northern and eastern suburbs as well as the outer south-east. Sign language users are conspicuously absent from inner Southern suburbs – Port Phillip, Stonnington, Yarra, Booroondura and Bayside all have less than 50 signers, which equates to less than 4.5 people for every 10,000 head of their total population. Figure 3 provides a visual representation of the distribution of Melbourne’s signing population, while the full figures for each municipality are given in Appendix 1:
2 In this report the boundaries used for the metropolitan population are those that correspond to the ABS “Greater Capital City Statistical Area”, while the regional population is based on the ABS classification “Balance of State”.

Figure 3: Signing Population distribution- Melbourne
In terms of raw numbers, Casey (214 signers), Whitehorse (125) Frankston (114) Wyndham (110) Banyule (106) and Maroodah (98) have largest signing populations however these figures need to be taken in context of the total size of the municipality (see table 4). Measuring sign language users in terms of their concentration per 10,000 head of total population shows that the municipalities with the highest concentration of signers is in fact Maroondah, with 9.6 signers per 10,000 residents. Itis followed by Frankston, (9.1) Banyule (9 in 10,000), Casey (8.6 in 10,000) and Whitehorse (8.4 in 10,000).
LGA SIGNING POPULATION
TOTAL POPULATION
SIGNERS PER 10,000
RESIDENTS Maroondah 98 101,934 9.6 Frankston 114 125,123 9.1 Banyule 106 117,569 9.0 Casey 214 250,068 8.6 Whitehorse 125 149,684 8.45 Nillumbuk 47 59,084 8.0 Wyndham 110 160,097 6.97 Knox 101 147,456 6.9 Darebin 89 135,559 6.6 Kingston 79 140,252 5.6 Table 4: Top ten metropolitan signing populations by ratio in 2011
Several factors appear to be at work in shaping the distribution of Melbourne’s signing population. There is a clear trend that many of the

metropolitan municipalities with the lowest percentages of sign languages users are among Melbourne’s most expensive suburbs to rent or buy a home. Thus it seems reasonable to argue that Deaf people are in the main priced out of municipalities such as Melbourne, Yarra and Port Philip, preferring instead to settle in more affordable areas such as Wyndham and Casey.
The historical legacy of many of Melbourne’s deafness services being located in the Eastern suburb (and particularly the City of Whitehorse) may have led to sign language users settling in that area in larger numbers. However, the growing communities in Frankston, Wyndhan and Casey suggest that areas of new housing development are also proving very popular with sign language users. Service providers will need to watch this apparent demographic shift wit interest and may wish to start thinking already about the best way to reach a community that is increasingly living in suburbs distant from (and poorly connected to) the city centre.
The regional population In 2011, 685 signers lived in regional Victoria. The signing population is largely concentrated in a handful of municipalities. Of 48 Local Government Areas (LGAs), 14 have no signing residents at all, while 20 have 10 or more sign language users. As might be expected, Victoria’s two largest regional municipalities – Greater Geelong and Greater Bendigo – also lead regional areas in the number of signers (111 and 80 respectively) while the number 3 and 4 spots for sign language users are taken by the fifth and third largest regional LGAs – Ballarat (55 signers) and Shepparton (42 signers). Figure 2 outlines the distribution of Victoria’s regional signing population, while the full figures for each municipality are given in Appendix 2:

Figure 4: Signing Population Distribution- Victoria
Aside from the municipalities with a high number of signing residents, mention should be made of several regional municipalities where the proportion of signers in the total population is unexpectedly high. In Mitchell there are 11.1 sign language users for every 10,000 residents, while in Colac-Otway the figure is 9.6 per 10,000. Wellington (8.7 per 10,000) and Greater Bendigo (8.1 per 10,000) also report a high concentration of sign language users (see table 5). Mitchell, in fact, has the highest Auslan to total population ratio in Victoria. No reason for these increased rates is readily apparent, although Mitchell is adjacent to Greater Bendigo, so presumably the services and friendship of those major regional Deaf communities would at least be relatively accessible to signing residents of these shires.
LGA SIGNING POPULATION
TOTAL POPULATION
SIGNERS PER 10,000
RESIDENTS Mitchell 38 34,184 11.12 Colac-Otway 19 19,842 9.58 Wellington 35 40,127 8.72 Greater Bendigo 80 99,150 8.07 Moira 22 27,676 7.95 East Gippsland 32 41,597 7.69 South Gippsland 20 26,298 7.61 Greater Shepparton 42 59,448 7.06 Moorabool 19 27,751 6.85 Warrnambool 19 31,690 6.00 Table 5: Top ten regional signing populations by ratio in 2011 (populations of 19 and over only)
While the signing population of country Victoria tends to cluster in major regional centres, the Gippsland area proves an exception to this rule and creates a unique challenge for service delivery. Of the 111 signers living in the DHS Gippsland region, 32 live in East Gippsland (itself Victoria’s second largest shire by area), 35 each live in Wellington, 24 in Latrobe and a further 20 live in South Gippsland (with sundry signers in Baw Baw and Bass Coast). This highly dispersed population creates difficulties when attempting to provide accessible deafness services, with distance often making it impractical (or at least incredibly costly) to arrange Auslan interpreters. The foundation of the Gippsland interpreter service has gone some way to alleviating these problems in recent years, however unmet demand and the tyranny of distance remains a real issue in this area. For all these reasons, Gippsland is an ideal area for organisations such as Vicdeaf to pilot initiatives aimed at improving service delivery for clients in regional areas.

Change from 2001 to 2011 In 2011, 2,783 Victorians indicated that they used a sign language at home on the census form, up from 2,107 in 2006 and 1,252 in 2001. As discussed early in the report, this growth rate (76% from 2001 to 2011) is taken to be the result of higher levels of reporting, rather than a large number of deaf people suddenly taking up sign language.
At the LGA level, 8 municipalities saw their number of signers increase by more than 50 people between 2001 and 2011. Of these, only the city of Greater Geelong is located outside the Melbourne statistical area. In regional areas, growth in Ballarat (38) and Greater Bendigo (37) is also worthy of comment.
LGA INCREASE IN SIGNERS 2001- 2011 Casey (C) 162 Maroondah (C) 70 Wyndham (C) 70 Greater Geelong (C) 70 Frankston (C) 60 Banyule (C) 54 Yarra Ranges (C) 53 Darebin (C) 52
Table 6: Top LGAs for increase in signers – 2001-2011
As Table 6 demonstrates, the municipalities that saw the greatest growth in their signing populations between 2001 and 2011 are by and large outer metropolitan LGAs. Wyndham and Casey have both seen large total population increases during this period (88% and 42% respectively), but it is important to note that growth in the signing population eclipses this natural growth: in Casey the number of signers increased four-fold in the period while Wyndam’s signing population increased from just 40 in 2001 to 110 in 2011. LGAs such as Maroondah, Yarra Ranges, Banyule, Frankston and Darebin also saw their signing populations double or even triple during this period despite experiencing total population growth of between 3-14%. Analysis of the 2006 census noted that Melton had largely been avoided by sign language users (Willoughby, 2009). While the proportion of signing residents in Melton, and also Hume and Whittlesea remains below the state average (see Appendix 1), all three municipalities saw growth of around 30 signers between 2001-2011. This may be the start of a trend towards a larger Deaf community in the western suburbs of Melbourne, but the eastern and south-eastern suburbs continue to attract the majority of Melbourne’s signers.

In regional Victoria, many LGAs in the west of the state saw sharp declines in the total population between 2001-2011, but this did not affect the already small signing population in those regions. In 2001 Greater Bendigo and Greater Geelong were the only regional LGAs to have a signing population of more than 20 people (43 and 41 respectively). Thus all regional LGAs with significant signing populations have seen these develop (or at least get reported on the census) since 2001. These growing regional communities suggest there will be strong demand for deafness services in regional Victoria for many years to come, and attest to the utility of interventions such as the Video Relay Interpreter service.

Conclusion This report has shown that the number of people in Victoria indicating they spoke a sign language increased Markedly between the 2001 and 20011 censuses. In both years, the signing population was concentrated in Greater Melbourne, but not markedly more so than the Victorian population as a whole. Within Melbourne, sign language users are increasingly settling in outer suburbs, with the Pakenham-Cranbourne growth corridor proving particularly popular. Deaf agencies are thus well advised to monitor this shifting population trend as current rates suggest a high demand for service delivery in Auslan in the outer suburbs in future. Outside of Melbourne the signing population more than doubled between 2001 and 20011. The largest growth LGAs were in the regional centres of Greater Geelong, Ballarat and Greater Bendigo. However, it is important to note that the majority of regional municipalities have at least a handful of sign language users. Effectively providing services to this highly dispersed and often isolated population remains a key challenge for Victorian deafness services.

Bibliography
Access Economics. (2008). Auslan interpreter services in Australia: supply and demand.
A report commissioned by the Victorian Deaf Society (Vicdeaf). Melbourne:
Access Economics.
Department of Education and Early Childhood Development. (2012). Languages in
Victorian Government Schools, 2011. Melbourne: Department of Education and
Early Childhood Development. Retrieved from
http://www.education.vic.gov.au/Documents/school/teachers/teachingresources/
discipline/languages/lotereport2011.pdf
Flynn, J. (1987). Sign language: Australian. In J. van Cleve (Ed.), The Gallaudet
Encyclopedia of Deaf People and Deafness (pp. 56–8). New York: McGraw-Hill.
Gregory, S., Bishop, J., & Sheldon, L. (1995). Deaf young people and their families:
Developing understanding. Cambridge: Cambridge University Press.
Hyde, M., & Power, D. (1992). The Use of Australian Sign Language by Deaf People. Sign
Language Studies, 75, 167–82.
Johnston, T. (2004). W(h)ither the deaf community? Population, genetics and the future
of Australian Sign Language. American Annals of the Deaf, 148, 358–75.
Kipp, S., Clyne, M., & Pauwels, A. (1995). Immigration and Australia’s language
resources. Canberra: Australian Government Publishing Service.
Komesaroff, L. R. (2008). Disabling pedagogy : power, politics, and deaf education.
Washington, DC: Gallaudet University Press.
Ladd, P. (2003). Understanding deaf culture : in search of deafhood. Clevedon:
Multilingual Matters.
Matairavula, K. (2009). Deaf Seniors : A profile of Deaf seniors in New South Wales 2009
(full report). Sydney: The Deaf Society of New South Wales.
Meadow-Orlans, K., Mertens, D., & Sass-Lehrer, M. (2003). Parents and their deaf
children. Washington D.C.: Gallaudet University Press.

Ozolins, U., & Bridge, M. (1999). Sign language interpreting in Australia. Melbourne:
Languages Australia.
Willoughby, L. (2009). The distribution of Victoria’s signing populations: Analysis from
the 1996 and 2006 Census. Melbourne: Victorian Deaf Society.
Willoughby, L. (2011a). Sign language users’ education and employment levels: keeping
pace with changes in the general Australian population? Journal of deaf studies
and deaf education, 16(3), 401–413. doi:10.1093/deafed/enq067
Willoughby, L. (2011b). Aged care support for Deaf Victorians. Melbourne: The Victorian
Deaf Society.

Appendix 1: Sign Language Users and Total Population in the Melbourne Statistical Area, 2011
AREA AUSLAN TOTAL SIGNERS PER 10,000
RESIDENTS Banyule 106 117,569 9.02 Bayside 19 89,877 2.11 Boroondara 39 156,665 2.49 Brimbank 69 181,965 3.79 Cardinia 26 72,833 3.57 Casey 214 250,068 8.56 Darebin 89 135,559 6.57 Frankston 114 125,123 9.11 Glen Eira 56 129,476 4.33 Greater Dandenong 69 135,307 5.10 Hobsons Bay 41 82,895 4.95 Hume 69 167,183 4.13 Kingston 79 140,252 5.63 Knox 101 147,456 6.85 Manningham 42 109,553 3.83 Maribyrnong 31 71,473 4.34 Maroondah 98 101,934 9.61 Melbourne 43 110,556 3.89 Melton 49 108,568 4.51 Monash 81 168,360 4.81 Moonee Valley 56 106,164 5.27 Moreland 62 145,982 4.25 Mornington Peninsula 54 140,114 3.85 Nillumbik 47 59,084 7.95 Port Phillip 37 91,521 4.04 Stonnington 17 92,682 1.83 Whitehorse 125 149,684 8.35 Whittlesea 51 153,994 3.31 Wyndham 110 160,097 6.87 Yarra 28 74,342 3.77 Yarra Ranges 76 141,860 5.36 TOTAL 2,098 3,918,196 5.35

Appendix 2: Sign Language Users and Total Population outside the Melbourne Statistical Area, 2011 AREA AUSLAN TOTAL SIGNERS PER
10,000 RESIDENTS
Alpine 3 12,640 2.37 Ararat 0 10,968 - Ballarat 55 92,405 5.95 Bass Coast 14 29,556 4.74 Baw Baw 13 41,792 3.11 Benalla 3 13,216 2.27 Buloke 0 6,241 - Campaspe 16 35,567 4.50 Central Goldfields 0 12,239 - Colac-Otway 19 19,842 9.58 Corangamite 3 16,002 1.87 East Gippsland 32 41,597 7.69 Gannawarra 3 10,080 2.98 Glenelg 0 18,975 - Golden Plains 11 18,174 6.05 Greater Bendigo 80 99,150 8.07 Greater Geelong 111 207,614 5.35 Greater Shepparton 42 59,448 7.06 Hepburn 3 14,062 2.13 Hindmarsh 0 5,661 - Horsham 9 18,997 4.74 Indigo 5 14,739 3.39 Latrobe 24 70,917 3.38 Loddon 5 7,296 6.85 Macedon Ranges 4 40,872 0.98 Mansfield 0 8,257 - Mildura 15 50,949 2.94 Mitchell 38 34,184 11.12 Moira 22 27,676 7.95 Moorabool 19 27,751 6.85 Mount Alexander 9 17,208 5.23 Moyne 0 15,508 - Murrindindi 5 12,681 3.94 Northern Grampians 6 11,736 5.11 Pyrenees 0 6,464 - Queenscliffe 0 2,868 - South Gippsland 20 26,298 7.61 Southern Grampians 0 16,162 - Strathbogie 0 9,142 - Surf Coast 4 25,199 1.59

Swan Hill 6 20,290 2.96 Towong 0 5,633 - Wangaratta 10 26,410 3.79 Warrnambool 19 31,690 6.00 Wellington 35 40,127 8.72 West Wimmera 3 4,088 7.34 Wodonga 15 35,295 4.25 Yarriambiack 0 6,841 - Unincorporated Vic 0 8,350 - TOTAL 681 1388857 4.90 Strathbogie 0 9,142 - Surf Coast 4 25,199 1.59 Swan Hill 6 20,290 2.96 Towong 0 5,633 - Wangaratta 10 26,410 3.79 Warrnambool 19 31,690 6.00 Wellington 35 40,127 8.72 West Wimmera 3 4,088 7.34 Wodonga 15 35,295 4.25 Yarriambiack 0 6,841 - Unincorporated Vic 0 8,350 - TOTAL 681 1388857 4.90 Strathbogie 0 9,142 - Surf Coast 4 25,199 1.59 Swan Hill 6 20,290 2.96 Towong 0 5,633 - Wangaratta 10 26,410 3.79 Warrnambool 19 31,690 6.00 Wellington 35 40,127 8.72 West Wimmera 3 4,088 7.34 Wodonga 15 35,295 4.25 Yarriambiack 0 6,841 - Unincorporated Vic 0 8,350 - TOTAL 681 1388857 4.90

Appendix 3: Change in the Melbourne Statistical Area Populations, 2001-2011 2001 2011 Increase
Signing
Population Total
Population Signing
Population Total
Population Signing
Population Total
Population Banyule 52 113,696 106 117,463 104% 3% Bayside 18 83,504 19 89,858 6% 8% Boroondara 20 148,532 39 156,626 95% 5% Brimbank 32 162,931 69 181,896 116% 12% Cardinia 8 45,305 26 72,807 225% 61% Casey 52 175,505 214 249,854 312% 42% Darebin 37 122,821 89 135,470 141% 10% Frankston 54 109,808 114 125,009 111% 14% Glen Eira 38 117,199 56 129,420 47% 10% Greater
32 123,965 69 135,238 116% 9%
Hobsons Bay 13 80,120 41 82,854 215% 3% Hume 34 131,182 69 167,114 103% 27% Kingston 41 127,540 79 140,173 93% 10% Knox 57 141,408 101 147,355 77% 4% Manningham 18 107,079 42 109,511 133% 2% Maribyrnong 16 59,406 31 71,442 94% 20% Maroondah 28 96,132 98 101,836 250% 6% Melbourne 10 65,617 43 110,513 330% 68% Melton 13 51,685 49 108,519 277% 110% Monash 63 155,061 81 168,279 29% 9% Moonee Valley 23 100,743 56 106,108 143% 5% Moreland 23 130,531 62 145,920 170% 12% Mornington
16 124,891 54 140,060 238% 12%
Nillumbik 22 57,932 47 59,037 114% 2% Port Phillip 10 78,227 37 91,484 270% 17% Stonnington 20 86,090 17 92,665 -15% 8% Whitehorse 90 139,549 125 149,559 39% 7% Whittlesea 20 113,784 51 153,943 155% 35% Wyndham 40 84,861 110 159,987 175% 89% Yarra 19 67,052 28 74,314 47% 11% Yarra Ranges 23 137,113 76 141,784 230% 3%

Appendix 4: Change in the Non-Melbourne Statistical Area Populations, 2001-2011 2001 2011 Increase
Signing Population
Total Population
Signing Population
Total Population
Signing Population
Total Population
Alpine 0 0 3 12,640 - - Ararat 3 11,075 0 10,968 -100% -1% Ballarat 17 79,794 55 92,405 224% 16% Bass Coast 0 23,970 14 29,556 - 23% Baw Baw 4 34,632 13 41,792 225% 21% Benalla 3 13,282 3 13,216 - - Buloke 0 6,961 0 6,241 - -10% Campaspe 9 34,551 16 35,567 78% 3% Central
ldf ld 0 12,246 0 12,239 - -
Colac-Otway 12 19,997 19 19,842 58% -1% Corangamite 0 16,554 3 16,002 - -3% East Gippsland 16 37,792 32 41,597 100% 10% Gannawarra 0 11,377 3 10,080 - -11% Glenelg 0 19,248 0 18,975 - -1% Golden Plains 10 14,278 11 18,174 10% 27% Greater
d 43 85,781 80 99,150 86% 16%
Greater l
41 183,530 111 207,614 171% 13% Greater h
15 55,082 42 59,448 180% 8% Hepburn 0 13,835 3 14,062 - 2% Hindmarsh 0 6,256 0 5,661 - -10% Horsham 0 17,744 9 18,997 - 7% Indigo 0 13,888 5 14,739 - 6% Latrobe 15 66,819 24 70,917 60% 6% Loddon 0 8,177 5 7,296 - -11% Macedon
7 35,552 4 40,872 -43% 15%
Mansfield 0 6,234 0 8,257 - 32% Mildura 4 48,201 15 50,949 275% 6% Mitchell 16 27,391 38 34,184 138% 25% Moira 10 25,401 22 27,676 120% 9% Moorabool 0 23,830 19 27,751 - 16% Mount l d
6 16,141 9 17,208 50% 7% Moyne 4 14,989 0 15,508 -100% 3% Murrindindi 0 13,059 5 12,681 - -3% Northern G
3 12,618 6 11,736 100% -7% Pyrenees 0 6,354 0 6,464 - 2% Queenscliffe 0 3,068 0 2,868 - -7% South
l d 0 24,524 20 26,298 - 7%
Southern G
0 16,484 0 16,162 - -2% Strathbogie 5 9,119 0 9,142 -100% -

Surf Coast 11 19,461 4 25,199 -64% 29% Swan Hill 0 20,635 6 20,290 - -2% Towong 0 5,944 0 5,633 - -5% Wangaratta 0 25,606 10 26,410 - 3% Warrnambool 0 28,572 19 31,690 - 11% Wellington 16 39,158 35 40,127 119% 2% West Wimmera 0 4,547 3 4,088 - -10% Wodonga 19 30,921 15 35,295 -21% 14% Yarriambiack 0 7,737 0 6,841 - -12% Unincorporated Vic 4 7,638 0 8,350 -100% 9%