the distribution and diversity of insular ants: do exotic
TRANSCRIPT

The distribution and diversity of insularants: do exotic species play by differentrules?
N�uria Roura-Pascual1,2, Nathan J. Sanders3 and Cang Hui4,5
1Department de Ciencies Ambientals,
Facultat de Ciencies, Universitat de Girona,
Girona, Catalonia, Spain, 2Centre Tecnol�ogic
Forestal de Catalunya, Ctra. Sant Llorenc de
Morunys km 2, Solsona, Catalonia, Spain,3Center for Macroecology, Evolution, and
Climate, University of Copenhagen,
Copenhagen, 2100, Denmark, 4Centre for
Invasions Biology, Department of
Mathematical Sciences, Stellenbosch
University, Matieland 7602, South Africa,5Mathematical and Physical Biosciences,
African Institute for Mathematical Sciences,
Muizenberg, 7945, South Africa
*Correspondence: N�uria Roura-Pascual,
Departament de Ciencies Ambientals, Facultat
de Ciencies, Universitat de Girona, Campus
Montilivi, 17071 Girona, Catalonia, Spain.
E-mail: [email protected]
ABSTRACT
Aim To examine the relationship between island characteristics (area, distance
to the nearest continent, climate and human population size) and ant species
richness, as well as the factors underlying global geographical clustering of
native and exotic ant composition on islands.
Location One hundred and two islands from 20 island groups around the
world.
Methods We used spatial linear models that consider the spatial structure of
islands to examine patterns of ant species richness. We also performed
modularity analyses to identify clusters of islands hosting a similar suite of
species and constructed conditional inference trees to assess the characteristics
of islands that explain the formation of these island–ant groups.
Results Island area was the best predictor of ant species richness. However,
distance to the nearest continent was an important predictor of native ant
species richness, as was human population size for exotic species richness.
Native species appear slightly more modulated (i.e. well grouped in species
assemblages that are present over a distinct cluster of islands) than are exotic
species. Exotic species, while still exhibiting some modularity, tended to be
widely distributed among island groups. Interestingly, ocean currents accounted
for most of the variation in modularity and thus species composition for both
native and exotic ant species.
Main conclusions Contrary to previous work, both native and exotic species
appeared to be confined to particular island regions, and patterns in the
distribution of both native and exotic species were limited by a similar suite of
factors. However, the distribution of exotic ant species appeared to be more
influenced by human-related variables and less structured relative to those of
native ant species, perhaps due to the long-term (and increasing) influence of
human-mediated dispersal that favours exotic species.
Keywords
Biodiversity, biological invasions, Hymenoptera: Formicidae, insular bio-
geography, invasiveness, nativeness, spatial distribution, species richness
INTRODUCTION
Oceanic islands have been test beds for biogeographical
theory, at least since MacArthur & Wilson (1963, 1967) first
elucidated the dynamic theory of island biogeography and
Simberloff & Wilson (1969) went on to test its fundamental
tenets experimentally. Indeed, over the last several decades
biogeographers have taken diverse approaches to understand
why some islands have more species than others. Concurrent
with the increased understanding of insular biodiversity has
DOI: 10.1111/geb.12442VC 2016 John Wiley & Sons Ltd http://wileyonlinelibrary.com/journal/geb642
Global Ecology and Biogeography, (Global Ecol. Biogeogr.) (2016) 25, 642–654
RESEARCHPAPER
been the increasing spread of exotic species among island
systems, some of which may become dominant competitors
(Borges et al., 2006; Blackburn et al., 2008; Traveset et al.,
2014; Whittaker et al., 2014). These natural biogeographical
experiments have resulted in novel combinations of native
and exotic species, sometimes increasing but at other times
decreasing local diversity; however, it is not yet clear what
rules (or key processes) govern the structure and dynamics
of island assemblages (Whittaker et al., 2014).
The theory of island biogeography (MacArthur & Wilson,
1967) posits that island size and isolation drive speciation,
colonization and extinction, which ultimately limit the num-
ber of indigenous species on oceanic islands. But do exotic
species adhere to the principles of island biogeography
theory? Or do they simply increase diversity on islands or
decrease it when they are dominant competitors or preda-
tors? The size of islands and their geographical complexity
influence habitat diversity, and therefore the number of spe-
cies that can persist on an island. Habitat diversity affects
both exotic and native species, whether endemic or not, such
that islands with a high habitat diversity are likely to sustain
a rich biota of both native and exotic species (Levine &
D’Antonio, 1999; Stohlgren et al., 2003).
Isolated islands can often have a unique native biota rela-
tive to the biota of the nearest mainland (Sadler, 1999).
However, island isolation is more likely to influence collec-
tions of native species rather than exotic species, in part
because the distribution and dispersal of exotic species is so
closely tied to humans (Bartomeus et al., 2012). Humans
facilitate both the introduction (by removing the barriers
that confine species to certain areas) and the establishment
(by increasing propagule pressure) of exotic species (William-
son, 1996). Assemblages on islands shaped by anthropogenic
forces seem to be randomly structured but biased by histori-
cal trading and human settlement (Helmus et al., 2014).
Therefore, if the diversity of native species on islands is
driven solely by the fundamental processes that lie at the
heart of the theory of island biogeography, then the predic-
tion would be that native species, rather than exotic species,
should show stronger signals of matching between their niche
requirements and the characteristics of islands because they
have evolved in association with those islands. In addition to
traditional island biogeography analyses of species richness,
one way to test this prediction would be to ask whether
native species on islands belong to distinct functional clusters
(or modules), with species matching the habitat within a
geographically clustered group of islands. In contrast, exotic
species should exhibit a weaker match because many exotic
species are dispersed by humans, with no regard to whether
the niche requirements of the species match the characteris-
tics of the island (Hui et al., 2013).
Here, we use data on the occurrences of ant species on
102 islands that belong to 20 island groups around the world
to: (1) examine the potential drivers of the insular species
richness of native species (including both endemic and non-
endemic species) and exotic ant species, and (2) identify
global patterns of species composition and the processes that
shape them – some in line with traditional island biogeogra-
phy theory and others reflecting anthropogenic processes that
potentially govern these clustered groups of native and exotic
ants world-wide. Exotic ants constitute a diverse group of
species that have become established across many islands
world-wide. They have overcome biogeographical barriers
associated with human-mediated transport pathways, and
some species are responsible for causing a significant dis-
placement of native fauna and altering the functioning of
ecosystems (Rizali et al., 2010; Morrison, 2014). While
numerous studies have examined ant diversity on islands and
archipelagos in many corners of the globe (see Appendix 1),
none have elucidated the relationship between native and
exotic ants globally, nor have they identified the potential
drivers of such relationships. Therefore, to the best of our
knowledge, ours is the first study to examine the biogeogra-
phy of exotic insular ants at a global scale.
METHODS
Data
The occurrences of native and exotic ants on islands were
extracted from existing literature. We limited the search to
species checklists on small islands (area< 1000 km2) and
extended this by combining literature reviews with field work
conducted after 1995 to increase the probability of complete
sampling of all island habitats (Appendix 1). By doing so, we
limited the analyses to studies where information on species
presence was not only obtained from a compilation of pub-
lished records but also from a recent field survey where both
native and exotic species were identified. Many of the studies
conducted prior to 1995 did not include field surveys and/or
excluded exotic species from their lists (Morrison, 2014).
Prior to our formal statistical analysis, we explored the com-
pleteness of the dataset by constructing species accumulation
curves and the zeta-diversity index. Zeta diversity depicts the
number of species shared by multiple sites and either declines
with the number of sites exponentially, indicating stochastic
assembly processes, or follows a power law, suggesting habitat
differentiation among species (Hui & McGeoch, 2014).
The independent variables considered were related to envi-
ronmental heterogeneity and natural isolation, but also to
biotic diversity and human alteration (Appendix S1 in Sup-
porting Information). Variables related to environmental het-
erogeneity were island area and climatic variables (mean
annual temperature and mean annual precipitation; Hijmans
et al., 2005), while variables related to natural isolation were
represented by longitude and latitude, distance to the nearest
continent, distance to the nearest island, number of islands
within a radius of 300 km and a series of biogeographical
elements [such as biogeographical realm (Olson et al., 2001)
and ocean, ocean region and ocean current]. Variables related
to biotic diversity (subfamily, tribe, generic and species rich-
ness) were derived from source publications, while human
alteration was estimated based on the number of people
Native-exotic ant biogeography
Global Ecology and Biogeography, 25, 642–654, VC 2016 John Wiley & Sons Ltd 643
inhabiting each island. This last variable was included as a surro-
gate of the amount of trade and consequent opportunities for
import and release of exotic ants (as in Blackburn et al., 2008).
Data on human population size, island area and ocean current or
region were derived from online atlases, databases or encyclopae-
dias (UNEP, 2010; Encyclopædia Britannica, 2011; Ryan et al.,
2013; Wikimedia Foundation Inc., 2015).
Species richness analyses
We first investigated the univariate and multivariate relation-
ships between native and exotic species richness and island
characteristics using spatial linear models of the simultaneous
autoregressive (SAR) model type. SAR models assume that
the response at each location is a function not only of the
explanatory variable but also of the values of the response at
neighbouring locations (Kissling & Carl, 2008). A SAR of the
error type (which assumes that the spatial autocorrelation is
not fully explained by the explanatory variables) was chosen
and a lag distance of d 5 1000 km with weighted neighbour-
hood structure showed the best model fit and largely reduced
the spatial autocorrelation from the residuals, although it did
not completely eliminate it. In the multivariate analyses, we
examined all possible combinations of five explanatory varia-
bles related to environmental heterogeneity (island area,
mean annual temperature and mean annual precipitation),
natural isolation (distance to the nearest continent) and
human alteration (human population size) and chose the
best ones based on the Akaike information criterion (AIC)
(Burnham & Anderson, 2002). Non-climatic variables were
log10-transformed to approximate normally distributed resid-
uals. Statistical analyses were conducted using the R package
SPDEP (Bivand, 2015).
Species composition analyses
We then adopted a two-step approach to examine patterns of
community composition of native and exotic ant diversity
across islands. First we employed modularity analysis to
identify groups of islands hosting similar suites of species to
test the prediction that native species would be clustered
among islands but exotic species would show no such clus-
tering. Modularity analyses, also called compartmentalization,
have been used in ecological studies to provide insights into
the structure of food webs and co-distributions of species
that are otherwise difficult to quantify (Olesen et al., 2007;
Hui et al., 2013). The basic idea is that, given a network of
nodes, modularity analyses partition the network nodes into
groups (or modules) within which the number of within-
group connections are more dense than the between-group
connections and are maximized relative to random expecta-
tion (Newman & Girvan, 2004).
We generated a species 3 site matrix, with both species
and islands treated as network nodes. The partitioning of
nodes into modules was conducted by maximizing the net-
work’s modularity using simulated annealing in the NETCARTO
program (Guimera & Amaral, 2005). We used the Z-score of
modularity for comparing natives with exotics, MZ 5 (M –
MN)/SDN, where MN and SDN are the average and standard
deviation of modularity from 1000 random matrices with the
same ranking of node degrees as the observed matrices (Gui-
mera & Amaral, 2005). By using data from native and exotic
species separately and a two-sample Welch’s t-test for com-
parison, we tested whether native species were more com-
partmentalized among islands than were exotic species. A
significant test would demonstrate that the characteristics of
islands increase modularity, while anthropogenic processes
(and unintentional introduction of exotic species) reduce it.
Second, we used the modules of islands for native and
exotic species derived from the modularity analysis as the
response variables in two separate conditional inference trees
in order to address whether there were characteristics of the
islands that promote modularity for native and exotic spe-
cies. After examining the importance of variables by means
of conditional inference forests, we identified the most influ-
ential ones using conditional inference trees. Conditional
inference forests (or random forests) are a type of recursive
partitioning method that first build a large number of boot-
strapped trees (in our case 2000 trees) based on random
samples of variables, and second identify the global effect of
predictors across all trees by assessing the effect of changing
the values of the nodes (Breiman, 2001). Variables are con-
sidered informative only when the value of the variable
importance is above the absolute value of the lowest
negative-scoring variable (Strobl et al., 2009). Random forests
have been shown to be extremely accurate across datasets
(Caruana & Niculescu-Mizil, 2006).
On the other hand, conditional inference trees use permutation
tests to evaluate the splits (branches in the tree) and do not
require pruning (Hothorn et al., 2006). At each split, a signifi-
cance test on independence between any of the predictors and the
response is performed. A split is established when the P-value, in
our case adjusted for multiple comparisons of the same variable,
is smaller than a pre-specified nominal level. The advantage of
this approach compared with simple classification and regression
trees lies in the effect of the statistically motivated stopping crite-
rion ‘the P-value’, making pruning back of large initial trees
unnecessary (Everitt & Hothorn, 2006). These analyses were con-
ducted using the R package PARTY (Hothorn et al., 2006; Strobl
et al., 2009) and including all independent variables (Appendix
S1). Different modules of islands should reflect different drivers.
The characteristics of islands – mainly related to environmental
heterogeneity, natural isolation, and biotic diversity – should be
the key drivers of islands’ native modules, while anthropogenic
forces could account for the exotic modules (Fisher, 2010).
RESULTS
Species data overview
Native ants occurred on 87 of the 102 islands. They were
absent on 15 islands from the archipelagos of the South
Atlantic islands, Madeira, the Cocos (Keeling) Islands, Poly-
nesia and the Juan Fern�andez Islands. Exotic species were
N. Roura-Pascual et al.
644 Global Ecology and Biogeography, 25, 642–654, VC 2016 John Wiley & Sons Ltd
present on 98 islands, but were absent on only two islands
from Islas Murci�elago and two islands from the archipelago
of Madeira. In general, there were more native species than
exotic species (i.e. 308 native and 87 exotic species, with 27
species occurring as both native and exotics; Appendix S2).
When we used Chao2 metric to estimate the potential diver-
sity across all islands, the number of native species (Chao2
estimate 5 603 6 74 species; mean 6 SD) was substantially
higher than that of exotic species (Chao2 estimate 5 125 6 21
species; t 5 633.87, d.f. 5 200, P< 0.0001). These results sug-
gest that the proportion of discovered species is higher for
exotics (70%) than for native species (50%). Indeed, species
accumulation curves for native species do not asymptote,
even after excluding endemic species, but curves for exotic
species are asymptotic (Appendix S3).
Half of the native species (48%) were found only on a sin-
gle island, but the two most widely distributed species in our
dataset (Pheidole oceanica and Odontomachus simillimus)
occurred on 20 and 28 islands (in six and five archipelagos),
respectively (Appendix S2). Exotic species follow a similar,
but less pronounced, trend: a third of exotic species (37%)
were found only on a single island, but 15 exotic species
occurred on more than 20 islands. Monomorium floricola and
Paratrechina longicornis were the most widely distributed
exotic species in our dataset, present on 50 and 69 islands
(in 11 and 18 archipelagos), respectively (Appendix S2). Zeta
diversity followed an exponential form of decline for both
native and exotic species (Appendix S3), signalling
stochasticity-driven assemblage patterns.
Species richness analyses
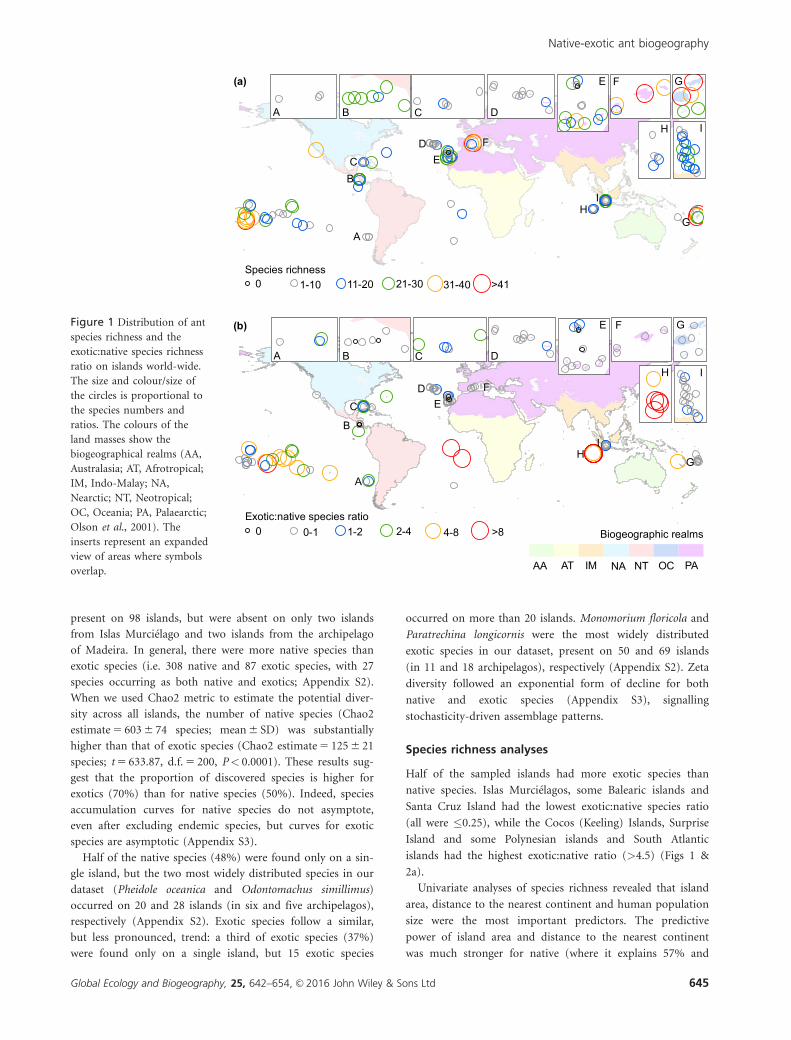
Half of the sampled islands had more exotic species than
native species. Islas Murci�elagos, some Balearic islands and
Santa Cruz Island had the lowest exotic:native species ratio
(all were �0.25), while the Cocos (Keeling) Islands, Surprise
Island and some Polynesian islands and South Atlantic
islands had the highest exotic:native ratio (>4.5) (Figs 1 &
2a).
Univariate analyses of species richness revealed that island
area, distance to the nearest continent and human population
size were the most important predictors. The predictive
power of island area and distance to the nearest continent
was much stronger for native (where it explains 57% and
Figure 1 Distribution of ant
species richness and the
exotic:native species richness
ratio on islands world-wide.
The size and colour/size of
the circles is proportional to
the species numbers and
ratios. The colours of the
land masses show the
biogeographical realms (AA,
Australasia; AT, Afrotropical;
IM, Indo-Malay; NA,
Nearctic; NT, Neotropical;
OC, Oceania; PA, Palaearctic;
Olson et al., 2001). The
inserts represent an expanded
view of areas where symbols
overlap.
Native-exotic ant biogeography
Global Ecology and Biogeography, 25, 642–654, VC 2016 John Wiley & Sons Ltd 645

55% of variation, respectively) than for exotic species (46%
and 26%, respectively), but human population size accounted
for a similar amount of variance in both groups (c. 53%).
The slope of species richness against island area and human
population size was positive in both native and exotic spe-
cies, but the relationship of species richness with distance to
the nearest continent was negative in native species
(20.30 6 0.07, estimate 6 SE) and positive in exotics
(0.09 6 0.05) (Table 1, Fig. 2). Apart from a few divergences,
this apparent difference remained robust when the native
endemic and non-endemic species were considered separately
(Appendices S5 & S6).
The multivariate analyses corroborated our previous
results. Island area and distance to the nearest continent
appeared to be the most influential variables determining
native species richness, while exotic species richness appeared
to be shaped by island area and human population size. In
both cases, climatic variables accounted for some of the vari-
ation in richness (precipitation in the case of native species
and temperature for exotic species) (Table 2). However, when
examining native species separately, we found clear differen-
ces between native endemic and native non-endemic species.
Native endemic species richness appears to be strongly influ-
enced by island area, but native non-endemic species richness
is accounted for mostly by distance to the nearest continent
as well (Appendix S7).
Species composition analyses
The modularity analysis to examine patterns of ant species
composition indicated that both native and exotic species
were significantly spatially compartmentalized, with native
species (nine detected modules, Z-test, MZ 5 72.63,
P< 0.001) slightly more modulated than exotic species (seven
detected modules, Z-test, MZ 5 19.40, P< 0.001). These dif-
ferences in the degree of modularity between native and
exotic species appeared to be statistically significant (Welch’s
t 5 309.2, d.f. 5 190.4, P< 0.0001), corroborating that native
species are more modulated than exotic ants. These results
held up even when comparing native non-endemic species
with exotic species, although the degree of modularity was a
little bit lower (native non-endemic species, six modules,
Z-test, MZ 5 39.70, P< 0.001; exotic species, six modules,
Z-test, MZ 5 7.52, P< 0.001; Welch’s t 5 226.4, d.f. 5 198.0,
P< 0.0001). The most abundant island modules for native
Figure 2 Relationships between island characteristics and native and exotic ant species richness. Lines show linear fits, black broken
lines correspond to native species (depicted in black open circles) while grey continuous lines correspond to exotic species (grey open
circles). Plot (a) shows the relationship between native and exotic species (Appendix S4). Variables in plots (b)–(f) refer to species
richness [log10(x 1 1)], island area (log10x; km2), distance to the nearest continent (log10x; km), human population size [log10(x 1 1)],
mean annual temperature (x; �C) and mean annual precipitation (x; mm) (Appendix S1).
N. Roura-Pascual et al.
646 Global Ecology and Biogeography, 25, 642–654, VC 2016 John Wiley & Sons Ltd

species were modules 2, 4 and 9 (hosting 21%, 18% and
17%, respectively), while for exotic species, modules 1, 2 and
3 (27%, 34% and 26%, respectively) were the most abundant
(Appendix S8 and S9).
Conditional inference forests identified ocean current as
the most informative variable for explaining the differences
between modules for both native and exotic species. Other
explanatory variables differed considerably in their order of
importance (Appendix S10). Since we did not find any vari-
able with a negative score, all variables were considered
informative and were included in the posterior conditional
inference trees. The conditional inference tree of the island
modules for native species included only variables related to
natural isolation (ocean current, ocean region and realm)
and correctly classified 84% of the islands (Fig. 3a). Similarly,
the conditional inference tree for the exotic species consid-
ered a similar set of variables (except the number of exotic
subfamilies) and classified correctly an identical number of
islands (84%; Fig. 3b). Models calibrated using native non-
endemic versus exotic species corroborate this finding, since
only ocean current appeared as the sole variable explaining
differences in species modularity (Appendix S11).
The geographical distribution of modules suggests that the
native modules reflect the long-term outcome of barriers lim-
iting dispersal (Fig. 4a). Most ant assemblages in the central
and southern Pacific were grouped together in module 2,
while modules found in the North Atlantic differentiated the
ant fauna in the east (modules 6 and 9) from the one in the
west (module 5); the remaining modules presented a more
localized distribution. The patterns observed in the native
modules disappeared when we examined the exotic modules
(Fig. 4b). The most widespread exotic modules were modules
1 and 2: module 1 distributed primarily along the Atlantic
Table 1 Univariate spatial linear models examining the relation-
ship between island characteristics and native and exotic ant spe-
cies richness on islands world-wide. Variables refer to species
richness [log10(x 1 1)], island area (log10x; km2), distance to the
nearest continent (log10x; km), human population size
[log10(x 1 1)], mean annual temperature (x; �C) and mean
annual precipitation (x; mm) (Appendix S1). R2 refers to
likelihood-based R2-values after Nagelkerke (1991).
Model Estimate SE Z P R2
Native
Area 0.18 0.03 5.44 <0.001 0.57
Distance 20.30 0.07 24.55 <0.001 0.55
Population 0.09 0.02 4.38 <0.001 0.54
Temperature 20.04 0.02 22.77 0.006 0.49
Precipitation 0.00 0.00 0.16 0.869 0.46
Exotic
Area 0.18 0.02 7.16 <0.001 0.46
Distance 0.09 0.05 2.02 0.044 0.26
Population 0.12 0.01 8.27 <0.001 0.53
Temperature 0.00 0.01 0. 21 0.831 0.23
Precipitation 0.00 0.00 0.31 0.754 0.24
Table 2 Multivariate spatial linear models examining the relationship between island characteristics and native and exotic ant species
richness on islands world-wide. Only the best-subset models (those with DAIC< 4) are presented, with the most parsimonious model
highlighted in bold. Each row corresponds to a different model. The third and fourth columns refer to the AIC analysis, while the other
columns refer to the likelihood ratio test comparing each model with the one presenting the lowest AIC. Variables refer to species rich-
ness [log10(x 1 1)], island area (log10x; km2), distance to the nearest continent (log10x; km), human population size [log10(x 1 1)], mean
annual temperature (x; �C) and mean annual precipitation (x; mm) (Appendix S1). Superscript ‘M2’ indicates that the log-likelihood-
ratio test was calculated against the second model within the same set of models.
Model N AIC DAIC Log-likelihood Likelihood ratio d.f. P
Native
Area 1 distance 1 precipitation 3 29.99 0.00 28.99
Area 1 distance 1 temperature 1 precipitation 4 31.36 1.37 28.68 0.63 1 0.43
Area 1 distance 1 population 1 precipitation 4 31.93 1.94 28.97 0.06 1 0.81
Area 1 distance 2 32.25 2.26 211.13 4.26 1 0.04
Area 1 distance 1 population 1 temperature 1 precipitation 5 33.32 3.33 28.66 0.67 2 0.71
Area 1 distance 1 temperature 3 33.87 3.88 210.94 M24.51 1 0.03
Exotic
Area 1 population 1 temperature 3 216.35 0.00 14.18
Area 1 distance 1 population 1 temperature 4 215.50 0.85 14.75 1.15 1 0.28
Area 1 population 1 temperature 1 precipitation 4 215.12 1.23 14.56 0.77 1 0.38
Area 1 distance 1 population 1 temperature 1 precipitation 5 214.80 1.55 15.40 2.45 2 0.29
Distance 1 population 1 temperature 3 213.49 2.86 12.74 M24.02 1 0.05
Distance 1 population 1 temperature 1 precipitation 4 213.12 3.23 13.56 1.23 1 0.27
Population 1 temperature 2 212.96 3.39 11.48 5.39 1 0.02
Native-exotic ant biogeography
Global Ecology and Biogeography, 25, 642–654, VC 2016 John Wiley & Sons Ltd 647

Figure 3 Conditional inference tree visualizing the distribution of (a) native and (b) exotic modules for islands (i.e. distinct clusters of
islands with a certain assemblage of species) derived from a modularity analysis. Ocean current is the most relevant factor followed by
biogeographical realm (realm), ocean region and number of exotic subfamilies (N exotic subfamilies). The significance value of variables
chosen at each split is indicated. The bar graphs in terminal nodes show the proportion of islands in each module class. The module 0
means that the island does not have ant species. Abbreviations for ocean currents: Ant, Antilles Current; AtlSEq, Atlantic South
Equatorial Current; Azo, Azores Current; Cal, California Current; Can, Canary Current; Flo, Florida Current; IndSEq, Indian South
Equatorial Current; Java, Java Sea; Med, Mediterranean Sea; NAtlg, North Atlantic gyre; PacEqcc, Pacific Equatorial countercurrent;
PacNEq, Pacific North Equatorial Current; PacSEq, Pacific South Equatorial Current; Peru, Peru Current; SAtl, South Atlantic Current;
SPacg, South Pacific gyre. Abbreviations for biogeographical realms: AA, Australasia; AT, Afrotropical; IM, Indo-Malay; NA, Nearctic;
NT, Neotropical; OC, Oceania; PA, Palaearctic.
N. Roura-Pascual et al.
648 Global Ecology and Biogeography, 25, 642–654, VC 2016 John Wiley & Sons Ltd

Ocean and module 2 across the central and southern Pacific
Ocean (Appendix S12 for a more detailed description).
DISCUSSION
Why biodiversity varies from place to place on the planet is
one of the most fundamental questions in biogeography. The
study of biodiversity on islands, either experimentally (Sim-
berloff & Wilson, 1969) or observationally (Losos & Ricklefs,
2010), has illuminated many of the biogeographical processes
that can shape spatial variation in biodiversity. Using data on
ant biodiversity from 102 islands from 20 island groups
around the world, we found that island area is the most
important predictor of both native and exotic species rich-
ness, followed by distance to the nearest continent in the case
of native species and human population size for exotic spe-
cies. The global patterns of native and exotic species compo-
sition also appeared to be constrained to certain geographical
regions by factors related to natural isolation. However, while
still exhibiting some modularity, exotic ant species tended to
be more widely distributed among island groups, probably
due to the influence of human-mediated dispersal.
It is important to highlight, however, that these patterns
depend on reliable checklists and surveys of island faunas
(Appendix 1). We tried to ensure that these checklists
Figure 4 Distribution of (a) native and (b) exotic modules for islands (i.e. distinct clusters of islands with a certain assemblage of
species) derived from a modularity analysis. The colours indicate the module assigned by the modularity analysis, while the symbols
show whether the conditional inference tree grouped that particular island in a node where the majority of islands have the same
module (�) or a different one (D). Module 0 means that the island does not have ant species. The colours of the land masses show the
biogeographical realms (AA, Australasia; AT, Afrotropical; IM, Indo-Malay; NA, Nearctic; NT, Neotropical; OC, Oceania, PA, Palaearctic;
Olson et al., 2001). The inserts represent an expanded view of areas where symbols overlap.
Native-exotic ant biogeography
Global Ecology and Biogeography, 25, 642–654, VC 2016 John Wiley & Sons Ltd 649

contained the most up-to-date information by considering
only recent studies that included field sampling; even so some
of them may not be complete yet and the native/exotic status
of some species may still be uncertain or unknown. Moreover,
because many exotic ant species are dominant competitors
and displace native species (either locally or regionally) it
could be the case that some native endemic and non-endemic
species have become extinct and what we see today on islands
around the world are homogenized ant communities domi-
nated by only a handful of exotic, but naturalized, species.
However, because our results from the analyses in which we
separated native species into endemic and non-endemic spe-
cies (using a reduced set of the original data, i.e. 77 islands
from 18 archipelagos; see Appendix 1) present only a few
divergences, we argue that our global analyses can provide
initial insights into the richness and composition patterns of
native and exotic ant species on oceanic islands.
Native and exotic species were present on most islands,
but only a few native ants occurred on many islands, in con-
trast with exotic ant species that occurred on many islands.
Besides these differences, the zeta-diversity indices of native
and exotic species were qualitatively similar, suggesting that
stochastic forces shape the distributions of both native and
exotic ant species. Analyses of species richness confirmed the
strong influence of island area on both native and exotic ant
species. The effect of area on species diversity has received
considerable attention over the years (Rosenzweig, 1995).
Island area is likely to increase habitat heterogeneity, and
thus ant species diversity, but it can also influence speciation,
extinction and colonization (H€olldobler & Wilson, 1990;
Abbott et al., 2006; Fisher, 2010). However, the effect of
island area is largely moulded by distance to the nearest con-
tinent. The influence of distance to the nearest continent on
native ant species richness suggests that communities of
native endemic and non-endemic species are shaped by two
different sets of assembly processes: communities of native
endemics depend more on habitat diversity, whilst native
non-endemic species are shaped by dispersal (perhaps human
assisted) from mainland areas as well. Contrary to native spe-
cies, distance to the nearest continent does not seem to influ-
ence the richness of exotic ant species, and more isolated
islands seem to harbour more exotic species than do islands
that are close to continents. Such a pattern could arise if
exotic ants have traits that predispose them for dispersal and
establishment and they arrive on remote islands with depau-
perate native ant fauna (Fisher, 2010). In any case, human
population seems to account for considerable variation in
exotic species richness because of the role of humans as dis-
persal agents, facilitating the establishment of exotic species
across the world (Rizali et al., 2010; Morrison, 2014).
When we examined the composition patterns of insular
ants, the modularity analyses indicated that the native species
were slightly more modulated (i.e. separated into numerous
groups of islands) than were exotic species. Natural isolation
seems to be the most plausible hypothesis for explaining the
higher modularity of native species. The limited dispersal abil-
ity of most native ants confines them to adjacent islands inter-
connected by prevailing winds and ocean currents (Fisher,
2010; Morrison, 2014). Modules 9 and 6 are quite interesting
in this regard. One part of module 9 lies in the Mediterranean
Sea (including the Balearic Islands) and the other in the
Atlantic Ocean (including the archipelagos of Azores and
Madeira), suggesting that these islands have been somewhat
historically connected. Module 6, which lies between these
Mediterranean and Atlantic islands (including the Canary
Islands), suggests that module 9 is mainly driven by the Euro-
pean continent while module 6 is driven by the African conti-
nent. However, the aggregation of Atlantic islands into a
single module separated from the Mediterranean ones when
considering native non-endemic species alone (i.e. excluding
native endemic species), suggests the idea that there is a set of
species with a broad distribution in this Macaronesia region.
The most widespread species are Hypoponera eduardi, Lasius
grandis, Monomorium subopacum, Monomorium carbonarium
and Plagiolepis schmitzii (Appendix S2). The rest of the mod-
ules present a more localized distribution, apart from module
2 that groups most of the islands scattered over the central
and southern Pacific Ocean. The most widespread species in
this region are Technomyrmex albipes, Pheidole oceanica, Phei-
dole umbonata, Rogeria stigmatica and Tetramorium pacificum
in module 2, but also Odontomachus simillimus and Anochetus
graeffei in module 4 (Appendix S2). Ward & Wetterer (2006)
called these species ‘wide-ranging Pacific natives’.
In contrast to our prediction for native ants, we expected
exotic species to be little constrained by natural isolation and
therefore to present a more homogeneous distribution as a
consequence of human movements breaking the geographical
barriers that confine taxa to certain biogeographical regions.
The exotic assemblages examined in our study seem to differ
among ocean currents and oceanic regions. Nevertheless, the
exotic assemblages appear to be slightly less spatially struc-
tured than native ones. Module 1 is principally distributed
along the Atlantic Ocean, while module 2 is distributed
across the central and southern Pacific Ocean. Module 3,
however, presents a more widespread distribution and cannot
be localized in a specific geographical region. This apparent
homogenization in the distribution of modules for exotic
species is driven by the presence of a few species with a large
geographical range throughout the world. Exotic ants repre-
sent only a quarter of the total pool of species, but a few of
these species are present in a large number of islands. The
most prominent one is Paratrechina longicornis, followed by
Monomorium floricola, Tetramorium bicarinatum, Tapinoma
melanocephalum, Pheidole megacephala, Anoplolepis gracilipes,
Cardiocondyla nuda, Cardiocondyla emeryi, Nylanderia bour-
bonica, Solenopsis geminata, Tetramorium smillimum, Linepi-
thema humile and Nylanderia vaga (Appendix S2).
Biotic interactions, at least as examined here, do not seem
to influence the modular structure of these insular ant
assemblages. Because we analysed changes in ant assemblages
at the island level, it is difficult to detect the effect of biotic
interactions operating at small scales and over a much
N. Roura-Pascual et al.
650 Global Ecology and Biogeography, 25, 642–654, VC 2016 John Wiley & Sons Ltd

reduced extent (Fridley et al., 2007). It is, however, relevant
to note that the number of exotic subfamilies differentiates
the archipelagos of Thousand Islands (Indonesia) from Islas
Murci�elago (Costa Rica), both in module 3, with the first
presenting a higher number of subfamilies. The separation of
this module could be due to the artificiality of the module,
which is not restricted to a species’ geographical location but
groups a series of exotic species with a widespread distribu-
tion. Other variables related to environmental heterogeneity
(through island area and climate), distance to the nearest
land masses (such as geographical coordinates and nearest
continents/islands) and human alteration (represented only
by the human population size variable) do not seem to influ-
ence the compartmentalization of ant assemblages (Fig. 3).
The lack of an influence of these variables in our study could
be due to an incomplete sampling of the islands (Morrison,
2014), but also to the inability of these variables to capture
the spatially nested structure of ant assemblages at the global
scale of our analysis.
Human presence and transportation can increase the num-
ber of exotic ants on small islands (Badano et al., 2005; Rizali
et al., 2010), but the human population size variable does
not explain the similarities/differences between island mod-
ules. Following the findings of Helmus et al. (2014) on the
influence of human movements on the biogeography of Ano-
lis lizards among Caribbean islands, data on both the natural
and economic isolation of islands could have provided more
evidence of the effects of humans on insular ant faunas. The
importance of ocean currents and regions in explaining the
modularity of ant assemblages could indicate the complexity
and directionality of movement of people and commodities
that are responsible of these geographical patterns, acting as
surrogates of both past natural and current anthropogenic
isolation. The role of ocean currents and regions in explain-
ing native assemblages could respond to the influence of
long-term biogeographical processes and the movement of
ants across closely related islands (Fisher, 2010), while exotic
modules would be more dependent on economic factors that
influence the present-day transport of humans and commod-
ities among islands and therefore the arrival of exotic ants
(Morrison, 2014).
Combining the data available on ant distributions from
around the world with enhanced geographical tools allowed
us to obtain a first picture of the global biogeography of
exotic insular ants. It also allowed us to make a rough esti-
mate of the geographical barriers that pose constraints on
dispersal among ant assemblages, as well as identify the con-
ditions that modulate insular ant assemblages at global scales.
More field-based studies confirming whether insular ant spe-
cies are native endemic, native non-endemic or exotic could
refine or enhance our results. Nevertheless, our results
strongly indicate that the distribution of native ants is gov-
erned by long-term ecological, biogeographical and evolu-
tionary processes, such as natural isolation, leading to
assemblages of native ants that are more modulated. In con-
trast, assemblages of exotic ants are less geographically con-
strained by natural forces but influenced by factors related to
the invasion process (such as human movements) which are
difficult to consider in our analysis (but see Helmus et al.,
2014). The number of exotic species is not expected to
increase exponentially in the future, but their geographical
extent may increase as a result of secondary dispersal events
(Morrison, 2014). Combining data on species traits and pop-
ulation genetics and genomics in addition to the kinds of
data we present here would provide insights into the
relationships among ecological interactions, evolutionary
processes, biogeographical barriers and the influence of
human-aided dispersal on the distribution of ants, be they
exotic or not, among islands.
ACKNOWLEDGEMENTS
We are grateful to Xavier Espadaler for sharing occurrence data
on ant distribution in the Canary and Balearic islands and Paulo
A. V. Borges and two anonymous reviewers for many useful sug-
gestions. N.J.S. was supported by a National Science Foundation
Dimensions of Biodiversity grant (NSF-1136703) and acknowl-
edges the support of the Danish National Research Foundation
for its support of the Center for Macroecology, Evolution and
Climate. C.H. was supported by the National Research Founda-
tion of South Africa (no. 89967 and 76912) and the Australian
Research Council (Discovery Project DP150103017).
REFERENCES
Abbott, K.L., Sarty, M. & Lester, P.J. (2006) The ants of Toke-
lau. New Zealand Journal of Zoology, 33, 157–164.
Badano, E.I., Regidor, H.A., Nunez, H.A., Acosta, R. &
Gianoli, E. (2005) Species richness and structure of ant
communities in a dynamic archipelago: effects of island
area and age. Journal of Biogeography, 32, 221–227.
Bartomeus, I., Sol, D., Pino, J., Vicente, P. & Font, X. (2012)
Deconstructing the native–exotic richness relationship in
plants. Global Ecology and Biogeography, 21, 524–533.
Bivand, G.P. (2015) Comparing implementations of estima-
tion methods for spatial econometrics. Journal of Statistical
Software, 63, 1–36.
Blackburn, T.M., Cassey, P. & Lockwood, J.L. (2008) The
island biogeography of exotic bird species. Global Ecology
and Biogeography, 17, 246–251.
Borges, P.A.V., Lobo, J.M., de Azevedo, E.B., Gaspar, C.S.,
Melo, C. & Nunes, L.V. (2006) Invasibility and species
richness of island endemic arthropods: a general model of
endemic vs. exotic species. Journal of Biogeography, 33,
169–187.
Breiman, L. (2001) Random forests. Machine Learning, 45,
5–32.
Burnham, K.P. & Anderson, D.R. (2002) Model selection and
multimodal inference: a practical information-theoretic
approach. Springer-Verlag, New York.
Caruana, R. & Niculescu-Mizil, A. (2006) An empirical com-
parison of supervised learning algorithms. Proceedings of
Native-exotic ant biogeography
Global Ecology and Biogeography, 25, 642–654, VC 2016 John Wiley & Sons Ltd 651

the 23rd International Conference on Machine Learning
(ICML 2006), pp. 161–168. ACM Press, New York.
Encyclopædia Britannica, Inc. (2011) Ocean current:
major ocean current systems of the world. Available at: http://
global.britannica.com/media/full/553857/46367 (accessed 14
May 2014).
Everitt, B. & Hothorn, T. (2006) A handbook of statistical
analyses using R. Chapman & Hall/CRC, Boca Raton, FL.
Fisher, B.L. (2010) Biogeography. Ant ecology (ed. by L. Lach,
C.L. Parr and K.L. Abbott), pp. 18–37. Oxford University
Press, Oxford.
Fridley, J.D., Stachowicz, J.J., Naeem, S., Sax, D.F., Seabloom,
E.W., Smith, M.D., Stohlgren, T.J., Tilman, D. & Von
Holle, B. (2007) The invasion paradox: reconciling pattern
and process in species invasions. Ecology, 88, 3–17.
Guimera, R. & Amaral, L.A.N. (2005) Functional cartogra-
phy of complex metabolic networks. Nature, 433, 895–
900.
Helmus, M.R., Mahler, D.L. & Losos, J.B. (2014) Island bio-
geography of the Anthropocene. Nature, 513, 543–546.
Hijmans, R.J., Cameron, S.E., Parra, J.L., Jones, P.G. & Jarvis,
A. (2005) Very high resolution interpolated climate surfa-
ces for global land areas. International Journal of Climatol-
ogy, 25, 1965–1978.
H€olldobler, B. & Wilson, E.O. (1990) The ants. Springer-Ver-
lag, Berlin.
Hothorn, T., Hornik, K. & Zeileis, A. (2006) Unbiased recur-
sive partitioning: a conditional inference framework. Jour-
nal of Computational and Graphical Statistics, 15, 651–674.
Hui, C. & McGeoch, M.A. (2014) Zeta diversity as a concept
and metric that unifies incidence-based biodiversity pat-
terns. The American Naturalist, 184, 684–694.
Hui, C., Richardson, D.M., Py�sek, P., Le Roux, J.J., Kucera, T.
& Jaro�s�ık, V. (2013) Increasing functional modularity with
residence time in the co-distribution of native and intro-
duced vascular plants. Nature Communications, 4, 2454.
Kissling, W.D. & Carl, G. (2008) Spatial autocorrelation and
the selection of simultaneous autoregressive models. Global
Ecology and Biogeography, 17, 59–71.
Levine, J.M. & D’Antonio, C.M. (1999) Elton revisited: a
review of evidence linking diversity and invasibility. Oikos,
87, 15–26.
Losos, J.B. & Ricklefs, R.E. (eds.) (2010) The theory of island
biogeography revisited. Princeton University Press, Prince-
ton, NJ.
MacArthur, R.H. & Wilson, E.O. (1963) Equilibrium-theory
of insular zoogeography. Evolution, 17, 373–387.
MacArthur, R.H. & Wilson, E.O. (1967) The theory of island
biogeography. Princeton University Press, Princeton, NJ.
Morrison, L.W. (2014) The ants of remote Polynesia revis-
ited. Insectes Sociaux, 61, 217–228.
Nagelkerke, N.J.D. (1991) A note on a general definition of
the coefficient of determination. Biometrika, 78, 691–692.
Newman, M.E.J. & Girvan, M. (2004) Finding and evaluating
community structure in networks. Physical Review E, 69,
026113.
Olesen, J.M., Bascompte, J., Dupont, Y.L. & Jordano, P. (2007)
The modularity of pollination networks. Proceedings of the
National Academy of Sciences USA, 104, 19891–19896.
Olson, D.M., Dinerstein, E., Wikramanayake, E.D., Burgess,
N.D., Powell, G.V.N., Underwood, E.C., D’Amico, J.A.,
Itoua, I., Strand, H.E., Morrison, J.C., Loucks, C.J., Allnutt,
T.F., Ricketts, T.H., Kura, Y., Lamoreux, J.F., Wettengel,
W.W., Hedao, P. & Kassem, K.R. (2001) Terrestrial ecore-
gions of the world: a new map of life on Earth. Bioscience,
51, 933–938.
Rizali, A., Lohman, D.J., Buchori, D., Prasetyo, L.B., Triwidodo,
H., Bos, M.M., Yamane, S. & Schulze, C.H. (2010) Ant com-
munities on small tropical islands: effects of island size and
isolation are obscured by habitat disturbance and ‘tramp’ ant
species. Journal of Biogeography, 37, 229–236.
Rosenzweig, M.L. (1995) Species diversity in space and time.
Cambridge University Press, Cambridge.
Ryan, E.H., Mariano, A.J. & Bischof, B. (2013) Ocean surface
currents. Available at: http://oceancurrents.rsmas.miami.edu
(accessed 14 May 2014).
Sadler, J.P. (1999) Biodiversity on oceanic islands: a palae-
oecological assessment. Journal of Biogeography, 26, 75–
87.
Simberloff, D. & Wilson, E.O. (1969) Experimental zoogoeg-
raphy of islands – colonization of empty islands. Ecology,
50, 278–296.
Stohlgren, T.J., Barnett, D.T. & Kartesz, J. (2003) The rich get
richer: patterns of plant invasions in the United States.
Frontiers in Ecology and the Environment, 1, 11–14.
Strobl, C., Malley, J. & Tutz, G. (2009) An introduction
to recursive partitioning: rationale, application, and
characteristics of classification and regression trees, bag-
ging, and random forests. Psychological Methods, 14,
323–348.
Traveset, A., Kueffer, C. & Daehler, C.C. (2014) Global and
regional nested patterns of non-native invasive floras on
tropical islands. Journal of Biogeography, 41, 823–832.
UNEP (2010) Islands web site. Available at: http://islands.
unep.ch (accessed 14 May 2014).
Ward, D.F. & Wetterer, J.K. (2006) Checklist of the ants of
Fiji (Hymenoptera: Formicidae). Bishop Museum Occa-
sional Papers, 85, 23–47.
Whittaker, R.J., Rigal, F., Borges, P.A.V., Cardoso, P.,
Terzopoulou, S., Casanoves, F., Pla, L., Guilhaumon, F.,
Ladle, R.J. & Triantis, K.A. (2014) Functional biogeography
of oceanic islands and the scaling of functional diversity in
the Azores. Proceedings of the National Academy of Sciences
USA, 111, 13709–13714.
Wikimedia Foundation Inc. (2015) Wikipedia: the free ency-
clopedia. Available at: http://www.wikipedia.org (accessed
14 May 2014).
Williamson, M. (1996) Biological invasions. Chapman and
Hall, London.
Additional references to the data sources used in this study
can be found in Appendix 1.
N. Roura-Pascual et al.
652 Global Ecology and Biogeography, 25, 642–654, VC 2016 John Wiley & Sons Ltd

SUPPORTING INFORMATION
Additional Supporting Information may be found
in the online version of this article at the publisher’s
web-site.
Appendix S1 Variables used in the species richness and
compositional analyses to explain the diversity of ant species
on islands world-wide.
Appendix S2 List of native and exotic ant species used in the
study.
Appendix S3 Species accumulation curves and zeta diversity
for native (separating endemic and non-endemic) and exotic
ant species.
Appendix S4 Relationship between native and exotic ant
species richness.
Appendix S5 Relationship between island characteristics and
native endemic, native non-endemic and exotic ant species
richness.
Appendix S6 Univariate spatial linear models examining
native endemic, native non-endemic and exotic species
richness.
Appendix S7 Multivariate spatial linear models examining
native endemic, native non-endemic and exotic species
richness.
Appendix S8 Summary results of the modularity and
conditional inference tree analyses for islands.
Appendix S9 Number of islands found in each native (or
native non-endemic) and exotic module.
Appendix S10 Importance of variables in explaining the
modularity of islands.
Appendix S11 Conditional inference tree visualizing the
distribution of native non-endemic and exotic modules for
islands.
Appendix S12 Detailed description of the geographical
distribution of native and exotic modules.
Appendix S13 Distribution of native non-endemic and
exotic modules for islands.
Appendix S14 Distribution of nodes predicted in the
conditional inference trees for native and exotic modules.
Appendix S15 Distribution of nodes predicted in the
conditional inference trees for native non-endemic and exotic
modules.
BIOSKETCHES
N�uria Roura-Pascual is an assistant professor at Uni-
versitat de Girona. Her research focuses on under-
standing the distribution of invasive species, with
recent emphasis on the development of tools that pre-
dict their success in a context of global change.
Nathan Sanders is a professor at the University of
Copenhagen. His research focuses on the causes and
consequences of changes in biodiversity
Cang Hui is a professor of mathematical ecology at
Stellenbosch University and a South African Research
Chair in Mathematical and Theoretical Physical Bio-
sciences. His research focuses on investigating the
structure and function of spatial biodiversity and eco-
logical networks.
Editor: Katrin B€ohning-Gaese
Native-exotic ant biogeography
Global Ecology and Biogeography, 25, 642–654, VC 2016 John Wiley & Sons Ltd 653
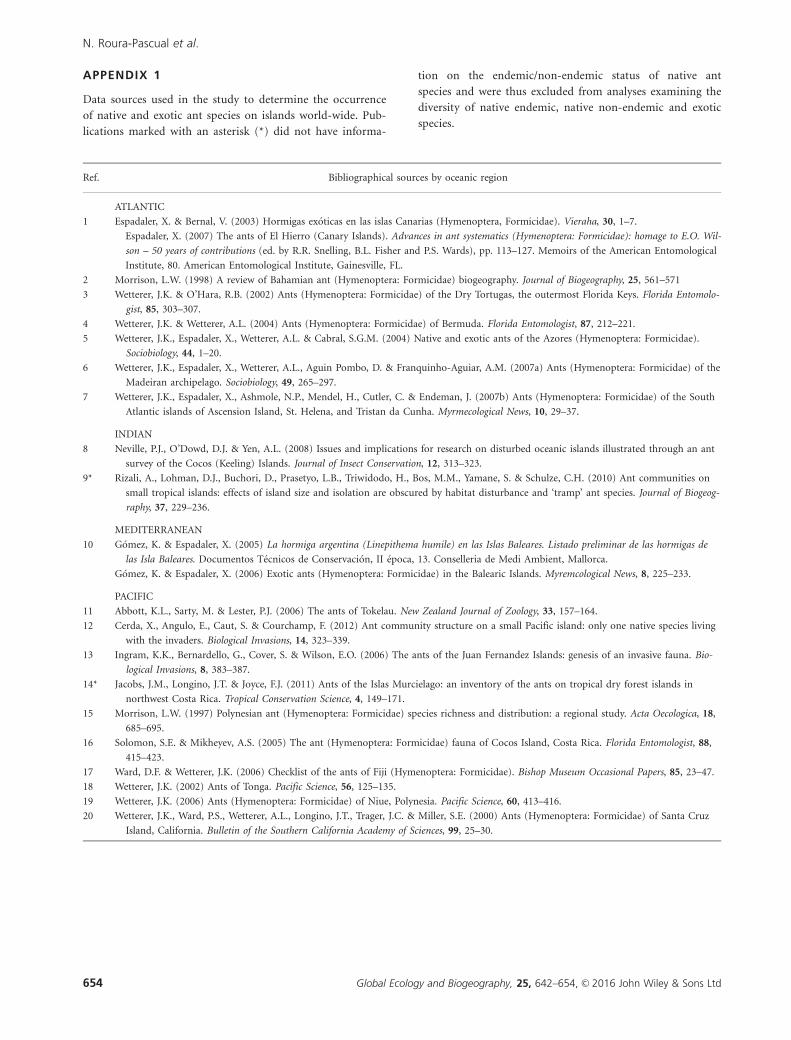
APPENDIX 1
Data sources used in the study to determine the occurrence
of native and exotic ant species on islands world-wide. Pub-
lications marked with an asterisk (*) did not have informa-
tion on the endemic/non-endemic status of native ant
species and were thus excluded from analyses examining the
diversity of native endemic, native non-endemic and exotic
species.
Ref. Bibliographical sources by oceanic region
ATLANTIC
1 Espadaler, X. & Bernal, V. (2003) Hormigas ex�oticas en las islas Canarias (Hymenoptera, Formicidae). Vieraha, 30, 1–7.
Espadaler, X. (2007) The ants of El Hierro (Canary Islands). Advances in ant systematics (Hymenoptera: Formicidae): homage to E.O. Wil-
son – 50 years of contributions (ed. by R.R. Snelling, B.L. Fisher and P.S. Wards), pp. 113–127. Memoirs of the American Entomological
Institute, 80. American Entomological Institute, Gainesville, FL.
2 Morrison, L.W. (1998) A review of Bahamian ant (Hymenoptera: Formicidae) biogeography. Journal of Biogeography, 25, 561–571
3 Wetterer, J.K. & O’Hara, R.B. (2002) Ants (Hymenoptera: Formicidae) of the Dry Tortugas, the outermost Florida Keys. Florida Entomolo-
gist, 85, 303–307.
4 Wetterer, J.K. & Wetterer, A.L. (2004) Ants (Hymenoptera: Formicidae) of Bermuda. Florida Entomologist, 87, 212–221.
5 Wetterer, J.K., Espadaler, X., Wetterer, A.L. & Cabral, S.G.M. (2004) Native and exotic ants of the Azores (Hymenoptera: Formicidae).
Sociobiology, 44, 1–20.
6 Wetterer, J.K., Espadaler, X., Wetterer, A.L., Aguin Pombo, D. & Franquinho-Aguiar, A.M. (2007a) Ants (Hymenoptera: Formicidae) of the
Madeiran archipelago. Sociobiology, 49, 265–297.
7 Wetterer, J.K., Espadaler, X., Ashmole, N.P., Mendel, H., Cutler, C. & Endeman, J. (2007b) Ants (Hymenoptera: Formicidae) of the South
Atlantic islands of Ascension Island, St. Helena, and Tristan da Cunha. Myrmecological News, 10, 29–37.
INDIAN
8 Neville, P.J., O’Dowd, D.J. & Yen, A.L. (2008) Issues and implications for research on disturbed oceanic islands illustrated through an ant
survey of the Cocos (Keeling) Islands. Journal of Insect Conservation, 12, 313–323.
9* Rizali, A., Lohman, D.J., Buchori, D., Prasetyo, L.B., Triwidodo, H., Bos, M.M., Yamane, S. & Schulze, C.H. (2010) Ant communities on
small tropical islands: effects of island size and isolation are obscured by habitat disturbance and ‘tramp’ ant species. Journal of Biogeog-
raphy, 37, 229–236.
MEDITERRANEAN
10 G�omez, K. & Espadaler, X. (2005) La hormiga argentina (Linepithema humile) en las Islas Baleares. Listado preliminar de las hormigas de
las Isla Baleares. Documentos T�ecnicos de Conservaci�on, II �epoca, 13. Conselleria de Medi Ambient, Mallorca.
G�omez, K. & Espadaler, X. (2006) Exotic ants (Hymenoptera: Formicidae) in the Balearic Islands. Myremcological News, 8, 225–233.
PACIFIC
11 Abbott, K.L., Sarty, M. & Lester, P.J. (2006) The ants of Tokelau. New Zealand Journal of Zoology, 33, 157–164.
12 Cerda, X., Angulo, E., Caut, S. & Courchamp, F. (2012) Ant community structure on a small Pacific island: only one native species living
with the invaders. Biological Invasions, 14, 323–339.
13 Ingram, K.K., Bernardello, G., Cover, S. & Wilson, E.O. (2006) The ants of the Juan Fernandez Islands: genesis of an invasive fauna. Bio-
logical Invasions, 8, 383–387.
14* Jacobs, J.M., Longino, J.T. & Joyce, F.J. (2011) Ants of the Islas Murcielago: an inventory of the ants on tropical dry forest islands in
northwest Costa Rica. Tropical Conservation Science, 4, 149–171.
15 Morrison, L.W. (1997) Polynesian ant (Hymenoptera: Formicidae) species richness and distribution: a regional study. Acta Oecologica, 18,
685–695.
16 Solomon, S.E. & Mikheyev, A.S. (2005) The ant (Hymenoptera: Formicidae) fauna of Cocos Island, Costa Rica. Florida Entomologist, 88,
415–423.
17 Ward, D.F. & Wetterer, J.K. (2006) Checklist of the ants of Fiji (Hymenoptera: Formicidae). Bishop Museum Occasional Papers, 85, 23–47.
18 Wetterer, J.K. (2002) Ants of Tonga. Pacific Science, 56, 125–135.
19 Wetterer, J.K. (2006) Ants (Hymenoptera: Formicidae) of Niue, Polynesia. Pacific Science, 60, 413–416.
20 Wetterer, J.K., Ward, P.S., Wetterer, A.L., Longino, J.T., Trager, J.C. & Miller, S.E. (2000) Ants (Hymenoptera: Formicidae) of Santa Cruz
Island, California. Bulletin of the Southern California Academy of Sciences, 99, 25–30.
N. Roura-Pascual et al.
654 Global Ecology and Biogeography, 25, 642–654, VC 2016 John Wiley & Sons Ltd