the direct microscopic analysis of milk over a period of
TRANSCRIPT

Butler University Botanical Studies Butler University Botanical Studies
Volume 5 Butler University Botanical Studies Article 4
The direct microscopic analysis of milk over a period of one year The direct microscopic analysis of milk over a period of one year
from three creameries serving Indianapolis from three creameries serving Indianapolis
George W. Wade Butler University
Follow this and additional works at: https://digitalcommons.butler.edu/botanical
The Butler University Botanical Studies journal was published by the Botany Department of
Butler University, Indianapolis, Indiana, from 1929 to 1964. The scientific journal featured
original papers primarily on plant ecology, taxonomy, and microbiology.
Recommended Citation Recommended Citation Wade, George W. (1941) "The direct microscopic analysis of milk over a period of one year from three creameries serving Indianapolis," Butler University Botanical Studies: Vol. 5 , Article 4. Retrieved from: https://digitalcommons.butler.edu/botanical/vol5/iss1/4
This Article is brought to you for free and open access by Digital Commons @ Butler University. It has been accepted for inclusion in Butler University Botanical Studies by an authorized editor of Digital Commons @ Butler University. For more information, please contact [email protected].

T he Bu t le r Un iv e r s i ty Bo ta n ic a lS tu d ie s jo u r n a l w a s p u b li s he d by t he Bo t-a n y De p a r tm e n t o f B u t le r U niv e r si ty, I n di a n a po li s, I n di a n a, f ro m 1 9 2 9 to1 9 6 4. T h e s ci e n ti fi c jo u r n a l fe a t u re d o rig i n a l p a pe r s p ri m a ri l y o n p l a n te co lo g y, t a xo no m y, a n d m i c ro bi o lo g y . T he p a pe r s co n t ai nv a l u a b lehi s to ri c a l s t u di e s, e s pe ci a l l y f l o ri s ti c s u rv e y s t h a t do c u m e n t I n di a n a ’ sv e g e t a ti o n i n p a s t de c a de s . A u t ho r s we re B u t le r f a c u l ty, c u r re n t a n dfo rm e r m a s te r ’ s de g re e s t u de n t s a n d u n de rg r a d u a te s, a n d o t he r I n di a n abo t a ni s t s . T he jo u r n a l w a s s t a r te d by S t a n le y C ai n, no te d co n se rv a ti o nbi o lo g i s t, a n d e di te d t h ro ug h m o s t o f i t s y e a r s o f p ro d u c ti o n by R a y C.F ri e s ne r, B u t le r ’ s fi r s t bo t a ni s t a n d fo u n de r o f t he de p a r tm e n t i n 1 9 1 9 .T he jo u r n a l w a s di s t ri b u te d to le a r ne d so ci e ti e s a n d li b r a ri e s t h ro ug he x c h a ng e .D u ri ng t he y e a r s o f t he jo u r n a l ’ s p u b li c a ti o n, t he B u t le r U niv e r si ty Bo t-a n y De p a r tm e n t h a d a n a c tiv e p ro g r a m o f re se a r c h a n d s t u de n t t r ai ni ng .2 0 1 b a c he lo r ’ s de g re e s a n d7 5 m a s te r ’ s de g re e s i n Bo t a n y we re co n -fe r re d d u ri ng t hi s pe ri o d . T hi r ty - fiv e o f t he se g r a d u a te s we n t o n to e a r ndo c to r a te s a t o t he r i n s ti t u ti o n s .T he Bo t a n y De p a r tm e n t a t t r a c te d m a n y no t a b le f a c u l ty m e m be r s a n ds t u de n t s . Di s ti ng ui s he d f a c u l ty, i n a d di ti o n to C ai n a n d F ri e s ne r, i n -c l u de dJ o h n E . Po tz g e r, a fo re s t e co lo g i s t a n d p a l y no lo g i s t, Wi l l a r dN e l -so n C l u te , co - fo u n de r o f t he Am e ri c a n Fe r n So ci e ty, M a ri o n T. H a l l, fo r-m e r di re c to r o f t he M o r to n A r bo re t u m , C. M e rv i n P a l m e r, Re x We b s te r,a n dJ o h n Pe l to n . So m e o f t he fo rm e r u n de rg r a d u a te a n d m a s te r ’ s s t u -de n t s w ho m a de a c tiv e co n t ri b u ti o n s to t he fi e l d s o f bo t a n y a n d e co lo g yi n c l u de D wig h t . W . Bi l li ng s, F a y Ke no y e r D ai l y, Wi l li a m A. D a i l y, Re x fo r dD a u de n m i re , F r a n ci s H ue be r, F r a n k M c Co rm i c k, S co t t M c Co y, Ro be r tPe t ty, Po tz g e r, H e le ne S t a r c s, a n d T he o do re S pe r ry . C ai n, D a u be n m i re ,Po tz g e r, a n d Bi l li ng s se rv e d a s P re si de n t s o f t he E co lo g i c a l So ci e ty o fAm e ri c a .Re q ue s t s fo r u se o f m a te ri a l s, e s pe ci a l l y fig u re s a n d t a b le s fo r u se i ne co lo g y te x t bo o k s, f ro m t he Bu t le r Un iv e r s i ty Bo ta n ic a lS tu d ie s co n -ti n ue to be g r a n te d . Fo r m o re i n fo rm a ti o n, v i si t w w w. b u t le r. e d u /
"
r. Hanford V'cn thronghs is also due
g his 1937-38
e lake water at 1929. Nisconsin. The eol. Nat. Hist.
. 1:41-44. 1872.
l!allkton 0 f the :to Stud. 4:13-31.
Lake Michigan niv. Dot. Stud.
Stale Nat. Hist.
.ka. A thesis in Ie of Doctor of
if Woods Hole,
Ecol. 11 :165-183.
~s. McGraw-Hill
Erie. Ohio State
"e. Am. Midland
~. Publisher. 1938.
Am. Jour. Bot.
lpany. New York.
THE DIRECT MICROSCOPIC ANALYSIS OF MILK OVER A PERIOD OF ONE YEAR FROM THREE CREAMERIES SERVING INDIANAPOLIS
By GEORGE W. WADE
This study involves the agar plate count and the direct microscopic connt of milk received f rOIll three SOllfces, taken at weekly intervals, over a periQd of one year. It also includes recognition of the morphological types of bacteria found in milk, in an effort to determine the past history of the milks studied, and to determine the seasonal differences in the bacterial counts of this milk from each of the three SOllfces.
Sedgwick and Batchelder (2) in the results of their bacteriological examination of Boston milk were among the earliest to hring to the public realization of the importance of dairy sanitation. The beginnings of certified milk in 1893 by Coit and Francisco (3) also involved the use of laboratory methods for controlling the number of bacteria present in milk and it was the city of Montclair, N. J., which first undertook regular bacteriological examinations of its milk supply. Prohahly the first work done on a state wide basis was that organized by Conn in Connecticut in 1908. The first committee of American Public Health Association was appointed in 1905 to standardize methods of control of milk. By the time the report was drawn up and adopted in 1910, 21 cities of the United States and Canada had adopted plans. In 1910 examinations in Baltimore, Philadelphia and Boston areas consisted of microscopic examination 6f centrifuge sediments for letlcocytes. and streptococci. In 1929-30, according to Standard Methods (1), 125 commercial laboratories analyzed more than 294,000 samples by the direct miscroscopic method in the United States and 2,500 samples in Canada.
The direct miscroscopic test first developed by Breed (1) has proved to be of immeasurable value on raw and pasteurized milk. It is the best means for determining the presence of excessive number of body cells in raw milk; it is a positive and reliable method for determining the typical intermingling of streptococci and cells in mastitisinfected milk; it also shows the presence of soil organisms, acid formers, colon and putrefactive types of bacteria.
45

The United States Government has set up regular rules as to the most effective means of drawing and handling milk (6). Where these regulations have been in ef fect, they have been of great help in improving the quality of the milk. Since in Indianapolis these rules are not in effect, it was believed that the method of handling milk in this city would lead to great differences in the quality of milk from different dairies. This was found to be true in a previous study by Miss Stanley (5) in this laboratory.
The direct microscopic method is rarely used by dairymen on pasteurized milk, but in many cases forms part of the tests of raw milk as it enters the dairy. Since each type of organism is an indicator of the conditions under which the milk is produced and distributed, a microscopic study of the smear reveals a history of the milk. The diplococci, paired spherical bacteria, are normal flora of milk; these are known as lactic acid bacteria. These forms in excessive numbers indicates slow cooling. The short streptococci,' single or paried spherical bacteria in chains of 3-6 cells, are also lactic acid bacteria and in excessive numbers are likewise indicators of slow cooling. Long chains of spherical streptococci together with an excessive number of body cells, i. e., over 3,000,000 per cc, indicate mastitis.
Staphylococci and pariec1 bacilli are indicators of unclean utensils. They originate in unclean surfaces and moist residues remaining on the surfaces of the cans between mil kings, and from the fat and casein residues found in crevices and open seams of utensils and cans. Their presence in large numbers is an indication of dirty milking machines and cans. Mold fragments are seldom observed in fresh milk (4) but are commonly found around farms, and in milk which has come into contact with some surface containing a scum of sour milk solids. Their presence in large numbers is an indication of dirty cans, milking machine tubes, and connections.
Rods in clumps, individual rods and amorphous matter are indicators of dust, dirt, feed and other kinds of external contamination. These may be seen as long, heavy rods in chains, or in clumps; as short blocky rods also in chains or in clumps; and as long thin rods in chains. The sources of these forms and the mold which often accompanies them, are the flanks and udder of the cow, dust and dandruff from the cow, feed, wet milking, water, manure, etc. These bacteria often include thennoduric and thermophilic types. Bacteria
46
of the former group are the latter group grow aU.
Both agat- and direc latter, the object was to e, of bacteria as well as t delivered to the homes of companies and taken to done on each Satttrday 1939. Companies llcliven and are designated hy th
The agar used for th formula recommended i agar and water blanks w ing solution f rom one till were found by experim and incubated at 3r C f
of whole milk was taken slide, and spread over an needle. This was allow minutes to remove the f for five minutes to fix slide was dipped into a for two to five seconds. 95 % alcohol.
A microscope with I used for counting th~ b a field with a diameter 1/600,000 part of a cu fields of each sample w bacterial clumps, diploc less), long streptococci isolated cocci, -isolated number of bacteria and
The numbers of b streptococci, staphyloc,

as to thc . Where great help these rules ug milk in milk from s study by
"rymen on sts of raw an indica I'
d and dismy of the tal flora of
rs
s in excesei, single
lactic acid of slow
with an exec, indicate
can utensils. emaining on the fat and utensils and f dirty milkobserved in and in milk
19 a scum of itn indication
er are indicaontamination. n clumps; as ng thin rods which often
rOw, dust and re, ctc. These ~es. Bacteria
of the former group are not destroyed by pasteurization and those of the latter group grow abundantly at pasteurization temperatures .
PROCEDURE
Both agar and direct miscroscopic methods were lIsed. rn the latter, the object was to examine for types and numbers of each type of bacteria as well as total numbers. One pint bottle of milk, as delivered to the homes of consumers was obtained from each of three companies and taken to the laboratory for examination. This was done on each Saturday from December 3, 1938 to November II, 1939. Companies delivering the milk are unaware of this experiment and are designated by the letters A, Band C.
The agar used for the plate method was prepared according to the formula recommended in Standard Methods (I). Sterile plates, agar and water blanks were used. The pipettes were kept in cleaning solution from one time of use until the next. Dilutions of 1 :100 were found by experiment to be best and these dilutions were plated and incubated at 37° C for 67 hours. For the direct method, 0.01 cc of whole milk was taken in a calibrated pipette, deposited on a clean slide, and spread over an area of one square centimeter with a sterile needle. This was allowed to dry thoroughly, placed in xylol for five minutes to remove the fat, dried again, and dipped into 95 % alcohol for five minutes to fix the material to the slide. After drying, the slide was dipped into a saturated aqueous solution of methylene blue for two to five seconds. 'Where necessary, the slide was destained in 95 % alcohol.
A microscope with 15x ocular and 1.8 immersion oil objective was used for counting the bacteria. The drawtube was adjusted to give a field with a diameter of 0.146 mm making it possible to examine 1/600,000 part of a cubic centimeter of milk in each field. Thirty fields of each sample wcre observed for the number of body cells, bacterial clumps, diplococci, short streptococci (chains a f eight or less), long streptococci (chains of more than eight), staphylococci, isolated cocci, isolated rods, rods in clumps, mold fragments, number of bacteria and number of groups of bacteria.
total
RESULTS
The numbers of body cells, clumps, diplococci, short and long streptococci, staphylococci, isolated cocci, isolated rods, rods in
:1

~
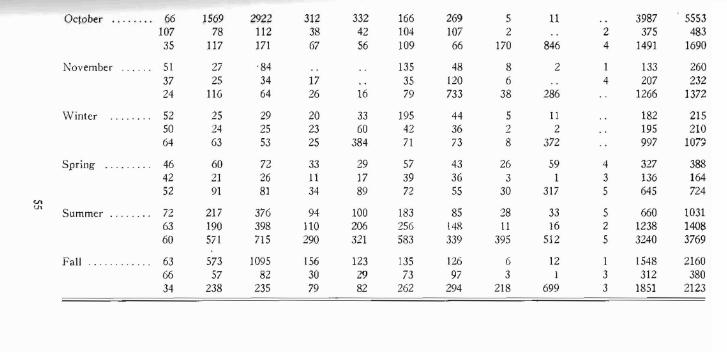
clumps, mold fragments, groups of bacteria and total bacteria per 30 fields are g'iven in terms of monthly averages and seasonal averages ill table I. In view of the dilutions and size of fields studied, each figure must be multiplied by 20,000 to secure the actual numbers per cc of orig·jnalmilk. Table II presents, in monthly and seasonal averages, a comparison of the counts by the plate and direct microscopic method.
Ladle arid ba(/er-ia and trmpcmturc. These organisms are diplococci and short streptococci. When large number of these bacteria are present it is conclusive evidence that the producer has failed to properly cool the milk, (4). The diplococci and the short streptococci followed the temperature curve except for Company A for the month of Octoher, reaching an all time high of 2922 for the diplococci for 30 fields (1/20,000 cc). In sbort streptococci it was noticeable that Companies A and B kept their count down, with a low count of zero for Company A in November and of 5 for B in
l!March and April. The lowest count of Company C was 12 for the month of February. \Vhen milk is cooled down to the optimum temperature for their growth (70° F) the streptococci have a tendency to become larger in size and arrange themselves in short chains. When milk is cooled carelessly (down to 80-85° F) these streptococci have a tendency toward a smaller size usually arranged in clumps which break up later to give the bacteria a scattered appearance. Poor cooling is a good explanation for the presence of excessive number of bacteria in the usual run of market milk (4).
Bacteria fm1n unclean utensils. These organisms appear as isolated cocci, or as clumps of spherical bacteria (staphylococci), resembling bunches of grapes. Producers using milking machines which arc not properly cleaned and sterilized are greatly troubled by this type of contamination. Staphylococci originate primarily from the fat and casein residues found in crevices and open seams of utensils and cans. They are abundantly found in dirty milk machines and cans (4). Except for an unexplained rise of Company A in January, the staphylococci followed the rise and fall of the temperature chart. All companies were high during the summer months, but Company C was very high, having twice the number of organisms per 30 fields as the second company. The all-time high here was Company C during months of June with 619; July with 635; August' with 495; and September with 599. It is only during the
48
summe~ ,m.ol)ths tbt of dirty ~ltensi!s.
Isolated cocci II
month of Novemhel 1/20,000. e"" Thi samples te~tecl.
with a ~911nt of 15 and November will the experimem wll Decemher, 42; j\:Ia November, 48, Un pany (.A.) lead the, we acsume that the the greater the la thus rated: deane Company B.
Bacteria ft'01'n ciated with dust, ell heavy rods in chain above types of bac isolated rods, throll ency to follow lh. throughout; Comr= August. Company the entire experim Company A rising'
M~ld fragment! companies with nc any company. Du ate1y. Mold proba fall of the numher fragments are not
Many bacteria named sources a mophilic (heal-leI\" the bacteria are Il
group they grow al
Masl-it'is hulicatl appear together in

I bacteria per 30 Is-easonal averages Ids studied, each tual I1lllTIbers per od scasonal aver
unt
irect microscopic
anisms are diploof these bacteria cer has failed to
lhe short streptompany A for the 22 for the diploeptococci it was
down, with a ,f! of 5 for 1:1 in
C was 12 for the the optimum tem
,:i have a tendency " in short chains. these streptococci
ranged in clumps ttered appearance. :sence of excessive
(4) .
Isms appear as isostaphylococci), re-milking machines
~reatly troubled by late primarily from pen seams 0 f uten
lirty milk machines of Company A in
tall a £ the tempera,e summer months,
number of organall-time high here 9; July with 635; is only during the
summer .)11onths that t~W., st;i.phY:~Qcocc,i..px.q;Y-f, to be good indicators of dirty utensils. , , I :'1"1 11 ' • •
Isolated cocci followed the chart o[ temperature except for the month of November when,Col1wan.;y C rQse to a high of 733 cells per 1/20,000 CCi, This number (733) was the all-time high for the samples tested. Company C was high for six months; December with a ~.ount of IS4: .\pril. 43: May. 99: July, 613; A ngust. 217; and Novemher with 733. Company_ A had the lowest counts for the experiment with the following low connts per 1/20,000 cc: December. 42; May, 50: June, 83: ALI~ust. 89: September, 63; and November, 48., Only in October with a count of 269 did this company (A) lead the other two companies. In interpreting the results we a~Sl1me that the higher the staphylococci and isolated cocci connt, the greater the lack of cleanliuess of utensils. The companies are thus rated: cleancst, Company A; dirtiest, Company C: and medium, Company B.
Bactt'Yia from dirt. Belonging to this gronp are bacteria associated with dLlst, dirt, feecl, etc. These can be recognized as long, heavy rods in chains or clumps. They are also associated with the above types of bacteria. Company C was predominantly high in isolated rods, throughont the entire experiment, but there was a tendency to follow the temperature curve. Company B was down throughout; Company A rose through the months of April and August. Company C was up enormously high in clumps of rods for the entire experiment while Company B was down throughout, with Company A rising from April to September, inclusive.
Mold fragments followed the temperature curve in all three companies with none present for Jal1l1ary, Febrttary and March for any company. During the summer months the number rose moderately. Mold probably had its source with dirt, hut since the rise and fall of the number is closely related to the temperature curve. mold fragments are not good indicators of the amount of dirt present.
Many bacteria which gain entrance into the milk from the above named sources are of the thermoduric (heat-resisting) and thermophilic (heat-loving) types of organisms. In the former group, the bacteria are not destroyed by pasteurization, and in the latter group they grow abundantly at pasteurization temperatures.
M ast'itis indirators. Body cells and long streptococci, when they appear together in large nnmbers, are indicators of mastitis. Tbe
49

high number of long streptococci and of body cells were found in Company C in March. High counts of long streptococci are found in December for Company C, in February for Company B, and in October for Company A, but these high counts are not accompanied by correspondingly high counts of body cells. With these exceptions, the long streptococci count tends to increase from winter to summer and to decrease again in the fall, indicating that many long streptococci may be lactic acid bacteria which increase with temperature rises. Body cells in all three companies followed the air temperature curve with very little fluc'tuation, except for the months of December and January where the counts rise to 61 and 75 for the respective months in Company C.
A high leucocyte count should not always be interpreted as mastitis. Cows giving colostrum milk and stripper cows will show a high leucocyte count. The same is true of cows whose udders become bruised during any time of their lactation period, or whose resistance have become weakened by over-feeding, etc. Except for a high leucocyte count in Company B in October, the number does not vary' 111uch during the year in any of the companies. It is not easy to detect the presence of mastitis in composite samples of milk as received by the consumer. Individual cases should be tested.
Relaf'ion of Plate count to the fatal 'microscopic count and total {rOUp (Gun!. The plate and microscopic count both gave only estimates of the total number of bacteria present, but the latter is more accurate. This is true because the plate method counts only colonies, each one of which may have started from any number of individual cells. The microscopic method is also quick. Only a few minutes are required in the latter method to determine with what kind of milk one is dealiug. If the sample is not of high quality, the cause can be quickly determined and remedied. In order to learn anything from a plate count, two days must elapse for incubation, and by that time any undesirable milk which might be discovered will have been distributed to the consumer.
In all counts, the direct counts were much higher than the plate count, (table II) as would be expected. Not in all cases did the highest tally correspond in the same companies for the two methods, as in the plate count; Company A was high during the spring, summer and fall seasons, whereas the direct count was high only during the fall, dropping to the lowest of the three companies for each of the
50
other three seasons. In relation with the rise (
The ratio of the plat as foHows: Company ~
C, 1 :500. The ratio of counts are as follows: Company C, 1 :425. Th of dead organisms pres\!! is shown in Company A higher plate count than of living bacteria was hi count of Companies B was fairly well cover:ed pasteurization.
1. For the lactic aCl
position and Comp3ny counts rose in warmer
2. Indicators uf It
following order: fir!itl
Company C, third. Ind. mer months.
3. The rating of th pany C, highest count, hence the least dirt; with
4. Mold was not a number of these organi appeared during the moll
bers of mold fragmen when the air temperatu mold fragments correla' lated rods and rods in c
5. It is hard (or samples. There is one pally C during March.

r.
found in re found
B. and in ompanied se excepwinter to
,nany 'long tempera
'r temper~1onths of 5 for the
~d. as masIlOW a high rs become resistance
a high leunot vary
ot easy to !milk as re
ted.
t and tota.l . only estier is more ly colonies,
individual ~w minutes ind. of milk
Ie cause can n anything and by that
have been
n the plate id the highmethods, as ng, summer . during the each of the
other three seasons. In each case, however. the counts rose m correlation with the rise of temperature.
The ratio of the plate counts to the group microscopic counts are as follows: Company A. 1:150; Company B, 1 :500; and Company C, 1 :500. The ratio of the plate count to the individual microscopic counts are as fonows: Company A, 1:110; Company B, 1:400; and Company C, I :425. The higher the ratio, the higher is the number of dead organisms present to the number of living organisms. This is shown in Company A which had a lower microscopic count and a higher plate count than Company C which indicated that the number of living bacteria was higher in Company A. The high microscopic count of Companies Band C indicated poor past history, but this was fairly well covered up in the results of the plate count by pasteurization.
CONCLUSIONS
1. For the lactic acid bacteria Companies A and. B held the low position and Company C was high throughout the year. All these counts rose in warmer weather.
2. Indicators of unclean utensils placed the companies in the following order: first, Company A; second, Company B; with Company C. third. Indicators here were good only during the summer months.
3. The rating of the companies by bacteria f rom dirt was: Company C, highest count, hence most dirt; Company B, lowest count, hence the least dirt; with Company A occupying the medium position.
4. Mold was not a good indicator of dirt, since the rise in the number of these organisms followed a constant pattern. ?'J 0 mold appeared dming the months with low air temperatures, and the numbers of mold fragment~ were nearly identical during the months when the air temperatures were high. In no case did the number of mold fragments correlate in its rise and fall with the number of isolated rods and rods in clumps,
5. It is hard (or impossihle) to detect mastitis in composite samples. There is one possible exception to this and that was Company C during March.
51

6. In the total counts the ratio of plate to direct microscopic connt was lower in Company A and about equal in Companies Band C for both grOLlp and individual ratios.
7. There was no doubt as to which company ranked lowest in sanitary quality since C kept that position almost consistently. This milk evidently came Irom a dairy which was neglectful of sanitation in several respects.
LITERATL'RE CUED
1. A MERICAN PUBLIC HEALTH ASSOCIATlO~. Standard methods of milk
analysis. American Public Health Association. 1934.
2. HAMMER, B. W. Dairy Bacteriology. John Wiley and Sons. 1938.
3. HEINEMANN, P. G. Milk. Saunders, 1919.
4. L,\ZARUS, N. E. Quality control of market milk. Olsen Publishing Com
pany. 1935.
S. STANLEY,!. A comparison of market milks from ten Indianapolis com
panies by use of the direct microscopic method of analysis. Butler Uniy.
Bot. Stud. 4 :85-92. 1938.
6. UNITED STAns TRF.ASURY D£PARTME1'\T. Milk ordinance and code; 1936.
Public Health Bulletin. No. 220. 1937.
'00 E'~ ... ~ v ... ~.-..c .S :; ~..cc:: ~
::l-o o c:: u '"
.~I=Q
ou·-'" '" ...o c::b:.::: .§ 11 ~ 0 u u ... ... .... '" ;a ...
..c >.~
.0 • ,-..<t: ~ >.:::: ;aE 0,
- E .[ (3.-.... .-'" o
H ... ~ ~ 0 0
..J ~ 8 ..cI=Q o u
<t: 0'"o ...!-< ci ... N 0::::. ... '-'v
C<11.-0
.-v-'"4-< ~
u 0.-0, ._
C
" o .... u 0 "'..co .. U <II
·s ....
ii: o"" . ... ~ v tlO 0. '" ... <II ...E ;. <II '"'2.tlOC:: '" '" ... 0 o <II ... .,'" o <II
.,... "" c:: .0 '"E::l_>.
Z£ c::
~
SI'P J~d "!J"P"q
SjU'lDS"J.'!" PI
sduJUI:) U!
Sp01:J: P'll1j
1"'0:) P"l"l
!"0'0[,{'Ic!
P:)OJOlt
1:):I0:l0:J, . I'ii
pJO;)!t
.d
sll':)
'II
S2

(') o 3
L
.
TABLE I Number of organisms per 30 microscopic fields 0/20,000 cc of original milk) by direct microscopic count in terms of
monthly and seasonal averages. First horizontal line for each month is Company A, the second line is B and the third is C.
'" ""' 0.'" 0 ~
'0 0.'0<) <) .; g " '"0.
" '0 '0 0 0 " ::>~ <) <) 0~ 'u <) U I": 0 t 015- 'c00 <) <) 0 2;~u <)
0 0 .., ;:. 'C 'C ~ ~ " !;,.~~ <)'0
00-'" '" ~ ""'~->. '" .~ -0. ",0. -'" ."" 00 '0 0" " .0"§ ~" 'C'" .~
0 '0 C. o~ ~" 0. "0 '0 "0 dO~0 0::: !l 0 00-"'- ::;; z ~ 0::s" c:Q 0 ~ U)(/) ...l(/) (/) ~ ~ I": .0'" z'"
December 55 38 56 12 42 17 42 7 18 156 212 59 29 28 31 31 36 43 3 6 180 189 61 99 95 30 1106 44 154 9 768 2200 2300
en t.> January ........ 53 27 2J 35 49 547 39 5 12 294 326
51 15 20 13 31 44 29 1 136 151 75 57 43 35 31 43 28 9 290 480 612
February ....... 49 11 10 13 10 13 52 4 5 97 109 41 28 28 27 120 46 36 2 1 261 290 61 34 27 12 17 126 38 7 59 311 325
March .. - ...... 41 77 115 43 41 94 44 11 12 2 381 462 44 8 9 5 12 5 27 2 4 64 72 71 69 46 43 226 87 23 17 248 5 694 738
•••••••• 0April 43 42 41 26 16 26 37 27 80 8 250 293 43 11 16 5 6 6 33 3 3 65 81 46 38 34 35 17 43 18 277 5 351 380

TABLE I-(Continued)
Number of organisms per 30 microscopic fields (1/20,000 cc of original milk) by direct microscopic count in terms of monthly and seasonal averages. First horizontal line for each month is Company A, the second line is B and the third is C.
~<n ~ e. c '0 .,
·0 e.'v "' ;0 v "' <.J 6:!2 Uu 'v
<.J 0 0 " "" 0 3'~ ·E-.; '0 0 0 <.J U 0<: U" ~ ~o. ., U ., <.J
0 U U
00 ~'"
oo.~~ - '" 0-" ." ~ >. ""~ "" .-" '" oto; u"'"<.J ~ e; E :.:: ~fr t<>'" -a. ~]'" c.,
0 o~ j '0 '" -0 '" "' ""-0 ::g "" 0 " ..c~ ot: ", "" 0 ::g o~"7 00
al U a ..Juj Vl ~ "' .... >t: Z.CI g ZM<I'Vl
May ....... , ... 56 61 60 31 30 53 50 40 85 2 350 411. 41 46 45 24 34 108 50 4 4 3 279 340 39 167 165 25 42 113 99 55 426 5 890 1055
v. ,j:> June ........... 49 160 J82 44 73 194 83 22 42 8 693 854
60 ]14 143 49 142 336 225 8 15 3 927 1034 56 363 443 468 192 619 187 128 399 8 21()2 2465
July ........... 82 261 293 123 lSI 192 88 43 43 4 935 1156 62 225 708 152 275 294 40 16 14 2 1760 1985 69 565 600 218 218 635 613 58.1 593 5 3561 4125
August , ...... 86 230 354 106 106 164 86 20 16 4 854 108S 68 231 345 130 203 137 179 10 20 3 1029 1205 55 786 1103 185 555 495 217 476 546 3 4057 4718
September ...... 72 123 269 58 39 105 63 7 25 4 526 669 55 78 100 36 47 81 64 2 3 3 356 426 45 511 500 144 ]75 599 84 447 965 5 2798 3308
11 3987 55533]2 332 166 269 5October ........ 66 )569 2922 2 2 375 483
107 78 112 38 42 104 107 GG 170 846 4 1491 1690
35 117 ]71 67 56 109
2 1 133 260135 48 8November ...... 51 27 84
]7 35 120 G 4 207 23237 25 34
286 1266 137226 16 79 733 3824 116 64
Winter ..
55 1&1 II .3 S 555 49~ 21
7 25 4 526 669105 63September ...... 72 123 269 58 39 2 3 3 356 426
55 78 100 36 47 81 64 2798 3308
45 511 500 144 175 599 84 447 965 5
October ..... ". 66 107 35
1569 78
117
2922 112 171
312 38 67
332 42 56
166 104 109
269 107 66
5 2
170
U
846 2 4
3987 375
1491
. 5553 483
1690
November 5L 37 24
27 25
116
'84 34 64
17 26 16
135 35 79
48 L20 733
8 6
38
2
286
1 4
133 207
1266
260 232
1372
Winter 52 50 64
25 24 63
29 25 53
20 23 2S
33 60
384
195 42 71
44 36 73
5 2 8
11 2
372
182 195 997
215 210
101?
u.. V1
Spring ........ .
Summer ........
46 42 52
72 63 60
60 21 91
217 190 57L
72 26 81
376 398 715
33 11 34
94 110 290
29 17 89
100 206 321
57 39 72
L83 256 583
43 36 5S
85 [48 339
26 3
30
28 11
395
59 1
317
33 16
512
4 3 5
5 2 5
327 136 645
660 1238 3240
388 164 724
1031 140S 3769
Fall .......... 63 66 34
573 57
238
J095 82
235
L56 30 79
123 29 82
l35 73
262
126 97
294
6 3
2L8
12 1
699
1 3 3
L548 312
1851
2160 380
2123

TABLE II
Comparison of plate and direct microscopic counts in terms of monthly and seasonal averages. First horizontal line for each month is Company A, second is B and third is C.
Djrect Mkroscopic Count Month Plate COlllll BacterLa per cc Groups per cc:
December 24,750 4,232,000 3,048,000 1,290 4,188,000 3,632,000
26,740 63,750,000 25,796,000
J alwary 14,287. 6,275,000 5,980,000 850 3,035,000 2,730,000
7,962 10,750,000 10,015,000
February . 32,575 2,975,000 1,950,000 34,612 5,750,000 5,230,000 56,462 6,145,000 5,595,000
March . 55,938 9,440,000 7,595,000 13,400 1,445,000 1,280,000 45,712 15,255,000 13,625,000
April . 54,012 7,560,000 5,855,000 26,887 1,645,000 1,340,000 47,850 7,812,000 7,025,000
May . 25,850 8,230,000 7,000,000 14,740 6,295,000 5,355,000 48,150 21,150,000 18,220,000
June . 67,250 17,080,000 14,620,000 25,340 20,430,000 18,400,000 53,650 41,850,000 39,176,000
July 214,140 23,052,000 18,696,000 34,400 39,616,000 29,250,000
195,720 82,498,000 67,ZZ4,000
August 64,650 21,700,000 17,909,000 36,300 24,100,000 20,580,000
135,050 81,860,000 76,145,000
September 113,040. 28,320,000 13,376,000 22,560 11,104,000 6,736,000
150,200 66,172,000 55,956,000
October 530,400. 83,575,000 60,535,000 46,875 7,300,000 6,130,000 86,550 25,350,000 ZZ,360,000
November . 30,600 6,280,000 5,700,000 11,100 7,420,000 4,640,000 38,100 27,440,000 25,120,000
56
Co seasonal second i
Mond. Winter
Spring
Summer
Fall ..

TABLE II-(Continued)
Comparison of plate and direct microscopic counts in terms of monthly and seasonal averages. First horizontal line ior each month is Company A, second is Baud thi rd is C.
Month Plat.e COllllt.
Winter 23,837 12,230 26,254
Spring 111,933 18,342 47,237
Summer 132,013 32,013
128,140
Fall 223,680 26,845 91,616
,909,000 ,580,000 ,,145,000 , 1,376,000 1,736,000 \,956,000
1,535,000 ,,130,000 1,360,000
,700,000 1,640,000 i,120,000
Direci. 1.'licroscopic Count Bac\.cna per cc Gronps per cc
4,494,000 3,659,333 4,357,666 3,864,000
26,881,666 13,802,000
8,410,000 6,816,666 3,128,333 2,568,333
17,405,666 12,956,666
20,610,666 16,802,000 28,048,666 22,743,333 68,736,000 60,848,333
39,391,666 26,537,000 8,608,000 5,835,333
39,654,000 34,478,666
57