the dimensions of popularity in the stock market · the dimensions of popularity in the stock...
TRANSCRIPT

The Dimensions of Popularity in the Stock
Market
Roger G. IbbotsonProfessor in Practice Emeritus, Yale School of Management
Founder, Ibbotson Associates, a Morningstar Company
New York City
June 2015

Outline
• The Standard Risk Premium Paradigm• Higher Risk = Higher Return
• RPs in stock markets, bond markets, and across markets
• Are the Stock Market Premiums RPs?• A look at US, UK, and JP
• Or are the Premiums “Popularity” Premiums?• Popularity & Liquidity
• Explains Premiums & Mispricings
• Conclusions
2

Premiums in Asset Pricing
3
Excess Returns
Premiums Mispricing
persistent temporary
Risk
Tversky & Kahneman
1974
Grossman & Stiglitz 1980
Shiller 1984
de Bondt & Thaler 1985
Markowitz 1952
Sharpe 1964, Lintner 1965
Ross 1976
Fama & French 1993
Other?
Basu 1975, Banz 1981
Ibbotson, Diermeier, & Siegel
1984
Daniel & Titman 1997
Baker & Wurgler, 2006
Green, Hand & Zhang 2013

Higher Risk = Higher Return
• The Capital Market Line illustrates the payoff from the Equity Risk Premium and the U.S. Treasury Bill riskless rate.
4

Ibbotson® SBBI®
Stocks, Bonds, Bills, and Inflation 1926–2014
•Past performance is no guarantee of future results. Hypothetical value of $1 invested at the beginning of 1926. Assumes reinvestment of income and no transaction costs or taxes. This is for illustrative purposes only and not indicative of any investment. An investment cannot be made directly in an index. ©2015 Morningstar. All Rights Reserved.
5

Comparing the Periods
6
*Ibbotson SBBI Classic 2015 Yearbook: Market results for Stocks, Bonds, Bills, and Inflation, 1926-2014,
Morningstar, Inc.
U.S. 1926-2014* 1996-2014*
Large Company Stocks 10.1% 8.6%
LT Government Bonds 5.7 7.5
U.S. Treasury Bills 3.5 2.5
Inflation 2.9 2.3
Compound Annual (Geometric Mean) Returns
• We examine the period 1996-2014 in which we have
complete int’l data.
• Returns similar to period starting in 1926, with positive but
lower risk premiums.

Are Stock Market Premiums RPs?
7
• Across markets and within the bond market,
higher risk = higher return
• We examine the global stock market premiums
in US, UK, and Japan
• In theory, high beta, small stocks, and value stocks
have both higher returns and higher risk

Study Methodology
8
Selection PerformanceTSelection PerformanceT
19961995 1997 2014
Selection PerformanceT
2013
– Equally weighted quartile
portfolios at the end of the
selection year
– Report portfolio mean returns
(arithmetic & geometric), std. dev.
– All returns in local currenciesBroad US/UK/JP
universe
ranked by 21 metrics:
tra
de
Beta, Volatility (3)
Value (3)
Liquidity (2)
Size (4)
Momentum (2)
Fama-French Betas (3)
Single Beta Factors (4)
Source: Ibbotson & Kim, “Risk Premiums or Popularity Premiums?,” presentation given at 2015 Morningstar Institutional Conference.

Overall Performance
9
Maximum Universe Count 3,000 500 1,500
1996-2014Geom.
Mean
Arith.
Mean
Std.
Dev.
Geom.
Mean
Arith.
Mean
Std.
Dev.
Geom.
Mean
Arith.
Mean
Std.
Dev.
Equal-Weighted Universe 11.23% 13.27% 20.93% 8.34% 10.84% 22.52% 2.21% 5.53% 27.11%
Cap-Weighted Universe 9.08 10.77% 18.49 7.34 8.59% 17.42 1.07 4.07% 26.50
Local Risk-Free Rate 2.50 2.53 2.28 3.92 3.94 2.50 0.17 0.17 0.17
Display the capital market line with the equally weighted
index (arithmetic mean) and the risk free rate in local
currency

Risk & Return Within Markets1996 – 2014
10
84 portfolios
per country:
21 metrics
X 4 quartiles
Beta, Volatility
Value
Liquidity
Size
Momentum
Fama-French Betas
Single Beta Factors

Risk & Return Within Markets1996 – 2014
11
US UK JP
slope, CML 0.57 0.34 0.20
slope, OLS fit ‒0.14 ‒0.24 ‒0.00
t-stat [H0: CML] ‒24.0 ‒13.9 ‒8.1
Source: Ibbotson & Kim, “Risk Premiums or Popularity Premiums?,” presentation given at 2015 Morningstar Institutional Conference.
Capital Markets Line (CML)

Risk is an Incomplete Explanation of Returns
The univariate view of risk and return is a gross oversimplification.
• What’s missing here? – Should be a broad, universal concept
– Should affect pricing
– A behavioral finance perspective
• Our proposal: Popularity *– Popular: prices ↑, returns ↓
– Unpopular: prices ↓, returns ↑
12
Ris
k
Ris
k
Ris
k
*Ibbotson & Idzorek, “The Dimensions of Popularity”, Journal of Portfolio Management, 40th Anniversary Issue 2014

What is Popularity?
• Popularity is how much anything is liked or recognized • Not a new concept, similar to contrarian, sentiment, affect,
crowding, herding, admired/spurned, hot/cold, etc.
• More popular stocks have higher valuations relative to their fundamentals, but lower expected returns
• Popularity (or unpopularity) can be permanent (premiums) or temporary (mispricing)
13

Behavioral Finance
14
Systematic Behavioral
Biases
Stock
Popularity
Popularity
Premium
• Why do these payoffs exist / persist?
• Are they “risk” premiums or “popularity” premiums?
• Overconfidence
• Availability
• Herding / Group
Think
• Overly popular
• Less popular
• Low Beta /
Volatility
• Value
• Liquidity

Can Popularity Explain Return with Less Risk?
15
Risk
Popularity?
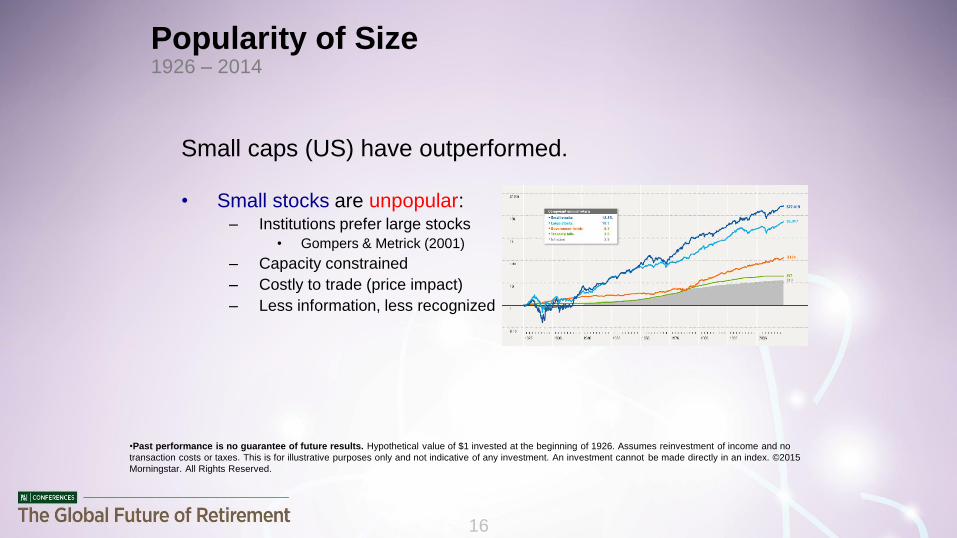
Popularity of Size1926 – 2014
Small caps (US) have outperformed.
• Small stocks are unpopular:– Institutions prefer large stocks
• Gompers & Metrick (2001)
– Capacity constrained
– Costly to trade (price impact)
– Less information, less recognized
16
•Past performance is no guarantee of future results. Hypothetical value of $1 invested at the beginning of 1926. Assumes reinvestment of income and no
transaction costs or taxes. This is for illustrative purposes only and not indicative of any investment. An investment cannot be made directly in an index. ©2015
Morningstar. All Rights Reserved.
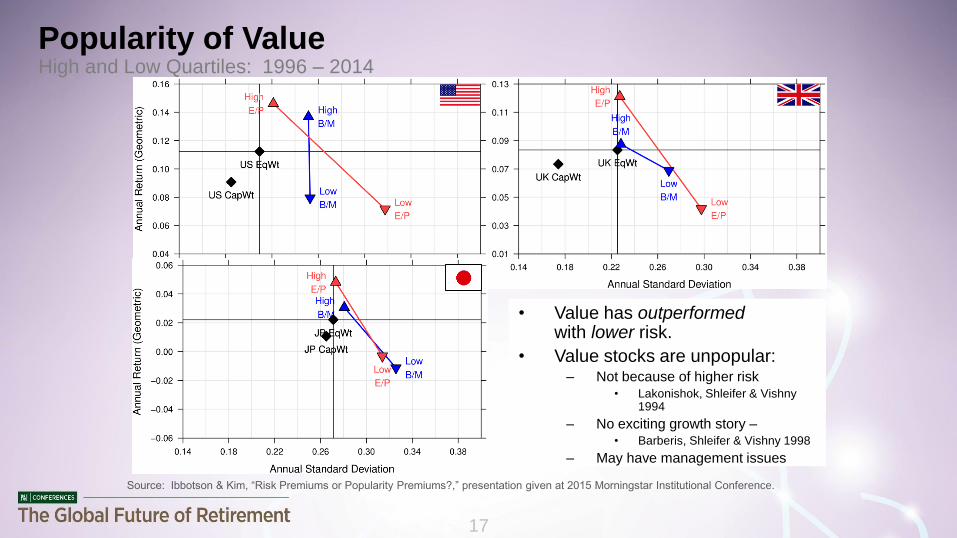
• Value has outperformed with lower risk.
• Value stocks are unpopular:– Not because of higher risk
• Lakonishok, Shleifer & Vishny1994
– No exciting growth story –• Barberis, Shleifer & Vishny 1998
– May have management issues
Popularity of ValueHigh and Low Quartiles: 1996 – 2014
17
Source: Ibbotson & Kim, “Risk Premiums or Popularity Premiums?,” presentation given at 2015 Morningstar Institutional Conference.

Popularity of Beta and Volatility All Quartiles: 1972 – 2014
High beta and volatility have underperformed.
• Leverage aversion – Identified high beta & vol as popular
– Volatility: Haugen & Baker, 1991
– Beta: Frazzini & Pedersen, 2011
• Future outlook– Low beta & vol have become popular
with institutions in recent years
– Beta is only an indirect measure of popularity
– Popularity can change over time
18
US
1972‒2014
PopularityLow High
b
Low 15.2% 14.2% 11.7% 3.4%
16.2% 14.8% 13.7% 10.2%
13.4% 14.4% 13.2% 9.8%
High 11.5% 11.7% 10.3% 6.2%
Source: Ibbotson & Kim, “Liquidity as an Investment Style: 2015 Update” [Ibbotson, Chen, Kim & Hu, FAJ 2013], available at research.zebracapital.com

0
1
2
3
4
Valuations and Popularity1972 – 2014, U.S.
Large changes in trading activity are associated with higher returns
19
1
Low
Popularity
2
3
4
High
Popularity
1
Low
Popularity
0.74% Migrate to Quartile 4
+110.80% Return
2.80% Migrate to
Quartile 3
+61.75% Return
18.26% Migrate to Quartile 2
+26.18% Return
78.20% Stay in Quartile 1
+10.66% Return
Q
4
Q
3
Q
2
Q
1
Source: Ibbotson & Kim, “Liquidity as an Investment Style: 2015 Update” [Ibbotson, Chen, Kim & Hu, FAJ 2013], available at research.zebracapital.com

Global Popularity Premiums2000 – 2014 (USD)
20
+3.97%
+7.39% +8.15% +7.84%+6.31%
+4.02%
+7.43%
+3.03%+3.89% +4.52%
-12%-11%
-9%
-7%
-9%
-3%
-6%
-8%
-3%
-7%
-15%
-10%
-5%
+0%
+5%
+10%
R1K R2K CAN FRA DEU GBR ITA CHE AUS JPN
Popularity Premium (T1-T3)
Source: Zebra Capital Research.
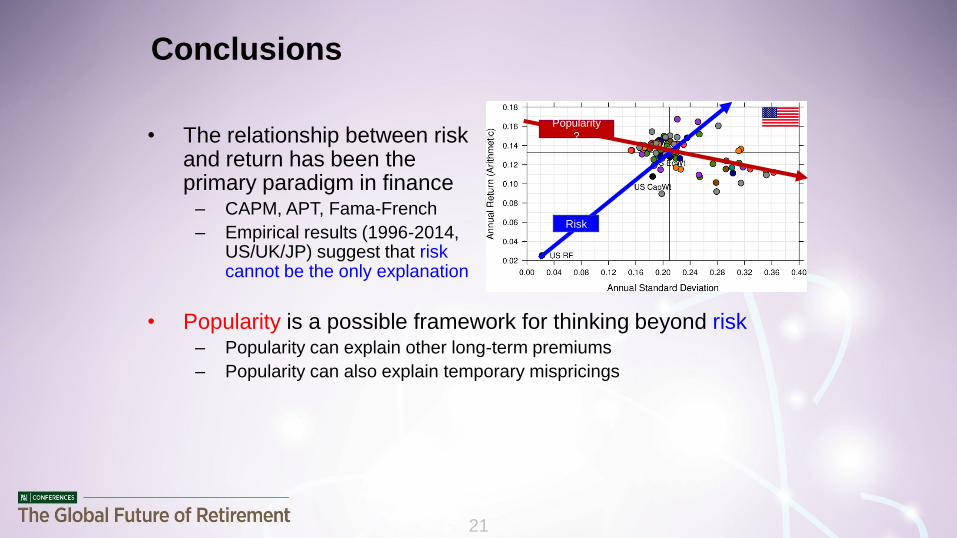
Conclusions
• The relationship between riskand return has been the primary paradigm in finance
– CAPM, APT, Fama-French
– Empirical results (1996-2014, US/UK/JP) suggest that risk cannot be the only explanation
• Popularity is a possible framework for thinking beyond risk– Popularity can explain other long-term premiums
– Popularity can also explain temporary mispricings
21
Risk
Popularity
?

Appendix
22

Popularity PremiumsU.S. Equity Mutual Funds, Feb. 1995 – Dec. 2009
Value / Growth
Value Blend Growth
Siz
e
Large
7.35%
+2.33%
6.86%
+1.65%
6.68%
+1.75%
Mid
9.73%
+3.25%
9.61%
+3.19%
8.38%
+3.18%
Small
9.91%
+2.77%
9.29%
+3.32%
7.77%
+3.00%
23
Source: Idzorek, Xiong and Ibbotson, 2012, “The Liquidity Style of Mutual Funds,” FAJ 41(3):401-439.
Morningstar
Style Box®
Style Box® Category
Compound
Annual
Return Popularity
PremiumDifference in returns
of mutual funds in the lowest quintile
of popularity of holdings vs. highest quintile

Popularity Regressions on Factors1972 – 2014, U.S.
24
Annualized Alpha
Market M-RF
Size SMB
ValueVMG
MomentumHML
R2
Long Unpopular, Short Popular
Factor4.44%* –0.45 –0.39 +0.58 +0.14 72.2%
Unpopular Long Portfolio(excess over risk-free
rate)
2.40%* +0.74 +0.56 +0.44 0.00 88.3%
Popularity can be expressed as a long/short or a long only factor.
Source: Ibbotson & Kim, “Liquidity as an Investment Style: 2015 Update” [Ibbotson, Chen, Kim & Hu, FAJ 2013], available at
research.zebracapital.com
*t-stats = 3.40 and 3.00 (both statistically significant at 5% level.)

• Low Beta and Volatility
had higher returns
Market Beta & Volatility1996 – 2014
25

• Small size premium
(small minus big) is
inconsistent across
markets and metrics.
Size1996 – 2014
26
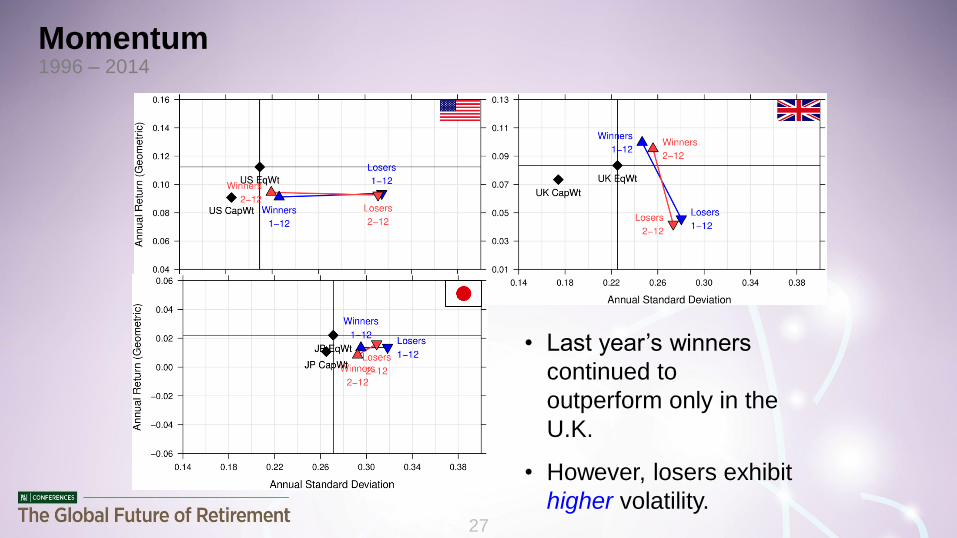
• Last year’s winners
continued to
outperform only in the
U.K.
• However, losers exhibit
higher volatility.
Momentum1996 – 2014
27

The Dimensions of Popularity in the Stock
Market
Roger G. IbbotsonProfessor in Practice Emeritus, Yale School of Management
Founder, Ibbotson Associates, a Morningstar Company
New York City
June 2015