the development of wind damage bands for buildingsdevika/evac/papers/building safety.pdf ·...
TRANSCRIPT

Journal of Wind Engineeringand Industrial Aerodynamics 84 (2000) 119}149
The development of wind damage bandsfor buildings
C.O. Unanwa!,*, J.R. McDonald", K.C. Mehta", D.A. Smith"
!Department of Civil and Mechanical Engineering Technology, South Carolina State University, Orangeburg,SC 29117, USA
"Department of Civil Engineering, Texas Tech University, Lubbock, TX 79409, USA
Received 30 June 1998; received in revised form 7 May 1999; accepted 9 June 1999
Abstract
The past decade in the United States was marked by a tremendous loss in propertiesattributed to wind damage, generating in the process, an enormous awareness to the twinproblems of wind damage mitigation and storm prediction. This paper proposes a newapproach to hurricane wind damage prediction using the concept of wind damage bands. Thedamage band prediction methodology employs an objective weighting technique driven bybuilding component cost factors, component fragilities, and location parameters to obtainupper and lower bounds to building damage thresholds. Damage bands are developed for1}3 story (low-rise) buildings as well as 4}10 story (mid-rise) buildings. The damage bandsreveal that the wind damage response of individual 1}3 story buildings is most easily distin-guished in the 43}60 m/s (sustained one-min mean) wind regime and that above 73 m/ssustained one-minute wind speed, 1}3 story buildings experience near-total destruction of theirsuperstructures, with the damage response of the most wind-resistant and least wind-resistantbuilding approaching each other. In contrast, the damage response of individual mid-risebuildings is most easily distinguished in the 60}81 m/s wind regime, and continues to dependlargely upon the components and connections. Wind damage bands form the basis for newmethods of wind damage prediction of individual buildings and groups of buildings, winddamage mitigation, and emergency management planning. ( 2000 Elsevier Science Ltd. Allrights reserved.
Keywords: Wind damage bands; Development; Damage prediction; Building damage
*Corresponding author.
0167-6105/00/$ - see front matter ( 2000 Elsevier Science Ltd. All rights reserved.PII: S 0 1 6 7 - 6 1 0 5 ( 9 9 ) 0 0 0 4 7 - 1

Nomenclature
ai1, a
i2wind speeds at which damage will commence and be total in theith damage mode
BSE building speci"c evaluation modi"erc minimum life in Weibull distributionCCF
icomponent cost factor
COM(U),COM(L)
upper and lower damage functions, respectively for 1}3 storycommercial buildings
D damage matrixDD(l ) damage degree (or percent damage) at hazard level lDPM damage probability matrixDR
#(l) building contents damage ratio
DRi
damage ratio for the ith damage modeDR#
icontent damage given damage of component i of the structure
DRk
damage ratio for content type kDR
4(l) building damage ratio
E eventED&W exterior doors and windowsED&W/EW exterior doors and windows damage given damage of exterior
wallED&W/RS exterior doors and windows damage given damage of roof
structureEW exterior wallEW/ED&W exterior wall damage given damage of exterior doors and win-
dowsEW/RS exterior wall damage given damage of roof structurefL(l), f
R(r) marginal probability density functions of ¸ and R, respectively
F-OR function `ORa (special user-de"ned OR gate)FR(li) cumulative distribution function of the resistance variable R
GAE general analytical evaluation modi"erGEE general empirical evaluation of a buildingHVE hurricane vulnerability evaluationIi
relative importance of the ith damage modeINST(U),INST(L)
upper and lower damage functions, respectively, for 1}3 storyinstitutional buildings
INT interiorJi
relative importance of the ith damage mode to the damage ratioof the contents
li
ith load e!ectL loss vector, mean damage ratio matrix, load variable, model
speci"cation matrixLN(*,*) lognormal distributionm
Rmedian of the resistance variable R
120 C.O. Unanwa et al. / J. Wind Eng. Ind. Aerodyn. 84 (2000) 119}149

n number of components, number of expertsN(*,*) normal distributionO
iith expert's estimate
P windstorm strike probability vector, hazard state probabilitymatrix
P(E1),P(E
2) individual probabilities of failure of events E
1and E
2, respec-
tivelyP(E
1E2) joint probability of failure of any two events E
1and E
2P&
conditional probability of failureP&i
component conditional probability of failure (or componentfragility)
PB&i
component basic fragilityPP&i
component conditional probability of failure due to propaga-tional e!ects
Pi
aggregated response of experts for the ith questionP(INT/C
i) probability of interior damage given that the ith component is
damagedP(interiordamage)
conditional probability of damage of the building interior
R resistance variable, expert's ratingRC roof coveringRC/RS roof covering damage given damage of roof structureRCF
irelative component cost factor
RES(U), RES(L) upper and lower damage functions, respectively, for 1}3 storyresidential buildings
RS roof structureRS/ED&W roof structure damage given damage of exterior doors and
windowsRS/EW roof structure damage given damage of exterior wallS unbiased estimator for standard deviationSh1, Sh2,Sh3, Sh4
fault tree diagrams denoted by sheet numbers 1, 2, 3 and 4,respectively
TEM terrain evaluation modi"erl wind speed< sustained 1-min surface wind speed=(H,H), =(H,H,H) 2- and 3-parameter Weibull distribution, respectivelyai
component location parameter (or component damage localiza-tion factor)
b scale parameter in Weibull distributionkR
mean of the resistance random variable Ro1,2
correlation coe$cient between failure of two components 1and 2
p-/(R)
logarithmic standard deviation of the resistance variable RpR
standard deviation of the resistance random variable RU( ) ) cumulative distribution function
C.O. Unanwa et al. / J. Wind Eng. Ind. Aerodyn. 84 (2000) 119}149 121

Subscripts
a shape parameter in Weibull distribution, level of signi"cancei,k indices for components, experts, variablesR in"nity
1. Introduction
The dramatic increase in the value of properties lost in hurricanes during the pastdecade has resulted in an increased awareness of the enormity of the hurricane winddamage problem, earning it the unenviable position of number one catastrophe interms of dollar loss in the United States. Unfortunately, the important issues of winddamage prediction and mitigation have not kept pace with this level of recognition ofthe wind hazard. Wind damage prediction is an issue because all existing structuresare not windstorm-resistant. When this fact is combined with recent climatic changesfavorable to major hurricane occurrences on the US east coast [1], and the fact thatmost structures located in the hurricane-prone coastal areas are insured against winddamage, the need for an adequate tool for predicting and mitigating wind damagebecomes all the more compelling.
In general, two types of damage prediction methods may be distinguished,namely, qualitative and quantitative methods. Qualitative damage predictionsdescribe the likely damage levels associated with di!erent building categoriesand/or hurricane wind intensities. Typical examples of qualitative damage predictionsare: (1) the classi"cation of buildings as either fully engineered, pre-engineered,marginally engineered, or non-engineered, with their associated wind damageperformances [2], and (2) the Sa$r/Simpson damage potential scale [3,4]. Quali-tative approaches to wind damage prediction serve general purposes only and donot predict damage to speci"c buildings. Quantitative approaches which considerstructure characteristics are essential for the reliable prediction of damage tobuildings.
A review of the technical literature on quantitative wind damage prediction indi-cates a great deal of reliance on expert input. This is largely attributable to the lack oftest data on the behavior of materials under extreme wind loading and the heuristicnature of the wind damage phenomenon. A method for regional estimation of tornadodamage for general structural types was proposed by Hart [5]. Using expert-supplieddamage matrices, Ref. [5] presented wind speed/damage relationships for 1}3 storywood-framed and masonry/concrete wall residential structures, 1}3 story metal indus-trial structures, structures greater than 4 stories, mobile homes, and windows. Hart[5] evaluated the expected annual dollar loss for each damage state under 1970conditions, according to the equation
Total wind damage"MLNT[D] MPN. (1)
122 C.O. Unanwa et al. / J. Wind Eng. Ind. Aerodyn. 84 (2000) 119}149

In the above equation, MLN is a loss vector, [D] the damage matrix, and MPN thewindstorm strike probability vector. Although not suitable for damage prediction ofspeci"c buildings, this pioneering work holds promise for evaluating the expectedannual loss of buildings within a speci"ed geographic region.
Building wind vulnerability relationships have also been obtained by analyzingweather data and insurance claim "les [6,7]. Ref. [7] analyzed approximately 250claim "les of one insurer and plotted overall loss ratio and direct damage ratio forgroups of reinforced masonry-wall single family dwellings against gradient windspeeds obtained from airforce reconnaissance aircraft measurements [8] shortlybefore the landfall of Hurricane Andrew. The overall loss ratio was de"ned as thetotal claim paid (including the amount paid for additional living expenses and debrisremoval) divided by the insured value of the structure and its contents, while thedirect wind damage was considered to be the cost of repairs to the roof, doors,windows, walls, and the external facilities. Ref. [7] concluded that a very suddenincrease in the overall loss ratio occurs when the gradient wind speed exceeds 70 m/sdue to the breakage of windows and damage to roofs. While the sole use of suchwind speed/damage relationships derived from past damage data and traditionalactuarial procedures may not provide a consistent measure of present or future risk[6], they reveal information useful in validating wind speed}damage predictionmodels.
In a pioneering work to simulate building contents damage in hurricanes, Stubbsand Boissonnade [9] proposed a model using roo"ng failure and openings as thehazards which a!ect content damage, and the damage probability concept. Thedamage ratio for content type k, DR
k, was given as
DRk"L[DPM]P, (2)
where L is a 1]6 matrix containing the mean damage ratios, DPM a 6]6 damageprobability matrix, and P a 6]1 matrix containing the probability that the buildingenvelope is in one of six "nal hazard states. However, a more comprehensive meth-odology was subsequently proposed by Stubbs et al. [10], in which the buildingcontents damage ratio, DR
#(l), was given by
DR#(l)"
+ JiDR#
iDR
i+ J
i
. (3)
In Eq. (3), Jiis the relative importance of the ith damage mode to the damage ratio
of the contents, DR#i
the content damage given the damage of component i of thestructure, and DR
ithe damage ratio for the ith damage mode (see Eq. (5)). Also
proposed in Ref. [10] is a model for building damage ratio, DR4(l), in terms of
expert-supplied wind speed/building damage mode parameters according to thefollowing equation:
DR4(l)"
+9i/1
IiDR
i(l)
+9i/1
Ii
(4)
C.O. Unanwa et al. / J. Wind Eng. Ind. Aerodyn. 84 (2000) 119}149 123

where Iiis the relative importance of the ith damage mode to the damage ratio of the
entire structure, subscript 9 the number of components, and
DRi(l)"G
0, l)ai1
l!ai1
ai2!a
i1
, ai1(l)a
i2,
1, l'ai2,
(5)
is the damage ratio for the ith damage mode, l the wind speed, and ai1
and ai2
arerespectively, the windspeeds at which damage will commence and be total in the ithdamage mode. The usefulness of this procedure for damage evaluation of broadbuilding classes is heavily dependent upon the availability of reliable values of theconstants a
i1and a
i2.
A hurricane vulnerability model for single-family dwellings was proposed by Chiu[11], in which expert-supplied damage probability matrices were employed as thegeneral empirical evaluation of a building (GEE). The GEE was then modi"ed bya general analytical evaluation (GAE), a terrain evaluation (TEM), and a building-speci"c evaluation (BSE), to obtain the hurricane vulnerability evaluation (HVE), asfollows:
HVE"TEM (GEE!GAE#BSE). (6)
The model [11] may be applied to predict damage to a speci"c single-family home. Itis, however, considered coarse, as the general analytical evaluation does not adequate-ly account for the major failure modes of a building, including damage due towindborne debris.
In the present work, we propose a new concept that utilizes building damage bandsfor addressing the wind damage prediction problem. This paper presents the results ofa recently concluded study at Texas Tech University's Wind Engineering ResearchCenter. The emphasis in this paper is on the procedure for developing wind damagebands for buildings. A building wind damage band de"nes the upper and lowerthresholds of damage degree}wind speed relationships for buildings in an occupancyclass or for particular types of buildings within an occupancy class. In addition totheir use in determining general characteristics of building failure in extreme winds,building wind damage bands may be employed with speci"c building wind perfor-mance information to predict damage to individual buildings or groups of buildings,and for wind damage mitigation.
2. Proposed model
The proposed model for determining the degree of damage to any given building orgroup of buildings is based upon the `damage banda for the building type(s) orclass(es) of interest. We de"ne a wind damage band as the damage degree rangebounded by a lower and upper damage threshold for given intensities of the windhazard. The upper and lower damage thresholds are determined, respectively, for the
124 C.O. Unanwa et al. / J. Wind Eng. Ind. Aerodyn. 84 (2000) 119}149

set of building components and connection characteristics that are associated with thehighest and lowest probabilities of failure in a windstorm, using the following equation:
DD(l)"n+i/1
P&i(CCF
i)a
i(7)
In the above equation, DD(l) is the damage degree (or percent damage) at hazard levell, P
&ithe component conditional probability of failure (or component fragility), CCF
ithe component cost factor, a
ithe component location parameter (or component
damage localization factor), and n the number of components used in the buildingdamage model. The terms in Eq. (7) are explained in the sections that follow. Implicitin Eq. (7) is that a building su!ers some degree of damage if there exists a probabilityof failure of at least one of its components. In this case, damage to a buildingcomponent could result from damage to the connection of that component to othercomponents, or from damage in the domain of the component. Based on the relativelikelihood of damage and cost contribution of a building component, the presentmodel considers a building as composed of the following components: roof covering,roof structure, exterior doors and windows, exterior wall (includes "nishes, electricaland mechanical components supported, cladding and support systems), interior(including contents), structural system (includes columns, girders, elevated #oors, andconveying equipment), and foundation.
An overall picture of the damage process used in the model is shown in theschematic diagram of Fig. 1. Fig. 1 shows that each building component may su!er
Fig. 1. Wind damage process.
C.O. Unanwa et al. / J. Wind Eng. Ind. Aerodyn. 84 (2000) 119}149 125

damage either through the direct impact of the wind or as a result of damage of othercomponents (i.e., damage propagation). Each building component (except the struc-tural system and interior) in the damage model is connected with three lines. The "rstline indicates its contribution to the propagational damage of other components,while the second and third lines show the component's direct (basic) damage andpropagational damage, respectively. Since the basic and propagational damage ofa building component in a windstorm are not necessarily mutually exclusive, the "nalcomponent damage response to varying levels of the wind hazard, in terms ofprobability of failure, P
&i(l ), is obtained by combining the two e!ects as follows:
P&i(l )"PB
&i#PP
&i!PB
&iPP&i
(8)
where PB&i
is the component basic fragility, i.e., component conditional probability offailure due to wind pressures and windborne missiles, and PP
&ithe component condi-
tional probability of failure due to propagational e!ects.
3. Component fragilities
The building component fragilities are obtained by analyzing a multiple fault treescheme in which the damage of the components serve as the top events. The fault treediagrams for the explicitly modeled building component damage modes are shown inFigs. 2}10. Component basic fragilities are given by the probabilities of the intermediateevents labeled B1}B4 in the fault trees while component propagational failures areindicated by the intermediate events whose labels begin with the letter P. For practicalreasons, the failure modes modeled in the fault trees are those that are predominant inhurricanes and can also contribute signi"cantly to overall building damage. We assumethat building foundations are not subject to damage. Although the structural systems ofbuildings should be considered in determining individual building damage resistivities,their damage probabilities are orders of magnitude less than those of roof covering, roofstructure, exterior doors and windows, and exterior wall, and are therefore not explicitlymodeled in the fault trees. However, conservative allowances have been made indeveloping the damage bands to account for their damage susceptibilities in low-risebuildings. For purposes of clarity, we have used repeated events in the fault trees. Theseare, however, removed during the fault tree analysis using Boolean algebra relations [12].
The probability of failure of the basic events (i.e., lowest level events represented bycircles in the fault trees) are obtained by considering the wind pressure and thestrength of components and connections as the load (¸) and resistance (R) variables,respectively, using the stress}strength interference method [13]. From the classicaltime-invariant probability of failure expression for random-"xed stress and random-"xed strength (Eq. (9)), the conditional probability of failure for deterministic loadsand random-"xed strength variables is given by Eq. (10):
P&"P
=
~=
fL(l )[P
l
~=
fR(r) dr] dl (9)
Pf
(li)"P(R)l
i)"P
li
~=
fR(r) dr"F
R(li) (10)
126 C.O. Unanwa et al. / J. Wind Eng. Ind. Aerodyn. 84 (2000) 119}149

Fig. 2. Fault tree for roof covering damage.
In (9) and (10), fR(r) and f
L(l) are the marginal probability density functions of R and
¸ respectively, and FR(li) is the cumulative distribution function of the resistance
variable R. The basic event probabilities labeled E2}E
9in the fault trees were obtained
by means of Eq. (10). Although it is recognized that wind loading is a random variablewhose magnitude may increase or decrease with time, current analysis and designmethods for wind e!ects on structures (for example, Ref. [14]) generally envelope themost critical load conditions. The load e!ect, l, taken as deterministic, corresponds tohurricane wind design pressures obtained using the procedure of Ref. [14] for windloading. The probability of failure of basic events which are conditional in nature areobtained through expert experience or information, as discussed subsequently in thepaper.
In addition to damage propagational e!ects, an important wind damage phenom-enon that should be considered in modeling wind damage is common-cause orcommon mode e!ects [12,15,16]. The hurricane wind a!ects the building envel-ope components at the same time and is a typical common-cause event. This in-troduces another level of complexity in the fault tree analysis since we can nolonger make the simplifying assumption that all events are independent of eachother. Noting that component failure events are generally positively correlated[17], we estimated the dependence between any two events by means of the
C.O. Unanwa et al. / J. Wind Eng. Ind. Aerodyn. 84 (2000) 119}149 127

Fig. 3. Fault tree for roof structure damage.
traditional correlation coe$cient [18] using the method proposed by Reed et al. [19],in the following form:
P(E1E2)"P(E
1)P(E
2)#o
1,2(JP(E
1)P(E
2)[1!P(E
1)][1!P(E
2)]). (11)
In Eq. (11), P(E1E2) denotes the joint probability of failure of any two events E
1and E
2, P(E
1) and P(E
2) are the individual probabilities of failure of events E
1and
E2, respectively, and o
1,2is the correlation coe$cient between P(E
1) and
P(E2).
128 C.O. Unanwa et al. / J. Wind Eng. Ind. Aerodyn. 84 (2000) 119}149

Fig. 4. Fault tree for exterior doors and windows damage.
3.1. Building interior probability of failure
The conditional probability of damage of the building interior, given componentdamage, P(interior damage), is obtained via a quasi-fault tree analysis (see Fig. 6). Thespecial symbol used in the fault tree (F-OR) represents a user-de"ned function, whichin the present case is given by
P(interior damage)"n+i/1
[P(INT/Ci)]RCF
i, (12)
where P(INT/Ci) is the probability of interior damage given that the ith component is
damaged, n the number of components used in the interior damage model, and RCFi
C.O. Unanwa et al. / J. Wind Eng. Ind. Aerodyn. 84 (2000) 119}149 129

Fig. 5. Fault tree for exterior wall damage.
the relative component cost factor, given by
RCFi"
CCFi
+ni/1
CCFi
, (13)
in which CCFiis the component cost factor.
3.2. Distribution functions and parameters for component resistance
Crucial steps in the damage band technique are the selection of the set of buildingcomponents and connection characteristics that furnish upper and lower wind dam-age probabilities, and the choice of appropriate distribution functions of the failuremode resistances and of their distribution parameters. The building characteristics
130 C.O. Unanwa et al. / J. Wind Eng. Ind. Aerodyn. 84 (2000) 119}149

Fig. 6. Fault tree for interior damage.
Fig. 7. Fault tree for interior damage due to roof covering damage (Sh. 1).
C.O. Unanwa et al. / J. Wind Eng. Ind. Aerodyn. 84 (2000) 119}149 131

Fig. 8. Fault tree for interior damage due to roof structure damage (Sh. 2).
used for upper and lower bound fragilities are shown in Table 1. We hasten to addthat the combination of building components and connection characteristics may notnecessarily re#ect that of any particular building. The component and connectioncharacteristics were chosen on the basis of individual components and failure modesonly, with prime concern placed upon wind damage performance, building techno-logy, design codes, and material data.
As seen in Eq. (10), evaluation of the basic event conditional probabilities of failureof the fault trees requires use of the marginal probability density function of the
132 C.O. Unanwa et al. / J. Wind Eng. Ind. Aerodyn. 84 (2000) 119}149

Fig. 9. Fault tree for interior damage due to exterior doors and windows damage (Sh. 3).
C.O. Unanwa et al. / J. Wind Eng. Ind. Aerodyn. 84 (2000) 119}149 133

Fig. 10. Fault tree for interior damage due to exterior wall damage (Sh. 4).
134 C.O. Unanwa et al. / J. Wind Eng. Ind. Aerodyn. 84 (2000) 119}149

Table 1Building characteristics for upper and lower bound fragilities
Component Failure modemodeled by
Properties for upperbound fragility
Properties for lowerbound fragility
Roof covering(RC)
Blow-o! at theattachments
Asphalt shingles stapled@ 12 in (300 mm) o.c.
Flat concrete tiles fastenedwith 6d common nails@ 6 in (150 mm) o.c.
Roof structure(RS)
Roof sheathing failureby fastener pull-out
OSB, 15/32 in (12 mm)thick, fastened with 6dcommon nails @ 12in (300 mm) o.c., 24in (600 mm) inter-mediate supports
Plywood, 19/32 (15 mm) inthick 5-ply, fastened with10d common nails @ 6 in(150 mm) o.c.
Uplift at roof-to-wallconnection
Wood rafters @ 2 ft(0.6 m) o.c. toe-nailedto wall plate with 3 no.16d box nails
Roof frame fastened to wallwith no. H7 Simpson StrongTie connector [20]
Exterior doorsand windows(ED and W)
Breakage by windbornemissiles
Annealed glass, 3/16in (5 mm) thick.
Highly tempered glass, 3/4in (19 mm) thick
Interior surface failureby pressure
Weathered annealedglass
New fully tempered glass
Exterior wall(EW)
Lateral pressure failure Wood stud wall, studs@ 16 in (400 mm) o.c.
Precast concrete wall
Wall-to-foundationuplift
Connection using3/8 in (10 mm) bolts@ 8 ft (2.4 m) o.c.
Connection using pilingstrap HST3 [20]
Interior (INT) Failure of RC, RS,ED&W, EW
As per properties forRC, RS, ED&W, EW
As per properties for RC,RS, ED&W, EW
resistance variable, fR(r). The distribution types and distribution parameters corre-
sponding to the component failure modes of Table 1 are shown in Tables 2 and 3 . Inthe cumulative distribution functions U( ) ) of Table 2, l
irepresents the load e!ect,
kR
and pR
are, respectively, the mean and standard deviation of the resistance randomvariable R, a is the shape parameter (or Weibull slope), b the scale parameter, andc the minimum life.
In general, the form of the component failure mode resistance, fR(r), depends on the
availability and form of the test data. For component failure modes where test dataare available and the data are "tted to some distribution, that distribution type isadopted. If the available failure data were not "tted to a distribution, these wereanalyzed and "tted to an appropriate distribution. In cases where test data areavailable only in the form of means and variances, or where mean strengths ofconnections have been determined by analytical calculations, the lognormal modelwas adopted. Although the normal distribution is more analytically tractable and haswell-known properties, it has some disadvantages as a model for material behavioral
C.O. Unanwa et al. / J. Wind Eng. Ind. Aerodyn. 84 (2000) 119}149 135

Table 2Probability density functions of component resistance
Component resistance Probability distributionof component resistance
FR(li)"U( ) )
Roof covering uplift resistance Lognormal UCln(l
i)!ln(m
R)
p-/(R)
DRoof sheathing Fastener pull-out resistance Normal UC
li!k
RpRD
Uplift resistance of roof-to-wall connection Lognormal UCln(l
i)!ln(m
R)
p-/(R)
DMissile impact resistance of exterior doorsand windows
Lognormal UCln(l
i)!ln(m
R)
p-/(R)
DLateral pressure resistance of glass cladding 2-parameter Weibull 1!expC!A
libB
aD
Lateral pressure resistance of exterior wall 3-parameter Weibull 1!expC!Ali!c
b BaD
Wall-to-foundation uplift resistance Lognormal UCln(l
i)!ln(m
R)
p-/(R)
D
properties [18,43,44]. The choice of the lognormal model for the resistance casesdescribed above was based on its widespread use in engineering practice [15,18,45,46]and its ability to dovetail some of the disadvantages of the normal distribution, whileat the same time, possessing most of its good properties.
3.3. Conditional event and other probabilities
The probabilities of basic events of the fault trees which are conditional in natureand which are not obvious from wind damage experience are obtained through expertinformation and experience of wind and structural engineers using a Delphi approach[47]. The method involved the following steps: (1) A preliminary meeting with eachexpert to explain the questionnaire, i.e., the conditional probability data, and solicitresponses. (2) Aggregation of the initial responses of the experts using the weightedarithmetic mean method:
Pi"
n+i/1
OiR
iNn+i/1
Ri, (14)
where Piis the aggregated responses of the experts, R
ithe rating of the ith expert,
Oithe ith expert's estimate, and n the number of expert's. The ratings for aggregating
136 C.O. Unanwa et al. / J. Wind Eng. Ind. Aerodyn. 84 (2000) 119}149

Table 3Distribution parameters for component resistance
Component resistance Distribution parameters References
Upper Lower
Roof covering upliftresistance
LN(60, 0.20)! (psf ) LN(237, 0.20)! [21}26](28.7,0.10) (kPa) (113.5,0.10)
Roof sheathing fastenerpull-out resistance
N(82, 122)" (psf ) N(254, 542)" [24,27}32](39.3,5.72) (kPa) (121.6,25. 92)
Uplift resistance ofroof-to-wall connection
LN(950, 0.17) (plf ) LN(2985, 0.17) [20,21,24](13.87,0.002) (kN/m) (43.6,0.00 2)
Missile impact resistanceof exterior doors andwindows
LN(37.52, 0.156)# (mph) LN(802,0.156)# [33}36](16.82,0.07) (m/s) (35.82,0.07 )
Lateral pressure resistanceof glass cladding
=(1.98, 182 psf )$,% =(2.89, 716 psf )$,% [36}39]=(a, b)=(1.98, 8.72 kPa) =(2.89, 34.3 kPa)
Lateral pressure resistanceof exterior wall
=(34.1 psf, 3.28, 38.8 psf ) Based on (U)& [40}42]=(c, a, b)=(1.63 kpa, 3.28, 1.86 kPa) ''
Wall-to-foundation upliftresistance
LN(2628, 0.20) (plf ) LN(5126, 0.20) [20,24,31,32](38.4,0.003) (kN/m) (74.8,0.003)
!Lognormal distribution."Normal distribution.#Parameters based on missile impact velocities and modi"ed for the 2]4 in timber missile.$Weibull distribution.%Obtained by "tting data to test results on weathered and new glass samples for upper and lower bound
fragilities, respectively. Glass type factor of 4 was used for fully tempered glass.&Lower bound fragility obtained by modifying upper bound parameters to account for increased strength
due to high modulus of elasticity of concrete used in establishing the lower fragility curve.
the initial responses were based on the number of years of wind damage experienceand damage documentation conducted by each expert. (3) Review by each expert ofthe aggregated initial responses, and indication of a self-rating. (4) Aggregation of newresponses of the experts using Eq. (14) and the experts' self-ratings.
The "nal aggregated responses are shown in Table 4. Each conditional probabilityvalue in Table 4 represents the probability of failure of a building component, giventhat another component fails. In addition to use of self-ratings in aggregating theexpert responses, the data gathering procedure ensured that the expert responses wereindependent of each other at each response stage. This two-stage Delphi method isconsidered most feasible in a time and "nancial constraints situation. Since buildingdamage degree is obtained as a function of the components' damage amounts (see Eq.(7)), it is important to note that the failure probabilities in Table 4 must be tempered toaccount for the location, distribution, and spread of components' damage in wind-storms (i.e., damage localization of components). This is e!ected by use of component
C.O. Unanwa et al. / J. Wind Eng. Ind. Aerodyn. 84 (2000) 119}149 137
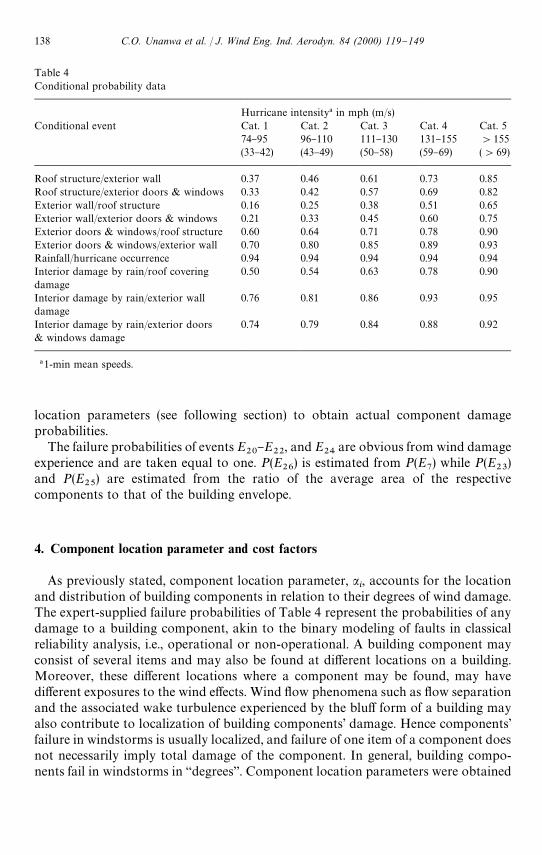
Table 4Conditional probability data
Hurricane intensity! in mph (m/s)Conditional event Cat. 1 Cat. 2 Cat. 3 Cat. 4 Cat. 5
74}95 96}110 111}130 131}155 '155(33}42) (43}49) (50}58) (59}69) ('69)
Roof structure/exterior wall 0.37 0.46 0.61 0.73 0.85Roof structure/exterior doors & windows 0.33 0.42 0.57 0.69 0.82Exterior wall/roof structure 0.16 0.25 0.38 0.51 0.65Exterior wall/exterior doors & windows 0.21 0.33 0.45 0.60 0.75Exterior doors & windows/roof structure 0.60 0.64 0.71 0.78 0.90Exterior doors & windows/exterior wall 0.70 0.80 0.85 0.89 0.93Rainfall/hurricane occurrence 0.94 0.94 0.94 0.94 0.94Interior damage by rain/roof coveringdamage
0.50 0.54 0.63 0.78 0.90
Interior damage by rain/exterior walldamage
0.76 0.81 0.86 0.93 0.95
Interior damage by rain/exterior doors& windows damage
0.74 0.79 0.84 0.88 0.92
!1-min mean speeds.
location parameters (see following section) to obtain actual component damageprobabilities.
The failure probabilities of events E20}E
22, and E
24are obvious from wind damage
experience and are taken equal to one. P(E26
) is estimated from P(E7) while P(E
23)
and P(E25
) are estimated from the ratio of the average area of the respectivecomponents to that of the building envelope.
4. Component location parameter and cost factors
As previously stated, component location parameter, ai, accounts for the location
and distribution of building components in relation to their degrees of wind damage.The expert-supplied failure probabilities of Table 4 represent the probabilities of anydamage to a building component, akin to the binary modeling of faults in classicalreliability analysis, i.e., operational or non-operational. A building component mayconsist of several items and may also be found at di!erent locations on a building.Moreover, these di!erent locations where a component may be found, may havedi!erent exposures to the wind e!ects. Wind #ow phenomena such as #ow separationand the associated wake turbulence experienced by the blu! form of a building mayalso contribute to localization of building components' damage. Hence components'failure in windstorms is usually localized, and failure of one item of a component doesnot necessarily imply total damage of the component. In general, building compo-nents fail in windstorms in `degreesa. Component location parameters were obtained
138 C.O. Unanwa et al. / J. Wind Eng. Ind. Aerodyn. 84 (2000) 119}149

via expert experience using the Delphi procedure previously described. The compon-ent location parameters, as a function of the sustained 1-min wind speeds, <, are
Roof covering: a"2.264612!0.067645<#0.000666<2!1.841]10~6<3
(15a)
Roof structure: a"0.046451!0.00668<#0.000129<2!3.94]10~7<3,
(15b)
Ext. doors & windows: a"0.592731!0.029062<
#0.000366<2!1.104]10~6<3, (15c)
Exterior wall: a"!0.174995!0.005124<#0.000134<2!4.44]10~7<3,
(15d)
Building interior:a" 1.394525!0.044214<#0.000454<2!1.247]10~6<3.
(15e)
Component cost factors, de"ned as the ratio of replacement value of a componentto the replacement value of the building, objectively relate individual componentdamage degrees to the damage degree of the entire building. The component costfactors used in developing the damage bands in this work were evaluated on the basisof the model buildings in Ref. [48}50]. The cost of contents for each building wasestimated as a percentage of the building's replacement value, following the generalguidelines in Ref. [51]. The average values of the cost factors, using six, thirteen, eight,and four types of model residential, commercial/industrial, government/institutional,and 4}10 story buildings, respectively, are shown in Table 5. The relative componentcost factors, RCF
i(see Eq.(13)) used in the interior damage probability evaluation
were based on the average values of the cost factors given in Table 5. The resultingvalues of RCF
iare shown in Table 6.
Table 5Average building component cost factors
Component 1}3 storyresidential
1}3 story commercial/industrial
1}3 story govt./institutional
4}10 storymid-rise
Structural System 5.4 2.9 3.8 13.1Roof covering 1.4 1.8 1.5 0.4Roof structure 2.7 4.1 3.3 3.0Exterior wall 9.7 8.6 9.6 9.6Exterior doors & windows 3.8 2.6 1.9 1.5Building interior 71.9 75.6 76.5 71.0
C.O. Unanwa et al. / J. Wind Eng. Ind. Aerodyn. 84 (2000) 119}149 139

Table 6Relative component cost factors
Component Cost factor Relative cost factor
Roof covering 1.5 0.09Roof structure 3.5 0.21Exterior doors and windows 2.5 0.15Exterior wall 9.2 0.55Total 16.7 1.00
5. Damage bands
The fault trees were evaluated using Eqs. (8)}(14) and the data of Tables 1}4, toobtain component failure probabilities. In conjunction with the component cost dataof Tables 5 and 6, and the component location parameter equations 15, upper andlower building damage degrees were obtained using Eq. (7). Evaluation of the faulttrees and subsequent calculation of the damage degrees was found to be moste$ciently implemented on several spread sheet "les that were linked to one another.In applying (7), we have conservatively allowed for structural system damage prob-abilities in low-rise buildings equal to the corresponding damage probabilities of theexterior walls. Also, in view of the use of shear walls, and better design attention inmid-rise building contruction, additional considerations were made in establishing thedamage bands for mid-rise buildings. These are the use of reinforced concrete and steelroof structures for the lower and upper bound fragilities, respectively, and exteriorwalls that are two times less likely to be damaged than those of low-rise buildings.Within the context of the damage band concept, these assumptions are consideredconservative and reasonable.
The resulting upper and lower damage functions de"ning the damage bands weresubsequently "tted to polynomial regression models and 95% con"dence bounds onthe predicted damage degrees found using the test statistic [52]:
DD/l$ta@2SJl{0(¸@¸)~1l
0. (16)
In Eq. (16), ta@2 is the appropriate point on the ¹n~k~1
distribution, and
SJl{0(¸@¸)~1l
0is the standard error of prediction. The resulting damage bands are
shown in Figs. 11}14, respectively, for 1}3 story residential, commercial/industrial,government/institutional buildings, and 4}10 story mid-rise buildings, in terms of theequivalent sustained 1-min hurricane wind speeds.
To obtain an indication of the robustness and validity of the present work, thedamage bands were subsequently compared to the vulnerability relationships forsingle family dwellings presented in Sparks and Bhinderwala [7] for hurricane winds,and also to the mean percent}wind speed relationships presented in Hart [5] forwood, concrete or masonry, and steel buildings impacted by tornadoes. For consist-ency, the gradient wind speeds used in Ref. [7] have been converted to the equivalent
140 C.O. Unanwa et al. / J. Wind Eng. Ind. Aerodyn. 84 (2000) 119}149

Fig. 11. Wind damage band for 1}3 story residential buildings. T Upper, j lower.
Fig. 12. Wind damage band for 1}3 story commercial/industrial buildings. T Upper, j lower.
C.O. Unanwa et al. / J. Wind Eng. Ind. Aerodyn. 84 (2000) 119}149 141

Fig. 13. Wind damage band for 1}3 story institutional buildings. T Upper, j lower.
Fig. 14. Wind damage band for 4}10 story mid-rise buildings. T Upper, j lower.
142 C.O. Unanwa et al. / J. Wind Eng. Ind. Aerodyn. 84 (2000) 119}149

Fig. 15. Comparison of damage predictions for residential buildings. T Author (upper), j author (lower),m Hart (wood), d Hart (concrete), Sparks (overall loss), 3 Sparks (direct damage).
sustained 1-min surface winds using a conservative factor of 0.70 [8,53]. The result ofthe comparison is shown in Fig. 15.
The wind damage resistance of the building types in Ref. [5] may be considered asspanning the spectrum of building wind damage resistivity, and hence can be com-pared to the damage bands reported herein. To undertake this comparison, it wasnecessary to convert the tornado wind speeds to the equivalent 1-minute hurricanespeeds. Since the appearance of damage to structures in windstorms of the sameintensity is the same, regardless of the type of storm [54,55], application of the damagematrices in Ref. [5] to tornado damage, does not in practice, detract from the use ofthe same for other extreme windstorms such as hurricanes. Conversion of the tornadowindspeeds to the equivalent hurricane 1-min winds was made by "rst converting thetornado speeds to the corresponding peak gust speeds using the procedure outlined inFujita [56], and then converting the resulting hurricane peak gust speeds to 1-minspeeds using the gust factor/averaging time relationship for hurricane winds [57]. Theupper and lower damage functions from the present work, indicated as Author, andthe mean damage curves in Ref. [5] are presented in the same graphs (see Figs. 15}17)for comparison.
In general, it is seen that for the wind speed range of interest in this work, the meandamage curves in Ref. [5] and the vulnerability curves of Ref. [7] furnish damagepercentages smaller than the upper bound values from the present research, i.e., theupper damage functions of the present work furnish upper threshold damage percent-ages. Above a wind speed of about 53 m/s, the overall loss ratios in Ref. [7] appear to
C.O. Unanwa et al. / J. Wind Eng. Ind. Aerodyn. 84 (2000) 119}149 143
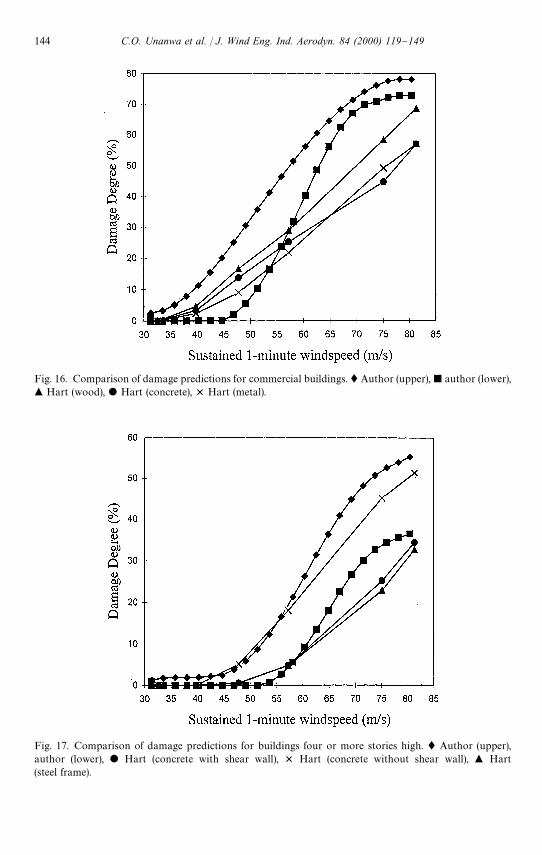
Fig. 16. Comparison of damage predictions for commercial buildings. T Author (upper), j author (lower),m Hart (wood), d Hart (concrete), 3 Hart (metal).
Fig. 17. Comparison of damage predictions for buildings four or more stories high. T Author (upper),author (lower), d Hart (concrete with shear wall), 3 Hart (concrete without shear wall), m Hart(steel frame).
144 C.O. Unanwa et al. / J. Wind Eng. Ind. Aerodyn. 84 (2000) 119}149

be greater than the damage percentages furnished by the upper damage functiondeveloped herein. This is because the overall loss ratio in [7] included such items aspayments for additional living expenses and debris removal, which are not included inthe calculation of probable maximum loss. Also, because the direct damage ratio inRef. [7] did not include loss to contents, the lower damage function presented hereinpredicts higher damage percentages than the direct damage curve in Ref. [7] for windspeeds between 50 and 56 m/s.
In the lower windspeed regimes (i.e., up to category 3 hurricane intensity), the lowerdamage functions developed herein furnish lower threshold damage percentages thanthose in Ref. [5], but beyond this wind regime, the mean damage percentages in Ref.[5] become lower than the predictions of the current study. In the higher windregimes, the slopes of the damage curves for concrete and steel in Ref. [5] eitherdecrease or do not increase rapidly as would be expected by virtue of wind damagebeing indirectly proportional to the second power of the wind speed. This fact,coupled with the wholly subjective nature of the damage matrices [5] may account forthis part of the mean damage curves in Ref. [5] falling outside the building damagebands presented herein.
6. Signi5cance of wind damage bands
Building wind damage bands are developed for speci"c classes (or types) of build-ings as depicted in Figs. 11}14. The upper and lower damage degree}windspeedrelationships (otherwise known as damage functions) de"ne the boundaries of a dam-age band. The band so de"ned contains the damage functions for all buildings in theoccupancy class for which the damage band was developed. The upper boundary ofa damage band can be thought of as representing the wind damage function of theleast wind-resistant building in that occupancy class. Conversely, the lower boundaryof a damage band corresponds to the damage function of the most wind-resistantbuilding for the building occupancy class. This information is vital for the damageprediction of individual buildings. Building damage bands are employed with buildingattributes to determine the wind damage vulnerability of individual buildings, groupsof buildings, and for wind damage mitigation. The attributes of a given buildingdetermine the damage function of that building, which lies between the upper andlower boundaries of the damage band for that building class.
7. Discussion and conclusions
From the building damage bands (Figs. 11}14), it is seen that the wind damagefunctions are non-linear, a behavior that had previously been noted by analysis ofpast wind loss data [6,7]. For all three occupancy classes of 1}3 story buildings,the greatest di!erences in the damage degrees furnished by the upper and lowerdamage functions occur in the 43}60 m/s wind speed range. The implication is that thedi!erences in the damage response of individual 1}3 story buildings are most evident
C.O. Unanwa et al. / J. Wind Eng. Ind. Aerodyn. 84 (2000) 119}149 145

in the 43}60 m/s wind regime. In contrast, the corresponding wind speed range formid-rise buildings is 54}81 m/s, with the damage response of individual mid-risebuildings being most easily distinguished in the category 5 hurricane wind regime (i.e.,windspeeds greater than 69.3 m/s).
The damage bands for 1}3 story buildings also clearly indicate that at very highwind speeds (category 5 winds), the upper and lower damage functions tend toapproach each other, i.e., the di!erence in damage response of the most wind-resistantand the least wind-resistant building becomes insigni"cant. In practical terms, a 1}3story building exposed to such wind regimes experiences a near-total destruction to itsenvelope. In contrast, mid-rise buildings do not experience near-total destruction totheir envelopes. A much higher wind regime than used in this study would benecessary to cause near-total destruction to the superstructure of mid-rise buildings.The damage bands also indicate that no signi"cant damage will occur to the bestquality building experiencing windspeeds less than or equal to 47 and 56 m/s for 1ow-and mid-rise buildings, respectively.
When placed side by side (see Fig. 18), the damage bands for 1}3 story residential,commercial, and institutional buildings do not show any pronounced di!erences inpeak values of damage degree. Since di!erences in building occupancy classes arere#ected in the present model in terms of component cost factors, a much largerpopulation of buildings of each occupancy class than used in this study would benecessary to conclusively determine if any systematic di!erences exist in the damagebands for the three occupancy classes of low-rise buildings. However, it is to be noted
Fig. 18. Comparison of wind damage bands for di!erent types of buildings. j Mid-rise, m residential,d commercial, T institutional.
146 C.O. Unanwa et al. / J. Wind Eng. Ind. Aerodyn. 84 (2000) 119}149

that the damage bands were obtained on the basis of average cost factors for eachbuilding occupancy class. Obviously, variations exist in the values of component costfactors for individual types of buildings within an occupancy class. The decision to usedamage bands obtained on the basis of building occupancy classes or on the basis ofa particular type of building within an occupancy class depends on the application.Since a damage band is ultimately used in conjunction with the relative resistivities ofbuildings for predicting the damage to individual buildings and groups of buildings, itis recommended that damage bands based on the cost factors of the speci"c type ofbuilding under consideration be used in determining individual building damagedegree rather than the cost factors for the building's occupancy class. For portfolioanalysis, however, damage bands based on average cost factors of building occupancyclasses are recommended.
References
[1] W.H. Gray, Likely increase in intense landfalling hurricanes in the coming decades, Paper presentedat the 12th. Annual Hurricane Conference, Dallas, TX, 1990.
[2] J.E. Minor, J.R. McDonald, K.C. Mehta, The tornado: an engineering-oriented perspective, NationalOceanic and Atmospheric Administration Technical Memorandum ERL NSSL-82, US Departmentof Commerce, 1977.
[3] R.H. Simpson, The hurricane disaster potential scale, Weatherwise 27 (1974) 169}186.[4] R.H. Simpson, H. Riehl, The Hurricane and its Impact, Louisiana State University Press, Baton
Rouge, 1981.[5] G.C. Hart, Estimation of structural damage due to tornadoes, Proceedings of the Symposium on
Tornadoes: Assessment of Knowledge and Implications for Man, Texas Tech University, Lubbock,1976, pp. 645-665.
[6] D.G. Friedman, Natural hazards risk assessment for an insurance program, in: The Geneva Papers onRisk and Insurance, International Association for the Study of Insurance Economics (GenevaAssociation), Switzerland 1 (30) (1984) 57}128.
[7] P.R. Sparks, S.A. Bhinderwala, Relationship between residential insurance losses and wind conditionsin hurricane Andrew, Hurricanes of 1992: Andrew and Iniki, One Year Later, Proceedings of theASCE Symposium, Riverwalk, 1993, pp. XI.1-XI.14.
[8] M.D. Powell, S.H. Houston, Surface wind "eld analyses in Hurricane Andrew, Proceedings of theSeventh US National Conference on Wind Engineering, Los Angeles, CA, 1993, pp. 523-532.
[9] N. Stubbs, A. Boissonnade, Damage simulation model for building contents in a hurricane environ-ment, Proceedings of the Seventh US National Conference on Wind Engineering, Los Angeles, CA,June 27-30, 1993, pp. 759}771.
[10] N. Stubbs, D. Perry, P. Lombard, Cost e!ectiveness of the new building code for windstorm resistantconstruction along the Texas coast, Final Report, Texas Department of Insurance, Austin, TX, 1995,submitted.
[11] G.L.F. Chiu, An extreme-wind risk assessment system, Ph.D. Dissertation, Department of CivilEngineering, Stanford University, CA, 1994, submitted.
[12] B.S. Dhillon, C. Singh, Engineering Reliability: New Techniques and Applications, Wiley, New York,1981.
[13] D. Kececioglu, D. Cormier, Designing a speci"ed reliability into a component, Proceedings of theThird Annual Aerospace Reliability and Maintainability Conference, Society of Automotive Engin-eers, Inc., New York, NY, 1964, pp. 546}565.
[14] ASCE, Minimum design loads for buildings and other structures-ANSI/ASCE 7-95, AmericanSociety of Civil Engineers, New York, NY, 1996.
C.O. Unanwa et al. / J. Wind Eng. Ind. Aerodyn. 84 (2000) 119}149 147

[15] NRC, Reactor safety study: an assessment of accident risks in U.S. commercial nuclear power plants:Main Report and Appendix II, WASH-1400 (NUREG-75/014), Nuclear Regulatory Commission,Washington, DC, 1975.
[16] W.C. Ganglo!, Common-mode failure analysis, IEEE Trans, Power Apparatus Systems 94 (1975)27}30.
[17] A. H.-S. Ang, H.-F. Ma, On the reliability of structural systems, Proceedings of the Third Interna-tional Conference on Structural Safety and Reliability (ICOSSAR' 81), Trondheim, Norway, 1981,pp. 295}314.
[18] J.R. Benjamin, C.A. Cornell, Probability, Statistics, and Decision for Civil Engineers, McGraw Hill,Inc, New York, 1970.
[19] J.W. Reed, M.W. McCann, J. Iihara, H. Hadidi-Tamjed, Analytical techniques for performingprobabilistic seismic risk assessment of nuclear power plants, Proceedings of the Fourth Inter-national Conference on Structural Safety and Reliability (ICOSSAR' 85), Kobe, III, 1985,pp. 253}263.
[20] Simpson Strong-Tie Company, Inc., Connectors for wood construction: products and instructionmanual, Pleasanton, CA, 1994.
[21] Forest Products Laboratory, Handbook of Wood and Wood-based Materials for Engineers, Archi-tects, and Builders, Hemisphere Publishing Corporation, New York, 1989.
[22] G.D. Lamb, J.S. Noe, Wind performance of asphalt roo"ng shingles, in: A. H.-S. Ang (Ed.), StructuralDesign, Analysis and Testing, Proceedings of the Structures Congress '89, San Francisco, CA, 1989,pp. 528-535.
[23] IIPLR, Understanding the wind peril, Insurance Institute for Property Loss Reduction, Boston, MA,1994.
[24] SFBC, The South Florida building code, Board of County Commissioners, Metropolitan DadeCounty, FL, 1979.
[25] BOCA, The BOCA National Building Code/1990, 11th Edition, Building O$cials & Code Adminis-trators International, Inc., Country Club Hills, IL, 1989.
[26] Underwriters Laboratory, Tests for wind-uplift resistance of roof assemblies, UL-588, Underwriters'Laboratory, Inc., Northbrook, IL, 1980.
[27] S. Murphy, S. Schi!, D. Rosowsky, S. Pye, System e!ects and uplift capacity of roof sheathingfasteners, Proceedings of the ASCE Structures Congress, Chicago, IL, vol. XIV, 1996, pp. 765}770.
[28] P. Cunningham, Roof sheathing fastening schedules for wind uplift, APA Report T92-28, AmericanPlywood Association, Tacoma, WA, 1993.
[29] E. Sutt, K. Muralidhar, T. Reinhold, Roof sheathing uplift resistance for hurricanes, Proceedings ofthe ASCE Structures Congress, Vol. XIV, 1996, pp. 974}981.
[30] SBCCII, Standard building code, (as amended 1980), Standard Building Code Congress Interna-tional, Inc., Birmingham, AL, 1979.
[31] NBC, The national building code, Engineering and Safety Services, New York, 1976.[32] NCBIA, North Carolina Uniform Residential Building Code, The North Carolina Building Code
Council, Raleigh, NC, 1984.[33] J.E. Minor, W.L. Beason, P.L. Harris, Designing for windborne missiles in urban areas, J. Struct. Div.
ASCE 104 (1978) 1749}1759.[34] J.R. McDonald, Impact resistance of common building materials to tornado missiles, J. Wind Eng.
Ind. Aerodyn. 36 (1990) 717}724.[35] J.E. Minor, W.L. Beason, Window glass failures in windstorms, J. Struct. Div. ASCE 102 (1976)
147}160.[36] ASTM, Standard practice for determining the minimum thickness and type of glass required to resist
a speci"ed load, designation: E 1300-94, 1996 Annual book of ASTM Standards, Section 4, WestConshohocken, PA, 1996.
[37] J.J. Abiassi, The Strength of Weathered Window Glass using Surface Characteristics, Institute forDisaster Research, Texas Tech University, Lubbock, TX, 1981.
[38] H.S. Norville, J.E. Minor, Strength of weathered window glass, Am. Cer. Soc. Bull. 64 (1985)1467}1470.
148 C.O. Unanwa et al. / J. Wind Eng. Ind. Aerodyn. 84 (2000) 119}149

[39] D.C. Kanabolo, H.S. Norville, The Strength of New Window Glass Plates using Surface Character-istics, Glass Research and Testing Laboratory, Department of Civil Engineering, Texas Tech Univer-sity, Lubbock, TX, 1985.
[40] A. Polensek, D.S. Gromala, Probability distributions for wood walls in bending, J. Struct. Eng. ASCE110 (1984) 619}635.
[41] A. Polensek, E!ect of construction variables on performance of wood-stud walls, Forest Products J.32 (1982) 37}41.
[42] ACI, Building code requirements for structural concrete (ACI 318-95) and commentary (ACI 318R-95), American Concrete Institute, Farmington Hills, MI, 1995.
[43] A.A. Mittenbergs, The material problem in structural reliability, Annals of Reliability & Maintaina-bility Conference, New York, 1966, pp. 148}158.
[44] E.B. Haugen, Probabilistic Mechanical Design, Wiley, New York, 1980.[45] T.V. Galambos, B. Ellingwood, J.G. MacGregor, C.A. Cornell, Probability based load criteria:
assessment of current design practice, J. Struct. Div. ASCE 108 (1982) 959}977.[46] M.K. Ravindra, Seismic risk assessment, in: C. Raj Sundararajan (Ed.), Probabilistic Structural
Mechanics Handbook: Theory and Industrial Applications, Chapman&Hall, New York, 1995, pp.429}464.
[47] H.A. Linstone, M. Turo!, The Delphi Method: Techniques and Applications, Addison-Wesley, Inc.,Reading, MA, 1975.
[48] R.S. Means, Means Square Foot Costs, 16th Annual Edition, R.S. Means Company, Inc., Kingston,MA, 1995.
[49] R.S. Means, Means Residential Cost Data, 15th Annual Edition, R.S. Means Company, Inc.,Kingston, MA, 1996.
[50] R.S. Means, Means Light Commercial Cost Data, 15th Annual Edition, R.S. Means Company, Inc.,Kingston, MA, 1996.
[51] ATC, Earthquake damage evaluation data for California, ATC-13, FEMA Contract No. EMW-C-0912, Applied Technology Council, Redwood City, CA, 1985.
[52] J.S. Milton, J.C. Arnold, Introduction to Probability and Statistics: Principles and Applications forEngineering and the Computing Sciences, McGraw-Hill, Inc., New York, 1990.
[53] M.D. Powell, P.G. Black, The relationship of hurricane reconnaissance #ight-level wind measure-ments to winds measured by NOAA'S oceanic platforms, J. Wind Eng. Ind. Aerodyn. 36 (1990)381}392.
[54] J.R. McDonald, K.C. Mehta, Building response to extreme winds and tornadoes, in: Gary Hart (Ed.),Proceedings of the Second ASCE/EMD Specialty Conference on Dynamics of Structures, Atlanta,GA, ASCE, New York, 1981.
[55] J.E. Minor, Windstorm damage, Glass Digest Oct. 15 (1992) 33}34.[56] T.T. Fujita, Proposed characterization of tornadoes and hurricanes by area and intensity, SMRP
Research Paper No. 91, Department of the Geophysical Sciences, The University of Chicago, IL,1971.
[57] W.R. Krayer, R.D. Marshall, Gust factors applied to hurricane winds, Bull. Am. Meteorol. Soci. 73(1992) 613}617.
C.O. Unanwa et al. / J. Wind Eng. Ind. Aerodyn. 84 (2000) 119}149 149