the development of real estate investment trusts (reits ... · p.1 the development of real estate...
TRANSCRIPT
P.1
The development of Real Estate Investment
Trusts (REITs) in Hong Kong
October 2013
P.2
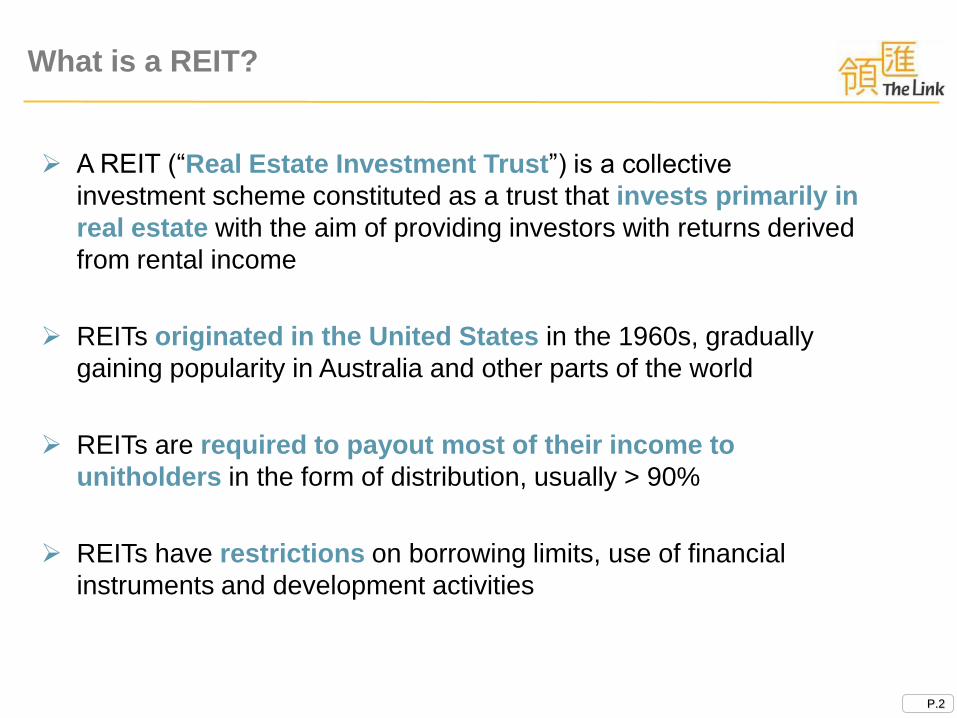
What is a REIT?
A REIT (“Real Estate Investment Trust”) is a collective
investment scheme constituted as a trust that invests primarily in
real estate with the aim of providing investors with returns derived
from rental income
REITs originated in the United States in the 1960s, gradually
gaining popularity in Australia and other parts of the world
REITs are required to payout most of their income to
unitholders in the form of distribution, usually > 90%
REITs have restrictions on borrowing limits, use of financial
instruments and development activities

P.3
Investment Advantages of REITs
Buying Physical Assets Buying Listed REITs
Barrier to entry Medium to High Low
Liquidity Low High
Divisibility Low High
Flexibility Low High
Transparency Low High
Profitability Stable to Fluctuate Stable
Costs and
disbursements
High (HK property stamp duty: 1.5 – 8.5%;
HK special stamp duty: 5 -20%;
HK buyer stamp duty: 15%;
Estate agent commission; Solicitor fees;
Mortgages; Taxes; Government rate;
Insurance; etc (if applicable))
Low (Brokerage: ~1.0%;
HK Stock Exchange trading fee: 0.005%;
SFC transaction levy: 0.003%;
Investor compensation levy; etc
(if applicable))
Day-to-day operational
management
Required Not required
Risk exposure Concentrated Diversified

H-REIT Structure – Typically Externally Managed
Typical externally managed H-REITs
P.4
REIT
Unitholders
Trustee Manager
Properties Property Manager
Management Services
Management Fees
Act on behalf of Unitholders
Trustee’s Fees
Property Management Services
Property Management Fees
Distributions Holding of units
Net property income Ownership
Sponsor
Assets Acquisition

The Link REIT is the only internally managed REIT in Asia
The Link REIT – Internally Managed
The Manager is stapled together as part of the REIT
Trustee Unitholders
HSBC Institutional Trust
Services (Asia) Limited
Ownership of Units
The Link
Management Limited
The Link
Holdings Limited
THE LINK REIT
Trustee’s Fees
Management Services
Manager’s Fee on cost recovery basis
Special Purpose Vehicles Manager
100%
182 Properties
Custodian of assets
P.5

Hong Kong Business Trust – Stapled Units Structure
P.6
Trust
Public Investors
Share Stapled Units
Trustee - Manager
Operating Business
Listco
Provision of trustee/
management service
Reimbursement of expenses
Preference Shares
Units
100% Ordinary Shares
Sponsor/
Controlling Unitholder
100%

P.7
H-REITs At a Glance
* Source: Data as at 30 Sep 2013, Bloomberg
Name Year of
IPO
Stock code Asset types Assets'
location
Market cap
(HK$ billion)*
The Link 2005 823.HK Retail Hong Kong 87.6
Prosperity 2005 808.HK Office Hong Kong 3.3
Yuexiu 2005 405.HK Office China 10.6
Champion 2006 2778.HK Diversified Hong Kong 20.0
Sunlight 2006 435.HK Diversified Hong Kong 4.9
Regal 2007 1881.HK Hotel Hong Kong 7.4
Fortune 2010 778.HK Retail Hong Kong 11.7
Hui Xian 2011 87001.HK Diversified China 19.3
New Century 2013 1275.HK Hotel China 2.8

Hong Kong Lag Behind Singapore as
Developing into a Regional Centre for REITs
P.8
Development of the REIT market in Hong Kong began with the listing of The Link
REIT in 2005, while Singapore REIT market was started in 2002 with the IPO of
CapitaMall Trust
To date, the development of the two markets are in stark contrast:
Number of REITs/
Business Trusts
Total Market Cap
(@30/09/13) Types of Assets
Location of
Assets
Hong Kong 9 ~US$22bn Retail, mixed, office,
hospitality Hong Kong, PRC
Singapore 33 ~US$46bn
Retail, mixed, office,
hospitality, industrial,
healthcare,
apartment
Singapore, PRC,
Hong Kong,
India, Japan,
Malaysia

P.9
Comparison of Hong Kong and
Singapore REIT Markets
Source: Bloomberg ; Market cap of 2013 as at 30 September 2013
Growth of S-REIT Market Growth of H-REIT Market
10
20
30
40
50
60
Mark
et
cap
at
year-
en
d (
US
$B
)
Development of S-REITs
10
20
30
40
50
60
2005 2006 2007 2008 2009 2010 2011 2012 2013
Mark
et
cap
at
year-
en
d (
US
$B
)
Development of H-REITs
Singapore REIT market has vastly outgrown Hong Kong REIT market by
number of listings, size, diversity of asset type and diversity of geography

Criteria US Australia UK France Netherlands Singapore Japan Hong Kong
Management Internal &
external
Internal &
external
Internal &
external
Internal &
external
Internal External External Internal &
external
Property
Investment
75%+ Flexible 75%+
Flexible 100% 70%+ 75%+
100%
Overseas
Investment
Yes Yes Yes Yes Yes Yes Yes Yes
Property
Development
Yes Yes Yes Yes Minimal Max. 10%
assets
Restricted No
Gearing Limit No limit No limit 1.25x
interest
cover test
No limit 60%
total assets
35% total
assets; 60%
total assets
if credit
rating
No limit 45%
total assets
Distribution
Percentage
> 90%
taxable
income
100%
taxable
income
> 90%
rental asset
income
> 85%
taxable
income
100% fiscal
earnings
> 90%
taxable
income
> 90%
taxable
income
> 90%
taxable
income
Tax
Transparency
Yes Yes Yes Yes Yes Yes Yes No
Source: “Implications for the Strategic Development of UK REITs from the Experience of LPTs in Australia”, IPF Research Programme 2006-2009
Hong Kong’s REIT regulations are relatively more restrictive than
other international markets
P.10
Regulatory Restrictions on REITs

Key Issues of the Hong Kong REIT Market
P.11
Restrictions under Mandatory Provident Fund
Exclusion from Hang Seng Index
Preclusion from Development Activities
Uncertainties in REIT Regulations

Developing Hong Kong into a Regional Centre
for REITs
P.12
Potential for listing of PRC and other overseas REITs
REIT as an investment choice for retail investors
Cluster effect to attract REIT specialist analysts and global property investors
Platform for developers to recycle capital by offloading non-core assets to REIT’s
Most significantly, REIT is a heavy user of capital markets(1) leading to demand for
rights issues, private placements, CMBS, bonds and loans, thus supporting Hong
Kong’s financial services industry
Note (1): As REIT has to distribute at least 90% of its distributable income, it does not have retained
earnings for acquisitions or capital expenditure and relies on the capital markets for funding.

0
50
100
150
200
250
300
350
Jan 09 Jan 10 Jan 11 Jan 12 Jan 13
Indic
es r
e-b
ase
d to
100
as a
t 1
Ja
n 2
00
9
Hang Seng REIT Index Straits Times REIT Index Hang Seng Index Straits Times Index
P.13
REIT Indices Outperformed Broad Market Indices
Source: Bloomberg
REIT Indices Broad Market Indices

0
50
100
150
200
250
300
350
400
Jan 09 Jan 10 Jan 11 Jan 12 Jan 13
Un
it P
rice
re
-base
d to
100
as a
t 1
Ja
n 2
00
9
The Link REIT Hang Seng REIT Index
P.14
Outperformance of Retail REITs
Source: Bloomberg
Retail REIT

Hong Kong Retail Market
Strong Retail sales growth
Steady household income growth supports retail market
Decentralisation of retailers drives retail space demand
Limited new supply of retail space
P.15
-40%
-30%
-20%
-10%
0%
10%
20%
30%
40%
50%
92 93 94 95 96 97 98 99 00 01 02 03 04 05 06 07 08 09 10 11 12 Jan-Jul 13
Supermarkets
Jewellery
Foods & alcoholic drinks
Department stores
Clothing
Asian financial crisis
Tech bubble burst
Global financial crisis
SARS outbreak
12 Jan-Jul 13
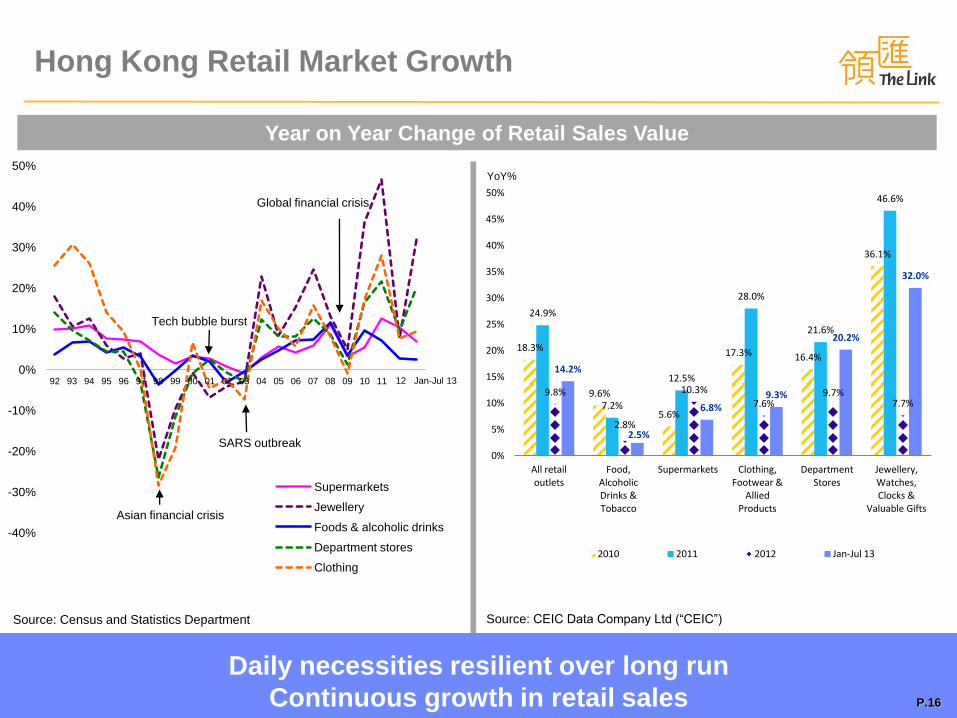
Daily necessities resilient over long run
Continuous growth in retail sales
Year on Year Change of Retail Sales Value
Hong Kong Retail Market Growth
Source: CEIC Data Company Ltd (“CEIC”)
Source: Census and Statistics Department
P.16
18.3%
9.6%
5.6%
17.3% 16.4%
36.1%
24.9%
7.2%
12.5%
28.0%
21.6%
46.6%
9.8%
2.8%
10.3%
7.6% 9.7%
7.7%
14.2%
2.5%
6.8% 9.3%
20.2%
32.0%
0%
5%
10%
15%
20%
25%
30%
35%
40%
45%
50%
All retail outlets
Food, Alcoholic Drinks & Tobacco
Supermarkets Clothing, Footwear &
Allied Products
Department Stores
Jewellery, Watches, Clocks &
Valuable Gifts
2010 2011 2012 Jan-Jul 13
YoY%

$221 $208 $237
$295 $309
$52 $67
$88
$111 $137
0
50
100
150
200
250
300
350
400
450
500
2008 2009 2010 2011 2012
Total Retail Sales HKD bn Mainlanders' Spending HKD bn
Continuous growth in tourist arrival and
mainlanders’ spending on retail sales
Hong Kong Tourism Growth
P.17
Steady Tourist Arrival Growth
36.03
41.92
48.62
25.37
22.68
28.10
34.91
18.82
-
5
10
15
20
25
30
35
40
45
50
2010 2011 2012 Jan-Jun 2013
Tourist Arrivals (Millions)
Total (Millions) Mainland China (Millions)
Source: CEIC
0
Mainlanders’ Spending on Retail Sales
+
HK$’B
2008 2009 2010 2011 2012
Contribution of Mainlanders’
Spending on Shopping to HK Retail
Sales*
19% 24% 24% 27% 31%
Mainland Tourist -
Per Capita Overall Spending (HK$)
4,106 4,649 4,980 5,237 5,119
*Contribution (%) is estimated based on the Mainland tourists’ spending on
shopping from HKTB as a fraction of HK Retail Sales from C&SD (The Link
REIT’s Estimates)
Source: CEIC, Hong Kong Tourism Board (“HKTB”)
(HK$’B) (HK$’B)

Months Unemployment Rate
May 13 3.4%
Jun 13 3.3%
Jul 13 3.3%
2013F 3.1%
-8
-6
-4
-2
0
2
4
6
8
10
12
14
2Q
03
4Q
03
2Q
04
4Q
04
2Q
05
4Q
05
2Q
06
4Q
06
2Q
07
4Q
07
2Q
08
4Q
08
2Q
09
4Q
09
2Q
10
4Q
10
2Q
11
4Q
11
2Q
12
4Q
12
2Q
13
GDP Private Consumption Expenditure
YoY%
Hong Kong Economic Growth
Source: Census & Statistics Department
2Q13
YoY
+4.2%
+3.3%
P.18
GDP & PCE
Source: Census and Statistic Department and Economist Intelligence Unit
Modest Growth in GDP & PCE with unemployment rate at near historic
low supporting income growth
P.18
Unemployment Rate
Source: Census and Statistic Department and Economist Intelligence Unit
0
1
2
3
4
5
6
7
8
9
Ma
r-04
Oct-
04
Ma
y-0
5
De
c-0
5
Ju
l-06
Feb-0
7
Se
p-0
7
Ap
r-08
No
v-0
8
Ju
n-0
9
Ja
n-1
0
Au
g-1
0
Ma
r-11
Oct-
11
Ma
y-1
2
De
c-1
2
Ju
l-13
%

7,500
10,000
12,500
15,000
17,500
20,000
22,500
25,000
27,500
30,000
32,500
2Q
03
4Q
03
2Q
04
4Q
04
2Q
05
4Q
05
2Q
06
4Q
06
2Q
07
4Q
07
2Q
08
4Q
08
2Q
09
4Q
09
2Q
10
4Q
10
2Q
11
4Q
11
2Q
12
4Q
12
2Q
13
Private Permanent Housing Subsidized Sale Flats
Overall Public Rental Housing
Median Monthly Household Income (including bonus)
HK$
Hong Kong Economic Growth
Source: Census & Statistics Department P.19
Household Income Growth
Source: CEIC
Public household income growth outpaced steady overall
growth due to minimum wages and labour shortage P.19
2Q13 2Q13
YoY
Median HH Income (2Q13)
Public Rental Housing +10.0% HK$13,200
Subsidized Home Ownership Housing
+4.8% HK$24,000
Private Permanent Housing
0.0% HK$30,000
Overall +6.3% HK$21,900

Market Decentralisation
P.20
Expansion of international retailers
forcing high street retailers to suburban locations
Tsuen Wan Kwai Shing East, Shek Lei,
Kwai Fong
New Territories East Wo Che, Tai Wo, Choi Yuen
New Territories West Leung King, Chung Fu,
Yau Oi, On Ting
Kowloon Tong Lok Fu, Wong Tai Sin, Lung Cheung
Tseung Kwan O Hau Tak, Sheung Tak, Nan Fung
P.20

The Link REIT -
Portfolio Benefitting from Mainland Shoppers
Lung Cheung Plaza
Stanley Plaza
Lok Fu Plaza Tai Wo Plaza
Butterfly Plaza
Choi Yuen Plaza Chung Fu Plaza
Presence with The Link REIT’s properties
P.21
Wong Tai Sin Plaza

0.12 0.22
0.48
0.78
0.59 0.49
0.60
1.30
5 5
6
5
4
5
4
9
0
1
2
3
4
5
6
7
8
9
0.00
0.20
0.40
0.60
0.80
1.00
1.20
1.40
2007/08 2008/09 2009/10 2010/11 2011/12 2012/13 2013/14 2014/15 and beyond
Total Reported Project Capex (HK$'B) No. of Projects Completed
No. of Projects Underway/ Pending Statutory Approval Total Estimated Project Capex (HK$’B)
HK$’B No. of Projects
Financial
Year
The Link REIT -
Asset Enhancement Investments
30 Completed Asset Enhancement Projects with a Total Capex of HK$2.7B
Continuous improvement of assets and service quality
Note: Data as at 31 March 2013
P.22
(HK$’B)

The Link REIT -
Continuous Improvement of Asset and Service Quality
Chung Fu – Established One-stop Shopping Centre in Tin Shui Wai
From This… To This…
Asset Enhancement (Phase II) to be completed in 2013
P.23

The Link REIT -
Continuous Improvement of Asset and Service Quality
Yau Oi and On Ting – A New Tuen Mun Flagship Upon Asset Enhancement Completion
Estimated completion in late 2014
From This… To This…
P.24

The Link REIT -
Continuous Improvement of Asset and Service Quality
Tai Yuen Market – Pioneer Fresh Market Asset Enhancement Project
Completed in 2011
From This… To This…
P.25

The Link REIT -
Business Model with Multiple Growth Drivers
Our Growth
Drivers
Our Strengths
Our Vision,
Mission,
Values Managing and operating
our business with Respect,
Excellence, Integrity and Teamwork
To Be a World Class
Real Estate Investor and Manager
Serving and Improving the Lives
of Those Around Us
Asset
Management
Asset
Enhancement
Asset
Investment
Real Estate
Expertise
Financial
Strength
Strong Corporate
Governance
P.26

The Link REIT -
Aligning Vision and Strengthening Culture
P.27
To build a business with long term sustainable growth

The Link Real Estate Investment Trust
HEAD OFFICE
33/F, AXA Tower, Landmark East,
100 How Ming Street, Kwun Tong, Kowloon, Hong Kong
Tel: +852 2175 1800
Fax: +852 2175 1900
Email: [email protected]
Website: www.thelinkreit.com
P.28