the development of attitudes and emotions related to
TRANSCRIPT

The Development of Attitudes and Emotions Related to Mathematics Guest Editors: Ann Dowker, Mark Ashcraft, and Helga Krinzinger
Child Development Research
The Development of Attitudes and EmotionsRelated to Mathematics

Child Development Research
The Development of Attitudes and EmotionsRelated to Mathematics
Guest Editors: Ann Dowker, Mark Ashcraft, and Helga Krinzinger

Copyright © 2012 Hindawi Publishing Corporation. All rights reserved.
This is a special issue published in “Child Development Research.” All articles are open access articles distributed under the CreativeCommons Attribution License, which permits unrestricted use, distribution, and reproduction in any medium, provided the originalwork is properly cited.

Editorial Board
Glenda Andrews, AustraliaRuth Berman, IsraelOlga Capirci, ItalyLei Chang, Hong KongXinyin Chen, USAPriscilla K. Coleman, USAGedeon Deak, USA
Cheryl Dissanayake, AustraliaJeffrey W. Fagen, USARoss Flom, USAMasha Gartstein, USAHui-Chin Hsu, USANobuo Masataka, JapanKarla K. McGregor, USA
Andrew N. Meltzoff, USADorit Ravid, IsraelHelena R. Slobodskaya, RussiaTricia Striano, USAAnna L. Theakston, UKAnnie Vinter, France

Contents
The Development of Attitudes and Emotions Related to Mathematics, Ann Dowker, Mark Ashcraft,and Helga KrinzingerVolume 2012, Article ID 238435, 3 pages
Math Anxiety Questionnaire: Similar Latent Structure in Brazilian and German School Children,Guilherme Wood, Pedro Pinheiro-Chagas, Annelise Julio-Costa, Letıcia Rettore Micheli, Helga Krinzinger,Liane Kaufmann, Klaus Willmes, and Vitor Geraldi HaaseVolume 2012, Article ID 610192, 10 pages
Beliefs, Anxiety, and Avoiding Failure in Mathematics, Steve ChinnVolume 2012, Article ID 396071, 8 pages
Attitudes to Mathematics in Primary School Children, Ann Dowker, Karina Bennett, and Louise SmithVolume 2012, Article ID 124939, 8 pages
Instructional Quality and Attitudes toward Mathematics: Do Self-Concept and Interest Differ acrossStudents’ Patterns of Perceived Instructional Quality in Mathematics Classrooms?, Rebecca Lazarides andAngela IttelVolume 2012, Article ID 813920, 11 pages
Relationships between 9-Year-Olds’ Math and Literacy Worries and Academic Abilities, Laura Punaroand Robert ReeveVolume 2012, Article ID 359089, 11 pages
Primary School Age Students’ Spontaneous Comments about Math Reveal Emerging DispositionsLinked to Later Mathematics Achievement, Michele M. M. Mazzocco, Laurie B. Hanich,and Maia M. NoederVolume 2012, Article ID 170310, 12 pages
Math Self-Assessment, but Not Negative Feelings, Predicts Mathematics Performance of ElementarySchool Children, Vitor Geraldi Haase, Annelise Julio-Costa, Pedro Pinheiro-Chagas,Lıvia de Fatima Silva Oliveira, Letıcia Rettore Micheli, and Guilherme WoodVolume 2012, Article ID 982672, 10 pages
Parents’ Beliefs about Children’s Math Development and Children’s Participation in Math Activities,Susan Sonnenschein, Claudia Galindo, Shari R. Metzger, Joy A. Thompson, Hui Chih Huang,and Heather LewisVolume 2012, Article ID 851657, 13 pages
Children’s Use of Arithmetic Shortcuts: The Role of Attitudes in Strategy Choice, Katherine M. Robinsonand Adam K. DubeVolume 2012, Article ID 459385, 10 pages
Attitudes towards Mathematics: Effects of Individual, Motivational, and Social Support Factors,Maria de Lourdes Mata, Vera Monteiro, and Francisco PeixotoVolume 2012, Article ID 876028, 10 pages

Hindawi Publishing CorporationChild Development ResearchVolume 2012, Article ID 238435, 3 pagesdoi:10.1155/2012/238435
Editorial
The Development of Attitudes and EmotionsRelated to Mathematics
Ann Dowker,1 Mark Ashcraft,2 and Helga Krinzinger3
1 Department of Experimental Psychology, University of Oxford, South Parks Road, Oxford OX1 3UD, UK2 Department of Psychology, University of Nevada, Las Vegas, 4505 S. Maryland Pkwy, Las Vegas, NV 89154, USA3 Department of Child and Adolescent Psychiatry and Psychotherapy, University of Aachen, Neuenhofer Weg 21,52074 Aachen, Germany
Correspondence should be addressed to Ann Dowker, [email protected]
Received 8 November 2012; Accepted 8 November 2012
Copyright © 2012 Ann Dowker et al. This is an open access article distributed under the Creative Commons Attribution License,which permits unrestricted use, distribution, and reproduction in any medium, provided the original work is properly cited.
Attitudes and emotions regarding mathematics are animportant topic, especially in view of the fact that many peo-ple have very negative attitude to mathematics, sometimes tothe point of serious mathematics anxiety, which is distressingin itself and also tends to impair mathematical performance[1]. Attitudes toward mathematics, and mathematics anxietyin particular, have been topics of interest to researchers for along time [2–5]. However, until recently most such studiesdealt with adolescents and adults and gave relatively littleattention to attitudes in younger children, or to the factorsthat influence their development. There has been increasedemphasis on attitudes to mathematics in elementary schoolchildren in recent years [6–8]) but the database has stillbeen small, with far more research needed, especially asthe results are somewhat conflicting: some studies suggestthat mathematics anxiety is rare in young children, andthat attitudes only become seriously negative later on, whileothers suggest that mathematics anxiety is a very significantproblem from an early age.
Moreover, perhaps in part as a result of the paucity ofresearch on the early development of attitudes to math-ematics, we have relatively little knowledge as yet abouttheir antecedents or even their correlates. We know acertain amount about what attitudes people have towardmathematics, but not very much about why or how theydevelop. There are also questions to be asked about thespecificity of mathematics anxiety, and the extent to whichit may reflect more general academic-related anxieties orcognitive difficulties.
This special issue attempts to examine attitudes tomathematics at different ages, with a particular emphasis onearly ages and to investigate some of the factors associatedwith attitudes and emotional reactions toward mathematics.
Research reported in this special issue indicates thatyoung children’s attitudes should indeed receive more study,not only for their own sake, but because they may have aninfluence on subsequent mathematical development. M. M.M. Mazzocco et al. describe a longitudinal study of primaryschool children’s spontaneous comments about mathemat-ics. The children’s likability comments were similar for“math” and “reading,” but they were more likely to describemath than reading as difficult. Achievement at Grade 3 waspredicted by comments at Grade 2. This indicates that youngchildren’s spontaneously expressed attitudes to maths can bea predictor of later achievement.
A. Dowker et al. report a study which gives data aboutprimary school children’s attitudes to mathematics and leadsto some hypotheses about the development of relationshipsbetween attitudes and performance. English primary schoolchildren in Grades 3 and 5 took a Mathematics Attitude andAnxiety Questionnaire, using pictorial rating scales to recordtheir self-rating for maths, liking for maths, anxiety aboutmaths, and unhappiness about poor performance in mathe-matics. They were also given the British Abilities Scales BasicNumber Skills test. Anxiety as such was not related to actualperformance, but self-rating was. Although a relatively smallsample size means a need for caution in drawing conclusions,it is of interest that the relationship between self-rating and

2 Child Development Research
actual performance seemed to develop between Grade 3 andGrade 5, suggesting that attitudes and performance maybecome increasingly linked with age.
G. Wood et al. extend research on young children’sattitude development cross-culturally. They describe a study,where they gave German and Brazilian 7- to 12-year-oldschool children the same Mathematics Anxiety Question-naire. They found a similar factor structure in both groups,but much more negative attitudes in the Brazilian group. TheBrazilian children liked mathematics less than the Germanchildren did, were more anxious about it, and were moreunhappier if they could not do a mathematics task. Theydid not, however, differ in their self-ratings of their ownperformance. Mathematics anxiety increased with age inboth groups. In both groups, attitudes were related to actualmathematics performance.
One question that arises with regard to mathematicsanxiety is that of whether it is just one form of academicperformance anxiety. It is generally assumed that mathe-matics anxiety is greater than anxiety about other subjects;but it could be argued that this simply reflects a lack ofresearch on anxiety about other subjects. L. Punaro and R.Reeve report a study that compares mathematics and literacyanxiety in Australian 9-year-olds and relates their anxiety totheir actual academic abilities. Although children expressedanxiety about difficult problems in both mathematics andliteracy, worries were indeed greater for mathematics thanliteracy. Moreover, anxiety about mathematics was relatedto actual mathematics performance, whereas anxiety aboutliteracy was not related to actual literacy performance.
A related issue is whether mathematics anxiety really isspecific to mathematics, or is just one consequence of generalanxiety and/or of difficulties with attention and executivefunctions, especially in view of Ashcraft and Krause’s [1]findings of important links between mathematics anxiety,working memory, and mathematical performance. V. G.Haase et al. report here that psychosocial competencies(general anxiety and attention deficits) and self-rating inmathematics are independent predictors of children’s mathe-matics performance. Moreover, general psychosocial compe-tencies predict both mathematics and spelling performance,while self-rating in mathematics predicts only mathematicsperformance. This gives support to the view that, thoughgeneral anxiety and attentional factors do affect academicskills in general, including mathematics, there is also a morespecific relationship between attitudes and performance inmathematics, that cannot be reduced to a more generalemotional or cognitive problem.
There are many questions to be asked as to whatfactors lead to individual and perhaps gender and culturaldifferences in attitudes to arithmetic. M. L. Mata et al. reporta study examining several factors that may influence attitudesto mathematics. They investigated Portuguese fifth to twelfthgrade pupils’ motivation and their perceptions of teacher andpeer support and also assessed their attitudes to mathemat-ics. Most pupils had positive attitudes to mathematics. Therewas no overall gender effect on attitudes, but there was aninteraction between gender and grade, such that girls but notboys showed a steady decline in attitudes to mathematics as
grade level increased. A hierarchical analysis using structuralequation modelling indicated that motivational variableswere the strongest predictors of attitudes to mathematics, butthat perceived social support from teachers and peers wasalso a very important factor.
It is often assumed that the quality of teaching inmathematics has an influence on attitudes, and also thatattitudes to mathematics influence reactions to the teaching.There had, however, been few studies of the relationshipsbetween attitudes to mathematics and pupils’ perceptionof the quality of their instruction. R. Lazarides and A.Ittell report a study of German secondary school pupilsperceptions of the quality of their mathematics instruction.Nearly half of the sample perceived their teaching as poor,and girls were more likely than boys to have this perception.There was a strong relationship between such negativeperceptions of teaching and experiencing negative attitudestoward mathematics.
Parents are also regarded as a strong influence ontheir children’s attitudes, and in particular intergenerationaltransmission of attitudes to mathematics is sometimespostulated as important. S. Sonnenschein et al. report a studyof parents’ beliefs about children’s development and aboutthe extent to which their children engaged in mathematics-related activities at home. The children were preschool or inthe early years of elementary school. Parents who consideredit important to have their children do math activities athome, saw themselves as role models, and considered it asimportant to involve children in daily living math activities,also reported that their children were in fact more frequentlyinvolved in math activities at home. Parents’ own enjoymentof math and perception of their own mathematical skills werenot related to the extent of their children’s engagement inmathematical activities, suggesting that, at least in this agegroup, the provision of mathematical activities at home wasdirectly related to whether parents thought it was importantto do so, but not to their own attitudes to mathematics.
The consequences of attitudes to mathematics are asimportant as their causes and are here investigated in termsnot just of effects on overall performance, but on particularkey aspects of mathematics. S. Chinn reports a study, notof the factors that cause mathematics anxiety, but of animportant but often neglected consequence: a tendency toavoid attempting mathematics problems at all out of fearof failure. This paper presents data taken from over 2500mathematics test papers from both children and adults. Alarge number of responses to questions were in the “noattempt” category; that is, the problems were avoided. Thisavoidance strategy was more common for multiplicationthan addition, and commonest of all for division.
Attitudes can also have an effect on the type of strategyused. There have been a number of studies (e.g., [9, 10])of children’s use of derived fact strategies, where they use aknown fact, combined an arithmetical principle such as com-mutativity, inversion, or associativity, to obtain the answer toanother problem without performing a full calculation. Here,K. M. Robinson (gave Canadian elementary school childrenthree sets of three-term addition problems, that could besolved by shortcuts involving associativity or inversion. They

Child Development Research 3
were then given an intervention where they were shown howto use the shortcut strategies and a standard algorithm andasked which they preferred. The intervention increased theuse of shortcuts for subsequent problems, but more so ifthey expressed a preference for the shortcuts to the standardalgorithm. This shows that attitudes may influence strategyuse.
We hope that this special issue will inspire furtherresearch on the nature, causes, and consequences of chil-dren’s attitudes and emotional reactions toward mathemat-ics.
Ann DowkerMark Ashcraft
Helga Krinzinger
References
[1] M. H. Ashcraft and J. A. Krause, “Working memory, mathperformance, and math anxiety,” Psychonomic Bulletin andReview, vol. 14, no. 2, pp. 243–248, 2007.
[2] L. R. Aiken, “Biodata correlates of attitude toward mathe-matics in three age and two sex groups,” School Science andMathematics, vol. 72, pp. 386–395, 1972.
[3] E. Fennema and J. A. Sherman, “The fennema-shermanmathematics attitude scales: instruments designed to measureattitudes to the learning of mathematics by females andmales,” Journal For Research in Mathematics Education, vol. 7,pp. 324–326, 1976.
[4] R. Hembree, “The nature, effects, and relief of mathematicsanxiety,” Journal For Research in Mathematics Education, vol.21, pp. 33–46, 1990.
[5] F. C. Richardson and R. M. Suinn, “The mathematics anxietyrating scale: psychometric data,” Journal of Counseling Psychol-ogy, vol. 19, no. 6, pp. 551–554, 1972.
[6] H. Krinzinger, L. Kaufmann, and K. Willmes, “Math anxietyand math ability in early primary school years,” Journal ofPsychoeducational Assessment, vol. 27, no. 3, pp. 206–225,2009.
[7] G. Ramirez, E. A. Gunderson, S. C. Levine, and S. L. Beilock,“Math anxiety, working memory and math achievement inearly elementary school,” Journal of Cognition and Develop-ment. In press.
[8] S. S. Wu, M. Barth, H. Amin, V. Malcarne, and V. Menod,“Math anxiety in second and third graders and its relationto mathematical achievement,” Frontiers in DevelopmentalPsychology, vol. 3, article 162, 2012.
[9] A. J. Baroody, H. P. Ginsburg, and B. Waxman, “Children’s useof mathematical structure,” Journal for Research in Mathemat-ics Education, vol. 14, pp. 156–168, 1983.
[10] A. Dowker, “Use of derived fact strategies by children withmathematical difficulties,” Cognitive Development, vol. 24, no.4, pp. 401–410, 2009.

Hindawi Publishing CorporationChild Development ResearchVolume 2012, Article ID 610192, 10 pagesdoi:10.1155/2012/610192
Research Article
Math Anxiety Questionnaire: Similar Latent Structure inBrazilian and German School Children
Guilherme Wood,1 Pedro Pinheiro-Chagas,2, 3
Annelise Julio-Costa,3 Letıcia Rettore Micheli,4 Helga Krinzinger,5
Liane Kaufmann,6 Klaus Willmes,5 and Vitor Geraldi Haase2, 3
1 Department of Neuropsychology, Institute of Psychology, Karl-Franzens University of Graz, Universitatsplatz 2/III. 8020, Graz, Austria2 Developmental Neuropsychology Laboratory, Department of Psychology, Federal University of Minas Gerais,31270-901 Belo Horizonte, MG, Brazil
3 Neuroscience Graduate Program, Federal University of Minas Gerais, 31270-901 Belo Horizonte, MG, Brazil4 Donders Institute for Brain, Cognition and Behavior, Radboud University Nijmegen, 106525 GA Nijmegen, The Netherlands5 Child Neuropsychology Section, Department of Child and Adolescent Psychiatry, RWTH Aachen University, 52074 Aachen, Germany6 Institute of Applied Psychology, UMIT-The Health and Life Science University, Eduard Wallnofer Zentrum 1,6060 Hall in Tyrol, Austria
Correspondence should be addressed to Guilherme Wood, [email protected]
Received 21 May 2012; Revised 21 October 2012; Accepted 21 October 2012
Academic Editor: Ann Dowker
Copyright © 2012 Guilherme Wood et al. This is an open access article distributed under the Creative Commons AttributionLicense, which permits unrestricted use, distribution, and reproduction in any medium, provided the original work is properlycited.
Math anxiety is a relatively frequent phenomenon often related to low mathematics achievement and dyscalculia. In the presentstudy, the German and the Brazilian versions of the Mathematics Anxiety Questionnaire (MAQ) were examined. The two-dimensional structure originally reported for the German MAQ, that includes both affective and cognitive components of mathanxiety was reproduced in the Brazilian version. Moreover, mathematics anxiety also was found to increase with age in bothpopulations and was particularly associated with basic numeric competencies and more complex arithmetics. The present resultssuggest that mathematics anxiety as measured by the MAQ presents the same internal structure in culturally very differentpopulations.
1. Introduction
Every student knows how unpleasant life can be when themathematics test is approaching. Although there is no goldstandard to measure the levels of math anxiety (MA) thatshould be considered maladaptive, depending on their inten-sity and duration, negative physiological reactions, effects,and thoughts regarding mathematics can be considered aform of performance-related phobia [1]. Correlations bet-ween MA and math achievement have been reported [2, 3]as well as bidirectional associations between MA and mathperformance on several time scales going from online orshort-term to long-term effects. On the long term, low mathachievement is an antecedent of MA [4, 5] but MA alsointerferes with math performance. MA leads to hastened
performance on math tasks and avoidance of math activitiesand courses, resulting in lower math skills and choice ofcareers with less demanding curricular requirements regard-ing mathematics [6, 7]. Besides, successful treatment of MAleads to significant improvements in math performance [2].
Short-term, online effects of MA on math performancehave also been described. Negative emotional and math-related primes have been shown to speed up math perfor-mance in children with math learning disability [8]. Otherstudies indicate that MA negatively interferes with mathperformance. Initial research showed that online effects ofMA on math performance were more pronounced for tasksdemanding higher levels of working memory resources, suchas those involving transfer between columns [9]. Newerfindings demonstrate, however, that MA also interferes

2 Child Development Research
with performance in more basic number processing tasks,such as magnitude comparison [10] and counting, but notsubitizing [11]. In line with these last results, children withhigh MA display comparatively lower levels of frontoparietaland higher levels of right amygdala activations performing asimple equation verification task [12]. Moreover, chil-dren with high MA also exhibit higher functional correlationlevels between right and left amygdala and between rightamygdala and ventromedial prefrontal cortex. These resultsindicate that in children MA is associated to a consistentpattern of activation in brain regions associated to emotionprocessing and regulation and hypoactivity in brain areasassociated with number processing and calculation.
MA is a multilevel construct keeping similarities with dis-orders such as social phobia and test and computer anxiety[1]. The physiological arousal component of MA has beenvariously assessed by salivary cortisol measures [13] orexperimentally manipulated by breathing of CO2 enrichedair [14]. However, most studies on MA have used self-reportscales assessing an affective component of tension, apprehen-sion and fear, and a cognitive component related to negativeattitudes, worrisome thoughts, and low self-assessments ofperformance [1, 4, 15]. The cognitive component of MAis correlated to but psychometrically distinguishable fromother self-related constructs such as math self-concept ormath self-efficacy [16]. Research investigating the latentstructure of MA self-assessments reliably distinguishes theaffective from the cognitive component [4]. There is alsocross-cultural research with adolescents confirming thedifferentiation between affective and cognitive componentsof MA [16, 17].
Although the latent structure of MA has been investi-gated in adolescents, to our knowledge, there is no researchon the latent structure of MA in elementary school childrenfocused on transcultural similarities and differences. Thiswould be important, as evidence suggests that distinct MAcomponents may differentially correlate to math perfor-mance and other factors according to age [4, 5]. Besides,although latent structure has been shown to preserve similar-ity across cultures, there are regional variations in the levelsand correlates of different constructs. For instance, studentsin some Asian countries such as Japan and Korea, exhibithigher levels of math performance, they also endorse lowerlevels of math self-concept and math self-efficacy [16].
Research on MA has been largely concentrated on high-school and college samples [2, 3]. But MA instruments toassess children of elementary school age are increasinglyavailable [4, 12, 15, 17, 18]. Age differences in the componentof MA associated to math performance have been reportedby Krinzinger and coworkers [4]. These authors foundthat lower math performance is a longitudinal predictor oflower math performance self-perceptions but not of negativeaffective reactions towards math in a sample examined rep-eatedly from the first to the third elementary school grade.In contrast, Ma and Xu [5] observed that lower mathachievement in the 7th grade is predictive of higher levelsin the affective component of MA in the 12th grade. Theseresults suggest that correlates of MA may vary according
to age but also that more research with elementary schoolchildren is still necessary.
Research reported here aimed at comparing MA latentstructure, math performance, and sociodemographic corre-lates in samples of typically developing elementary schoolchildren in two countries, Germany and Brazil. While thePISA 2003 math scores of German students are among thosewith the highest ranks, those of Brazilian students are placedin the lowest ranks [16]. Math anxiety (lower in Germany,higher in Brazil) and math self-efficacy (higher in Germany,lower in Brazil) were found previously to vary accordingly.Interestingly, math concept seems not to be affected by lowachievement and high math anxiety in Brazil [16].
More specifically, we aimed at examining if the bifactorialstructure described by Krinzinger and coworkers [4, 15] inGermany could be replicated in a Brazilian sample of ele-mentary school children, and if the affective and cognitiveMA components varied in level and associations to math per-formance in the two countries. Based on previous results byKrinzinger and coworkers, we hypothesize that the bifactorialaffective-cognitive structure may be reliably identifiable inthe two countries and that the cognitive MA componentshould be more strongly associated to math performance.
2. Materials and Methods
2.1. Participants
2.1.1. Brazilian Sample. The Brazilian sample was consti-tuted by children with ages ranging from 7 to 12 years andattending from 1st to 6th grade. The study was approved bythe local research ethics committee (COEP-UFMG). Chil-dren participated only after providing informed consent inwritten form from their parents, and orally from themselves.Children were recruited from schools of Belo Horizonteand Mariana, Brazil. A wide set of evenly geographicallydistributed schools was sampled. For this reason, the sampleis representative of the Brazilian school population, with 80%of children attending public school, and the 20% attendingprivate schools. In a first phase of testing, children with nor-mal intelligence (i.e., who scored above the 16th percentile inthe Raven colored matrices test, [19]) were included in thestudy. These children also solved the Arithmetic and Spellingsubtests of the Brazilian School Achievement Test (Teste doDesempenho Escolar, TDE, [20]). Those children scoringabove the 25th percentile on both Arithmetic and Spellingsubtests of the TDE were assigned to our study. The sampleconsisted of 171 children (see Table 1 for further details). In anext step, children were evaluated with a neuropsychologicalbattery containing the Digit-span and Corsi-blocks, forwardand backward, basic arithmetic operations, addition, sub-traction, and multiplication problems, individually.
2.1.2. German Sample. Four hundred fifty children with agesbetween 6 and 10 years old, attending to grades 1 to 3,who took part in a study aiming to collect norms for theGerman version of the TEDI-MATH [4, 21] were includedin the present study. In this sample, only children without

Child Development Research 3
Table 1: Descriptive data from Brazilian and German children.
Brazil Germany
N 171 450
Female (%) 99 (57.9%) 227 (50.4%)
Male (%) 72 (42.1%) 223 (49.6%)
Age (mean (sd))§ 119.26 (13.2) 96.04 (5.1)§expressed in months.
difficulties in mathematics—as screened by the TEDI-MATH [21]—were selected. Besides the TEDI-MATH, thesechildren have also completed a Digit-span task. Descriptivedata are depicted in Table 1. All children come from publicschools of the state of North Rhine-Westphalia in Germany.A more detailed description of the sample can be found inKrinzinger et al. [15].
For the purpose of comparing results between the Brazil-ian and the German samples, a subsample of those childrenwith ages between 7.6 and 10.1 years was selected, which isthe age interval common to both samples (Brazilian n = 101,German n = 284). When subsamples are compared, this willbe mentioned explicitly in the results. Importantly, the twosubsamples were formed by children attending to 2nd or 3rdgrades in school.
2.2. Psychological Instruments. The Math Anxiety Question-naire (MAQ) was applied both in Brazil as in Germany. Otherinstruments differed according to country. In Brazil, schoolachievement was assessed with the TDE and intelligencewith the Raven’s Colored Progressive Matrices. Besides, basiccomputation abilities were assessed with Basic ArithmeticOperations, and short-term and working memory with theDigit-span and Corsi-blocks tests. The TEDI-MATH wasused in Germany to assess basic math abilities. In thefollowing, these instruments will be described in more detail.
2.3. Brazilian School Achievement Test (TDE) [20]. The TDEis the most widely used standardized test of school achieve-ment with norms for the Brazilian population. It comprisesthree subtests: Arithmetics, single-word Spelling, and single-word Reading. In the screening phase, the Arithmetics andSpelling subtests were used, which can be applied in groups.Norms are provided for school-aged children betweenthe second and seventh grade. The Arithmetics subtest iscomposed of three simple verbally presented word problems(i.e., which is the largest, 28 or 42?) and 45 written arithmeticcalculations of increasing complexity (i.e., very easy: 4 −1; easy: 1230 + 150 + 1620; intermediate: 823 × 96; hard:3/4 + 2/8). Specific norms for each school grade wereused to characterize children’s individual performance. TheSpelling subtest consists of dictation of 34 words of increas-ing syllabic complexity (i.e., toca; balanco; cristalizacao).Reliability coefficients (Cronbach α) of TDE subtests are0.87 or higher. Children are instructed to work on theproblems to the best of their capacity but without timelimits.
2.4. Raven’s Colored Progressive Matrices. General intelligen-ce was assessed with the age-appropriate Brazilian validatedversion of Raven’s Colored Matrices [19].
Digit-Span (Forward and Backward). Verbal short-termmemory was assessed with the Brazilian WISC-III Digitssubtest [22]. Performance in the forward order was consid-ered a measure of phonological short-term memory, and thebackward order was used to assess verbal working memory.
Corsi Blocks (Forward and Backward). This test is a measureof the visuospatial component of working memory. It is con-stituted by a set of nine blocks, which are tapped, in a certainsequence by the examiner. The test starts with sequences oftwo blocks and can reach a maximum of nine blocks. Weused the forward and backward Corsi span tasks accordingto [23]. In the forward condition, the child is instructed totap the blocks on the same order as the examiner, in thebackward condition, in the inverse order. Span is determinedby the longest sequence correctly repeated before twosuccessive failures.
Basic Arithmetic Operations. This task consisted of addition(27 items), subtraction (27 items), and multiplication (28items) operations for individual application, which wereprinted on separate sheets of paper. Children were instructedto answer as fast and as accurate as they could, time limit perblock being 1 minute. Arithmetic operations were organizedin two levels of complexity and were presented to childrenin separate blocks: one consisted of simple arithmetic tablefacts and the other of more complex ones. Simple additionswere defined as those operations with the results below 10(i.e., 3+5), while complex additions with the results between11 and 17 (i.e., 9 + 5). Tie problems (i.e., 4 + 4) were notused for addition. Simple subtraction comprised of problemsin which the operands were below 10 (i.e., 9 − 6), whilefor complex subtractions the first operand ranged from 11to 17 (i.e., 16 − 9). No negative results were included inthe subtraction problems. Simple multiplication consisted ofoperations with results below 25 and with the number 5 asone of the operands (i.e., 2∗ 7, 5∗ 6), while for the complexmultiplication the result of operands ranged from 24 to72 (6 ∗ 8). Tie problems were not used for multiplication.Reliability coefficients were high (Cronbach’s α > 0.90).
2.5. TEDI-MATH. The TEDI-MATH is a battery for the asse-ssment of numerical and arithmetic competencies in 4–9-year primary school children. There are norms for the TEDI-MATH in three different languages: French, Flemish, andGerman. The TEDI-MATH is a multicomponential dyscal-culia test based on cognitive neuropsychological models ofnumber processing and calculation. The German versionof the TEDI-MATH [4] was translated of the BelgiumNeuropsychological Test for a Developmental Dyscalculiadiagnostic [24]. The German version offers in addition tothe original version an implementation of a core battery withsubtests of the first grade elementary school in the twocomponents of number processing (reading and writing

4 Child Development Research
multidigit numbers, size comparison multidigit numbers,recognition of unit and decade, representation of the decimalsystem), and arithmetic (addition, subtraction, multiplica-tion, word problems, additive decomposition of numbers,understanding of arithmetic concepts).
2.6. Math Anxiety Questionnaire (MAQ). The Math AnxietyQuestionnaire is a well-known scale developed by Thomasand Dowker [25] for the assessment of anxiety towards math-ematics in primary school children. The present study used aBrazilian Portuguese version developed and standardized byus (this paper). Children answer the questionnaire in indi-vidual sessions of 5 to 10 minutes. The Brazilian version ofthe MAQ contains 24 items that can be answered by childrenindividually or in groups within 5 to 10 minutes. The itemscan be combined into four basic subscales (“self-perceivedperformance” (Scale A), “attitudes in mathematics” (ScaleB), “unhappiness related to problems in mathematics” (ScaleC) and “anxiety related to problems in mathematics” (ScaleD)) according to the authors of the original version [25].Some studies have examined the construct validity of theMAQ [15]. Krinzinger and colleagues [15] have establishedwith help of multidimensional scaling that the latent struc-ture of the MAQ contains two main dimensions. Theseauthors have shown that the four original subscales canbe combined into two main scores called “Self-perceivedperformance and attitudes” and “Mathematics anxiety.” Thefirst one, named evaluation of mathematics, includes the firsttwo subscales, while the second one, called math anxiety,combines the last two subscales. Moreover, in a longitudinalstudy, Krinzinger and colleagues [4] also have shown that thetwo combined scales of the MAQ show a high stability overtime and are useful to predict calculation abilities. Finally,Haase and colleagues [26] showed recently that the differentsubscales of the MAQ can be differentiated from moregeneral forms of anxiety and are more specifically related toperformance in mathematics in school children than generalmeasures of anxiety. The MAQ items have the format of oneout of four types of questions: “How good are you at. . .” (ScaleA); “How much do you like. . .” (Scale B); “How happy orunhappy are you if you have problems with. . .” (Scale C) and“How worried are you if you have problems with. . .” (ScaleD). Each question is to be answered regarding six differentcategories related to mathematics, namely, mathematics ingeneral (MAQ G), easy calculations (MAQ E), difficult cal-culations (MAQ D), written calculations (MAQ W), mentalcalculations (MAQ M), and math homework (MAQ H).Children are encouraged by supportive figures to give theirresponses according to a Likert scale with 5 points (coded 0to 4, such as in the study by Krinzinger et al. [15]. Thehigher the score, the higher is the math anxiety. Reliabilitycoefficient (Cronbach α) of MAQ in the German studyranged between 0.83 and 0.91 for the total scale.
2.7. Testing Procedures. The assessment was performed in anappropriate room in children’s schools. Tests as well as theirorder of application varied in the two countries. In Brazil,the TDE and Raven were applied during the screening phase,
while four different pseudo-randomly varying sequences ofapplication were used in the individual testing phase. InGermany, the MAQ was applied immediately after the TEDI-MATH. The data from the Brazilian and German sampleswere obtained originally for very different purposes and atdifferent time points. The aim of the present study to analyzethe latent structure of the MAQ emerged after both data setshave been collected. This is the reason why the choice ofmeasurement instruments was so different in Brazilian andGerman populations.
2.8. Analyses. The internal consistency of all subscales of theMAQ will be calculated for the first time for the Brazilianversion of the MAQ. Because of existing findings in theGerman population [4], predictive validity over arithmeticsachievement will be assessed by means of regression analyseslinking basic number magnitude representations and arith-metics performance to the MAQ subscales. The constructvalidity of the MAQ will be assessed by different methods.To determine the dimensionality of the MAQ, Mokkenautomatic item classification [27] and multidimensionalscaling will be employed. Mokken scaling is based on theMonotone Homogeneity Model (MHM, [27–29]). It tests theassumptions that the traits being measured are unidimen-sional, that items can be ordered monotonically accordingto their difficulty, and that responses to single items bearlocal independence. Mokken analyses provide scalabilitycoefficients H for each item in each scale and for the scalesas a whole. Values H can vary from 0 to 1. The higher theH value, the higher is the scalability of an item according tothe Monotone Homogeneity Model [27, 28]. To determinethe convergent validity of the MAQ, a comparison between aGerman and a Brazilian versions of the MAQ was carried out.
3. Results
All children in the Brazilian sample reached a score abovethe 25th percentile in the subtests of the TDE and can beconsidered as typically achieving children in both arithmeticand spelling abilities. All children in the German sample canbe considered as typically achieving children in arithmeticsaccording to their scores in the TEDI-MATH. In thefollowing, results regarding the internal consistency of theMAQ will be presented first. Thereafter, the raw scores of theBrazilian and the German sample will be compared and thepredictive validity of the MAQ regarding numeric and arith-metic abilities will be reported. Finally, investigations on thelatent structure of the MAQ that employed automatic itemclassification and multidimensional scaling will be reported.
3.1. Brazilian Sample
Internal Consistency. Means, standard deviations, minimumand maximum and internal consistency (Cronbach’s α) ofthe scores in each MAQ subscale and each composite scaleobtained in the Brazilian sample are presented in Table 2. Theinternal consistency of the different subscales is satisfactoryor high in all cases (Table 2). According to the criteria

Child Development Research 5
Table 2: Descriptives of MAQ subscales and composite scales (n = 171).
Scales Mean Sd Minimum Maximum Cronbach’s α
Scale A (6 items) 23.66 3.53 11 30 0.71
Scale B (6 items) 23.00 4.66 8 30 0.71
Scale C (6 items) 17.80 6.13 6 30 0.88
Scale D (6 items) 17.20 5.80 6 30 0.80
Scale AB (12 items) 46.60 7.03 24 59 0.78
Scale CD (12 items) 35.06 10.55 12 58 0.88
Total (24 items) 81.70 14.67 46 116 0.87
Table 3: Regression models for arithmetic abilities.
Task Adjusted r2§
Sample size Significant predictors in the model
Simple addition 34.7 164 Sex, grade, raven, Corsi backwards, digit-span forward
Complex addition 38.4 164 Grade, Corsi backward, digit-span forward, Corsi backward
Simple subtraction 26.1 164 Sex, grade, Corsi backward, Corsi forward
Complex subtraction 29.9 164 Grade, Corsi backward, digit-span backward, MAQ-scale A
Simple multiplication 53.5 164 Grade, Corsi backward, digit-span forward, MAQ-scale A, MAQ-scale D
Complex multiplication 42.9 164 Corsi forward, digit-span forward, digit-span backward, MAQ-scale A§
expressed as the proportion of variance in the dependent variable explained by the model.
established by Willmes [30], scales C and D as well as CD andMAQ-total are practically invariant for the sample size n =171 and alpha-error probability of 5%. Composite scale ABis very close to practical invariance. The optimal sample sizewould be reached with 30 more children in the normativesample (see [30]).
To investigate the predictive validity of the MAQ, regres-sions analyses entering the four MAQ subscales as predictorsof numeric and arithmetic abilities were calculated.
Numeric and Arithmetic Abilities. The impact of math anxi-ety on simple and complex addition, subtraction, and multi-plication tasks was examined in the Brazilian sample. Hun-dred sixty four children from the Brazilian sample completedall these tasks. In order to ascertain the specificity of thecontribution of MAQ scales to explaining variance in thearithmetic tasks, age, sex, grade, general intelligence, verbaland nonverbal short-term memory and working memory(digit span and Corsi span, both of them forward and back-ward) were entered in the model as well. Age, sex, grade, andgeneral intelligence were entered first in the model using themethod “enter,” while the measures of short-term memoryand working memory were entered using the method “step-wise.” This regression method was adopted to ascertain thatthe impact more general sociodemographic and cognitivefunctions has been removed before analyzing the impactof math anxiety on numeric and arithmetic abilities andcompetencies was investigated. A summary containing theadjusted r2 and significant predictors in each single modelis presented in Table 3.
As depicted in Table 3, scale A of the MAQ has asignificant impact on more complex arithmetic operationssuch as complex subtraction, simple, and complex multipli-cation. Moreover, verbal and visuospatial working memory
measures (digit-span and Corsi blocks backwards) are signif-icant predictors of individual differences in performance inaddition, subtraction, and multiplication problems but theycannot account for the impact of different aspects of MA onarithmetics performance.
3.2. German Sample
Internal Consistency. The internal consistency of the MAQ inthe German population has been reported in detail elsewhere[15]. The Cronbach’s alpha coefficient of single subscalesranges between .65 and .86.
To investigate the predictive validity of the MAQ, regres-sions analyses entering the four MAQ subscales as predictorsof seven different subtests of the TEDI-MATH, whichmeasure numeric and arithmetic abilities, were calculated.
Numeric and Arithmetic Abilities. The impact of math anxi-ety on seven subtests of the TEDI-MATH was examined inthe German sample. Between 279 and 284 children fromthe German sample completed all these tasks. In order toascertain the specificity of the contribution of MAQ scales toexplaining variance in the arithmetic tasks, age, sex, grade,and verbal short-term memory (digit span forward andbackward) were entered in the model as well. Age, sex, andgrade were entered first in the model using the method“enter,” while the measures of short-term memory and wereentered using the method “stepwise”. This regression methodwas adopted to ascertain that the impact more generalsociodemographic and cognitive functions has been removedbefore analyzing the impact of math anxiety on numericand arithmetic abilities and competencies was investigated. Asummary containing the adjusted r2, sample sizes, and signif-icant predictors in each single model is presented in Table 4.

6 Child Development Research
Table 4: Regression models for numeric and arithmetic abilities.
Task Adjusted r2§
Sample size Significant predictors in the model
Addition decomposition 5 284 Age, MAQ-scale A
Text problems 8 284 Age, grade, MAQ-scale A
Magnitude comparison Arabic 2.6 284 MAQ-scale A
Magnitude comparison number words 3.3 284 MAQ-scale A
Writing number 6.7 284 Age
Reading number 6.8 284 Age
Arithmetic concepts 9.6 279 MAQ-scale A§expressed as the proportion of variance in the dependent variable explained by the model.
As depicted in Table 4, scale A of the MAQ has a signi-ficant—although small—impact on fundamental numericand arithmetic abilities measured by the TEDI-MATH suchas magnitude comparison (Arabic numbers and numberwords) as well as more complex abilities such as additiondecomposition, text problems, and arithmetic concepts.
3.3. Comparisons between Raw Scores. To compare data bet-ween the Brazilian and the German sample, a subsample ofeach group was selected (Brazilian sample, n = 101; Germansample n = 284), which had ages between 7.5 and 10.1years in both groups. t-tests revealed no difference betweenboth samples in the subscale A “self-perceived performance”(t(383) = 0.45; se = 0.49; P = 0.65; Cohen’s d = 0.05). TheBrazilian sample showed higher scores that the German sam-ple in the subscale B “attitudes in mathematics” (t(383) =2.81; se = 0.63; P = 0.0053; Cohen’s d = 0.34), subscale C“unhappiness related to problems in mathematics” (t(383) =5.30; se = 0.62; P = 0.0001; Cohen’s d = 0.61) and subscaleD “anxiety related to problems in mathematics” (t(383) =2.22; se = 0.68; P = 0.03; Cohen’s d = 0.26) although theeffect sizes of these differences were small or moderate.
3.4. Automatic Item Classification Analysis [27]. To investi-gate the latent structure of the MAQ, an automatic itemclassification analysis was employed [27]. Based on theLoevinger H-index of scalability, items were automaticallyassigned to a one-dimensional scales [28]. Only itemsreaching an H-index of at least 0.3 were assigned to a scale,while items with lower scalability are dropped automaticallyfrom the analysis [27]. Results were quite similar in bothBrazilian and German samples. In both cases, three scaleswere disclosed by the Mokken analysis (Table 5). MAQ scalesC and D were subsumed under a single unidimensional scalein both Brazilian and German samples. However, in bothsamples subscales A and B could not be assigned to one singlecomposite scale, but to two separate scales in which itemsfrom both subscales A and B were mixed. Closer inspectionof items being classified in scales 2 and 3 reveals that in theGerman sample “written calculations” drove the process ofitem classification in scale 3. In contrast, in the Braziliansample the items being assigned to scale 3 originate from theoriginal scale B measuring “attitudes towards mathematics”.
Three items could not be classified in the Braziliansample, while all items could be assigned to a scale in theGerman sample. Results were replicated when consideringonly children with ages between 7.5 and 10.1 years. For thisreason, these analyses will not be reported here.
3.5. Dimensionality of the MAQ. To investigate the constructvalidity of the Brazilian version of the MAQ, multidi-mensional scaling was employed. The facets diagram (seeFigure 1) depicts the projection of the distances between thedifferent items on a two-dimensional space. As can be easilyrecognized, Items from scales A and B cluster together as wellas items from scales C and D. These results replicate thosereported by Krinzinger et al. [15].
4. Discussion and Conclusion
In the present study, the psychometric properties of a Brazil-ian version of the MAQ were investigated for the first time aswell as its transcultural validity in German Brazilian samples.The internal consistency of all subscales and composite scalesobtained in the Brazilian sample is throughout satisfactoryor even high. A direct comparison of the raw scores obtainedin the Brazilian sample with those obtained in the Germansample reveal no differences in the subscale representing“self-perceived performance”. However, the Brazilian sampleshowed higher scores in the subscales “attitudes towardsmathematics,” “unhappiness related to problems in mathe-matics,” and “anxiety related to problems in mathematics”when compared to the German sample. The investigationof the predictive validity of the MAQ revealed that “self-perceived performance” is a significant predictor of basicnumeric abilities such as magnitude comparison as well ofmore complex arithmetic abilities and competencies. Impor-tantly, “self-perceived performance” remains a significantpredictor even after removing the specific effects of grade,age, sex, verbal, and nonverbal short-term memory andworking memory on these abilities. Finally, automatic itemselection as well as multidimensional scaling proceduresrevealed the similarities in the structure of the MAQ betweenboth Brazilian and German samples. In the following, theseresults will be discussed in more detail.

Child Development Research 7
Table 5: Results of the automatic classification of items (Mokken analysis).
ScaleBrazilian sample (n = 171) German sample (n = 450)
Items (scale)§ Loevinger’s H-score Items (scale)§ Loevinger’s H-score
Scale 1
MAQ M(C) (H = 0.64) MAQ M(D) (H = 0.57)MAQ D(C) (H = 0.64) MAQ D(D) (H = 0.57)MAQ G(C) (H = 0.62) MAQ H(D) (H = 0.55)MAQ H(C) (H = 0.60) MAQ G(D) (H = 0.52)MAQ E(C) (H = 0.59) MAQ E(D) (H = 0.51)MAQ W(C) (H = 0.58) MAQ W(D) (H = 0.49)MAQ H(D) (H = 0.54) MAQ D(C) (H = 0.46)MAQ W(D) (H = 0.50) MAQ H(C) (H = 0.44)MAQ E(D) (H = 0.48) MAQ E(C) (H = 0.43)MAQ M(D) (H = 0.46) MAQ G(C) (H = 0.42)MAQ D(D) (H = 0.43) MAQ W(C) (H = 0.40)MAQ G(D) (H = 0.42) MAQ M(C) (H = 0.39)
Scale 2
MAQ M(A) (H = 0.61)MAQ H(A) (H = 0.54) MAQ G(A) (H = 0.61)MAQ G(A) (H = 0.54) MAQ D(A) (H = 0.57)MAQ D(A) (H = 0.46) MAQ M(B) (H = 0.53)MAQ D(B) (H = 0.43) MAQ D(B) (H = 0.51)MAQ M(A) (H = 0.41) MAQ G(B) (H = 0.48)MAQ M(B) (H = 0.39) MAQ H(B) (H = 0.45)MAQ G(B) (H = 0.37) MAQ H(A) (H = 0.43)
MAQ E(B) (H = 0.40)MAQ E(A) (H = 0.39)
Scale 3
MAQ W(B) (H = 0.42)MAQ W(A) (H = 0.42) MAQ W(B) (H = 0.30)MAQ E(B) (H = 0.37) MAQ W(A) (H = 0.30)MAQ H(B) (H = 0.35)
§Item description is composed of the content of each item, that is: mathematics in general (MAQ G); easy calculations (MAQ E); difficult calculations
(MAQ D); written calculations (MAQ W); mental calculations (MAQ M); math homework (MAQ H) and its scale (A), (B), (C), or (D).
A
AA AA
A
B BBB
CCCCCC
DDD
DD D
−3
−2
−1
0
1
2
3
Scores first dimension
Scor
es s
econ
d di
men
sion
Facets diagram of the MAQ
−3 −2 −1 0 1 2 3
BB
Figure 1: Configuration of MAQ items represented in a two-dimensional space using multidimensional scaling. Symbols A, B,C, and D represent the different scale items according to their scaleassignment. The scale of axes x and y is arbitrary.
4.1. Internal Consistency and Diagnostic Properties of theMAQ. In Brazil, a raw sample covering a broad spectrum of
ages was investigated. The degree of accuracy to describe MAin children is lower than in the larger German sample, wherespecific norms for children in first and second halves of eachgrade were obtained [15]. However, the Brazilian data on theMAQ still have some very useful psychometric properties.The internal consistency was satisfactory for all scales.Especially subscales C and D as well as the composite scalesCD and Total were found to be practically invariant. Thismeans, the reliability estimations obtained for these scales aresufficient for the construction of stable confidence intervalson the individual performance and specially for testingintervention-related changes in the levels of MA. Moreover,the composite scale AB presents an internal consistency highenough to be very close to practical invariance as definedby Willmes [30] Since investigations on the dimensionalityof the MAQ support the view that scales A and B can begrouped into a composite scale AB it is unproblematic toconsider scale AB as equally useful for individual diagnosticspurposes.
4.2. Comparisons between the Brazilian and the German Sam-ples. The Brazilian sample showed higher scores on “atti-tudes towards mathematics,” “unhappiness related to prob-lems in mathematics,” and “anxiety related to problems inmathematics” when compared to the German sample. These

8 Child Development Research
results reveal higher levels of MA in the Brazilian samplewhen compared to the German sample. This replicatesevidence from the recent literature [16]. Lee [16] reportedthat Brazilian students present levels of math anxiety muchhigher than those presented by German students (i.e.,Brazilian students report math anxiety levels 0.4 standarddeviations above the average of the 41 nations examinedin that study, while German students report levels below−.35 standard deviations, [16, Figure 3, p. 361]. Interestingly,these differences were not found in the subscale “self-perceived performance”. These results are in line with thestudy by Lee [16], where the levels of self-concept presentedby both Brazilian and German students were comparable [16,Figure 1, p. 360].
One possible interpretation of these results can be deriv-ed from the view that there are at least two different waysfor MA to impact math performance [31]. Chinn [31] arguesthat feelings of tension, apprehension, and fear may interferedirectly with math performance but the state of discomfortassociated to math activities may impact on the more interndriven constructs of self-esteem, self-concept, which alsoimpact on math performance. The higher levels of “unhap-piness related to problems in mathematics” and “anxietyrelated to problems in mathematics” as well as the lowerlevels of “attitudes towards mathematics” observed in theBrazilian sample can be directly attributed to the less efficientBrazilian educational system. However, independently of theprejudice in educational resources to which Brazilian chil-dren are exposed, their self-perceived performance may stillbe relatively high because of some compensatory factors andcoping strategies. This could explain why comparable levelsof self-perceived performance were observed in Brazilianand German samples in the present study. According to theframework conceived by Chinn [31], one could argue thatparticularly MAQ scales B, C, and D reflect more directlyenvironmental influences such as a bad educational system,less motivated teachers on math performance indicate largerdifferences between countries. In contrast, the scale A seemsto reflect the more self-oriented aspects of MA, which revealno difference between countries because this dimension ofMA is more internally regulated and less driven by theenvironment. In summary, the MAQ offers a fine-grainedevaluation of both environment driven and self-orientedaspects of MA, which contribute to refine the diagnostics ofMA in its different dimensions and aspects.
4.3. Predictive Validity of the MAQ. Investigation on thepredictive validity of the MAQ revealed specific effects of self-perceived performance on basic number processing abilitiessuch as magnitude comparison. These results replicate thoseobtained by Maloney and colleagues [11] regarding magni-tude comparison (Arabic numbers and number words) aswell as more complex abilities such as addition decomposi-tion, text problems, and arithmetic concepts. Interestingly,no effect of self-perceived performance on number readingand writing was observed in the present study. Moreover,self-perceived performance also explained variance of simpleand complex arithmetics. In the Brazilian sample, the effect
of self-perceived performance could be distinguished fromthe more general factors such as age, general intelligence,short-term memory, and working memory. This is direct evi-dence on the specificity of the contribution of self-perceivedperformance to the diagnostics of performance in bothsimple and complex arithmetics. Interestingly, self-perceivedperformance contributes to explain variance of complexsubtraction as well as simple and complex multiplicationproblems but is not associated with the performance inaddition tasks and simple subtraction. Therefore, one mayconclude that the impact of self-perceived performance onarithmetics is more pronounced in more demanding tasks.These findings reflect probably the fact that more demandingtasks may differentiate better children’s performance thaneasier tasks and may reveal more about the self-perceivedperformance in mathematics than less demanding arith-metics tasks.
In general, these results suggest that the self-perceivedperformance is to some extent objectively associated to theactual level of performance observed in school children. Thisis indicative that the self-perceived performance may beassessed and used to complement the diagnostics of difficul-ties not only with the most elementary abilities in magnitudeprocessing but also in those arithmetics tasks more typical ofthe academic context.
4.4. The Latent Structure of the MAQ. Automatic itemclassification after Mokken produced similar results in bothsamples. Scales A and B, on the one side, and scales C andD, on the other side, can be grouped into scales AB andCD. Items from scales A and B as well as items from scalesC and D seem to load in the same latent dimensions ina way that item difficulty and individual competency aresufficient to describe the properties of the scale. The mostcentral evidence provided by the Mokken analysis is that theitems of the MAQ measure a broad spectrum of difficultyregarding MA. These findings are quite intuitive and can berelated in a very transparent fashion to the contents of theMAQ items. In other words, the kind of question asked inthe MAQ is related to a broad spectrum of expressions of thedifferent facets of the construct “mathematics anxiety.” Whileitems asking for “easy problems” are easy for everyone andhave a high probability of being responded positively even bychildren with high levels of MA, items representing the morecomplex categories such as “written calculations,” “mentalcalculations,” or “difficult calculations” have a decreasingprobability of being answered positively by children withincreasing levels of MA. Moreover, the good scalability ofmost items of the MAQ put in evidence the property ofmonotonicity found within each the MAQ scales. The highmonotonicity found the different scales of the MAQ reflectsthe fact that only children with low levels of MA respondpositively to more difficult items, while all children (thosewith low levels of MA as well as those with high levels of MA)tend to respond positively to easier items.
Finally, data from the multidimensional scaling analysisrevealed clear similarities between the German and the Bra-zilian version of the MAQ. In both samples, a clear separation

Child Development Research 9
between subscales A and B, on the one side, and C andD, on the other side was observed. Two latent dimensionshave been found in the German version of the MAQ byKrinzinger at al. [15] as well as in the present data. For theobjectives of the present study, the substantial differencesbetween samples should not be considered a drawback whencomparing the latent structure of the MAQ obtained inthe two populations but a strength of the study, since theyreinforce the conclusions about the invariance of the latentstructure of the MAQ even when comparing datasets fromBrazilian and German populations obtained under verydifferent circumstances and for very different purposes.
4.5. Final Considerations. The MAQ is a valid and usefulscale for measuring mathematics anxiety in children withdiverse cultural backgrounds with useful psychometric prop-erties. The MAQ also specifically predicts basic numberprocessing abilities as well as arithmetics performance andshould, for this reason, be included in the assessment pro-tocols used in the diagnostics of mathematics difficulties[32]. Studies on the psychophysiological correlates of mathanxiety [33] could benefit from the use of the MAQ as well.Moreover, the latent structure of the Brazilian version of theMAQ seems to be two dimensional such as in the Germanversion. Finally, probabilistic analyses revealed that the MAQshows properties of monotonic organization, which arevaluable to characterize a broad spectrum of variation in thedifferent dimension of math anxiety.
Acknowledgments
G. Wood was supported by Grant (P22577-B18 of theAustrian Wissenschaftsfond FWF). Research by the V. G.Haase during the elaboration of this paper was funded bygrants from CAPES/DAAD Probral Program, Conselho Nac-ional de Desenvolvimento Cientıfico e Tecnologico (CNPq,307006/2008-5, 401232/2009-3), and Fundacao de Amparoa Pesquisa do Estado de Minas Gerais (FAPEMIG, APQ-02755-SHA, APQ-03289-10, PPM-00280-12).
References
[1] M. H. Ashcraft, J. A. Krause, and D. R. Hopko, “Is mathanxiety a mathematical learning disability?” in Why Is Math soHard for Some Children? The Nature and Origins of Mathemat-ical Learning Difficulties and Disabilities, D. B. Berch and M.M. M. Mazzocco, Eds., pp. 329–348, Brookes, Baltimore, Md,USA, 2007.
[2] R. Hembree, “The nature, effects, and relief of mathematicsanxiety,” Journal for Research in Mathematics Education, vol.21, no. 1, pp. 33–46, 1990.
[3] X. Ma, “A meta-analysis of the relationship between anxietytoward mathematics and achievement in mathematics,” Jour-nal for Research in Mathematics Education, vol. 30, no. 5, pp.520–540, 1999.
[4] H. Krinzinger, L. Kaufmann, and K. Willmes, “Math anxietyand math ability in early primary school years,” Journal of Psy-choeducational Assessment, vol. 27, no. 3, pp. 206–225, 2009.
[5] X. Ma and J. Xu, “The causal ordering of mathematics anxietyand mathematics achievement: a longitudinal panel analysis,”Journal of Adolescence, vol. 27, no. 2, pp. 165–179, 2004.
[6] M. H. Ashcraft and M. W. Faust, “Mathematics anxiety andmental arithmetic performance: an exploratory investigation,”Cognition and Emotion, vol. 8, no. 2, pp. 97–125, 1994.
[7] J. A. LeFevre, A. G. Kulak, and S. L. Heymans, “Factorsinfluencing the selection of university majors varying in math-ematical content,” Canadian Journal of Behavioural Science,vol. 24, no. 3, pp. 276–289, 1992.
[8] O. Rubinsten and R. Tannock, “Mathematics anxiety in chil-dren with developmental dyscalculia,” Behavioral and BrainFunctions, vol. 6, article no. 46, no. 1, p. 46, 2010.
[9] M. H. Ashcraft and E. P. Kirk, “The relationships amongworking memory, math anxiety, and performance,” Journal ofExperimental Psychology, vol. 130, no. 2, pp. 224–237, 2001.
[10] E. A. Maloney, D. Ansari, and J. A. Fugelsang, “The effect ofmathematics anxiety on the processing of numerical magni-tude,” The Quarterly Journal of Experimental Psychology, vol.64, no. 1, pp. 10–16, 2011.
[11] E. A. Maloney, E. F. Risko, D. Ansari, and J. Fugelsang “Math-ematics anxiety affects counting but not subitizing duringvisual enumeration,” Cognition, vol. 114, no. 2, pp. 293–297,2010.
[12] C. B. Young, S. S. Wu, and V. Menon, “The neurodevelopmen-talbasis of math anxiety,” Psychological Science. In press.
[13] A. Mattarella-Micke, J. Mateo, M. N. Kozak, K. Foster, and S. L.Beilock, “Choke or thrive? The relation between salivary cor-tisol and math performance depends on individual differencesin working memory and math-anxiety,” Emotion, vol. 11, no.4, pp. 1000–1005, 2011.
[14] D. R. Hopko, D. W. McNeil, C. W. Lejuez, M. H. Ashcraft, G.H. Eifert, and J. Riel, “The effects of anxious respondingon mental arithmetic and lexical decision task performance,”Journal of Anxiety Disorders, vol. 17, no. 6, pp. 647–665, 2003.
[15] H. Krinzinger, L. Kaufmann, A. Dowker et al., “German ver-sion of the math anxiety questionnaire (FRA) for 6- to 9-year-old children,” Zeitschrift fur Kinder- und Jugendpsychiatrie undPsychotherapie, vol. 35, no. 5, pp. 341–351, 2007.
[16] J. Lee, “Universals and specifics of math self-concept, mathself-efficacy, and math anxiety across 41 PISA 2003 participat-ing countries,” Learning and Individual Differences, vol. 19, no.3, pp. 355–365, 2009.
[17] H. Z. Ho, D. Senturk, A. G. Lam et al., “The affective andcognitive dimensions of math anxiety: a cross-national study,”Journal for Research in Mathematics Education, vol. 31, no. 3,pp. 362–379, 2000.
[18] A. Wigfield and J. L. Meece, “Math anxiety in elementary andsecondary school students,” Journal of Educational Psychology,vol. 80, no. 2, pp. 210–216, 1988.
[19] L. Angelini, I. C. B. Alves, E. M. Custodio, W. F. Duarte, and J.L. M. Duarte, Matrizes Progressivas Coloridas de Raven, CentroEditor de Testes e Pesquisas em Psicologia, Sao Paulo, Brazil,1999.
[20] L. M. Stein, Teste de Desempenho Escolar: Manual para Apli-cacao e Interpretacao, Casa do Psicologo, Sao Paulo, Brazil,1994.
[21] L. Kaufmann, H.-C. Nuerk, M. Graf, M. Delazer, and K. Will-mes, TEDI-MATH: Test Zur Erfassung Numerisch-Rechne-rischer Fertigkeiten Vom Kindergarten Bis Zur 3, Hans-Huber,Zurich, Switzerland, 2009.
[22] V. L. M. Figueiredo, WISCIII: Escala de Inteligencia Wechslerpara Criancas. Manual Adaptacao e Padronizacao Brasileira,Casa do Psicologo, Sao Paulo, Brazil, 2002.

10 Child Development Research
[23] R. P. C. Kessels, M. J. E. Van Zandvoort, A. Postma, L. J.Kappelle, and E. H. F. De Haan, “The Corsi Block-TappingTask: Standardization and normative data,” Applied Neuropsy-chology, vol. 7, no. 4, pp. 252–258, 2000.
[24] C. Van Nieuwenhoven, J. Gregoire, and M. P. Noel, TestDiagnostique des Competences de Base en Mathematiques (Tedi-Math), Edition du Centre de Psychologie Appliquee, Paris,France, 2001.
[25] G. Thomas and A. Dowker, “Mathematics anxiety and relatedfactors in young children,” in Proceedings of the DevelopmentalSection Conference, British Psychological Society, Bristol, UK,2000.
[26] V. G. Haase, A. Julio-Costa, P. Pinheiro-Chagas, L. F. S. Olivei-ra, L. Rettore-Micheli, and G. Wood, “Math self-assessment,but not negative feelings, predicts mathematics performanceof elementary school children,” Child Development Research,vol. 2012, Article ID 982672, 10 pages, 2012.
[27] R. J. Mokken, A Theory and Procedure of Scale Analysis, DeGruyter, Berlin, Germany, 1971.
[28] R. J. Mokken and C. Lewis, “A nonparametric approach to theanalysis of dichotomous item responses,” Applied PsychologicalMeasurement, vol. 6, no. 4, pp. 417–430, 1982.
[29] K. Sijtsma and I. W. Molenaar, Introduction to NonparametricItem Response Theory, Sage, Thousand Oaks, Calif, USA, 2002.
[30] K. Willmes, “An approach to analyzing a single subject’s scoresobtained in a standardized test with application to the AachenAphasia Test (AAT),” Journal of Clinical and ExperimentalNeuropsychology, vol. 7, no. 4, pp. 331–352, 1985.
[31] S. Chinn, “Mathematics anxiety in secondary students inEngland,” Dyslexia, vol. 15, no. 1, pp. 61–68, 2009.
[32] F. de O. Ferreira, G. Wood, P. Pinheiro-Chagas et al., “Explain-ing school mathematics performance from symbolic and non-symbolic magnitude processing: similarities and differencesbetween typical and low-achieving children,” Psychology &Neuroscience, vol. 51, pp. 37–46, 2012.
[33] B. Pletzer, G. Wood, K. Moeller, H. C. Nuerk, and H. H.Kerschbaum, “Predictors of performance in a real-life statisticsexamination depend on the individual cortisol profile,” Biolog-ical Psychology, vol. 85, no. 3, pp. 410–416, 2010.

Hindawi Publishing CorporationChild Development ResearchVolume 2012, Article ID 396071, 8 pagesdoi:10.1155/2012/396071
Research Article
Beliefs, Anxiety, and Avoiding Failure in Mathematics
Steve Chinn
Faculty of Education, Health and Sciences, University of Derby, Derby DE22 1GB, UK
Correspondence should be addressed to Steve Chinn, [email protected]
Received 1 June 2012; Revised 26 August 2012; Accepted 29 August 2012
Academic Editor: Ann Dowker
Copyright © 2012 Steve Chinn. This is an open access article distributed under the Creative Commons Attribution License, whichpermits unrestricted use, distribution, and reproduction in any medium, provided the original work is properly cited.
Mathematics anxiety has been the subject of several books and numerous research papers, suggesting that it is a significant issuefor many people. Children and adults develop strategies to cope with this anxiety, one of which is avoidance. This paper presentsdata taken from over 2500 mathematics test papers in order to compare the levels of accuracy and the frequency of the use of the“no attempt” strategy, that is, avoidance, for arithmetic problems given to children aged from 10 years to adults aged up to 49 yearsfrom across the UK.
1. Introduction
The difficulties in learning mathematics are a fascinating andcomplex area for study. The interactions between factors thatcan be attributed to the cognitive domain and those that canbe attributed to the affective domain are many and varied.For example, anxiety has a negative influence on workingmemory [1]. Skemp ([2], page 127) suggested that thereflective activity of intelligence is most easily inhibitedby anxiety. Lundberg and Sterner [3] claim that “overand above common cognitive demands and neurologicalrepresentations and functions, performance in reading andarithmetic is influenced by a number of motivational andemotional factors such as need for achievement, task ori-entation, helplessness, depression, anxiety, self-esteem, self-concept. . ..” Hattie [4] selects a pithy quote from O’Connorand Paunonen [5], “Whereas cognitive ability reflects whatan individual can do, personality traits reflect what anindividual will do.”
The implications on learning of anxiety, motivation, self-worth, self-efficacy and attributional style are significant(e.g., [6–8]) particularly in mathematics where a curriculummay make inappropriate assumptions about how some chil-dren learn. Those assumptions may be rooted in beliefs aboutmathematics and how it can be taught and learnt.
There are a number of beliefs about mathematics that arelong established and embedded in its culture. This does not
necessarily make them helpful in creating a positive studentattitude to mathematics, especially for those who havedifficulties with learning mathematics or, indeed, mathemat-ics learning difficulties. For example, Mtetwa and Garofalo[9] discuss five beliefs, which include “mathematics problemshave only one correct answer” and “computation problemsmust be solved by using a step-by-step algorithm.” The firstbelief leads children to perceive of mathematics as highlyjudgmental, that answers are right or they are wrong. Thesecond belief leads children and their teachers to perceiveof mathematics as a series of procedures which have tobe memorised and not necessarily understood. Ernest [10]reviews the literature on beliefs in his book, “The Psychologyof Learning Mathematics.” Three examples from his revieware “some people have a mathematics mind and some donot,” “mathematicians do problems quickly in their head,”and “mathematics requires a good memory.” The first beliefpermits people to rationalise their inabilities in mathematicsand to protect their feelings of self-worth. The second beliefsets up children who process some information more slowly,for example dyslexic children, for failure. The last belief ispervasive, for example, Porkess et al. [11] claims that “Aswith any language, the fundamentals of mathematics (e.g.,multiplication tables and number bonds) are most easilylearnt when you are young.” Unfortunately the reliance onmemorising facts and procedures does not stop there.

2 Child Development Research
It could be hypothesised that these beliefs have been, andstill are, influential in the way mathematics’ curricula aredesigned and in the way mathematics is taught. For example,the beliefs that surround the task of learning times table facts,where the primary belief is that, providing the child practisesenough, then the learning is guaranteed and achieved early inthe child’s life. Informal surveys of teachers across the UK bythe author lead to an estimate of somewhere around 50% often-year-old students failing to achieve this goal. Evidence onlevels of achievement in retrieving basic facts acquired froma large sample of pupils from across the UK can be found inChinn [12].
The implications of the experience of failure in learningare succinctly described in the back-cover summary ofCovington’s [13] book on motivation:
“Achievement behaviour in schools can best be under-stood in terms of attempts by students to maintain a positiveself-image. For many students, trying hard is frighteningbecause a combination of effort and failure implies low abil-ity, which is often equated with worthlessness. Thus manystudents described as unmotivated are in actuality highlymotivated—not to learn, but to avoid failure.”
The experience of failure is a consequence of theinherently judgmental nature of arithmetic. For example, theanswer for 8× 7 is 56. Giving an answer of 54 is rarely judgedempathetically as, “That was close. Well done.” The “54”answer generates the response, “Wrong.” Arithmetic is, un-avoidably, the dominant experience of mathematics foryoung pupils.
Failure and the judgmental nature of mathematics con-tribute to anxiety. In Chinn’s [14] survey of mathematicsanxiety in over 2500 secondary students (ages 11 to 15 years)in England, the item “waiting to hear your score on a mathstest” was ranked high for anxiety, that is, from second to 6thout of 20 items for all ages and both genders of mainstreamstudents. “Having to take a written maths test” was rankedfrom second to 4th and “taking an end of term maths exam”was ranked first out of 20 items for all pupils.
The mathematics task which ranked highest was, “doinglong division questions without a calculator”, ranking fromsecond to 5th. “Long multiplication without a calculator”was ranked less highly, between 9th and 13th for ten of thefifteen subgroups of students.
The ranking of the item, “having to work out the answersto maths questions quickly,” which reflects the mathematicsbelief that computations have to be done quickly, was alsoranked high, for both the dyslexic (442 males) and the main-stream school students (2084 male and female) in the sample.The anxiety generated by having to attempt a problem thatis a threat to the pupil’s confidence is often exacerbated bythe need to work out an answer quickly, that is, within anarbitrary time limit.
Studies from many countries over many years haveshown that performance in mathematics is related negativelyto mathematics anxiety ([15, page 249], [16, page 334], and[17, 18]).
Failure can motivate or undermine ([6, page 5]) depend-ing on whether students’ reactions are mastery-oriented orhelpless. Dweck uses the term “helpless” to include all the
reactions that some students show when they meet failure,including plunging expectations, negative emotions, anddeteriorating performance. It seems that the consequence offailure in mathematics is to undermine.
One reaction, or strategy, to deal with failure that Chinn[19] observed in a classroom study on errors in arithmetic isto avoid the challenge and use the “no attempt” [20] error.The study was set up to compare both the performance andthe errors for pupils in mainstream schools to those fordyslexic pupils in specialist schools (ages 11 to 13 years).There appeared to be no difference in the frequency of occur-rence of any of Engelhardt’s other categories of errors, butthe one outstanding exception was the “no attempt” error.For example, for 37.6–4, 14.0% of the dyslexic pupils didnot attempt the item compared to 2.2% of the mainstreampupils. This compared to the addition item, 12.3 + 5 (wherefinger counting forwards is a strategy that is accessible toalmost all children) where the no attempt percentages were2.5% and 0%, respectively. For division the contrast wasgreater, for the item, 6040 ÷ 10, 39.7% of the dyslexic cohortdid not attempt the problem in comparison to 5.8% ofthe mainstream cohort. The study suggested that childrenwith specific learning difficulties, even if of above averageintelligence, or perhaps because they are of above averageintelligence, will use avoidance rather than risk failure. Datafrom a 15-minute mathematics test [12], the source of thedata for this paper, is given for the bottom and top quartilesof performers to support this conjecture.
Hadfield and McNeil [21] proposed a model of math-ematics anxiety, centred on three factors. Environmentalfactors include classroom issues and the perception of math-ematics as a rigid set of rules. Intellectual variables includea mismatch of learning styles and self-doubt. Personalityfactors include a reluctance to ask questions in class and lowself-esteem. Any or all of these three factors could influencea learner and generate a “no attempt” or avoidance attitude.
It is unlikely that this reaction is confined solely to thespecial needs population, nor just to avoidance of individualquestions. Ashcraft and Krause [17] note that “Mathematicsanxiety leads to a global avoidance pattern—whenever pos-sible, students avoid taking math classes and avoid situationsin which math will be necessary. . .”
The problem of avoidance begins when some children arequite young. An informal survey by the author, taken overthe past ten years, of hundreds of teachers from across theUK and abroad indicates that enough children at age 7 yearsare withdrawing from and giving up on maths for classroomteachers to notice.
The English Government ([22], page 17) has noted thata “minority of pupils” who were making less than expect-ed progress in mathematics shared certain characteristics,including the following.
They would work if the task was straightforward, butwould get distracted and might behave badly if they decidedthey could not do the work.
They did not want to be told they had got somethingwrong—they were likely to give the impression that they didnot care and give up.
They were concerned about how their peers viewedthem—for some it was a risk to be seen to try and fail.

Child Development Research 3
Table 1
34 = 4 + —
Age Sample Percentage of correct answers Percentage of “no attempts”
8 y 225 62.2 10.2
10 y 220 77.7 5.5
12 y 173 84.4 2.9
40–49 y 129 92.2 1.6
Table 2
9 = — – 4
Age Sample Percentage of correct answers Percentage of “no attempts”
8 y 225 36.9 22.2
10 y 220 72.3 9.5
12 y 173 71.1 9.2
14 y 225 81.3 5.3
40–49 y 129 82.9 4.7
These observations were personalised by a quote (p18)from a Year 9 (13 years old) girl:
“I don’t get stuck in other subjects—only maths.When I’m doing English, I can always get on withmy work. If I’m not sure about a spelling, I can justhave a go and still get my work done. But I can’tdo that in maths. If I’m stuck I can’t do anythingbut wait for help. Then I don’t get anything done.”
2. The Sample
1783 school children from age 7 years to 15 years old. 792people from age 16 years to 59 years old.
The sample was collected from across the UK from over50 sources, including state schools, independent schools,colleges, a prison, postal workers, and college students. Themajority of the data was collected over a period of twelvemonths, mid 2010 to mid 2011. Only one of the schools thatparticipated was a special school (for dyslexic pupils).
3. The Test/Survey
The data was collected as a consequence of setting up a 15-minute norm-referenced test/survey of mathematics [12].The “test” was renamed for adults as a “survey” in an attemptto lower anxiety levels and thus to encourage more of themto take part. The tactic was marginally successful.
The test consists of 44 items, ranging from 2 + 5 = —,to “Write forty thousand and seventy as a number,” to 20%of 140, to 2y + 5 = 31. It is, however, primarily a test ofarithmetic.
4. The Results
A number of hypotheses follow, stimulated by the analysis ofthe data collected for the standardising procedure combinedwith reflections on the author’s previous research and thirtyyears of teaching experience with students with specificlearning difficulties. This analysis of the data is in termsof the percentage of correct answers and the percentage of“no attempts.” A “no attempt” may have been caused by thesubject having not yet reached the relevant stage in the cur-riculum. The National Numeracy Strategy for England wasreferred to in order to ascertain at what age a topic is includedin the curriculum in order to minimise this problem.
4.1. Hypothesis 1. Addition is the default operation. Theother operations create less success, more insecurity andmore “no attempt” errors (see Table 1).
This item is testing knowledge of place value at a basiclevel of two-digit numbers. It is less about testing additionskills, although a + sign is present. The percentage of correctanswers grows steadily between 8 years and 12 years old andis at a slightly higher level for the 40 to 49 years old group.The percentage of “no attempts” is marginal at 12 years andolder.
The problem in Table 2 is a basic fact presented as asubtraction with a missing number and in the reverse orderto basic fact format, that is, — − 4 = 9. For those pupilswho are heavily dependent on consistency, even this simplechange in order may be a challenge. The percentage of pupilsaged 10 and 12 years who did not get a correct answer washigh at 27.7% and 28.9%, respectively. Almost 1 in 10 pupilsof these ages did not attempt the question. This dropped toalmost 1 in 20 at 14 years old. These figures suggest thatsubtraction is perceived as being more difficult than addition.
An item, which requires the subject to cross the tens (seeTable 3), provides further evidence to suggest that additionis believed to be easier than subtraction. The percentages of

4 Child Development Research
Table 3
36
+54
Age Sample Percentage of correct answers Percentage of “no attempts”
8 y 225 71.6 7.6
10 y 220 92.7 1.0
13 y 191 92.7 1.6
14 y 225 92.4 0.9
40–49 y 129 94.6 0.8
Table 4
103
–96
Age Sample Percentage of correct answers Percentage of “no attempts”
8 y 225 29.3 34.7
10 y 220 63.6 7.7
13 y 191 69.6 8.9
14 y 225 79.6 5.8
40–49 y 129 93.0 1.6
correct answers are higher and the percentages of “noattempts” are lower than for the subtraction item, 103 – 96,particularly for the school pupils (see Table 4).
The National Numeracy Strategy includes subtractionproblems of the type HTU-TU in Year 4 (8 years old).
The results shown in Table 4 indicate that around one-third of pupils aged from 10 to 13 years old cannot obtaina correct answer to this question. A number of the answersgiven, for example 193, were manifestly incorrect.
The problem shown in Table 5 is about the commutativeproperty. If that is recognised, then the answer is achievedquickly and accurately. If it is not recognised then the methodis to add 534 and 185, giving an interim answer of 719,followed by subtracting 185. The item uses three-digit num-bers and thus may be perceived as more challenging. Eventhough the item uses the low anxiety inducing + sign, thepercentage of “no attempts” is the highest for the exampleslisted so far which incorporate the + symbol. It is noteworthythat the percentage of “no-attempts” is now higher than forother addition problems in the test for the 40 to 49 year olds,who may not have the frequent exposure to the commutativeproperty of numbers that schoolchildren do.
The hypothesis may require a caveat, in that once theaddition problem becomes more challenging or is perceivedas more challenging, the security of “doing” addition isweakened. This caveat may be required for other hypotheses.
It can be tempting for teachers who feel that a lesson isgoing well to push the concept a step beyond the comfortzone of some learners.
4.2. Hypothesis 2. Multiplication is not widely understoodand is judged as difficult, so more learners avoid the risk ofbeing wrong.
Caveat: simply learning the times table facts by rote maynot help in building an early understanding of the conceptsof multiplication (or division).
The multiplication item in Table 6 was designed to notrequire the retrieval of any of the basic multiplication factsthat are often perceived as difficult (to retrieve). It requiresonly a retrieval of 2x and 3x facts. Thus, the item is testing theability to use a procedure. The procedures that can be usedall require the ability to organise, spatially and cognitively, arelatively large amount of information on the page.
The percentage of correct answers increases from age 13years to age 16–19 years old, but remains well under 50%.The percentage of “no attempts” is around 34% for ages 16to 39 years and then drops to around 15% for ages 40 to 59years. This could suggest that whatever the methods taught,the “traditional long multiplication” or the more recentlyfavoured grid method, they are not creating enduringsecurity and efficacy for people after-school. Even methodsthat resulted in a correct answer sometimes indicated a rigidadherence to procedure, for example, a 15 y 9 m studentwrote:
541×20316230000
108200109823
(1)
However, among 15-year-old students this method,which uses partial products selected via the place valuesof the digits in the multiplying number, was the preferred

Child Development Research 5
Table 5
534 + 185 = 185 +
Age Sample Percentage of correct answers Percentage of “no attempts”
10 y 220 52.7 12.3
13 y 191 70.7 12.7
15 y 220 82.3 10.0
40–49 y 129 77.5 15.5
Table 6
541
×203
Age Sample Percentage of correct answers Percentage of “no attempts”
13 y 191 15.2 40.8
14 y 225 27.1 22.2
15 y 220 38.2 16.8
16–19 y 307 33.2 32.6
20–29 y 160 33.1 34.4
30–39 y 108 32.4 33.3
40–49 y 129 57.4 16.3
50–59 y 88 52.3 13.6
Table 7
2)38
Age Sample Percentage of correct answers Percentage of “no attempts”
10 y 220 59.1 30.5
13 y 191 60.7 27.2
15 y 220 75.0 13.2
16–19 y 307 67.8 20.8
40–49 y 129 86.0 8.5
method and usually led to a correct answer. Place value andpartial product-based errors included
541 541×203 ×2031043 1003
541 541×203 ×20310820 1623
0000 0001623 108211443 2705
(2)
The insecurity, fear of failure, and anxiety createdby multiplications that are perceived of as complex anddemanding are likely to contribute significantly to the highpercentage of “no attempts”. A 59-year-old, successful, busi-ness man who scored 39/44 simply wrote “too hard” next tothis item and moved on.
The percentages for correct answers suggest that what-ever is happening to teach multiplication in many mathe-matics classrooms is not successful for a large proportion oflearners.
4.3. Hypothesis 3. Division is even less understood than mul-tiplication (and is rarely linked to multiplication in learners’minds) and is judged by learners as being even more diffi-cult, so that more children and adults will avoid the risk ofbeing wrong (see Table 7).
This item is at a low level of complexity. It could beviewed as “halving 38.”
The percentage of “no attempts” is high for the 10 yearsand 13 years cohorts, representing between a third and aquarter who did not take the risk of attempting this item.Even at 40 years, the “no attempt” percentage showed thatapproximately 1 in 12 did not attempt a division by 2 (seeTable 8).
Even though this item is still a division by a single digitnumber, it did create high percentages of “no attempts” andlow percentages of correct answers, data that, when com-pared with the 541 × 203 item shows that the percentagesof “no attempts” for this division item were higher than forthe multiplication item (see Tables 9 and 10).
For the latter two items the percentages of “no attempts”are high. Both items could be considered to be, funda-mentally, about place value. The “rules” about moving thedecimal place when multiplying and dividing by powers of
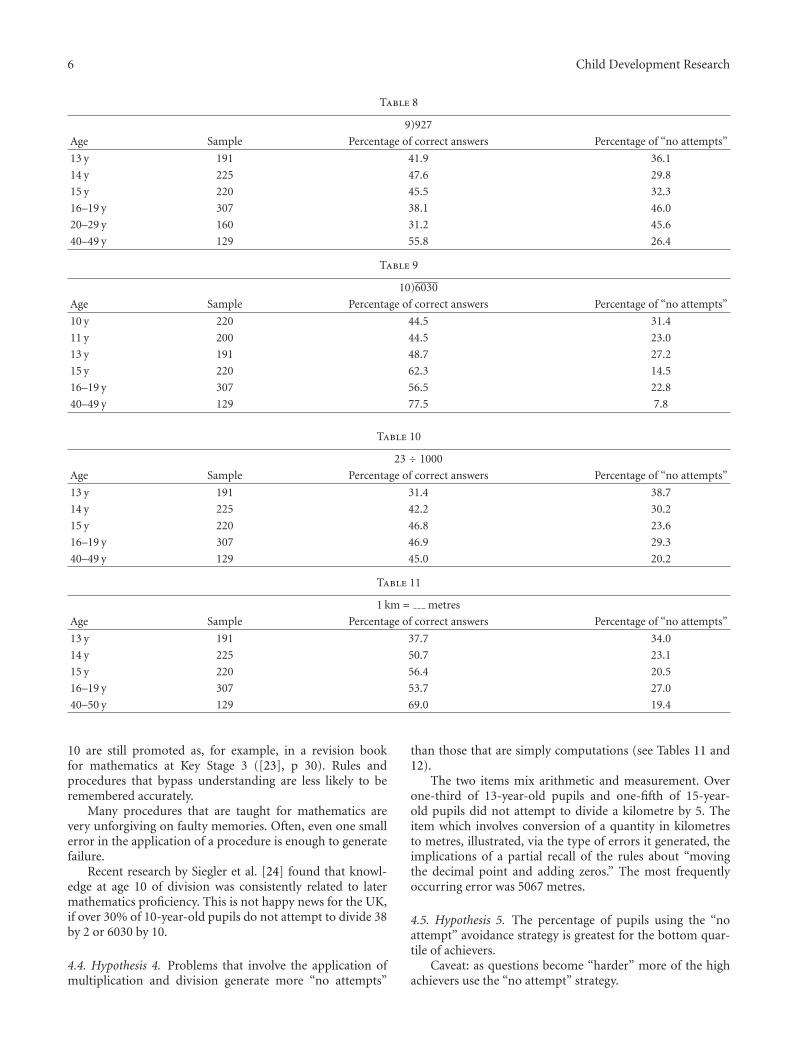
6 Child Development Research
Table 8
9)927
Age Sample Percentage of correct answers Percentage of “no attempts”
13 y 191 41.9 36.1
14 y 225 47.6 29.8
15 y 220 45.5 32.3
16–19 y 307 38.1 46.0
20–29 y 160 31.2 45.6
40–49 y 129 55.8 26.4
Table 9
10)6030
Age Sample Percentage of correct answers Percentage of “no attempts”
10 y 220 44.5 31.4
11 y 200 44.5 23.0
13 y 191 48.7 27.2
15 y 220 62.3 14.5
16–19 y 307 56.5 22.8
40–49 y 129 77.5 7.8
Table 10
23 ÷ 1000
Age Sample Percentage of correct answers Percentage of “no attempts”
13 y 191 31.4 38.7
14 y 225 42.2 30.2
15 y 220 46.8 23.6
16–19 y 307 46.9 29.3
40–49 y 129 45.0 20.2
Table 11
1 km = metres
Age Sample Percentage of correct answers Percentage of “no attempts”
13 y 191 37.7 34.0
14 y 225 50.7 23.1
15 y 220 56.4 20.5
16–19 y 307 53.7 27.0
40–50 y 129 69.0 19.4
10 are still promoted as, for example, in a revision bookfor mathematics at Key Stage 3 ([23], p 30). Rules andprocedures that bypass understanding are less likely to beremembered accurately.
Many procedures that are taught for mathematics arevery unforgiving on faulty memories. Often, even one smallerror in the application of a procedure is enough to generatefailure.
Recent research by Siegler et al. [24] found that knowl-edge at age 10 of division was consistently related to latermathematics proficiency. This is not happy news for the UK,if over 30% of 10-year-old pupils do not attempt to divide 38by 2 or 6030 by 10.
4.4. Hypothesis 4. Problems that involve the application ofmultiplication and division generate more “no attempts”
than those that are simply computations (see Tables 11 and12).
The two items mix arithmetic and measurement. Overone-third of 13-year-old pupils and one-fifth of 15-year-old pupils did not attempt to divide a kilometre by 5. Theitem which involves conversion of a quantity in kilometresto metres, illustrated, via the type of errors it generated, theimplications of a partial recall of the rules about “movingthe decimal point and adding zeros.” The most frequentlyoccurring error was 5067 metres.
4.5. Hypothesis 5. The percentage of pupils using the “noattempt” avoidance strategy is greatest for the bottom quar-tile of achievers.
Caveat: as questions become “harder” more of the highachievers use the “no attempt” strategy.

Child Development Research 7
Table 12
5.67 km = metres
Age Sample Percentage of correct answers Percentage of “no attempts”
13 y 191 36.6 43.5
14 y 225 44.4 32.4
15 y 220 50.9 25.5
16–19 y 307 45.0 39.4
40–50 y 129 54.3 27.9
Table 13
All BQ TQ BQ/All PC
10 years
2)38 30.5 18.2 1.0 60.0 59.1
10)6030 31.4 18.2 1.0 58.0 44.5
13 years
2)38 27.2 17.3 0.5 63.5 60.7
10)6030 27.2 17.8 0 65.4 48.7
15 years
2)38 13.2 8.2 0 62.1 75.0
10)6030 14.1 10.0 0 71.0 62.3
4.8 + 5.21 + 6 12.3 9.1 0 74.0 55.4
541 × 203 17.3 8.6 1.8 49.7 38.2
(2/5) + (3/8) 29.1 13.2 0.5 45.4 37.3
9)927 33.6 17.7 0.5 52.7 45.5
All: for all students.BQ: for the bottom quartile of total score.TQ: for the top quartile of total score.BQ/All: percentage of no attempts for the bottom quartile compared to all no attempts (for example, for 2)38 for pupils of 10 years, 60.0% of the “no attempts”were from the bottom quartile of students).PC: percentage of correct answers.
The “no attempts” for two items from the 15-minute testwere analysed for the bottom quartile of scores, the top quar-tile, and for all scores. The main focus was on the divisionitems 2)38 and 10)6030.
The students in the bottom quartile of achievers werecontributing a high proportion of the no attempts (seeTable 13). When the percentage of that contribution dropsbelow 50% the questions generate correct scores below 40%,suggesting that a larger number of the more able childrenare being dragged into the “no attempt” behaviour whenquestions become less straightforward. A related conclusionwas reached by Ashcraft and Krause [17] in a study on 80undergraduates, which investigated the correlation betweenmath performance and math anxiety. The lower achievementof the undergraduates who were math-anxious seemedlimited to more difficult math which is described as mathtaught at or after late elementary school.
5. Summary
Poor achievement levels in mathematics for a significantpercentage of the population have been an issue in the UK
for decades [25]. The data presented in this paper supportsa number of hypotheses, which combine to suggest a finalhypothesis, that is, that too many children and adults giveup on mathematics learning by withdrawing from any taskthat is perceived as likely to result in failure, which in turnbecomes a pervasive attitude. The withdrawal strategy avoidsthe learner being judged as wrong and thus adding to theirsense of helplessness. Some of the demands of mathematicsthat contribute to a sense of failure, anxiety, and helplessnessare based on beliefs, rather than academic necessity. Thesebeliefs also have an effect on the way mathematics is taughtwith a focus on the curriculum whilst overlooking thecharacteristics of the learners.
The combination of “no attempts” and incorrect answersfor many of the examples used above is not indicative of asuccessful outcome for the mathematics curriculum and howit is taught in the UK.
Finally, a 12-year-old student summed up his experiencesof mathematics teaching as, “All I hear is talking, talking.It’s a river.” Perhaps it is time to challenge some of themathematics beliefs that have a profound influence on theway the subject is perceived and taught and give more focusto how learners learn.

8 Child Development Research
References
[1] M. Ashcraft, E. P. Kirk, and D. Hopko, “On the cognitive con-sequences of mathematics anxiety,” in The Development ofMathematical Skills, C. Donlan, Ed., Hove, The PsychologicalCorporation, 1998.
[2] R. R. Skemp, The Psychology of Learning Mathematics, Pen-guin, Hardmondsworth, UK, 1971.
[3] I. Lundberg and G. Sterner, “Reading, arithmetic, and taskorientation—how are they related?” Annals of Dyslexia, vol.56, no. 2, pp. 361–377, 2006.
[4] J. Hattie, Visible Learning: A Synthesis of over 800 Meta-Analyses Relating to Achievement, Routledge, Abingdon, UK,2009.
[5] M. C. O’Connor and S. V. Paunonen, “Big Five personalitypredictors of post-secondary academic performance,” Person-ality and Individual Differences, vol. 43, no. 5, pp. 971–990,2007.
[6] C. S. Dweck, Self-Theories, Psychology Press, Philadelphia, Pa,USA, 2000.
[7] M. Seligman, Learned Optimism, Vintage Books, New York,NY, USA, 2006.
[8] S. Chinn, The Trouble with Maths: A Practical Guide to HelpingLearners with Numeracy Difficulties, Routledge, Abingdon,UK, 2nd edition, 2012.
[9] D. Mtetwa and J. Garofalo, “Beliefs about mathematics: anoverlooked aspect of student difficulties,” Academic Therapy,vol. 24, no. 5, pp. 611–618, 1989.
[10] P. Ernest, The Psychology of Learning Mathematics, LambertAcademic Publishing, Saarbrucken, Germany, 2011.
[11] R. Porkess et al., “A world-class mathematics education forall our youngpeople,” 2011, http://www.conservatives.com/.../Vorderman%20maths%20report.ashx .
[12] S. Chinn, More Trouble with Maths: A Complete Guide toIdentifying and Diagnosing Mathematical Learning Difficulties,Routledge, Abingdon, UK, 2012.
[13] M. V. Covington, Making the Grade: A Self-Worth Perspectiveon Motivation and School Reform, CUP, Cambridge, UK, 1992.
[14] S. Chinn, “Mathematics anxiety in secondary students inEngland,” Dyslexia, vol. 15, no. 1, pp. 61–68, 2009.
[15] A. Dowker, Individual Differences in Arithmetic, Hove, Psy-chology Press, 2005.
[16] M. H. Ashcraft, J. A. Krause, and D. R. Hopko, “Is mathanxiety a mathematical learning disability?” in Why is Mathso Hard for Some Children? The Nature and Origins ofMathematical Learning Difficulties and Disabilities, M. M. M.Mazzocco and D. B. Berch, Eds., Brookes, Baltimore, Md, USA,2007.
[17] M. H. Ashcraft and J. A. Krause, “Working memory, mathperformance, and math anxiety,” Psychonomic Bulletin andReview, vol. 14, no. 2, pp. 243–248, 2007.
[18] R. Hembree, “The nature, effects and relief of mathematicsanxiety,” Journal for Research in Mathematics Education, vol.21, pp. 33–46, 1990.
[19] S. J. Chinn, “A pilot study to compare arithmetic skill,”Dyslexia Review, vol. 4, pp. 4–7, 1995.
[20] J. M. Engelhardt, “Analysis of childrens’ computational errors:a qualitative approach,” British Journal of Educational Psychol-ogy, vol. 47, pp. 149–154, 1977.
[21] O. D. Hadfield and K. McNeil, “The relationship betweenMyers-Briggs personality type and mathematics anxietyamong pre-service elementary teachers,” Journal of Instruc-tional Psychology, vol. 21, no. 4, pp. 375–384, 1994.
[22] Department for Children, Schools and Families, “Getting backon track—pupils who make slow progress in Key Stage 3,” Ref.
00654-2007BKT-EN, 2007, http://www.tsm-resources.com/pdf/VordermanMathsReport.pdf.
[23] M. Chester, K. Manson, S. Little, K. Redmond et al., KS3 Mathematics: Complete Revision and Practice, Kirkby-in-Furness, Coordination Group Publications, 2004.
[24] R. S. Siegler, G. J. Duncan, P. E. Davis-Kean et al., “Earlypredictors of high school mathematics achievement,” Pyscho-logical Science, vol. 23, no. 7, pp. 691–697.
[25] S. Rashid and G. Brooks, “The levels of attainment in literacyand numeracy of 13- to 19-year olds in England, 1948–2009,”Literacy Today, vol. 32, no. 1, pp. 13–24, 2010.

Hindawi Publishing CorporationChild Development ResearchVolume 2012, Article ID 124939, 8 pagesdoi:10.1155/2012/124939
Research Article
Attitudes to Mathematics in Primary School Children
Ann Dowker,1 Karina Bennett,2 and Louise Smith2
1 Department of Experimental Psychology, University of Oxford, South Parks Road, Oxford OX1 3UD, UK2 St Hilda’s College, Cowley Place, Oxford OX4 1DY, UK
Correspondence should be addressed to Ann Dowker, [email protected]
Received 15 June 2012; Revised 24 September 2012; Accepted 8 October 2012
Academic Editor: Helga Krinzinger
Copyright © 2012 Ann Dowker et al. This is an open access article distributed under the Creative Commons Attribution License,which permits unrestricted use, distribution, and reproduction in any medium, provided the original work is properly cited.
44 Grade 3 children and 45 Grade 5 children from English primary schools were given the British abilities scales basic number skillssubtest, and a Mathematics Attitude and Anxiety Questionnaire, using pictorial rating scales to record their Self-rating for maths,Liking for maths, Anxiety about maths, and Unhappiness about poor performance in mathematics. There were few year groupdifferences in attitudes. Boys rated themselves higher than girls, but did not differ significantly in actual performance. Overall,Anxiety was not related to actual performance, but Self-rating was. This relationship between Self-rating and actual performanceseemed to develop between Grade 3 and Grade 5. Implications of the findings are discussed.
1. Introduction
Mathematics depends not only on cognitive abilities butalso on emotional factors and attitudes. Several studieshave shown that emotional factors may play a large partin mathematical performance, with mathematics anxietyplaying a particularly large role [1–3]. One possible reasonfor the negative association between mathematics anxietyand actual performance is that people who have higherlevels of math anxiety are more likely to avoid activitiesand situations that involve mathematics and, thus, haveless practice [4]. Mathematics anxiety might also influenceperformance more directly, by overloading working memory.For example, Ashcraft and Krause [5] reported that highlymath-anxious individuals had significantly lower workingmemory capacities in mathematics-related tasks than indi-viduals with low levels of mathematics anxiety.
Relationships between mathematics anxiety and perfor-mance may also be in the other direction. Poor mathematicalattainment may lead to mathematics anxiety, as a result ofrepeated experiences of failure. Indeed, there is likely to bea vicious circle, where anxiety and performance affect eachother negatively. Maloney and Beilock [6] point out thatthe development of mathematics anxiety is likely to be dueboth to social factors, such as exposure to teachers who
themselves suffer from mathematics anxiety, and to pre-existing difficulties in numerical cognition, and that thosewith initial mathematical difficulties are also likely to be morevulnerable to the negative social influences.
Although mathematics anxiety is a major focus forresearch, not all attitudes to mathematics are negative, andsome people express a strong liking for mathematics [7]. Thisseems to be particularly the case for mathematically giftedpeople [8] but is not restricted to them.
Most studies of attitudes to mathematics have involvedolder children and adults. It is particularly important toinvestigate the early development of attitudes to mathe-matics, if we are to understand the relationships betweenthese and actual performance, and if possible to prevent thedevelopment of strongly negative attitudes. The relativelyfew studies that have looked at younger children’s attitudesto mathematics have usually shown positive attitudes, withmost children claiming to like mathematics ([9–11]). How-ever, studies suggest that attitudes may deteriorate with age,especially through the secondary school period [9, 12, 13],but also within the primary age group ([10, 13]). One studyby Gierl and Bisanz [14] gave somewhat more ambiguousresults, indicating an increase in mathematics anxiety butalso an increase in liking for maths over the later elementaryschool years.

2 Child Development Research
Most studies of secondary school children and adultshave been consistent in showing actual performance inmathematics tends to be related positively to liking formathematics and to high self-ratings in mathematics, andnegatively to mathematics anxiety (e.g., [2, 5, 15–17] Lam etal., 2000 ). This is the case not only for advanced mathematicsbut for basic magnitude comparison skills [18].
Studies of the relationships between attitudes to mathsand performance in younger children have not resulted inas clear results as those for older children. Ma and Kishor[17] found that the relationships between attitudes andperformance increase with age. Cain-Caston [19] foundlittle relationship between mathematics performance andattitudes in a sample of 8- to 9-year olds. Thomas andDowker [20] (also see [10]) and Krinzinger et al. [21]found that 6- to 8-year olds’ mathematical performance wasrelated to Liking mathematics and to Self-rating of abilityin the subject, but not to anxiety. Krinzinger et al. [21]failed to find either longitudinal or concurrent relationshipsbetween anxiety and performance in young children. Onthe other hand, relationships between mathematics anxiety,other attitudes, and actual performance have been found inprimary school children in a white South African community[22], in New Zealand [23], and in several studies in theUnited States ([24–27]).
It is thus possible that the relationships between attitudesand performance become clearer in the later primaryyears. The present study aimed to examine relationshipsbetween mathematical performance, mathematics anxiety,unhappiness over poor performance, liking for mathematics,and self-rating in mathematics in children of midprimary age(Grade 3; age 7-8) and later primary age (Grade 5; age 9 to10).
On the basis of the earlier studies using a similar method[20, 21], it was predicted that mathematics performancewould be related to liking mathematics and to self-ratingof ability in the subject, but not to anxiety. It was alsopredicted, especially on the basis of Thomas and Dowker’s[20] results that there would be specific independent rela-tionships between liking mathematics and self-rating, andbetween anxiety and performance-related unhappiness, andthat otherwise there would be little correlation between theattitude variables.
Another aim was to investigate changes between Grade3 and Grade 5. It was predicted that older children mightshow more negative attitudes. We also aimed to look atwhether the relationships between the different variablesmight change between Grade 3 and Grade 5. Although anysuch analysis would have to be tentative due to reducednumbers, it was predicted that the relationships betweenmathematics performance and other attitude variables, andespecially between mathematics performance and self-rating,might not be noticeable at Grade 3 but might becomesignificant at Grade 5. This prediction is based on theassumption that children’s experiences of success and failuremight influence their attitudes toward and confidence inmathematics, and that such experiences and their effectswould become increasingly salient during the later primaryschool years.
The study also aimed to look at gender differences inmathematics performance and attitudes. Most current stud-ies suggest that females do not perform lower in mathematicsthan males, but that they do tend to rate themselves lower,and to experience more anxiety [28, 29]. The study aimed toinvestigate whether such gender differences would already bepresent in young children.
2. Method
2.1. Participants. The participants were 89 children takenfrom two state primary schools in Brentwood, Essex andone in Enfield, London. They were selected randomly fromthe third- and fifth-grade classes in these schools. Thesewere nonselective schools with varied intakes, but situated inpredominantly relatively middle-class areas. They included44 children (21 boys and 23 girls) in Grade 3 and 45 children(21 boys and 24 girls) in Grade 5. The Grade 3 children had amean age of 90.1 months (s.d. 3.48) and the Grade 5 childrenhad a mean age of 112.39 months (s.d. 6.51).
2.2. Materials and Procedure. In order to measure theirattitudes, children completed the Mathematics Attitudes andAnxiety Questionnaire [20, 30]. The attitude questionnaireconsists of 28 questions which focused on 7 areas of maths:maths in general, written sums, mental sums, easy maths,difficult maths, maths tests, and understanding the teacher.For each item, children were asked about their Self-rating(“How good are you?”) on a scale consisting of ticks andcrosses (“very good” to “very bad”); Liking for the items(“How much do you like it?”) on a scale consisting ofsweets and wasps (“like very much” to “hate very much”);Anxiety about them (“How worried would you feel?”) ona scale of facial expressions based on Roger Hargreaves’“Mr. Men” picture-book characters Mr. Happy and Mr.Worry (“very relaxed” to “very worried”); Unhappiness atpoor performance (“How unhappy would you feel if youdid badly?”) on a scale consisting of faces with frowningor happy faces (“very unhappy” to “very happy”). Possiblerating scores for each item ranged from 1 to 5, so the totalpossible scores on each scale ranged from 7 to 35. Scoreswere calculated so that a higher score represented a morepositive attitude. Thus, the Anxiety and Unhappiness scoresrepresent relative freedom from Anxiety and Unhappiness. Inplaces where there may be ambiguity, the paper will refer to“(Non-)Anxiety” and “(Non-)Unhappiness”.
3. Results
Table 1 shows the BNS standard score and the attitude scoresaccording to gender and school year.
3.1. Effects of Gender and School Year on MathematicalPerformance and Attitude Scores. An ANOVA was carriedout with Year Group (Grade 3 versus Grader 5) and Gender(Male versus Female) as the grouping factor, and BNSstandard score and the attitude scores of Liking, Self-rating,Anxiety, and Unhappiness as the dependent variables. There

Child Development Research 3
Table 1: Maths performance and attitude scores by year group and gender.
Year group Gender BAS Basic NumberSkills standard score
Self-rating Liking (Non-)Anxiety (Non-)Unhappiness
Year 3Boys (n = 21) 109.14 (13.42) 28.9 (4.31) 25.62 (7.89) 23.19 (7.57) 22.71 (4.36)
Girls (n = 23) 112.65 (12.8) 27.26 (4.46) 24.43 (5.56) 23.0 (6.33) 21.04 (5.23)
Total year 3 (n = 44) 110.98 (13.07) 28.04 (4.42) 25.0 (6.72) 23.09 (6.87) 21.84 (4.86)
Year 5Boys (n = 21) 120.52 (13.61) 29.05 (4.76) 24.62 (8.52) 23.05 (4.86) 21.00 (4.86)
Girls (n = 24) 115.71 (16.59) 25.75 (5.56) 24.46 (5.73) 23.46 (6.21) 19.71 (5.7)
Total year 5 (n = 45) 117.96 (15.29) 27.29 (5.4) 24.53 (7.08) 23.27 (5.57) 20.31 (5.3)
Total boys (n = 42) 114.83 (14.54) 28.98 (5.56) 25.12 (8.12) 23.11 (6.28) 21.86 (4.64)
Total girls (n = 47) 114.21 (14.78) 26.49 (5.06) 24.45 (5.58) 23.23 (6.21) 20.36 (5.46)
Total (n = 89) 114.51 (14.59) 27.66 (4.93) 24.76 (6.87) 23.18 (6.21) 21.07 (5.11)
Means are given with standard deviations in brackets.
was a significant effect of Year Group on basic number skillsstandard score (F(1, 85) = 5.7; P = 0.019; ηP2 = 0.063),indicating higher scores by the Grade 5 children. There wasa significant effect of Gender on Self-rating (F(1,85) = 5.93;P = 0.018; ηP2 = 0.064), indicating higher self-rating byboys. No other effects were significant.
Because there were year group differences in BNS stand-ard score, and because the year groups differed in bothchronological age and school experience, an ANCOVAwas then carried out including BNS standard score andchronological age in months (Age ) as covariates. Again, YearGroup (Grade 3 versus Grade 5) and Gender (Male versusFemale) were the grouping factors, and BNS standard scoreand the attitude scores of Liking, Self-rating, Anxiety, andUnhappiness were the dependent variables. BNS standardscore made a significant independent contribution to thevariance in Self-rating (F(1, 83) = 6.58; P = 0.012; ηP2 =0.073). Age made a significant independent contribution toUnhappiness (F(1, 83) = 13.79; P < 0.001; ηP2 = 0.143).After controlling the effects of the covariates, Gender stillhad a significant effect on Self-rating (F(1, 83) = 5.64; P =0.02; ηP2 = 0.064). Year Group now had a significanteffect on Unhappiness (F(1, 83) = 16.38; P < 0.001; ηP2 =0.165).
3.2. Correlations between Attitudes and Mathematics Per-formance. Pearson correlation coefficients were obtainedbetween the attitude scores of Liking, Self-rating, Anxietyand Unhappiness, BNS standard score, and age in months.These are shown in Table 2.
3.3. What Attitudes Predict Mathematical Performance?Table 3 shows entry-type linear regressions on each ofthe test variables, with the other variables as predictors.First, in order to investigate more directly the influenceof attitudes on mathematical performance an entry-typelinear regression was carried out with BNS standard scoreas the dependent variable, and Liking, Self-rating, (Non-)Anxiety and (Non-)Unhappiness as the predictors. The onlysignificant predictor was Self-rating.
Similar analyses were then carried out for each of theattitude variables, with BNS standard score and the otherattitude variables as predictors.
Self-rating was predicted by all the other variables except(Non-)Anxiety; BNS standard score, (Non-)Unhappiness,and Liking were all significant independent predictors ofSelf-rating.
Liking was independently predicted by Self-rating and(Non-)Anxiety.
(Non-)Anxiety was independently predicted only by Lik-ing, though (Non-)Unhappiness almost reached significanceas a predictor (P = 0.058).
(Non-)Unhappiness was independently predicted only bySelf-rating, though, as expected from the previous analysis,(Non-)Anxiety almost reached significance as a predictor.
The same analyses were then carried out separately forthe group of third-grade children (Table 4) and the group offifth-grade children (Table 5).
The findings for third-grade children are shown inTable 4.
None of the attitude variables predicted BNS standardscore. Liking and (Non)-Unhappiness predicted Self-Rating.Self-Rating and (Non-)Anxiety predicted Liking. Self-Ratingand Liking predicted (Non-)Anxiety. Self-rating predicted(Non-)Unhappiness.
The findings for fifth-grade children are shown inTable 5.
Self-rating was the only significant predictor of BNSstandard score. Similarly, BNS standard score was the onlysignificant predictor of Self-rating, (Non-)Anxiety was theonly significant predictor of Liking, and Liking was theonly significant predictor of (Non-)Anxiety. No predictorapproached significance for (Non-)Unhappiness.
4. Discussion
The results support previous studies with primary agechildren in suggesting that attitudes to mathematics aregenerally positive in the primary age group. All attitudescores, except for (Non-)Unhappiness at poor performance,were considerably higher than the notional neutral score of 3,though questions could be raised as to whether such a rating

4 Child Development Research
Table 2: Correlations between attitude scores, British abilities scales basic number skills standard score, and age in months.
Self rating Liking (Non-)Anxiety (Non-)Unhappiness Basic NumberSkills: standard score
Age in months
Self-rating 1
Liking 0.264∗ 1
(Non-)Anxiety 0.191 0.413∗∗ 1
(Non-)Unhappiness 0.329∗∗ 0.178 0.268∗ 1
Basic Number Skills: Standard score 0.255∗ −0.1 −0.069 0.021 1
Age in months −0.055 −0.083 0.232 0.075 0.231 1
∗P < 0.05 ∗∗P < 0.01.
Table 3: Entry-type multiple regressions on British abilities scales basic number skills standard score and the attitude variables: whole group.
Regression on BasicNumber Skillsstandard score
Regression onSelf-rating
Regression onLiking
Regression on(non-)Anxiety
Regression on(non-)Unhappiness
Degrees of freedom 4 4 4 4 4
Residual 84 84 84 84 84
R2 0.106 0.484 0.226 0.211 0.159
F 2.502 6.414 6.148 5.631 3.96
P 0.048∗ 0.000∗∗ 0.000∗∗ 0.000∗∗ 0.005∗∗
Predictors:
Basic number skills —
β — 0.286 −1.415 0.034 −0.047
t — 2.973 −1.402 −0.333 −0.446
P — 0.004∗∗ 0.164 0.74 0.657
Self-rating
β 0.333 — 0.236 0.021 0.306
t 2.973 — 2.219 0.191 2.795
P 0.004∗∗ — 0.029∗ 0.849 0.006∗∗
Liking —
β −0.163 0.234 — 0.368 0.006
t −1.402 2.219 — 3.591 0.049
P 0.104 0.029∗ — 0.001∗∗ 0.961
(Non-)Anxiety
β 0.039 0.021 0.361 — 0.212
t 0.333 0.191 3.591 — 1.919
P 0.74 0.849 0.001∗∗ — 0.058
(Non-)Unhappiness
β −0.05 0.278 0.005 0.198 —
t −0.446 2.973 0.049 1.919 —
P 0.657 0.006∗∗ 0.961 0.058 —∗P < 0.05 ∗∗P < 0.01.
really does represent “neutrality”. There was little differencein attitude between Grade 3 and Grade 5, contradictingthe hypothesis that attitudes might deteriorate during thisperiod.
In this particular group, the standard scores on a stan-dardized arithmetic test were rather higher in Grade 5 than inGrade 3, giving rise to the possibility that group differences
in mathematical attainment were masking deterioration inattitudes. However, even after controlling both arithmeticstandard score and chronological age, there continued to belittle effect of year group on attitude.
The exception was (non-)Unhappiness at poor perfor-mance, where the year group effect did become significant.However, this reflected a more positive attitude in Grade 5
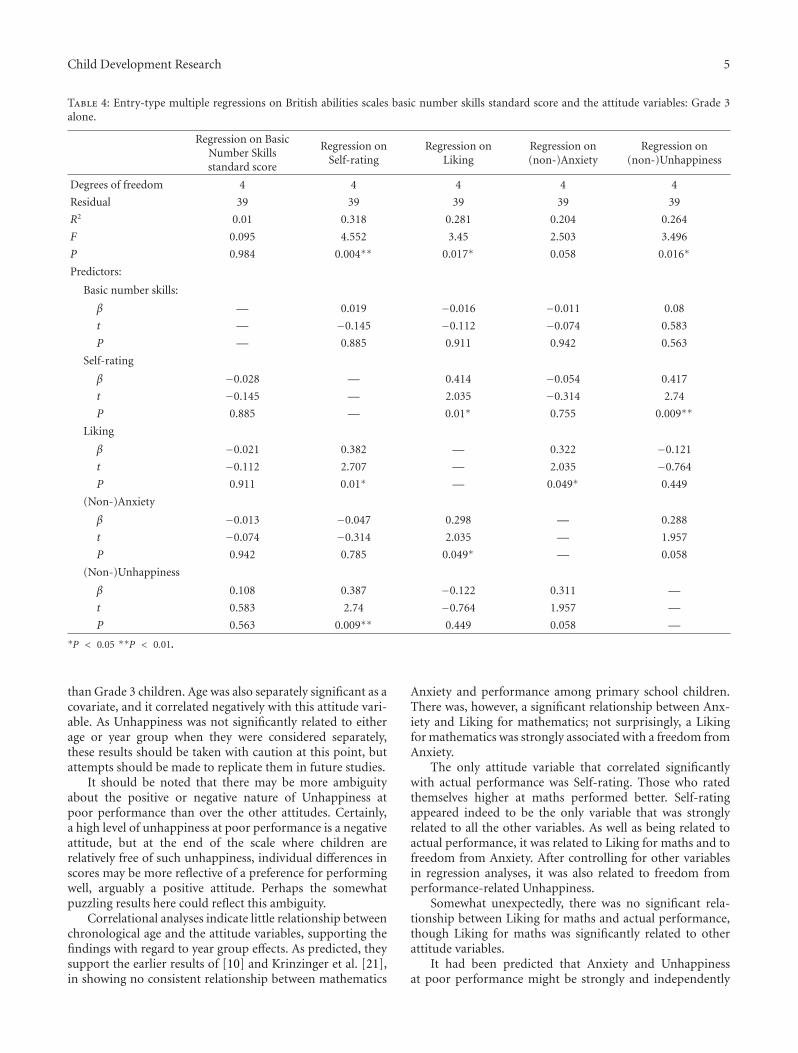
Child Development Research 5
Table 4: Entry-type multiple regressions on British abilities scales basic number skills standard score and the attitude variables: Grade 3alone.
Regression on BasicNumber Skillsstandard score
Regression onSelf-rating
Regression onLiking
Regression on(non-)Anxiety
Regression on(non-)Unhappiness
Degrees of freedom 4 4 4 4 4
Residual 39 39 39 39 39
R2 0.01 0.318 0.281 0.204 0.264
F 0.095 4.552 3.45 2.503 3.496
P 0.984 0.004∗∗ 0.017∗ 0.058 0.016∗
Predictors:
Basic number skills:
β — 0.019 −0.016 −0.011 0.08
t — −0.145 −0.112 −0.074 0.583
P — 0.885 0.911 0.942 0.563
Self-rating
β −0.028 — 0.414 −0.054 0.417
t −0.145 — 2.035 −0.314 2.74
P 0.885 — 0.01∗ 0.755 0.009∗∗
Liking
β −0.021 0.382 — 0.322 −0.121
t −0.112 2.707 — 2.035 −0.764
P 0.911 0.01∗ — 0.049∗ 0.449
(Non-)Anxiety
β −0.013 −0.047 0.298 — 0.288
t −0.074 −0.314 2.035 — 1.957
P 0.942 0.785 0.049∗ — 0.058
(Non-)Unhappiness
β 0.108 0.387 −0.122 0.311 —
t 0.583 2.74 −0.764 1.957 —
P 0.563 0.009∗∗ 0.449 0.058 —∗P < 0.05 ∗∗P < 0.01.
than Grade 3 children. Age was also separately significant as acovariate, and it correlated negatively with this attitude vari-able. As Unhappiness was not significantly related to eitherage or year group when they were considered separately,these results should be taken with caution at this point, butattempts should be made to replicate them in future studies.
It should be noted that there may be more ambiguityabout the positive or negative nature of Unhappiness atpoor performance than over the other attitudes. Certainly,a high level of unhappiness at poor performance is a negativeattitude, but at the end of the scale where children arerelatively free of such unhappiness, individual differences inscores may be more reflective of a preference for performingwell, arguably a positive attitude. Perhaps the somewhatpuzzling results here could reflect this ambiguity.
Correlational analyses indicate little relationship betweenchronological age and the attitude variables, supporting thefindings with regard to year group effects. As predicted, theysupport the earlier results of [10] and Krinzinger et al. [21],in showing no consistent relationship between mathematics
Anxiety and performance among primary school children.There was, however, a significant relationship between Anx-iety and Liking for mathematics; not surprisingly, a Likingfor mathematics was strongly associated with a freedom fromAnxiety.
The only attitude variable that correlated significantlywith actual performance was Self-rating. Those who ratedthemselves higher at maths performed better. Self-ratingappeared indeed to be the only variable that was stronglyrelated to all the other variables. As well as being related toactual performance, it was related to Liking for maths and tofreedom from Anxiety. After controlling for other variablesin regression analyses, it was also related to freedom fromperformance-related Unhappiness.
Somewhat unexpectedly, there was no significant rela-tionship between Liking for maths and actual performance,though Liking for maths was significantly related to otherattitude variables.
It had been predicted that Anxiety and Unhappinessat poor performance might be strongly and independently

6 Child Development Research
Table 5: Entry-type multiple regressions on British abilities scales basic number skills standard score and the attitude variables: Grade 5alone.
Regression on basicnumber skillsstandard score
Regression onself-rating
Regression onliking
Regression on(non)anxiety
Regression on(non)unhappiness
Degrees of freedom 4 4 4 4 4
Residual 40 40 40 40 40
R2 0.31 0.337 0.275 0.281 0.103
F 4.495 5.084 3.794 3.903 1.154
P 0.004∗∗ 0.002∗∗ 0.01∗ 0.009∗∗ 0.346
Predictors:
Basic number skills —
β — 0.522 −0.157 −0.15 −0.05
t — 3.983 −0.979 −0.939 −0.277
P — 0.000∗∗ 0.334 0.353 0.784
Self-rating
β −0.028 — 0.135 0.133 0.243
t −0.145 — 0.821 0.813 1.354
P 0.885 — 0.416 0.421 0.183
Liking
β −0.021 0.123 — 0.436 0.087
t −0.112 0.821 — 3.082 0.498
P 0.911 0.416 — 0.004∗∗ 0.621
(Non)anxiety
β −0.013 0.122 0.44 — 0.129
t −0.074 0.813 3.082 — 0.735
P 0.942 0.421 0.004∗∗ — 0.467
(Non)unhappiness
β 0.108 0.18 0.021 0.103 —
t 0.583 1.354 0.498 0.735 —
P 0.563 0.183 0.621 0.467 —∗P < 0.05 ∗∗P < 0.01.
correlated with one another but not with the other attitudevariables, and that Liking for maths and Self-rating mightbe strongly and independently correlated with one anotherbut not with the other attitude variables. This predictionwas not entirely borne out. Self-rating and Liking for mathsdid show an independent relationship, but Self-rating wasalso independently related to the other attitude variables.Liking for maths was correlated with Anxiety as well as Self-rating. There was only a weak relationship between Anxietyand performance Unhappiness, and each correlated morestrongly with other factors: Anxiety with Liking for maths,and performance Unhappiness with Self-rating.
The results of separate regression analyses for differentyear groups suggest that, although there are few age or yeargroup differences in the attitude scores themselves, theremay be some differences in the relationships between thevariables. A great deal of caution is needed in interpretingthese results, because of the reduced sample sizes in theseanalyses, resulting in relatively low statistical power. It ispossible that there were some small effects that would only
have become obvious in larger samples. However, the resultsdo support the hypothesis that the relationship between self-rating and actual performance may develop between Grade3 and Grade 5. There was no relationship between the twovariables in Grade 3 children. In Grade 3, none of theattitude variables predicted mathematical performance, andSelf-rating was predicted by Liking for maths and freedomfrom Anxiety, but not by performance. In Grade 5, bycontrast, there was a very strong and specific relationshipbetween Self-rating and actual performance. This findingmay suggest that children become more aware of theirmathematical performance in relation to that of their peersas they become older, either because of generally greaterself-awareness, or because of greater experience of tests andteacher assessments. Alternatively, or additionally, it may bethat children’s self-assessment has an increasing influence ontheir motivation, and thereby on their performance, as theyget older.
The only significant gender difference was in self-rating,where boys rated themselves higher than girls did. There

Child Development Research 7
were no gender differences in actual performance or inother attitudes. This supports findings from previous studiesthat indicate that males tend to rate themselves higher thanfemales in mathematics, although at least in recent studiesthe genders usually perform similarly. Future research shouldinvestigate whether this finding is specific to self-rating inmathematics, where it may reflect existing stereotypes aboutthe subject, or whether it might indicate generally higher self-ratings by boys in other subjects as well.
One key limitation of this study is of course thatthe sample is relatively small. It is important for futurestudies to extend both the number and the range of thesample. For example, the children in the sample wereattending schools in relatively middle-class catchment areasand, perhaps linked to this fact, were generally performingat somewhat above average levels in mathematics. Themean standard score on the basic number skills test was114.51, as compared with an assumed population meanstandard score of 100. It is possible that a lower-attaininggroup, or one including a higher proportion of childrenfrom low-SES backgrounds, might show more negativeattitudes and/or stronger relationships between attitudes andperformance.
Also, it is important to carry out cross-cultural com-parisons. This study aligns with most similar non-Americanstudies (e.g., [17, 21]), in suggesting that younger childrendo not show a significant relationship between mathematicsanxiety and actual mathematical performance, but, as indi-cated in the Introduction, most American studies have givencontrasting results (e.g., [24–26]). It would be interestingto investigate whether there is some difference in culturalattitudes or in methods of mathematics education thatcontributes to this disparity. It would also be desirable toinvestigate young children’s attitudes to mathematics in awider variety of cultures.
It could be argued that a questionnaire measure is notideal as a sole measure of attitudes in young children, orperhaps in any group. In future studies, it would be desirableto include other measures: for example implicit attitudetests [31], behavioural measures such as children’s responseswhen given a choice between activities with and withoutmathematical content, and perhaps physiological indicatorsof anxiety. It would also be desirable to use a wider varietyof mathematics tests, in particular, to use tests of mental aswell as written arithmetic, as the former is more likely tobe affected by the increased load that anxiety may place onworking memory ([5, 25]).
Despite such potential limitations, the study yields someimportant conclusions. Young children appear to showrelatively positive attitudes to mathematics, though a largersample of different ages would be needed to confirm this.They show little relationship between mathematics anxietyand mathematical performance, but they do show a rela-tionship between self-rating and mathematical performance,which seems to develop during the later primary years.There are also significant relationships between self-ratingand other attitudes. It is thus arguable that self-rating, ratherthan mathematics anxiety, is the key factor in the primaryschool age group, and that perhaps researchers on younger
children’s attitudes to mathematics should focus more onself-rating.
References
[1] M. Baloglu and R. Kocak, “A multivariate investigation of thedifferences in mathematics anxiety,” Personality and IndividualDifferences, vol. 40, no. 7, pp. 1325–1335, 2006.
[2] R. Hembree, “The nature, effects, and relief of mathematicsanxiety,” Journal For Research in Mathematics Education, vol.21, no. 1, pp. 33–46, 1990.
[3] H. Miller and J. Bichsel, “Anxiety, working memory, gender,and math performance,” Personality and Individual Differ-ences, vol. 37, no. 3, pp. 591–606, 2004.
[4] M. H. Ashcraft, “Math anxiety: personal, educational, andcognitive consequences,” Current Directions in PsychologicalScience, vol. 11, no. 5, pp. 181–185, 2002.
[5] M. H. Ashcraft and J. A. Krause, “Working memory, mathperformance, and math anxiety,” Psychonomic Bulletin andReview, vol. 14, no. 2, pp. 243–248, 2007.
[6] E. A. Maloney and S. Beilock, “Math anxiety: who has it, whyit develops, and how to guard against it,” Trends in CognitiveSciences, vol. 16, no. 8, pp. 404–406, 2012.
[7] J. Evans, Adults’ Mathematical Thinking and Emotions: A Studyof Numerate Practices, Routledge, London, UK, 2000.
[8] V. A. Krutetskii, The Psychology of Mathematical Abilitiesin Schoolchildren, University of Chicago Press, London, UK,1976.
[9] P. Blatchford, “Pupils’ views on school work and school from7 to 16 years,” Research Papers in Education, vol. 11, no. 3, pp.263–288, 1996.
[10] A. Dowker, Individual Differences in Arithmetic: Implicationsfor Psychology, Neuroscience and Education, Psychology Press,New York, NY, USA, 2005.
[11] B. Tizard, P. Blatchford, J. Burke, C. Farquhar, and I. F. Plewis,Young Children at School in the Inner City, Erlbaum, London,UK, 1988.
[12] P. Mortimore, School Matters: The Junior Years, Open Books,Wells, UK, 1988.
[13] A. Wigfield and J. L. Meece, “Math anxiety in elementary andsecondary school students,” Journal of Educational Psychology,vol. 80, no. 2, pp. 210–216, 1988.
[14] M. J. Gierl and J. Bisanz, “Anxieties and attitudes relatedto mathematics in grades 3 and 6,” Journal of ExperimentalEducation, vol. 63, no. 2, pp. 139–158, 1995.
[15] L. R. Aiken, “Two scale of attitude toward mathematics,”Journal For Research in Mathematics Education, vol. 5, no. 2,pp. 67–71, 1974.
[16] H. Z. Ho, D. Senturk, A. G. Lam et al., “The affective andcognitive dimensions of math anxiety: a cross-national study,”Journal for Research in Mathematics Education, vol. 31, no. 3,pp. 362–379, 2000.
[17] X. Ma and N. Kishor, “Assessing the relationship between atti-tude toward mathematics and achievement in mathematics: ameta-analysis,” Journal for Research in Mathematics Education,vol. 28, no. 1, pp. 26–47, 1997.
[18] E. A. Maloney, D. Ansari, and J. A. Fugelsang, “The effectof mathematics anxiety on the processing of numericalmagnitude,” Quarterly Journal of Experimental Psychology, vol.64, no. 1, pp. 10–16, 2011.

8 Child Development Research
[19] M. Cain-Caston, “Parent and student attitudes toward mathe-matics as they relate to third grade mathematics achievement,”Journal of Instructional Psychology, vol. 20, no. 2, pp. 96–101,1993.
[20] G. Thomas and A. Dowker, “Mathematics anxiety and relatedfactors in young children,” in Proceedings of the British Psycho-logical Society Developmental Section Conference, Bristol, UK,September 2000.
[21] H. Krinzinger, L. Kaufmann, and K. Willmes, “Math anxietyand math ability in early primary school years,” Journal ofPsychoeducational Assessment, vol. 27, no. 3, pp. 206–225,2009.
[22] K. Newstead, “Aspects of children’s mathematics anxiety,”Educational Studies in Mathematics, vol. 36, no. 1, pp. 53–71,1998.
[23] J. Young-Loveridge, The Development of Children’s NumberConcepts from Ages Five to Nine, Early Mathematics Learn-ing Project, Education Department, University of Waikato,Hamilton, New Zealand, 1991.
[24] J. A. Dossey, I. V. S. Mullis, M. M. Lindquist, and D. L.Chambers, The Mathematics Report Card. Are We Measuringup? Trends and Achievement Based on the 1986 NationalAssessment, Educational Testing Service, Princeton, NJ, USA,1988.
[25] G. Ramirez, E. A. Gunderson, S. C. Levine, and S. L. Beilock,“Math anxiety, working memory and math achievement inearly elementary school,” Journal of Cognition and Develop-ment. In press.
[26] S. S. Wu, M. Barth, H. Amin, V. Malcarne, and M. Vinod,“Math anxiety in second and third graders and its relationto mathematical achievement,” Frontiers in DevelopmentalPsychology, vol. 3, p. 162, 2012.
[27] C. B. Young, S. S. Wu, and V. Menod, “The neurodevelop-mental basis of math anxiety,” Psychological Science, vol. 23,pp. 492–501, 2012.
[28] A. Devine, K. Fawcett, D. Szucs, and A. Dowker, “Gen-der differences in mathematics anxiety and the relation tomathematics performance while controlling for test anxiety,”Behavioral and Brain Functions, vol. 8, article 33, 2012.
[29] N. M. Else-Quest, J. S. Hyde, and M. C. Linn, “Cross-national patterns of gender differences in mathematics: ameta-analysis,” Psychological Bulletin, vol. 136, no. 1, pp. 103–127, 2010.
[30] H. Krinzinger, L. Kaufmann, A. Dowker et al., “Deutsch-sprachige Version des Fragebogens fur Rechenangst (FRA) fur6- bis 9-jahrige Kinder,” Zeitschrift fur Kinder und Jugendpsy-chiatrie und Psychotherapie, vol. 35, no. 5, pp. 341–351, 2007.
[31] O. Rubinsten and R. Tannock, “Mathematics anxiety in child-ren with developmental dyscalculia,” Behavioral and BrainFunctions, vol. 6, article 46, 2010.

Hindawi Publishing CorporationChild Development ResearchVolume 2012, Article ID 813920, 11 pagesdoi:10.1155/2012/813920
Research Article
Instructional Quality and Attitudes toward Mathematics: DoSelf-Concept and Interest Differ across Students’ Patterns ofPerceived Instructional Quality in Mathematics Classrooms?
Rebecca Lazarides and Angela Ittel
Department of Educational Psychology, Institute of Education, Berlin Institute of Technology, Franklinstraße 28/29,10587 Berlin, Germany
Correspondence should be addressed to Rebecca Lazarides, [email protected]
Received 19 May 2012; Accepted 9 October 2012
Academic Editor: Helga Krinzinger
Copyright © 2012 R. Lazarides and A. Ittel. This is an open access article distributed under the Creative Commons AttributionLicense, which permits unrestricted use, distribution, and reproduction in any medium, provided the original work is properlycited.
Using a person-centered research approach, the present study explored individual differences in students’ perceptions ofinstructional quality in secondary school mathematics classes and their relations to students’ self-concept and interest inmathematics. Drawing on data collected from 425 high school students from ten schools in Berlin, Germany (male: 53.2%; female:46.3%), latent class analyses (LCA) revealed four distinct patterns of perceived quality of instruction. Almost half of the sample(46%) had a high likelihood of perceiving an overall low quality in mathematics classes. Those students reported particular lowself-concept and interest in mathematics. Compared to male students, female students were significantly more likely to belong tothis “challenging pattern.” Consequences for educational practice are discussed and suggest that instruction in mathematics shouldtake into account learners’ highly individual ways of perceiving and evaluating their learning environment.
1. Introduction
After major international large scale assessments on edu-cational performance such as the Programme for Interna-tional Student Assessment (PISA) revealed low to averageperformance of German students in mathematics and sciencecompared to other participating countries, the enhancementof learning success and later professional careers in theSTEM-disciplines (STEM = science, technology, engineering,and mathematics) have been prioritized in educational policy[1, 2]. Attitudinal and affective variables such as mathematicsself-concept and interest were shown to be central tostudents’ achievement in mathematics [3]. Mathematicsself-concept, which is broadly defined as a persons’ self-related perceptions in the area of mathematics that areformed through experience with others and one’s owninterpretations of their environment [4], is reciprocallyrelated to achievement in mathematics and positively relatedto course choice in mathematics domains during upper-secondary education [5, 6]. Another key factor for students’
learning is students’ interest in mathematics, which is shownto be related to achievement goals in mathematics classes andmathematics-related career choices [7, 8]. Students who areinterested in mathematics enjoy engaging in math, tend toreengage in mathematical contents, and view mathematics asimportant for their individual development [9].
Both self-concept and interest in mathematics are influ-enced by educational settings and teaching styles. Researchsuggests that particular aspects of instructional quality inmathematics classrooms such as classroom management,classroom climate, and cognitive activation relate to stu-dents’ attitudes and emotions concerning mathematics [10–12]. Although a vast number of previous studies considercharacteristics of instruction and their impact on learning[13–16], individual differences in students’ perceptions ofinstructional quality in their mathematics classrooms areexplored less frequently. However, it is important to addressindividual differences as students’ learning success dependshighly on the level of adaptability of learning environmentsto students’ individual needs [17, 18]. Subsequently, in

2 Child Development Research
the current study, we explored distinct student patternsof perceived instructional quality in mathematics classes.Thereby, the aim of this research was to analyze whetherstudents’ self-concept and interest in math differ acrossdistinct student patterns. As empirical studies suggest thatdemographic variables such as age and gender are relatedto students’ perceptions of instructional quality in mathe-matics classrooms [19, 20], we considered in our analysisassociations between these demographic characteristics andstudents’ patterns of perceived instructional quality.
2. Characteristics of Instructional QualityMathematics Self-Concept and Interest
Referring to a cognitive perspective of learning, researchon instructional quality conceptualizes learning as a self-determined, constructive, and self-regulated process of con-ceptual growth, which is supported or undermined byperceived learning conditions and shaped by a dynamicinterplay among personal, behavioral, and environmentalfactors [21–23]. Thus, a high level of instructional quality oflearning environments is seen as a prerequisite to enhancedlearning outcomes depending on students’ subjective per-ceptions, preknowledge, and internal structures of cognitiveprocessing [24, 25]. Based on related theoretical frameworkssuch as self-determination theory (SDT; [26]), researchconcerning relations between learning environments andstudents’ motivation often focuses on students’ individualperceptions of their learning environment [13, 27, 28].SDT suggests that learning conditions that lead to thefulfillment of students’ basic psychological needs for auton-omy, competence, and social relatedness facilitate students’intrinsic motivation. Thus, related research highlights stu-dents’ individual experiences in their learning environments.Conversely, research on effective teaching strategies oftenconsiders students’ perceptions aggregated on class level [16,29]. Using aggregate measures of classroom context refers toinstructional quality as an objective criterion of the learningenvironment that is perceived by all students within one classin a similar way [30]. However, it highly depends on theaims of research as to which conceptualization of instruc-tional quality is most appropriate. Lutdke et al. [31] pointout that assessing characteristics of learning environmentswith data aggregated at the group level focuses on differ-ences between learning environments, while assessing stu-dents’ personal perceptions focuses on differences betweenstudents. Concerning motivational learning outcomes, itis unclear which conceptualization is most appropriate.Clausen [32] highlights that students’ perceptions aggregatedat the class level are valid indicators of teaching behavioursand are highly related to students’ motivational learningoutcomes. However, Kunter et al. [30] highlighted that thevalidity of mean ratings as descriptions of the learningenvironment might be questioned. Their results indicatedthat mean ratings of classroom management strategies wereunrelated to the change in students’ interest in mathematicsfrom grade 7 to grade 8, while individual perceptions ofclassroom features were highly related to students’ change
in interest. Referring to this theoretical and empiricalwork, the present study aimed to examine how students’individually experience the instructional quality in theirclassrooms. To this end, we questioned which subtypes ofindividual perceptions of instructional quality exist, howgender and age are related to potential subtypes, and howthe subtypes differ in terms of motivational and attitudinallearning outcomes. Thus, we focused on students’ individualperceptions rather than on data aggregated at the class level.Appropriate to the aims of the present study, person-centeredresearch approaches such as Latent Class Analysis (LCA)allow the distinction of specific homogenous subgroups ofstudents within a heterogeneous total population of students[33].
Regarding the question of how instructional quality isdefined, three basic dimensions which structure the array ofsingle characteristics of teaching and classroom componentshave emerged consistently as being crucial for motivationallearning outcomes in mathematics [12, 34, 35]. Although theterminology used varies [36], the three basic dimensions are(1) classroom management, (2) supportive climate, and (3)cognitive activation. Our study enlists single characteristicsof instruction assigned to these three dimensions as indica-tors of instructional quality in mathematics classes.
The basic dimension of classroom management typicallyrefers to an efficient classroom and time management orlow levels of disruptive student behavior [36, 37]. Recentempirical studies furthermore outline high levels of clarityand structuredness of teachers’ instruction as importantcomponents of an effective classroom management [12,38]. An efficient classroom management characterized byhigh structuredness and clarity of instruction is a salientpredictor of students’ interest in mathematics classes [16].Theoretically, research related to self-determination theory[26] revealed that effective classroom management enhancesstudents’ experience of intrinsic need satisfaction and thusfacilitates students’ interest [28, 30, 39].
The basic dimension of supportive climate includesfeatures of teacher-student interaction such as supportiveteacher-student relationships, caring and attentive teacherbehavior, or constructive feedback [18]. Based on social com-parison theory [40], research has shown that students’ self-concepts are highly influenced by their social environmentand the social comparisons provided by this environment[41]. Langford et al. [42] point out, for example, thatperceived social support leads to more accurate perceptionsof normative peers [43]. Sarason and colleagues [43] proposethat low-perceived social support may encourage downwardsocial comparisons. Perceived social support further leads tothe experience of relatedness to others, whereby facilitatingstudents’ intrinsic motivation [39, 44]. Thus, studies showthat the degree to which students’ perceive teacher supportin class plays a critical role in the development of students’self-concept and interest in mathematics [13, 14].
The basic dimension of cognitive activation refers tocharacteristics of instruction, which promote students’ con-ceptual understanding by including, for example, challeng-ing tasks or enhancing different solution strategies andnonroutine problem solving [17]. Additionally, discursive

Child Development Research 3
effectiveness, which refers to students’ opportunity to co-construct knowledge by participating in mathematics class-room discourse, is viewed as a mechanism to activatecognitive processing [18, 45]. Participating in cognitivelychallenging classroom discourse facilitates students’ emo-tional well-being [46] and thus is linked to students’ interestin mathematics classrooms [15] and students’ mathematicsself-concept [47].
Concerning the relation between perceived character-istics of instructional quality in math and science classesand motivational learning outcomes, Eccles and colleagues[20] suggest in their stage-environment-fit approach thatthe consistent developmental decline of attitudinal andmotivational-affective learning outcomes during junior highschool [10, 16, 48] results from a mismatch between theneeds of developing adolescents and the opportunitiesafforded to them by their learning environments. However,research has shown that distinct subtypes of students existdespite this general decline, ranging from students with over-all positive characteristics (e.g., high self-concept of abilityand interest) to students with “challenging” characteristics(e.g., low self-concept of ability and interest) [49]. Seidel[49] reveals that the differences in students’ motivationallearning outcomes relate to perceived learning conditionsin mathematics classrooms such as instructional clarityand interaction with the teacher. Based on a theoreticalconceptualization of learning as a self-directed process, inwhich teachers provide learning opportunities that must beperceived and utilized by students [17, 50], in the presentstudy we expected to find distinct student subtypes withrespect to perceived instructional quality corresponding tothe subtypes of motivational learning outcomes as shown bySeidel [49]. Thus, we expected to find a subtype of learnerswith overall positive perceptions of the characteristics ofinstructional quality in math class. We expected furtherto find another extreme subtype of students with overallnegative perceptions of the instructional quality in mathclass. As it is well known that single characteristics ofinstructional quality, such as perceived structuredness andautonomy support, are independent learning factors that canbe complementary [51], we expected to find mixed subtypesof students’ perceived characteristics of instructional qualitystructuredness of teachers’ instruction, teachers’ social support,and discursive effectiveness.
In the present study, we controlled for gender and ageeffects in the latent-class models. Previous studies revealedthat gender has been shown to be related to learning environ-ment perceptions [52] as well as to mathematics self-conceptand interest [10, 53]. Ditton [19], for example, showedthat male students evaluate their mathematics teachers’performance more positively than their female classmates.Furthermore, age was shown to be related to students’ per-ceptions of the instructional quality in mathematics classes.Eccles and colleagues [20] suggest that negative learning-related changes in adolescence as in, for example, the declineof students’ self-competence beliefs and interest in math andscience [54, 55] results from an increasing mismatch betweenadolescent students’ needs and the opportunities affordedto them by their classrooms. Referring to these results, the
present study tested for relations between gender and ageand students’ pattern of perceived quality of instruction inmathematics classes. Instructional quality and attitudinaland affective variables were assessed using student self-reportscales. Compared to objective descriptions of instructionalquality, student ratings offers a range of conceptual advan-tages such as a high reliability due to students’ extensiveexperiences with different teachers and experiences withthe same teacher in different domains [31]. However, inparticular, students’ subjective perceptions of their learningenvironment were shown to be highly predictive for moti-vational learning outcomes [30]. In her multilevel study,Daniels [16] revealed that students’ perceived structurednessin mathematics classrooms influences mathematics interestat the individual and class level. However, the effect wasconsiderably stronger at the individual level. Frenzel et al.[29] conclude from their data that the relationships betweenperceived quality of instruction in mathematics classroomsand students’ emotional experiences in class predominantlyfunction at the individual level and not at the level ofaveraged classroom experiences. Although a large volume ofresearch examines the relations between instructional qualityand factors of students’ learning, nearly no empirical studiesfocus on students’ distinct patterns of perceived instructionalquality as rated by students themselves. Referring to thehigh importance of students’ subjective experiences in theirlearning environments for successful learning processes [16,29, 30] there is an urgent need for explorative studieson students’ individual patterns of perceived instructionalquality and their associations to students’ learning.
3. Research Questions
Based on the theoretical state of research and previousempirical results, the present study addressed the followingexplorative research questions.
(a) What distinct student patterns can be identifiedwith respect to perceived levels of characteristics ofinstructional quality (structuredness, teachers’ socialsupport, and discursive effectiveness) in secondaryschool mathematics classes?
(b) How do the demographic characteristics gender andage relate to patterns of instructional quality in math?
(c) Do the attitudinal and affective variables mathematicsself-concept and interest differ significantly across thedistinct patterns of instructional quality in mathe-matics classes?
4. Method
4.1. Participants and Procedure. The sample included 425high school students (grades 8 through 10) from 21 class-rooms from ten schools in Berlin, Germany. Each classroomhad a different teacher. The mean age of the participatingmale (53.2%) and female (46.3%) students was 14.93 years(SD = 1.04; age range: 13–17). The majority of participants(54.6%, n = 232) reported that they and both of their parents

4 Child Development Research
were born in Germany. Students’ participation was voluntaryand required parental consent if students were under 14 yearsold, following the research principles of the Berlin SenateAdministration for Education, Science and Research. Therecruitment procedure consisted of sending letters addressedto the students and their parents explaining the aims andprocedure of the study and requested students’ participation.Trained research assistants introduced the students to thequestionnaire, which they completed in approximately 45minutes during their mathematics class.
4.2. Measures. All items assessing instructional quality,described in more detail below, were divided into binaryitems to indicate those students’ with low to moderateratings on the perceived instructional quality characteristicsversus those children with high ratings. After examining thefactor structure using confirmatory factor analysis, itemswith high loadings on the three factors “structuredness,”“social support”, and “discursive effectiveness” (<.75) wereused as indicators for Latent Class Models.
4.2.1. Structuredness. The scale for “structuredness” assessedthe extent to which students perceived their teachers’ instruc-tions in mathematics class as well structured. Thus, the studyfocused on structuredness in terms of “a systematic approachin the design of instruction” [56, page 252]. Perceivedstructuredness was measured with a 4-item scale derivedfrom Daniels [16] (e.g., “Our teacher in mathematics usuallysummarizes everything, helping us remembering what welearned in class.”) The 4-point Likert scale ranging from 1(strongly disagree) to 4 (strongly agree) yielded good internalconsistency with Cronbachs’ α = .85.
4.2.2. Social Support. The participants’ sense of their mathe-matics teachers’ social support was measured using a 4-itemscale by Daniels [16]. An example item is “Our mathematicsteacher makes time for students who want to talk withhim/her.” The 4-point Likert scale ranging from 1 (stronglydisagree) to 4 (strongly agree) demonstrated adequate internalconsistency with Cronbachs’ α = .79.
4.2.3. Discursive Effectiveness. Students’ perception of oppor-tunities to participate in decisions concerning their learningprocess in mathematics was assessed with the 7-item scale“Feeling of discursive effectiveness” from Steinert et al. [57].An example item is “Students’ opportunities to decide thingsin class are never seriously considered by our mathematicsteacher.” Using a 4-point Likert response scale, items rangedfrom 1 (strongly disagree) to 4 (strongly agree). All items fromthe scale were negatively worded and recoded so that a higherscore indicated greater discursive effectiveness. The scaledemonstrated good internal consistency with Cronbachs’α = .83.
4.2.4. Students’ Interest in Mathematics Class. Students’interest in mathematics class was measured with a 9-itemself-report scale, based on Berger [58]. An example itemis “I value mathematics class particularly because of the
interesting topics.” The 5-point Likert-type scale ranged from1 (strongly disagree) to 5 (strongly agree). The scale displayedgood internal consistency with Cronbachs’ α = .83.
4.2.5. Self-Concept in Math Class. Students’ self-conceptin mathematics class was measured using an establishedGerman 4-item self-report scale derived from Bos et al. [59].An example item is “I’ m just not good at math.” The 4-pointLikert scale ranging from 1 (strongly agree) to 4 (stronglydisagree) was recoded so that a higher score indicated greaterself-concept in math class. The scale yielded good internalconsistency with Cronbachs’ α = 0.81.
4.3. Data Analysis. All analyses were conducted using MplusVersion 6.12 [60]. Due to the cluster sampling of the data(students’ in classrooms), and thus the nonindependenceof observations, corrections to the standard errors andchisquare test of model fit were obtained using a maximumlikelihood estimator with robust standard errors for all stepsin data analysis (Type = Complex [60]).
Steps in Data Analysis.
(1) Separate confirmatory factor analyses (CFAs) wereconducted for the 16 items of the self-report scalesstructuredness, social support, and discursive effec-tiveness, which were used as indicators for the latentclass analysis to examine the adequacy of the factorstructure and to identify problematic items (lowloadings; cross-loadings).
(2) A series of latent class analysis procedures wereconducted. The first step was to choose the optimalnumber of classes by specifying separate LCA modelswith various numbers of classes. The appropriatenumber of latent classes was evaluated based ona comparison between several statistical criteria,including Akaike information criterion (AIC: lowest)[61], Bayesian information criterion (BIC: lowest)[62], sample-size-adjusted Bayesian information cri-terion (ABIC: lowest), entropy (>.80) [63], andadjusted Lo-Mendell-Rubin Likelihood Ratio Test(LMR LRT: P value is used to determine if the null k-1 class model should be rejected in favor of the k classmodel). Suggested by a recent simulation study, wegave the most weight to model with the lowest BIC,as BIC value may provide the most reliable indicatorof true number of classes [64].
(3) As the current study explored whether gender andage were significantly associated with students’ latentclass membership, these demographic characteristicswere included as covariates in the basic model viamultinomial logistic regression.
(4) Mean differences of students’ self-reported moti-vational and cognitive learning outcomes acrossthe latent classes were tested by incorporating thecontinuous distal outcome variables students’ self -concept and interest in mathematics class into thelatent class model with covariates.

Child Development Research 5
5. Results
5.1. Confirmatory Factor Analysis. Based on the establishedmeasures, the 16 items of the three self-report scalesstructuredness, social support, and discursive effectivenesswere dichotomized and assigned to three dimensions. Afterexamining this initial model, we identified two items withmultiple factor loadings greater than 0.3 and subsequentlyremoved them from the model. The removed items consistedof one item from the social support scale (“Our math teacherusually helps us like a friend.”; M = 2.56, SD = 0.90;standardized loading on latent factor “social support” λ =1.20 and on latent factor “discursive effectiveness” λ = −.52)and one item from the discursive effectiveness scale (“Mymathematics teacher often does not listen to what I say.”,M = 2.00, SD = 0.84; standardized loading on latent factor“structuredness” λ = .36 and on latent factor “discursiveeffectiveness” λ = .47). Furthermore, due to low loadingscompared to the other items which were all greater than .80,two items were removed from the model (“Our math teacheroften says ‘We have to’ which means ‘You have to’.”, M = 2.33,SD = .96, and λ = .63; “In the end in our classroom itdepends on who is in charge.”, M = 2.13, SD = .98, andλ = .72). The final model with the remaining 12 items fit thedata well, χ2 (51) = 63.99, P > .05; CFI = .990; TLI = .987;RMSEA = .02, 90% CI [.00–.02].
5.2. Latent Class Analysis. Although the 5-class model hadthe lowest AIC- and aBIC-value, results of Nylund et al. [64]reveal that the AIC-value is not a good indicator for classenumeration for LCA models with categorical outcomes.Further, the authors propose that the BIC value moreconsistently identifies the correct model over the adjustedBIC. Thus, Nylund and colleagues [64] conclude that theBIC is the most reliable information criterion (IC) betweenAIC and aBIC information criteria for correctly identifyingthe number of classes in LCA-modeling. In our model,the LMR LRT test statistics showed the first nonsignificantP value for the 3-class model, suggesting that the 2-classmodel should not be rejected in favor of the 3-class model.However, Nylund and colleagues [64] also emphasize basedon results of their Monte Carlo simulation study that theLMR LRT test has inflated Type I error rates for LCAmodels with categorical outcomes. Thus in our study, wepreferred the BIC value as an indicator of the best model fit.As indicated by the lowest BIC-value, the four-class modelhad the best model fit. Model fit indices for the variouslatent class models are shown in Table 1. Figure 1 depictsthe class profiles. The y-axis indicates the probability ofa student rating high on the specific instructional qualityitems, which are listed on the x-axis. Latent Classes werelabeled referring to their most decisive criterion concerningstudents’ ratings on characteristics of instructional quality.Class 1 was best characterized as the “High Quality Pattern”(9.8%) given that students in this subgroup had moderate tohigh probabilities of reporting high levels of structuredness(.57–.81), high levels of social support by their teacher (.62–.78), and high levels of discursive effectiveness (.68–.86)in their mathematics classes. Class 2 was labeled as “High
Structuredness Pattern” (21.9%) and consisted of studentswho had high probabilities of reporting high to moderatelevels of structuredness of instruction in their mathematicsclasses (.45–.72), moderate to low probabilities of reportinghigh levels of social support by their mathematics teacher(.22–.43), and low probabilities of reporting high levels ofopportunities in their mathematics classes (.00–.17). Class 3was denoted as “High Social Support Pattern,” as membersof this subgroup (22.4%) displayed, aside from item “socialsupport 4” (.18), overall moderate to high probabilities offeeling supported by their mathematics teachers (.45–.59),low probabilities of reporting high levels of structuredness(.06–.13), and moderate probabilities of reporting high levelsof discursive effectiveness (.23–.43). Class 4 was the mostprevalent class (45.9%) and was characterized as “LowQuality Pattern” as students in this subgroup had lowprobabilities of reporting high levels of structuredness (.00–.04), high levels of social support by their mathematicsteacher (.00–.05), and high levels of discursive effectiveness(.00–.08) in their mathematics classes.
In a next step, we tested to which extent the groupscorresponded to individual classrooms/teachers. We therebyfocused only on both extreme patterns as they can be seenas a struggling group “Low Quality Pattern” and a no-riskgroup “High Quality Pattern”. Results of crosstab analysisrevealed significant associations between students’ groupmembership and individual classrooms/teachers [Pearsonχ2 = 169.83, df = 60, and P < .000; Cramer’s V = 0.37].Multinominal logistic regressions were conducted usingdummy-coded classrooms/teachers as independent variablesand latent class membership as dependent variable. Class4 “Low Quality Pattern” was set as reference class. Resultsrevealed that students who were in classrooms numbers 3,4, 5, 15, and 19 were significantly more likely to belong to the“High Quality Pattern” than to belong to the “Low QualityPattern” (OR3 = 4.68, P < .001; OR4 = 2.16, P < .01;OR5 = 8.69, P < .001; OR15 = 5.59, P < .05; OR19 =12.94, P < .001). Using Class 1 “High Quality Pattern”as the reference class, results indicated that students fromclassrooms numbers 3, 4, 5, 15, and 19 were significantlyless likely to belong to the “Low Quality Pattern” than to the“High Quality Pattern” (OR3 = 0.21, P < .001; OR4 = 0.46,P < .01; OR5 = 0.12, P < .001; OR15 = 0.18, P < .05;OR19 = 0.08, P < .001).
5.3. Latent Class Analysis with Covariates. The current studyexplored whether the demographic characteristics genderand age were associated with class membership by incor-porating these variables as covariates in the latent classmodels. Latent class analysis with covariates is analogousto a multinomial logistic regression approach with latentclass membership serving as categorical dependent variableand using observed covariates as independent variables [60].Class 4 “Low Quality Pattern” was set as the reference group.The model fit statistics of the LCA models with demographiccovariates are reported in Table 2. Covariates included gender(0 = male; 1 = female; male as referent) and age (centered).In the four-class model with covariates, it was shown that

6 Child Development Research
10.90.80.70.60.50.40.30.20.1
0Struc1 Struc2 Struc3 Struc4 Supp1 Supp2 Supp3 Supp4 Dis1 Dis2 Dis3 Dis4
High quality, N = 41, 9.8%
High support, N = 95, 22.4%
High structuredness, N = 93, 21.9%Low quality, N = 194, 45.9%
Figure 1: Latent class characteristics and prevalence for the four-class model.
Table 1: Model fit indices for 2–5 class solutions of students’ perceived characteristics of instructional quality with and without covariates(gender and age).
Number of classesWithout covariates With covariates
2 3 4 5 2 3 4 5
AIC 4526.28 4392.59 4320.60 4278.15 4505.44 4372.51 4298.91 4260.15
BIC 4627.47 4546.39 4527.02 4537.18 4618.70 4546.44 4533.52 4555.44
ABIC 4548.13 4425.81 4365.17 4334.09 4529.84 4409.99 4349.46 4323.78
Entropy 0.827 0.850 0.822 0.847 0.826 0.848 0.830 0.852
aLMR 0.024 0.379 0.365 0.729 0.040 1.000 1.000 1.000
Note. AIC: Akaike’s information criteria. BIC: Bayesian information criteria. ABIC: sample-size-adjusted Bayesian information criterion. aLMR LRT: Lo-Mendell-Rubin adjusted likelihood ratio test.
partial measurement noninvariance needed to be considered.Gender directly influenced the probability to rate high onthe item “social support 1” (OR = 0.51; β = −.668,SE = .257, z = −2.59, and P < .01). That is, compared tomale students, female students were significantly less likely toendorse the item “Our math teacher always has time to speakwith his students.” Concerning the associations betweendemographic characteristics and latent class membership,the results of the four-class model demonstrated that age hadno significant effect at all. Gender was significantly associatedwith students’ membership in Class 1 “High Quality Pattern”.Results demonstrated that the odds of belonging to the “HighQuality Pattern” for females were only 0.45 as high as formales (OR = 0.45; β = −.801, SE = .387, z = −2.07,and P < .05). Using an alternative parameterization forthe categorical latent variable regression with Class 1 “HighQuality Pattern” as reference class, it was shown that thechance of belonging to Class 4 “Low Quality Pattern” forfemale students was twice as high as for male students (OR =2.74; β = 1.006, SE = .364, z = 2.77, and P < .01). Agedid not relate significantly to students’ pattern of perceivedinstructional quality.
As shown in preliminary classroom-related analysis,particular classrooms were significantly related to students’group membership in the perceived “High Quality” andperceived “Low Quality” groups. Therefore, examining thequestion whether female students possibly were on average
more likely to attend classrooms which were significantlyrelated to the perceived “Low Quality Pattern,” we examinedthe associations between those classrooms numbers 3, 4, 5,15, and 19 and gender via crosstab analysis. Only classroomnumbers 15 and 19 were significantly associated withgender, indicating less female students than male studentsin classroom numbers 15 [Pearson χ2 = 4.68, df = 1,P < .05; Phi = 0.105] and 19 [Pearson χ2 = 4.49, df = 1,P < .05; Phi = 0.103]. These results suggest that females’higher chance of belonging to the “Low Quality Pattern” wasnot consistently caused by attending the classrooms with ahigh percentage of students who perceived low quality in thesample.
5.4. Mean Differences across the Latent Classes: MotivationalLearning Outcomes. Similar to an analysis of covariance(ANCOVA), we tested for mean differences across the latentclasses controlling for the covariates gender and age. Thus,we modeled a latent class analysis including the observedvariables self-concept and interest as distal outcomes andadding gender and age as covariates to the LCA modelto see how class membership predicts the distal outcomewhen controlling for the influence of covariates on the distaloutcome [65]. Further, using the “Model Test” command ofMplus, the statistical significance of mean differences of self-concept and interest was tested with Wald chi-square testsof parameter equalities by describing equality of means as

Child Development Research 7
Table 2: Class-specific means and standard errors of motivational and cognitive learning outcomes.
C1: High quality C2: High structuredness C3: High teacher support C4: Low quality
M SE M SE M SE M SE
Self-concept 3.24 0.15 3.05 0.16 2.95 0.12 2.63 0.08
Interest 3.86 0.13 3.42 0.12 3.32 0.18 3.03 0.09
restrictions on the analysis model for the Wald test [60].The class-specific means and standard errors of the distaloutcomes self-concept and interest in mathematics classesare reported in Table 2.
5.4.1. Self-Concept in Mathematics Class. Results revealedthat students who had a high probability of belonging toClass 1 (“High Quality Pattern”; M = 3.24, SE = 0.13)reported significantly higher self-concepts than students witha high probability of belonging to Class 4 (“Low QualityPattern”; M = 2.63, SE = 0.08; C1 versus C4: Wald test =15.33, df = 1, and P > .01). However, students with a highprobability of belonging to Class 4 (“Low Quality Pattern”;M = 2.63, SE = .083) reported significantly lower self-concepts in mathematics class than students in any othersubgroup (C1 versus C4: Wald test = 15.33, df = 1, andP < .001; C2 versus C4: Wald test = 7.56, df = 1, and P < .01;C3 versus C4: Wald test = 3.84, df = 1, and P < .05).
5.4.2. Interest in Mathematics Class. Results revealed thatstudents who had a high probability of belonging to Class 1(“High Quality Pattern”; M = 3.85, SE = .119) reported sig-nificantly higher values of interest in mathematics class thanstudents in any other subgroup (C1 versus C2: Wald test =6.57, df = 1, and P = .01; C1 versus C3: Wald test = 4.73,df = 1, and P < .05; C1 versus C4: Wald test = 30.24,df = 1, and P < .001). Inversely, students who had a highprobability of belonging to Class 4 (“Low Quality Pattern”;M = 3.85, SE = .119) reported significantly lower valuesof interest in mathematics class than students with a highprobability of belonging to the “High Quality” (Class 1)subgroup and students with a high probability of belongingto the “High Structuredness” (Class 2) subgroup (C4 versusC1: Wald test = 30.24, df = 1, and P < .001; C4 versus C2:Wald test = 6.78, df = 1, and P < .01).
5.4.3. Summary of Mean Differences across Classes. Theresults demonstrated that students with a high probabilityof belonging to the “High Quality Pattern” (Class 1)showed significantly higher interests than students from anyother subgroup, while students’ with a high probability ofbelonging to the “Low Quality Pattern” (Class 4) showedsignificantly lower self-concepts than students from anyother subgroup.
6. Discussion
The aim of the present study was to explore how charac-teristics of classroom instruction relate to male and femalestudents’ attitudinal and affective learning characteristics
in mathematics. To probe this question, our investigationfocused on students’ patterns of perceived instructionalquality in secondary school mathematics classes and theirrole for students’ self-concept and interest in math. Results ofLCA analyses indicated the existence of four distinct studentpatterns and, thus, suggested that students’ perception ofthe instructional quality in their classrooms is highly indi-vidualized and heterogeneous. Almost half of the studentsin the sample (about 46%) belonged to a “challengingpattern” perceiving an overall low quality of instruction(low structuredness of content, low social support by theteacher, and low discursive effectiveness). These students alsodemonstrated lower levels of mathematics self-concept thanstudents from any other subtype. Only a small percentageof students in the sample (about 10%) belonged to a groupof students who perceived high quality of instruction andalso demonstrated significantly higher levels of mathematicsself-concept and interest than students with other patternsof perceived instructional quality. Thus, results suggest thatthe impact of learning environments on students’ learningoutcomes depends highly on students’ subjective experiencesof their learning environments. The existence of distinctpatterns of students’ perceived instructional quality andtheir relations to students’ mathematics self-concept andinterest support the theoretical assumption that learningenvironments are shaped by the involved actors and theirperceptions of the learning context [66]. Thus, our resultssuggested that learning success relates to these individuallydifferent perceptions. Accordingly, results of the presentstudy suggest in line with previous research [25] thatlearning environments are processed in different ways byeach student based on demographic characteristics. Whenexamining demographic characteristics such as gender andage, which are associated with students’ perception of theirlearning environment, results revealed that gender relatedsignificantly to students’ perceived quality of instruction inmathematics. Age did not relate to students’ patterns ofperceived instructional quality.
Concerning significant associations between single class-rooms and students’ group membership, five of the twenty-one classrooms were significantly related to students’ groupmembership. Two of these five classrooms were also sig-nificantly associated with students’ gender suggesting thatfemale students’ higher probability of belonging to the“Low Quality Pattern” was not consistently due to thefact that female students in our sample had on averagepoorer teachers. Our data did not include more teacher-related information; thus we did not explore particularteacher characteristics, which might be related to students’group membership. However, for future analyses, it willbe interesting to use the subgroup-related classrooms for

8 Child Development Research
the study of micro learning environments and to analyze,for instance, characteristics of questions, tasks, and receivedfeedback within these classrooms [49].
The unique value of the present study lies in thehighlighting of the particularly high probability of femalestudents to belong to a group of students who, in com-parison to male students, were significantly more likely toperceive an overall low quality of instruction in mathe-matics classes. These results align with previous research,suggesting that female students perceive less supportivefeedback by their mathematics teachers [67] and perceivelow opportunities to participate in classroom discourse[20]. Students who belonged to this “Low Quality” patternalso reported particular low levels of self-concept in math,which is associated with negative attitudes and emotionsconcerning their mathematics classes. The findings thuspoint to the urgent necessity to examine the ways in whichthe instructional design of mathematics classrooms can bebetter adapted to more effectively meet the needs of femalestudents.
6.1. Implications for Educational Practice. As the results ofthe present study indicate that students’ perceptions oftheir learning environments are highly diverse, and thatthese different perceptions are associated with students’learning outcomes, the findings highlight the necessity oftaking into account strategies of differentiated instructionin mathematics education. Differentiated instruction allowsteachers to provide choices to the students concerningcontent, learning processes, and products by, for example,using varied resource materials, tasks, and texts or adaptingcurriculum to students’ learning processes [68]. Specifyingthese general characteristics of differentiated instruction, thetwo extreme subtypes as well as the mixed subtypes found inthe present study indicate that mathematics teachers shoulddifferentiate content, learning processes, and products byconsidering students’ different levels of perceived structured-ness, support, and discursive effectiveness. Concretely, thesevariances can be targeted through the implementation ofpractices such as diverse feedback strategies and offeringdifferently structured learning materials.
To address students’ perceptions of their learning envi-ronment effectively, teacher evaluation is highly important.The instruments used in this study might be appropriateevaluation tools for regular student surveys. However, foroptimal teacher evaluation, other aspects of instructionalquality which relate to achievement and motivation suchas task complexity or level of mathematical argumentationshould also be taken into account [34].
In the present study, it was shown that female studentsbelong, compared to male students, significantly more oftento the subtype of learners who perceive mathematics classesas (a) less structured with respect to the presentation of thediscussed content, (b) less supportive concerning teachers’behavior, and (c) allowing low levels of participation inclassroom discourse. Thus, gender-appropriate teaching inmathematics is needed to enhance female students’ positiveevaluation of their learning environment in math. According
to the presented results and the current state of research,gender-sensitive teaching strategies include the following.
(a) To facilitate structuredness of presented content inmath class by involving different learning styles fordifferent students—research on gender differences inlearning styles, for example, suggested that femalestudents tend to be reading- and-writing-basedlearners [69].
(b) To provide gender-balanced social support by theteacher—it is, for example, well known that, com-pared to male students, female students receive morenegative feedback from their teachers concerningtheir intellectual abilities [70].
(c) To foster experiences of discursive effectiveness inthe classroom by facilitating classroom discussions.Classroom discussions in mathematics can be facil-itated by talking about mathematical concepts andprocedures, introducing various discourse formatssuch as extended group discussion and allowingstudents to talk about their thinking and problemsolving [71]. Another important point is to encour-age female and male students equally to partici-pate actively in these discussions by, for example,in the classroom puzzle strategy [72]. Hanze andBerger [73], for example, revealed in their studyon teaching settings in 12th grade physics classesthat critical groups with a low-academic self-conceptsuch as female students felt clearly more competentin learning environments, which were characterizedby cooperative instruction than in the traditionalteaching setting.
6.2. Limitations. The design of the present study is cross-sectional, and subsequently, the direction of relationshipsamong the variables cannot be determined. Results donot indicate whether students’ learning outcomes or otherrelevant factors impact the pattern of perceived instructionalquality to which they belong or vice versa. As suggestedby previous longitudinal analyses [10, 16], it was assumedthat attitudinal and affective learning characteristics differdepending on students’ perceived instructional quality. How-ever, longitudinal studies are needed to conclusively deter-mine the direction of influence. Second, the measurementinstruments utilized depict only some aspects of the highlycomplex construct of instructional quality in mathematics.Further research is needed including additional character-istics of instructional quality, which are related to students’self-concept and interest in math such as challenge, sense oftask novelty, or the opportunity to engage with others [9].
6.3. Conclusions. The present study highlights the necessityof instruction in mathematics classes to take into accountlearners’ different ways of perceiving and evaluating theirlearning environment. Considering almost half of the samplein the present study had a high probability of perceiving lowstructuredness, low support, and low discursive effectivenessin their math classes and thus, particular low mathematical

Child Development Research 9
self-concept and interest, this research emphasizes thatattitudes and emotions toward mathematics should beenhanced through increased adaption of mathematics class-room instruction to students’ different learning strategiesand by considering students expectations and perceptions ofinstructional quality in classroom discussions.
Acknowledgments
This research was supported by the European Social Fund(ESF) through the Research Programme on Advanced Train-ing on Universities. The authors would like to thank theteachers and students for their participation in this paper.
References
[1] Kultusministerkonferenz, Strengthening Education in Mathand Science-Recommendation of the Standing Conference ofthe Ministers of Education and Cultural Affairs of the Laenderin the Federal Republic of Germany, http://www.kmk.org/fileadmin/veroeffentlichungen beschluesse/2009/2009 05 07-Empf-MINT.pdf, 2009.
[2] K. Neumann, H. E. Fischer, and A. Kauertz, “From pisa toeducational standards: the impact of large-scale assessmentson science education in Germany,” International Journal ofScience and Mathematics Education, vol. 8, no. 3, pp. 545–563,2010.
[3] K. Singh, M. Granville, and S. Dika, “Mathematics and scienceachievement: effects of motivation, interest, and academicengagement,” Journal of Educational Research, vol. 95, no. 6,pp. 323–332, 2002.
[4] H. W. Marsh and R. Shavelson, “Self-concept: its multifacetedhierarchical structure,” Educational Psychologist, vol. 20, no. 3,pp. 107–133, 1985.
[5] H. W. Marsh and L. F. Scalas, “Self-concept in learning:reciprocal effects model between academic self-concept andacademic achievement,” in Social and Emotional Aspects ofLearning, S. Jarvela, Ed., pp. 191–198, 2011.
[6] G. Nagy, U. Trautwein, J. Baumert, O. Koller, and J. Garrett,“Gender and course selection in upper secondary education:effects of academic self-concept and intrinsic value,” Educa-tional Research and Evaluation, vol. 12, no. 4, pp. 323–345,2006.
[7] OECD (Organization for Economic Co-operation Develop-ment), PISA, 2006: Science CompetencieS For Tomorrow’sWorld, OECD (Organization for Economic Co-operation andDevelopment), Paris, France, 2007.
[8] U. Schiefele, A. Krapp, and A. Winteler, “Interest as a predictorof academic achievement: a meta-analysis of research,” in TheRole of Interest In learnIng and Development, K. A. Renninger,S. Hidi, and A. Krapp, Eds., pp. 183–1212, Erlbaum, Hillsdale,NJ, USA, 1992.
[9] K. A. Renninger and S. Hidi, “Revisiting the conceptualiza-tion, measurement, and generation of interest,” EducationalPsychologist, vol. 46, no. 3, pp. 168–184, 2011.
[10] A. C. Frenzel, T. Goetz, R. Pekrun, and H. M. G. Watt, “Devel-opment of mathematics interest in adolescence: influences ofgender, family, and school context,” Journal of Research onAdolescence, vol. 20, no. 2, pp. 507–537, 2010.
[11] H.-Y. Chen, M. S. Thompson, J. D. Kromrey, and G. H. Chang,“Relations of student perceptions of teacher oral feedback with
teacher expectancies and student self-concept,” The Journal ofExperimental Education, vol. 79, no. 4, pp. 452–477, 2011.
[12] M. Waldis, U. Grob, C. Pauli, and K. Reusser, “The influ-ence of instructional design on domain-specific interest andachievement in mathematics,” in Design of Instruction AndInstructional Quality-Results of An International germAn-SwissVideo Study on Mathematics Classes, K. Reusser, C. Pauli, andM. Waldis, Eds., pp. 209–251, Waxmann, Muenster, Germany,2010.
[13] K. R. Wentzel, A. Battle, S. L. Russell, and L. B. Looney, “Socialsupports from teachers and peers as predictors of academicand social motivation,” Contemporary Educational Psychology,vol. 35, no. 3, pp. 193–202, 2010.
[14] M. K. Demaray, C. K. Malecki, S. Y. Rueger, S. E. Brown,and K. H. Summers, “The role of youth’s ratings of theimportance of socially supportive behaviors in the relationshipbetween social support and self-concept,” Journal of Youth andAdolescence, vol. 38, no. 1, pp. 13–28, 2009.
[15] C. Pauli and F. Lipowsky, “Participating or listening? Students’verbal contributions in mathematics classes,” Unterrichtswis-senschaft, vol. 35, no. 2, pp. 101–124, 2007.
[16] Z. Daniels, Developing Schoolbased Interests in Adolescence,Waxmann, Muenster, Germany, 2008.
[17] F. Lipowsky, K. Rakoczy, C. Pauli, B. Drollinger-Vetter, E.Klieme, and K. Reusser, “Quality of geometry instructionand its short-term impact on students’ understanding of thePythagorean Theorem,” Learning and Instruction, vol. 19, no.6, pp. 527–537, 2009.
[18] J. Brophy, Teaching. Educational Practices Series 1, Interna-tional Academy of Education, International Bureau of Edu-cation, PCL, Lausanne Switzerland, International Academy ofEducation, Brussels, Belgium, 2000.
[19] H. Ditton, “Students’ perspective on teachers and classrooms:results of a study on mathematics education,” ZeitschRiFt FuRPadagogik, vol. 48, no. 2, pp. 262–286, 2002.
[20] J. S. Eccles, C. Midgley, A. Wigfield et al., “Developmentduring adolescence: the impact of stage-environment fit onyoung adolescents’ experiences in schools and in families,”American Psychologist, vol. 48, no. 2, pp. 90–101, 1993.
[21] D. H. Schunk and F. Pajares, “Self-efficacy theory,” in Hand-book of Motivation at School, K. R. Wentzel and A. Wigfield,Eds., pp. 35–53, Routledge, New York, NY, USA, 2009.
[22] J. G. Greeno, A. M. Collins, and L. B. Resnick, “Cognitionand learningin,” in Handbook of Educational Psychology, D. C.Berliner and R. C. Calfee, Eds., pp. 15–46, Macmillan, NewYork, NY, USA, 1996.
[23] C. P. Niemiec and R. M. Ryan, “Autonomy, competence,and relatedness in the classroom: applying self-determinationtheory to educational practice,” Theory and Research inEducation, vol. 7, no. 2, pp. 133–144, 2009.
[24] P. Cobb and J. Bowers, “Cognitive and situated learningperspectives in theory and practice,” Educational Researcher,vol. 28, no. 2, pp. 4–15, 1999.
[25] A. Helmke, Instructional Quality and Teacher Professional-ity: Diagnosis, Evaluation, and Enhancement of Instruction,Kallmeyer, Seelze-Velber, Germany, 2009.
[26] E. L. Deci and R. M. Ryan, Handbook of Self-DeterminationResearch, University of Rochester Press, New York, NY, USA,2002.
[27] E. Sierens, M. Vansteenkiste, L. Goossens, B. Soenens, and F.Dochy, “The synergistic relationship of perceived autonomy

10 Child Development Research
support and structure in the prediction of self-regulatedlearning,” British Journal of Educational Psychology, vol. 79, no.1, pp. 57–68, 2009.
[28] H. Valas and N. Søvik, “Variables affecting students’ intrinsicmotivation for school mathematics: two empirical studiesbased on Deci and Ryan’s theory on motivation,” Learning andInstruction, vol. 3, no. 4, pp. 281–298, 1994.
[29] A. C. Frenzel, R. Pekrun, and T. Goetz, “Perceived learningenvironment and students’ emotional experiences: a mul-tilevel analysis of mathematics classrooms,” Learning andInstruction, vol. 17, no. 5, pp. 478–493, 2007.
[30] M. Kunter, J. Baumert, and O. Koller, “Effective classroommanagement and the development of subject-related interest,”Learning and Instruction, vol. 17, no. 5, pp. 494–509, 2007.
[31] O. Ludtke, A. Robitzsch, U. Trautwein, and M. Kunter,“Assessing the impact of learning environments: how to usestudent ratings of classroom or school characteristics inmultilevel modeling,” Contemporary Educational Psychology,vol. 34, no. 2, pp. 120–131, 2009.
[32] M. Clausen, Instructional Quality: A Matter of Perspective?Waxmann, Munster, Germany, 2002.
[33] M. Croon, “Ordering the classes,” in Applied Latent ClassAnalysis, J. A. Hargenaas and A. L. McCutcheon, Eds., pp. 137–212, Cambridge University Press, New York, NY, USA, 2002.
[34] E. Klieme, F. Lipowsky, K. Rakoczy, and N. Ratzka, “Qualitydimensions and effectiveness of mathematics instruction.Theoretical background and selectedfindings of the Pythago-ras project,” in Research on Educational Quality of Schools.FInal Report of the DFG Priority Program, M. Prenzel andL. Allolio-Naecke, Eds., pp. 127–146, Waxmann, Muenster,Germany, 2006.
[35] E. Klieme, G. Schuemer, and S. Knoll, “Mathematics instruc-tion at secondary level. Task culture and instructional design,”in TIMSS-Impulse fur Schule und Unterricht. Forschungsbe-funde, Reforminitiativen, Praxisberichte und Video-Dokumente,Bundesministerium fur Bildung und Forschung (BMBF), Ed.,pp. 43–57, Medienhaus Biering, Munich, Germany, 2001.
[36] J. Baumert, M. Kunter, W. Blum et al., “Teachers’ mathe-matical knowledge, cognitive activation in the classroom, andstudent progress,” American Educational Research Journal, vol.47, no. 1, pp. 133–180, 2010.
[37] M. C. Wang, G. D. Haertel, and H. J. Walberg, “Toward aknowledge base for school learning,” Review of EducationalResearch, vol. 63, no. 3, pp. 249–294, 1993.
[38] S. Gruehn, Teaching and Learning in School: Students AsSources of Lesson Descriptions, Waxmann, Muenster, Germany,2000.
[39] N. Ntoumanis, “A self-determination approach to the under-standing of motivation in physical education,” British Journalof Educational Psychology, vol. 71, no. 2, pp. 225–242, 2001.
[40] L. Festinger, “A theory of social comparison processes,”Human Relations, vol. 7, no. 2, pp. 117–140, 1954.
[41] J. V. Wood, “Theory and research concerning social compar-isons of personal attributes,” Psychological Bulletin, vol. 106,no. 2, pp. 231–248, 1989.
[42] C. P. H. Langford, J. Bowsher, J. P. Maloney, and P. P. Lillis,“Social support: a conceptual analysis,” Journal of AdvancedNursing, vol. 25, no. 1, pp. 95–100, 1997.
[43] B. R. Sarason, G. R. Pierce, E. N. Shearin, I. G. Sarason, J. A.Waltz, and L. Poppe, “Perceived social support and workingmodels of self and actual others,” Journal of Personality andSocial Psychology, vol. 60, no. 2, pp. 273–287, 1991.
[44] M. Reinboth, J. L. Duda, and N. Ntoumanis, “Dimensionsof coaching behavior, need satisfaction, and the psychologicaland physical welfare of young athletes,” Motivation andEmotion, vol. 28, no. 3, pp. 297–313, 2004.
[45] M. Walshaw and G. Anthony, “The teacher’s role in classroomdiscourse: a review of recent research into mathematicsclassrooms,” Review of Educational Research, vol. 78, no. 3, pp.516–551, 2008.
[46] D. Sembill and K. Gut-Sembill, “Questions behind students’questions-to inquire students’ questions in class,” Unter-richtswissenschaft, vol. 32, no. 4, pp. 321–333, 2004.
[47] R. Lazarides and A. Ittel, “Classroom characteristics, mathe-matics self-concept and interest,” in Differentiation in Mathand Science Classes. Implications For Theory and EducationalPractice, R. Lazarides and A. Ittel, Eds., Klinkhardt, BadHeilbrunn, Germany, 2012.
[48] H. W. Marsh, “Age and sex effects in multiple dimensions ofself-concept: preadolescence to early adulthood,” Journal ofEducational Psychology, vol. 81, no. 3, pp. 417–430, 1989.
[49] T. Seidel, “The role of student characteristics in studyingmicro teaching-learning environments,” Learning Environ-ments Research, vol. 9, no. 3, pp. 253–271, 2006.
[50] A. Helmke, Assessing, Evaluating, and Enhancing InstructionalQuality, Kallmeyer, Seelze, Germany, 2003.
[51] E. Sierens, M. Vansteenkiste, L. Goossens, B. Soenens, and F.Dochy, “The synergistic relationship of perceived autonomysupport and structure in the prediction of self-regulatedlearning,” British Journal of Educational Psychology, vol. 79, no.1, pp. 57–68, 2009.
[52] M. M. Mitchell, C. P. Bradshaw, and P. J. Leaf, “Student andteacher perceptions of school climate: a multilevel explorationof patterns of discrepancy,” Journal of School Health, vol. 80,no. 6, pp. 271–279, 2010.
[53] G. Nagy, H. M. G. Watt, J. S. Eccles, U. Trautwein, O. Ludtke,and J. Baumert, “The development of students’ mathematicsself-concept in relation to gender: different countries, differenttrajectories?” Journal of Research on Adolescence, vol. 20, no. 2,pp. 482–506, 2010.
[54] L. Hoffmann, A. Krapp, A. K. Renninger, and J. Baumert, Eds.,Interest and Learning: Proceedings of the Seeon Conference onInterest and Gender, IPN, Kiel, Germany, 1998.
[55] J. E. Jacobs, S. Lanza, D. W. Osgood, J. S. Eccles, and A.Wigfield, “Changes in children’s self-competence and values:gender and domain differences across grades one throughtwelve,” Child Development, vol. 73, no. 2, pp. 509–527, 2002.
[56] K. Neumann, A. Kauertz, and H. E. Fischer, “Quality ofinstruction in science education,” in Second InternationalHandbook of Science Education, B. J. Fraser, K. Tobin, andC. McRobbie, Eds., vol. 1, pp. 247–258, Springer, Dordrecht,Germany, 2012.
[57] B. Steinert, M. Gerecht, E. Klieme, and P. Dobrich, SchoolQuality Measures: Documentation of the Survey Instruments Forthe APU and PEB, GFPF ua, Frankfurt a. M., Germany, 2003.
[58] R. Berger, “Influence of context-based physics class on interestand performance in upper secondary school,” Zeitschrift furDidaktik der Naturwissenschaften, vol. 8, no. 1, pp. 119–132,2002.
[59] W. Bos, E. M. Lankes, M. Prenzel et al., IGLU: Documentationof the Survey Instruments, Waxmann, Muenster, Germany,2006.
[60] B. O. Muthen and A. Satorra, “Technical aspects of Muthen’sliscomp approach to estimation of latent variable relations

Child Development Research 11
with a comprehensive measurement model,” Psychometrika,vol. 60, no. 4, pp. 489–503, 1995.
[61] H. Akaike, “A new look at the statistical model identification,”IEEE Transactions on Automatic Control, vol. 19, no. 6, pp.716–723, 1974.
[62] G. Schwartz, “Estimating the dimension of a model,” Annals ofStatistics, vol. 6, no. 2, pp. 461–464, 1978.
[63] J. Rost, “Latent-class analyses,” in Handbook of PsychologicalDiagnostics, F. Petermann and M. Eid, Eds., pp. 275–287,Hogrefe, Goettingen, Germany, 2006.
[64] K. L. Nylund, T. Asparouhov, and B. O. Muthen, “Decidingon the number of classes in latent class analysis and growthmixture modeling: a Monte Carlo simulation study,” Struc-tural Equation Modeling, vol. 14, no. 4, pp. 535–569, 2007.
[65] S. L. Clark and B. O. Muthen, “Relating latent class analysisresults to variables not included in the analysis,” In press.
[66] K.-O. Bauer, “Models of instructional quality,” in InstructionalQuality and Subject-Didactic Research. Models and Measuresof Domain-Specific Learning Conditions and Competences, K.O. Bauer and N. Logemann, Eds., pp. 51–74, Waxmann,Muenster, Germany, 2011.
[67] J. S. Eccles, “Gender roles and women’s achievement-relateddecisions,” Psychology of Women Quarterly, vol. 11, no. 2, pp.135–172, 1987.
[68] J. A. Bianchini and M. E. Brenner, “The role of induction inlearning to teach toward equity: a study of beginning scienceand mathematics teachers,” Science Education, vol. 94, no. 1,pp. 164–195, 2010.
[69] E. A. Geist and M. King, “Different, not better: genderdifferences in mathematics learning and achievement,” Journalof Instructional Psychology, vol. 35, no. 1, pp. 43–52, 2008.
[70] E. R. Altermatt, “Coping with academic failure: genderdifferences in students’ self-reported interactions with familymembers and friends,” Journal of Early Adolescence, vol. 27, no.4, pp. 479–508, 2007.
[71] S. H. Chapin, C. O. ’Connor, and N. C. Anderson, ClassroomDiscussions: Using Math Talk To Help Students Learn, GradesK-6, Math Solutions Publications, Sausalito, CA, USA, 2003.
[72] E. Aronson, “Building empathy, compassion, and achievementin the jigsaw classroom,” in Improving Academic Achievement.Impact of Psychological Factors on Education, J. Aronson, Ed.,pp. 209–225, Academic Press, San Diego, Calif, USA, 2002.
[73] M. Hanze and R. Berger, “Cooperative learning, motivationaleffects, and student characteristics: an experimental studycomparing cooperative learning and direct instruction in 12thgrade physics classes,” Learning and Instruction, vol. 17, no. 1,pp. 29–41, 2007.

Hindawi Publishing CorporationChild Development ResearchVolume 2012, Article ID 359089, 11 pagesdoi:10.1155/2012/359089
Research Article
Relationships between 9-Year-Olds’ Math andLiteracy Worries and Academic Abilities
Laura Punaro and Robert Reeve
Melbourne School of Psychological Sciences, University of Melbourne, VIC 3010, Australia
Correspondence should be addressed to Robert Reeve, [email protected]
Received 11 May 2012; Revised 16 August 2012; Accepted 30 August 2012
Academic Editor: Helga Krinzinger
Copyright © 2012 L. Punaro and R. Reeve. This is an open access article distributed under the Creative Commons AttributionLicense, which permits unrestricted use, distribution, and reproduction in any medium, provided the original work is properlycited.
We investigated whether 9-year-olds experience math and/or literacy worries and, if they do, whether it is related to problem-solving abilities. Fifty-eight children judged the correctness of math, literacy, and mental rotation problems that differed indifficulty and rated their worry level about the correctness of judgments. Nonverbal IQ, general math, and literacy abilities werealso assessed. Results showed children’s worry ratings varied as a function of task and problem difficulty. Latent class analysesof math and literacy worry ratings revealed high-, moderate- and low-worry subgroups in both domains. The high-worry mathsubgroup exhibited poorer math performance than the other math subgroups, demonstrating a link between math worry and mathperformance. No relationship was found between worry literacy subgroups and literacy performance. Moreover, no relationshipwas found between teachers’ rating of children’s academic and general worry and children’s own worry ratings. The relevance ofthe findings for understanding math and literacy worry is discussed.
1. Introduction
Insofar as preadolescent children experience academic-related anxieties/worries, it is unclear whether these effectsare specific to an academic domain (e.g., math) exists inother domains (e.g., literacy), or, if they exist, affect abilitiessimilarly across domains. Although it is assumed that thetrepidation associated with math is greater than other aca-demic domains [1, 2], research into anxiety problem-solvingabilities associations in areas other than math is limited,even in older students [1]. Moreover, even though academicanxieties may exist in preadolescent children, it is unclearwhether children would be able to accurately describe theseexperiences because of immature metacognitive abilities. Theresearch reported herein investigates 9-year-olds’ academicanxiety/worry-ability relationships in math, reading, andmental rotation (a nonacademic area), where children rateanxiety level immediately after solving a problem (We usethe term “worry” rather than anxiety because pilot worksuggested that children could readily provide examples oftheir worry experiences, but had more difficulty providingexamples of anxiety experiences. Moreover, the term “worry”
has occasionally been used as a way of describing “anxiety” tochildren (see [2, 42]). Nevertheless, we also use the genericterms “math anxiety” and “literacy anxiety” because theyare used in the literature). The aim is to better understandthe nature of academic anxiety/worry-ability associations inpreadolescent children.
Although most academic anxiety research focuses onmath anxiety (MA), literacy anxiety may also exist. In one ofthe few studies on language anxiety, Carroll et al. [3] foundthat, compared to their literate peers, 5- to 15-year-olds withpoor literacy tended to be more anxious about their languageabilities. This is an important issue because MA might bean aspect of academic anxiety more generally. However, thereasons for literacy anxiety are not well understood, and theresearch considered herein mainly focuses on math anxiety/worry performance relationships.
MA is thought to emerge in the preadolescent years, peakaround Grades 9 to 10, and not change thereafter [4, 5]. It isassociated with poor math achievement, as well as socioemo-tional and behavioral difficulties in high school students [1,5–7]. Surprisingly little is known about the impact of mathanxiety/worries on preadolescent children’s math abilities [8,

2 Child Development Research
9]. Dowker [1] suggests that MA affects math performanceonly after Grade 4 (10 years old)—a claim supported byMa [9] in his meta-analysis of research on the associationbetween MA and math performance (note, however, Ma[9] only included three studies of children younger than11 years old in his meta-analysis). Moreover, Krinzingeret al. [10] found no association between MA and arithmeticability in 6- to 9-year-olds and suggested that the way youngchildren are questioned about math-related anxieties mayaffect their responses. These findings suggest that youngchildren are either not affected by math anxiety/worries, donot understand anxiety-related questions, or are unable toreport their anxieties [1, 11, 12].
It is often assumed that children are able to report anxietystates—a claim that overlooks limitations in children’smetacognitive capabilities, which may affect their ability toanswer questions about their own cognitive or socioemo-tional states [13]. In questionnaires typically used to assessMA, children are asked to reflect on general events (e.g.,imagine being in a math lesson) and rate their anxiety, yetthis may be beyond their cognitive capabilities [9, 14, 15].
Some researchers have used simplified MA tasks to probeyoung children’s anxiety states. Thomas and Dowker [16],for example, used a pictorial MA task in which 6- to 9-year-olds pointed to facial expressions to convey their emotionalresponse to math events. The questions focused on children’sperceived math ability, how much they enjoyed math tasks,and how worried they felt when they encountered difficultproblems. Thomas and Dowker [16] found that their partic-ipants did not express anxiety or unhappiness at perceivedmath difficulties and concluded that MA was unrelated topoor math performance in young children. Gierl and Bisanz[12] also used a pictorial judgment paradigm to assess MA in9- to 12-year-olds. They found that 9-year-olds reported lowlevels of anxiety, while 12-year-olds reported higher anxietylevels. They concluded that MA increases as students matureand become more concerned about the consequences ofsuccess and/or failure. However, both groups of researchersasked probe questions about general retrospective events(e.g., experiences with mental calculation), rather than aspecific problem solving event as they occurred. It is possiblethat the 9-year-olds in both studies lacked the abilities toreflect on general events [13].
The question of whether MA is a manifestation of generalanxiety or is specific to math has been often debated. Ina meta-analysis of MA research conducted on high schooland college students, Hembree [5] reported moderate cor-relations (0.35 and 0.40) between MA, general anxiety, traitanxiety, and state anxiety, and a stronger correlation (0.52)between MA and test anxiety. However, stronger correlations(0.5 to 0.8) have been found between MA measures (e.g.,Math Anxiety Rating Scale and the Abbreviated Math Anx-iety Scale), which suggests that MA is a specific anxiety—aclaim supported by findings which show that general anxietymeasures account for little of the variance in MA scores[6, 11]. However, these analyses do not address whether MAis unique or a part of academic anxiety more generally. Find-ings from a study by Faust [17] suggest that MA is uniquein older students, at least. He found that high MA students
did not show anxiety on a verbal anagram task. A questionof some interest is whether preadolescent children exhibitsimilar across-domain anxieties/worries. Indeed, Gierl andBisanz [12] found that preadolescent children’s MA ratingsdid not differ from their general school anxiety ratings,which could be interpreted as suggesting that children exhibitanxiety across academic domains.
A key aim of studying MA is to understand its impacton math abilities. Higher levels of MA are often linked tolower levels of math achievement [2, 7, 18]. However, therelationship between MA and math ability is complex. Forinstance, MA is often associated with avoidance behaviors,less time spent studying, and lower class engagement [10,19], factors that can impact the acquisition of math skills.Poor performance by high MA students may also reflect theintrusion of worrisome thoughts while solving math prob-lems. A reduced processing efficiencymodel was proposedby Eysenck and Calvo [20] who suggest that worries limitworking memory capacity because they take up problem-solving resources [4, 10, 11, 21]. Consistent with this claim,Ashcraft and Faust [22] found that MA had minimal impacton simple arithmetic problems, but had substantial impacton more difficult multiplication problems. However, notall researchers support the cognitive resources hypothesis.For arousal theorist, worry may motivate some students toincrease efforts, while extreme worry may impede effort [2,9]. Also, Wigfield and Meece [2] and Ho et al. [7] suggestedthat it is the affective-emotional component (i.e., tension,unpleasant physiological reactions) rather than the cognitivecomponent that affects (correlates negatively) with mathperformance.
In the present study we investigate 9-year-olds’ academicworry-performance associations, by probing their “worry”reactions using a “faces worry scale” immediately follow-ing problem solving (i.e., deciding whether two problemspresented side by side represent the same solution to aproblem). We are interested in whether worry judgmentsvary as a function of to-be-judged problem difficulty andproblem correctness for math, literacy and, a nonacademicdomain (mental rotation). If they do, it would confirm thatchildren experience worry, whether or not they are able toreport it. Of interest is whether math and language taskselicit distinct patterns of worry judgments compared to thenonacademic task. If academic worries are unique, mathand language worry judgments would be expected to differfrom nonacademic worry judgments. Insofar as children’spatterns of worry judgments differ, of interest is whetherjudgments are related to ability. On the basis of research withadolescents, it is expected that children’s academic worryratings would be associated with ability.
2. Method
2.1. Participants. Fifty-eight Grade 4 children (32 boys and26 girls: M = 117.55 months, SD = 6.91) from an urban pri-mary school in a large Australian city participated. Commonto Australian urban schools, the sample comprised childrenfrom diverse multicultural and socioeconomic backgrounds.All children had normal or correct-to-normal vision; and,

Child Development Research 3
according to school personnel, none had known learningdifficulties. The research was, approved by, and conducted inaccordance with, the authors’ university human ethics com-mittee requirements.
2.2. Materials and Procedures. To determine whether worrylevel differed as a function of math, literacy, or nonacademic(mental rotation) problems, children were presented twoproblems side by side from the three domains and (1) judgedwhether the solution to the pair of problems was the same ornot and (2) rated their worry about the confidence they hadin their decision using a face worry scale (described above)(see Table 1 for examples of pairs of to-be-judged problemsfor each of the three domains). Children judged 48 separateproblems in each of the three domains (n = 144 problemsacross the three domains) comprising pairs of to-be-judgedproblems that were easy or difficult to judge and for whichthe solutions were either equivalent or not (n = 12 for eachdifficulty/equivalence combination within each domain: seeTable 1 e.g., of these combination for each domain).
Children completed the Ravens Colored ProgressiveMatrices nonverbal IQ measures two weeks before judgmenttasks [23]. They also completed a general numeracy andliteracy worry test one week before completing judgmenttasks. This task was used to (1) introduce children to the faceworry judgment procedure, described above (see Figure 1),and (2) assess children’s general retrospective worries. Theterm worry rather than anxiety was used in discussingfaces with children because pilot work revealed it was moremeaningful to them. Children were able to point to facescorresponding to “not worried at all,” “a little bit worried”and “very worried” without hesitation and grasped thepurpose of these procedures without difficulty.
Teachers rated children’s general school-related anxietyprior to the judgment tasks. They also rated children’s liter-acy and numeracy competency. Teachers were encouraged toconsult children’s formal test scores in making competencyjudgments—Australian children complete national numer-acy and literacy tests throughout the primary (elementary)school years.
To avoid fatigue, the three domain judgment tasks werecompleted in three 15-minute sessions on consecutive days.Task procedures were explained before each session usingfour practice problems. Children were reintroduced to thefaces worry scale (introduced one week earlier for use inthe general numeracy and literacy worry judgment task) andencouraged to use the range of anxiety/worry faces to judgeworry level if they felt it was appropriate to do so. Task orderpresentation was randomized across the three days; howeverwithin-task problems were presented in a fixed order.
The three domain judgment task problems were pre-sented on a 15′′ laptop screen, and children judged whetherto-be-judged problem pairs were equivalent by pressing theleft-shift key (for equivalent/similar) or the right-shift key(for not equivalent/not similar). Task problems remained onthe screen for a fixed time (math problems = 16 seconds;language problems = 11 seconds; mental rotation problems =5 seconds). Presentation times were based on pilot data froma separate group of 10-year-olds and reflected the average
1 2 3 4 5 6
Figure 1: The faces worry scale.
time taken to complete easy and difficult problems. It wasexpected that children would have sufficient time to completeeasy, but not hard problems, before problems disappearedfrom the screen. The perception of insufficient time tocomplete tasks is known to increase worry in children [24].Although children could make a judgment before problemsdisappeared, few did so, and thus it was not possible to assessthe function of response time.
As soon as children made a judgment, the faces worryscale appeared on the screen (see Figure 1 and descriptionbelow). Children judged how worried they felt about the“correctness” of their equivalence judgment by pressing thenumeric computer key corresponding to their worry facechoice. Of interest were (1) judgment correctness and (2)worry ratings.
2.3. Judgment Tasks. For the math judgment task childrenjudged whether two addition equations were equivalent. Theproblems were instances of associativity problems (e.g., 4 +3 = 3 + 2 + 2) [25]. Difficulty was determined by the numberof terms in the equation. Easy problems comprised equationsof the form of “a + b = b + c + d” and difficult problemscomprised equations of the form of a + b + c = c + d +e + f. Research shows that 8-year-olds are able to solve theeasy associativity problems, and 10-year-olds are able to solvedifficult problems [25]. Equations, terms comprised single-digit numbers between 2 and 9 (excluding doubles: e.g., 6 +6) and summed to 20 or less. Children’s task was to judgewhether both sides of the equal sign were equal or unequal.The task comprised 12 easy/same (correct), easy/different(incorrect), difficult/same, and difficult/different problems(see Table 1, e.g., of each).
The language judgment task comprised a synonym judg-ment test [26], designed to assess literacy (verbal reasoning,reading ability, vocabulary knowledge, and comprehension).Children were presented with two sentences, which differedin a single word and were asked to decide whether thetwo sentences were equivalent in meaning (e.g., “Elephantsare larger than mice/Elephants are bigger than mice” andasked: “Do these sentences mean the same thing?”). Level ofdifficulty was determined by selecting synonym pairs thatwere appropriate for Grade 2 (easy) and Grade 4/5 (difficult).Example stimuli are presented in Table 1.
Quaiser-Pohl’s [27] mental rotation test was used as thenonacademic task—we regarded it as a nonacademic measurebecause it requires skill not taught in school. It compriseda spatial ability measure designed for primary school agedchildren. Stimuli comprised colored pictures of two animalsor humans, one of which was rotated around a central axis.Children judged whether the rotated figure was the same as

4 Child Development Research
Table 1: Example stimuli used in the math, literacy, and mental rotation tasks.
Task
Math Literacy Mental rotation
Easy/Same
Peter RAISED/LIFTED the
4 + 2 + 3 = 6 + 3 trophy after winning the
Grand Final.
Mark is
3 + 7 = 2 + 3 + 5 STRONG/POWERFUL
enough to lift a truck.
Easy/Different
3 + 4 + 1 = 2 + 5Mum’s dinner was a
major FAILURE/SUCCESS.
4 + 1 + 6 = 8 + 6Kate’s pet turtle was very
LIGHT/HEAVY.
Difficult/Same
The policeman
4 + 3 + 6 = 2 + 7 + 3 + 1 PURSUED/CHASED the
thief through the alley.
Frank’s
2 + 4 + 9 = 3 + 7 + 4 + 1 CONDUCT/BEHAVIOUR
in the playground was
atrocious.
Difficult/Different
Steven waited
4 + 8 + 5 + 3 = 3 + 9 + 5 PATIENTLY/RESTLESSLY
for his mother.
Roger was
3 + 5 + 9 = 6 + 2 + 3 + 4 HOPEFUL/PESSIMISTIC
about getting the job.
the target figure. Difficulty was determined by the rotationangle between the comparison pictures; easy problems wererotated less than 90 degrees (45 or 90 degrees), and difficultitems were rotated more than 90 degrees (135 or 180degrees).
Children’s worry ratings for the math, literacy, and men-tal rotation tasks were computed for the problem difficultyand equivalence conditions (i.e., mean ratings were com-puted for the four within-task conditions for each of thetasks).
2.3.1. Worry Judgments. Worry judgment was assessed usingthe Faces Pain Anxiety Scale [28] (see Figure 2). The “facesscales” have been used in medical contexts to measureanxiety/worry [28–30]. The faces depict six different facialexpressions in a graded sequence from nonanxious “1” tovery anxious “6”. The faces are claimed to represent approx-imately equal intervals in anxiety representations [28]. TheFaces Anxiety Scale has a test-retest reliability of 0.79 [28]over a two-week period and correlates with similar scalesr = 0.8 on average [31]. The scale has been used with 3-year-olds to older adults.
2.3.2. General Math and Literacy Worry. To assess children’sgeneral math and literacy worry, they were asked to rate
their level of worry for math and literacy. Children rated“How worried do you usually feel when you are doing x′′?(x = working on computers, sport, playing music, addition,subtraction, multiplication, reading, and writing stories).These questions were developed by the authors and servedto (1) introduce children to the “faces worry scale” and (2)assess possible differences in children’s general retrospectivemath and literacy worries. Children were introduced to thefaces worry scales by judging their worry about working oncomputers, sports, and playing music. The purpose of usingthese neutral questions was to familiarize children with theworry judgment procedure and to answer questions if theyarose. Following the so-called neutral questions, childrenmade worry judgments about the addition, subtraction,multiplication, reading, writing stories questions. Children’smath worry ratings were averaged across the three mathitems and literacy ratings were averaged across the two lit-eracy ratings.
2.3.3. Teacher Judgment of Children’s General Anxiety. Teach-ers completed the modified version of the School AnxietyScale Teacher Report [32], which examines children’s generaland social anxiety in the school environments. This test hasgood test-retest reliability (r = 0.93) over an eight-weekperiod), and is correlated (r = 0.83) with the Strengths and

Child Development Research 5
0
1
2
3
4W
orry
rat
ing
Math Language
Math judgment task
HighModerateLow
(a)
0
1
2
3
4
Wor
ry r
atin
g
MathLanguage
Language judgment task
HighModerateLow
(b)
Figure 2: The relationships between math and literacy subgroup membership and literacy (a) and math (b) worry ratings, respectively.
Difficulties Questionnaire Internalizing Symptoms Scale, awidely used measure of teacher-rated anxiety. Seven generalanxiety items were administered (e.g., “This child is afraid ofmaking mistakes”; “This child worries about things”; “Thischild worries that (s)he will do badly at school”). Teachersrated anxiety on a four-point scale (0: never, 1: sometimes, 2:usually, 3: always). Teachers’ ratings were averaged across theseven items.
2.3.4. Teacher Judgment of Children’s Competency. Teachersrated children’s ability in three areas—math, literacy (readingand writing), and general problem solving—on a five-pointscale (1: poor, 2: not good, 3: average, 4: very good, and 5:superior). As noted earlier, teachers were encouraged to con-sult children’s formal test results in rating their competencies.
2.4. Analytic Approach. Because we were not confident thatthe measurement scale properties of the math, literacy, andmental-rotation judgments tasks were sufficiently similar tocombine them in analyses, we used separate ANOVAs toidentify judgment correctness and worry rating for each taskseparately. Because we were also interested in identifyingdifferent patterns of worry as a function of within-taskmanipulations, we used latent class methods to isolate possi-ble subgroup patterns of performances. Latent class (LC)methods [33] are a specific form of finite mixture modeling[34] approaches, which aim to uncover two or moresubgroups of individuals characterized by distinct patternsof responding. A fundamental aspect of such models is theassumption of a categorical latent variable. The latent (unob-served) categories represent qualitatively different states ofthe underlying latent variable. Models are estimated withsuccessively more latent classes, with the final modelbest capturing the structural representation of covariancebetween the indicator (observed) variables. Informationcriteria indices (e.g., AICc [35], CAIC [36]) were used to
determine the best fitting model to the data, penalisingincreasingly complex specifications.
Unlike proximity-based cluster approaches (such asK-means), LC approaches offer a formal, model-basedapproach to the classification of individuals to unique clus-ters [37, 38]. An important outcome of using this approachis probabilistic estimates of every individual’s likelihood ofbelonging to each class of the latent variable, in this case,levels of worry.
Latent profile analysis (LPA) is a particular type of LCmodelling [39]. What separates LPA from other LC modelsis that the profiles are formed based on continuous indicatorvariables; in this case, online worry judgments. Models weresuccessively estimated from a two- to four-class specification.The relatively small sample size resulted in idiosyncraticclasses beyond this range.
3. Results
Preliminary analyses showed no relationship between gen-der, Ravens measures, and any of the other measures ofinterest and so they were not included in analyses reportedherein.
Three separate ANOVAs examined judgment accuracyof the to-be-judged problem pairs for the three tasks(math, literacy, and nonacademic tasks) as a function ofthe difficulty (easy or difficulty) and the similarity (same ordifferent) of the two problems (see Table 2 for the meansand standard deviations associated with these analyses). Formath judgment accuracy, main effects of problem difficulty(F(1, 57) = 80.83, P < 0.001, η2 = 0.59) and problemsimilarity (F(1, 57) = 23.38, P < 0.001, η2 = 0.29) werefound. In addition, the interaction between them was alsosignificant (F(1, 57) = 8.30, P < 0.01, η2 = 0.13). Forliteracy judgment accuracy, main effects of problem difficulty(F(1, 57) = 349.00, P < 0.001, η2 = 0.86) and problem

6 Child Development Research
Table 2: Mean worry ratings and problem correctness (and stan-dard deviations) for the math, literacy, and mental rotation tasksas a function of the difficulty and similarity of the to-be-judgedproblem pairs.
Easy Difficult
Same Different Same Different
Math problems
1.48 (0.56) 1.55 (0.67) 1.83 (0.79) 1.93 (0.83)
89.22 (11.47) 92.96 (10.79) 70.69 (22.03) 83.19 (13.92)
Literacy problems
1.21 (0.40) 1.34 (0.44) 1.73 (0.80) 1.61 (0.70)
95.98 (8.58) 93.97 (6.58) 60.78 (18.67) 73.85 (15.88)
Mental rotation problems
1.22 (0.35) 1.35 (0.51) 1.35 (0.46) 1.38 (0.46)
88.51 (23.04) 86.06 (13.00) 79.60 (28.02) 81.18 (17.49)
similarity (F(1, 57) = 7.93, P < 0.001, η2 = 0.12) werefound. In addition, the interaction between them was alsosignificant (F(1, 57) = 23.21, P < 0.01, η2 = 0.29). Formental rotation nonacademic accuracy, only a main effect ofdifficulty was found (F(1, 57) = 22.69, P < 0.001, η2 = 0.29).
Three separate ANOVAs also examined judgment worryratings for the three tasks as a function of the problem diffi-culty (easy or difficulty) and the similarity (same or different)of the to-be-judged problem pairs. For math judgment worryratings, main effects of difficulty (F(1, 57) = 50.72, P < 0.01,η2 = 0.47) and problem similarity (F(1, 57) = 8.10, P < 0.01,η2 = 0.12) were found. For literacy judgment worry ratings,only a main effect of difficulty was found (F(1, 57) = 42.72,P < 0.01), η2 = 0.43). In addition, the interaction betweenthem was also significant (F(1, 57) = 18.38, P < 0.001, η2 =0.24). For mental rotation-nonacademic worry ratings, maineffects of difficulty (F(1, 57) = 7.92, P < 0.01, η2 = 0.12) andproblem similarity (F(1, 57) = 11.94, P < 0.01, η2 = 0.17)were found. In addition, the interaction between them wasalso significant (F(1, 57) = 4.19, P < 0.05, η2 = 0.07).
These findings show that manipulating the difficulty andsimilarity of the to-be-judged problem pairs affected judg-ment accuracy and worry ratings for the math and literacytasks; however, only task difficulty affected accuracy judg-ments in the nonacademic task.
The next set of analyses investigated the relationshipbetween the math and literacy worry ratings and accuracymeasures. Because of the relatively large math and literacyworry SD’s, two separate latent profile analysis [39] wereemployed to identify possible worry subgroups in the twodomains. Specifically, mean worry ratings for problemsimilarity and problem difficulty were used to identify clustermembership. Different criteria were used to identify thebest fitting model (see Table 3). The AICc and CAIC valuesindicated a three-cluster solution for both the patternsof math and literacy worry judgments (see Table 3). Inparticular, the solutions revealed low-, moderate- and high-worry subgroups for both domains. Classification errors,defining the degree of uncertainty between probabilisticcluster proportions and cluster membership using maximum
Table 3: Latent class analysis of the math and literacy worry ratings.
Cluster LL AICc CAIC BIC CE (%)
Math worry clusters
2-cluster −104.83 224.95 295.68 278.68 0.62
3-cluster −68.75 182.78 269.07 243.07 2.14
4-cluster −49.98 214.50 277.07 242.07 1.99
Literacy worry clusters
2-cluster −38.02 91.34 162.07 145.07 0.36
3-cluster 25.40 −5.51 80.78 54.78 0.76
4-cluster 45.81 22.92 85.50 50.50 1.87
Table 4: Worry subgroups membership cross-classification acrossthe math and literacy domains.
Literacy worry subgroupMath worry subgroup
Low Moderate High
Low
Count 18 8 1
Expected count 12.6 9.8 4.7
Adjusted residual 2.9∗ −1 −2.5∗
Moderate
Count 9 9 5
Expected count 10.7 8.3 4
Adjusted residual −0.9 0.4 0.7
High
Count 0 4 4
Expected count 3.7 2.9 1.4
Adjusted residual −2.8∗ 0.9 2.6∗∗P < 0.05.
class assignment, were acceptably small, indicating that thesubgroups were valid.
The relationship between low, moderate, and high sub-groups across the math and language domains was significant(χ2(4,N = 58) = 15.26, P < 0.001), with a significantordinal-by-ordinal association (γ = 0.67, P < 0.001: seeTable 4 for the cross-classification of the math and literacysubgroups). Table 4 reports differences between expectedand observed cell frequencies, and the associated adjustedstandardized residuals for significant differences amongcells. The information in Table 4 could be interpreted assuggesting that there is a tendency to belong to similar worrygroups in both the math and literacy domains; however, theinformation in Table 4 does not provide information aboutthe within-domain differences on across-domain measures.
Figure 2 shows the mean worry ratings for math andliteracy, respectively, as a function of the math and literacysubgroups. Figure 2 suggests a differential impact of sub-group membership on across-domain measures, which wasconfirmed by analyses of the across-domain worry ratings.Specifically, for the math worry subgroups, a significantinteraction between math subgroup and literacy worry ratingwas found (F(2, 55) = 12.47, P < 0.001, η2 = 0.31).However, for the literacy worry subgroups, no significant
Child Development Research 7
interaction between literacy subgroup and math worry rat-ings was found (F(2, 55) = 2.26, P > 0.05, η2 = 0.08). (Note,only interactions are important here). These results suggestthat literacy subgroup worry ratings might reflect generalworry ratings, whereas the math worry subgroup ratingsreflect unique within-domain differences in worry ratings.
The analyses reported thus far do not address directly thequestion of whether worry subgroup memberships predictjudgment accuracy. These relationships are reported inTable 5, which appears to show that judgment accuracy isindeed associated with worry. In the next set of analyses wereport findings from regression analyses in which within-domain worry subgroup membership respectively predictedwithin-domain judgment accuracy over and above theeffect of teachers competence ratings and children’s owngeneral worry ratings. The latter two factors are includedin the analyses to determine whether teachers’ assessmentof children’s competence and children’s general retrospectiveworry judgments moderate the relationship between worrysubgroup membership and judgment accuracy.
Two separate multiple regression analyses were con-ducted predicting math and literacy correctness judgments,respectively, subgroup membership was entered as a dummyvariable (the low-worry subgroup was used as the referencecategory in both analyses). (Note: we only used the accuracyfor difficult judgments because of ceiling effects associatedwith easy accuracy judgments—see Table 5).
VIF scores were low, suggesting that multicollinearity wasnot an issue in the analyses. The overall model for mathproblem judgments was significant (F(4, 53) = 5.50, P <0.01, R2 = 0.29) (see Table 6 for the regression parameters).Two significant predictors emerged: teacher rating of mathcompetency and worry subgroup membership. Specifically,teacher math competency ratings predicted math task judg-ment performance (β = 0.46, P < 0.01) and membershipof the high worry subgroup predicted poorer math taskjudgment performance, relative to belonging to the low-worry subgroup (β = −0.33, P < 0.05). Retrospective worryratings did not predict difficult math judgment performance.The overall model for literacy problem judgments wassignificant (F(4, 53) = 2.97, P < 0.05, R2 = 0.18) (seeTable 7 for the regression parameters). Only children’s ownretrospective literacy worry rating predicted literacy problemjudgment correctness (β = 0.46, P < 0.01). It is evidentthat different factors predict math and literacy correctnessjudgments.
4. Discussion
The aim of the research was twofold. The first was todetermine whether 9-year-olds report differences in math,literacy, and nonacademic worry immediately after solvinga problem using the “faces worry scale.” The second wasto see whether differences in worry ratings were related toproblem solving. Three findings are of note. First, worryratings were higher for more difficult math, language, andmental rotation problems, indicating that children weresensitive to task demands. Second, overall, worry levels werehigher for the math problems, compared to language and
nonacademic (mental rotation) problems. Three meaningfulworry subgroups were identified from worry ratings forboth the math and the language tasks (but not for thenonacademic mental rotation task). Importantly, childrenwith high math worry were less successful in making correctmath judgments compared to children with low math worry.As noted earlier, neither gender nor general ability effectswere observed.
The faces worry scale was used (1) immediately afterchildren made judgment about the equivalence of pairs ofmath, literacy, and mental rotation problems and (2) toassess children’s general math and literacy worries. Children’sworry ratings increased as math and literacy judgment taskdifficulty increased, which shows that children were sensitiveto task difficulty (however, worry ratings did not increaseas the difficulty of the mental rotation problems increased).This particular finding stands in contrast to Thomas andDowker’s [16] and Gierl and Bisanz’s [12] findings thatmost 6- and 9-year-olds’ did not exhibit math performance-related anxiety. Our finding adds weight to claims thatmath anxiety symptoms may be displayed in primary-agedchildren [9, 10, 40] and is inconsistent with claims that mathanxiety symptoms only appear in late primary/elementaryschool students [1, 11]. It is possible of course that the latterstudies may have underestimated young children’s academicanxieties because of difficulties associated with assessingaffective states retrospectively [13]. In the present study,this difficulty was minimized by asking children about theirworry immediately after solving a problem. Nevertheless, itis also evident that children in the current study were able touse the “faces worry scale” to rate general math and literacyworries.
MA is considered a unique anxiety linked specificallyto math [5]. Math is thought to elicit greater worry thanother academic domains [1, 17]. Wigfield and Meece [2]suggest that math is particularly anxiety provoking becauseof its emphasis on precision, logic, and problem solving.While our findings support this claim (worry ratings werehigher for math than language), it is evident that 9-year-oldsalso experienced language worries. This finding suggests thatboth math and language elicit worry reactions. Interestingly,a similar differential in worry ratings was found in thegeneral academic worry ratings: math problems were ratedas more worrisome than literacy problems.
It is noteworthy that associations were found between themath and language subgroups and other tasks. It is evidentthat (1) children in the low math anxiety/worry subgroupshowed equally low levels of worry on all three judgmenttasks; (2) children in the high math anxiety/worry subgroupfound the math task more worrisome than the languagetask; (3) some children only showed high levels of worry onthe math task, but not on other tasks. The latter finding isimportant because it provides support for the specificity ofmath anxiety.
The fact that some children reported high levels of worryin the literacy judgment task suggests literacy per se mayevoke anxiety. Indeed, the link between reading difficultiesand anxiety symptoms has been noted by researchers [41].It is assumed that anxiety arises in response to experiences

8 Child Development Research
Table 5: Worry ratings and problems corrects as a function of math and literacy worry groups.
Math worry group
Low (n = 27) Moderate (n = 21) High (n = 10)
Mean SD Mean SD Mean SD
Mean worry rating
Math easy 1.08 0.09 1.57 0.28 2.60 0.49
Math difficult 1.22 0.20 2.15 0.39 3.10 0.57
Percent correct
Math easy 90.43 11.25 92.46 8.80 90.00 7.91
Math difficult 80.56 15.33 76.79 13.34 67.50 13.15
Literacy worry group
Low (n = 27) Moderate (n = 23) High (n = 8)
Worry rating
Literacy easy 1.03 0.04 1.27 0.18 2.12 0.33
Literacy difficult 1.10 0.11 1.82 0.39 3.14 0.41
Percent correct
Literacy easy 95.99 4.40 95.11 5.43 91.15 9.03
Literacy difficult 68.98 12.73 66.67 10.59 63.54 13.50
Table 6: Predicting math judgment correctness: multiple regressionparameters.
B Std. Error β t Sig.
(Constant) 57.09 8.89 6.42 0.000
Moderate worrysubgroup1 −0.09 4.20 −0.00 −0.02 0.983
High worry subgroup1 −12.71 5.13 −0.33 −2.48 0.016
Teacher rating mathcompetency
6.73 1.86 0.46 3.61 0.001
Children’s retrospectivemath worry
0.11 2.79 0.01 0.04 0.968
1Reference category is low subgroup.
Table 7: Predicting literacy judgment correctness: multiple regres-sion parameters.
B Std. Error β t Sig.
(Constant) 45.65 8.91 5.13 0.000
Moderate worrysubgroup1 −2.14 3.18 −0.09 −0.67 0.505
High worry subgroup1 −2.86 4.62 −0.08 −0.62 0.539
Teacher rating literacycompetency
1.61 2.73 0.08 0.59 0.559
Child retrospectivereading worry
6.01 1.89 0.42 3.19 0.002
1Reference category is low subgroup.
of failure rather than literacy anxiety per se. Our resultssuggest that literacy anxiety is not necessarily a reflection ofpoor ability, but can arise in children with age-appropriatereading skills. Indeed, our results showed that children inthe high language worry subgroup also found the math taskworrisome (see Figure 2). However, it should be noted that
children in the high math worry subgroup did find thelanguage task worrisome. The difference in the direction ofthese relationships suggests that language worry might reflectgeneral academic-related worries, whereas math worry isunique to math.
Interestingly, teachers’ ratings of children’s general anxi-ety (as assessed on the School Anxiety Scale) were unrelatedto children’s immediate or general worry ratings. Thisfinding is consistent with previous research with adolescentand adult samples [4, 5, 11].
Some researchers have identified math anxiety in youngchildren that was unrelated to math performance [10, 40].The failure to find a relationship has led some researchers toquestion the existence of a math anxiety performance link inchildren [1, 9]. However, Krinzinger et al. [10] suggest thatthe failure to find a math anxiety-performance link mightbe due to methodological issues rather than an absence ofmath anxiety. In the present study, we found meaningfulrelationships between worry ratings and problem solvingjudgments. Similar to Krinzinger et al. [10, 42] we assessed“worry” using a faces rating scale. However, there are twokey differences between our scale and the scale used byKrinzinger et al. [10, 42]. First, children rated worry imme-diately after making problem solving judgments. Second, ourworry scale was unipolar in nature (neutral face to worriedface); in contrast, Krinzinger et al.’s [10, 42] scale was bipolarin nature (from happy to neutral to worried). Tomlinsonet al. [43] suggest that showing a range of emotions on thesame scale that require anxiety judgment maybe difficult forchildren to understand. Nevertheless, it is evident that thechildren in our study were also able to use our faces worryscale to rate their worry about general math and literacyabilities.
It has been claimed that worry interferes with cognitionbecause it focuses attention on intrusive thoughts rather thanthe task at hand [10, 11, 21]. Further, MA is claimed to

Child Development Research 9
reduce working memory capacity, which in turn affects mathperformance. Two findings from the present study are rele-vant here. First, a relationship between worry subgroup andperformance emerged in comparing performance among thethree math worry subgroups. Children in the high-worrygroup made fewer correct judgments than children in thelow-worry group judging difficult problems. In the literacytask, overall worry groups differed in judgment accuracy,although no specific subgroup differences were identified.However, recent research suggests that the relationshipbetween numerical cognition and MA is complex. For exam-ple, individuals with high MA also possess poor (1) spatialprocessing ability [42, 44], (2) dot enumeration [45], and (3)symbolic number comparison abilities [46]. These findingssuggest that much more work needs to be undertaken tounpack the relationships between MA, numerical cognitiveabilities, and math performance.
The present research findings have implications foreducational practitioners. In particular, our findings showthat it is possible to identify “at risk worry”-children earlierthan previously thought. Moreover, it might be valuableto inform teachers of the consequences of academic-relatedworry on performance so that they can help at risk childrenminimize worry. Future research should focus on the impacton children’s academic performance of reducing worry (see[47], e.g., on reducing, alleviating, and managing anxiety instudents).
Although the current research findings provide evidencefor a relationship between academic-related worry and theassociated academic competencies, it is limited in at leastthree respects. First, the sample size (n = 58) was relativelysmall and limited possible analyses. In particular, with alarger sample we would have been able to investigate thedirection of causal effects more explicitly. Second, it isevident the future research should examine the relationshipsbetween general cognitive factors (e.g., different measures ofworking memory), specific aspects of numerical cognition(e.g., dot enumeration, number comparison), problem solv-ing, and worry. Third, in the present study, we were unableto examine the sequelae associated with response times.Studies have shown that time pressure affects anxiety ratings,and manipulating time requirements might shed moreinformation about the relationships between worry, problemsolving, and cognition.
Interestingly, similar to other researchers who haveexamined MA in preadolescent children, we found no sexdifferences in worry judgments [2, 12, 40]. The absence ofa gender effect stands in contrast to research with adolescentsamples [9, 48] in which gender differences have been foundin MA. The developmental context in which MA gendereffects emerge requires research.
The present study investigated 9-year-olds’ worries usinga sensitive measure in two academic domains—math andlanguage—and the relationship between worry and problemsolving ability. Results showed that children’s worry variedwith problem difficulty, and that math and literacy worry dif-fered from nonacademic worry. Moreover, math worry pre-dicted math ability, and a negative association was observedbetween high math worry and math performance. It is
evident that the faces worry scale is a sensitive worry measurefor assessing both immediate problem solving and moregeneral academic worries. Nevertheless, more research isneeded to investigate worry ratings across a broader rangeof academic-related problems that differ in difficulty, as wellas to investigate how worry ratings change over time.
Acknowledgments
The authors would like to thank our colleagues Jacob Pauland Kelly Trezise for their willingness to discuss the researchdescribed herein: the paper benefitted greatly from theirinput. They would also like to thank Dr. Krinzinger and threeanonymous reviewers for the helpful comments made on anearlier draft of the paper.
References
[1] A. Dowker, Individual Differences in Arithmetic: ImplicationsFor Psychology, Neuroscience and Education, Psychology Press,Hove, UK, 2005.
[2] A. Wigfield and J. L. Meece, “Math anxiety in elementary andsecondary school students,” Journal of Educational Psychology,vol. 80, no. 2, pp. 210–216, 1988.
[3] J. M. Carroll, B. Maughan, R. Goodman, and H. Meltzer,“Literacy difficulties and psychiatric disorders: evidence forcomorbidity,” Journal of Child Psychology and Psychiatry andAllied Disciplines, vol. 46, no. 5, pp. 524–532, 2005.
[4] M. H. Ashcraft and A. M. Moore, “Mathematics anxiety andthe affective drop in performance,” Journal of Psychoeduca-tional Assessment, vol. 27, no. 3, pp. 197–205, 2009.
[5] R. Hembree, “The Nature, effects, and relief of MathematicsAnxiety,” Journal For Research in Mathematics Education, vol.21, pp. 33–46, 1990.
[6] M. H. Ashcraft and K. S. Ridley, “Math anxiety and its cogni-tive consequences,” in Handbook of Mathematical Cognition, J.I. D. Campbell, Ed., pp. 315–327, Psychology Press, New York,NY, USA, 2005.
[7] H. Z. Ho, D. Senturk, A. G. Lam et al., “The affective andcognitive dimensions of math anxiety: a cross-national study,”Journal for Research in Mathematics Education, vol. 31, no. 3,pp. 362–379, 2000.
[8] W. S. Bush, “Factors related to changes in elementary students’mathematics anxiety,” Focus on Learning Problems in Mathe-matics, vol. 13, pp. 33–43, 1991.
[9] X. Ma, “A meta-analysis of the relationship between anxietytoward mathematics and achievement in mathematics,” Jour-nal for Research in Mathematics Education, vol. 30, no. 5, pp.520–540, 1999.
[10] H. Krinzinger, L. Kaufmann, and K. Willmes, “Math anxietyand math ability in early primary school years,” Journal ofPsychoeducational Assessment, vol. 27, no. 3, pp. 206–225,2009.
[11] M. H. Ashcraft, J. A. Krause, and D. R. Hopko, “Is mathanxiety a mathematical learning disability?” in Why is MathSo Hard For Some Children? the Nature and Origins of Mathe-matical Learning Difficulties and disabilities, D. B. Berch and M.M. Mazzocco, Eds., pp. 329–348, Paul H. Brookes Publishing,Baltimore, Md, USA, 2007.
[12] M. J. Gierl and J. Bisanz, “Anxieties and attitudes relatedto mathematics in Grades 3 and 6,” Journal of ExperimentalEducation, vol. 63, pp. 139–158, 1995.

10 Child Development Research
[13] M. A. Campbell and R. M. Rapee, “Current issues in the assess-ment of anxiety in children and adolescents: a developmentalperspective,” Behaviour Change, vol. 13, no. 3, pp. 185–193,1996.
[14] C. R. Brewin, B. Andrews, and I. H. Gotlib, “Psychopathologyand early experience: a reappraisal of retrospective reports,”Psychological Bulletin, vol. 113, no. 1, pp. 82–98, 1993.
[15] P. Harris, Children and Emotion: The Development of Psycho-logical Understanding, Basil Blackwell, Oxford, UK, 1989.
[16] G. Thomas and A. Dowker, “Mathematics anxiety and relatedfactors in young children,” in Proceedings of the British Psycho-logical Society Developmental Section Conference, Bristol, UK,September 2000.
[17] M. W. Faust, Analysis of physiological reactivity in mathematicsanxiety [doctoral dissertation], Bowling Green State University,Columbus, Ohio, USA, 1992.
[18] E. Satake and P. P. Amato, “Mathematics anxiety and achieve-ment among Japanese elementary school students,” Educa-tional and Psychological Measurement, vol. 55, pp. 1000–1008,1995.
[19] F. Yυksel-Sahin, “Mathematics anxiety among 4thand 5thGrade Turkish elementary school students,” International Elec-tronic Journal of Mathematics Education, vol. 3, pp. 179–192,2008.
[20] M. W. Eysenck and M. G. Calvo, “Anxiety and performance:the processing efficiency theory,” Cognition and Emotion, vol.6, pp. 409–434, 1992.
[21] X. Ma and J. Xu, “The causal ordering of mathematics anxietyand mathematics achievement: a longitudinal panel analysis,”Journal of Adolescence, vol. 27, no. 2, pp. 165–179, 2004.
[22] M. H. Ashcraft and M. W. Faust, “Mathematics anxiety andmental arithmetic performance: an exploratory investigation,”Cognition and Emotion, vol. 8, no. 2, pp. 97–125, 1994.
[23] J. C. Raven, J. H. Court, and J. Raven, Manual For Raven’sProgressive Matrices and Vocabulary scales, Lewis, London, UK,1986.
[24] R. F. Salame, “Test anxiety: its determinants, manifestations,and consequences,” in Advances in Test Anxiety Research, H.M. van der Ploeg, R. Schwarzer, and C. D. Spielberger, Eds.,pp. 83–119, Lawrence Erlbaum Associates, Hillside, NJ, USA,1984.
[25] K. H. Canobi, R. A. Reeve, and P. E. Pattison, “Young children’sunderstanding of addition concepts,” Educational Psychology,vol. 22, no. 5, pp. 513–532, 2002.
[26] W. A. Garnham, J. Brooks, A. Garnham, and A. M. Osten-feld, “From synonyms to homonyms: exploring the role ofmetarepresentation in language understanding,” Developmen-tal Science, vol. 3, no. 4, pp. 428–441, 2000.
[27] C. Quaiser-Pohl, “The mental cutting test “schnitte” and themental rotation rotation test—two new measures to assessspatial ability,” International Journal of Testing, vol. 3, pp. 219–231, 2003.
[28] D. Bieri, R. A. Reeve, G. D. Champion, L. Addicoat, and J.B. Ziegler, “The faces pain scale for the self-assessment ofthe severity of pain experienced by children: development,initial validation, and preliminary investigation for ratio scaleproperties,” Pain, vol. 41, no. 2, pp. 139–150, 1990.
[29] H. R. Chapman and N. Kirby-Turner, “Visual/verbal analoguescales: examples of brief assessment methods to aid manage-ment of child and adult patients in clinical practice,” BritishDental Journal, vol. 193, no. 8, pp. 447–450, 2002.
[30] K. E. Howard and R. Freeman, “Reliability and validity ofa faces version of the modified child dental anxiety scale,”
International Journal of Paediatric Dentistry, vol. 17, no. 4, pp.281–288, 2007.
[31] J. N. Stinson, T. Kavanagh, J. Yamada, N. Gill, and B.Stevens, “Systematic review of the psychometric properties,interpretability and feasibility of self-report pain intensitymeasures for use in clinical trials in children and adolescents,”Pain, vol. 125, no. 1-2, pp. 143–157, 2006.
[32] H. J. Lyneham, A. K. Street, M. J. Abbott, and R. M. Rapee,“Psychometric properties of the school anxiety scale—teacherreport (SAS-TR),” Journal of Anxiety Disorders, vol. 22, no. 2,pp. 292–300, 2008.
[33] L. A. Goodman, “Latent class analysis: the empirical study oflatent types, latent variables, and latent structures,” in AppliedLatent Class Analysis, J. A. Hagenaars and A. L. McCutcheon,Eds., pp. 3–53, Cambridge University Press, Cambridge, UK,2002.
[34] G. J. McLachlan and D. Peel, Finite Mixture Models, John Wiley& Sons, New York, NY, USA, 2000.
[35] C. M. Hurvich and C. L. Tsai, “Regression and time seriesmodel selection in small samples,” Biometrika, vol. 76, no. 2,pp. 297–307, 1989.
[36] H. Bozdogan, “Model selection and Akaike’s Information Cri-terion (AIC): the general theory and its analytical extensions,”Psychometrika, vol. 52, no. 3, pp. 345–370, 1987.
[37] J. Magidson and J. K. Vermunt, “Latent class clusteringas a probabilistic extension of K-Means,” Quirk’s MarketingResearch Review, vol. 20, pp. 77–80, 2002.
[38] J. Magidson and J. K. Vermunt, “Latent class models forclustering: a comparison with K-means,” Canadian Journal ofMarketing Research, vol. 20, pp. 36–43, 2002.
[39] L. M. Collins and S. T. Lanza, Latent Class and Latent Tran-sition Analysis For the Social, Behavioral, and Health Sciences,John Wiley & Sons, New York, NY, USA, 2010.
[40] C. B. Young, S. S. Wu, and V. Menon, “The neurodevelop-mental basis of math anxiety,” Psychological Science, vol. 23,pp. 492–501, 2012.
[41] J. M. Carroll and J. E. Iles, “An assessment of anxiety levelsin dyslexic students in higher education,” British Journal ofEducational Psychology, vol. 76, no. 3, pp. 651–662, 2006.
[42] H. Krinzinger, G. Wood, and K. Willmes, “What accounts forindividual and gender differences in the multi-digit numberprocessing of primary school children?” Zeitschrift fur Psy-chologie, vol. 220, pp. 78–79, 2012.
[43] D. Tomlinson, C. L. von Baeyer, J. N. Stinson, and L. Sung,“A systematic review of faces scales for the self-report of painintensity in children,” Pediatrics, vol. 126, no. 5, pp. e1168–e1198, 2010.
[44] E. A. Maloney, S. Waechter, E. F. Risko, and J. A. Fugelsang,“Reducing the sex difference in math anxiety: the role ofspatial processing ability,” Learning and Individual Differences,vol. 22, no. 3, pp. 380–384, 2012.
[45] E. A. Maloney, E. F. Risko, D. Ansari, and J. Fugelsang, “Math-ematics anxiety affects counting but not subitizing duringvisual enumeration,” Cognition, vol. 114, no. 2, pp. 293–297,2010.
[46] E. A. Maloney, D. Ansari, and J. A. Fugelsang, “The effect ofmathematics anxiety on the processing of numerical magni-tude,” Quarterly Journal of Experimental Psychology, vol. 64,no. 1, pp. 10–16, 2011.
[47] E. A. Maloney and S. L. Beilock, “Math anxiety: Who hasit, why it develops, and how to guard against it,” Trends inCognitive Sciences, vol. 16, no. 8, pp. 404–406, 2012.

Child Development Research 11
[48] X. Ma and F. Cartwright, “A longitudinal analysis of genderdifferences in affective outcomes in mathematics during mid-dle and high school,” School Effectiveness and School Improve-ment, vol. 14, no. 4, pp. 413–439, 2003.

Hindawi Publishing CorporationChild Development ResearchVolume 2012, Article ID 170310, 12 pagesdoi:10.1155/2012/170310
Research Article
Primary School Age Students’ SpontaneousComments about Math Reveal Emerging DispositionsLinked to Later Mathematics Achievement
Michele M. M. Mazzocco,1, 2 Laurie B. Hanich,3 and Maia M. Noeder4
1 Institute of Child Development, University of Minnesota, 51 East River Parkway, Minneapolis, MN 55455, USA2 Johns Hopkins University School of Education Baltimore, MD 21218, USA3 Department of Educational Foundations, Millersville University of Pennsylvania, P.O. Box 1002,Millersville, PA 17551, USA
4 Department of Psychology, Case Western Reserve University, 10900 Euclid Avenue, Cleveland, OH 44106-7123, USA
Correspondence should be addressed to Michele M. M. Mazzocco, [email protected]
Received 12 June 2012; Revised 10 August 2012; Accepted 10 August 2012
Academic Editor: Ann Dowker
Copyright © 2012 Michele M. M. Mazzocco et al. This is an open access article distributed under the Creative CommonsAttribution License, which permits unrestricted use, distribution, and reproduction in any medium, provided the original work isproperly cited.
To longitudinally explore children’s developing beliefs towards mathematics, we asked 207 children to define “math” and “reading”at grades 2 and 3 and coded for spontaneous references to likability or difficulty of math (or reading) in their definitions. We foundthat children attributed more difficulty to math than to reading despite their relatively neutral comments on the likability of eithersubject. Children described math and reading with comparable degrees of specificity, but girls’ definitions were more specific thanboys’. Relative to their peers, children with mathematics learning disability (MLD) provided less specific definitions overall, weremore likely to describe math as more difficult than reading, and were more likely to show a decrease in likability ratings of math(but not reading) from grades 2 to 3. Grade 2 ratings predicted math ability at grade 3, more so than predictors from grade 3.These findings, although based on informal analyses not intended to substitute for validated assessments of disposition, supportthe notions that distinct aspects of dispositions towards math emerge in early childhood, are revealed through casual discourse,and are predictive of later math achievement outcomes. This further supports current interests in developing formal measures ofacademic disposition in early childhood.
1. Introduction
A productive disposition towards mathematics is an essentialcomponent of mathematics proficiency [1]. Like manyelements of successful mathematics outcomes, the constructof a “productive disposition” is multifaceted. The NationalResearch Council [1] defines it as “the tendency to seesense in mathematics, to perceive math as both useful andworthwhile, and to believe that steady effort in learningmathematics pays off.” At a minimum, this descriptioncaptures features of positive attitudes about mathematics,seeing sense in mathematics, the belief that effort is neededto support math learning, and a perspective that math isuseful within and beyond school experiences—regardless of
whether it is liked or disliked or achieved with minimal orgreat effort. Associations between these and other distinctfeatures of a productive disposition are likely to be dynamic,but the nature and emergence of the elements themselvesare not yet fully understood, particularly in early childhood.Here we report on a brief, exploratory study of whethersecond and third graders’ definitions of mathematics shedlight on their emerging dispositions and are related to theirlater mathematics achievement.
The recent interest in measuring beliefs about mathemat-ics in early childhood (e.g., [2, 3]) has yielded evidence of areciprocal relationship between math interest or beliefs andmath ability, even in preschoolers [4]. Accordingly, in thisstudy we ask whether children’s spontaneous conversations

2 Child Development Research
about math reveal tendencies in their beliefs. Specifically, weask if children’s definitions of “math” reveal children’s beliefsabout whether math is easy or difficult, liked or disliked, oruseful. We ask whether these potential disposition featuresapply to math specifically or to school subjects in generalby asking our participants to also define “reading.” By com-paring definitions of math (and reading) among childrenwith a wide range of math achievement levels (includingchildren with mathematics learning disability (MLD)), wetest the plausibility that early indicators of children’s beliefsabout math contribute to predicting their future mathe-matics outcomes. We base this hypothesis on prior researchdemonstrating that elementary school students’ beliefs abouttheir ability and subjective task values in mathematics predicttheir current and future activity choices [5, 6].
Until recently, dispositions towards math and relatedconstructs, such as math anxiety, were often not evaluatedbefore middle school [7] or high school [8]. This is troublingin light of evidence of age-related changes in children’s moti-vational patterns. Whereas most students begin schoolingenthusiastically [1], a shift from intrinsic to extrinsic motiva-tional orientations emerges at about grade 3 (approximately8 years of age) [9, 10]. This type of progression has beenreported for measures of attitudes and curiosity [11, 12],perceived competence [13–15], and beliefs about intelligence[16], and suggests that early childhood (prior to and upto grade 3) may be an essential period for establishing,maintaining, or at least initiating the foundation of apositive disposition towards mathematics. Moreover, whiledeveloping productive dispositions is important for childrenacross a wide range of achievement levels, this may beespecially important for students at risk for low mathematicsachievement and/or MLD.
To explore how productive learning dispositions arecultivated in early childhood, we utilized an expectancy-value model of achievement motivation [17] which asserts aproportional relationship between task engagement, expec-tations for success, and subjective task values. Specifically,the amount of effort children invest in an activity (e.g.,mathematics engagement) is a product of their expectationsfor success and the extent to which they value the task.These components are influenced by children’s perceptionsof competence, task difficulty, and affect, and have beenshown to directly affect achievement-related behaviors (asreviewed elsewhere [17]). In the present study, we didnot objectively measure students’ efforts nor did we relyon self-report measures related to subjective task value.Rather, we used open-ended questioning to specificallytest whether indicators of beliefs and values related tomathematics emerge from spontaneous conversations withyoung children. In particular, we focused on the extent towhich children’s responses reflect affect (likability), perceivedtask difficulty, and values reflected in the specificity withwhich their responses relate to the usefulness of mathematics.The expectancy-value model provided a useful frameworkfor considering the types of beliefs on which to focus incoding children’s responses, and for interpreting our findingsgiven the similarities between our variables of interest andthose proposed as part of this theoretical model.
What is the relevance of spontaneous conversations ofthis type in the context of evaluating children’s beliefsabout math? First, early conversations about math providea mechanism by which adults can deliberately attend tothe potential influences they have on their children’s orstudents’ math-oriented beliefs. Second, in addition to usingconversations to nurture the development of a healthy mathdisposition, conversations can be monitored for indicators ofa child’s emerging beliefs. In other words, early conversationsare useful as a platform for adults’ messages to children, butalso for attending to children’s comments—spontaneous orstructured.
Why are children’s early comments about math poten-tially important? In view of emerging evidence that earlybeliefs about mathematics are related to later achievementoutcomes, efforts to steer children from paths towardsnegative outcomes should begin in early childhood, whenchildren’s beliefs may be more malleable rather than deeplyrooted. Consequences of negative beliefs towards math arefrequently described in terms of secondary-school behaviors,such as avoidance of elective mathematics courses aftergrade 10 (age 15 years) [18]. But the antecedents of suchavoidance likely occur much earlier. For example, a negativerelationship between math anxiety and math achievementhas been observed among elementary school aged childrenwith high working memory capacity [19, 20], and among ele-mentary aged students who believe math-gender stereotypeswith female students showing weaker identification withmathematics than their male counterparts despite similarlevels of achievement [21, 22]. Gender stereotypes havebeen shown to influence mathematics achievement gainsin first or second grade (ages 6 and 7 years), at leastamong young girls who conform to the belief that femalesunderperform in math relative to males, and particularlyamong girls who receive instruction from a teacher withelevated levels of anxiety about mathematics [2]. These earlyassociations warrant attention; information from informalconversation may be among the earliest indicators to directadults’ attention to students’ emerging dispositions.
Children’s math ability self-perceptions become wellestablished in elementary school (e.g., [6]), but parentexpectancies and attributions may influence children’s mathbeliefs [23, 24] before and after the onset of formal schooling.Parents who believe that math and science are male-orienteddomains tend to overestimate their sons’ math and scienceperformance and underestimate their daughters’ perfor-mance in math and science at least in mid- to late-elementaryschool [25]. In middle school students, this underestimationmay impact self-concepts and self-underestimation of mathability [26, 27]. These findings suggest that teacher andparent behaviors can and do play a major role in studentlearning, and that efforts to counter such effects on negativebeliefs about math and achievement-related perceptionsshould begin in early childhood [23]. Listening to children’sdialogues about math may contribute to these efforts andprovide opportunity for intercession.
There are a number of ways to evaluate math beliefs. Rat-ings of children’s math self-perception and their enjoymentof mathematics are objectively measureable in elementary

Child Development Research 3
school aged children [13–15, 28] and earlier [4]. Here, wepropose that discourse may serve not only as a means forparents and teachers of young children to help shape apositive disposition towards math through adult-initiated“math talk,” but also as a means for adults to gleaninformation about a child’s emerging disposition, despite thefact that dialogues are no substitute for formal screening anddiagnostic assessments of risk for poor math outcomes.
What aspects of children’s early dispositions towardsmathematics are revealed during open-ended discussions,and are these beliefs related to formal math outcomes? Toaddress these questions, in the present study we used a simpleand straightforward approach to elicit children’s sponta-neous comments about math. Importantly, we avoidedexplicit prompting for information about beliefs about mathin order to focus on children’s spontaneous comments.Although findings to emerge from this approach do notreveal causal pathways to successful mathematics, evidence ofthe mere presence of relevant information from spontaneousspeech has implications for the role of early conversationsabout mathematics among children and their parents, teach-ers, and care providers in shaping or supporting a child’sdisposition towards mathematics.
2. Method
2.1. Participants. Participants were drawn from a largerlongitudinal study of mathematics achievement and mathe-matics learning disabilities during the primary school agedyears, described elsewhere in more detail [29]. Briefly, theparticipants from the larger study were recruited from23 kindergarten classrooms across seven schools in onelarge metropolitan public school district. The participatingschools were selected based on their relatively low ratesof mobility and free or reduced lunch participation, todiminish attrition and decrease the likelihood that poormath performance observed among participants was linkedto low socioeconomic status. Of the 445 kindergartners fromthese classrooms invited to participate, 249 enrolled (129girls). Participation in the present study was limited to the207 children (107 girls) who completed annual assessmentsduring both grades 2 and 3. Of the 207 included, most(86.5%) participants were white, 8% were black, 3% wereAsian, and the remaining 2.5% represented other or mixedethnicities.
2.2. Materials and Procedures. During each year of the study,children were tested individually by one of five femaleexaminers. Testing occurred during two or three sessions upto 45 minutes each, in a room separate from the classroomor other distracting activities. The testing battery includeda range of standardized and experimental assessments. Themeasures relevant to the present report are two measures ofmathematical ability, and a vocabulary probe administeredto glean information about each participant’s beliefs aboutmathematics.
2.2.1. Test of Early Math Ability-Second Edition (TEMA-2,[30]). The TEMA-2 is a standardized measure of formal and
informal mathematical ability normed for use with childrenages 2 to 8 years, 11 months. Items from the TEMA-2include basic knowledge items such as counting principles,calculation and fact retrieval items, and items testing placevalue concepts or word problem solving. Total correct scoresare converted to age-referenced standard scores for whichtest-retest reliability is 0.94 [30].
We administered the TEMA-2 to participants in thelongitudinal study, from kindergarten through grade 3. Inthe present study, we used the standard scores from all fourgrades to assign children to one of three groups: childrenwith mathematical learning disability (MLD), children withlow mathematics achievement (LA), and children with ageappropriate math achievement (typically achieving or TA).For the participants who exceeded the upper age level for theTEMA-2 ceiling at grade 3, we calculated prorated standardscores using regression-models to predict age 9 years and age9.5 years outcomes, based on data from over 200 childrenwho completed the TEMA-2 during all four years of thestudy. The criteria for these participant groups, describedelsewhere in detail [31], reflect the growing consensus thatMLD classification is strengthened by considering scoresover time, rather than one score at a single assessment.Children with TEMA-2 scores below the 10th percentile ofthe study sample were classified as having MLD (n = 18) andchildren with scores between the 11th to 25th percentile wereclassified as having low achievement in mathematics (LA;n = 26). These criteria were met during at least two of thefour grades tested, provided that scores during any remainingyears fell within the 95th percentile confidence interval of the10th or 25th percentile cut off, respectively. Children whodid not meet these criteria and who scored above the 25thpercentile (or within the 95th percentile confidence intervalfor this range) were classified as typically achieving (TA; n =163).
2.2.2. Woodcock Johnson—Revised Calculations (WJ-R Calc).The Woodcock Johnson Psycho-Educational Battery-Revised[32] is a widely used standardized test of formal academicskills and is normed for use with children ages 2 to 21years. The WJ-R Calculation subtest, normed for ages 6and older, is an untimed paper-and-pencil test that includesa range of arithmetic problems presented in order ofincreasing difficulty. We administered this subtest at grades1 and 3. Due to floor effects, we did not administer thetest at kindergarten; due to time constraints, it was notadministered at grade 2. Internal consistency reliability forthe WJ-R Calc subtest ranges from r = .89 to r = .93across ages 6–9 years [33]. In the present study, we used thestandard scores from the WJ-R Calc subtest at grade 3 as thedependent variable in select analyses, controlling for earliermath performance (WJ-R Calc performance at grade 1).
2.2.3. Defining “Mathematics.” During select years of thelongitudinal study, the test battery included a standardizedexpressive vocabulary test from the Stanford Binet FourthEdition [34] (at grades K to 2) or the Wechsler AbbreviatedScale of Intelligence [35] (at grade 3). These subtests involved

4 Child Development Research
asking children to define a word presented orally by theexaminer, beginning and ending at standardized basals andceilings based on the examinee’s age. In accordance withthese standardized protocols, we asked each participant,“what is math?” followed by, “what is reading?” withoutany prompting for any specific or additional information.Only if a child responded with the equivalent of, “I donot know,” we added the following prompt: “Just tell mewhat you think (math/reading) is.” These definitions wereelicited after a child reached a performance ceiling on thestandardized vocabulary subtest, so that the point at whicha definition was requested occurred at comparable levelsof performance fatigue for all participants. This procedurealso avoided unintentional alteration of the standardizedvocabulary subtest. Also, by requesting a definition of mathat the end of the expressive vocabulary test, we implicitlyestablished expectations for the amount of informationexpected in response, and could indirectly convey com-parable expectations about length of definitions for both“math” and “reading.” Definitions of math and reading wereobtained during grades 2 and 3.
Children’s responses were recorded verbatim and tran-scribed into a central database with child identifiers removed.This ensured that coders were blind to the children’sidentity, gender, or math achievement status. Each responsewas coded independently by two trained coders. Codingresponses were compared, and discrepancies were resolved ina coding meeting with the study PI and both coders present.Therefore, all definitions were double coded and, if there wasdisagreement, by three coders. Coding reliability is reportedsubsequently.
2.3. Coding Variables and Guidelines. Each definition wascoded separately for three attributes: the extent to whichthe child’s definition spontaneously reflected a like or dislikefor math or reading (likability code), whether the child’sdefinition made reference to ease or difficulty associatedwith math or reading (difficulty code), and how specificallymath or reading concepts, procedures, or uses were described(specificity code). One set of scoring criteria was developedfor each of the likability and difficulty coding protocols(Tables 1 and 2, resp.), each of which was applied todefinitions of math and reading. Two parallel sets of criteriawere established for coding the specificity of math (Table 3)and reading (Table 4) definitions.
The full range of possible likability codes was −2(extremely dislikes math or reading) to 2 (extremely likesmath or reading), with a code of 0 reflecting a neutralresponse (Table 1). Children’s responses were assigned codesbased on whether they were moderate (1) to strong or exag-gerated (2) statements; these were further coded as positive(1 or 2) or negative (−1 or −2). Neutral responses includedeither no negative or positive comments, or included both(e.g., “it is kind of fun, but sometimes it is boring”). Ofthe four sets of 207 valence codes assigned, there were2 disagreements among the 2 coders (99.9% agreement),which were resolved with a third coder/arbitrator. No childreceived a likability code of “2” for math at either grade,
although at both grades, codes of “2” were assigned forreading.
The full range of possible difficulty codes was −2 (verydifficult) to 2 (very easy), with a code of 0 reflecting noreference to either the difficulty or ease associated withmathematics or reading (Table 2). Of the four sets of 207difficulty codes, there were 19 disagreements among the 2coders (99.97% agreement), which were all resolved with athird coder/arbitrator. No child received a code of “2” (veryeasy) for either math or reading, at either grade.
Specificity codes ranged from 1 to 5, reflecting irrelevantor otherwise uninformative responses (1) to responsesreflecting mathematics (or reading) as a useful tool (5).A summary of these coding criteria and sample responsesappears in Tables 3 and 4. Of the four sets of 207 specificitycodes, there were 58 disagreements among the 2 coders(93.0% agreement), which were resolved with a thirdcoder/arbitrator.
All data were double entered into two excel spreadsheets,subtracted, and reviewed for discrepancies that were thencorrected until the subtraction comparisons yielded noerrors.
3. Results
3.1. Defining Math and Reading. First we asked whetherqualitative features of children’s definitions of math andreading differ as a function of gender or MLD status. Wecarried out three analyses of variance (ANOVAs), each basedon a 2 (subject area: math versus reading) × 2 (grades: 2and 3) × 2 (gender) × 3 (MLD status: TA, LA, and MLD)design, with repeated measures of the first two factors. Theoutcome variables were likability codes, difficulty codes, orspecificity codes from children’s spontaneous definitions ofmath and reading. Note that the means reported in the textare marginal estimated means whereas means reported in thefigures are observed means.
3.1.1. Children’s Likability for Math and Reading Definitions.We found no main effects of grade, MLD status, or gender onlikability codes, P > .437. Although mean codes for readingwere slightly more positive than those for math, the effectof subject area was not statistically significant, F(1, 201) =3.86, P = .051, partial η2 = 0.019. Group means for likabilitycodes were essentially neutral for math (−0.011) and reading(0.048) when collapsed across grade and MLD status.
Two-way interactions emerged for grade × MLD status,F(2, 201) = 3.86, P < .03, partial η2 = 0.037; and grade× subject area, F(1, 201) = 6.67, P < 0.02, partial η2 =0.032, but these effects were also very small. From grade 2to 3, valence codes did not change among children fromthe TA group (estimated marginal means = 0.032 and 0.023,resp.), became slightly more positive among children in theLA group (means = −0.017 and 0.095, resp.), and slightlymore negative among children with MLD (means = 0.013and −0.036, resp.). From grade 2 to 3, valance codes didnot change as much for math (means = 0.013 and −0.035,resp.) as they did for reading (means = 0.006 and 0.090,

Child Development Research 5
Table 1: Likability scores: coding criteria and real examples of math and reading definitions.
Score Definition Math examples Reading examples
−2 Extremely disliked, hated, or dreaded.Includes reference to words such as hate,worst, awful, and so forth.
n/aa “When you sit and read a book bored outof your mind.”
−1 Disliked or avoided. Includes reference towords such as do not like, not fun,boring, bad, and so on.
“Math is something Ido not like.”
“Something you do only when you needto do it, you have to read to figure outinformation.”
0 Neutral feeling or tolerated. Includes noreference to an emotion.
“When you learnmath problems.”
“Like when you read a book in school orat home.”
1 Liked or enjoyed. Includes reference towords such as play, fun, like, good, and soforth.
“Math is fun, youcould do math atschool—you could doit anywhere!”
“You can read for information or just forthe fun of it.”
2 Extremely liked, loved, or favored.Includes reference to words such as love,favorite, best, and so forth.
n/aa “Oh I love to read.”
Note: aNo responses were coded at this value.
Table 2: Difficulty scores: coding criteria and real examples of math and reading definitions.
Score Definition Math examples Reading examples
−2 Really hard. Includes reference to wordssuch as difficult, hard, or complex.
“Something you do in school. Somethingthat’s very, very hard.”
“Like you are reading and you are bad atreading and you read something like hardwords.”
−1 Kind of hard. Includes reference to wordssuch as the noun form of work, words likelearn, phrases that imply exertion zero, orimplicit or explicit reference to cognitiveprocesses.
“It is like problems that you have tosolve.”
“It is when there is like lots of sentencesand you read it to get information.”
0 Neutral difficulty. Includes no referenceto difficulty, refers to verbs such as work,do, use, teach, or “work with” withoutimplying exertion.
“Like math projects. Doing mathhomework.”
“You have a book and you read thewords.”
1 Kind of easy. Includes reference to wordssuch as “not hard” or words implyingease.
“It is easy and you have to do it in yourhomework.”
“To just lay back and read a book.”
2 Really easy. Includes reference to wordssuch as simple, effortless, or speed.
n/aa n/aa
Note: aNo responses were coded at this value.
resp.), but the direction of these changes differed with mathscores becoming slightly more negative, and reading scoresbecoming slightly more positive (Figure 1).
Even the strongest interaction to emerge from thisanalysis was associated with a small effect size, for a three-way interaction between subject area, grade, and MLD status,F(2, 201) = 5.53, P < .01, partial η2 = 0.052. Pairwisecomparisons indicated that children in the TA group maderelatively neutral references to both math and reading at
both grades (means = 0.012 for math at grades 2 and 3; andmeans = .051 and .034 for reading at grades 2 and 3, resp.),with little change from grades 2 to 3. Among children inthe LA group, valence codes for definitions of math becameslightly more negative over time (means = .000 to −0.045 atgrades 2 to 3, resp.), and slightly more positive for readingduring the same time period (means = −0.033 to 0.236).Children with MLD made neutral references when definingreading at both grades (both means = 0.000), whereas the

6 Child Development Research
Table 3: Specificity scores: coding criteria and real examples of math definitions.
Score Definition Examples
1 No response, a circular response, aresponse unrelated to math, or anotheruninformative response.
“You do your math.”“I cannot explain it.”“I do not know.”
2 Response is unspecific or only indirectlyrelated to math as a primary schoolsubject. The response may includereferences to activities performed inrelation to math or in a math class butwith no discernible reference to mathconcepts or procedures.
“You play games and stuff.”“Science.”“Like you do something. . .and you havepennies and money.”
3 Unelaborated basic concepts ormechanics of math. Includes reference toreal numbers, operations, mathproblems, or learning math.
“It has to do with numbers and sizes andfractions.”“It means taking away, subtracting, andmultiplication.”“When you do all sorts of problems likedivide, multiply, fractions, decimals.”“In my class we do like a drill so it likerefreshes our memory from the otherday.”
4 Elaborated concepts of math. “Like if you have a word problem, likeJim has 18 apples and eats 3, you usemath to solve it.”
5 Concept of math as a useful tool. “Math is something that people do andthey have to know math to be able to geta job and do other stuff.”
largest difference over time was the shift towards morenegative ratings of math among the MLD group (means =0.026 to −.071 from grades 2 to 3, a difference of −0.097).
In summary, at grades 2 and 3, boys and girls donot spontaneously make reference to extremely positive ornegative sentiments about math or reading when definingeither term, but there is a slight tendency for more negativecomments about math (versus reading) among children withMLD, and, to a lesser degree, among children with lowachievement in math.
3.1.2. Children’s Reference to the Difficulty of Math andReading. We also evaluated spontaneous comments aboutthe difficulty versus easiness of math or reading in our secondset of repeated measures ANOVAs. Here, the main effect ofsubject area was significant, F(1, 201) = 16.02, P < .0001,partial η2 = 0.074. Children’s definitions of math includedmore references to difficulty (mean code = −0.347) than didtheir definitions of reading (mean code = −0.171). The maineffect of MLD status reflected significantly more negativereferences (i.e., more ratings reflecting difficulty) to mathand reading in the MLD group (mean rating across subjectareas = −0.378), relative to the LA and TA groups (whosemeans ratings were −0.174 and −0.225, resp.), F(2, 201) =3.40, P < .05. Still, the effect was small, partial η2 = 0.033.Pairwise comparisons showed that math and reading ratings
combined were significantly more negative among the MLDversus LA or TA groups, P < .03, but did not differ betweenthe TA and LA groups, P = .361.
There was no main effect of grade or gender on difficultyratings, P > .87. No interactions were significant, with theexception of a weak three-way interaction between subjectarea × grade × gender, F(1, 201) = 4.26, P < .05, partialη2 = .021. Here, both boys and girls reported slightlygreater difficulty for math than reading at both grades. Thisdifference was more pronounced for girls than for boys atgrade 2 but not at grade 3. Over time, boys showed a slightshift towards reporting greater difficulty from grades 2 to3, for both math and reading; among girls, there was aslight shift towards reporting less difficulty for math (and nochange in reports of difficulty for reading) from grades 2 to 3(Figure 2).
In sum, at both grades 2 and 3, both boys and girls makereferences to math or reading as difficult (or as requiring“work” or exertion), but there is a tendency for math tobe described as slightly more difficult than reading, and atendency for children with MLD to rate both math andreading as more difficult compared to ratings assigned bytheir non-MLD peers.
3.1.3. Likability and Difficulty as Distinct Constructs. It ispossible that likability and difficulty ratings simply represent
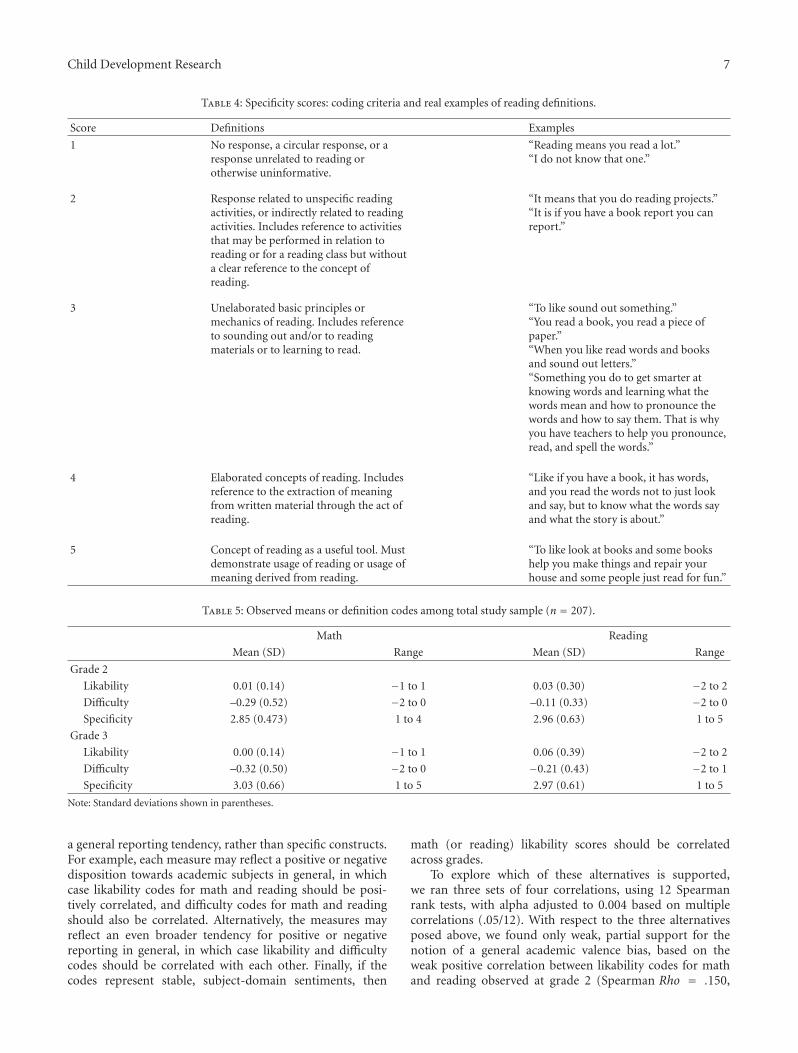
Child Development Research 7
Table 4: Specificity scores: coding criteria and real examples of reading definitions.
Score Definitions Examples
1 No response, a circular response, or aresponse unrelated to reading orotherwise uninformative.
“Reading means you read a lot.”“I do not know that one.”
2 Response related to unspecific readingactivities, or indirectly related to readingactivities. Includes reference to activitiesthat may be performed in relation toreading or for a reading class but withouta clear reference to the concept ofreading.
“It means that you do reading projects.”“It is if you have a book report you canreport.”
3 Unelaborated basic principles ormechanics of reading. Includes referenceto sounding out and/or to readingmaterials or to learning to read.
“To like sound out something.”“You read a book, you read a piece ofpaper.”“When you like read words and booksand sound out letters.”“Something you do to get smarter atknowing words and learning what thewords mean and how to pronounce thewords and how to say them. That is whyyou have teachers to help you pronounce,read, and spell the words.”
4 Elaborated concepts of reading. Includesreference to the extraction of meaningfrom written material through the act ofreading.
“Like if you have a book, it has words,and you read the words not to just lookand say, but to know what the words sayand what the story is about.”
5 Concept of reading as a useful tool. Mustdemonstrate usage of reading or usage ofmeaning derived from reading.
“To like look at books and some bookshelp you make things and repair yourhouse and some people just read for fun.”
Table 5: Observed means or definition codes among total study sample (n = 207).
Math Reading
Mean (SD) Range Mean (SD) Range
Grade 2
Likability 0.01 (0.14) −1 to 1 0.03 (0.30) −2 to 2
Difficulty –0.29 (0.52) −2 to 0 –0.11 (0.33) −2 to 0
Specificity 2.85 (0.473) 1 to 4 2.96 (0.63) 1 to 5
Grade 3
Likability 0.00 (0.14) −1 to 1 0.06 (0.39) −2 to 2
Difficulty –0.32 (0.50) −2 to 0 −0.21 (0.43) −2 to 1
Specificity 3.03 (0.66) 1 to 5 2.97 (0.61) 1 to 5
Note: Standard deviations shown in parentheses.
a general reporting tendency, rather than specific constructs.For example, each measure may reflect a positive or negativedisposition towards academic subjects in general, in whichcase likability codes for math and reading should be posi-tively correlated, and difficulty codes for math and readingshould also be correlated. Alternatively, the measures mayreflect an even broader tendency for positive or negativereporting in general, in which case likability and difficultycodes should be correlated with each other. Finally, if thecodes represent stable, subject-domain sentiments, then
math (or reading) likability scores should be correlatedacross grades.
To explore which of these alternatives is supported,we ran three sets of four correlations, using 12 Spearmanrank tests, with alpha adjusted to 0.004 based on multiplecorrelations (.05/12). With respect to the three alternativesposed above, we found only weak, partial support for thenotion of a general academic valence bias, based on theweak positive correlation between likability codes for mathand reading observed at grade 2 (Spearman Rho = .150,

8 Child Development Research
−0.2
0
0.2
0.4
Grade 2 Grade 3
Less
lika
ble
Mor
e lik
able
TALAMLD
MathReading
Figure 1: Observed means for likability scores, from grades 2 and3, depict the three following interactions: grade × MLD status,grade × subject area, and grade ×MLD status × subject area.
P = .031) but not at grade 3 (Spearman Rho = .0, P = 1.0);and positive correlations between difficulty codes for mathand reading at Grades 2 (Spearman Rho = .160, P = .022)and 3 (Spearman Rho = .311, P = .0001). Only the lattercorrelation at grade 3 met our adjusted significance criteriafor multiple correlations.
There was less support for a broad reporting dispositionbias, because likability and difficulty codes were not corre-lated with each other, P ranging from .096 to .594, withthe exception of the association between math likability anddifficulty at grade 3 only, −.148, P = .033, which did notmeet criteria adjusted for multiple correlations.
There was far more support for subject-specific likability(or difficulty) over time, suggesting that our codes areindicative of stable, and subject-domain beliefs, at least overthe short term (from grade 2 to 3): reading likability atgrade 2 was correlated with reading likability at grade 3(Spearman Rho = .239, P = .001), and reading difficultyat grades 2 and 3 were also correlated with each other
−0.4
−0.2
0
Grade 2 Grade 3
Mor
e di
fficu
lt
Less
dif
ficu
lt
BoysGirls
MathReading
Figure 2: Observed means for difficulty scores in grades 2 and 3depict the significant main effects of subject area and MLD status,and the significant three way interaction between grade, gender, andsubject area.
(Spearman Rho = .210, P = .002). Likewise, math likabilityat grades 2 and 3 were correlated with each other, (SpearmanRho = .251, P < .0003), although math difficulty scoreswere not correlated across grades (P = .816). All three ofthe significant results met our criteria adjusted for multiplecorrelations. Grade level means are reported in Table 5.
3.1.4. Subject-Area Specificity of Children’s Definitions of Mathand Reading. The third set of repeated measures ANOVAsconcerned the specificity of children’s descriptions of mathor reading, with codes reflecting noninformative to elaboratedescriptions (exemplified in Tables 3 and 4). There wasno main effect of subject area on this aspect of children’sdefinitions, P = .49. Responses ranged from 1 to 5 for bothmath and reading, with estimated marginal mean ratings of2.86 for math and 2.90 for reading, collapsed across all othervariables. There was no effect of grade on the specificity ofdefinitions (means = 2.85 to 2.91, at grades 2 and 3, resp.),P = .29.
Gender and MLD status each contributed significantly tovariance in the specificity of definitions. Girls gave slightlymore specific definitions of mathematics or reading (mean= 3.00) than did boys (mean = 2.75), F(1, 201) = 10.53,P = .001, partial η2 = 0.050. The main effect of MLD status,F(2, 201) = 4.30, P < .02, partial η2 = 0.041, reflected morespecific definitions of math or reading by children in the TA

Child Development Research 9
2.2
2.4
2.6
2.8
3
3.2
Boys Girls
Less
spe
cifi
cM
ore
spec
ific
TALAMLD
MathReading
Figure 3: Observed means for specificity scores depict significantmain effects of MLD status and gender, and the significant MLDstatus × gender interaction. Subject area is not significant.
group (mean = 3.00), relative to the MLD or LA groups (P <.02), which did not differ from each other, P = .68 (means =2.84 and 2.80, resp.).
The only interaction to reach statistical significance wasa two way interaction between MLD status and gender,F(2, 201) = 5.96, P < .004, partial η2 = 0.056. Thisinteraction reflects that girls’ ratings did not differ acrossMLD groups (with estimated marginal mean ratings of 2.99,2.96, and 3.07 across the TA, LA, and MLD groups, resp.),whereas boys’ ratings did (means = 3.02, 2.72, and 2.52, resp.;Figure 3).
3.2. Predicting Mathematics Achievement. Do these explor-atory measures predict future or concurrent math per-formance? We carried out two regression models, eachcomprised of three predictors of grade 3 WJ-R mathCalculation score as the outcome variable of interest. Thesemodels were based on predictors obtained at grade 2 orgrade 3 (grade level predictors examined separately). Whencombined, grade 2 likability, difficulty, and specificity codesaccounted for approximately 5% of the variance in WJ-RCalculation scores obtained at grade 3, F(3, 206) = 5.03, P <.003, adjusted r2 = .055. However, likability and difficultycodes did not contribute significantly to the model, P > .12,
whereas specificity codes did, t(206) = 3.11, beta = .212,P < .01.
Model strength improved significantly when grade WJ-R Calculation score was included as a predictor, F(4, 206) =32.47, P < .0001, adjusted r2 = .379. Still, the small con-tribution made by the specificity score remained significant,t(206) = 2.40, beta = .134, P < .02.
To examine whether concurrent predictors would bestronger than predictors obtained one year prior, the anal-ysis was repeated using grade 3 likability, difficulty, andspecificity codes to predict grade 3 WJ-R Calculation scores.The model strength for the grade 3 predictor model wasweaker than the aforementioned grade 2 predictor model,F(3, 206) = 3.00, P < .04, adjusted r2 = .028. Here, boththe specificity and likability codes predicted grade 3 WJ-RCalculation scores, but effects were small (t(206)s (beta) =2.12 (.147), and 1.99 (.138), resp., P < .05), and these effectsdisappeared when the grade 2 WJ-R Calculation scores wereadded to the model, P > .31
To evaluate whether the effect to emerge from grade 2predictors was specific to math disposition, we carried outparallel regression models using grade 2 or grade 3 likability,difficulty, and specificity codes from reading definitions, topredict WJ-R Calculation scores. Neither model accountedfor significant variation in grade 3 WJ-R Calculation scores,adjusted r2 < .02, P > .10.
4. Discussion
Our research questions examined primary school agedstudents’ spontaneous comments about mathematics andspecifically tested whether these comments reveal emergingdispositions linked to students’ later mathematics achieve-ment. Additionally, we tested the notion that beliefs aboutmath may differ among children with versus withoutMLD. For comparative purposes, children’s spontaneouscomments about reading were also obtained. Our approachinvolved a straightforward design to elicit spontaneouscomments of the kind that may emerge during casualverbal dialogue between young children and their parentsor teachers. Finally, by repeating this procedure during twoconsecutive grades, we were able to test short term stabilityor reliability of the codes we collected.
Despite the subtlety of our approach, our findingsindicate that children’s spontaneous comments about mathare informative even if they are no substitute for a structuredand validated assessment of disposition. Specifically, wefound that subject-specific comments about likability (ordifficulty) appear to be stable beliefs, at least from grade 2to 3. Lower likability ratings (i.e., more negative comments)were evident in definitions of math (versus reading) amongchildren with MLD, and, to a lesser degree, among childrenwith LA in math; but overall, reference to liking or dislikingmathematics was absent from most of the participants’spontaneous comments of math and variability was greateramong definitions of reading.
With regard to difficulty, children made more referencesto difficulty in definitions of math versus reading, collapsed

10 Child Development Research
across grades, groups, and gender. Children rarely, if ever,spontaneously remarked that math was easy but this wasalso true of reading. Children with MLD were more likelyto make references to difficulty of math than their peers,but they also made more references to reading as difficult.This finding is consistent with reports of high co-occurrenceof math and reading difficulties [36] and with reports thatchildren with MLD recognize their academic weakness inmathematics, as determined by ratings on self-perceptionmeasures [37]. However, Hanich and Jordan [37] found that,on measures of reading, children with math difficulties andnormal reading achievement do not rate their competencelower than children without math difficulties, although chil-dren with co-morbid math and reading difficulty do. Theyhypothesized that children in the math and reading difficultygroup in their study were more accurate at evaluating theirreading performance than math performance given thatmany of the children in this group were receiving specialeducation services for reading related problems, which mayhave contributed to the formation of children’s achievement-related beliefs.
Analyses related to specificity of children’s definitionsof math and reading showed that, in general, childrenreport unelaborated conceptions regarding the usefulness orimportance of both math and reading as a tool. The onlycontributions of MLD status to the specificity rating fromchildren’s definitions of math concerned slightly less specificdefinitions by the MLD and LA groups, relative to the TAgroup, more so for boys versus girls; but this finding alsoemerged from definitions of reading. Greater specificity indefinitions for math and reading were also observed amonggirls versus boys, which may simply reflect girls’ superiorexpressive vocabulary during the school age years.
Of the four main predictor variables examined acrossthese analyses—MLD status, subject area, gender, andgrade—the only variable to account for variability in allthree outcome variables was MLD status. Main effects orinteractions involving MLD status emerged for likability,difficulty, and specificity. Although it is erroneous to inferthat brief, open-ended questions like the ones used in ourstudy are appropriate for diagnosis of MLD, future andongoing work is needed to address the dynamic role(s) ofa productive disposition and long term math achievementoutcomes.
There were no gender differences in likability ratingsfor math or reading, but boys and girls reported slightlygreater difficulty for math than reading at both grades. Fromgrades 2 to 3, boys shifted towards reporting slightly greaterdifficulty for both math and reading over time, whereas girlsshifted towards reporting slightly less difficulty for math overtime. This may reflect differences in shift towards behavioralcompliance rather than a specific shift in beliefs about math-ematics, but neither explanation is supported by our data.The effect was small and warrants more in depth evaluation,especially in light of research that has found primary schoolaged boys identify more strongly with mathematics andhave higher self-concepts than girls despite similar levels ofmathematics achievement [22]. Other research conductedwith eighth graders found an absence of gender differences
in attitudes towards mathematics and achievement, althoughboys were more likely to attribute their math achievement totheir intellectual abilities than girls [38].
It is quite clear that the effects that emerged in thisexploratory study are small. Yet the fact that any suchfindings would emerge given the simplistic nature of ourquestioning is somewhat intriguing. Our ratings were basedon children’s unstructured responses to brief, open-endedquestions, “what is math?” and “what is reading?” andtheir definitions hint at potentially distinct elements ofa productive disposition towards math, evident at secondand third grades. This finding is consistent with factorsto emerge from formal assessments based research. Forinstance, Adelson and McCoach [28, 39] found evidence oftwo factors from their math attitudes survey given to upperelementary students (grades 3 to 5), reflecting an “enjoymentof math” construct (similar to our “likability” codes) anda “math self-perceptions” construct (similar to both our“difficulty” and “specificity” codes). Their development ofa structured survey supports the notion that individualdifferences in dispositions towards math exist and can bemeasured at grade 3 and above; we add that this work canlikely be extended downward to grade 2 and below. As ourwork and that of others indicates, some dispositional factorsmay be math-specific (“math is difficult”) whereas othersmay generalize to academic subjects.
4.1. Implications for Further Studies. Although our findingsdo not indicate causal pathways, they are consistent withevidence that primary school aged students’ interests orbeliefs about mathematics affect their achievement level orreflect risk status for future math outcome [2, 4]. Thepredictive contribution of grade 2 specificity ratings tomath scores at grade 3 suggests associations emerging inearly childhood. One possibility is that opinions about theimportance or challenges of math precede and direct learningor performance success, as has been implicated in workwith adults [40]; alternatively, earlier ability levels mayinfluence emerging opinions, such that these features operatedynamically throughout schooling. There is some evidencethat students’ perceived competence ratings and ratings ofenjoyment of mathematics are independent of achievementin the early years, but are related to math performanceat the end of elementary school [41]. Our findings runcounter to this conclusion, and thus support the contentionthat research on dispositional contributions to mathematicsachievement must include studies of early childhood.
These findings in early childhood have implications forteachers, parents, and care providers of young children. Ingeneral, children in our study expressed relative flat affectwith regard to their enjoyment of mathematics, did nothold very elaborate conceptions regarding the usefulness ofmathematics, and attributed more difficulty to mathematicthan reading. Despite the small effect size that emerged fromthese findings, these suggest potential negative outcomeswhen considered in the context of expectancy-value theory.According to the model, these dispositions run counterto facilitating engagement in mathematics activities given

Child Development Research 11
the proportional relationship among components of themodel (i.e., engagement = success expectancies× task value).However, the “neutral” codes for likability were based onspontaneous comments, and children may have respondedvery differently to prompts eliciting remarks about likingor disliking mathematics. To foster adaptive motivationalbehaviors, parents and teachers should provide feedbackto young children about the task values associated withmathematics, help students develop positive but accurateperceptions of their abilities, and teach children to effectivelyappraise learning to modify their achievement behaviors.
4.2. Limitations and Conclusions. There are several limita-tions to our exploratory study. Although our sample sizewas large and data collection over time was longitudinal,the time period over which we examined definitions ofmath and reading was limited to two consecutive years,and the number of students with MLD and LA was limitedby the defining criteria of these constructs (e.g., MLDoccurring in only ∼6–10% of the population, as it was inour study). The deliberately simplistic nature of our datacollection was consistent with our goal to evaluate morenaturalistic and spontaneous versus prompted commentsabout mathematics likability, difficulty, and specificity, butchildren’s comments could be elaborated upon throughstructured probes and conversations. For instance, mostchildren’s definitions received “neutral” codes for likability,but this does not mean that children did not have beliefsabout liking or disliking mathematics.
Our research question did not concern the strength ofchildren’s beliefs about math so much as the likelihood oftheir emergence during conversation. In addition to express-ing (or not expressing) beliefs about math and reading,the children in this study remind us of the importance oflistening to what they say, even during casual discourse. Thatis, adult-child discourse provides a means for parents andteachers to both nurture a child’s positive disposition towardsmath, and monitor the child’s emerging disposition.
Acknowledgments
This work was supported by a Grant from the SpencerFoundation awarded to M. M. M. Mazzocco and L. B.Hanich, based on data collected from a study supported byNIH Grant HD R01 34061 awarded to M. M. M. Mazzocco.The views expressed are solely those of the authors. Theywould like to thank the children who participated in thestudy, their parents and teachers, the staff at participatingBaltimore County Public School elementary schools; and ananonymous reviewer of an earlier version of this paper. Theyalso acknowledge the outstanding contributions of Gwen F.Myers, Project Manager for the longitudinal study, to thiswork and to the overall longitudinal research program.
References
[1] National Research Council, Adding It Up: Helping ChildrenLearn Mathematics, Mathematics Learning Study Committee,
Center for Education, Division of Behavioral and Social Sci-ences and Education, National Academy Press, Washington,DC, USA, 2001.
[2] S. L. Beilock, E. A. Gunderson, G. Ramirez, and S. C.Levine, “Female teachers’ math anxiety affects girls’ mathachievement,” Proceedings of the National Academy of Sciencesof the United States of America, vol. 107, no. 5, pp. 1860–1863,2010.
[3] T. Kutaka, C. P. Edwards, and W. M. Smith, “The relationshipbetween math competence beliefs and math ability scores inthe early primary years,” in Proceedings of the Annual Meetingof the American Education Research Association, Vancouver,Canada, April 2012.
[4] P. H. Fisher, J. Dobbs-Oates, G. L. Doctoroff, and D. H.Arnold, “Early math interest and the development of mathskills,” Journal of Educational Psychology, vol. 104, no. 3, pp.673–681, 2012.
[5] J. S. Eccles and A. Wigfield, “In the mind of the actor:the structure of adolescents’ achievement tasks values andexpectancy-related beliefs,” Personality and Social PsychologyBulletin, vol. 21, pp. 215–225, 1995.
[6] A. Wigfield, “Expectancy-value theory of achievement moti-vation: a developmental perspective,” Educational PsychologyReview, vol. 6, no. 1, pp. 49–78, 1994.
[7] J. Garofalo, “Beliefs and their influence on mathematicalperformance,” Mathematics Teacher, vol. 82, pp. 502–505,1989.
[8] A. H. Schoenfeld, “Explorations of students’ mathematicalbeliefs and behavior,” Journal for Research in MathematicsEducation, vol. 20, pp. 238–355, 1989.
[9] J. S. Eccles and C. Midgley, “Changes in academic motivationand self-perceptions during early adolescence,” in Advancesin Adolescent Development: From Childhood to Adolescence, R.Montemayor, G. R. Adams, and T. P. Gullotta, Eds., pp. 134–155, Sage, Thousand Oaks, Calif, USA, 1990.
[10] S. Harter, “A new self-report scale of intrinsic versus extrinsicorientation in the classroom: motivational and informationalcomponents,” Developmental Psychology, vol. 17, no. 3, pp.300–312, 1981.
[11] J. H. Corpus, M. S. McClintic-Gilbert, and A. O. Hayenga,“Within-year changes in children’s intrinsic and extrinsicmotivational orientations: contextual predictors and academicoutcomes,” Contemporary Educational Psychology, vol. 34, no.2, pp. 154–166, 2009.
[12] A. E. Gottfried, J. S. Fleming, and A. W. Gottfried, “Continuityof academic intrinsic motivation from childhood throughlate adolescence: a longitudinal study,” Journal of EducationalPsychology, vol. 93, no. 1, pp. 3–13, 2001.
[13] J. Eccles, A. Wigfield, R. D. Harold, and P. Blumenfeld, “Ageand gender differences in children’s self- and task perceptionsduring elementary school,” Child Development, vol. 64, no. 3,pp. 830–847, 1993.
[14] J. E. Jacobs, S. Lanza, D. W. Osgood, J. S. Eccles, and A.Wigfield, “Changes in children’s self-competence and values:gender and domain differences across grades one throughtwelve,” Child Development, vol. 73, no. 2, pp. 509–527, 2002.
[15] A. Wigfield, R. D. Harold, C. Freedman-Doan et al., “Changesin children’s competence beliefs and subjective task valuesacross the elementary school years: a three year study,” Journalof Educational Psychology, vol. 89, no. 3, pp. 451–469, 1997.
[16] D. J. Stipek and D. MacIver, “Developmental changes inchildren’s assessment of intellectual competence,” Child Devel-opment, vol. 60, pp. 521–538, 1989.

12 Child Development Research
[17] A. Wigfield and J. S. Eccles, “Expectancy-value theory ofachievement motivation,” Contemporary Educational Psychol-ogy, vol. 25, no. 1, pp. 68–81, 2000.
[18] M. C. Steffens, P. Jelenec, and P. Noack, “On the leakymath pipeline: comparing implicit math-gender stereotypesand math withdrawal in female and male children andadolescents,” Journal of Educational Psychology, vol. 102, no.4, pp. 947–963, 2010.
[19] S. Lau, A. D. Liem, and Y. Nie, “Task- and self-related pathwaysto deep learning: the mediating role of achievement goals,classroom attentiveness, and group participation,” BritishJournal of Educational Psychology, vol. 78, no. 4, pp. 639–662,2008.
[20] G. Ramirez, E. A. Gunderson, S. C. Levine, and S. L. Beilock,“Math anxiety, working memory and math achievement inearly elementary school,” Journal of Cognition and Develop-ment. In press.
[21] A. G. Greenwald, D. E. McGhee, and J. L. K. Schwartz,“Measuring individual differences in implicit cognition: theimplicit association test,” Journal of Personality and SocialPsychology, vol. 74, no. 6, pp. 1464–1480, 1998.
[22] D. Cvencek, A. N. Meltzoff, and A. G. Greenwald, “Math-gender stereotypes in elementary school children,” ChildDevelopment, vol. 82, no. 3, pp. 766–779, 2011.
[23] E. A. Gunderson, G. Ramirez, S. C. Levine, and S. L. Beilock,“The role of parents and teachers in the development ofgender-related math attitudes,” Sex Roles, vol. 66, pp. 153–166,2012.
[24] M. P. Levpuscek and M. Zupancic, “Math achievement inearly adolescence: the role of parental involvement, teachers’behavior, and students’ motivational beliefs about math,”Journal of Early Adolescence, vol. 29, no. 4, pp. 541–570, 2009.
[25] J. Tiedemann, “Parents’ gender stereotypes and teachers’beliefs as predictors of children’s concept of their mathe-matical ability in elementary school,” Journal of EducationalPsychology, vol. 92, no. 1, pp. 144–151, 2000.
[26] R. Bhanot and J. Jovanovic, “Do parents’ academic genderstereotypes influence whether they intrude on their children’shomework?” Sex Roles, vol. 52, no. 9-10, pp. 597–607, 2005.
[27] P. M. Frome and J. S. Eccles, “Parents’ influence on children’sachievement-related perceptions,” Journal of Personality andSocial Psychology, vol. 74, no. 2, pp. 435–452, 1998.
[28] J. L. Adelson and D. B. McCoach, “Development and psy-chometric properties of the Math and Me survey: measuringthird through sixth graders’ attitudes towards mathematics,”Measurement and Evaluation in Counseling and Development,vol. 44, pp. 225–247, 2011.
[29] M. M. M. Mazzocco and G. F. Myers, “Complexities inidentifying and defining mathematics learning disability in theprimary school-age years,” Annals of Dyslexia, vol. 53, pp. 218–253, 2003.
[30] H. Ginsburg and A. Baroody, Test of Early Mathematics Ability,PRO-ED, Austin, Tex, USA, 2nd edition, 1990.
[31] M. M. Murphy, M. M. M. Mazzocco, L. B. Hanich, and M. C.Early, “Cognitive characteristics of children with MathematicsLearning Disability (MLD) vary as a function of the cutoffcriterion used to define MLD,” Journal of Learning Disabilities,vol. 40, pp. 467–487, 2007.
[32] R. W. Woodcock and M. B. Johnson, Woodcock-Johnson Psy-choEducational Battery-Revised. Tests of Achievement, River-side, Itasca, Ill, USA, 1989.
[33] R. W. Woodcock and N. Mather, Woodcock Johnson Psycho-Educational Battery Revised, Tests of Achievement, Examiner’sManual, Riverside, Chicago, Ill, USA, 1990.
[34] R. L. Thorndike, E. P. Hagen, and J. M. Sattler, Guide forAdministering and Scoring the Fourth Edition Standford BinetIntelligence Scale, Riverside, Chicago, Ill, USA, 1986.
[35] D. Wechsler, Wechsler Abbreviated Scale of Intelligence (WASI),The Psychological, San Antonio, Tex, USA, 1999.
[36] L. B. Hanich, N. C. Jordan, D. Kaplan, and J. Dick, “Per-formance across different areas of mathematical cognitionin children with learning difficulties,” Journal of EducationalPsychology, vol. 93, no. 3, pp. 615–626, 2001.
[37] L. B. Hanich and N. C. Jordan, “Achievement-related beliefs ofthird-grade children with mathematics and reading difficul-ties,” Journal of Educational Research, vol. 97, no. 5, pp. 227–233, 2004.
[38] S. N. Geogiou, P. Stavrinides, and T. Kalavana, “Is Victor betterthan Victoria at maths?” Educational Psychology Review inPractice, vol. 23, pp. 329–342, 2007.
[39] J. L. Adelson and D. B. McCoach, “Measuring the mathemat-ical attitudes of elementary students: the effects of a 4-pointor 5-point likert-type scale,” Educational and PsychologicalMeasurement, vol. 70, no. 5, pp. 796–807, 2010.
[40] M. Cadinu, A. Maass, A. Rosabianca, and J. Kiesner, “Why dowomen underperform under stereotype threat? Evidence forthe role of negative thinking,” Psychological Science, vol. 16, no.7, pp. 572–578, 2005.
[41] P. Kloosterman and M. C. Cougan, “Students’ beliefs aboutlearning mathematics,” The Elementary School Journal, vol. 94,pp. 375–388, 1994.

Hindawi Publishing CorporationChild Development ResearchVolume 2012, Article ID 982672, 10 pagesdoi:10.1155/2012/982672
Research Article
Math Self-Assessment, but Not Negative Feelings, PredictsMathematics Performance of Elementary School Children
Vitor Geraldi Haase,1, 2, 3 Annelise Julio-Costa,1, 3 Pedro Pinheiro-Chagas,1, 3
Lıvia de Fatima Silva Oliveira,1, 2 Letıcia Rettore Micheli,4 and Guilherme Wood5
1 Developmental Neuropsychology Laboratory, Department of Psychology, Federal University of Minas Gerais,31270-901 Belo Horizonte, MG, Brazil
2 Child and Adolescent Health Graduate Program, Medical School, Federal University of Minas Gerais,31270-901 Belo Horizonte, MG, Brazil
3 Neuroscience Graduate Program, Federal University of Minas Gerais, 31270-901 Belo Horizonte, MG, Brazil4 Donders Institute for Brain, Cognition and Behavior, Radboud University Nijmegen, 106525 GA Nijmegen, The Netherlands5 Department of Neuropsychology, Institute of Psychology, Karl-Franzens-University of Graz, 8010 Graz, Austria
Correspondence should be addressed to Vitor Geraldi Haase, [email protected]
Received 9 May 2012; Revised 27 July 2012; Accepted 21 August 2012
Academic Editor: Mark Ashcraft
Copyright © 2012 Vitor Geraldi Haase et al. This is an open access article distributed under the Creative Commons AttributionLicense, which permits unrestricted use, distribution, and reproduction in any medium, provided the original work is properlycited.
Mathematics anxiety has been associated to performance in school mathematics. The association between math anxiety andpsychosocial competencies as well as their specific contribution to explain school mathematics performance are still unclear. Inthe present study, the impact of sociodemographic factors, psychosocial competencies, and math anxiety on mathematics andspelling performance was examined in school children with and without mathematics difficulties. The specific contributionsof psychosocial competencies (i.e., general anxiety and attentional deficits with hyperactivity) and math anxiety (i.e., self-assessment in mathematics) to school mathematics performance were found to be statistically independent from each other.Moreover, psychosocial competencies—but not math anxiety—were related also to spelling performance. These results suggestthat psychosocial competencies are more related to general mechanisms of emotional regulation and emotional response towardsacademic performance, while mathematics anxiety is related to the specific cognitive aspect of self-assessment in mathematics.
1. Introduction
Negative feelings about mathematics are usually associatedwith low mathematics achievement both in children andadults [1]. Mathematics anxiety (MA) is a feeling of tension,apprehension, or fear that interferes with mathematicsperformance, or as a state of discomfort in response tomathematics which is perceived as threatening to self-esteem[2]. As math anxious individuals avoid engagement in mathtasks, they dedicate less time and effort to learn mathematics,reach lower attainment levels, enroll less in mathematicscourses from high school onwards, and eventually selectmajors with lower mathematics requirements [3]. MA is thusof potential social and economic relevance in a globalizedculture that imposes greater and greater demands on science
and technology abilities of individuals in career as well as ineveryday life.
MA is related to more general forms of anxiety, but canbe distinguished from them. For instance, Young et al. [4]found brain activity patterns specific of MA to be unrelatedto general anxiety, intelligence, working memory, or readingability. In that study, higher levels of activation were observedin the amygdala and other regions associated with emotionalprocessing [4], while lower levels of activation were foundin areas associated to number processing and workingmemory [5]. MA has been linked to performance-relatedanxiety disorders such as test anxiety and social phobia[6–8]. Research also indicates that the genetic etiology ofanxiety disorders is unspecific, being shared by differentanxiety syndromes [9]. However, the correlations between

2 Child Development Research
behavioral measurements of MA and other forms of anxietyhave been found to range in the interval between .35 forgeneral anxiety, .38 for trait anxiety, and .52 for test anxiety[3]. Data suggesting specificity of MA were obtained byDew et al. [10, 11]. In that study, intercorrelations betweenthree MA measures varied from .50 to .80, while correlationsbetween MA and other forms of anxiety were substantiallylower (r’s from .30 to .50).
Aversive experiences with mathematics as well as theinteraction between the individual’s experience and vul-nerability have been related to the occurrence of MA [8,9, 12]. Two main vulnerability factors related to MA arefemale gender and low math achievement. There is a trendin females to report higher levels of MA [3, 13] despiteequivalent achievement [14]. This has been associated withhigher propensity of females to report feelings [8] and tosocial stereotyping [1, 14–16]. In an fMRI study, Krendlet al. [17] showed that in a neutral control condition, femaleparticipants activated usual frontoparietal math-related net-works in response to math tasks. Under conditions ofgender-stereotyped threat, math-related areas were inhibited,whereas the ventral anterior cingulate cortex was activated.Moreover, female reports on MA have been reported to bemediated by spatial cognitive ability, which is knowinglydependent on fetal androgen levels more than on socialstereotyping [18].
Low mathematics achievement and developmentaldyscalculia are other risk factors for MA. Results from twometa-analyses indicate that the correlations between MA andIQ are positive but low (r = .17). The association of IQ withmath achievement is slightly stronger (r’s between .27 and.34) [3, 13]. Several studies focused on the reversed causalitydirection in the assessment of the association between MAand achievement, but the results are inconsistent. Ma andXu [19] observed that low math achievement at Grade 7predicted high MA six years later, while the reverse was nottrue: initial MA was not statistically predictive of later lowachievement. Krinzinger et al. [20] showed that childrenbeing assessed from the 1st to 3rd Grade do not presentan effect of “math anxiety” [1] (Krinzinger et al. [20] useda two-factor model of math anxiety on the MathematicsAnxiety Questionnaire (MAQ, Krinzinger et al. [21]. Thefirst factor describes self-evaluation and math-relatedattitudes (“evaluation of mathematics”) while the secondfactor comprises negative emotions and worries concerningmathematics (“math anxiety”).) on calculation ability orvice versa. In that study, initial low calculation abilitywas predictive of “evaluation of mathematics.” Moreover,Rubinsten and Tannock [22] compared the performance of agroup of dyscalculics with that of typically achieving childrenin an affective arithmetic priming task. Negative affect andarithmetic stimuli induced comparable priming effectsin dyscalculics. In typically achieving children arithmeticpriming was not observed.
Relationships between MA and mathematics achieve-ment are complex and probably of two ways. For this reason,it is paramount to look not only at studies reporting effectsof arithmetics achievement on anxiety levels but also atstudies reporting effects of anxiety levels on arithmetics
achievement. There is an evidence that MA may moderatethe relationship between working memory and mathematicsachievement in mathematics disabled undergraduates [23].Moreover, in real-life situations, the impact of MA onmathematics achievement is mediated by cortisol levelsassociated with stress responses and anxiety [24]. Moreover,cognitive-behavioral interventions specifically addressinganxiety symptoms in mathematics disabled children havebeen shown to contribute to substantial improvement inmathematics achievement [25].
As MA probably originates from the interaction betweenindividual vulnerability and experience in the early schoolyears, it is necessary to investigate the specificity of thepresumed vulnerability. Three main issues are addressedin this study. First, we investigated whether children withmathematics difficulties (MD) present higher levels of MAcompared to typically achieving children (TA), as has beensuggested by previous results [22]. Concretely, we expectchildren with MD to present higher levels of mathematicsanxiety in the MAQ [21] when compared to matched TAchildren. Second, we tested whether MA can be dissociatedfrom general anxiety proneness and psychosocial competen-cies in children, as suggested by previous studies with adults[3, 10, 11]. We expect that a significant effect of MA wouldstill be present even after removing the impact of generalanxiety proneness and psychosocial competencies on math-ematics performance. Finally, we explored in more detail thespecificity of MA in mathematics achievement comparativelyto domains such as sociodemographic characteristics, psy-chosocial competencies, general cognitive abilities, and othernonmathematic academic subjects such as spelling ability.To examine the specificity of this relation, the impact ofMA on domain-related arithmetics achievement as well asdomain-unrelated spelling achievement was examined. Weexpect that MA should be specifically related to mathematics,but not to spelling achievement. This hypothesis will betested by comparing the predictive strength of MA overperformance in arithmetics and spelling tests. An effect ofMA on arithmetics is expected to be significant while nosignificant effect of MA on spelling achievement should bedetectable.
2. Materials and Methods
2.1. Participants. Samples were constituted by children withages ranging from 7 to 12 years and attending from firstto sixth grade. No differences between the performance-stratified groups were found regarding sex, age, and grade(Table 1). The study was approved by the local research ethicscommittee (COEP-UFMG). Only after giving informedconsent in written form from their parents and orally fromthemselves, children were allowed to take part in the study.
Children were recruited from schools in Belo Horizonteand Mariana, Brazil. The proportion of children attendingto private and public schools is representative of thesociodemographic characteristics of the population. In thefirst phase of group testing, only those children with normalintelligence (i.e., who scored above the 16th percentile inthe Raven Colored Matrices Test) [26] were included in

Child Development Research 3
Table 1: Descriptive data of TA and MD groups.
TA MD
N 171 36 x2 df P w
Sex (%male) 42.1 52.8 1.38 1 0.241 0.006
Mean SD Mean SD t df P d
Age (years) 9.5 1.14 9.28 1.27 1.05 205 0.293 0.190
Grade 3.39 1.15 3.08 1.05 1.45 205 0.148 0.270
Raven z-score 0.69 0.70 0.28 0.58 3.29 205 0.001 0.604
TDE arithmetic z-score 0.53 0.76 −0.90 0.47 14.66 79.7 <.001 2.690
TDE spelling z-score 0.67 0.56 0.05 0.58 5.99 205 <.001 1.100
TA: typically achieving; MD: mathematical difficulties; TDE: Brazilian school achievement test.
the study. These children also solved the arithmetic andspelling subtests of the Brazilian School Achievement Test(Teste do Desempenho Escolar, TDE) [27]. Those childrenscoring above the 25th percentile on both arithmetic andspelling subtests of the TDE were assigned to the typicallyachieving group (TA). The TA group consisted of 171children. Children performing below the 25th percentile onarithmetics were assigned to the mathematical difficultiesgroup (MD). Thirty-six children took part in the MD group(Table 1).
In a next step, psychosocial competencies and mathe-matical anxiety were individually assessed using the ChildBehavior Checklist (CBCL) [28] and the Math Anxiety Ques-tionnaire (MAQ) [29], see also [30], respectively. Childrenanswered the MAQ individually, in an appropriate room ontheir schools. Parents filled out the CBCL in group also intheir childrens’ school.
2.2. Psychological Instruments
2.2.1. Brazilian School Achievement Test (TDE) [27]. TheTDE is the most widely used standardized test of schoolachievement with norms for the Brazilian population [28,29]. It comprises three subtests: arithmetics, single-wordspelling, and single-word reading. In the screening phase,we used the arithmetics and spelling subtests, which canbe applied in groups. Norms are provided for school-agedchildren between the first and sixth grade. The arithmeticssubtest is composed of three simple verbally presented wordproblems (i.e., which is the largest, 28 or 42?) and 45 writtenarithmetic calculations of increasing complexity (i.e., veryeasy: 4− 1; easy: 1230 + 150 + 1620; intermediate: 823× 96;hard: 3/4 + 2/8). Specific norms for each school grade wereused to characterize children’s individual performance. Thespelling subtest consists of dictation of 34 words of increasingsyllabic complexity (i.e., toca; balanco; cristalizacao). Thespelling subtest was chosen as a marker for literacy becauseit can be performed in groups. Reliability coefficients(Cronbach α) of TDE subtests are .87 or higher. Childrenare instructed to work on the problems to the best of theircapacity but without time limits.
2.2.2. Raven’s Colored Progressive Matrices. General intel-ligence was assessed with the Brazilian version of Raven’s
Colored Matrices [26]. Children with general intelligencebelow the 16th percentile were not included in the sample.
2.2.3. Math Anxiety Questionnaire (MAQ). The math anxietyquestionnaire is a well-known scale developed by Thomasand Dowker [31] for the assessment of anxiety towardsmathematics in primary school children. The present studyused a Brazilian Portuguese version of the MAQ that wasdeveloped and standardized by Wood and colleagues [32].The Brazilian version of the MAQ contains 24 items that canbe answered by children individually or in groups within 5to 10 minutes. The items can be combined into four-basesubscales (“self-perceived performance,” “attitudes in math-ematics,” “unhappiness related to problems in mathematics,”and “anxiety related to problems in mathematics”) accordingto the authors of the original version [31]. Moreover,Krinzinger et al. [21] have shown that the four originalsubscales can be combined into two main scores called “self-perceived performance and attitudes” and “mathematicsanxiety.” The first one, named evaluation of mathematics,includes the first two subscales, while the second one, calledmath anxiety, combines the last two subscales. The MAQitems have the format of one out of four types of questions:“How good are you at . . .;” “How much do you like . . .;”“How happy or unhappy are you if you have problemswith . . .;” “How worried are you if you have problemswith . . ..” Each question is to be answered regarding sixdifferent categories related to math, namely, mathematicsin general; easy calculations; difficult calculations; writtencalculations; mental calculations; math homework. Childrenare encouraged by supportive figures to give their responsesaccording to a Likert scale with 5 points. The higher thescore, the higher the math anxiety. Reliability coefficients(Cronbach α) of MAQ in the German study range between.83 and .91 for the total scale, while in the Brazilian studyreliability coefficients are .88 for the total scale; .74 forthe “self-perceived performance in mathematics” subscale;.75 for the “attitudes in mathematics” subscale; .85 for thesubscale “unhappiness related to problems in mathematics;”finally, .81 for the subscale “anxiety related to problems inmathematics” (see [32], this issue).
2.2.4. Child Behavior Checklist 6/18 (CBCL) [30]. The CBCLis a screening instrument answered by parents that is widely

4 Child Development Research
Table 2: Regression coefficients for mathematics performance (after stepwise regression).
Regression analysis for TDE arithmetics (r2 = .31)
PredictorUnstandardized coefficient Std. coefficient Partial t sig % change in explained varianceB Std. error Beta
Intercept −0.594 0.81 −1.14 0.26
Age 0.03 0.01 0.41 3.26 <.001 0.00
Sex 0.06 1.05 0.03 0.53 0.59 0.00
School grade −0.26 0.10 −0.33 −2.62 0.01 3.00
Intelligence (Raven) 0.43 0.08 0.33 5.49 <.001 15.40
Attention deficit/hyperactivity scale∗ −0.02 0.01 −0.18 −2.52 0.01 2.80
MAQ self-perceived∗∗ −0.08 0.01 −0.35 −5.87 <.001 12.40∗
CBCL’s subscales guided by the DSM-IV; ∗∗MAQ’s factor. TDE: brazilian school achievement test; MAQ: Math Anxiety Questionnaire; CBCL: childrenbehavior checklist.
used in research and clinical sets. The CBCL is stronglyassociated with diagnoses guided by international diagnosticmanuals such as DSM-IV [33]. The CBCL is divided intotwo independent parts. The first part consists of a rangeof psychosocial competencies and the second part consistsof 113 items in which the parents answer about behavioral,emotional, and social adjustment of the child. Eight syn-drome scales derived from exploratory and confirmatoryfactor analysis are extracted. In addition to the syndromescales, there are the DSM-oriented scales, built through aclinical consensus of the items by experienced psychiatristsand psychologists, among them the scales “anxiety prob-lems” and “attention deficit/hyperactivity problems.” CBCLdata were compared with international norms obtained in amulticultural study (group 3 in [34]), for which there is dataon the comparability of the Brazilian population [35].
3. Results
3.1. Single Comparisons. t-tests were used to compare TAand MD groups regarding general anxiety and math anxiety.Degrees of freedom were corrected for in homogeneities ofvariance when the associated Levene’s test was significant.
The typically achieving group presented substantiallyhigher levels of performance in arithmetics and spelling thanMD children. MD children presented spelling abilities in thenormal range (all children >25th percentile). Moreover, nodifference between TA versus MD children was observed inCBCL subscales (all P values higher than .124). Finally, theself-perceived performance subscale of the MAQ revealedgroup differences between TA and MD children. Group com-parison showed substantially more positive self-evaluationin the TA group when compared to MD children (t(205) =−3.64; P ≤ .001; d = −.067). Other factors of the MAQ werenonsignificant, all P values higher than .136.
To assess more precisely the specific contribution ofpsychosocial competencies and mathematics anxiety onarithmetics and spelling abilities, a range of regressionmodels was calculated.
3.2. Regression Analysis. In a second analysis, the specificimpact of the different scales of general anxiety as well as of
math anxiety on school performance was evaluated in a rangeof hierarchical multiple-regression models. Separate modelswere calculated for mathematics and spelling performance.Modelling the impact of general anxiety and mathematicsanxiety on measures of spelling performance served to testthe specificity of the effect of math anxiety on mathematicsperformance. While measures of general anxiety shouldcontribute to explain the variance in both mathematics andspelling performance, MAQ scales should be specificallyrelated to mathematics performance and not to spellingperformance. For this reason, the last range of models servesto investigate the specificity of the association between mathanxiety and school performance on mathematics. Data fromTA and MD groups were combined in this analysis. In thefirst step, general factors predicting individual differences inschool performance were included in the regression models.These were sociodemographic factors (gender, school grade,and age) as well as general intelligence. In a second step, thoseamong the six scales of the CBCL which explained specificvariance were added to the model (stepwise method). Thesame procedure was adopted in the third step, when the fourMAQ scales were added to the model. The stepwise methodwas used in the second and third steps to avoid redundantpredictors entering the model and producing overfitting.
Table 2 shows the results from the final stepwiseregression model calculated for mathematics performance.Although the amount of explained variance in arithmeticsachievement was low, regression models revealed that age,school grade, general intelligence as well as attentionaldeficits and hyperactivity, and self-perceived performance inmathematics contributed independently to explain mathe-matics performance in TA and MD children.
Table 3 shows the results from the final stepwise regres-sion model calculated for spelling performance. Althoughthe amount of explained variance in spelling performancewas low, regression models revealed that general intelligenceas well as attentional deficits and hyperactivity contributedindependently to explain spelling performance in TA andMD children.
3.3. Path-Analysis Models. As a complement to the resultsobtained in the regression analyses, path-analyses including

Child Development Research 5
Table 3: Regression coefficients for spelling performance (after stepwise regression).
Regression analysis for TDE spelling (r2 = .14)
PredictorUnstandardized coefficient Std. coefficient Partial t sig. % change in explained varianceB Std. error Beta
Intercept 0.94 0.63 0.49 0.14
Age 0.001 0.01 0.02 0.11 0.92 0.00
Sex 0.09 0.08 0.07 0.11 0.27 0.50
School grade 0.03 0.08 0.05 0.33 0.74 0.00
Intelligence (Raven) 0.21 0.06 0.24 0.45 0.001 7.50
Attention deficit/hyperactivity scale∗ −0.02 0.00 −0.21 3.15 <.001 4.30∗
CBCL’s subscales guided by the DSM-IV. TDE: Brazilian School Achievement Test; CBCL: children behavior checklist.
Table 4: Fit statistics for path models regarding arithmetics and spelling performance.
Arithmetic performance CMIN df P RMR GFI AGFI CFI RMSEA
Null model 95 10 0 1.915 0.899 0.638 0.816 0.203
Raven-MAQ (sp) 88 9 0 1.462 0.916 0.664 0.829 0.207
Raven-Arith 53 8 0 1.421 0.942 0.737 0.904 0.164
CBCL (anx)-Arith 52 7 0 1.415 0.943 0.709 0.903 0.176
CBCL (ADH)-Arith 45 6 0 1.401 0.953 0.719 0.915 0.178
MAQ (sp)-Arith 10 5 0.08 1.391 0.989 0.919 0.990 0.067
CBCL (anx)-MAQ (sp) 7.5 4 0.110 1.148 0.991 0.92 0.992 0.066
CBCL (ADH)-MAQ (sp) 7.5 4 0.110 1.148 0.991 0.92 0.992 0.066
Spelling performance CMIN df P RMR GFI AGFI CFI RMSEA
Null model 48 10 0 1.874 0.944 0.800 0.907 0.136
Raven-MAQ (sp) 41 9 0 1.408 0.954 0.817 0.921 0.132
Raven-Spell 25 8 0.001 1.399 0.970 0.864 0.958 0.102
CBCL (anx)-Spell 25 7 0.001 1.400 0.970 0.845 0.956 0.112
CBCL (ADH)-Spell 13 6 0.049 1.387 0.985 0.912 0.984 0.073
MAQ (SP)-Spell 10 5 0.086 1.386 0.989 0.919 0.989 0.067
CBCL (anx)-MAQ (sp) 7.5 4 0.110 1.144 0.991 0.920 0.991 0.066
CBCL (ADH)-MAQ (sp) 7.5 4 0.110 1.144 0.991 0.920 0.991 0.066
CMIN: minimum value; RMR: root mean square residual; GFI: goodness of fit index; AGFI: adjusted goodness of fit index; CFI: comparative fit index; RMSEA:root mean square error of approximation. MAQ (sp): self-perceived performance factor of MAQ; arith: arithmetic subtests of TDE; Spell: spelling subtests ofTDE CBCL (anx): anxiety subscale of CBCL; CBCL (ADH): attention deficit hyperactivity subscale of CBCL.
demographic and cognitive factors as well as general anxietyand math anxiety were calculated separately for spellingand mathematics performance. These models included onlythe subscales among those subscales of the CBCL andMAQ, which exerted a specific contribution to explainingvariance in mathematics or spelling performance in theregression models. As regarding regression models, pathmodels evaluating the impact of MAQ on spelling perfor-mance served as a control measure for unspecific associationsbetween the MAQ and school performance. To estimate thestrength of the effects of general anxiety and math anxietyon mathematics and spelling performance, a range of pathmodels was calculated and compared. As indexes of modelquality regarding the fit of single models, the Chi-squareand the approximate fit indexes RMR, GFI, AGFI, CFI, andRMSEA [36] were used. In this context, a nonsignificant Chi-square reveals that the discrepancy between data and modelspecifications are negligible. The RMR evaluates the propor-tion of residuals in comparison to the covariances accounted
for by the models. Values smaller than .1 are consideredadequate. GFI, AGFI, and CFI evaluate, respectively, thedegree of misspecification present on the model. Generally,values over .95 and .90 are accepted as good. A value above.95 is considered good for the CFI as well. Finally, the Rootmean square error of approximation, or RMSEA, considersthe model complexity when evaluating model fit. TheRMSEA is considered acceptable, when it is lower than .05.The Chi-square difference between models was employedto compare models with an increasing amount of freeparameters. Models were calculated in the software AMOSv.19 using the maximum likelihood estimation function.
Fit statistics of path models are shown in Table 4. Thenull models described in Table 4 only included covari-ances between sociodemographic variables, general cognitiveabilities, and psychosocial competencies, but no directedpath from a variable to another. Further path models aredesignated by the paths added to them, which were notpresent in the previous models in the row.

6 Child Development Research
Table 4 reveals that very satisfactory model fit wasreached both in the case of mathematics (model MAQ(self-perceived)-Arith, Figure 1(a)) and spelling abilities(model CBCL (ADH)-Spell, Figure 1(b)). Model MAQ (self-perceived)-Arith depicts the effects of general intelligence onmathematics self-perceived performance and mathematicsachievement. A large amount of residuals as indicated by theRMR cannot be accounted by the variables inserted in themodel; however, the nonsignificant Chi-square and the otherindices of approximate fit yielded acceptable values for bothmodels MAQ (self-perceived)-Arith and CBCL (ADH)-Spell.Although in both cases the values obtained in the RMSEA areslightly above the acceptable levels (Table 3), it may be asso-ciated to the low number of degrees of freedom in the modeland does not invalidate the results [36]. Importantly, thenonsignificant Chi-square cannot be attributed to a lack ofpower to detect discrepancies between data and model struc-ture, since the sample size n = 207 employed in the presentstudy is sufficient to guarantee enough statistical power.
In the model MAQ (self-perceived)-Arith, attentionaldeficits and hyperactivity as well as mathematics self-perceived performance also have specific effects on arith-metics performance. Finally, mathematics self-perceived per-formance is statistically independent from general anxietyand attentional deficits and hyperactivity. Most importantly,however, is that MAQ scores were important in predictingthe arithmetic scores, and not at all important for spellingscores.
Model CBCL (ADHD)-Spell depicts the effects of generalintelligence on mathematics self-perceived performance andspelling performance. Moreover, attentional deficits andhyperactivity (but not mathematics self-perceived perfor-mance) showed specific effects on spelling performance.MAQ self-perceived performance scores were not relevantfor predicting the spelling scores. This is indicative that thisMAQ subscale is not evaluating self-perceived performancein an unspecific way but rather seems to be specificallyrelated to the domain of mathematics.
4. Discussion
In the present study the association of math anxiety andmore general forms of anxiety as well as their specificcontribution to arithmetics achievement were examined.Group comparisons revealed that the children between 7and 12 years old with and without mathematics difficultiesshow comparable levels of psychosocial competencies andgeneral anxiety, as assessed by the CBCL. As expected,children with mathematics difficulties also present muchlower levels of self-perceived performance for mathematicsthan typically achieving children. Moreover, in typicallyachieving children, age, school grade, general intelligence,attentional deficits, and hyperactivity as well as self-perceivedperformance in mathematics contributed independentlyto explain mathematics achievement. A different patternof results was observed for spelling performance. Here,general intelligence, attentional deficits and hyperactivity,and general anxiety contributed independently to explainspelling performance. These results indicate that both
hyperactivity/inattention as well as mathematics specificforms of self-assessment predict mathematics performance.Moreover, these results show that self-perceived performancefor mathematics as measured by the MAQ is specific formathematics abilities since it does not predict spelling per-formance. In summary, the results suggest that mathematicsperformance is associated with different forms of anxiety.Some more general anxiety, which impair performance notonly in mathematics but also in other academic abilitiessuch as spelling, and others more specific, which are directlyrelated to self-perceived performance in mathematics. In thefollowing, these results will be discussed in more detail.
MD children show lower levels of self-perceived perfor-mance in mathematics when compared to TA. Following therationale examined by Krinzinger et al. [21], this scale ismore associated to self-assessment of and attitudes towardsmathematics. Interestingly, the subscales of the MAQ reflect-ing unhappiness and anxiety for mathematics presented nosignificant differences between groups. Some recent studiessuggest the presence of such differences [37, 38]. Thoseauthors found associations of MA and math performance inearly graders with combined measures of MA. Nevertheless,in these studies it is impossible to dissociate between the spe-cific impact of cognitive and affective components of MA onthe reported associations such as in the present study, wherefour separated dimensions of MA can be distinguished. Forthis reason, the positive results by Ramirez et al. [37] andWu et al. [38] should be interpreted cautiously, since itis impossible to determine whether the positive differencesobtained should be attributed to cognitive, affective, or bothcomponents of MA.
None of the CBCL subscales revealed any significantdifference between MD and TA children. Moreover, com-paratively to TA individuals, children with MD in our studydo not exhibit performance differences in aspects of psy-chosocial functioning such as attention deficit/hyperactivityand general anxiety and math anxiety levels. One possibilityis that our participants are still of a relatively young agefor these effects to take over. Literature indicates that ittakes some time to build up the psychosocial negativeconsequences of persistent math failure [39]. For instance,Auerbach and colleagues [39] assessed dyscalculic childrenfrom 10/11 years of age to the age of 16/17 years. At theage of 16/17 years, dyscalculics exhibited higher mean levelsof maladjustment in several CBCL and Youth Self-Reportscales, most notably those pertaining to both internalizingand externalizing disorders, while no significant statisticaldifferences between persistent and non persistent dyscal-culics were present in the initial assessment at 10/11 yearsold. These results suggest that at the assessed ages childrenwith mathematics difficulties are not necessarily less adjustedin behavior, cognition, or affect than the average TA children.These findings are in line with fMRI evidence on specificpatterns of neural activation related to math anxiety but notto other more general processes [4].
Moreover, a significant association between self-per-ceived performance and math attainment must be analyzedin the context of the development of self-perceptions inschool children. Children may have some difficulty making

Child Development Research 7
−0.02
0.41
−0.19−0.23
−0.21
−0.03−0.03
−0.13
−0.2
0.01
0.01
0.89
0.070.07
Raven
Age
Grade
Sex
CBCL ADHD
CBCL anxietyMAQ se
TDE Arith
0.02
e3
e2
−0.16∗
0.050.33∗
0.42∗
0
0.03
−0.34∗
0.1
−0.37∗
−0.14
0.33
0.04
(a)
−0.02
0.41
−0.19−0.23
−0.04
0.05
−0.21
−0.03
−0.03−0.13
−0.2
0.01
0.01
0.89
0.070.07
Raven
Age
Grade
Sex
0.02
e3
e2
0
0
0
0
0
0.07
0
0.01
0.03
TDE Spell
CBCL ADHD
CBCL anxietyMAQ se
−0.18∗
(b)
Figure 1: Path-analyses models describing the effects of sociodemographic factors, psychosocial competencies as well as self-perceivedperformance in mathematics on arithmetics, and spelling performance. Paths marked with ∗ are statistically significant.

8 Child Development Research
realistic assessment of their performance early in the elemen-tary school [40]. For example, in a study by Nicholls [41],correlations between self-assessments and reading attain-ment raised from virtually nonexistent in the first grade toaround 0.70 in the sixth grade (see also [42]). Other evidenceindicates that it is not until 11–13 years old that performancebegins to systematically benefit from error-related feedback[43]. Our results are, however, more in line with otherresearch showing that from 7 or 8 years onward, childrenare able to make self-assessments of performance which aremore similar to those of their teachers [44, 45]. These resultshave an important implications for the motivation to learnmathematics. Self-assessment is an important motivationalfactor [46], which may be an antecedent to more affectiveaspects of MA observable in high school and college [19, 47],presumably as the math curriculum is more demanding andself-assessments more unfavorable to many students.
The present results regarding the ability of young chil-dren to assess their own performance in mathematics arein line with those presented by Krinzinger and coworkers[20]. These authors showed that low calculation ability inthe first grade was predictive of “evaluation of mathematics”in the third grade, a composite measure of two MAQ scales:self-perceived performance and attitude. Ma and Xu [19]also found that prior low math achievement in adolescentsis predictive of higher levels of MA assessed by questionstapping on more affective components. This discrepancysuggests that it may take some time until the affectiveconsequences of low performance on MA accrue.
Regression analyses conducted in the present studycomplemented the pattern of results by looking at thepredictive value of sociodemographic and general cognitivefactors, psychosocial competencies, and mathematics anxietyon arithmetics and spelling achievement. After removing theeffects of age, general intelligence, and school grade fromdata, one still is able to detect specific effects of attentionaldeficits and hyperactivity as well as of mathematics self-perceived performance on arithmetics performance. Thissuggests that the impact of hyperactivity and mathematicsself-perceived performance on arithmetics performance can-not be reduced to general aspects of cognition, age, gender,or sociodemographic differences in TA children (see also[37, 38]).
The impact of hyperactivity symptoms and mathematicsself-perceived performance on arithmetics achievement hasvery different meanings. Attentional deficits and hyperac-tivity are associated with lower achievement not only inarithmetics but also in spelling. In the literature, manyreports support these results [48, 49]. Interestingly, affectiveproblems and general anxiety also have been associated withlower spelling performance in the present study. These resultscan be interpreted as a less-specific effect of psychosocialcompetencies on school performance, since spelling abilitiesare necessary in almost all topics taught in school. However,we cannot offer a more definitive answer to this questionbased on our data alone. Moreover, mathematics self-perceived performance impacts on arithmetics performancein a very specific way. The regression analysis of spellingperformance revealed no effect of mathematics self-perceived
performance on spelling performance. The comparison ofthis result with the significant effect of mathematics self-perceived performance on arithmetics reveals that there isan effect of mathematics anxiety on arithmetics performancethat cannot be reduced to the impact of more general level ofanxiety or psychosocial competencies.
Path-analysis models also have corroborated the resultsof regression analyses that there is an effect of mathemat-ics self-perceived performance on arithmetics achievement.Another important aspect of path-analyses is that theconstruct of mathematics self-perceived performance wasfound to be statistically independent from psychosocialcompetencies in 7–12 years old children. Among the differentfacets of mathematics anxiety, only the particular aspect ofmathematics self-perceived performance was associated toarithmetics performance in a specific way. The perceptionof cognitive resources, knowledge, and competencies tosolve arithmetics problems explained individual differencesin arithmetics performance, which cannot be accounted byany specific aspect of general psychosocial competencies.Absence of effects of general anxiety on math performancesuggests that the MA is a subject-specific phenomenon,in line with previous research in adolescents and collegestudents [3, 13].
The MA construct as assessed by the MAQ is a complexone, composed of several cognitive and affective compo-nents. Lack of association between math achievement andperformance on the scale assessing the more affective ordysphoric component of MA deserves explanation. Childrenwith lower achievement in math may be using a copingstrategy of “insulating” or detaching themselves from theirdifficulties in order to resolve internal conflict. Testing ofthis hypothesis would require further studies focusing on thecoping processes employed by MD children. Nevertheless, itis positive news that low mathematics performance may notimmediately elicit negative feelings towards mathematics.This may favor early training and support procedures, whichmay prevent that low mathematics performance triggers acircle of anxiety and avoidance towards mathematics.
5. Conclusions
MA can be reliably assessed in elementary school childrenand its correlates are specific as no evidence for an earlyassociation between general anxiety, literacy, and mathperformance is present in 7–12 years old children. Moreover,MA comprises both cognitive and affective components.Low mathematics performance may be detected by childrenalready in the early school grades. However, it may takea considerable time for that to increase so much anxietytowards mathematics that more general psychosocial com-petencies also would be compromised.
Acknowledgments
The research by V. G. Haase during the elaboration of thispaper was funded by grants from CAPES/DAAD ProbralProgram, Conselho Nacional de Desenvolvimento Cientıficoe Tecnologico (CNPq, 307006/2008-5, 401232/2009-3) and

Child Development Research 9
Fundacao de Amparo a Pesquisa do Estado de Minas Gerais(FAPEMIG, APQ-02755-SHA, APQ-03289-10. G. Wood issupported by a FWF research project (no. P22577).
References
[1] A. Dowker, Individual Differences in Arithmetic. Implicationsfor Psychology, Neuroscience and Education, Psychology Press,Hove, UK, 2005.
[2] S. Chinn, Dealing with Dyscalculia: Sum Hope 2, SouvenirPress, London, UK, 2007.
[3] R. Hembree, “The nature, effects, and relief of mathematicsanxiety,” Journal for Research in Mathematics Education, vol.21, no. 1, pp. 33–46, 1990.
[4] C. B. Young, S. S. Wu, and V. Menon, “The neurodevelopmen-tal basis of math anxiety,” Psychological Science, vol. 1, no. 23,pp. 492–501, 2012.
[5] L. Kaufmann, G. Wood, O. Rubinsten, and A. Henik, “Meta-analyses of developmental fMRI studies investigating typicaland atypical trajectories of number processing and calcula-tion,” Developmental Neuropsychology, vol. 36, no. 6, pp. 763–787, 2011.
[6] D. R. Hopko, D. W. McNeil, M. J. Zvolensky, and G. H. Eifert,“The relation between anxiety and skill in performance-basedanxiety disorders: a behavioral formulation of social phobia,”Behavior Therapy, vol. 32, no. 1, pp. 185–207, 2001.
[7] M. H. Ashcraft and E. P. Kirk, “The relationships amongworking memory, math anxiety, and performance,” Journal ofExperimental Psychology, vol. 130, no. 2, pp. 224–237, 2001.
[8] M. H. Ashcraft, J. A. Krause, and D. R. Hopko, “Is mathanxiety a mathematical learning disability?” in Why Is MathSo Hard for Some Children? The Nature and Origins of Math-ematical Learning Difficulties and Disabilities, D. B. Berch andM. M. M. Mazzocco, Eds., pp. 329–348, Brookes, Baltimore,Md, USA, 2007.
[9] J. W. Smoller, E. Gardner-Schuster, and J. Covino, “The geneticbasis of panic and phobic anxiety disorders,” American Journalof Medical Genetics, Part C, vol. 148, no. 2, pp. 118–126, 2008.
[10] K. H. Dew and J. P. Galassi, “Mathematics anxiety: some basicissues,” Journal of Counseling Psychology, vol. 30, no. 3, pp.443–446, 1983.
[11] K. H. Dew, J. P. Galassi, and M. D. Galassi, “Math anxiety: rela-tion with situational test anxiety, performance, physiologicalarousal, and math avoidance behavior,” Journal of CounselingPsychology, vol. 31, no. 4, pp. 580–583, 1984.
[12] J. M. Armfield, “Cognitive vulnerability: a model of theetiology of fear,” Clinical Psychology Review, vol. 26, no. 6, pp.746–768, 2006.
[13] X. Ma, “A meta-analysis of the relationship between anxietytoward mathematics and achievement in mathematics,” Jour-nal for Research in Mathematics Education, vol. 30, no. 5, pp.520–540, 1999.
[14] J. S. Hyde, S. M. Lindberg, M. C. Linn, A. B. Ellis, and C.C. Williams, “Diversity: gender similarities characterize mathperformance,” Science, vol. 321, no. 5888, pp. 494–495, 2008.
[15] S. L. Beilock, E. A. Gunderson, G. Ramirez, and S. C.Levine, “Female teachers’ math anxiety affects girls’ mathachievement,” Proceedings of the National Academy of Sciencesof the United States of America, vol. 107, no. 5, pp. 1860–1863,2010.
[16] H. Krinzinger, G. Wood, and K. Willmes, “What accounts forindividual and gender differences in the multi-digit number
processing of primary school children?” Journal of Psychology,vol. 220, no. 2, p. 78.
[17] A. C. Krendl, J. A. Richeson, W. M. Kelley, and T. F.Heatherton, “The negative consequences of threat: a func-tional magnetic resonance imaging investigation of the neu-ral mechanisms underlying women’s underperformance inmath,” Psychological Science, vol. 19, no. 2, pp. 168–175, 2008.
[18] E. A. Maloney, S. Waechter, E. F. Risko, and J. A. Fugelsang,“Reducing the sex difference in math anxiety: the role ofspatial processing ability,” Learning and Individual Differences,vol. 22, no. 3, pp. 380–384, 2012.
[19] X. Ma and J. Xu, “The causal ordering of mathematics anxietyand mathematics achievement: a longitudinal panel analysis,”Journal of Adolescence, vol. 27, no. 2, pp. 165–179, 2004.
[20] H. Krinzinger, L. Kaufmann, and K. Willmes, “Math anxietyand math ability in early primary school years,” Journal ofPsychoeducational Assessment, vol. 27, no. 3, pp. 206–225,2009.
[21] H. Krinzinger, L. Kaufmann, A. Dowker et al., “German ver-sion of the math anxiety questionnaire (FRA) for 6- to 9-year-old children,” Zeitschrift fur Kinder- und Jugendpsychiatrie undPsychotherapie, vol. 35, no. 5, pp. 341–351, 2007.
[22] O. Rubinsten and R. Tannock, “Mathematics anxiety inchildren with developmental dyscalculia,” Behavioral andBrain Functions, vol. 6, article 46, 2010.
[23] F. Prevatt, L. Welles, H. Li, and B. Proctor, “The contributionof memory and anxiety to the math performance of col-lege students with learning disabilities,” Learning DisabilitiesResearch and Practice, vol. 25, no. 1, pp. 39–47, 2010.
[24] B. Pletzer, G. Wood, K. Moeller, H. C. Nuerk, and H. H.Kerschbaum, “Predictors of performance in a real-life statisticsexamination depend on the individual cortisol profile,” Biolog-ical Psychology, vol. 85, no. 3, pp. 410–416, 2010.
[25] M. P. Kamann and B. Y. Wong, “Inducing adaptive coping self-statements in children with learning disabilities through self-instruction training,” Journal of Learning Disabilities, vol. 26,no. 9, pp. 630–638, 1993.
[26] L. Angelini, I. C. B. Alves, E. M. Custodio, W. F. Duarte, and J.L. M. Duarte, Matrizes Progressivas Coloridas de Raven—EscalaEspecial, Centro Editor de Testes e Pesquisas em Psicologia, SaoPaulo, Brazil, 1999.
[27] L. M. Stein, Teste de Desempenho Escolar: Manual paraAplicacao e Interpretacao, Casa do Psicologo, Sao Paulo, Brazil,1994.
[28] A. J. Costa, J. B. L. Silva, P. P. Chagas et al., “A hand fullof numbers: a role for offloading in arithmetics learning?”Frontiers of Psychology, vol. 2, article 368, 2011.
[29] F. de O. Ferreira, G. Wood, P. Pinheiro-Chagas et al., “Explain-ing school mathematics performance from symbolic and non-symbolic magnitude processing: similarities and differencesbetween typical and low-achieving children,” Psychology &Neuroscience, vol. 51, pp. 37–46, 2012.
[30] T. M. Achenbach, Manual for the Child Behavior Checklist 6and 18 profile, University of Vermont, Burlington, Vt, USA,2001.
[31] G. Thomas and A. Dowker, “Mathematics anxiety and relatedfactors in young children,” in Proceedings of the DevelopmentalSection Conference, British Psychological Society, Bristol, UK,2000.
[32] G. Wood, P. Pinheiro-Chagas, A. Julio-Costa et al., “Anintercultural comparison between Germany and Brazil,” ChildDevelopment Research. In press.

10 Child Development Research
[33] American Psychiatric Association, Diagnostic and StatisticalManual of Mental Disorders, American Psychiatric Associa-tion, Washington, DC, USA, 4th edition, 2000.
[34] T. M. Achenbach and L. A. Rescorla, Multicultural Supplementto the Manual for the ASEBA School-Age Forms & Profiles,University of Vermont, Research Center for Children, Youth,& Families, Burlington, Vt, USA, 2007.
[35] M. M. Rocha, L. A. Rescorla, D. R. Emerich et al., “Behavioral-emotional problems in Brazilian children: findings fromparents’ reports on the child behavior checklist,” PsychologicalAssessment, vol. 60, no. 5, p. S286, 2012.
[36] R. E. Schumacker and R.G. Lomax, A Beginner’s Guide toStructural Equation Modeling, Lawrence Erlbaum Associates,Mahwah, NJ, USA, 2nd edition, 2004.
[37] G. Ramirez, E. A. Gunderson, S. C. Levine, and S. L. Beilock,“Math anxiety, working memory and math achievement inearly elementary school,” Journal of Cognition and Develop-ment. In press.
[38] S. S. Wu, M. Barth, H. Amin, V. Malcame, and V. Menon,“Math anxiety in second and third graders and its relationto mathematics achievement,” Frontiers in Psychology, vol. 3,article 162, 2012.
[39] J. G. Auerbach, V. Gross-Tsur, O. Manor, and R. S. Shalev,“Emotional and behavioral characteristics over a six-yearperiod in youths with persistent and nonpersistent dyscalcu-lia,” Journal of Learning Disabilities, vol. 41, no. 3, pp. 263–273,2008.
[40] A. Wigfield, J. S. Eccles, M. V. Covington, and E. Dray, “Thedevelopment of competence beliefs, expectancies for success,and achievement values from childhood to adolescence,” inThe Development of Achievement Motivation, A. Wigfield andJ. Eccles, Eds., pp. 91–120, Academic, San Diego, Calif, USA,2002.
[41] J. G. Nicholls, “Development of perception of own attainmentand causal attributions for success and failure in reading,”Journal of Educational Psychology, vol. 71, no. 1, pp. 94–99,1979.
[42] C. S. Dweck, “The development of ability conceptions,” inThe Development of Achievement Motivation, A. Wigfield andJ. Eccles, Eds., Academic, San Diego, Calif, USA, 2002.
[43] A. C. K. Van Duijvenvoorde, K. Zanolie, S. A. R. B. Rombouts,M. E. J. Raijmakers, and E. A. Crone, “Evaluating thenegative or valuing the positive? Neural mechanisms support-ing feedback-based learning across development,” Journal ofNeuroscience, vol. 28, no. 38, pp. 9495–9503, 2008.
[44] J. F. Benenson and C. S. Dweck, “The development of traitexplanations and self-evaluations in the academic and socialdomains,” Child Development, vol. 57, no. 5, pp. 1179–1187,1986.
[45] G. D. Heyman, C. S. Dweck, and K. M. Cain, “Young children’svulnerability to self-blame and helplessness: relationship tobeliefs about goodness,” Child Development, vol. 63, no. 2, pp.401–415, 1992.
[46] A. Wigfield, J. S. Eccles, U. Schiefele, R. W. Roeser, and P.Davis-Kean, “Development of achievement motivation,” inHandbook of Child Psychology. Volume 3. Social, Emotional andPersonality Development, N. Eisenberg, W. Damon, and R. M.Lerner, Eds., Wiley, New York, NY, USA, 2006.
[47] S. Chinn, “Mathematics anxiety in secondary students inEngland,” Dyslexia, vol. 15, no. 1, pp. 61–68, 2009.
[48] I. M. Loe and H. M. Feldman, “Academic and educationaloutcomes of children with ADHD,” Journal of PediatricPsychology, vol. 32, no. 6, pp. 643–654, 2007.
[49] A. Rodriguez, M. R. Jarvelin, C. Obel et al., “Do inattentionand hyperactivity symptoms equal scholastic impairment?Evidence from three European cohorts,” BMC Public Health,vol. 7, article 327, 2007.

Hindawi Publishing CorporationChild Development ResearchVolume 2012, Article ID 851657, 13 pagesdoi:10.1155/2012/851657
Research Article
Parents’ Beliefs about Children’s Math Development andChildren’s Participation in Math Activities
Susan Sonnenschein,1 Claudia Galindo,2 Shari R. Metzger,1 Joy A. Thompson,1
Hui Chih Huang,2 and Heather Lewis1
1 Department of Psychology, University of Maryland, Baltimore County, Baltimore, MD 21250, USA2 The Language, Literacy, and Culture Program, University of Maryland, Baltimore County, Baltimore, MD 21250, USA
Correspondence should be addressed to Susan Sonnenschein, [email protected]
Received 12 May 2012; Revised 31 August 2012; Accepted 6 September 2012
Academic Editor: Helga Krinzinger
Copyright © 2012 Susan Sonnenschein et al. This is an open access article distributed under the Creative Commons AttributionLicense, which permits unrestricted use, distribution, and reproduction in any medium, provided the original work is properlycited.
This study explored associations between parents’ beliefs about children’s development and children’s reported math activitiesat home. Seventy-three parents were interviewed about the frequency of their children’s participation in a broad array of mathactivities, the importance of children doing math activities at home, how children learn math, parents’ role in their children’smath learning, and parents’ own math skills. Although the sample consisted of African Americans, Chinese, Latino, and Caucasianparents in the United States, the majority were Chinese or Caucasian. Several important findings emerged from this study. Parents’beliefs about math development and their role in fostering it were significantly related to children’s math activities. There wasimportant variability and relatively limited participation of children in math activities at home. There were age-related differencesin children’s engagement in math activities. Chinese and Caucasian parents showed somewhat similar beliefs about how childrendeveloped math. Although further research is needed to confirm the findings with a larger sample and to include measures ofchildren’s math competencies, these findings are an important step for developing home-based interventions to facilitate children’smath skills.
1. Introduction
Many children in the United States do not exhibit adequatemath skills [1]. On average, US children earn significantlylower math scores on international assessments such as PISAand TIMSS than children from other industrialized nations[2, 3]. The importance of children’s early math skills iswell documented. Early math skills continue to have long-lasting effects as children progress through school [1, 4–7]. And math skills have been recognized as important forindividual upward mobility and advancing U.S. standingin the global market [1]. Given that there is significantvariability in the math skills with which children enterschool [4] and that early math skills predict later ones[6], it is critical to identify mechanisms to improve youngchildren’s math understanding. One important but relativelyunderstudied mechanism to improve children’s math skillsduring preschool and the early school years is the home-mathenvironment.
Young children’s home-based math experiences, includ-ing playing games and engaging in everyday math activities,positively predict their math skills ([8–12]; see also [13], forfurther discussion of the relation between home learningenvironment and children’s academic development). Forexample, LeFevre and colleagues [10, 11] demonstrated thatthe frequency with which children in kindergarten throughsecond grade engaged in home-based math activities suchas playing board and card games, cooking, and shoppingpositively predicted their scores on measures of mathknowledge and fluency. Ramani and Siegler [14] found thatplaying board games at home positively predicted children’sscores on a measure of number sense.
Although the frequency of engagement in home-basedmath activities predicts children’s math skills, a nontrivialpercentage of children reportedly do not engage in much,if any, math activities at home [14, 15]. Ramani andSiegler [14], for instance, found that 20% of middle-income

2 Child Development Research
children and 53% of low-income children did not reportplaying any math games at home. Tudge and Doucet [15]found 60% of the low- and middle-income preschoolers intheir study had no involvement with math-related activitiesat home. In order to understand the variability in children’sengagement in math activities, it is necessary to understandfactors that predict such engagement.
This study investigates the relations between parentalbeliefs about how to foster young children’s math devel-opment and the frequency of children’s reported mathactivities at home. We provide descriptive information ofparental beliefs about the importance of children doing mathactivities at home, beliefs about how children learn, parents’role in their children’s math learning, and parents’ own mathskills as well as the types of math activities children doat home. We also document similarities and differences inparents’ beliefs and children’s math activities for younger(prekindergarten and kindergarten) and older children (earlyelementary school), and for Chinese and Caucasian parents.We then examine the association between the frequencyof children’s participation in math activities and parents’beliefs.
Our conceptual framework reflects ecological and socio-cultural theories, which emphasize the importance of con-sidering the individual and overlapping contexts withinwhich children’s development occurs (e.g., [16, 17]), tounderstand the importance of the home-environment formath development.
A key aspect that influences the context of children’s livesaccording to Super and Harkness [18] is parental beliefs.Parents have specific beliefs about child development thatpredict the experiences they make available to their children[19] which, in turn, predict children’s math development(see also [20–22]). Parents also have ideas about their rolein their children’s development [19, 23, 24]. These ideasor beliefs reflect parents’ cultural heritage and experiencesand predict their behavior and practices [21, 25, 26]. Manycurrent theories of children’s development emphasize theimportance of parental beliefs [27, 28]; however, very littleresearch, with the exception of the following two studies,has investigated the beliefs that parents have about theirchildren’s math development and how such beliefs relate tochildren’s engagement in math activities at home.
Simpkins et al. [29] found that parents’ socialization oftheir children’s math behavior in elementary school (2nd–5th grades) was related to their children’s engagement in outof school activities in math, science, and computer usage.Skwarchuk [12] demonstrated that parents’ prior experi-ences with math were positively related to the frequencyof their preschoolers’ math activities and math knowledge.Prior experiences were assessed with two questions askingparents to rate how good at math they were in school andwhether they found math enjoyable.
An important criticism of Skwarchuk’s [12] study is themeasure of math activity involved an intervention compo-nent; it was not a measure of normative (or daily/routine)math activity because parents were given a bag of mathmaterials and were told to play math-related activities for 10–15 minutes each day. We add to findings from these studies by
examining the confluence of different indicators of parentalbeliefs.
In contrast to research on children’s math development,research has examined the relation between children’s home-environment and their reading development. Parents whoemphasize the importance of engaging their young children’sinterest in reading have children who choose to read morefrequently which, in turn, positively predicts their readingdevelopment [30].
The Early Childhood Project [23] was a longitudinalinvestigation of literacy development with children fromdiverse income and ethnic/racial backgrounds in prekinder-garten through third grade. It provides an impetus forhow parents’ beliefs about children’ math development wereassessed in this study. Parents in the Early Childhood Projectwere asked about the best way to foster their young children’sliteracy development. Parents’ responses were coded for threepossible orientations towards literacy development: engagingchildren’s interest/making reading entertaining or enjoyablefor the child, inculcating skills, and using daily living activi-ties. Parents’ orientation towards engaging young children’sinterest in reading was related to the types of activities inwhich children engaged in prekindergarten through thirdgrade. An orientation towards engaging children’s interestwas also positively related to early literacy and readingcompetencies. In contrast, an orientation focused on skillsinculcation was either not related or negatively related tochildren’s literacy development (see also [31]). Although itseems reasonable to assume that findings of the relationbetween parents’ beliefs and children’s reading developmentwill extend to children’s math development, it is possible thathome environments could have a differential impact on thetwo domains, given that reading and math require differentskill sets.
Findings from the Early Literacy Project also showedthe changing nature of children’s home-based activities asthey get older and become better readers [23]. Researchalso shows that parents’ beliefs assessed when childrenare in preschool continue to predict their development inelementary school [13, 23]. However, to our knowledge, noresearch on math development has specifically investigateddifferences in parents’ beliefs about their children’s learningor their role in such learning for different age groups ofchildren. This study compares similarities and differences inparents’ beliefs and children’s activities for younger and olderage groups of children.
Another important issue when studying the home-learning environment of children is to take into account theinteraction between cultural manifestations and responsesto the larger social structure. As Super and Harkness [32]argue, the home-learning environment that parents createfor their children includes both culturally defined andtransmitted messages. Harkness and Super [33] argue thatculture impacts family functioning and child development atthe proximal and distal levels through 3 mechanisms: physicaland social settings (structure and organization of the homeplus individuals who interact with child), culturally specificchildcare customs (common parenting behaviors that arewell integrated into the larger structure), and ethnotheories

Child Development Research 3
of parenting (specific beliefs about significance and role,expectations about behaviors and development, and natureand needs of children). These three factors, physical andsocial settings, culturally specific child care customs, andethnotheories of parenting comprise the developmentalniche [18]. Individual differences in the developmental nichereflect differences in ethnic/cultural background and incomeand are related to differences in children’s development [34].
Particularly relevant for this study are the cultural dif-ferences between Asian (Chinese) and Western (Caucasian)parents’ beliefs and socialization practices. Such differencesmay account, at least in part, for differences in children’sdevelopmental outcomes. It is a well-documented findingthat Chinese children display higher math skills from theoutset of schooling than Caucasian children (e.g., [35, 36]).Asian parents consider schooling one of the most importantresponsibilities of parents, strongly believe that without asolid education a person cannot be successful in life [37], andclearly articulate their educational expectations [38]. Sucha strong emphasis on education may not be found amongWestern parents.
Another important belief commonly found among Asianparents is related to the relation between academic suc-cess/learning and children’s ability/effort. Asian and AsianAmerican parents consider hard work and effort as the keyfor academic success [39]. In contrast, Caucasian parentsconsider ability as a very important determinant of academicsuccess, which implies a more deterministic view of academicsuccess [40]. These beliefs have important consequences forAsian parents’ socialization practices. This study comparesand contrasts Chinese and Caucasian parents’ socializationbeliefs and practices.
In short, the present study investigates relations betweenparents’ beliefs about how to facilitate their children’s mathdevelopment and the frequency of children’s math activitiesat home. We considered four sets of parental beliefs: theimportance of children doing math activities at home, howchildren learn math, parents’ role in their children’s mathlearning, and parents’ own math skills. How children learnmath included three possible orientations: engaging child’sinterest, inculcating skills, and using daily living activities.Note that we assess parents’ beliefs in a more comprehensivemanner than has been done in the limited prior research andwith a more ethnically/racially diverse sample. We also assessrelations among parents’ beliefs and children’s involvementin math activities.
2. Method
2.1. Participants. Families were recruited from local schoolsand preschools, Chinese schools and churches, and commu-nity centers in a large city in the Middle Atlantic section ofthe United States. Data were collected in two waves, duringthe spring and summer of 2010 (Wave 1) and during the fallof 2011 and spring of 2012 (Wave 2). Data from the firstwave included families from four ethnic/racial groups, datafrom Wave 2 were collected to allow comparisons betweenChinese and Caucasian families. On average, participants in
both waves of data were comparable in their demographiccharacteristics except for their average levels of education. Asexpected, Wave 2 participants were significantly more edu-cated (Mean = 5.50, SD = 0.71; college completion/graduateschool) than Wave 1 participants (Mean = 4.30, SD =1.89; associate degree), F(1, 52) = 11.68, p = .001, partialeta squared = .183. Accordingly, data from both waves ofparticipants were combined in all analyses.
Table 1 shows demographic characteristics of the 73participants in this study. All participants were mothersof children in prekindergarten through fourth grade; themajority of the children were in prekindergarten throughsecond grade. About 68% of the children lived in dualparent households. Participants came from four racial/ethnicgroups: African American, Chinese, Latino, and Caucasian.The mean age of the participants was 36.58 years (SD =8.06).
All of the Chinese parents and 80% of the Latinos inour sample were first generation (foreign-born) immigrants.Chinese and Latino immigrants had lived in the Unites Statesfor an average of 9.01 years (SD = 5.39). Consistent withU.S. population statistics, Chinese parents were the mosteducated; about 93% completed at least college in contrastto 44% of African American, 62% of Caucasian, and 20% ofLatino parents.
2.2. Task and Procedure. The Parents’ Conceptions of MathDevelopment (PCMD) questionnaire was used to assess par-ents’ beliefs and reported frequency of children’s engagementin math activities. It included open-ended questions andrating scales about parents’ metacognitions about math, theimportance of home-based math engagement for children,parents’ views of how children learn math, parents’ roles insuch learning, parents as role models of math engagement,and the frequency of children’s math engagement across abroad base of theoretically-relevant math activities. Versionsof the questionnaire were available in English, Mandarin,and Spanish. Mandarin and Spanish questionnaires were firstprepared in English, and then translated and back-translatedto ensure linguistic validity.
A trained graduate or advanced undergraduate researchassistant administered the questionnaire in the parent’spreferred language. Completion of the questionnaire tookabout 30–40 minutes. The research assistant took notes andaudio-taped the interviews.
Tapes were transcribed and then reviewed by theinterviewer and another member of the research team.Questionnaires conducted in Mandarin or Spanish weretranscribed in that language, translated into English, andthen back-translated by a third assistant. The two versionswere compared and any inconsistencies were discussedamong the transcriber and translators.
Coding was based on the written transcript with the oraltapes and field notes consulted as needed.
2.3. Key Variables. The key variables of interest in thisstudy were parents’ beliefs and frequency of children’s mathactivities.

4 Child Development Research
Table 1: Demographic characteristics of sample.
OverallN = 73
ChineseN = 28
CaucasianN = 26
African AmericanN = 9
LatinosN = 10
Boys (%) 56.2 60.7 65.4 33.3 40
Mean age (SD) 6.12 (1.60) 6.26 (1.84) 5.83 (1.83) 6.10 (1.28) 6.24 (1.62)
Children’s grade (%)
Prekindergarten 23.3 21.4 26.9 22.2 20
Kindergarten 31.5 42.9 19.2 33.3 30
First grade 26.0 17.9 38.5 22.2 20
Second grade 6.8 3.6 11.5 11.1 0
Third grade 11.0 14.3 0 11.1 30
Fourth grade 1.4 0 3.8 0 0
Two-parent homes (%)∗ 68.1 85.7 61.5 33.3 66.7
Number of other children inhome
1.07 (0.93) 0.75 (0.65) 1.27 (0.96) 1.44 (1.51) 1.10 (0.74)
Mean (SD)
0% 27.4 35.7 19.2 33.3 20
1 49.3 53.6 50 33.3 50
2 13.7% 10.7 15.4 0 30
3 8.2 0 15.4 22.2 0
4 1.4 0 0 11.1 0
Child fluent in English (%) 56.5 44.4 100 100 50
Parent education 4.55 (1.72) 5.54 (0.74) 4.54 (1.68) 3.78 (1.92) 2.50 (1.58)
Mean level (SD)
Less than HS (%) 8.2 0 11.5 0 30
High school 12.3 0 3.8 44.4 40
Some college 4.1 3.6 3.8 11.1 0
Associate 9.6 3.6 19.2 0 10
Bachelor 23.3 28.6 23.1 11.1 20
Postgraduate 42.5 64.3 38.5 33.3 0
Parent U.S. born (%) 49.3 0 96.2 100 20
Note. ∗One Hispanic parent did not provide data for this question.
2.3.1. Parents’ Beliefs. Four types of beliefs were assessed:importance of children doing math activities at home, beliefsabout how children learn, parents’ role in their children’smath learning, and parents’ own math skills.
Importance of Children Doing Math Activities at Home.Parents were asked, “How important is it that your child doesmath activities at home?” Responses could range from 1 (notvery) to 5 (very important).
Beliefs about How Children Learn Math. Parents were asked,“What is the best way to help your child learn math?”Responses to the open-ended question were reliably codedas focusing on entertaining or engaging the child (“to playmath games with him” or “do an activity that will hold herattention. . .”), developing skills (“count numbers with him”or “sitting down and showing her the numbers on paper”),or using daily living activities (“taking advantage of everydayactivities that incorporate math in them” or “counting carson the road when we drive to the store”). Each of these
beliefs are binary variables (1 = it was mentioned duringthe conversation, 0 = was not mentioned). These beliefswere not mutually exclusive; parents’ responses could includemore than one focus. Reliability of coding was based ontwo raters independently coding 16 of the interviews. Kappasranged from .875 to 1.00.
In reviewing the transcripts of the interviews, it becameapparent that parents’ discussion of their beliefs abouthow children learn extended beyond their response to aspecific question. Therefore, we complemented response tothe previous question with information from the entiretranscript. We call responses that emerged from review of theentire transcript “themes” to contrast them with responsesto specific questions. We coded a theme of how childrenlearn math with the same coding scheme (described inprior paragraph) as for the specific question. All responseswere reviewed by two coders. These coders had establishedadequate reliability for the themes using a subset of 20interviews. Kappas for each of the orientation themes were1.00. Because the themed responses were based on more
Child Development Research 5
information than the response to a specific question, andbecause themed responses were correlated with responsesto a specific question (.33 skills, .53 daily living, .58engagement), the analyses presented in the paper includeonly the themed responses.
Parents’ Role in Their Children’s Math Learning. There werethree separate roles parents could take: they serve as rolemodels of math engagement, they provide children withartifacts, and they provide instructions. These roles were notmutually exclusive; parents could play more than one role.
(1) Serve as role model of math engagement. Parents wereasked to rate on a 4-point scale (1 = never/almostnever through 4 = everyday/almost every day)“How often does your child see you engage in mathactivities?”
(2) Provide artifacts. Responses from the entire transcriptwere reviewed to identify whether parents discussedproviding artifacts for their children as a part of theway they socialized their children’s math skills. Twoexamples of remarks consistent with this role include,“We got him a math book,” and “She has a countingbook.” A parent received a code of 1 if she mentionedthe theme and 0 if she did not. The kappa for thistheme was 1.00.
(3) Active involvement in children’s math learning. Parentswere asked to rate, “How important is it that you helpyour child with math?” Responses could range from1 (not very) to 5 (very).
Parents’ Own Math Skills. Parents were asked, “How goodat math are you?” and “How much do you enjoy math?”.Ratings on each question ranged from 1 (not good at all) to5 (very good).
2.3.2. Frequency of Children’s Math Activities. The frequencyof children’s math activities was assessed using two indica-tors, overall math activity and a composite indicator basedon specific math activities.
Overall Math Activity. Parents were asked about their chil-dren’s overall math activity, “How often does your childengage in math activities?” Ratings were 0 (never, almostnever), 1 (less than once a week), 2 (once a week to severaltimes a week), and 3 (everyday/almost every day).
Specific Math Activities. Parents were asked to rate thefrequency of children’s participation in a broad-range of27 specific math-relevant activities (e.g., counting, playingboard games, and playing jigsaw puzzles). We used thesame rating scale (from 0 to 3) as with the previousindicator of overall math activity. Scores on these specificmath items were averaged. The items comprising the specificmath activities composite showed good internal consistency(Cronbach’s alpha of .80).
2.3.3. Covariates. Mothers’ educational level, a proxy forsocioeconomic status, was included as a control variable inthe statistical analyses. Educational levels were coded intosix categories: 1 = less than high school degree, 2 = highschool graduate, 3 = some college, vocational or technicalschool, 4 = associate degree, 5 = bachelor degree, and6 = postgraduate degree. Although income and maternaleducation are separate factors, they are highly related [41].In fact, several researchers note that much of the differencesin children’s educational outcomes or factors related totheir education are predicted by maternal education ratherthan income. For example, Suizzo and Stapleton [42], usinga large U.S. nationally representative sample, found thatmaternal education was the strongest predictor of parentalinvolvement. Income was not a significant predictor whenmaternal education was included as a predictor (see also [43],for further analysis of the role of income and education).
The data in this study revealed systematic group-baseddifferences in parents’ education. Chinese parents had sig-nificantly higher educational levels than Caucasians who,in turn, had significantly higher educational levels thanLatinos, F(1, 71) = 12.48, p = .001. African Americans’educational levels fell between Caucasians and Latinos butdid not differ significantly from either group (p > .10).There were no significant differences in the educational levelsbetween parents of younger and older children, F(1, 71) =1.56, p = .216. Preliminary correlational analyses foundthat parents’ educational level was significantly related toseveral parental beliefs: importance of assisting child withmath activities, r(72) = .29, p = .013, and children learnmath through a skills-based focus at home, r(72) = −.24,p = .04. There also was a borderline effect for parents’ self-reported math skills, r(72) = .21, p = .069.
3. Results
This section begins with unadjusted descriptive information(no controls for mother’s educational level) of parents’beliefs about their children’s math development for the entiresample. We then compare beliefs of parents of younger(prekindergarten, kindergarten) and older children (firstgrade and older). We also present ethnic/racial comparisonsbetween the Chinese and Caucasian parents; comparisons forAfrican Americans and Latinos are not included because oftheir relatively small sample size. We next present informa-tion about children’s reported math activities following thesame strategy as we did for the analysis of parental beliefs.Finally, we analyze relations between parents’ beliefs and thefrequency of children’s math activities for the entire sample.We control for mother’s educational level in all analyses(correlations, analysis of covariance, and regressions) exceptfor descriptive information.
3.1. Parents’ Beliefs about Children’s Math Development
3.1.1. Importance of Children Doing Math Activities at Home.On average, parents highly endorsed the importance ofchildren doing math at home (Mean = 4.51, SD = .77).Eighty-six percent gave scores of 4 or 5 suggesting that

6 Child Development Research
parents considered doing math at home important (or veryimportant); only 14% considered doing math at home assomewhat or not important (scores of 2 or 3).
3.1.2. Beliefs about How Children Learn Math. We askedparents about the best ways to help their children learn math.Most parents reported engaging children’s interest (73%) andskills inculcation (77%) as the best way to help their childrenlearn math. About half (56%) mentioned involvement indaily living activities.
3.1.3. Parents’ Role in Their Children’s Math Learning.As noted below, parents generally reported being activelyinvolved in their children’s math learning.
Role Models. There was variability in how often chil-dren reportedly observed their parents do math activities.Although about half the parents (48%) reported that theirchildren observed them engage in math activities everyday or almost every day, 29% of the children observedtheir parents do math activities less than once a week(Mean = 3.10, SD = 1.03). Of those children who didobserve their parents engage in math activities, they typicallyobserved them participate in daily living activities, such ascooking, paying bills and bank-related matters, and goingfood shopping.
Provide Artifacts. Seventy-four percent of the parents saidthey provided their children with math artifacts. Artifactsincluded various math books or workbooks, games, andcalendars.
Active Involvement. Almost all parents reported that it wasimportant to assist their children with math. Eighty-sixpercent gave ratings of 4 or 5 to this question; 12% gaveratings of 3 (Mean = 4.53, SD = .77).
3.1.4. Parents’ Own Math Skills. Almost half of the parents(46.5%) considered themselves good or very good at math(scores of 4 or 5); a similar percentage rated themselves as“ok” (score of 3), (Mean = 3.55, SD = 0.99). Similarly,almost half the parents rated themselves as enjoying math(scores of 4 or 5) and about a third (38.4%) reported onlyenjoying math somewhat (score of 3) (Mean = 3.41, SD =1.15). Parents’ rating of their enjoyment of math was stronglycorrelated with their ratings of how good at math they were,r(70) = .63, p = .001.
3.1.5. Confluence of Parents’ Beliefs. Parents have a setof beliefs about how children develop and their role insuch development. Therefore it is important to considerinterrelations among the different types of beliefs. All ofthe correlational analyses controlled for maternal level ofeducation.
Parents who emphasized the importance of childrendoing math at home endorsed the importance of helpingtheir children with math, r(70) = .54, p = .001. Parents
who emphasized children’s engagement in learning reportedproviding artifacts, r(67) = .44, p = .001.
Parents who emphasized the importance of daily livingactivities for their children’s learning also reported that theirchildren more frequently saw them do math, r(70) = .34,p = .003, emphasized the importance of helping theirchildren with math, r(70) = .24, p = .045, and gave higherratings to enjoying math (borderline significance), r(70) =.23, p = .056.
Parents who endorsed a skill’s orientation also endorsedthe importance of their children doing math at home,r(67) = .29, p = .017 and helping their children with math,r(67) = .33, p = .006. There was a negative relation betweenendorsing a skill’s orientation and how good at math parentsreported they were, r(67) = −.26, p = .033, and a borderlinenegative relation between a skill’s orientation and how muchparents enjoyed math, r(67) = −.22, p = .073.
3.2. Parents’ Beliefs about Math Development, by Children’sAge Group. A series of analyses of covariance (ANCOVAs)and logistic regressions were conducted to compare the fourcategories of parents’ beliefs (the importance of childrendoing math activities at home, how children learn, parents’role in their children’s math learning, and parents’ ownmath skills) between parents of younger and older children.ANCOVAs were conducted when the dependent measureswere rating scales and logistic regressions were used withbinary outcomes. All analyses included mothers’ educationallevel as a control variable.
As Table 2 indicates none of the analyses were statisticallysignificant suggesting that parents of children in prekinder-garten through early elementary school have similar beliefsabout how children learn math and their role in suchlearning.
3.3. Chinese and Caucasian Parents’ Beliefs about Children’sMath Development. Percentages included in this sectionare unadjusted; ANCOVAS and logistic regression analysesinclude mothers’ educational level as a control variable.Therefore, all reported means are adjusted for mothers’educational level. Table 3 reports coefficients and analysesfor comparisons between Chinese and Caucasian parents’beliefs.
3.3.1. Importance of Children Doing Math Activities atHome. Approximately 79% of Chinese parents and 88%of Caucasian parents reported that doing math activitiesat home was important or very important. Although bothChinese and Caucasian parents emphasized the importanceof children doing math activities, Chinese parents (Mean =4.19, SE = .16) gave significantly lower ratings thanCaucasian parents, (Mean = 4.72, SE = .16).
3.3.2. Beliefs about How Children Learn Math. There wereno statistically significant differences between Chinese andCaucasian parents in the endorsement of engaging theirchildren’s interest, Wald χ2(N = 73, 1) = 0.47, p = .495,involvement in daily living activities Wald χ2(N = 73, 1) =0.21, p = .648 and skills inculcation as the best way to

Child Development Research 7
Table 2: Beliefs of parents by age group of children.
B Statistical test P
Importance of children doing math at home1 0.09 F(1, 70) = 0.23 .632
Beliefs about how children learn math2
Engagement 1.13 Wald χ2(N = 73, 1) = 0.05 .818
Skills 2.13 Wald χ2(N = 73, 1) = 1.52 .218
Daily living 0.76 Wald χ2(N = 73, 1) = 0.32 .572
Parents’ role in their children’s math learning
Role models1 −0.08 F(1, 70) = 0.10 .750
Provide artifacts2 1.26 Wald χ2(N = 73, 1) = 0.21 .649
Active involvement1 0.27 F(1, 70) = 2.44 .122
Parents’ own math skills1
How good parents are at math 0.11 F(1, 70) = 0.23 .634
How much parents enjoy math 0.09 F(1, 70) = 0.10 .756
Note. Parents’ highest level of education was used as a covariate in all analyses. There were 40 parents of younger and 33 parents of older children included inanalyses.1ANCOVA parameter estimates reported for comparisons between groups.2Logistic regression odds ratios reported for group predicting endorsement of each belief.
Table 3: Statistical analyses for chinese and caucasian parents’ beliefs about children’s math development.
B Statistical test P
Importance of children doing math at home1 0.52 F(1, 51) = 5.06 .029
Beliefs about how children learn math2
Engagement 1.58 Wald χ2(N = 54, 1) = 0.47 .495
Skills 2.74 Wald χ2(N = 54, 1) = 2.12 .146
Daily living 0.76 Wald χ2(N = 54, 1) = 0.21 .648
Parents’ role in their children’s math learning
Role models1 0.64 F(1, 51) = 5.77 .020
Provide artifacts2 2.56 Wald χ2(N = 54, 1) = 2.16 .142
Active involvement1 −0.12 F(1, 51) = 0.24 .625
Parents’ own math skills1
How good parents are at math 0.18 F(1, 51) = 0.49 .487
How much parents enjoy math 0.20 F(1, 51) = 0.39 .533
Note. Parents’ highest level of education was used as a covariate in all analyses. There were 28 Chinese and 26 Caucasian parents included in analyses.1ANCOVA parameter estimates reported for comparisons between groups.2Logistic regression odds Ratios reported for group predicting endorsement of each belief.
help their children learn math Wald χ2(N = 73, 1) = 2.12,p = .146. On average, parents regardless of ethnicity/raceendorsed these orientations.
3.3.3. Parents’ Role in Their Children’s Math Learning
Role Models. Caucasian parents (Mean = 3.46, SE = .19)were significantly more likely than Chinese parents (Mean =2.82, SE = .18) to report that their children saw them engagein math activities, F(1, 51) = 5.77, p = .02, partial etasquared = .10.
Provide Artifacts. Differences between Chinese and Cau-casian parents in providing artifacts to their children werenot statistically significant, Wald χ2(N = 73, 1) = 2.16,p = .142.
Active Involvement. There were no statistically significantdifferences in how strongly Chinese (Mean = 4.47, SE = .17)
and Caucasian parents (Mean = 4.35, SE = .17) rated theimportance of assisting their children with math at home,F(1, 51) = .24, p = .625, partial eta squared= .005.
3.3.4. Parents’ Own Math Skills. There were no significantdifferences in how good Chinese (Mean = 3.43, SE = .17)and Caucasian (Mean = 3.61, SE = .16) parents believedthey were in math, F(1, 51) = 0.49, p = .487, partial etasquared = .01. There also were no significant differences inhow much Chinese (Mean = 3.25, SE = .22) and Caucasianparents (Mean = 3.49, SE = .22) reported enjoying math,F(1, 51) = 0.39, p = .533, partial eta squared = .008.
3.4. Frequency of Children’s Engagement in Math Activities.As Table 4 indicates, on average, parents’ reported that theirchildren engaged in math activities between several timesa week and almost every day (Mean = 2.49; SD = .60)based on an overall measure of math activities. About half

8 Child Development Research
Table 4: Mean frequency of children’s math activities by age group.
OverallN = 73
YoungerN = 40
OlderN = 33
P
Composite math activities
Overall indicator 2.49 2.57 2.40 .222
Average based on specificmath activities
1.48 1.42 1.55 .138
Specific math activities
Count objects 2.42 2.72 2.07 <.001
Answer/ask questions “Howmany are things are there?”
2.21 2.31 2.08 .324
Write numbers 2.18 1.99 2.42 .047
Use TV remote 2.07 1.87 2.31 .088
Add/subtract objects 2.01 1.68 2.41 <.001
Match/identify shapes 2.01 2.38 1.57 <.001
Tell time on a clock 1.86 1.59 2.20 .021
Play with blocks/constructiontoys
1.73 1.87 1.56 .210
Use a computer 1.73 1.38 2.15 .003
Make patterns withbeads/blocks
1.50 1.61 1.39 .356
Play with money 1.49 1.50 1.48 .924
Play with puzzles 1.42 1.73 1.05 .001
Do math homework 1.41 0.82 2.12 <.001
Put objects in order 1.38 1.51 1.24 .260
Use math workbooks 1.36 1.01 1.78 .001
Dial telephone 1.33 1.40 1.25 .568
Play math games/board games 1.29 1.21 1.39 .374
Play video games 1.26 0.79 1.83 <.001
Use calendars 1.25 0.82 1.77 <.001
Play card games 1.22 1.22 1.21 .964
Measure things 1.18 1.08 1.29 .344
Watch math TV programs 1.18 1.48 0.81 .008
Keep score in games 1.15 0.92 1.43 .042
Look at math books 1.12 1.19 1.05 .583
Jump rope/play hop scotchgames
1.00 0.97 1.04 .762
Use math flashcards 0.69 0.74 0.63 .632
Use maps 0.42 0.35 0.52 .314
Note. Younger group includes children going into prekindergarten andkindergarten; the older group includes children going into first grade andabove. Means for younger and older age group are adjusted for mothers’educational level. Overall means are not adjusted. Significance is based onresults of an ANCOVA, controlling for mothers’ education level.
of parents reported that their children participated in mathactivities every day or almost every day.
In contrast to parents’ reports of the frequency ofoverall math activity, when we averaged the frequency ofinvolvement across specific math activities, parents reportedlower levels of children engagement (between less than oncea week and one to several times a week; Mean = 1.48; SD =.39). Very few (about 1.5%) of the children reportedlyengaged in math activities every day. As is apparent fromthe two means, parents’ estimates of the frequency of
their children’s overall engagement in math activities wassignificantly higher than the average of reported engagementin specific activities, t(72) = 15.46, p = .001. Resultspresented in the following sections are based on the averageof the specific math activities composite rather than theoverall composite question because we think it is a moreaccurate reflection of children’s frequency of engagement.
Table 4 shows important variability in the level ofchildren’s reported engagement across math activities. Themost commonly occurring activities (mean of 2.00 or higher,once to several times a week) are counting objects, ask-ing/answering questions about quantity, using the televisionremote, and writing numbers. Lowest levels of reportedengagement are found for playing board or card games orwatching math video games.
3.5. Younger and Older Children’s Reported Engagement inMath Activities. There were some significant differencesbetween children in the two age groups in the frequencyof engagement in specific activities (see Table 4). Asexpected, younger children were more likely to be involvedthan older children in basic math activities. The specificactivities that younger children more frequently report-edly did were count objects, F(1, 70) = 13.34, p =.001, partial eta squared = .168; match or identify shapes,F(1, 70) = 14.13, p = .001, partial eta squared = .168;play with puzzles, F(1, 70) = 12.01, p = .001, partialeta squared = .147; and watch math television programs,F(1, 70) = 7.43, p = .008, partial eta squared = .096.In contrast, older children significantly more frequentlyengaged in activities such as add/subtract things, F(1, 70) =14.64, p = .001, partial eta squared = .173; write num-bers F(1, 70) = 4.09, p = .047, partial eta squared =.058, do homework (assigned by teachers), F(1, 70) = 24.33,p = .001, partial eta squared = .266; use math workbooks,F(1, 70) = 12.03, p = .001, partial eta squared = .149keep score in games, F(1, 70) = 4.27, p = .042, partial etasquared = .057; use calendars, F(1, 70) = 13.52, p = .001,partial eta squared = .162; tell time, F(1, 70) = 5.61, p =.021, partial eta squared = .074; play video games, F(1, 70) =19.22, p = .001, partial eta squared =.215; use a computer,F(1, 670) = 9.72, p = .003, partial eta squared = .122.
3.6. Chinese and Caucasian Children’s Reported Frequency ofEngagement in Math Activities. There were significant dif-ferences between Chinese and Caucasian children’s reportedfrequency of engagement for some math activities (seeTable 5). Caucasian children reportedly engaged more fre-quently in the following math-related activities: countingobjects, F(1, 51) = 4.43, p = .040, partial eta squared= .080;playing with or using money, F(1, 51) = 10.27, p = .002,partial eta squared = .168; matching or identifying shapes,F(1, 51) = 4.27, p = .044, partial eta squared = .077;ordering objects, F(1, 51) = 6.01, p = .018, partial etasquared = .105; measuring things, F(1, 51) = 7.81, p =.007, partial eta squared = .133; playing math games/boardgames, F(1, 51) = 4.76, p = .034, partial eta squared = .085;keeping score in games, F(1, 51) = 9.59, p = .003, partial etasquared = .158.

Child Development Research 9
Table 5: Mean frequency of children’s math activities.
OverallN = 73
ChineseN = 28
CaucasianN = 26
P
Composite math activities
Overall indicator 2.49 2.41 2.64 .154
Average based on specificmath activities
1.48 1.34 1.53 .091
Specific math activities
Count objects 2.42 2.10 2.58 .040
Answer/ask questions“How many are things arethere?”
2.21 2.16 2.02 .628
Write numbers 2.18 2.48 2.00 .057
Use TV remote 2.07 1.83 2.03 .551
Add/subtract objects 2.01 1.91 2.22 .215
Match/identify shapes 2.01 1.73 2.30 .044
Tell time on a clock 1.86 1.63 1.78 .655
Play withblocks/construction toys
1.73 1.65 1.95 .288
Use a computer 1.73 1.90 1.76 .669
Make patterns withbeads/blocks
1.50 1.38 1.52 .634
Play with money 1.49 0.95 1.86 .002
Play with puzzles 1.42 1.46 1.20 .239
Do math homework 1.41 1.27 1.64 .309
Put objects in order 1.38 1.00 1.62 .018
Use math workbooks 1.36 1.54 1.04 .082
Dial telephone 1.33 1.16 0.98 .507
Play math games/boardgames
1.29 1.16 1.64 .034
Play video games 1.26 1.30 1.26 .911
Use calendars 1.25 1.09 1.40 .374
Play card games 1.22 1.08 1.45 .127
Measure things 1.18 0.73 1.41 .007
Watch math TV programs 1.18 1.01 0.99 .937
Keep score in games 1.15 0.68 1.54 .003
Look at math books 1.12 1.13 0.90 .424
Jump rope/play hop scotchgames
1.00 0.89 0.89 .991
Use math flashcards 0.69 0.51 0.75 .373
Use maps 0.42 0.44 0.60 .481
Note. Means for Chinese and Caucasian parents are adjusted for mothers’educational level. Overall means are not adjusted. Overall means representmeans for all ethnic/racial groups.
Chinese children reportedly engaged more frequently(borderline effects) in writing numbers, F(1, 51) = 3.80,p = .057, partial eta squared = .071, and using workbooks,F(1, 51) = 3.15, p = .082, partial eta squared = .058.
3.7. Associations between Parents’ Beliefs and Frequencyof Children’s Math Activities. We first calculated partialcorrelations between parents’ beliefs and children’s mathactivities to determine which beliefs to include in a regression
Table 6: Summary of multiple regression analysis for parent beliefspredicting frequency of math activities at home.
Variable B SE (B) β t P
Intercept 0.67 0.27 2.46 .016
Mothers’ education level −0.04 0.02 −.16 −1.54 .135
Importance of childrendoing math at home
0.13 0.06 .25 2.35 .022
Parents’ role—role models 0.10 0.04 .26 2.28 .026
How children learnmath—daily living
0.16 0.09 .21 1.82 .073
Note. R2 = .262, F(4, 68) = 6.05, P < .001.
model. Given the small sample size, it was important tolimit the number of predictors in the regression models.Accordingly, we included only those predictors that weresignificantly correlated with frequency of children’s mathactivities. Correlation and regression analyses controlled formothers’ educational level.
The frequency of children’s math activities (compositemeasure based on average of specific math activities) wassignificantly related to three parent beliefs: the importanceof children doing math activities at home, r(70) = .35,p = .003; the importance of involving children in dailyliving activities, r(70) = .34, p = .003; the frequency withwhich they saw their parents do math activities (parents asrole models), r(70) = .38, p = .001. On average, childrenof parents who consider it important to have their childrendo math activities at home, see themselves as role models,and involve children in daily living math activities are morefrequently involved in math activates at home.
It is noteworthy that neither parents’ enjoyment of mathnor how good they are at math was significantly relatedto the frequency with which children did math at home,r(70) = .15, .18, p = .21, .14, respectively. Skills inculcationfor helping their children learn math was not significantlyrelated to the frequency with which children participated inmath activities at home, r(70) = .001, p = .993.
Table 6 shows the regression analysis with parents’ beliefsas predictors and the composite measure of engagement inmath activities as the dependent variable. Parents’ ratingsof the importance of children doing math at home, andparents’ ratings of the frequency with which their child seesthem do math activities were both significantly related tothe frequency with which children reportedly did math athome. Parents’ endorsement of involving their children indaily living activities as a means of learning math showeda borderline relation with children’s engagement in mathactivities. These results show the importance of parents’beliefs for increasing the frequency of children’s engagementin math activities.
4. Discussion
Far too many children in the United States do not becomecompetent in math [1]. This exploratory study examined themath home-environment of children by analyzing parents’beliefs and children’s involvement in math activities. Giventhe strong connection between children’s involvement in

10 Child Development Research
math activities at home and their math learning [8, 10, 11],we wanted to provide some insights into the basis of thevariability in children’s home-based involvement in mathactivities. Understanding the reason for the variability in thefrequency with which children participate in math activitiesat home is an important first step towards neutralizing themath disadvantages experienced by a significant number ofchildren.
Five important findings emerged from this study: theassociation between parents’ beliefs about children’s mathdevelopment and the frequency of children’s engagementin math activities at home, the relation among parents’beliefs about children’s math development, the frequencyand nature of children’s math activities, age-related patternsin children’s engagement in math activities, and comparisonsbetween Chinese and Caucasian parents’ beliefs and chil-dren’s math activities.
One, these results highlight the importance of consider-ing parents’ beliefs in any model of children’s math devel-opment [19]. The frequency with which children reportedlyparticipated in math activities was related to the frequencywith which children observed their parents do math activities[29]. It also was related to parents’ beliefs about using dailyliving activities to foster math learning, and to parents’ beliefsabout the importance of children doing math at home.
There is an interesting difference between parents’ beliefsabout math, as documented in this study, and readingdevelopment, as documented in Serpell et al. [23]. Incontrast to Serpell et al.’s [23] findings, where the importanceof using daily living activities to help their children learnto read was not mentioned, more than half of the parentsin this study mentioned that involvement in daily livingactivities is an important means of fostering children’s mathdevelopment. The difference in patterns between readingand math underscores the need to more fully investigatechildren’s home-math environments. We cannot just assumethat how parents foster their children’s reading competencieswill apply to how they foster math competencies.
Two, this study demonstrates the importance of consid-ering the relations among different dimensions of parents’beliefs. We considered four sets of parental beliefs: theimportance of children doing math activities at home,how children learn math (through engaging child’s interest,inculcating skills, and using daily living activities), parents’role in their children’s math learning (serve as role modelsof engagement, provide artifacts, and active involvement inchildren’s math learning), and parents’ own math skills (self-rated skills and enjoyment). By considering different aspectsof parents’ beliefs, we were able to document relations amongthe beliefs. Such documentation is necessary to obtain a morevalid understanding of parents’ beliefs about children’s mathdevelopment. Only with a valid understanding will we beable to design interventions that are effective for a diversepopulation of children.
Note that parents’ enjoyment of math and their self-rated ability in math were not significant predictors of thefrequency with which children engaged in math activities.The lack of association between mothers’ perceptions of theirown ability and enjoyment and children’s math engagement
may reflect the simplicity of math activities that children,on average, are involved in at this age. As children becomeinvolved with more complicated math activities, these par-ticular beliefs may become relevant.
Consider the associations among the beliefs held byparents. Parents who emphasized the importance of childrendoing math at home also emphasized the importance ofhelping their child with math, and, in particular, that parentsteach their children math. Parents who emphasized theimportance of daily living activities for their child’s learningalso reported that their child more frequently saw them domath. Parents who emphasized the importance of helpingtheir children with math tended to report that they enjoyedmath.
Three, this study confirmed the variability and relativelylimited participation of children in math activities at home[15]. About 44% reported mean engagement in mathactivities (based on the average of activities) between onceand several times a week. About 53% reported less frequentengagement in math activities. Although we do not knowwhat is the minimum involvement needed to acquire orimprove math skills, we suspect that the limited participationreported by the children in this study is not optimal.
Four, these results also add to the literature by showingage-related differences in children’s reported engagementin math activities. Differences between younger and olderchildren in the frequency of reported engagement were foundin specific activities. Not surprisingly, younger children weremore likely to reportedly engage in activities likely to fostercounting and basic math skills; older children reportedlyengaged in activities that fostered more advanced skills(addition and subtraction) and/or required more advancedcompetencies (using calendars and playing video games).However, parents’ beliefs about how to foster math were notsensitive to the differences in the two age groups of children.It is possible that differences would have emerged if we hadused a wider age span. Alternatively, the beliefs tapped in thisstudy may be stable and not subject to change as children gofrom prekindergarten to elementary school.
Five, these findings also add to the body of researchon Chinese and Caucasian children’s math development. Incontrast to previous findings [44]; (Li [45]), Chinese andCaucasian parents in this study showed somewhat similarbeliefs about how children’s developed math. When therewere differences between groups, Caucasian parents reportedhigher frequency of being role models for their children andplaced more emphasis on the importance of their childrendoing math at home.
We propose five possible explanations for these findingswith Chinese and Caucasian parents in this study. Thefirst three explanations focus on changing acculturationpatterns. The next two focus on potential limitations ofwhat was explored in this study. First, Chinese immigrantsin this study mainly lived in the suburbs and did notbenefit from living in strong ethnic enclaves (and sourcesof educational support) unlike other Chinese immigrantsin the United States who are more likely to live in cities[46]. Consistent with the first option, the Chinese parentsincluded in this study may be more culturally assimilated

Child Development Research 11
to the Caucasian mainstream culture than were previousgenerations of Chinese immigrants or those who participatedin other studies. Third, given globalization trends, it maybe possible that the beliefs and practices of parents fromdifferent countries are becoming more homogenous overtime. Fourth, Chinese and Caucasian parents may differon other pertinent beliefs not explored in this study. Forexample, we did not explore parents’ expectations forchildren’s academic accomplishments and progress, areasof documented differences across ethnic/racial groups [39].Fifth, differences in Chinese and Caucasian children’s mathskills may be due to factors other than parents’ beliefs.Further empirical analyses should be conducted to study therelative importance of these explanations.
4.1. Limitations and Future Directions. Because the samplesize in this study, particularly for African Americans andLatinos, was fairly small, the findings are exploratoryin nature. Future studies should use a larger sample tocapture a more representative portrait of the math home-environments of children from diverse ethnic/racial back-grounds. The important variability in ethnic/racial/incomepatterns of math development [7, 47, 48] highlights the needto examine group-specific family environments. The natureof this study limited any such exploration to only Chineseand Caucasian families residing in the mid-Atlantic regionof the United States.
The theoretical model guiding this research is thatparents’ beliefs are related to children’s activities which, inturn, are related to children’s math skills. However, we wereunable to include a measure of children’s math skills in thisstudy. We expect that children’s math activities are related tochildren’s math skills (e.g., [8, 10, 11]). Nevertheless, futureresearch should investigate the full model. It is also importantto note that our measures of children’s math activities arebased on parents’ reports. Future research should attempt toconfirm these findings with some form of direct measure orwith corroboration, if possible, with reports by children.
This study investigated a small portion of children’shome environments and parents’ math-related beliefs andpractices. Although such a directed focus appears to us to bevalid, it is important for future research to compare parents’beliefs and practices across different academic and nonaca-demic domains to get a fuller picture of home learningopportunities available to different groups of children.
Regardless of the limitations of this study, our analysisprovides new exploratory evidence of the importance ofunderstanding children’s math home-environments. Theseexploratory findings can inform the development of home-based interventions to improve math outcomes of chil-dren from different ethnic/racial groups. For example,these results show that certain beliefs of parents, but notothers, predicted children’s engagement in math activities.Educating parents about the importance of having theirchildren engage in math activities at home, serving asrole models of such engagement, and using appropriatedaily living activities involving math are important avenuesfor facilitating children’s increased engagement with mathat home. Recall that only about half the parents (56%)
mentioned involvement in daily living activities as a way tofacilitate children’s math development. Clearly, some parentsare not aware of the positive implications of involving theirchildren in frequent math-related activities. Parents can alsobe encouraged to give increased attention to being rolemodels of engagement for their children. Only about half(49%) the parents reported that their children saw themdo math activities every day and 10% noted their childrennever saw them engaged in math activities. In fact, takingadvantage of the many daily living activities that involvemath (e.g., cooking and paying bills) may be an excellent wayfor parents to serve as role models of math engagement fortheir children. In contrast, neither parents’ own enjoymentof math nor their self-rated skills predicted whether this agegroup of children engaged in math at home.
5. Conclusion
This study documented aspects of children’s home mathenvironments to explore the relation between parents’ beliefsand children’s participation in math activities. Althoughresearch shows that children’s math activities at home arerelated to their math skills, a significant portion of childrenhave limited math involvement at home [8, 10, 11, 15].Parents’ beliefs about children’s math development and theirrole in fostering such development was significantly relatedto children’s math activities. Although further research isneeded to confirm the findings with a larger sample, par-ticularly for analyses focusing on ethnic/racial comparisons,and to include measures of children’s math competencies,these findings are an important first step that will aid inthe development of home-based interventions to facilitatechildren’s math skills.
Acknowledgments
The authors would like to thank Jared Au Yeung, Shel-ter Bamu, Sumit Bose, Felix Burgos, Brittany Cholakian,Vishka Correya, Semone Dupigny, Rebecca Gao, JenniferGibbs, Christine Glancey, Dan Li, Claudia Paiva, KishanPatel, Samantha Schene, Alexandria Spaay, Kirsten Spence,Mariana Triantos, Judy Wang, Kaitlyn Wilson, and ZuotangZhang for their assistance. This research was supported byUMBC Venture SEED funds and MIPAR.
References
[1] National Research Council and Committee on Early child-hood Mathematics, Mathematics Learning in Early Childhood:Paths Towards Excellence and Equity, Center for Education,Division of Behavioral and Social Sciences and Education, TheNational Academies Press, Washington, DC, USA, 2009.
[2] S. Baldi, Y. Jin, M. Skemer, P. J. Green, and D. Herget,Highlights From PISA 2006: Performance of U.S. 15-Year-Old Students in Science and Mathematics Literacy in anInternational Context (NCES 2008-016), National Center forEducation Statistics, Institute of Education Sciences, U.S.Department of Education, Washington, DC, USA, 2007.
[3] I. V. S. Mullis, M. O. Martin, P. Foy et al., “Findings fromIEA’s Trends in International Mathematics and Science Study

12 Child Development Research
at the fourth and eighth grades,” TIMSS 2007 InternationalMathematics Report, TIMSS & PIRLS International StudyCenter, Boston College, Chestnut Hill, MA, USA, 2008.
[4] M. Burchinal, K. McCartney, L. Steinberg et al., “Examiningthe Black-White achievement gap among low-income childrenusing the NICHD study of early child care and youthdevelopment,” Development, vol. 82, pp. 1404–1420, 2011.
[5] R. Crosnoe, F. Morrison, M. Burchinal et al., “Instruction,teacher-student relations, and math achievement trajectoriesin elementary school,” Journal of Educational Psychology, vol.102, no. 2, pp. 407–417, 2010.
[6] G. J. Duncan, C. J. Dowsett, A. Claessens et al., “Schoolreadiness and later achievement,” Developmental Psychology,vol. 43, no. 6, pp. 1428–1446, 2007.
[7] N. C. Jordan, D. Kaplan, C. Ramineni, and M. N. Locuniak,“Early math matters: kindergarten number competence andlater mathematics outcomes,” Developmental Psychology, vol.45, no. 3, pp. 850–867, 2009.
[8] Y. Anders, H.-G. Rossbach, S. Weinert et al., “Home andpreschool learning environments and their relations to thedevelopment of early literacy skills,” Early Childhood ResearchQuarterly, vol. 27, pp. 231–244, 2012.
[9] B. Blevins-Knabe and L. Musun-Miller, “Number use at homeby children and their parents and its relationship to earlymathematical performance,” Infant and Child Development,vol. 5, no. 1, pp. 35–45, 1996.
[10] J.-A. LeFevre, E. Polyzoi, S. L. Skwarchuk, L. Fast, and C.Sowinski, “Do home numeracy and literacy practices ofGreek and Canadian parents predict the numeracy skills ofkindergarten children?” International Journal of Early YearsEducation, vol. 18, no. 1, pp. 55–70, 2010.
[11] J.-A. Lefevre, S.-L. Kwarchuk, B. L. Smith-Chant, L. Fast,D. Kamawar, and J. Bisanz, “Home numeracy experiencesand children’s math performance in the early school years,”Canadian Journal of Behavioural Science, vol. 41, no. 2, pp. 55–66, 2009.
[12] S.-L. Skwarchuk, “How do parents support preschoolers’numeracy learning experiences at home?” Early ChildhoodEducation Journal, vol. 37, no. 3, pp. 189–197, 2009.
[13] E. C. Melhuish, M. B. Phan, K. Sylva, P. Sammons, I. Siraj-Blatchford, and B. Taggart, “Effects of the home learningenvironment and preschool center experience upon literacyand numeracy development in early primary school,” Journalof Social Issues, vol. 64, no. 1, pp. 95–114, 2008.
[14] G. B. Ramani and R. S. Siegler, “Promoting broad and stableimprovements in low-income children’s numerical knowledgethrough playing number board games,” Child Development,vol. 79, no. 2, pp. 375–394, 2008.
[15] J. R. H. Tudge and F. Doucet, “Early mathematical experiences:observing young black and white children’s everyday activi-ties,” Early Childhood Research Quarterly, vol. 19, no. 1, pp.21–39, 2004.
[16] U. Bronfenbrenner, The Ecology of Human Development,Harvard University Press, Cambridge, Mass, USA, 1979.
[17] L. S. Vygotsky, Mind in Society: The Development of HigherPsychological Proces, Harvard University Press, Cambridge,Mass, USA, 1978.
[18] C. M. Super and S. Harkness, “The developmental niche:a conceptualization at the interface of child and culture,”International Journal of Behavioral Development, vol. 9, pp.545–569, 1986.
[19] M. H. Bornstein and L. R. Cote, “Mothers’ parenting cogni-tions in cultures of origin, acculturating culture, and cultures
of destination,” Child Development, vol. 75, no. 1, pp. 221–235,2004.
[20] M. Keels, “Ethnic group differences in early head start parents’parenting beliefs and practices and links to children’s earlycognitive development,” Early Childhood Research Quarterly,vol. 24, no. 4, pp. 381–397, 2009.
[21] I. E. Sigel, “The belief-behavior connection: a resolvabledilemma?” in Parental Belief Systems: The Psychological Con-sequences for Children, I. E. Sigel, A. V. McGillicuddy-DeLisi,and J. J. Goodnow, Eds., pp. 433–456, Lawrence ErlbaumAssociates, Hillsdale, NJ, USA, 2nd edition, 1992.
[22] T. S. Weisner, “Ecocultural understanding of children’s devel-opmental pathways,” Human Development, vol. 45, no. 4, pp.275–281, 2002.
[23] R. Serpell, L. Baker, and S. Sonnenschein, Becoming Literatein the City: The Baltimore Early Childhood Project, Cambridge,Mass, USA, 2005.
[24] S. Sonnenschein, “Engaging children in the appropriation ofliteracy: the importance of parental beliefs and practices,” inContemporary Perspectives in Early Childhood Education, O.Saracho and B. Spodek, Eds., pp. 127–149, Information AgePublishing, Greenwich, CT, USA, 2002.
[25] J. J. Goodnow, “Parents’ ideas, children’s ideas: corre-spondence and divergence,” in Parental Belief Systems:ThePsychological Consequences for Children, I. E. Sigel, A. V.McGillicuddy-DeLisi, and J. J. Goodnow, Eds., pp. 293–317,Lawrence Erlbaum Associates, Hillsdale, NJ, USA, 2nd edition,1992.
[26] A. V. McGillicuddy-DeLisi and I. E. Sigel, “Parental Beliefs,” inHandbook of Parenting, M. H. Bornstein, Ed., vol. 3, pp. 333–358, 2nd edition, 2002.
[27] J. S. Eccles, “Families, schools, and developing achievement-related motivations and engagement,” in Handbook of Social-ization, J. E. Grusec and P. D. Hastings, Eds., pp. 665–691,Guilford Press, New York, NY, USA, 2007.
[28] F. J. Morrison, C. M. Connor, and H. J. Bachman, “Thetransition to school,” in Handbook of Early Literacy, D.Dickinson and S. B. Neuman, Eds., pp. 375–394, Guildford,New York, NY, USA, 2006.
[29] S. D. Simpkins, P. E. Davis-Kean, and J. S. Eccles, “Parents’socializing behavior and children’s participation in math,science, and computer out-of-school activities,” Applied Devel-opmental Science, vol. 9, pp. 14–30, 2005.
[30] S. Sonnenschein and K. Munsterman, “The influence ofhome-based reading interactions on 5-year-olds’ readingmotivations and early literacy development,” Early ChildhoodResearch Quarterly, vol. 17, no. 3, pp. 318–337, 2002.
[31] S. Sonnenschein, L. Baker, and R. Serpell, “The EarlyChildhood Project: a 5-year longitudinal investigation ofchildren’s literacy development in sociocultural context,” inLiteracy Development and Enhancement Across Orthographiesand Cultures, D. Aram and O. Korat, Eds., pp. 85–96, Springer,New York, NY, USA, 2010.
[32] C. M. Super and S. Harkness, “Culture structures the environ-ment for development,” Human Development, vol. 45, no. 4,pp. 270–274, 2002.
[33] S. Harkness and C. M. Super, Parents’ Cultural Belief Systems:Their Origins, Expressions, and Consequences, Guilford Press,New York, NY, USA, 1996.
[34] R. H. Bradley, “Environment and parenting,” in Handbook ofParenting, M. H. Bornstein, Ed., vol. 2 of Biology and Ecologyof Parenting, pp. 281–314, Lawrence Erlbaum Associates,Mahwah, NJ, USA, 2002.

Child Development Research 13
[35] D. C. Geary, L. Fan, and C. C. Bow-Thomas, “Numericalcognition: loci of ability differences comparing children fromChina and the United States,” Psychological Science, vol. 3, pp.180–185, 1992.
[36] H. W. Stevenson, S. Y. Lee, C. S. Chen et al., “Mathematicsachievement of children in China and the United States,” ChildDevelopment, vol. 61, no. 4, pp. 1053–1066, 1990.
[37] R. Chao and V. Tseng, “Parenting of Asians,” in Handbook ofParenting, M. H. Bornstein, Ed., vol. 4 of Social Conditions andApplied Parenting, pp. 59–93, Lawrence Erlbaum Associates,Mahwah, NJ, USA, 2002.
[38] J. Li, S. D. Holloway, J. Bempechat, and E. Loh, “Buildingand using a social network: nurture for low-income ChineseAmerican adolescents’ learning,” in Beyond Families andSchools: How Broader Social Contexts Shape the Adjustment ofChildren and Youth in Immigrant Families, H. Yoshikawa andN. Way, Eds., pp. 7–25, 2008.
[39] Y. Yamamoto and S. D. Holloway, “Parental expectations andchildren’s academic performance in sociocultural context,”Educational Psychology Review, vol. 22, no. 3, pp. 189–214,2010.
[40] L. Okagaki and R. J. Sternberg, “Parental beliefs and children’sschool performance,” Child Development, vol. 64, pp. 36–56,1993.
[41] G. J. Duncan and K. A. Magnuson, “Can family socioeconomicresources account for racial and ethnic test score gaps?” TheFuture of Children, vol. 15, no. 1, pp. 35–54, 2005.
[42] M.-A. Suizzo and L. M. Stapleton, “Home-based parentalinvolvement in young children’s education: examining theeffects of maternal education across U.S. ethnic groups,”Educational Psychology, vol. 27, no. 4, pp. 533–556, 2007.
[43] R. H. Bradley and R. F. Corwyn, “Age and ethnic variationsin family process mediators of SES,” in Socioeconomic Status,Parenting, and Child Development, M. H. Bornstein and R.H. Bradley, Eds., pp. 151–188, Lawrence Erlbaum Associates,Mahwah, NJ, USA, 2003.
[44] R. K. Chao, “Beyond parental control and authoritarianparenting style: understanding Chinese parenting through thecultural notion of training,” Child Development, vol. 65, no. 4,pp. 1111–1119, 1994.
[45] J. Li, “Chinese conceptualization of learning,” Ethos, vol. 29,no. 2, pp. 111–137, 2001.
[46] M. Zhou, Contemporary Chinese American: Immigration,Ethnicity, and Community Transformation, Temple UniversityPress, Philadelphia, Pa, USA, 2009.
[47] C. S. Huntsinger and P. E. Jose, “Parental involvement inchildren’s schooling: different meanings in different cultures,”Early Childhood Research Quarterly, vol. 24, no. 4, pp. 398–410, 2009.
[48] S. F. Reardon and C. Galindo, “The hispanic-white achieve-ment gap in math and reading in the elementary grades,”American Educational Research Journal, vol. 46, no. 3, pp. 853–891, 2009.
Hindawi Publishing CorporationChild Development ResearchVolume 2012, Article ID 459385, 10 pagesdoi:10.1155/2012/459385
Research Article
Children’s Use of Arithmetic Shortcuts: The Role ofAttitudes in Strategy Choice
Katherine M. Robinson and Adam K. Dube
Department of Psychology Campion College at the University of Regina, 3737 Wascana Parkway, Regina, SK, Canada S4S 0A2
Correspondence should be addressed to Katherine M. Robinson, [email protected]
Received 20 May 2012; Accepted 10 August 2012
Academic Editor: Ann Dowker
Copyright © 2012 K. M. Robinson and A. K. Dube. This is an open access article distributed under the Creative CommonsAttribution License, which permits unrestricted use, distribution, and reproduction in any medium, provided the original work isproperly cited.
Current models of strategy choice do not account for children’s attitudes towards different problem solving strategies. Grade 2, 3,and 4 students solved three sets of three-term addition problems. On inversion problems (e.g., 4 + 8 − 8), if children understandthe inverse relation between the operations, no calculations are required. On associativity problems (e.g., 5 + 27 − 23), if childrenunderstand the associative relation between the operations, problem solving can be facilitated by performing subtraction beforeaddition. A brief intervention involving demonstrations of different problem solving strategies followed the first problem set.Shortcut use increased after the intervention, particularly for students who preferred shortcuts to the left-to-right algorithm. Inthe third set, children were given transfer problems (e.g., 8 + 4 − 8, 4 − 8 + 8, 27 + 5 − 23). Shortcut use was similar to first setsuggesting that transfer did occur. That shortcut use increased the most for students who had positive attitudes about the shortcutssuggests that attitudes have important implications for subsequent arithmetic performance.
1. Children’s Use of Arithmetic:The Role of Preference in Strategy Choice
Children’s understanding of the relations between additionand subtraction is considered integral for later mathematicalskills [1]. Part of the research agenda needs to understandand account for the large individual differences in children’sconceptual knowledge [2]. While many researchers havefocussed on factors such as general mathematics skills [3] orworking memory [4] to account for individual differencesin understanding the relationship between addition andsubtraction, one overlooked factor may be students’ attitudesand beliefs towards mathematics. Attitudes are positive ornegative evaluations (e.g., “I like addition”) and beliefs are“thoughts” based on experience (e.g., “division is difficult”)[5] and both are considered to be integral in determiningsuccess in mathematics [6]. These attitudes and beliefs couldbe integral in the conceptual knowledge that children use andunderstand when making problem solving strategy choices.
Researchers have often considered children’s use of theinversion shortcut strategy on inversion problems of theform a+b−b as an indicator of understanding of the inverse
relation between the two operations [3]. The inversionshortcut involves stating that the answer is a without per-forming any calculations as the two bterms cancel each otherout. Children’s understanding of the relationship betweenaddition and subtraction can also be assessed via children’suse of the associativity shortcut on problems of the forma + b − c, which were originally included in studies ofchildren’s inversion as control problems [7]. When childrenunderstand that addition and subtraction are associative,they can use that information to simplify and speed upproblem solving by first subtracting and then adding (e.g.,3 + 29− 27 would be solved by calculating 29− 27 and thenadding 3) [4]. Both inversion and associativity three-termproblems are novel and therefore children must implementspontaneous problem solving strategies [8]. Researchers havetaken advantage of this novelty to gain an understandingof children’s knowledge of the relations between additionand subtraction by utilizing children’s use of conceptually-based shortcuts as an indicator of conceptual understandingbecause understanding the inverse or associative relationsbetween addition and subtraction is required to implementthe inversion and associativity shortcuts [9].

2 Child Development Research
Given the importance of understanding the relationsbetween addition and subtraction, some studies have gonebeyond assessing children’s spontaneous use or evaluation ofthe inversion shortcut by trying to promote conceptually-based shortcut use focussing exclusively on inversion prob-lems. In these studies, 8-year-old children’s conceptualunderstanding of the inverse relation between addition andsubtraction, as assessed via shortcut use, increased aftereither 2 or 3 training sessions with concrete objects [10, 11]or after repeated weekly exposure to inversion problems [12].
A possible alternative to the longer interventions usedin previous studies comes from a study with Grade 2, 3,and 4 students by Robinson and Dube [13] who askedchildren to solve inversion and associativity problems andthen had the children complete an evaluation of procedurestask [9] as a second measure of conceptual understanding.In the task, for both inversion and associativity problems,the shortcut and a standard left-to-right algorithm (i.e.,adding the first two numbers and then subtracting the thirdnumber) were demonstrated to participants and participantswere asked if they approved of each approach. Bisanz et al.[9] argued that the evaluation of procedures task is a goodmeasure of conceptual understanding as it permits childrento demonstrate their understanding which they may haveimplemented during problem solving. However, in an earlierpilot study, we found that participants were very likely toapprove of both the shortcut and the left-to-right algorithmfor both inversion and associativity and thus a more stringentmeasure was needed. To gain more useful informationabout children’s understanding of arithmetic concepts, theparticipants in Robinson and Dube [13] were also asked tocompare the two solution procedures for each problem typeand decide which was better and why. Explicitly justifyinga strategy suggests conceptual understanding because theability to justify typically develops after the ability to assessa strategy’s worth and even use the strategy during problemsolving [14]. Robinson and Dube [13] found that most of theparticipants (80% or more) approved of both the shortcutand the left-to-right procedure for both the inversion andassociativity problems. The more stringent measure ofchoosing the better strategy was more sensitive as a clearmajority of participants preferred the shortcut to the left-to-right algorithm for inversion problems (78%) but not forassociativity problems (59%) with older students in Grades 3and 4 more likely to prefer the associativity shortcut. Effectsof the evaluation of procedures task on subsequent problemsolving were not examined in that study.
The study by Robinson and Dube [13] provided twoconclusions regarding strategy instruction and attitudesabout problem solving strategies. The first conclusion isthat the children had distinctly positive or negative attitudesabout the appropriateness of the shortcuts. For example,some participants commented on the cleverness of theshortcuts (e.g., “that’s so easy, I wish I’d thought of doing itthat way” while others strongly disapproved of the shortcuts“e.g., it’s cheating not to do all the math”). This variability inattitudes across individuals suggests that some children maybe open and flexible about learning new ways to problemsolve while others may be rigid and inflexible. For example,
across a series of studies, Torbeyns and colleagues [15–17]have shown that children are often resistant to using a moreefficient arithmetic strategy, even when explicitly encouragedand/or instructed to use that strategy. Previous researchhas suggested that children’s attitudes and beliefs aboutmathematics are critical to success in mathematics and toenrollment in advanced mathematics courses and thereforeengaging children with mathematics is of critical importance[18]. During schooling, children begin to have strongattitudes and beliefs about mathematics [19]. Children whoare intrinsically motivated [20], are mastery-oriented [21] orwho have low levels of mathematics anxiety [22], are morelikely to be successful in mathematics. Other factors relatingto mathematics success include the role of peer pressure [23]and disengagement [24].
Although several studies have investigated children’sattitudes and beliefs about mathematics, few studies haveinvestigated children’s attitudes about specific problem solv-ing strategies. Ellis [25] and Verschaffel et al. [26] note thatmuch of the research on the factors involved in children’sstrategy choices has focussed on the roles of speed andaccuracy and has ignored other factors such as individualand sociocultural influences. The findings of Robinson andDube [13] suggest that children’s attitudes towards the useof problem solving strategies that involve simplifying andreducing solution times are already entrenched by Grade 2and that these attitudes may become even more firmly heldby the end of the middle school years [27]. Current modelsof children’s strategy choices emphasize the tendency forchildren to want to use the most efficient problem solvingstrategies [28, 29] and yet the findings of Robinson and Dube[13] support Ellis’ and Verschaffel et al.’s [26] proposal thatother factors, in this case attitudes, may also impact strategychoices.
The second conclusion drawn from Robinson and Dube[13] was that comparison of problem solving strategiesyielded more information about children’s understandingof arithmetic concepts than only asking them to evaluatestrategies. Research on comparison of solution methods hasbeen encouraging as it appears to be an effective learningtool [30–32]. In two studies, participants in Grades 7 and/or8 were given the opportunity to compare different solutionmethods for solving algebraic equations [30, 31] and inStar and Rittle-Johnson [32], participants in Grades 5 and6 compared different solution methods for computationalestimation. In all of the studies, the opportunity to comparedifferent methods led to greater increases in procedural andconceptual knowledge than simply being presented withdifferent methods. None of the studies examined whetherthere were developmental changes in the effectiveness ofcomparison and no studies of the effects of comparisonhave been conducted with younger students. Extendingthe use of comparisons even further, Yakes and Star [33]found that teachers who participated in a workshop onhow to use comparison as an instructional tool for teachingalgebra changed their teaching practices. The teachers usedcomparison of different solution methods as a teaching tooland also began to recognize and emphasize the importanceof procedural flexibility in their teaching.

Child Development Research 3
Based on the findings of Robinson and Dube [13]that there are marked individual differences in children’sattitudes about the inversion and associativity shortcuts andthat presenting solution methods concurrently improvescomparison and is a useful learning technique for olderchildren (e.g., [30, 31]), the first two goals of this studywere to determine whether children’s attitudes about thesolution methods they were asked to evaluate would impactsubsequent problem solving strategies and to examinewhether presenting solution methods concurrently improvescomparison and is an effective learning tool on inversion andassociativity problems. The final two goals of the study wereto examine whether attitudes and the impact of comparisonwould change across development and to assess the strengthof the intervention task by investigating whether childrenwould transfer their new knowledge about the shortcutsto transfer problems. When concepts such as inversion orassociativity are effectively learned, then that knowledgeshould be applicable or transferable to new problem types[34]. Rittle-Johnson and Star [30, 31] found that comparisonof solution methods promoted flexibility and Rittle-Johnson[35] proposed that explaining why a procedure works is aneffective learning tool and can result in the ability to transferknowledge to new situations. Children do not necessarilyunderstand a concept that has been taught to them but theability to generalize a problem-solving strategy based onconceptual knowledge is an indicator that learning of thatconcept has occurred [36].
2. Method
2.1. Participants. Twenty-four Grade 2 students (12 boys,12 girls) (mean age = 7 years, 0 months), thirty-five Grade3 students (14 boys, 21 girls) (mean age = 7 years, 11months), and forty-three Grade 4 students (20 boys, 23girls) (mean age = 8 years, 10 months) participated in thestudy. The age groups were selected to correspond withprevious research [13] and to correspond to the time inwhich children are learning about addition and subtraction[18]. Participants were from a large Canadian city, werepredominantly Caucasian, and from middle SES families.The study took place in the first half of the school year.
2.2. Design and Intervention. The same pretest-intervention-posttest design was used as in the studies by Rittle-Johnsonand Star [30, 31] but the participants were tested individuallythroughout the study rather than being paired up for theintervention, and the posttest was divided into the firstposttest with familiar problems and a second posttest withtransfer problems to assess strength of learning from theintervention. Half the students per grade were randomlyassigned to either the sequential condition (n = 51) orthe concurrent condition (n = 51). The intervention wasthe evaluation of procedures task. For both inversion andassociativity problems, two strategies were demonstrated.In the sequential group, for each problem type: (1) thefirst strategy was demonstrated and then participants wereasked if they approved of the strategy; (2) the second
strategy was demonstrated and then participants were askedif they approved of the second strategy; (3) participantswere asked which of the two strategies they preferred. Inthe concurrent group, for each problem type: (1) bothstrategies were demonstrated consecutively; (2) participantswere asked if they approved of both strategies at the sametime; (3) participants were asked which of the two strategiesthey preferred. Problem type and strategy orders werecounterbalanced across boys and girls as closely as possiblewithin each grade. For the inversion problems, on oneproblem, participants were told how a fictitious child hadsolved the problem by using the inversion shortcut (“WhenX solved this problem, s/he said that the answer would bethe first number because when you add and subtract by thesame number, the answer is always the first number”). Onthe other problem, participants were told how a fictitiouschild had solved the problem using a left-to-right algorithmicapproach (“When X solved this problem, she/he added thefirst two numbers together and then subtracted the thirdnumber from that answer”). For the associativity problems,on one problem, participants were told how a fictitious childhad solved the problem by using the associativity shortcut(“When X solved this problem, she/he subtracted the thirdnumber from the second number and then took the answerand added it to the first number”). On the other problem,the same left-to-right algorithmic approach used on theinversion problem was used again.
2.3. Materials and Procedure. There were three sessions,which took place within a 7 day period with at least oneday between each session. In the first session which wasthe pretest, participants solved 16 three-term addition andsubtraction problems. Half the problems were inversionproblems of the form a + b − b and half were associativityproblems of the form a+b−c. Half the problems of each typewere small (a, b, c < 10) (e.g., 3 + 6−6 and 3 + 6−4) and halfwere large (a < 10, b and c between 21 and 29, b > c) (e.g.,7 + 23− 23 and 7 + 23− 21). No more than two problems ofeach type or each size were presented consecutively. Problemswere presented on a laptop screen using e-prime. Participantsdid not have the aid of paper and pencil. Solution latencies(measured from the time the problem appeared on the screenuntil the participant stated the answer and pressed the spacebar), accuracy, and immediately retrospective verbal reportsof problem solving strategy (i.e., “how did you solve thatproblem?”) were collected for each problem. Participantswho were unable to provide an answer within 30 secondswere given a “cut-off protocol” in which they were askedto report how they were trying to solve the problem beforemoving on to the next problem. Cut-off problems werecoded as incorrect and no solution latencies were recorded.
In the second session which was the intervention andfirst posttest session, participants were randomly assignedto the concurrent or sequential conditions and completedthe evaluation of procedures task and then solved thefirst posttest of a new set of 16 three-term addition andsubtraction problems. The same measures and the sameproblem parameters were used as in the first session.

4 Child Development Research
In the third session which was the second posttest session,participants solved 16 novel transfer problems. Half ofthe problems were inversion problems and the other halfwere associativity problems using the same parameters andmeasures as in the first and second sessions except that halfof the inversion problems were of the form b+a−b (e.g., 4 +9 − 4) and half of the form a − b + b (e.g., 7 − 23 + 23) andthe associativity problems were of the form b + a− c (e.g., 28+ 6 − 25).
3. Results
Data from boys and girls were collapsed together as nosignificant results involving gender were found. Tukey’sHonestly Significant Difference test was used to examinepost-hoc effects and the alpha level was .05 or less forall significant results. Analyses of verbal report data onlyare reported but accuracy, solution latency, and cutoff datamatched expected patterns (higher accuracy, shorter solutionlatencies, and fewer cutoffs when shortcuts were used, seeTable 1). Although differences between the concurrent andsequential conditions were expected, no differences werefound (see Table 2) so the analyses reported below are allcollapsed across condition. This lack of condition effect mayhave been a result of such a brief intervention or of thenature of the task. Both conditions included exposure to thesame information and the same problems and the childrenin both conditions were asked to decide which strategy theypreferred (the conceptually-based shortcut or the left-to-right strategy) yielding comparable data across conditions.This data allows the investigation of how children’s attitudestowards different problem solving strategies impacts subse-quent conceptually-based shortcut use.
3.1. Promotion of Conceptually-Based Shortcuts across Devel-opment. As can be seen in Table 3, some children werealready using the inversion and associativity shortcuts in thepretest. Shortcut use between the pretest and the first posttest(familiar problems) was compared to determine if shortcutuse on familiar problems increased after the evaluation ofprocedures task. Two separate 3 (Grade) × 2 (Size) × 2(Session) analyses of variance were conducted on inversionand associativity shortcut use. Shortcut use increased fromthe pretest to the first posttest (43.6% versus 63.2% forinversion, 20.9% versus 35.9% for associativity), F(1, 99)= 39.75, MSE = 929.93, η2
p = .29 and F(1, 99) = 17.43,MSE = 1231.66, η2
p = .15 for inversion and associativityrespectively. There was less shortcut use on small than largeproblems (50.7% versus 56.2% for inversion, 23.86% versus32.86% for associativity), F(1, 99) = 11.17, MSE = 259.68,η2p = .10 and F(1, 99) = 15.67, MSE = 496.78, η2
p = .14for inversion and associativity respectively. For inversion, nograde differences were found (44.0%, 62.9%, and 53.5%, forGrades 2, 3, and 4) but for associativity (17.71%, 39.46%,and 27.91% for Grades 2, 3 and 4), there was more shortcutuse by Grade 3 than Grade 2 students and Grade 4 studentsdid not differ from Grade 2 or 3 students, F(2, 99) = 3.92,MSE = 882.88,η2
p = .07, and HSD = 17.7.
If the evaluation of procedures task was successful atpromoting shortcut use, then participants should also usethe shortcuts on the novel transfer problems in the secondposttest. Shortcut use on typical problems before and afterthe evaluation of procedures task and shortcut use ontransfer problems after the evaluation of procedures taskwere analyzed using two repeated measures ANOVAs. Afterthe evaluation of procedures task, shortcuts were used lessfrequently on transfer problems in the second posttest thanon typical problems in the first posttest (43.8% versus 65.0%,for inversion, 16.8% versus 37.6% for associativity) but wereused just as frequently as shortcuts before the evaluation ofprocedures task (44.0% for inversion, 21.3% for associativ-ity), F(2, 202) = 25.68, MSE = 588.35, η2
p = .20, HSD = 14.4,F(2, 202) = 21.24, MSE = 576.48, η2
p = .17, and HSD = 14.3for inversion and associativity problems, respectively. Thissuggests that participants had greater difficulty applying theshortcuts to transfer problems than to typical problems afterthe evaluation of procedures task. However, shortcut use onthe transfer problems after the intervention was the same asshortcut use on the typical problems before the interventionsuggesting that the intervention may have promoted shortcutuse on the transfer problems.
Shortcut use on the transfer problems in the secondposttest was analyzed in greater detail to determine the effectsof grade, problem size, and transfer type. For inversionproblems, two types of transfer problems were possible, anda 3 (Grade) × 2 (Size) × 2 (Transfer type) ANOVA wasconducted (see Figure 1). Inversion shortcut use was higheron large problems (32.7% versus 49.9% for small and large),F(1, 99) = 34.32, MSE = 828.65, η2
p = .26. There was a two-way interaction between transfer type and grade, F(2, 99) =5.22, MSE = 1119.79, and η2
p = .10, with no grade differenceson the first type of inversion transfer problem (a− b+ b) buthigher shortcut use by the Grade 4 than the Grade 2 studentson the second type of transfer problem (b+a−b). There wereno differences between transfer type in Grades 2 or 3 but inGrade 4, shortcut use was higher on the second type. Thisinteraction was mediated by a three-way interaction betweentype, grade, and size, F(2, 99) = 3.23, MSE = 615.43, andη2p = .06. There was a main effect of problem size with more
shortcut use on large problems in all grades and both typesof transfer problems, except for Grade 4 students who hadno size difference on the first type of problem although themeans were in the expected direction.
For associativity problems, a 3 (Grade) × 2 (Size)ANOVA was conducted on the transfer problems in thesecond posttest (see Figure 2). Associativity shortcut use waslower on small problems (12.4% versus 18.5% for small andlarge), F(1, 99) = 5.89, MSE = 303.04, and η2
p =.06, and therewas a two-way interaction between grade and size, F(2, 99) =6.35, MSE = 303.04, and η2
p = .11. On small problems, Grade2 students used the associativity shortcut less frequently thanthe Grade 3 students, and on large problems the Grade 2students used the shortcut less than both the Grade 3 and 4students. There was no main effect of problem size in Grades2 or 3, but Grade 4 participants used the shortcut more onlarge problems.
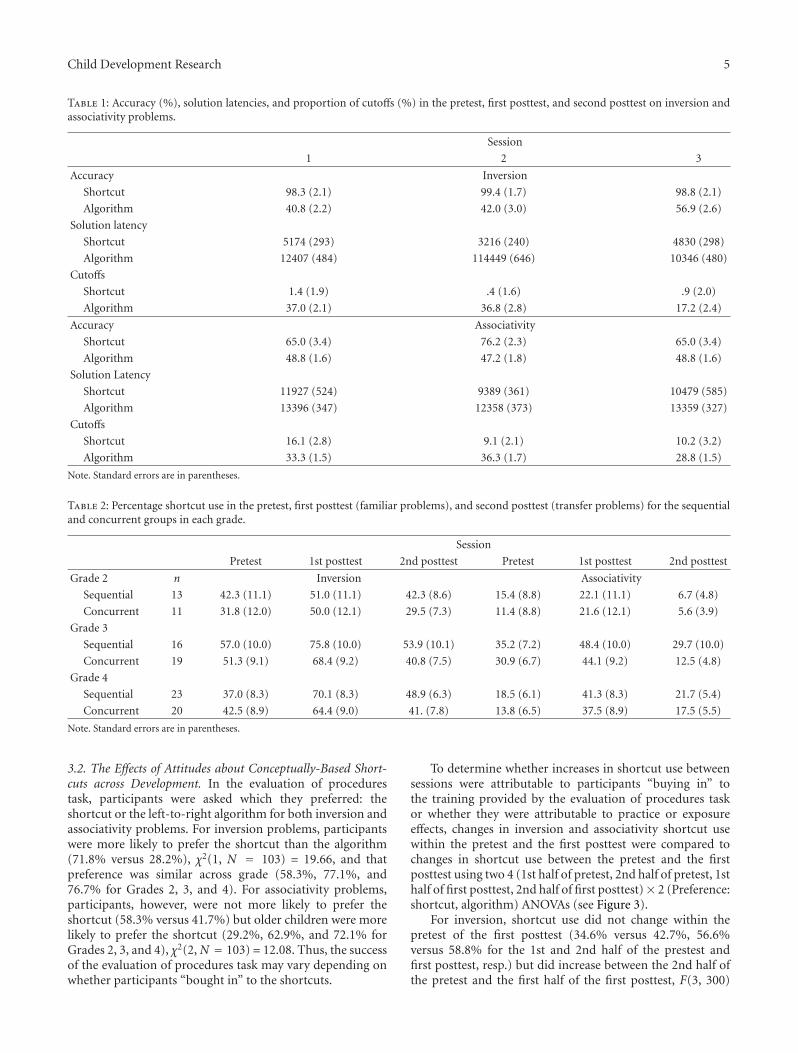
Child Development Research 5
Table 1: Accuracy (%), solution latencies, and proportion of cutoffs (%) in the pretest, first posttest, and second posttest on inversion andassociativity problems.
Session
1 2 3
Accuracy Inversion
Shortcut 98.3 (2.1) 99.4 (1.7) 98.8 (2.1)
Algorithm 40.8 (2.2) 42.0 (3.0) 56.9 (2.6)
Solution latency
Shortcut 5174 (293) 3216 (240) 4830 (298)
Algorithm 12407 (484) 114449 (646) 10346 (480)
Cutoffs
Shortcut 1.4 (1.9) .4 (1.6) .9 (2.0)
Algorithm 37.0 (2.1) 36.8 (2.8) 17.2 (2.4)
Accuracy Associativity
Shortcut 65.0 (3.4) 76.2 (2.3) 65.0 (3.4)
Algorithm 48.8 (1.6) 47.2 (1.8) 48.8 (1.6)
Solution Latency
Shortcut 11927 (524) 9389 (361) 10479 (585)
Algorithm 13396 (347) 12358 (373) 13359 (327)
Cutoffs
Shortcut 16.1 (2.8) 9.1 (2.1) 10.2 (3.2)
Algorithm 33.3 (1.5) 36.3 (1.7) 28.8 (1.5)
Note. Standard errors are in parentheses.
Table 2: Percentage shortcut use in the pretest, first posttest (familiar problems), and second posttest (transfer problems) for the sequentialand concurrent groups in each grade.
Session
Pretest 1st posttest 2nd posttest Pretest 1st posttest 2nd posttest
Grade 2 n Inversion Associativity
Sequential 13 42.3 (11.1) 51.0 (11.1) 42.3 (8.6) 15.4 (8.8) 22.1 (11.1) 6.7 (4.8)
Concurrent 11 31.8 (12.0) 50.0 (12.1) 29.5 (7.3) 11.4 (8.8) 21.6 (12.1) 5.6 (3.9)
Grade 3
Sequential 16 57.0 (10.0) 75.8 (10.0) 53.9 (10.1) 35.2 (7.2) 48.4 (10.0) 29.7 (10.0)
Concurrent 19 51.3 (9.1) 68.4 (9.2) 40.8 (7.5) 30.9 (6.7) 44.1 (9.2) 12.5 (4.8)
Grade 4
Sequential 23 37.0 (8.3) 70.1 (8.3) 48.9 (6.3) 18.5 (6.1) 41.3 (8.3) 21.7 (5.4)
Concurrent 20 42.5 (8.9) 64.4 (9.0) 41. (7.8) 13.8 (6.5) 37.5 (8.9) 17.5 (5.5)
Note. Standard errors are in parentheses.
3.2. The Effects of Attitudes about Conceptually-Based Short-cuts across Development. In the evaluation of procedurestask, participants were asked which they preferred: theshortcut or the left-to-right algorithm for both inversion andassociativity problems. For inversion problems, participantswere more likely to prefer the shortcut than the algorithm(71.8% versus 28.2%), χ2(1, N = 103) = 19.66, and thatpreference was similar across grade (58.3%, 77.1%, and76.7% for Grades 2, 3, and 4). For associativity problems,participants, however, were not more likely to prefer theshortcut (58.3% versus 41.7%) but older children were morelikely to prefer the shortcut (29.2%, 62.9%, and 72.1% forGrades 2, 3, and 4), χ2(2, N = 103) = 12.08. Thus, the successof the evaluation of procedures task may vary depending onwhether participants “bought in” to the shortcuts.
To determine whether increases in shortcut use betweensessions were attributable to participants “buying in” tothe training provided by the evaluation of procedures taskor whether they were attributable to practice or exposureeffects, changes in inversion and associativity shortcut usewithin the pretest and the first posttest were compared tochanges in shortcut use between the pretest and the firstposttest using two 4 (1st half of pretest, 2nd half of pretest, 1sthalf of first posttest, 2nd half of first posttest)× 2 (Preference:shortcut, algorithm) ANOVAs (see Figure 3).
For inversion, shortcut use did not change within thepretest of the first posttest (34.6% versus 42.7%, 56.6%versus 58.8% for the 1st and 2nd half of the prestest andfirst posttest, resp.) but did increase between the 2nd half ofthe pretest and the first half of the first posttest, F(3, 300)
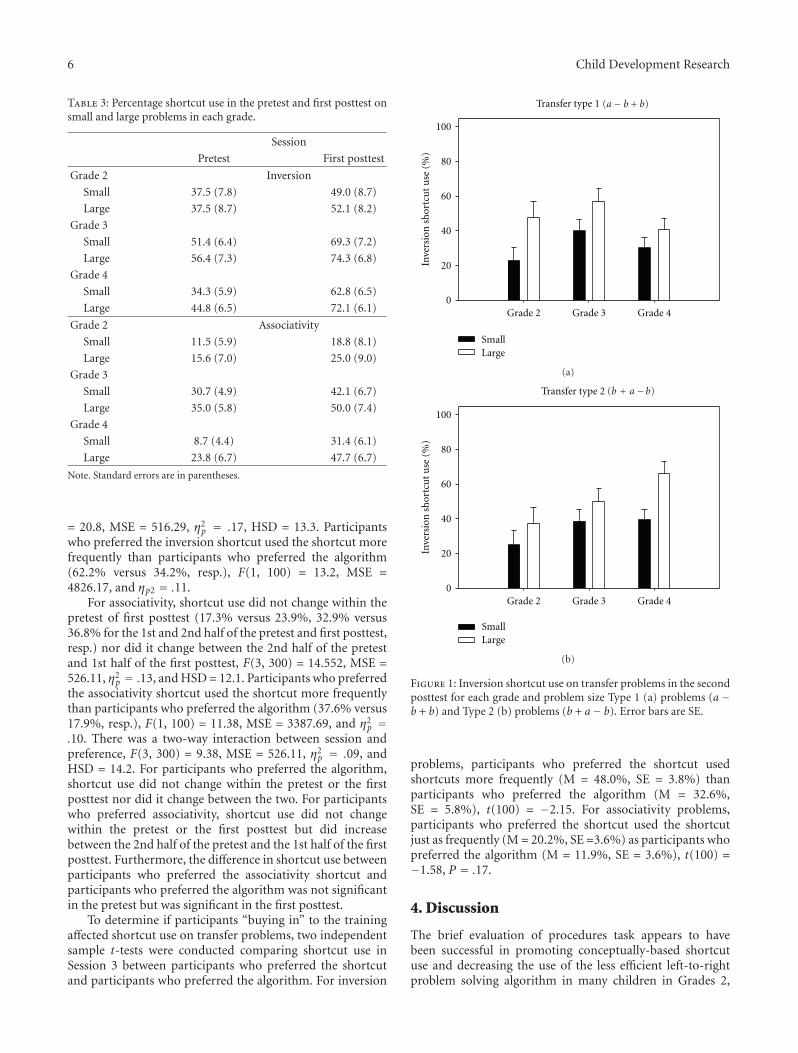
6 Child Development Research
Table 3: Percentage shortcut use in the pretest and first posttest onsmall and large problems in each grade.
Session
Pretest First posttest
Grade 2 Inversion
Small 37.5 (7.8) 49.0 (8.7)
Large 37.5 (8.7) 52.1 (8.2)
Grade 3
Small 51.4 (6.4) 69.3 (7.2)
Large 56.4 (7.3) 74.3 (6.8)
Grade 4
Small 34.3 (5.9) 62.8 (6.5)
Large 44.8 (6.5) 72.1 (6.1)
Grade 2 Associativity
Small 11.5 (5.9) 18.8 (8.1)
Large 15.6 (7.0) 25.0 (9.0)
Grade 3
Small 30.7 (4.9) 42.1 (6.7)
Large 35.0 (5.8) 50.0 (7.4)
Grade 4
Small 8.7 (4.4) 31.4 (6.1)
Large 23.8 (6.7) 47.7 (6.7)
Note. Standard errors are in parentheses.
= 20.8, MSE = 516.29, η2p = .17, HSD = 13.3. Participants
who preferred the inversion shortcut used the shortcut morefrequently than participants who preferred the algorithm(62.2% versus 34.2%, resp.), F(1, 100) = 13.2, MSE =4826.17, and ηp2 = .11.
For associativity, shortcut use did not change within thepretest of first posttest (17.3% versus 23.9%, 32.9% versus36.8% for the 1st and 2nd half of the pretest and first posttest,resp.) nor did it change between the 2nd half of the pretestand 1st half of the first posttest, F(3, 300) = 14.552, MSE =526.11, η2
p = .13, and HSD = 12.1. Participants who preferredthe associativity shortcut used the shortcut more frequentlythan participants who preferred the algorithm (37.6% versus17.9%, resp.), F(1, 100) = 11.38, MSE = 3387.69, and η2
p =.10. There was a two-way interaction between session andpreference, F(3, 300) = 9.38, MSE = 526.11, η2
p = .09, andHSD = 14.2. For participants who preferred the algorithm,shortcut use did not change within the pretest or the firstposttest nor did it change between the two. For participantswho preferred associativity, shortcut use did not changewithin the pretest or the first posttest but did increasebetween the 2nd half of the pretest and the 1st half of the firstposttest. Furthermore, the difference in shortcut use betweenparticipants who preferred the associativity shortcut andparticipants who preferred the algorithm was not significantin the pretest but was significant in the first posttest.
To determine if participants “buying in” to the trainingaffected shortcut use on transfer problems, two independentsample t-tests were conducted comparing shortcut use inSession 3 between participants who preferred the shortcutand participants who preferred the algorithm. For inversion
Grade 2 Grade 3 Grade 40
20
40
60
80
100
Small Large
Inve
rsio
n s
hor
tcu
t u
se (
%)
Transfer type 1 (a− b + b)
(a)
Grade 2 Grade 3 Grade 40
20
40
60
80
100
Small Large
Inve
rsio
n s
hor
tcu
t u
se (
%)
Transfer type 2 (b + a−b)
(b)
Figure 1: Inversion shortcut use on transfer problems in the secondposttest for each grade and problem size Type 1 (a) problems (a −b + b) and Type 2 (b) problems (b + a− b). Error bars are SE.
problems, participants who preferred the shortcut usedshortcuts more frequently (M = 48.0%, SE = 3.8%) thanparticipants who preferred the algorithm (M = 32.6%,SE = 5.8%), t(100) = −2.15. For associativity problems,participants who preferred the shortcut used the shortcutjust as frequently (M = 20.2%, SE =3.6%) as participants whopreferred the algorithm (M = 11.9%, SE = 3.6%), t(100) =−1.58, P = .17.
4. Discussion
The brief evaluation of procedures task appears to havebeen successful in promoting conceptually-based shortcutuse and decreasing the use of the less efficient left-to-rightproblem solving algorithm in many children in Grades 2,

Child Development Research 7
Grade 2 Grade 3 Grade 4
Ass
ocia
tivi
ty s
hor
tcu
t u
se (
%)
0
20
40
60
80
100
Small Large
Figure 2: Associativity shortcut use on transfer problems in thesecond posttest for each grade and problem size. Error bars are SE.
3, and 4. Children who use a conceptually-based shortcutare implementing an efficient problem solving strategy orprocedure that is dependent on the inverse or associaterelation between addition and subtraction, that is, they areusing a procedure that is based on an arithmetic concept. Thesuccessful promotion of shortcuts that arise from arithmeticconcepts is a finding consistent with a recent study withslightly older children showing that the task promoted moreconceptually-based shortcut use in a condition similar tothe present study’s concurrent condition than in a controlcondition [37]. To learn and implement new problem solvingstrategies such as the inversion and associativity shortcuts isintegral to increasing mathematical knowledge [8] as chil-dren with stronger conceptual knowledge of arithmetic willbe able to represent problems in arithmetic and algebra moreaccurately [14, 38]. Children are expected to understandand discover the inversion and associativity concepts andshortcuts on their own [8] and few studies have attemptedto teach children about the inverse relationship betweenaddition and subtraction [11] and none have been conductedon teaching children about the associative relationshipbetween addition and subtraction. The results of the currentstudy support both the ability of many children in Grades 2,3, and 4 to spontaneously discover and apply conceptually-based shortcuts during problem solving and the capacity ofchildren to learn how to use these shortcuts immediately aftera brief intervention where children are given demonstrationof the shortcuts. Interestingly, children’s attitudes towardsthe shortcuts were much more critical for children adoptinga shortcut during subsequent problem solving. In contrast,being in the concurrent or sequential condition had littleimpact [30–32].
The lack of grade differences in spontaneous inversionshortcut use (see also [3]), the higher use of the inversionshortcut for all students after the evaluation of procedurestask, and the more frequent use of the inversion shortcutthan the associativity shortcut all suggest that the inversionshortcut is easier to discover, learn, and apply than the
Inve
rsio
n s
hor
tcu
t u
se (
%)
100
80
60
40
20
01 2 0 1 2
Shortcut preferredAlgorithm preferred
Demonstration
Session 1 Session 2
(a)
Ass
ocia
tivi
ty s
hor
tcu
t u
se (
%)
100
80
60
40
20
01 2 0 1 2
Shortcut preferredAlgorithm preferred
Demonstration
Session 1 Session 2
(b)
Figure 3: Shortcut use in 1st and 2nd half of the pretest and thefirst posttest on inversion (a) and associativity (b) problems bypreference. Error bars are SE.
associativity shortcut. The associativity shortcut, on theother hand, was more likely to be used by the Grade 3 thanthe Grade 2 and 4 students. The shortcut requires calculationand therefore the advantage of using the shortcut may notbe clear to Grade 2 students struggling with calculation,whilst the Grade 4 students may be good enough calculatorsthat the shortcut does not seem superior. Demonstratingthe conceptually-based shortcuts may be most suitable forGrade 3 students who have just enough calculation skillsto be able to cope with the shortcut but not enough thatthe shortcut and the algorithm seem equally efficient. Whentypical solution methods are too difficult or inefficient,students are more likely to use alternative methods [39],which is consistent with the finding in the current study

8 Child Development Research
that students in all grades had higher use of shortcuts onproblems with larger numbers.
When children have good conceptual knowledge of inver-sion and associativity, they should be able to appropriatelytransfer the conceptually-based shortcuts to solve novelproblems [1]. Our findings suggest that the evaluation ofprocedures task promoted the use of conceptually-basedshortcuts on similar problems and that students were alsoable to apply the shortcuts to transfer problems. Consistentwith the findings of Siegler and Stern [12], inversionshortcut use was lower on transfer problems than in theprevious session with typical inversion problems, and thepattern was similar for associativity shortcut use. However,shortcut use on the transfer problems was similar to that ofspontaneous shortcut use in the first session. It is possiblethat, without the intervention, use of the shortcuts onthe transfer problems might have been even lower andtherefore future studies that investigate spontaneous useof the shortcuts on transfer problems before and after anintervention are needed. Children in all grades were able tospontaneously apply their knowledge of the shortcuts to thenovel problems in the first session indicating a strong schemaor strong understanding of inversion and associativity [40].After the very brief intervention, shortcut use may not havetransferred because children had learned to use the shortcutrather than understanding the concept behind the shortcut.
Contrary to expectations, the presentation format for theevaluation of procedures task, either sequential or concur-rent, made little difference to the promotion of conceptually-based shortcuts. Rittle-Johnson and Star’s [30–32] studiesdiffered from the present task in that our task was briefer,the problems and solution procedures in our task weresimpler, and our participants were not required to provideas much information about their mathematical reasoning.Future work could use an intervention containing moreproblems and include problems that are similar in structurebut to which the shortcuts do not apply—this could improvethe effectiveness of the instruction by showing childrenthe limitations of the shortcuts. Our results indicate thatproviding multiple problem solving approaches was effectivein promoting shortcut use and the presentation of theapproaches and the opportunity for comparison was notcritical as it was in the Rittle-Johnson and Star studies.However, Rittle-Johnson, Star, and Durkin [41] found thatcomparison of solution strategies was not always effective.Based on children’s shortcut use before and after theevaluation of procedures task, we propose that the evaluationtask used in the present study provides a quick and effectiveinstructional tool that can be implemented in the classroomto promote children’s understanding of the relations betweenaddition and subtraction.
Children’s attitudes about the demonstrated shortcuts,compared to a left-to-right algorithm on inversion andassociativity problems, had a clear effect on subsequentproblem solving procedures. Inversion and associativityshortcut use was higher for participants who preferredthe shortcut, with associativity shortcut use significantlyincreasing after the demonstration for participants whopreferred the shortcut. On transfer problems, preferring
the inversion shortcut also led to higher shortcut use andpreferring the associativity shortcut did not. This latterfinding provides further evidence that the associativityshortcut is more difficult for students perhaps because itcan overtax cognitive resources. The associativity transferproblems require students to pay attention to all threenumbers and notice that the third number can be subtractedfrom the first number and then to subsequently performthat subtraction and then add the middle number whilekeeping track that all of the numbers have been added orsubtracted. However, associativity shortcut use was similaron the transfer problems as it was in the pretest so theintervention may still have had a beneficial effect.
As most intervention studies involve providing studentswith information or instruction without assessing children’sattitudes or beliefs about that information or instruction, thefinding that children’s views of problem solving proceduresimpact their subsequent procedure or strategy choices alsoneeds to be further investigated and current theories ofstrategy choice need to include children’s attitudes as afactor in strategy choice [27]. The current study used a briefintervention task and children had the opportunity to onlyprovide brief information about their strategy preferences.As Verschaffel et al. [26] propose, more extensive interviewswith children to gain deeper insight into their strategychoices and the influences on their strategy choices areneeded. However, this is the first study to examine theconsequences of children being more or less receptive toconceptually-based shortcuts and the consequences, par-ticularly for the associativity shortcut, were marked. Inareas outside of mathematics, research has shown thatchildren’s attitudes significantly contribute to their actions[5]. The present study indicates that children’s attitudestowards mathematics, even simple preferences between twostrategies, can be the basis for action during problem solving.
Researchers are increasingly focussing attention on howattitudes impact children’s mathematics performance, deci-sions to take advanced mathematics courses, and careerchoices (e.g., [24]). However, there is also a need toinvestigate how attitudes impact smaller components ofmathematics learning such as strategy choice. Conceptually-based shortcut use has important advantages. First, usingshortcuts frees up cognitive resources [42] that can then beused to deal with more complex problems such as algebraproblems [38]. Second, using shortcuts may make childrenmore likely to pay attention to problem characteristics toguide strategy choices [39, 42] rather than being “mindless”problem solvers who are rigid rather than flexible [43].Further research on why some children have more positiveattitudes towards accepting strategies that are highly effi-cient but are novel to their current strategy repertoire ofalgorithmic approaches may help explain some of the largeindividual differences found in children’s procedural andconceptual knowledge of arithmetic.
Acknowledgment
This paper was supported in part by an NSERC discoverygrant. Thanks to Jen Gibson, John Brand, and Anna Maslany

Child Development Research 9
for assistance with the collection and coding of the data.Many thanks to the children, teachers, and principals fromthe participating schools.
References
[1] National Mathematics Advisory Panel, Foundations for Success:The Final Report of the National Mathematics Advisory Panel,U.S. Department of Education, Washington, DC, USA, 2008.
[2] J. Bisanz, “The development of mathematical cognition:arithmetic,” Journal of Experimental Child Psychology, vol. 74,no. 3, pp. 153–156, 1999.
[3] C. K. Gilmore and M. Papadatou-Pastou, “Patterns of individ-ual differences in conceptual understanding and arithmeticalskill: a meta-analysis,” Mathematical Thinking and Learning,vol. 11, no. 1-2, pp. 25–40, 2009.
[4] J. S. Klein and J. Bisanz, “Preschoolers doing arithmetic:the concepts are willing but the working memory is weak,”Canadian Journal of Experimental Psychology, vol. 54, no. 2,pp. 105–116, 2000.
[5] K. Bartsch and H. Wellman, “Young children’s attribution ofaction to beliefs and desires,” Child Development, vol. 60, no.4, pp. 946–964, 1989.
[6] J. Kilpatrick, J. Swafford, and B. Findell, Adding it up: HelpingChildren Learn Mathematics, National Academy Press, Wash-ington, DC, USA, 2001.
[7] J. Bisanz and J. LeFevre, “Strategic and nonstrategic processingin the development of mathematical cognition,” in Children’sStrategies: Contemporary Views of Cognitive Development, D.F. Bjorklund, Ed., pp. 213–244, Erlbaum, Hillsdale,, NJ, USA,1990.
[8] M. Schneider and E. Stern, “The inverse relation of additionand subtraction: a knowledge integration perspective,” Math-ematical Thinking and Learning, vol. 11, no. 1-2, pp. 92–101,2009.
[9] J. Bisanz, R. P. D. Watchorn, C. Piatt, and J. Sherman, “On“understanding” children’s developing use of inversion,”Mathematical Thinking and Learning, vol. 11, no. 1-2, pp. 10–24, 2009.
[10] M.-L. Lai, A. J. Baroody, and A. R. Johnson, “Foster-ing Taiwanese preschoolers’ understanding of the addition-subtraction inverse principle,” Cognitive Development, vol. 23,no. 1, pp. 216–235, 2008.
[11] T. Nunes, P. Bryant, D. Hallett, D. Bell, and D. Evans, “Teach-ing children about the inverse relation between addition andsubtraction,” Mathematical Thinking and Learning, vol. 11, no.1-2, pp. 61–78, 2009.
[12] R. S. Siegler and E. Stern, “Conscious and unconscious strat-egy discoveries: a microgenetic analysis,” Journal of Experimen-tal Psychology, vol. 127, no. 4, pp. 377–397, 1998.
[13] K. M. Robinson and A. K. Dube, “Children’s understandingof addition and subtraction concepts,” Journal of ExperimentalChild Psychology, vol. 103, no. 4, pp. 532–545, 2009.
[14] R. W. Prather and M. W. Alibali, “The development of arith-metic principle knowledge: how do we know what learnersknow?” Developmental Review, vol. 29, no. 4, pp. 221–248,2009.
[15] B. De Smedt, J. Torbeyns, N. Stassens, P. Ghesquiere, and L.Verschaffel, “Frequency, efficiency and flexibility of indirectaddition in two learning environments,” Learning and Instruc-tion, vol. 20, no. 3, pp. 205–215, 2010.
[16] J. Torbeyns, B. De Smedt, P. Ghesquiere, and L. Verschaffel,“Acquisition and use of shortcut strategies by traditionally
schooled children,” Educational Studies in Mathematics, vol.71, no. 1, pp. 1–17, 2009.
[17] J. Torbeyns, B. De Smedt, P. Ghesquiere, and L. Verschaffel,“Solving subtractions adaptively by means of indirect addi-tion: influence of task, subject, and instructional factors,”Mediterrannean Journal for Research in Mathematics Educa-tion, vol. 8, no. 2, pp. 1–30, 2009.
[18] National Council of Teachers of Mathematics, Principles andStandards for School Mathematics, NCTM, Reston, Va, USA,2000.
[19] D. B. McLeod, “Connecting research to teaching,” Mathemat-ics Teacher, vol. 86, pp. 761–763, 1993.
[20] M. R. Lepper, H. J. Corpus, and S. S. Iyengar, “Intrinsicand extrinsic motivational orientations in the classroom: agedifferences and academic correlates,” Journal of EducationalPsychology, vol. 97, no. 2, pp. 184–196, 2005.
[21] C. A. Wolters, “Advancing achievement goal theory: using goalstructures and goal orientations to predict students’ moti-vation, cognition, and achievement,” Journal of EducationalPsychology, vol. 96, no. 2, pp. 236–250, 2004.
[22] M. H. Ashcraft, J. A. Krause, and D. R. Hopko, “Is mathanxiety a mathematical learning disability?” in Why is Mathso Hard for Some Children? The Nature and Origins of Math-ematical Learning Difficulties and Disabilities, D. B. Berch andM. M. M. Mazzocco, Eds., pp. 329–248, Paul H. Brookes,Baltimore, Md, USA, 2007.
[23] National Research Council, Knowing and Learning Mathemat-ics for Teaching: Proceedings of a Workshop, National AcademyPress, Washington, DC, USA, 2001.
[24] A. J. Martin, J. Anderson, J. Bobis, R. Vellar, and J. Way,“Switching on and switching off in mathematics: an ecologicalstudy of future intent and disengagement among middleschool students,” Journal of Educational Psychology, vol. 104,no. 1, pp. 1–18, 2012.
[25] S. Ellis, “Strategy choice in sociocultural context,” Develop-mental Review, vol. 17, no. 4, pp. 490–524, 1997.
[26] L. Verschaffel, K. Luwel, J. Torbeyns, and W. Van Dooren,“Conceptualizing, investigating, and enhancing adaptiveexpertise in elementary mathematics education,” EuropeanJournal of Psychology of Education, vol. 24, no. 3, pp. 335–359,2009.
[27] K. M. Robinson and J. LeFevre, “The inverse relation betweenmultiplication and division: concepts, procedures, and acognitive framework,” Educational Studies in Mathematics, vol.79, no. 3, pp. 409–428, 2012.
[28] A. J. Baroody, S. H. Tiilikainen, and Y.-C Tai, “The applicationand development of an additional goal sketch,” Cognition andInstruction, vol. 24, no. 1, pp. 123–170, 2008.
[29] R. S. Siegler and R. Araya, “A computational model ofconscious and unconscious strategy discovery,” in Advances inChild Development and Behavior, R. V. Kail, Ed., vol. 33, pp.1–42, Elsevier, New York, NY, USA, 2005.
[30] B. Rittle-Johnson and J. R. Star, “Does comparing solutionmethods facilitate conceptual and procedural knowledge? Anexperimental study on learning to solve equations,” Journal ofEducational Psychology, vol. 99, no. 3, pp. 561–574, 2007.
[31] B. Rittle-Johnson and J. R. Star, “Compared with what? Theeffects of different comparisons on conceptual knowledgeand procedural flexibility for equation solving,” Journal ofEducational Psychology, vol. 101, no. 3, pp. 529–544, 2009.
[32] J. R. Star and B. Rittle-Johnson, “It pays to compare: anexperimental study on computational estimation,” Journal ofExperimental Child Psychology, vol. 102, no. 4, pp. 408–426,2009.

10 Child Development Research
[33] C. Yakes and J. R. Star, “Using comparison to develop flex-ibility for teaching algebra,” Journal of Mathematics TeacherEducation, vol. 14, no. 3, pp. 175–191, 2011.
[34] D. C. Geary, Children’s Mathematical Development: Researchand Practical Implications, American Psychological Associa-tion., Washington, DC, USA, 1994.
[35] B. Rittle-Johnson, “Promoting transfer: effects of self-expla-nation and direct instruction,” Child Development, vol. 77, no.1, pp. 1–15, 2006.
[36] T. P. Carpenter, “Conceptual knowledge as a foundation forprocedural knowledge: implications from research on theinitial learning of arithmetic,” in Conceptual and ProceduralKnowledge: The Case of Mathematics, J. Hiebert, Ed., pp. 113–132, Erlbaum, Hillsdale,, NJ, USA, 1986.
[37] K. M. Robinson and A. K. Dube, “Children’s additive concepts:promoting understanding and the role ofinhibition,” Learningand Individual Differences. In press.
[38] T. Nunes, P. Bryant, D. Burman et al., “Deaf children’sunderstanding of inverse relationships,” in Deaf Cognition:Foundations and Outcomes, M. Marschark and P. C. Hauser,Eds., pp. 201–225, Oxford University Press, New York, NY,USA, 2008.
[39] K. J. Newton, J. R. Star, and K. Lynch, “Understanding thedevelopment of flexibility in struggling algebra students,”Mathematical Thinking and Learning, vol. 12, no. 4, pp. 282–305, 2010.
[40] A. J. Baroody, “The development of adaptive expertise andflexibility: the integration of conceptual and proceduralknowledge,” in The Development of Arithmetic Concepts andSkills: Constructing Adaptive Expertise, A. J. Baroody and A.Dowker, Eds., pp. 1–33, Erlbaum, Mahwah, NJ, USA, 2003.
[41] B. Rittle-Johnson, J. R. Star, and K. Durkin, “The importanceof prior knowledge when comparing examples: influences onconceptual and procedural knowledge of equation solving,”Journal of Educational Psychology, vol. 101, no. 4, pp. 836–852,2009.
[42] D. J. Mabbott and J. Bisanz, “Developmental change and indi-vidual differences in children’s multiplication,” Child Devel-opment, vol. 74, no. 4, pp. 1091–1107, 2003.
[43] N. M. McNeil, B. Rittle-Johnson, S. Hattikudur, and L. A.Petersen, “Continuity in representation between children andadults: arithmetic knowledge hinders undergraduates’ alge-braic problem solving,” Journal of Cognition and Development,vol. 11, no. 4, pp. 437–457, 2010.

Hindawi Publishing CorporationChild Development ResearchVolume 2012, Article ID 876028, 10 pagesdoi:10.1155/2012/876028
Research Article
Attitudes towards Mathematics: Effects of Individual,Motivational, and Social Support Factors
Maria de Lourdes Mata, Vera Monteiro, and Francisco Peixoto
ISPA, Instituto Universitario, UIPCDE, Rua Jardim do Tabaco 34, 1149-041 Lisboa, Portugal
Correspondence should be addressed to Maria de Lourdes Mata, [email protected]
Received 11 May 2012; Revised 4 August 2012; Accepted 19 August 2012
Academic Editor: Helga Krinzinger
Copyright © 2012 Maria de Lourdes Mata et al. This is an open access article distributed under the Creative Commons AttributionLicense, which permits unrestricted use, distribution, and reproduction in any medium, provided the original work is properlycited.
This paper aims to understand how certain different but interrelated variables such as background, motivation, and social supportcould lead to an explanation of student attitudes towards math and to an understanding of the defining characteristics of theseattitudes in the school environment. Participants consisted of 1719 Portuguese students, from fifth-to-twelfth grade. The studyutilizes an adaptation of the “Intrinsic Motivation Inventory” assessing main determinants of intrinsic motivation. One section ofthe questionnaire—“In my Math Class”—also assesses student perceptions of teacher and peer support as well as student attitudes.The results revealed that, in general, students held positive attitudes towards mathematics and also highlighted the main effects ofgrade and math achievement on these attitudes. No gender effect was identified although the girls showed a continuous decline inattitudes the further they progressed in school. A hierarchical analysis using structural equation modeling showed that motivation-related variables are the main predictors of attitudes towards mathematics and that teachers and the social support of peers arealso highly significant in understanding these attitudes.
1. Introduction
Proficiency in languages, science, and mathematics is seenas an essential precursor to success in modern society. InPortugal, recent guidelines, set by the Ministry of Educationregarding Mathematics and Portuguese Language curricula,tasks, evaluation, and workload, reflect this concern asthese subjects are cross-curricular and are used in dailylife. Comparative international evaluations [1] revealed thatPortuguese students did not perform as well as expected,and that they underachieved in mathematics and languageswhen compared to students from other countries in theOECD. In mathematics, results showed that whilst there wasan improvement in mathematics performance by Portuguesestudents from 2003 to 2009, in 2009, on a scale of six levels,Portugal still has in the region of 25% of their students atlevel 2 or below [1].
These results give impetus to the development of furtherresearch that seeks to characterize and understand differentvariables which may influence student performance. Thiswill help to make possible strategies for future action in
schools, families, and communities, in order to bring aboutan improvement in the failure rate in math.
The complexity of factors that can influence mathperformance is demonstrated by Singh, Granville, and Dika[2] when they show that high achievement in mathematics isa function of many interrelated variables related to students,families, and schools. Among student variables, attitudes areregarded by several researchers, as an important/key factorto be taken into account when attempting to understand andexplain variability in student performance in maths [3–6].
Mobilizing a set of different definitions concerningattitudes presented since 1935, Eshun [7, page 2] definesan attitude towards mathematics as “a disposition towardsan aspect of mathematics that has been acquired by anindividual through his or her beliefs and experiences butwhich could be changed.” When emphasizing the importanceof individual experiences, the contexts where students inter-act with others and with mathematics become importantfocal points. Fraser and Kahle [8] have also highlighted thisaspect in research which shows that learning environmentsat home, at school, and within the peer group accounted for

2 Child Development Research
a significant amount of variance in student attitudes and,furthermore, that class ethos had a significant impact on thescores achieved by students for these attitudes.
In addition, Mohamed and Waheed [5] when review-ing literature aimed at understanding attitudes and theinfluences on their development in relation to differencesbetween students, identified three groups of factors that playa vital role in influencing student attitudes: factors associatedwith the students themselves (e.g., mathematical achieve-ment, anxiety, self-efficacy and self-concept, motivation, andexperiences at school); factors associated with the school,teacher, and teaching (e.g., teaching materials, classroommanagement, teacher knowledge, attitudes towards maths,guidance, beliefs); finally factors from the home environmentand society (e.g., educational background, parental expecta-tions).
Attitudes can be seen as more or less positive. A positiveattitude towards mathematics reflects a positive emotionaldisposition in relation to the subject and, in a similar way,a negative attitude towards mathematics relates to a negativeemotional disposition [9]. These emotional dispositions havean impact on an individual’s behavior, as one is likely toachieve better in a subject that one enjoys, has confidence inor finds useful [7]. For this reason positive attitudes towardsmathematics are desirable since they may influence one’swillingness to learn and also the benefits one can derive frommathematics instruction [7].
1.1. Attitudes and School Grades. Nicolaidou and Philip-pou [6] showed that negative attitudes are the result offrequent and repeated failures or problems when dealingwith mathematical tasks and these negative attitudes maybecome relatively permanent. According to these authorswhen children first go to school they usually have positiveattitudes towards mathematics. However, as they progresstheir attitudes become less positive and frequently becomenegative at high school. Kogce et al. [3] found significantdifferences between younger and older students’ attitudestowards mathematics with 8th graders having lower attitudesthan 6th graders.
There are a number of factors which can explain whyattitudes towards mathematics become more negative withthe school grade, such as the pressure to perform well, overdemanding tasks, uninteresting lessons and less than positiveattitudes on the part of teachers [6].
1.2. Gender and Attitudes towards Maths. Gender differencesare a recurrent theme throughout the literature in academicstudies in general and in math studies in particular. Math isoften considered to be a domain in which boys are higherachievers, both in terms of attitudes and self-concept. Con-trary to this, findings show that math school achievementand grades do not differ significantly between boys andgirls (e.g., [10, 11]). This similarity in performance betweenmales and females is clear in the meta-analysis conducted byLindberg et al. [11] with data from 242 studies representing1.286.350 people, indicating no gender differences (d = 0.05)and nearly equal male and female variances.
There are, however, noticeable differences in the beliefsheld by boys and girls. Research has consistently shown thatgirls have lower math self-concept than boys (e.g., [12]).Results concerning gender differences in attitudes are lessconsistent than those in self-concept. Some studies havereported significant differences when we compare girls andboys attitudes towards mathematics [7, 13–15], neverthelessthere are a number of studies where these differences arenot identified [3, 5, 6, 16, 17]. A meta-analysis conductedby Etsey and Snetzler [17] taking into consideration 96studies (n = 30490) concluded that gender differencesin student attitudes toward mathematics do exist but aresmall. The results indicate that males show more positiveattitude. However in elementary school studies the effectsize was about .20 in favor of females and for grades 9 to12 the effect size was similar, .23, but in favor of males.Also Hyde et al. [18] in their meta-analysis confirm smallgender effects, which increase among older students (highschool and college), with females holding more negativeattitudes. Although these meta-analyses were developed inthe 1990s, there is recent research which confirms theseresults [13, 14] and attempts to provide a justificationfor it. Asante [13] states that, when compared with boys,“girls lacked confidence, had debilitating causal attributionpatterns, perceived mathematics as a male domain, andwere anxious about mathematics” [13, page 2]. The researchcarried out by this author in Ghana, showed that boyshad more positive attitudes towards mathematics than girls.Also Sanchez et al. [14] in a study with North Americanstudents found significant gender differences in eighth gradestudents’ attitudes towards math. American boys showedmore interest in math than girls, but girls perceived math asmore important than boys. Girls also presented higher scoreson items with regard to difficulties with math. According toAsante [13] school environment, developmental changes ingender identity, and teacher and parent attitudes and beliefstowards mathematics are factors that may contribute to thedifferences identified between boys and girls in their attitudestowards mathematics.
Nonetheless there is research which concludes thatgender does not affect attitudes towards mathematics [3,5, 6, 15, 16]. The meta-analysis conducted by Ma andKishor [15] which looks at 113 studies (n = 55265),when studying the effects of gender, concludes that thisvariable did not have a significant effect on the relationshipsbetween attitudes and performance in mathematics becauseseparate analysis by gender demonstrated similar significanteffect sizes. Georgiou et al. [16] showed that there was nodifference either in math achievement or in math attitudesbetween boys and girls. However, high achieving boys andgirls, despite both considering math as an attractive subject,differed in the explanations they gave for their performance.Since the ability attributions of boys were higher, theybelieved that their grades were due to their intelligence moreconsistently than girls did.
1.3. Achievement in Mathematics and Attitudes. Severalstudies have been undertaken to try to reach an understand-ing of the relationship between student attitudes towards

Child Development Research 3
mathematics and academic achievement [4–6, 8, 15, 19]. InMa and Kishor meta-analysis [15] only weak correlationsbetween these variables were identified and these rela-tionships were dependent on several variables (e.g., grade,sample size, ethnic background). With regard to grade, theseassociations become stronger among older students (7th to12th grade).
However, more recent studies point to a positive correla-tion between student attitudes towards mathematics and stu-dent academic achievement. Along these lines are the resultsobtained by Nicolaidou and Philippou [6] which revealsignificant correlations between attitudes and performance.Students having positive attitudes achieved better. Mato andDe La Torre [4] in a study with secondary school studentsalso showed that those with better academic performancehave more positive attitudes regarding math than those withpoorer academic performance. These results were confirmedin wider research, concerning math study attitudes amongthe secondary school students of nine countries, developedby Sanchez et al. [14].
Lipnevich et al. [20] in a study developed with USAand BieloRussian middle school students highlighted theimportance of attitudes in predicting academic achievement,when it showed that mathematics attitudes explained avariance of 25% to 32% in mathematics achievement, withmuch of the explained variance independent of ability inmath.
Nevertheless, Georgiou et al. [16] showed that highachievement could serve to predict a positive attitudetowards math, but such an attitude could not predictstronger achievement. However, these authors emphasize therole of teachers and schools in changing attitudes statingthat, math achievement could be improved by, for example,better teaching methods, more motivated teachers or bettercourse books, which has as its corollary the improvement ofattitudes towards math.
1.4. Mathematics Learning Environments and Attitudes.Akey’s [21] work showed that several aspects of schoolcontext (e.g., teacher support, student-to-student interac-tion, and the academic and behavior expectations of theteacher) were significantly related to student attitudes andbehaviors. Akey [21] concluded that the class environmentwhere teachers who students see as supportive promotestudent feelings of control and confidence in their abilityto succeed. The way students perceive teacher characteristicswill affect their attitudes towards mathematics [22]. Maatand Zakaria and Vaughan [22, 23] identified a significantrelationship between learning environment and attitudetowards mathematics. Students with a higher perception ofthe learning environment and a more positive perceptionof their teachers have more positive attitudes towardsmathematics [22]. Rawnsley and Fisher [24] also found thatstudents had more positive attitudes toward mathematicswhen their teacher was perceived to be highly supportive.
1.5. Motivation and Attitudes. A number of authors haveshown that the relationship between aspects of the social
environment and student emotional aspects may be medi-ated by other variables such as control-related appraisals andvalues-related appraisals [25, 26]. Therefore, competencesupport, autonomy support, expectations, and feedbackthat students receive from others have an impact on theircognitive appraisals and these are the main sources of theiremotional dispositions. When studying attitudes, it is impor-tant to take into consideration the role of these mediatedvariables where we can include the motivation features ofeach student. In this sense, Wigfield [27], in reading specificdomain, maintains that attitudes, realized as the individual’sfeelings towards reading, could be related to the motivationof the individual concerned because they influence howmuch individuals involve themselves in reading activities.Attitudes are affective responses that accompany a behaviorinitiated by a motivational state [28]. Attitudes can thereforebe linked directly to motivation and provide key informationto a better understanding of attitudinal and motivationalprocesses. In the domain of maths there is little research thatstudies the relationships between motivation and attitudes.However, a number of studies have highlighted some specificassociations. Singh et al. [2] used two sets of items to tapmotivation, one related to attendance of school and classesand another to participation and preparedness for mathclasses. The authors concluded that mathematics attitudewas affected by motivational factors since significant directeffects of .19 and .21, of these two motivation componentswere identified in student attitudes. Students who displayedschool behavior associated with low motivation (e.g., cominglate to school, skipping classes, coming unprepared withoutbooks and homework) had a more negative attitude towardmathematics. Other authors have taken into considerationEffort as an indicator of motivation [29, 30]. Reynolds andWalberg [30] using structural equation modeling to analyzediverse factors effects on math’s performance and attitudeswith 11th grade students, identify a significant effect onmotivation in math attitudes. Hemmings and Kay [29] in astudy with 10th grade students also verified that Effort waspositively and significantly related to math attitudes.
1.6. Objectives. This study has two main objectives: firstly,to analyze the effects on math attitudes of factors usuallyanalyzed in the literature (gender, grade, and achievement)among Portuguese school students; secondly, to analyze theeffect on attitudes in this group of other factors that havebeen less well researched, associated with learning environ-ment (e.g., perceived math’s teacher and peers’ support) andwith the motivational characteristics of students.
2. Method
2.1. Participants. 1719 fifth-to-twelfth grade Portuguese stu-dents from different schools in Lisbon and the surroundingarea participated in the study. They were from a wide rangeof social and economic backgrounds. There were 869 boysand 850 girls. In Portugal, school grades are organized in fourcycles: 1st Cycle (1st to 4th grade), 2nd Cycle (5th and 6thgrades), 3rd Cycle (7th to 9th grade), and Secondary (10th

4 Child Development Research
Table 1: Distribution of participants by study cycle.
Level n %
2nd Cycle (5th and 6th grades) 451 26.2
3rd Cycle (7th, 8th, and 9th grades) 847 49.3
Secondary (10th, 11th, and 12th grades) 421 24.5
to 12th grade). In this research participants were from the2nd and 3rd Cycles and Secondary. The student distributionaccording to study cycle is presented in Table 1.
In terms of achievement at mathematics, Portuguesestudents from the 2th and 3rd Cycles have been evaluatedon a five point scale, where 1 and 2 are negative marks,3 is medium, and 4 and 5 are good or very good marks.Secondary students are assessed on a scale ranging from 0to 20 that we converted into a 5-point scale similar to thoseof other cycles. Based on a mean of the two last mathematicsevaluations, students in this research were organized in threedifferent achievement groups: Low—with marks lower than3 (27.4%), Medium—with marks of 3 or 3,5 (30.1%), andGood—whose marks ranging from 4 to 5 (42.5%)
2.2. Procedure. Data used in this study was collected atschool. Letters describing the study were sent to parents whogave their written consent to the head teacher.
Questionnaires were administered in the classroomunder the supervision of a member of our research team.Questionnaires were read aloud for younger students when-ever it was thought necessary.
2.3. Instruments. The motivation towards math was mea-sured through a version of IMI Intrinsic Motivation Inven-tory, directed towards Mathematics, taking into consider-ation three dimensions: Perceived Competence, PerceivedChoice, and Value/Utility [31]. This instrument is conceptu-alized to take into consideration the main constructs of theSelf-Determination Theory (SDT) [32, 33]. Therefore, thePerceived Choice and Perceived Competence are theorized aspositive predictors of intrinsic motivation and are related tothe SDT innate psychological needs of autonomy and com-petence [34]. The Value/Usefulness subscale embodies theidea that people internalize and develop more self-regulatoryactivities when experience is considered as valuable anduseful for them [34].
The questionnaire comprised 14 items, distributedover three dimensions: Perceived Competence—four items(e.g., “I think I am pretty good at Math’s activities”);Value/Utility—five items (e.g., “Math’s activities are valuableto me”); Perceived Choice—five items (e.g., “I only do theMath’s tasks because the teacher orders me to”). All itemswere scored on a 6-point scale ranging from 1(“Never”) to6 (“Always”). Items from the Perceived Choice dimensionwere reversed due to their negative formulation. In thisinstrument higher scores are related to intrinsic motivationcharacteristics.
In order to verify the adequacy of item inclusion in thecorrespondent dimension, reliability has been analyzed using
Cronbach’s Alpha. Reliability scores for our sample in thethree subscales can be considered adequate as Cronbach’sAlpha values were .80 for Perceived Competence, .84 forPerceived Choice, and .93 for Value/Utility [35].
Student perceptions of classroom support (teacher andstudents support) and attitudes towards mathematics weremeasured by 16 items extracted from the classroom climatescale “In my Math class” [36]. Teacher Social Support (TSS)is a six item dimension looking at the extent to whichstudents feel that their math teacher supports them (e.g.,“My math teacher cares about how much I learn”). StudentsSocial Support (SSS) is an index calculated through fiveitems related to how classmates care and support them(e.g., “In math class students want me to do my best inmath work”). Based on the conceptualization of attitudes aspositive or negative affect associated with a certain subject[9], in this research Student Attitudes towards math is afive item index relating to how students feel in math classand when performing math school tasks (e.g., “When theteacher questions me about math I feel good”). All itemswere scored on a 6-point scale ranging from 1 (“Never”) to 6(“Always”).
Reliability coefficients were .81 for SSS, .95 for TSS and.84 for Attitudes.
3. Results
The results presented focus on two main vectors. Firstlythe descriptive statistics of participants’ attitudes, motivationand perceived social support towards mathematics, andalso their differences considering gender, grade, and mathperformance were analyzed. Secondly a hierarchical analysisusing structural equation modeling, utilizing three blocks ofvariables, was carried out. These blocks were background,motivation, and support-related variables.
Descriptive statistics of students’ perceived social sup-port, motivations, and attitudes toward mathematics arepresented in Table 2 in relation to gender, grades, andmath performance. Attitude scores vary between 3.37 and4.11 when different groups organized according to gender,cycle and math performance are considered. These resultsare above the middle point of the scale, which show that,overall, those students present positive attitudes towardsmathematics.
When considering motivation dimensions we can seethat scores are near the midpoint of the scale, and somedifferences are introduced when considering gender, studycycle, and achievement. These scores show that younger stu-dents (2nd Cycle) present higher motivational scores whencompared with their older colleagues. The same pattern ispresented with achievement, since students with low markspresent lower scores in all dimensions when compared tomedium and good achievers, and good achievers have thehighest scores.
With regard to social support, the results are almostsimilar across gender. In looking at grade and achievementone can see that younger students perceived greater supportfrom their math teachers. Better achievers also seem to feel
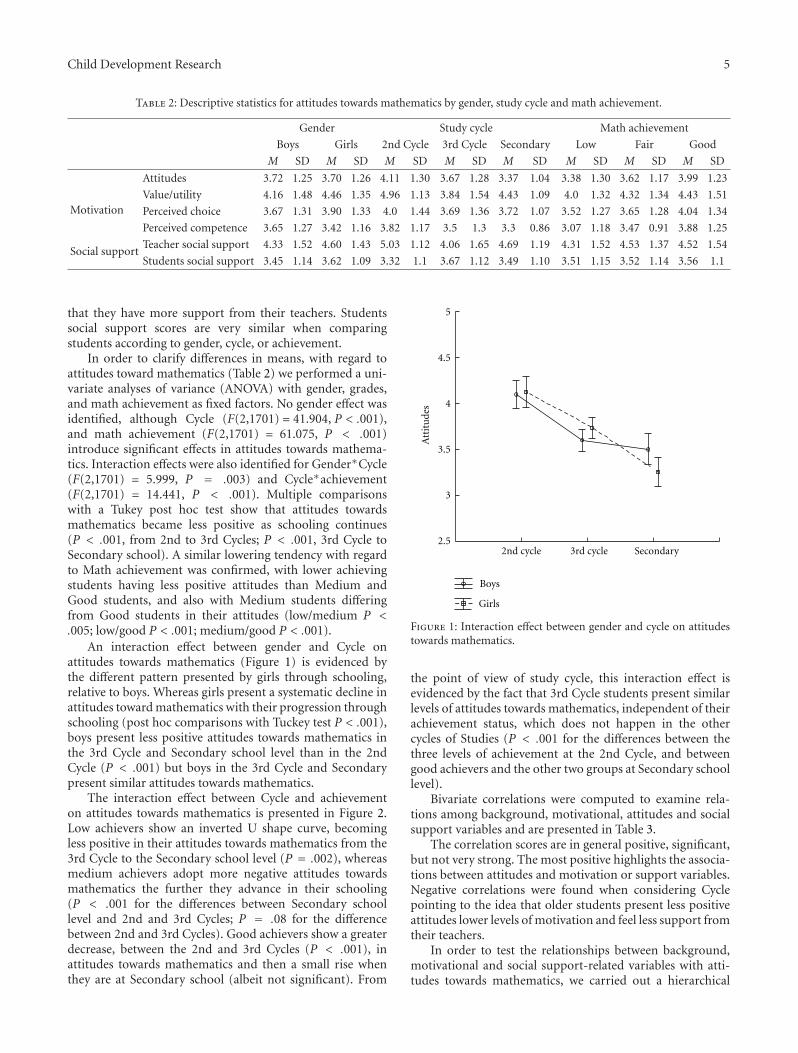
Child Development Research 5
Table 2: Descriptive statistics for attitudes towards mathematics by gender, study cycle and math achievement.
Gender Study cycle Math achievement
Boys Girls 2nd Cycle 3rd Cycle Secondary Low Fair Good
M SD M SD M SD M SD M SD M SD M SD M SD
Attitudes 3.72 1.25 3.70 1.26 4.11 1.30 3.67 1.28 3.37 1.04 3.38 1.30 3.62 1.17 3.99 1.23
MotivationValue/utility 4.16 1.48 4.46 1.35 4.96 1.13 3.84 1.54 4.43 1.09 4.0 1.32 4.32 1.34 4.43 1.51
Perceived choice 3.67 1.31 3.90 1.33 4.0 1.44 3.69 1.36 3.72 1.07 3.52 1.27 3.65 1.28 4.04 1.34
Perceived competence 3.65 1.27 3.42 1.16 3.82 1.17 3.5 1.3 3.3 0.86 3.07 1.18 3.47 0.91 3.88 1.25
Social supportTeacher social support 4.33 1.52 4.60 1.43 5.03 1.12 4.06 1.65 4.69 1.19 4.31 1.52 4.53 1.37 4.52 1.54
Students social support 3.45 1.14 3.62 1.09 3.32 1.1 3.67 1.12 3.49 1.10 3.51 1.15 3.52 1.14 3.56 1.1
that they have more support from their teachers. Studentssocial support scores are very similar when comparingstudents according to gender, cycle, or achievement.
In order to clarify differences in means, with regard toattitudes toward mathematics (Table 2) we performed a uni-variate analyses of variance (ANOVA) with gender, grades,and math achievement as fixed factors. No gender effect wasidentified, although Cycle (F(2,1701) = 41.904, P < .001),and math achievement (F(2,1701) = 61.075, P < .001)introduce significant effects in attitudes towards mathema-tics. Interaction effects were also identified for Gender∗Cycle(F(2,1701) = 5.999, P = .003) and Cycle∗achievement(F(2,1701) = 14.441, P < .001). Multiple comparisonswith a Tukey post hoc test show that attitudes towardsmathematics became less positive as schooling continues(P < .001, from 2nd to 3rd Cycles; P < .001, 3rd Cycle toSecondary school). A similar lowering tendency with regardto Math achievement was confirmed, with lower achievingstudents having less positive attitudes than Medium andGood students, and also with Medium students differingfrom Good students in their attitudes (low/medium P <.005; low/good P < .001; medium/good P < .001).
An interaction effect between gender and Cycle onattitudes towards mathematics (Figure 1) is evidenced bythe different pattern presented by girls through schooling,relative to boys. Whereas girls present a systematic decline inattitudes toward mathematics with their progression throughschooling (post hoc comparisons with Tuckey test P < .001),boys present less positive attitudes towards mathematics inthe 3rd Cycle and Secondary school level than in the 2ndCycle (P < .001) but boys in the 3rd Cycle and Secondarypresent similar attitudes towards mathematics.
The interaction effect between Cycle and achievementon attitudes towards mathematics is presented in Figure 2.Low achievers show an inverted U shape curve, becomingless positive in their attitudes towards mathematics from the3rd Cycle to the Secondary school level (P = .002), whereasmedium achievers adopt more negative attitudes towardsmathematics the further they advance in their schooling(P < .001 for the differences between Secondary schoollevel and 2nd and 3rd Cycles; P = .08 for the differencebetween 2nd and 3rd Cycles). Good achievers show a greaterdecrease, between the 2nd and 3rd Cycles (P < .001), inattitudes towards mathematics and then a small rise whenthey are at Secondary school (albeit not significant). From
5
4.5
4
3.5
3
2.52nd cycle 3rd cycle Secondary
Boys
Girls
Att
itu
des
Figure 1: Interaction effect between gender and cycle on attitudestowards mathematics.
the point of view of study cycle, this interaction effect isevidenced by the fact that 3rd Cycle students present similarlevels of attitudes towards mathematics, independent of theirachievement status, which does not happen in the othercycles of Studies (P < .001 for the differences between thethree levels of achievement at the 2nd Cycle, and betweengood achievers and the other two groups at Secondary schoollevel).
Bivariate correlations were computed to examine rela-tions among background, motivational, attitudes and socialsupport variables and are presented in Table 3.
The correlation scores are in general positive, significant,but not very strong. The most positive highlights the associa-tions between attitudes and motivation or support variables.Negative correlations were found when considering Cyclepointing to the idea that older students present less positiveattitudes lower levels of motivation and feel less support fromtheir teachers.
In order to test the relationships between background,motivational and social support-related variables with atti-tudes towards mathematics, we carried out a hierarchical

6 Child Development Research
Table 3: Correlations between study variables.
GenderMath
achievementCycle
Value/Utility
PerceivedChoice
PerceivedCompetence
Teacher socialsupport
Students socialsupport
Gender —
Math achievement .028 —
Cycle .055∗ .013 —
Value/utility .086∗∗ .116∗∗ −.140∗∗ —
Perceived choice .087∗∗ .178∗∗ −.079∗∗ .453∗∗ —
Perceived competence −.096∗∗ .289∗∗ −.157∗∗ .431∗∗ .326∗∗ —
Teacher social support .090∗∗ .040 −.087∗∗ .706∗∗ .319∗∗ .257∗∗ —
Students social support .076∗∗ .020 .055∗ .228∗∗ .127∗∗ .121∗∗ .287∗∗ —
Attitudes −.007 .212∗∗ −.209∗∗ .549∗∗ .562∗∗ .529∗∗ .494∗∗ .299∗∗∗
Correlation is significant at the 0.05 level; ∗∗correlation is significant at the 0.01 level.Gender codification: (1) boys; (2) girls.
5
4.5
5.5
4
3.5
3
2.52nd cycle 3rd cycle Secondary
Att
itu
des
Math achievement
Low
Medium
Good
Figure 2: Interaction effect between math achievement and cycleon attitudes towards mathematics.
analysis using structural equation modeling with Amos 20.0.In this analysis, we have taken three blocks of variables intoconsideration (Table 4). The first block, named backgroundvariables, includes gender, grade, and performance in math-ematics; the second block includes mathematics motivationdimensions and the third block looks at social supportvariables. Because all the variables in the second and thirdblock are self-reported, potentially introducing bias withspurious relations, the recommendations of Podsakoff etal. [37] were followed in the treatment. Thus, in order tocontrol for method bias due to the fact that all measuresare self-reported, in models 2 and 3 we added a common
latent factor with all the items of all measures loading inthis factor. In the three models tested we only considered therelationships between each variable and attitudes, discardingother possible relationships among them. All the modelstested presented acceptable fit (Model 1: AGFI −.98, CFI−.96, TLI −.94, RMSEA −.06; Model 2: GFI −.92, CFI −.92,TLI −.89, RMSEA −.076; Model 3: GFI −.91, CFI −.93, TLI−.92, RMSEA −.06).
In all models the three blocks of variables (background,motivation, and social support) are significant contribu-tors to Attitudes. Background variables explained 8.9% ofthe variance and Math Motivation variables explained afurther 31.3%. When adding Support variables (teacherand students) the model gains a further 24.1% in thevariance explained. Therefore the total amount of variationin Attitudes explained by all the variables included in the finalmodel is 64.3%. We can also verify in Model 3 that amongBackground variables only Cycle has a significant effect onAttitudes (β = −.055 P < .001). Among motivationalvariables Perceived Choice and Perceived Competence relatesignificantly to attitudes (β = .451 and β = .495 resp.),whereas both dimensions of social support are positivelyrelated to attitudes towards Maths. The contribution of bothis also significant for this model (P < .001), with a highercontribution of the perception of teacher social support(β = .307), when compared with the perception of supportprovided by peers (β = .246).
4. Discussion
This paper first sought to characterize attitudes towardsmathematics in students from 5th to 12th grade and toanalyze the effects of gender, cycle, and math performance onthese attitudes. Results showed that, in general, the studentshad positive attitudes towards mathematics, although scoreswere not very high and distributed mostly around themidpoint. Despite this overall positive attitude towardsmathematics the scenario changes when we consider Cycle.Cycle effects are significant and mean that during schooling,attitudes towards mathematics become less positive. Infact, students in the 2nd Cycle present attitudes towards

Child Development Research 7
Table 4: Parameter estimates and associated standard errors hierarchical analysis on attitudes towards mathematics.
Model 1 Model 2 Model 3
Background Background and motivation Full model
SE β SE β SE β
Gender .059 −.011 .045 −.017 .041 −.036
Cycle .042 −.227∗∗ .032 −.146∗∗ .029 −.176∗∗
Math achievement .034 .194∗∗ .026 .015 .024 .022
Value .032 .029 .094 .087
Perceived Choice .029 .452∗∗ .029 .451∗∗
Perceived Competence .035 .420∗∗ .029 .495∗∗
Teacher social support .039 .307∗∗
Students social support .031 .246∗∗
R2 .089 .402 .643
ΔR2(from previous model) .313∗∗ .241∗∗∗P < 0.01, ∗∗P < 0.001.
mathematics which are clearly positive, whereas students inSecondary school exhibit values below the midpoint of thescale. Considering that attitudes towards learning can berelated to motivation [38] the decrease in attitudes towardsmathematics can be associated with the overall decreasein intrinsic motivation, competence-related beliefs, interestand task values that occur during adolescence [39–41].This decline is experienced in math in particular [41–43].Motivation theorists have argued that during adolescenceinterests are directed towards other fields of experience whichcould explain the fall in school-related attitudes and interest.An additional explanation is related to the organization ofthe math curriculum which becomes more demanding asstudents move through grade levels, requiring increasinglyabstract levels of understanding [44]. However, challenge isalso an important feature of motivation [45] inasmuch asthe challenge is not that great that it would be experienced asoverwhelming, leading to feelings of helplessness. Interactioneffects between Cycle and Math Achievement seem toprovide some support to this explanation. Medium achieversshow a gradual decrease in attitudes towards mathematicsacross the school years whereas low achievers present aslight increase from 2nd to 3rd Cycles and a decline in thetransition from 3rd Cycle to Secondary school. An inversepattern is presented by good achievers. The differences inthe pattern of good and low achievers seems to support thehypothesis of differences in the way the challenges set bymath learning are experienced by students belonging to dif-ferent achievement groups. For good achievers mathematicaltasks are likely faced as real challenges which could increaseintrinsic motivation, raising the sense of competence whenthe tasks are solved, and leading to the development ofpositive attitudes towards math. Conversely, for low achieversmath tasks are likely experienced as unsurpassable obstaclesthat will be won infrequently, producing low self-belief incompetence and negative attitudes towards mathematics.
Gender-related attitudes towards mathematics seem tobe identical. This finding corroborates the results of otherresearch that claims that boys and girls present very similarattitudes towards mathematics [3, 5, 6, 15, 16]. However,
results also show an interaction effect between gender andstudy cycle that results in a systematic decline in attitudestowards mathematics along schooling. This counteracts thepattern presented by boys which showed a decrease in theirattitudes from the 2nd to the 3rd Cycles but which thenstabilized. This progressive decline in attitudes by girls canbe explained with reference to gender stereotypes [46].Traditionally math is viewed as a male-dominated domainwhich is evident in career choices and jobs [47]. Studiesin stereotyping and development in adolescence supportthe idea of gender intensification during middle and lateadolescence accompanied by less flexibility to stereotyping[46]. This leads to the assumption of roles according togender, assuming gender-type interests which could explainthe less positive attitudes towards mathematics exhibited bygirls at Secondary school.
Our findings concerning the relationship between mathachievement and attitudes towards mathematics are consis-tent with research showing that good achievers develop morepositive attitudes than lower achievers [2, 4, 14, 16, 20].Achievement is usually related to self-belief in competence[41, 48] and self-belief in competence can be related toattitudes towards math [38], which suggests that whenstudents succeed at a math task, it increases their sense ofcompetence and this may promote more positive attitudes.
The hierarchical analysis using structural equation mod-eling extends the findings of this study. The first model testedaccounts for less than 9% of variance in attitudes, showingthat the effects of Gender, Cycle and Math Achievement arerelatively small. Moreover, the contribution of Cycle andachievement for attitudes towards mathematics diminishedwhen psychological variables of students were added. Infact, motivational variables increase the amount of varianceexplained in attitudes, showing a close relationship betweenkey features of intrinsic motivation and attitudes towardsmathematics. Authors involved in intrinsic motivationresearch have shown that students learn more effectivelywhen they are interested and when they enjoy what they arelearning [6, 32]. According to these authors students who feelcompetent and self-determinate in an ongoing, continuous

8 Child Development Research
way, increase their intrinsic motivation. Likewise, positiveattitudes towards mathematics may also increase since theyhave been conceived as positive or negative emotional dispo-sitions toward a subject and positive emotion is, in general,perceived as pleasurable [9]. Our findings support these ideasrevealing that the positive predictors of intrinsic motivation(Perceived Competence and Perceived Choice) and are morestrongly related to attitudes towards mathematics. Addinglearning environment-related variables to the model alsoproduces an increase in the explanation of the variability ofattitudes.
Among the variables considered (teacher support andpeer support), teacher support shows closer relationshipsto attitudes. In the final model, this is the third strongestrelationship which shows the importance of teachers in thedevelopment of positive attitudes towards math.
Despite the importance of teacher support as a significantpredictor of attitudes, we cannot neglect the effect of peersupport identified in our data and in research by Fraser andKahle [8]. However, the improvement in attitudes is likely tobe more significant when taking into consideration differentenvironments, but the main contribution is determined inthe class environment. Research on this topic has shown thatteacher support with regard to autonomy affected studentmotivation, among other aspects, [49, 50] and that differentpedagogical goals also explained variations in student mathmotivation [51]. Taken together, these findings highlightthe role of the teacher in supporting student learning, atti-tudes and even motivation and have some implications foreducation and instructional practices. As Aunola et al. [51]have shown, teacher goals may influence child motivationand attitudes not only through their instructional practicesand the tasks they propose to students, but also throughthe messages they send out about learning in general. Inthis sense if teachers create situations that promote pleasure,are seen as self-determinate and students feel competent;intrinsic motivation can increase [32, 33], and this mayalso promote positive attitudes towards mathematics. Ateacher who is supportive to students [52], who shapesstudent expectations about learning in a positive way [53],who sets meaningful tasks which are somewhat, but notexcessively challenging [54, 55], and promotes cooperativelearning environments [23, 56] will probably stimulateintrinsic motivation in their students and, as a corollary,may contribute to the development of more positive attitudestowards math.
The results presented here suggest strong relationshipsbetween motivation and support related variables withattitudes. However, the cross-sectional natures of the designused do not allow us to infer causal relationships betweenthe variables. Therefore, for the interpretation of the resultswe cannot say that motivational and social context factorsinfluence student’s attitudes, although we cannot rule outthat variables closely related to motivation and social supportin the classroom have a significant relationship to attitudes.The use of multiple assessments over time could providea clearer view of the causal relations between variables.Furthermore, a longitudinal design could help us to achievea better understanding not only of the changes in time, but
also of the development of attitudes toward mathematics andthe effects of other variables such as background, motivation,and social support. Likewise, the use of a small groupstudy and the monitoring of the group including multipleassessments over time, also using qualitative data, couldprovide a deeper comprehension of the heterogeneity ofattitudes among subjects and allows for the researcher to takeinto account the effects of aging on the group. As suggestedby Hannula [57] qualitative data collected from observations,interviews, and case studies can be useful in studyingattitudes more accurately and to recognize possible factorsbehind the characteristics of attitudes and any changes thattake place.
Another limitation of this study is the fact that only self-report measures were used. It is possible to reduce the biasintroduced by single-source data using appropriate statisticalprocedures [37] as we have done in this research. Although,a worthwhile addition to a future study to overcome thisproblem would be to incorporate more than one data source,namely, data collected through classroom observations andteacher-reports.
A good deal of research has been conducted on attitudestowards mathematics, but most of the analyses used havefocused on how specific variables influence or are related toattitudes, considering these variables in an isolated way. Inorder to have a more complex perspective towards this topic,the present research has attempted to examine the combinedeffects of the individual, social contextual, and motivationalvariables on attitudes toward mathematics. The results of theintegration of data provide a more in-depth understandingof the different variables which allow for the explorationof different routes in promoting positive attitudes towardmathematics. On the other hand, researches concerningthe relationship between motivation, social support fromteachers and peers, and attitudes are scarce. In this regard,our data emphasizes the importance of these variables whentrying to understand attitudes toward mathematics.
Lack of student motivation and engagement in academicwork is an issue of concern amongst teachers. Since ourfindings confirm that attitudes are deeply related to motiva-tion and social support, we believe that developing strategiesin educational contexts, to improve teacher support andstudent engagement could be of vital importance in impro-ving not only attitudes but also mathematical performanceamong students throughout their schooling.
Acknowledgment
This research was supported by Grants from the Science andTechnology Foundation (POCI 2010).
References
[1] A. Serrao, C. Ferreira, and H. Diniz de Sousa, PISA 2009:Competencias dos alunos portugueses: Sıntese de resultados,GAVE, Ministry of Education, Lisbon, Portugal, 2010.
[2] K. Singh, M. Granville, and S. Dika, “Mathematics and scienceachievement: effects of motivation, interest, and academicengagement,” Journal of Educational Research, vol. 95, no. 6,pp. 323–332, 2002.

Child Development Research 9
[3] D. Kogce, C. Yıldız, M. Aydın, and R. Altındag, “Examiningelementary school students’ attitudes towards mathematics interms of some variables,” Procedia, vol. 1, no. 1, pp. 291–295,2009.
[4] M. Mato and E. De la Torre, “Evaluacion de las actitudes hacialas matematicas y el rendimiento academico,” PNA, vol. 5, no.1, pp. 197–208, 2010.
[5] L. Mohamed and H. Waheed, “Secondary students’ attitudetowards mathematics in a selected school of Maldives,”International Journal of Humanities and Social Science, vol. 1,no. 15, pp. 277–281, 2011.
[6] M. Nicolaidou and G. Philippou, “Attitudes towards math-ematics, self-efficacy and achievement in problem solving,”in European Research in Mathematics Education III, M. A.Mariotti, Ed., pp. 1–11, University of Pisa, Pisa, Italy, 2003.
[7] B. Eshun, “Sex-differences in attitude of students towardsMathematics in secondary schools,” Mathematics Connection,vol. 4, pp. 1–13, 2004.
[8] B. J. Fraser and J. B. Kahle, “Classroom, home and peerenvironment influences on student outcomes in science andmathematics: an analysis of systemic reform data,” Interna-tional Journal of Science Education, vol. 29, no. 15, pp. 1891–1909, 2007.
[9] R. Zan and P. Martino, “Attitude toward mathematics:overcoming the positive/negative dichotomy,” in Beliefs andMathematics, B. Sriraman, Ed., The Montana MathematicsEnthusiast: Monograph Series in Mathematics Education, pp.197–214, Age Publishing & The Montana Council of Teachersof Mathematics, Charlotte, NC, USA, 2008.
[10] T. Scafidi and K. Bui, “Gender similarities in math perfor-mance from middle school through high school,” Journal ofInstructional Psychology, vol. 37, no. 3, pp. 252–255, 2010.
[11] S. M. Lindberg, J. S. Hyde, J. L. Petersen, and M. C. Linn,“New trends in gender and mathematics performance: a meta-analysis,” Psychological Bulletin, vol. 136, no. 6, pp. 1123–1135,2010.
[12] S. Skaalvik and E. M. Skaalvik, “Gender differences inmath and verbal self-concept, performance expectations, andmotivation,” Sex Roles, vol. 50, no. 3-4, pp. 241–251, 2004.
[13] K. Asante, “Secondary students’ attitudes towards mathemat-ics,” IFE PsychologIA, vol. 20, no. 1, pp. 121–133, 2012.
[14] K. Sanchez, L. Zimmerman, and R. Ye, “Secondary students’attitudes toward mathematics,” Academic Exchange Quarterly,vol. 8, no. 2, pp. 56–60, 2004.
[15] X. Ma and N. Kishor, “Assessing the relationship between atti-tude toward mathematics and achievement in mathematics: ameta-analysis,” Journal for Research in Mathematics Education,vol. 28, no. 1, pp. 26–47, 1997.
[16] S. Georgiou, P. Stavrinides, and T. Kalavana, “Is Victor betterthan Victoria at maths?” Educational Psychology in Practice,vol. 23, no. 4, pp. 329–342, 2007.
[17] Y. Etsey and S. Snetzler, “A Meta-analysis of gender differencesin student attitudes toward mathematics,” in Proceedings ofthe Annual Meeting of the American Educational ResearchAssociation, 1998.
[18] J. Hyde, E. Fennema, M. Ryan, L. Frost, and C. Hopp, “Gendercomparisons of mathematics attitudes and affect—A meta-analysis,” Psychology of Woman Quarterly, vol. 14, no. 3, pp.299–324, 1990.
[19] H. Schofield, “Sex, grade, level, and relationships betweenmathematics attitude and achievement in children,” Journal ofEducational Research, vol. 75, no. 5, pp. 280–284, 1982.
[20] A. A. Lipnevich, C. MacCann, S. Krumm, J. Burrus, and R. D.Roberts, “Mathematics attitudes and mathematics outcomes
of US and Belarusian middle school students,” Journal ofEducational Psychology, vol. 103, no. 1, pp. 105–118, 2011.
[21] T. Akey, “School context, students attitudes and behavior andacademic achievement: an exploratory analysis,” Tech. Rep.,MDRC, 2006.
[22] S. Maat and E. Zakaria, “The learning environment, teacher’sfactor and students attitudes towards mathematics amongstengineering technology students,” International Journal ofAcademic Research, vol. 2, no. 2, pp. 16–20, 2010.
[23] W. Vaughan, “Effects of cooperative learning on achievementand attitude among students of color,” Journal of EducationalResearch, vol. 95, no. 6, pp. 359–364, 2002.
[24] D. Rawnsley and D. Fisher, “Learning environments inmathematics classrooms and their associations with students’attitudes and learning,” in Proceedings of the AustralianAssociation for Research in Education Conference, Adelaide,Australia, 1998.
[25] R. Pekrun, T. Goetz, W. Titz, and R. P. Perry, “Academic emo-tions in students’ self-regulated learning and achievement: aprogram of qualitative and quantitative research,” EducationalPsychologist, vol. 37, no. 2, pp. 91–105, 2002.
[26] T. Goetz, R. Pekrun, N. Hall, and L. Haag, “Academicemotions from a social-cognitive perspective: antecedents anddomain specificity of students’ affect in the context of Latininstruction,” British Journal of Educational Psychology, vol. 76,no. 2, pp. 289–308, 2006.
[27] A. Wigfield, “Reading motivation: a domain-specific approachto motivation,” Educational Psychologist, vol. 32, no. 2, pp. 59–68, 1997.
[28] J. Guthrie and K. Knowles, “Promoting reading motivation,”in Literacy and Motivation. Reading Engagement in Individualsand Groups, L. Verhoven and C. Snow, Eds., LawrenceErlbaum Associates, Hillsdale, NJ, USA, 2001.
[29] B. Hemmings and R. Kay, “Prior achievement, effort, andmathematics attitude as predictors of current achievement,”Australian Educational Researcher, vol. 37, no. 2, pp. 41–58,2010.
[30] A. Reynolds and H. Walberg, “A structural model ofhigh school mathematics outcomes,” Journal of EducationalResearch, vol. 85, no. 3, pp. 150–158, 1992.
[31] L. Mata, V. Monteiro, and F. Peixoto, “Intrinsic MotivationInventory: psychometric properties in its application in thecontext of learning Portuguese and Mathematics,” In press.
[32] E. L. Deci and R. M. Ryan, “The “what” and “why” ofgoal pursuits: human needs and the self-determination ofbehavior,” Psychological Inquiry, vol. 11, no. 4, pp. 227–268,2000.
[33] E. Deci and R. Ryan, Intrinsic Motivation and Self-Determin-ation in Human Behavior, Plenum, New York, NY, USA, 1985.
[34] SDT (n.d), http://www.psych.rochester.edu/SDT/measures/IMI description.php.
[35] J. C. Nunnaly, Psychometric Theory, McGraw-Hill, New York,NY, USA, 1978.
[36] L. Mata, V. Monteiro, and F. Peixoto, “Escala de clima de salade aula,” in Avaliacao psicologica: Instrumentos validados paraa populacao portuguesa, C. Machado, M. M. Goncalves, M. R.Simoes, and L. S. Almeida, Eds., vol. 4, Almedina, Coimbra,Portugal.
[37] P. M. Podsakoff, S. B. MacKenzie, J. Y. Lee, and N. P. Podsakoff,“Common method biases in behavioral research: a criticalreview of the literature and recommended remedies,” Journalof Applied Psychology, vol. 88, no. 5, pp. 879–903, 2003.
[38] J. Green, G. Liem, A. Martin, S. Colmar, H. Marsh, and D.McInerney, “Academic motivation, self-concept, engagement,

10 Child Development Research
and performance in high school: key processes from alongitudinal perspective,” Journal of Adolescence, vol. 35, no.5, pp. 1111–1122, 2012.
[39] M. Covington and E. Dray, “The developmental course ofachievement motivation: a need-based approach,” in Develop-ment of Achievement Motivation, A. Wigfield and J. S. Eccles,Eds., pp. 33–56, Academic Press, San Diego, Calif, USA, 2002.
[40] J. E. Jacobs, S. Lanza, D. W. Osgood, J. S. Eccles, and A.Wigfield, “Changes in children’s self-competence and values:gender and domain differences across grades one throughtwelve,” Child Development, vol. 73, no. 2, pp. 509–527, 2002.
[41] A. Wigfield, J. Eccles, U. Schiefele, R. Roeser, and P. Davis-Kean, “Development of achievement motivation,” in Hand-book of Child Psychology, N. Eisenberg, W. Damon, R. M.Lerner, N. Eisenberg, W. Damon, and R. M. Lerner, Eds., vol.3 of Social, Emotional, and Personality Development, pp. 933–1002, John Wiley & Sons, Hoboken, NJ, USA, 6th edition,2006.
[42] J. A. Fredricks and J. S. Eccles, “Children’s competence andvalue beliefs from childhood through adolescence: growthtrajectories in two male-sex-typed domains.,” DevelopmentalPsychology, vol. 38, no. 4, pp. 519–533, 2002.
[43] A. E. Gottfried, G. A. Marcoulides, A. W. Gottfried, and P. H.Oliver, “A latent curve model of parental motivational prac-tices and developmental decline in math and science academicintrinsic motivation,” Journal of Educational Psychology, vol.101, no. 3, pp. 729–739, 2009.
[44] J. Turner and D. Meyer, “Understanding motivation inmathematics: what is happening in classrooms?” in Handbookof Motivation at School, K. R. Wenzel, A. Wigfield, K. R.Wenzel, and A. Wigfield, Eds., pp. 527–552, Routledge/Taylor& Francis Group, New York, NY, USA, 2009.
[45] S. Miller, “How high- and low-challenge tasks affect motiva-tion and learning: implications for struggling learners,” Read-ing and Writing Quarterly: Overcoming Learning Difficulties,vol. 19, no. 1, pp. 39–57, 2003.
[46] D. N. Ruble, C. Martin, and S. Berenbaum, “Gender devel-opment,” in Handbook of Child Psychology, N. Eisenberg, W.Damon, R. M. Lerner, N. Eisenberg, W. Damon, and R.M. Lerner, Eds., vol. 3 of Social, Emotional, and PersonalityDevelopment, pp. 858–932, John Wiley & Sons, Hoboken, NJ,USA, 6th edition, 2006.
[47] C. Leaper, T. Farkas, and C. S. Brown, “Adolescent girls’experiences and gender-related beliefs in relation to theirmotivation in math/science and English,” Journal of Youth andAdolescence, vol. 41, no. 3, pp. 268–282, 2012.
[48] F. Peixoto and L. S. Almeida, “Self-concept, self-esteem andacademic achievement: strategies for maintaining self-esteemin students experiencing academic failure,” European Journalof Psychology of Education, vol. 25, no. 2, pp. 157–175, 2010.
[49] V. F. Filak and K. M. Sheldon, “Teacher support, student moti-vation, student need satisfaction, and college teacher courseevaluations: testing a sequential path model,” EducationalPsychology, vol. 28, no. 6, pp. 711–724, 2008.
[50] N. Gillet, R. J. Vallerand, and M. A. K. Lafreniere, “Intrinsicand extrinsic school motivation as a function of age: themediating role of autonomy support,” Social Psychology ofEducation, vol. 15, no. 1, pp. 77–95, 2012.
[51] K. Aunola, E. Leskinen, and J. E. Nurmi, “Developmentaldynamics between mathematical performance, task motiva-tion, and teachers’ goals during the transition to primaryschool,” British Journal of Educational Psychology, vol. 76, no.1, pp. 21–40, 2006.
[52] C. P. Niemiec and R. M. Ryan, “Autonomy, competence,and relatedness in the classroom: applying self-determinationtheory to educational practice,” Theory and Research inEducation, vol. 7, no. 2, pp. 133–144, 2009.
[53] J. Brophy, Motivating Students to Learn, Rowtledge, New York,NY, USA, 2010.
[54] M. K. Alderman, Motivation for Achievement. Possibilitiesfor Teaching and Learning, Lawrence Erlbaum AssociatesPublishers, Mahwah, NJ, USA, 2004.
[55] D. Stipek, Motivation to Learn. Integrating Theory and Practice,Allyn and Bacon, Boston, Mass, USA, 2002.
[56] G. Ghaith, “The relationship between forms of instruction,achievement and perceptions of classroom climate,” Educa-tional Research, vol. 45, no. 1, pp. 83–93, 2003.
[57] M. S. Hannula, “Attitude towards mathematics: emotions,expectations and values,” Educational Studies in Mathematics,vol. 49, no. 1, pp. 25–46, 2002.