the development of aerobic power in young athletes · the development of aerobic power in young...
TRANSCRIPT
The development of aerobic power in young athletes
A. BAXTER-JONES, H. GOLDSTEIN, AND P. HELMS Portex Anaesthesia, Intensive Therapy, and Respiratory Medicine Unit, Institute of Child Health, and Department of Mathematics, Statistics, and Computing, Institute of Education, University of London, WClN 1EH London; and Department of Child Health, University of Aberdeen, AB9 220 Aberdeen, United Kingdom
BAXTER-JONES, A.,H. GOLDSTEIN,AND P. HELMS. Thede- velopment of aerobic power in young athletes. J. Appl. Physiol. 75(3): 1160-1167,1993.-Previous studies investigating the ef- fects of training in children have been hampered in their inter- pretation by the confounding effects of growth and develop- ment. We followed the development of maximal aerobic power . (VO 2max) in 453 athletes drawn from soccer, swimming, gym- nastics, and tennis. Study design was of a mixed longitudinal type with five age cohorts (8,10,12,14 and 16 yr) followed for 3 consecutive years. A multilevel regression modeling procedure was used to identify the independent effects of predictor vari- ables while accounting for the effects of growth, such as changes in body size. When age, height, and weight were con- trolled for, vo2 max in males significantly increased with puber- tal status, indicated by the coefficient value of 0.15 l/min being greater than its associated SE of 0.07 Vmin. Females showed a similar pattern, with a coefficient value of 0.13 t 0.07 l/min, although the significant increase in VO, max (P < 0.05) found in males in the latter stages of puberty was not shown in females. Swimmers had the highest VO, m8x values (P -c 0.001) at all ages.
maximum oxygen uptake; puberty; training; longitudinal re- peated measures; statistical modeling
THEEFFECTTHATTRAINING has on the development of maximal aerobic power (VO,~& during childhood and adolescence continues to be a subject of great interest to physiologists and sports scientists (6, 7, 11, 13). Most studies have been cross sectional, and because of this the effects of growth, development, and maturation may have masked or may have been greater than those brought about by training (15). Longitudinally gathered data are essential to clearly identify the relative contri- butions from growth, maturation, and training on the development of aerobic power (16).
A comprehensive review (12) of previously published data has concluded that, in normal children, Vo2,,, increases proportionally to body size and mass in both sexes. When Vo2,, is “normalized” in this way, it re- mains stable in males throughout childhood and adoles- cence while decreasing in females. Although the use of ratio standards, such as VO, max per kilogram body mass, is an attractive and seemingly ideal method to control for the increase of VO 2 m8x with growth, the use of such ratio standards has been criticized by Tanner (20) and more recently by Winter et al. (25), because this method of controlling for growth can produce spurious correlation, misinterpretation of data, and incorrect conclusions.
The purpose of the present study was to examine the
relationship of VO, m8x to chronological age at different stages of maturity and to separate the effects of training from those of growth. The data used were obtained from the Training of Young Athletes (TOYA) study, a 5yr longitudinal investigation into the effects of training that ran from 1987 through 1991. We utilized a multilevel re- gression modeling procedure (MRMP) (8) that circum- vented the problems associated with ratio standards and had been designed especially for longitudinal data sets such as those provided by the TOYA study.
METHODS
Design. The TOYA study set out to establish the distri- bution, frequency, and source of the positive and nega- tive effects of intensive training within a population of young athletes, with specific reference to sports-related health and injury problems, growth, psychological devel- opment, and cardiorespiratory fitness, the latter being presented here. Four sports were selected: a racket sport (tennis), a contact team sport (soccer), a sport that re- quires cardiovascular and muscular endurance (swim- ming), and a sport that requires flexibility and explosive strength (gymnastics). These sports were also chosen be- cause they all involved a large number of young athletes, training for them was often started before puberty, and they possessed organized systems of intensive training and standardized age groups for competition. A random sample of athletes was drawn from within a 250-mile ra- dius of London, the study base. The basic criteria for inclusion were that all athletes were being intensively trained (thresholds provided by each sport’s governing body) and/or that they had performance success to a specified level in the past or were expected to achieve it in the future. The study used a mixed longitudinal design to incorporate five age cohorts spanning prepubertal, pu- bertal, and postpubertal children.
Subjects. At the start of the study in 1987 there were 453 subjects, 222 females and 231 males, in five age co- horts (8, 10, 12, 14, and 16 yr); by the end of 1990, 126 females and 145 males remained (59.8%; Table 1). A total of 182 subjects left the study; 58 were excluded because they retired from their sport, another 34 were excluded because they were not training intensively (i.e., they had fallen below the thresholds given by the sporting bodies or they were no longer achieving performance success), and 90 (19.9% of the total sample) withdrew themselves. With the exception of soccer and gymnastics, the sample was evenly distributed across genders (Table 1). Many
1160 0161-7567/93 $2.00 Copyright 0 1993 the American Physiological Society
AEROBIC POWER IN YOUNG ATHLETES
TABLE 1. Subject by age cohort, gender, and sport at beginning and end of TOYA study
Soccer Gymnastics Swimming
Year of Birth M M F M F M
1161
Tennis
F
1971 12 (2) 7 (4) 13 (3) 10 (5) 14 (8) 12 (7) 14 (7) 1973 25 (14) 10 (3) 18 (4) 14 (9) 16 (10) 15 (11) 17 (9) 1975 28 (16) 10 (5) 18 (12) 15 (11) 15 (11) 18 (15) 19 (12) 1977 6 (4) 15 (11) 15 (13) 15 (10) 19 (17) 20 (11) 1979 5 (2) 17 (12) 10 (7) 11 (6) Totals 65 (32) 38 (18) 81 (42) 54 (38) 60 (39) 74 (57) 81 (45) = 453 (271)
Values are nos. of subjects in 1987, whkn Training of Young Athletes (TOYA) study began, with nos. of subjects in 1990, at end of study, in parentheses. M, males; F, females.
more females than males take part in gymnastics in the UK, and the sample of 80 females and 38 males was thought to reflect current participation rates.
Measurements. Body height, weight, pubertal develop- ment, and Tjo2 m8X were measured annually for 3 consecu- tive years. As part of a self-report questionnaire, average weekly training hours were recorded. Subjects were grouped into three pubertal stages to ensure adequate cell sizes within each sport: prepubertal (PP), midpuber- tal (MP), and late-pubertal (LP). Puberty was deter- mined by assessment of stages of breast development in females and genitalia in males with Tanner’s criteria (Zl), where PP is Tanner’s stage 1, MP is Tanner’s stages 2-3, and LP is Tanner’s stages 4-5. Vozmax was mea- sured with the subject running on a motor-driven tread- mill (PK Morgan Instruments, Rainham, UK) and in an air-conditioned laboratory, temperature ZO-22”C, rela- tive humidity 45-60%. Subjects ran at an individually predetermined rate on a 3.4% grade for 1 min followed by increments of 0.5 km/h every minute until exhaustion (3, 4). Measures of gas exchange were obtained by standard open-circuit techniques. Subjects breathed through a Speak-Easy II face mask (Respironics, Monroeville, PA), and ventilation was measured through a turbine volume transducer attached to a control unit with digital display. Analysis of expired 0, and CO, was carried out by para- magnetic analyzers (model nos. QA 500D and 801D, re- spectively, Morgan Instruments, Rainham, UK). This equipment was interfaced with a Sperry/Unisys Micro IT (286) computer. Gas concentration data were aver- aged every 10 s, with subsequent calculation of 0, uptake (VO,), CO, output, expired ventilation, and respiratory exchange ratio by use of Wyvern software (Morgan In- struments). The system was calibrated before each ses- sion with standard gases of known 0, and CO, concen- tration. Heart rate was continuously recorded during ex- ercise. The highest VO, was accepted as VO, max if either a plateau occurred (an increase ~2 ml/kg with an increase in work load) or if one of the following criteria was met: a heart rate of >95% of the predicted maximum corrected for age or a respiratory exchange ratio A.1 (4).
Statistics. Descriptive statistics (means t SD) were applied to all variables. Analysis of variance (ANOVA) and Fisher’s least significant difference (LSD) procedure were used to determine whether significant differences existed between compared groups. Measures of Vozmax were adjusted for growth (height and weight) and matura- tion (pubertal staging) by the use of an MRMP (8). Sepa- rate equations were fitted for each sex, and predicted
values of V0 2 max (l/min) were then calculated from their age, height, weight, sport, and level of maturation. All analyses other than the modeling procedure were per- formed with the Statistical Analysis System Program (19), and P < 0.05 was considered significant.
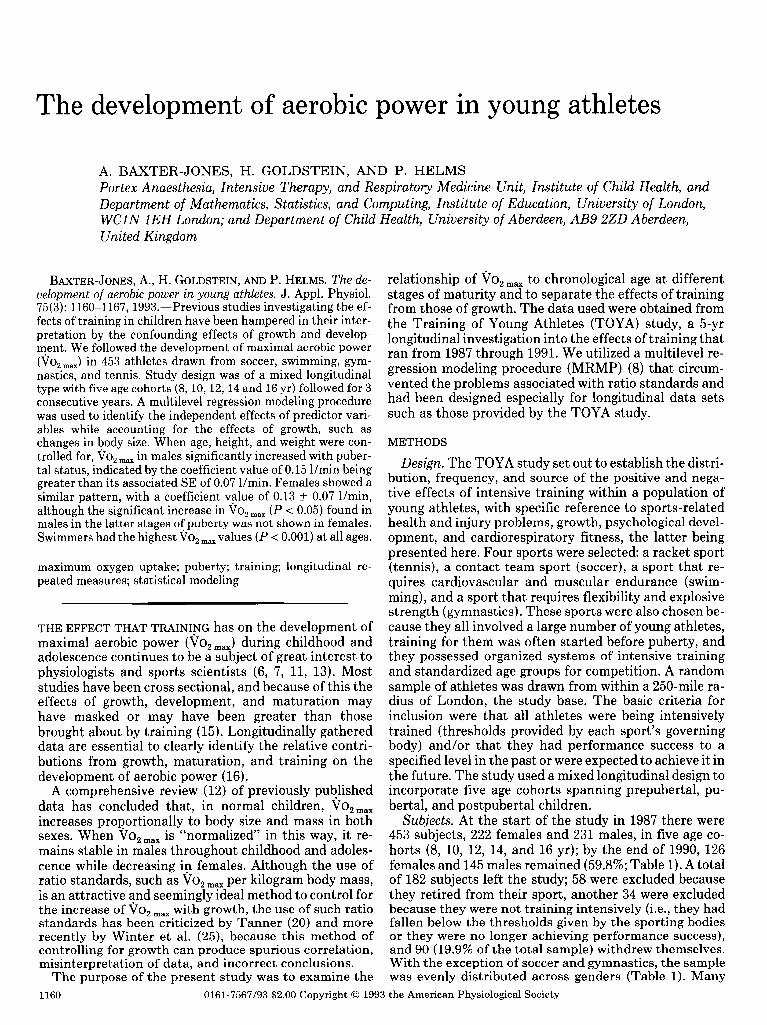
Modeling. The ideal method of analysis of longitudinal repeated-measures data involves some form of multilevel analysis (8). Multilevel analysis has been found useful in extending understanding of biological processes beyond that which can be obtained through single-level linear modeling. The term multilevel refers to a hierarchical or nested membership relationship among units in a sys- tem. Research on human growth has benefited from the formulation of two-level models for repeated measure- ments on individual models because fewer restrictions are placed on the data than in earlier types of analysis (8). When this type of modeling is used, coefficients in a linear model of a process occurring at one level of a hier- archical system can be viewed as variables of interest that are functions of characteristics of units at another level. Furthermore, the variances and covariances of these coefficients are often of direct interest, and coeffi- cients of within-unit relations among variables are gener- ally estimated better than they would be if a single-level analysis were conducted for each group. The more ap- propriate model specification also resolves the problem of misestimated precision inherent in single-level analy- sis of hierarchically structured data. Furthermore, inasmuch as longitudinal data have nested structure- measurements within individuals, multilevel analysis permits individuals to have their own growth curves. Mul- tilevel analysis was performed with the program Multi- level Models Project ML3 (17) using age, anthropometric variables, pubertal stage, and sport as covariates to iden- tify those factors with the most influence on the outcome variable Vo2 max. The models produced used all the avail- able data to produce individual growth trajectories (Fig. 1). Each line represents the predicted change in VO, max
with age for an individual; this is level 1 of the modeling procedure and represents within-individual variation. Comparisons between these regression lines represents Level 2 of the model, variations between individuals. These predicted individual regression lines use not only the individual’s own data but also information from the whole sample. Multilevel modeling effectively captures the feature that the variance of the observations in- creases with time, and because each individual has his or her own slope and intercept, it provides the opportunity to determine the effects on slope and intercept of each
1162 AEROBIC POWER IN YOUNG ATHLETES
4.0 I I I
g 3.6 - /
/
E /
\ =
' 3.2 -
2.4 I I I
9 12 15 18 21
AGE (years)
FIG. 1. Predicted individual maximal aerobic power (vo2 ,,,) growth curves for 70 male tennis players by use of multilevel modeling technique (8, 17). Each line represents regression of aerobic power (VO,) on age from 2-3 annual data points for each subject, with data from both individuals and whole sample. Alinearity was allowed for by including age2 as a term.
predictor variable and its significance by relating the ob- served effects to the respective SEs. Thus group effects larger than within-individual variation can be identified.
To improve accuracy of calculation, age was measured around an origin of 12 yr, and for the same reason height and weight measures were adjusted around an origin of their respective means. Although the quadratic terms of age squared and height squared were not found to be significant, they were left in the model because they were the best estimates available to allow for the nonlinear relationship betyeen VO, m8X and age. Because swimmers had the highest VO, max values, swimming was chosen as the base sport, and the other sports were compared with reference to it. In graphic representations of the model, height and weight were predicted at the age of 12 yr (our chosen origin) by regressing the variable on age and age squared, thereby allowing for the variation in height and weight of our sample at that age.
RESULTS
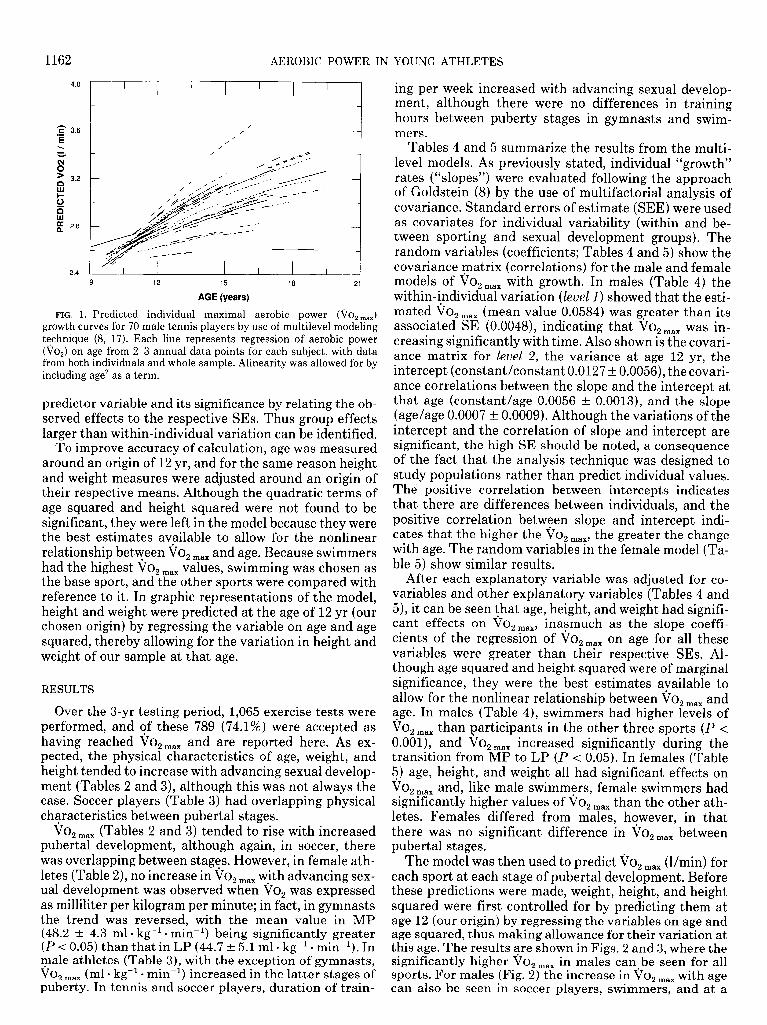
Over the 3-yr testing period, 1,065 exercise tests were performed, and of these 789 (74.1%) were accepted as having reached Vo2 max and are reported here. As ex- pected, the physical characteristics of age, weight, and height tended to increase with advancing sexual develop- ment (Tables 2 and 3), although this was not always the case. Soccer players (Table 3) had overlapping physical characteristics between pubertal stages.
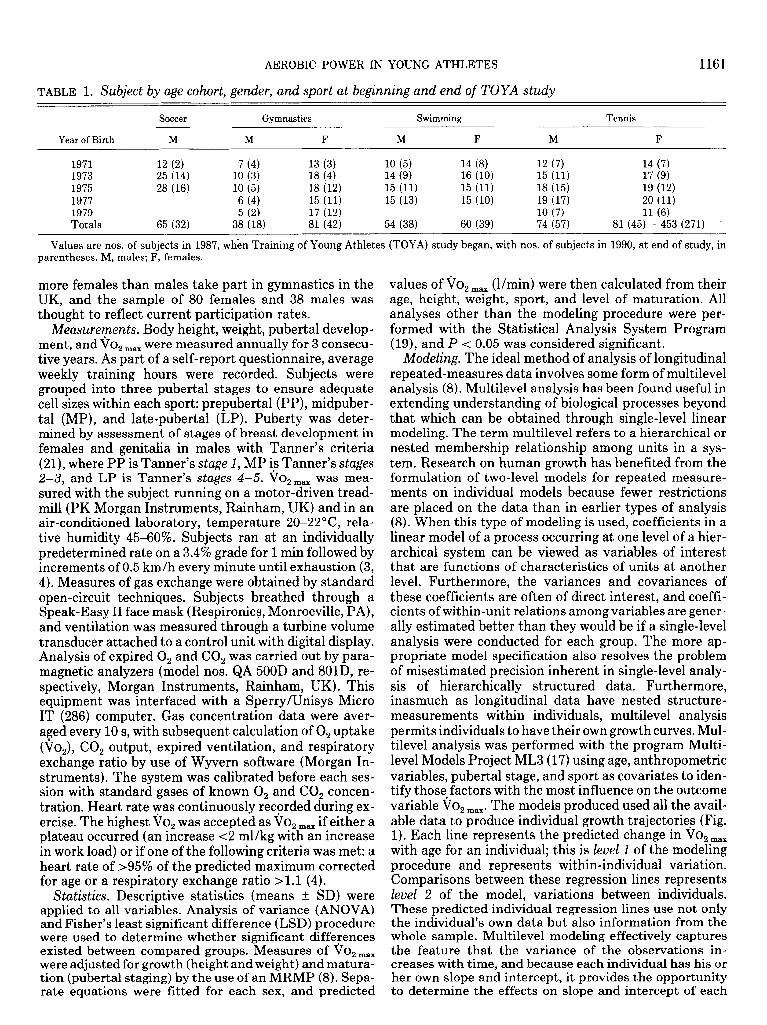
vo 2 max (Tables 2 and 3) tended to rise with increased pubertal development, although again, in soccer, there was overlapping between stages. However, in female ath- letes (Table 2), no increase in Vo2 max with advancing sex- ual development was observed when V,Z was expressed as milliliter per kilogram per minute; in fact, in gymnasts the trend was reversed, with the mean value in MP (48.2 t 4.3 ml. kg-’ l min-‘) being significantly greater (P < 0.05) than that in LP (44.7 t 5.1 ml l kg-‘. min-l). In male athletes (Table 3), with the exception of gymnasts, . vo 2 max Cm1 l kg-1 l
min-‘) increased in the latter stages of puberty. In tennis and soccer players, duration of train-
ing per week increased with advancing sexual develop- ment, although there were no differences in training hours between puberty stages in gymnasts and swim- mers.
Tables 4 and 5 summarize the results from the multi- level models. As previously stated, individual “growth” rates (“slopes”) were evaluated following the approach of Goldstein (8) by the use of multifactorial analysis of covariance. Standard errors of estimate (SEE) were used as covariates for individual variability (within and be- tween sporting and sexual development groups). The random variables (coefficients; Tables 4 and 5) show the covariance matrix (correlations) for the male and female models of Vo2,,, with growth. In males (Table 4) the within-individual variation (Level 1) showed that the esti- mated VO, max (mean value 0.0584) was greater than its associated SE (0.0048), indicating that V02max was in- creasing significantly with time. Also shown is the covari- ante matrix for Level 2, the variance at age 12 yr, the intercept (constant/constant 0.0127 t 0.0056), the covari- ante correlations between the slope and the intercept at that age (constant/age 0.0056 t 0.0013), and the slope (age/age 0.0007 t 0.0009). Although the variations of the intercept and the correlation of slope and intercept are significant, the high SE should be noted, a consequence of the fact that the analysis technique was designed to study populations rather than predict individual values. The positive correlation between intercepts indicates that there are differences between individuals, and the positive correlation between slope and intercept indi- cates that the higher the Vo2max, the greater the change with age. The random variables in the female model (Ta- ble 5) show similar results.
After each explanatory variable was adjusted for co- variables and other explanatory variables (Tables 4 and 5), it can be seen that age, height, and weight had signifi- cant effects on VO, max, inasmuch as the slope coeffi- cients of the regression of V02max on age for all these variables were greater than their respective SEs. Al- though age squared and height squared were of marginal significance, they were the best estimates available to allow for the nonlinear relationship between Vo2 max and age. In males (Table 4), swimmers had higher levels of . vo 2 max than participants in the other three sports (P < O.OOl), and VO, max increased significantly during the transition from MP to LP (P < 0.05). In females (Table 5) age, height, and weight all had significant effects on . vo 2max and, like male swimmers, female swimmers had significantly higher values of Vonmax than the other ath- letes. Females differed from males, however, in that there was no significant difference in Vo2,,, between pubertal stages.
The model was then used to predict VO, max (Urnin) for each sport at each stage of pubertal development. Before these predictions were made, weight, height, and height squared were first controlled for by predicting them at age 12 (our origin) by regressing the variables on age and age squared, thus making allowance for their variation at this age. The results are shown in Figs. 2 and 3, where the significantly higher irO, max in males can be seen for all sports. For males (Fig. 2) the increase in VO, max with age can also be seen in soccer plavers. swimmers. and at a
AEROBIC POWER IN YOUNG ATHLETES
TABLE 2. Physical and performance characteristics of female subjects
1163
n Age, Weight,
Yr kg
Height, cm l/min
%XU3X
ml l kg-’ l min-’ Training Duration,
h/wk
Gymnastics
PP MP LP
29 10.6kl.2 35 12.7*1.5* 53 16.Otl.5*
30.2k4.8 37.5t4.2” 52.5t6.4*
137.0t7.3 147.7*5.1* 160.6t5.3”
1.46t0.24 l.BlkO.23* 2.33*0.30*
48.4t8.0 48.2t4.3 44.7t5.1*
13.7k5.4 12.825.1 13.4t6.6
Swimming
135.4t4.1 154.9k7.1” 164.8k5.1”
PP 7 MP 25 LP 72
11.3t0.6 12.8kl.6 15.lt3.9’
27.8tl.2 42.Ok6.4” 56.027.6”
1.45kO.17 2.16*0.44* 2.86&0.45*
52.2t3.9 51.7kB.O 51.1k6.3
12.5t5.6 10.2k5.4 10.5t5.9
Tennis
PP 18 MP 41 LP 101
10.7t0.8 12.0*1.0* 15.5kl.9”
33.5t4.3 40.5t5.7” 58.lt6.8*
142.2t7.2 150.8*7.9* 165.5k6.0”
1.58t0.27 1.97*0.33* 2.72*0.37*
47.4k5.8 48.6k5.3 47.1t5.3
5.5t2.1 7.6t4.7 9.2t5.1
Values are means t SD (all visits); n, no. of subjects. VO, -, maximal aerobic power; PP, MP, and LP, pre-, mid-, and late-pubertal stages, respectively. * Significant difference from preceding state (P < 0.05) by Fisher’s least significant difference (LSD) comparisons.
lower rate of increase in tennis players, with a plateau in gymnasts at -12 yr. At all stages of pubertal develop- ment, swimmers had higher values than the other ath- letes. In females there was a smoother transition, and the nonsignificant differences between pubertal stages dem- onstrated in Table 5 can be clearly seen. Female swim- mers increased their VO 2 max with age, whereas gymnasts showed a decrease from the age of 8-9 yr, and tennis players maintained a constant level with growth.
differences found during adolescence (2,s). In the pres- ent study swimmers, soccer players, and tennis players had higher values of aerobic power (assessed as VO, max in ml l kg-’ l min-l) at all stages of pubertal development compared with a normal untrained population of British children (Fig. 4), who had been measured at a similar time and under experimental conditions similar to those in this study (2). The most commonly cited cause for the fall in \i0, m8x (ml l kg-’ l min-‘) in females is that they have a greater accumulation of subcutaneous fat during and after puberty (2, 10). In a review of maturity-asso- ciated variation in VO, M8X, Krahenbuhl et al. (12) con- cluded that weight was probably the best general index for controlling the effects of maturation. It was argued that the changes with chronological age were not taken into account when the effects of weight, height, and bio- logical age were used to control for the effects of matura- tion.
DISCUSSION
Aerobic power in trained and untrained children has been frequently measured, and in untrained males and females it has been shown to increase with chronological age (12). When trained and untrained subjects of both genders are compared, the values of aerobic power in the trained subjects are higher at all ages, with the greatest
TABLE 3. Physical and performance characteristics of male subjects
n Age,
Yr
Weight,
kg
Height, cm l/min
%max
ml l kg-’ l min-’ Training Duration,
h/wk
Soccer
PP 13 MP 27 LP 77
13.1t0.7 13.720.9 15.921.4’
41.3t4.9 44.0t6.6 62.8tlO.l”
152.5t5.1 154.8t4.9 172.7*7.7*
2.30~0.29 2.44kO.31 3.85*0.60*
55.7t3.7 55.7k4.0 61.5k4.9”
3.5k2.5 3.7t3.0 7.5t5.8*
Gymnastics
PP 12 MP 11 LP 25
11.4tl.2 14.0t0.9” 16.ltl.3’
31.2t4.7 41.9t4.6” 58.5k7.1’
137.0t6.2 152.7t8.3’ 167.2t5.5”
1.7lt0.35 2.35kO.32” 3.2OkO.55”
54.5t4.4 56.0k3.3 54.7k5.3
14.8t6.0 15.8+4.0 13.9t7.7
Swimming
147.2t5.7 155.lt6.7” 176.4t_7.3*
37.8k6.4 44.2-+6.6* 66.6210.5”
2.16t0.35 2.57t0.42* 4.16t0.70”
57.7t7.5 58.1t5.4 62.7k6.8”
8.5k4.7 9.3t3.9
lO.Bt6.6
PP 18 MP 17 LP 59
11.720. 8 12.8&0.7* 16.ltl.7’
Tennis
PP 41 MP 39 LP 69
11.6tl.3 13.Okl.2 16.2tl.7
36.7k6.1 43.0t6.0 64.8t9.7
147.0t6.4 155.9k7.4 176.5t7.2
1.98t0.35 2.47t0.38 3.86t0.72
54.1k5.2 57.6t5.6 59.5t6.1
7.8k3.2 ll.lk5.5 12.3k7.7
Values are means t SD (all visits); n, no. of subjects. * Significant difference from preceding stage (P < 0.05) by Fisher’s LSD comparisons.
1164 AEROBIC POWER IN YOUNG ATHLETES
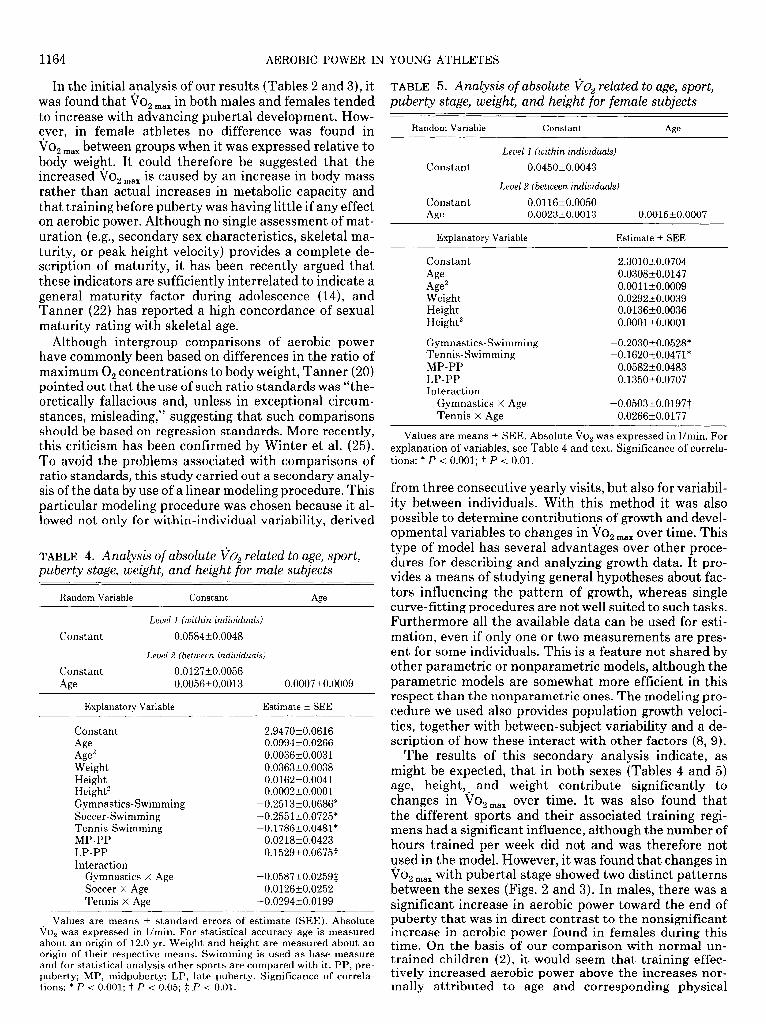
In the initial analysis of our results (Tables 2 and 3), it was found that VO
TABLE 5. Analysis of absolute VO, related to age, sport, 2 m8X in both males and females tended puberty stage, weight, and height for female subjects
to increase with advancing pubertal development. How- ever, in female athletes no difference was found in Random Variable Constant Age .
vo 2 m8X between groups when it was expressed relative to body weight. It could therefore be suggested that the
Level 1 (within individuals)
increased VO 2 max is caused by an increase in body mass Constant 0.0450t0.0043
rather than actual increases in metabolic capacity and Level 2 (between individuals)
that training before puberty was having little if any effect Constant 0.0116+0.0050
on aerobic power. Although no single assessment of mat- Age 0.0023+0.0013 0.0015~0.0007
uration (e.g., secondary sex characteristics, skeletal ma- Explanatory Variable Estimate f SEE
turity, or peak height velocity) provides a complete de- scription of maturity, it has been recently argued that Constant 2.3010t0.0704
these indicators are sufficiently interrelated to indicate a AiF 0.0308~0.0147
general maturity factor during adolescence (l4), and Age2 0.0011t0.0009 Weight 0.0292+0.0039
Tanner (22) has reported a high concordance of sexual Height 0.0136~0.0036 maturity rating with skeletal age. Height2 0.0001~0.0001
Although intergroup comparisons of aerobic power have commonly been based on differences in the ratio of maximum 0, concentrations to body weight, Tanner (20) pointed out that the use of such ratio standards was “the- oretically fallacious and, unless in exceptional circum-
Gymnastics-Swimming Tennis-Swimming MP-PP LP-PP Interaction
Gymnastics X Age
-0.2030t0.0528* -0.1620+0.0471*
0.0582t0.0483 0.1350~0.0707
stances, misleading,” suggesting that such comparisons Tennis X Age - -0.0266+0.0177 should be based on regression standards. More recently, this criticism has been confirmed by Winter et al. (25).
Values are means t SEE. Absolute VO, was expressed in l/min. For explanation of variables, see Table 4 and text. Significance of correla-
To avoid the problems associated with comparisons of tions: * P < 0.001; t P < 0.01. ratio standards, this study carried out a secondary analy- sis of the data by use of a linear modeling procedure. This particular modeling procedure was chosen because it al- lowed not only for within-individual variability, derived
from three consecutive yearly visits, but also for variabil- ity between individuals. With this method it was also possible to determine contributions of growth and devel- .
TABLE 4. Analysis of absolute 30, related to age, sport, puberty stage, weight, and height for male subjects
Random Variable Constant Age
Level
Constant
1 (within individuals)
0.0584kO.0048
Level 2 (between individuals)
opmental variables to changes in VO, max over time. This type of model has several advantages over other proce- dures for describing and analyzing growth data. It pro- vides a means of studying general hypotheses about fac- tors influencing the pattern of growth, whereas single curve-fitting procedures are not well suited to such tasks. Furthermore all the available data can be used for esti- mation, even if only one or two measurements are pres- ent for some individuals. This is a feature not shared by
Constant
Age 0.0127+0.0056 0.0056kO.0013 0.0007+0.0009
Explanatory Variable Estimate 2 SEE
Constant Age Age2 Weight Height Height2 Gymnastics-Swimming Soccer-Swimming Tennis-Swimming MP-PP LP-PP Interaction
Gymnastics X Age Soccer X Age Tennis X Age
2.9470+0.0616 0.0994kO.0266
-0.0036+0.0031 0.0363+_0.0038 0.0162~0.0041 0.0002+0.0001
-0.2513+0.0686* -0.2551&0.0725* -0.1786&0.0481*
0.0218kO.0423 0.1529+0.0675.f
-0.0587&0.0259$ 0.0126kO.0252
-0.0294t0.0199
Values are means + standard errors of estimate (SEE). Absolute VO, was expressed in l/min. For statistical accuracy age is measured about an origin of 12.0 yr. Weight and height are measured about an origin of their respective means. Swimming is used as base measure and for statistical analysis other sports are compared with it. PP, pre- puberty; MP, midpuberty; LP, late puberty. Significance of correla- tions: * P < 0.001; t P < 0.05; $ P < 0.01.
other parametric or nonparametric models, although the parametric models are somewh at more efficient in this respect than the nonparametric ones. The modeling pro- cedure we used also provides population growth veloci- ties, together with between-subject variability and a de- scription of how these interact with other factors (8, 9).
The results of this secondary analysis indicate, as might be expected, that in both sexes (Tables 4 and 5) age, height, and weight contribute significantly to . changes in Vo2max over time. It was also found the different sports and their associated training
that regi-
mens had a significant influence, although the number-of hours trained per week did not and was therefore not used in the model. However, it was found that changes in vo 2 max with pubertal stage showed two distinct patterns between the sexes (Figs. 2 and 3). In males, there was a significant increase in aerobic power toward the end of puberty that was in direct contrast to the nonsignificant increase in aerobic power found in females during this time. On the basis of our comparison with normal un- trained children (2), it would seem that training effec- tively increased aerobic power above the increases nor- mally attributed to age and corresponding physical

1165 AEROBIC POWER IN YOUNG ATHLETES
TENNIS
3.2 1 3.2
3.0
2.8
2.6 - .
2.4-
: - LP
- MP
I- PP
2.6
2.4
2.2
I *
- LP 2.0 - MP
FIG. 2. Predicted voarnm for male athletes at different ages in each puber- tal group. Weight, height, and height2 were controlled for by predicting them at age 12 by regressing variables on age and age2. PP, prepubertal; MP, midpubertal; LP, late pubertal.
1.8 - PP
1.6 1, . , . , . , . , , , . , . ,
7 9 11 13 15 17 19 21
AGE (years)
1.6’, . , - , . , . , = , . , w 1 7 9 11 13 15 17 19 21
AGE (years)
GYMNASTICS SOCCER
3.2 3.2 - .
3.0 -
2.8 -
2.6 -
2.4-
:::;
1.8- - pp . 1.6’1 8 I - I - 1 - 1 - 1 - ’ - 1
7 9 11 13 1s 17 19 21
AGE (years)
J
2.8 -
2.6 -
2.49
2.2 -
2.0 - .
1.8 -
LP
- MP - PP
1.6’, r , 1 , . , . , . , . , . 1 7 9 11 13 15 17 19 21
AGE (years)
growth and maturation. In a more aerobic sport, such as swimming, this effect was more noticeable. It was also found that, contrary to other reports (11, 15), aerobic power was seen to increase with training even in the pre- pubertal years. . The question remains: how much of the increase in
vo 2 max is due to growth and biological maturity, and how much is a result of training (15). Using the MRMP, we
we;e able to model not only the within-subject variation Of v”2 max with time but also the variation between sub- jects while simultaneously accounting for other explana- tory variables, such as age, height, weight, sport, and pu- bertal development, all of which have been shown to con- tribute to within-subject variation. The MRMP enabled us to separate the effects of maturation while avoiding the errors inherent when using ratio standards. At the
TENNIS
3.2 - z E 3.0 -
. = 2.8-
2 - LP 2 2.6-
. - MP 9 2.4- - PP
E 2.2-
g 2.0-
$ 1.8- *
1.6-1 - , . , . , . , . , . , . , 7 9 11 13 15 17 19 21 FIG. 3. Predicted vo2max for female
AGE (years) athletes at different ages in each puber- tal group. Weight, height, and height2 were controlled for by predicting them at age 12 by regressing variables on age and age2.
3.2
3.0
2.8
2.6
1.8 1 PP
1.6 jr . , . , . , . , . . , , . ,
7 9 11 13 15 17 19 21
AGE (years)
GYMNASTICS
3.2 -
3.0 -
2.8 - .
2.6 -
2.4- - LP
- MP
- PP
7 9 11 13 1s 17 19 21
AGE (years)

1166 AEROBIC POWER IN YOUNG ATHLETES
- Untrained
- Swlmmlng
- Gymnastics
- Tennh
2 3 4
PUBERTY STAGE
Untrained
Swlmmlng
Gymnastics
Tennis
5: 36
A Soccer
32
PUBERTY STAGE
FIG. 4. iTO, m8x in trained and untrained children and adolescents in relation to gender and sexual maturity (as assessed by Tanner; see Measurements and Ref. 21). Results of present study were compared with those of a recent study (2) of a normal untrained population of British children.
same time we were also able to compare the effects of intensive training in four different sports on the growth of aerobic power. However, it should-be emphasized again that this modeling procedure produces large SEs (Tables 4 and 5), a consequence of the fact that the analy- sis technique is designed to study predict individual values.
populations and not to
A common issue in work with children is whether or not they obtain a true Vo2max. Previous studies have found that only a minority of children produce a true . vo 2 max plateau (1,lZ) and have suggested that the more appropriate term to use with children is peak VO,, which represents the highest To2 elicited during an exercise test to exhaustion. However, it has been found that if chil- dren are sufficiently encouraged, they do approach the true limits of VO 2marr without reaching a plateau in Vo2
(5, 18). It _ is therefore possible that the significant in- crease in V02max with time (Table 4) could have been a reflection of true V02,, tests being produced by the older children. it is important
--- Therefore,
to be aware when interpreting these data, that the large SEs produced by
the model could also have been a consequence of the pos- I sible lack of a stable end point in VO, max.
The critical stage of maturity during which endurance training exerts its greatest influence on the cardiorespira- tory system is still speculative (23). Mirwald et al. (15) found, in agreemen t with Kobayashi et al. (ll), that in longitudinal studies of ma le subjects t raining did not ap-
ASTRAND, P. O., AND K. RODAHL. Textbook of Work Physiology. New York: McGraw-Hill, 1986, p. 344-349. BUNC, V., J. HELLER, J. LESO, S. SPRYNAROVA, AND R. ZDANO- WICZ. Ventilatory threshold in various groups of highly trained athletes. Int. J. Sports Med. 8: 275-280, 1987. COOPER, D. M., D. WEILER-RAVELL, B. J. WHIPP, AND K. WASSER- MAN. Aerobic parameters of exercise as a function of body size during growth in children. J. Appl. Physiol. 56: 628-634, 1984. CUNNINGHAM, D. A., AND R. B. EYNON. The working capacity of young competitive swimmers, lo-16 years of age. Med. Sci. Sports 5: 227-231,1973.
preciably improve aerobic power before the age of 12 yr. 7. DANIELS, J., AND N. OLDRIDGE. Changes in oxygen consumption of
However, both studies supported the view that the ado- lescent growth period was the critical period for growth of aerobic power. This view has been opposed by Weber et al. (24), who found that there was no difference in rate of increase in aerobic power during this growth period, although the amount of training performed and the matu- rity indicator used have been criticized (15). In the pres- ent study we found a statistically significant increase in aerobic power during pubertal development in male ath- letes (P < 0.05), an increase that was most obvious to- ward the end of puberty.
Male swimmers were found to have significantly higher aerobic power at all stages of puberty than males participating in the other three sports (P < 0.001). This could have been a result of the training program, al- though a genetic predisposition cannot be ruled out. In female subjects, we found no significant difference in aerobic power between pubertal stages, and, like males, female swimmers had significantly greater aerobic power at all stages of puberty than participants in other sports.
In conclusion, growth in aerobic power was found to be significantly related to physical growth (age, height, and weight) and, in males, to pubertal development. Further- more the different sports all showed different patterns of aerobic power with age, suggesting that the type of sports training was influencing aerobic power development. However, further research is needed to verify this, espe- cially with groups of untrained children, so that the ef- fects of selection can be controlled for. The high SEs obtained from the modeling procedure highlight not only the fact that the model should not be used to predict individual values but also the possible problem asso- I ciated with measuring VO, max in children. In contrast to previous reports (11,15), we found that in sports with an aerobic content to their training, aerobic power did in- crease in the prepubertal years.
We are grateful for the cooperation and participation of the children and their parents. We thank J. Bains and Dr. N. Maffulli for technical assistance and J. Douglas for help with data management.
This study was supported by The (UK) Sports Council, Research Unit.
Address for reprint requests: A. Baxter-Jones, Dept. of Child Health, Foresterhill, Aberdeen AB9 2ZD, UK.
Received 23 March 1992; accepted in final form 23 April 1993.
REFERENCES
1.
2.
3.
4.
5.
6.
ARMSTRONG, N., AND B. DAVIES. The metabolic and physiological responses of children to exercise and training. Phys. Edm Reu. 7: go-105,1984. ARMSTRONG, N., J. WILLIAMS, J. BALDING, P. GENTLE, AND B. KIRBY. The peak oxygen uptake of British children with reference to age, sex and sexual maturity. Eur. J. Appl. Physiol. Occup. Phys- iol. 62: 369-375, 1991.
AEROBIC POWER IN YOUNG ATHLETES 1167
young boys during growth and running training. Med. Sci. Sports 3: 161-165,197l.
8. GOLDSTEIN, H. Efficient statistical modelling of longitudinal data. Ann. Hum. Biol. 13: 129-141, 1986.
9. GOLDSTEIN, H. Flexible models for the analysis of growth data with an application to height prediction. Rev. Epidemiol. 37: 477- 484, 1989.
10. KEMPER, H. C. G., H. J. P. DEKKER, M. G. OOTJERS, B. POST, J. SNEL, P. G. SPLINTER, L. STORM-VAN ESSEN, AND R. VERSCHUUR. Growth and health of teenagers in the Netherlands: survey of mul- tidisciplinary studies and comparison to recent results of a Dutch study. Int. J. Sports Med. 4: 202-214, 1983.
11. KOBAYASHI, K., K. KITOKAZU, M. MIURA, H. SODEYAMA, Y. MUR- ASE, M. MIYASHITA, AND H. MATSUI. Aerobic power as related to body growth and training in Japanese boys: a longitudinal study. J. AppZ. Physiol. 44: 666-672, 1978.
12. KRAHENBUHL, G. S., J. S. SKINNER, AND W. M. KOHRT. Develop- mental aspects of maximal aerobic power in children. Exercise Sport Sci. Rev. 13: 503-538, 1985.
13. KRAMER, J. D., AND P. R. LURIE. Maximal tests in children. Am. J. Dis. Child. 108: 283-297, 1964.
14. MALINA, R. M. Competitive youth sports and biological matura- tion. In: Competitive Sports for Children and Youth. An Overview of Research and Issues, edited by E. W. Brown and C. F. Branta. Champaign, Illinois: Human Kinetics Books, 1988, p. 227-245.
15. MIRWALD, R. L., D. A. BAILEY, N. CAMERON, AND R. L. RASMUS- SEN. Longitudinal comparison of aerobic power in active and inac- tive boys aged 7.0 to 17.0 years. Ann. Hum. Biol. 8: 405-414, 1981.
16. MIRWALD, R. L., D. A. BAILEY, AND C. WEESE. Problems in the assessment of maximal aerobic power in a longitudinal growth study. Proc. 4th Intl Motoric Symp. Darmstadt 1977, p. l-17.
17. PROSSER, R., J. RASBASH, AND H. GOLDSTEIN. ML3 Software for the Three-Level Analysis User’s Guide. London: Inst. of Education, Univ. of London, 1990, p. l-134.
18. RITMEESTER, J. W., H. C. G. KEMPER, AND R. VERSCHUUR. Is a levelling-off criterion in oxygen uptake a prerequisite for maximal performance in teenagers? In: Children and Exercise XI, edited by R. A. Binkhorst, H. C. G. Kemper, and W. H. M. Saris. Champaign, IL: Human Kinetics Books, 1985, p. 161-169.
19. SAS INSTITUTE, INC. Statistical Analysis System Procedure Guide, (Release 6.03). Cary, NC: SAS, 1985.
20. TANNER, J. M. Fallacy of per-weight and per-surface area stan- dards, and their relation to spurious correlation. J. Appl. Physiol. 2: 1-15, 1949.
21. TANNER, J. M. Growth at Adolescence (2nd ed.). Boston, MA: Blackwell, 1962.
22. TANNER, J. M. Foetus into Man. Physical Growth From Conception to Maturity. London: Open Books, 1978.
23. VACCARO, P., AND, A. MAHON. Cardiorespiratory responses to en- durance training in children. Sports Med. 4: 352-363, 1987.
24. WEBER, G., W. KARTODIHARDJO, AND V. KLISSOURAS. Growth and physical training with reference to heredity. J. Appl. Physiol. 40: 211-215, 1976.
25. WINTER, E. M., F. B. C. BROOKES, AND E. J. HAMLEY. Maximal exercise performance and lean leg volume in men and women. J. Sports Sci. 9: 3-13, 1991.