the development of a sensitive multi-residue lc-ms/ms ... · for the quantitative determination of...
TRANSCRIPT

1
The Development of a Sensitive Multi-Residue LC-MS/MS Method for the Quantitative Determination of Mycotoxins in Animal Feedstuffs and Silage Using Xevo TQ-SSara Stead,1 Dominic Roberts,1 Antonietta Gledhill,1 Theo de Rijk,2 Christof Van Poucke,3 and Sarah De Saeger3
1 Waters Corporation, Manchester, UK; 2 RIKILT Institute of Food Safety, Wageningen, The Netherlands3 Ghent University, Ghent, Belgium
IN T RO DU C T IO N
There are now over 400 recognized mycotoxins that may be found in animal
feedings materials and it has been reported that as much as 25% of the world’s
cereal grains may be contaminated with mycotoxins.1
The analysis of animal feedingstuffs including silage represents a major technical
challenge due to the complexity and in-homogeneity of these matrices. Although
permitted limits for mycotoxins are set at relatively high (µg kg -1) concentrations
in the EU,2,3 toxic effects such as immunotoxicity and feed uptake problems in
certain species (poultry and porcine) are often observed at sub μg kg -1
concentrations.4 For this reason there is often a requirement to achieve low
detection limits in feedingstuffs. There is also a potential for co-contamination
due to pre- and post- harvest infestation resulting in the occurrence of
tricothecenes, beauvercin and enniatins, fumonisins, ochratoxin, T2, HT-2,
and alternaria toxins for example within a single feed sample.5
In this application note, we report the development of a quantitative method for
the determination of 33 relevant mycotoxins in a variety of animal feed and
silage extracts. A Waters® ACQUITY UPLC I-Class System coupled to a Xevo
TQ-S was used for rapid, high quality, and ultra-sensitive analysis of multiple
mycotoxins in feed extract. Our goal was to investigate the effect of matrix
dilution and enhanced instrument sensitivity to overcome common analytical
challenges such as ion suppression and to reduce the effects of matrix variability.
WAT E R S SO LU T IO NS
ACQUITY UPLC® I-Class System
Xevo® TQ-S
TargetLynx™ Application Manager
Quanpedia™ Database
K E Y W O R D S
mycotoxin, feedingstuffs, silage,
tricothecene, beauvercin, enniatin,
fumonisin, ochratoxin, T2, HT-2,
alternaria, tandem quadrupole,
A P P L I C AT IO N B E N E F I T S ■■ Provides a quantitative LC-MS/MS method
for the simultaneous determination of
33 mycotoxins in animal feedingstuffs
and silage.
■■ Suitable for use as sensitive screening assay
for the determination of low level mycotoxin
contamination in animal feedingstuffs.
■■ Reduces complex matrix effects by
incorporating a simple extract dilution
step prior to analysis.

2The Development of a Sensitive Multi-Residue LC-MS/MS Method for the Quantitative Determination
E X P E R IM E N TA L
Extract preparation
The extracts of different animal feedingstuffs and silage were kindly provided by RIKILT, The Netherlands and
Ghent University for the purposes of this study. A generic and simplified sample extraction protocol based
on 84:16 (v/v) acetonitrile: acidified water for the recovery of mycotoxins from the variety of feedingstuffs
and silage was used.6 Briefly, the feed samples were mechanically homogenized in the presence of the
extraction solvent followed by a centrifugation step. An aliquot of the supernatant was removed and placed
in autosampler vial for subsequent LC-MS/MS analysis.
Time A B Curve
0 90 10
3 90 10
10 30 70
10.1 10 90 6
12 10 90
12.1 90 10
15 90 10
UPLC conditions
LC system: ACQUITY UPLC I-Class
Column: BEH C18,
2.1 x 100 mm, 1.7 μm
Temp.: 40 °C
Injection volume: 5 μL
Flow rate: 0.4 mL/min
Mobile phase A: Water + 0.1%
formic acid
Mobile phase B: Acetonitrile + 0.1%
formic acid
MS conditions
MS System: Xevo TQ-S
Ionization mode: ES +/- switching
Capillary voltage: 3.4 kV
Source temp.: 150 °C
Desolvation temp.: 400 °C
Cone gas flow: 150 L/hr
Desolvation gas flow: 800 L/hr
Table 1. UPLC gradient.
3The Development of a Sensitive Multi-Residue LC-MS/MS Method for the Quantitative Determination
Mycotoxin MRM transition Dwell time
(s) Cone voltage
(V) Collision energy
(eV) Polarity
Aflatoxin B1 Q 313.1 > 241.1 q 313.1 > 285.1
0.02 25 50 30
Pos
Aflatoxin B2 Q 315.1 > 259.1 q 315.1 > 287.1
0.02 25 40 35
Alfatoxin G1 Q 329.1 > 243.1 q 329.1 > 311.1
0.02 20 33 20
Alfatoxin G2 Q 331.1 > 245.1 q 331.1 > 313.1
0.037 25 18 19
DON Q 297.1 > 231.1 q 297.1 > 249.1
0.103 20 30 36
Enniatin A Q 682.6 > 99.9 q 682.6 > 210.3
0.108 70 30 34
Enniatin A3 Q 668.5 > 99.9 q 668.5 > 210.0
0.052 64 30 36
Enniatin B Q 640.5 > 85.9 q 640.5 > 195.9
0.052 64 30 36
Enniatin B1 Q 654.5 > 85.9 q 654.5 > 195.9
0.02 70 55 50
Fumonisin B1 Q 722.4 > 334.3 q 722.4 > 352.3
0.023 25 55 50
Fumonisin B2 Q 706.4 > 336.2 q 706.4 > 318.2
0.023 50 5
12
HT-2 Q 425.2 > 245.1 q 425.2 > 263.1
0.021 14 32 30
OTA Q 404.2 > 245.1 q 404.2 > 263.1
0.021 10 5 5
T-2 Q 467.3 > 245.1 q 467.3 > 305.1
0.052 20 23 19
Zearalenone Q 319.1 > 185 q 319.1 > 187
0.038 78 70 28
Beauvericin Q 784.5 > 133.9 q 784.5 > 244.0
0.052 32 43 30
Tentoxin Q 415.2 > 131.9 q 415.2 > 312.1
0.038 17 12 7
Pencillic acid Q 171.1 > 125.0 q 171.1 > 153.0
0.163 28 25 25
Citrinin Q 251.1 > 191.0 q 251.1 > 205.1
0.023 25 30 25
Alternariol Q 259.0 > 185.1 q 259.0 > 213.2
0.02 10 20 8
NIV Q 313.7 > 175.1 q 313.7 > 295.1
0.163 14 15 7
α- Zearalenone Q 323.0 > 277.1 q 323.0 > 305.2
0.023 14 15 7
β- Zearalenone Q 323.0 > 277.1 q 323.0 > 305.2
0.023 20 39 36
Sterigimatocystin Q 325.1 > 253.1 q 325.1 > 281.1
0.05 22 20 26
Cyclopiazonic acid Q 337.1 > 182.0 q 337.1 > 196.0
0.163 18 19 12
3-acetyl-DON Q 339.1 > 137.0 q 339.1 > 231.0
0.03 14 12 10
15-acetyl-DON Q 339.1 > 261.0 q 339.1 > 279.1
0.03 20 20 13
Fusarenon-X Q 355.2 > 229.1 q 355.2 > 247.1
0.03 14 10 10
Diacetoxyscirpenol Q 367.2 > 289.1 q 367.2 > 307.2
0.02 17 27 20
Neosolaniol Q 383.1 > 185.1 q 383.1 > 215.1
0.03 27 28 19
Roquefortin Q 390.2 > 193.0 q 390.2 > 322.2
0.032 25 42 30
Ergotamine Q 587.3 > 208.1 q 587.3 > 187.5
0.02 35 40 30
Alternariol monomethyl ether Q 271.2 > 228.2 q 271.2 > 256.2
0.031 42 30 10
Neg
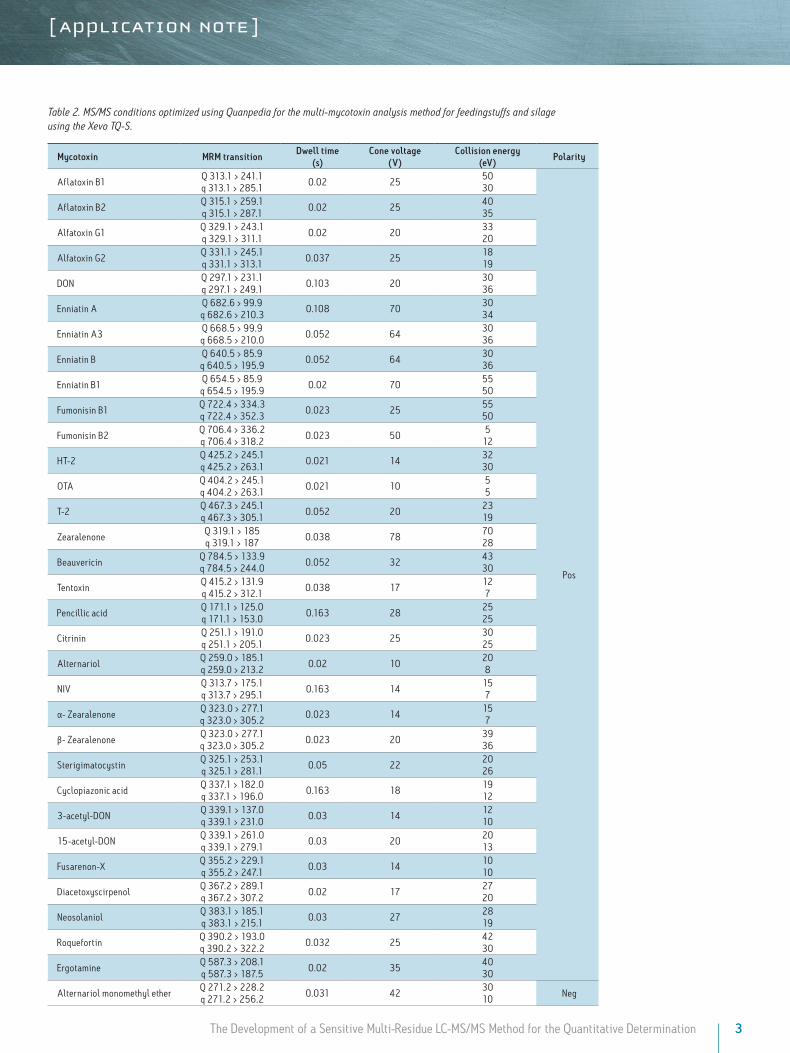
Table 2. MS/MS conditions optimized using Quanpedia for the multi-mycotoxin analysis method for feedingstuffs and silage using the Xevo TQ-S.

4The Development of a Sensitive Multi-Residue LC-MS/MS Method for the Quantitative Determination
Figure 1 shows the MRM transitions and automated time window scheduling functionality to obtain a minimum
of 12 points across each chromatographic peak generated by Quanpedia. This method is available in the
Quanpedia database.
Figure 1. MRM transitions for 33 mycotoxins (in ESI + and - modes) and automated time window scheduling functionality generated by the Quanpedia Database.

5The Development of a Sensitive Multi-Residue LC-MS/MS Method for the Quantitative Determination
R E SU LT S A N D D IS C U S S IO N
The feed and silage samples were analyzed as neat and diluted extracts and quantified against either solvent
or matrix matched standards (as available). As anticipated, the matrix interference profile was found to be
highly complex and variable between samples as determined via the RADAR functionality. Figure 2 shows
the LC-MS/MS spectra obtained for a neat extract of a porcine feed. The Base Peak Intensity (BPI) spectrum
obtained in full scan mode and the simultaneously acquired MRM transitions for five mycotoxins identified
in the sample (displayed in the Figure inset) were found to elute in a region of high matrix background. The
presence of high concentrations of matrix background can result in variable ion suppression effects for
the analytes of interest and can affect the overall analytical performance. For this reason, matrix matched
calibrants, standard addition, and isotopically labelled internal standards are approaches typically used for
the quantitative analysis of mycotoxins in complex matrices to overcome the matrix effects and improve the
quantitative accuracy and precision.
Figure 2. Base peak intensity (BPI) chromatogram obtained for naturally contaminated porcine feed extract showing the background matrix profile monitored in full scan mode (MS function 2, RADAR) and the MRM transitions (MS function 1) for fumonisins B1 and B2 and enniatins A, A1, B, and B2.

6The Development of a Sensitive Multi-Residue LC-MS/MS Method for the Quantitative Determination
In this study, we investigated the use of a simple dilution step coupled to the enhanced sensitivity of the Xevo
TQ-S to reduce the matrix contribution and improve measurement repeatability and accuracy between different
sample types. Table 3 shows the repeatability data obtained for six different extracts of feed spiked with six
mycotoxins diluted 1:10 prior to injection. The intra-day method precision (expressed as %RSD) was found to
be good at less than 23% for all the spiked mycotoxins.
The same dilution factor (1:10) was also applied to a wider selection of feedingstuffs (12) and silage (10)
sample extracts and analyzed according to the optimized Xevo TQ-S conditions monitoring for 33 mycotoxins
and quantified against an appropriate calibration series. Figure 3 shows the TargetLynx report generated
showing the linearity and sensitivity of the method and calculated concentrations for the unknown samples.
Figure 3. TargetLynx report showing linearity and sensitivity of standards down to 0.25 µg kg for fumonisin B2 using the Xevo TQ-S.
Table 3. The repeatability data generated for a selection of six mycotoxins spiked into to a variety of different animal feeds (n=6), the extracts were diluted 1:10 prior to analysis on the Xevo TQ-S.
Feed Type Measured concentration in animal feed extract diluted 1:10 (ng/g)*
Enniatin A Enniatin A1 Enniatin B Enniatin B1 Fumonisin B1 Fumonisin B2
Maize Gluten 305.9 165.6 48.0 86.1 14.0 17.1
Pig feed 275.5 160.5 43.6 56.5 17.0 17.5
Rye 258.5 136.1 61.8 62.1 18.7 19.3
Oats 221.9 115.5 41.4 62.0 22.7 20.1
Sunflower seed 197.4 117.7 48.2 77.1 13.0 13.2
Cattle feed 193.9 102.2 32.0 51.3 14.0 14.8
Mean 242.2 133.0 45.8 65.9 16.6 17.0
SD 45.1 25.7 9.8 13.1 3.7 2.6
%RSD 19 19 21 20 22 15
*Mycotoxins spiked into feed samples prior to extraction

7The Development of a Sensitive Multi-Residue LC-MS/MS Method for the Quantitative Determination
Tables 4 and 5 show the measured concentrations of the mycotoxins identified (monitoring two MRM
transitions) in naturally contaminated feeds and silage samples, respectively along with the calculated
LODs (S:N of ≥1:3). The LOD values were found to be in the ppt to low ppb range in both solvent and matrix
for all the mycotoxins identified. The naturally contaminated feed samples were found to contain multiple
mycotoxins ranging from 3 to 12 of the 33 potential mycotoxins monitored for and estimated to be present at
concentrations equivalent sub-1 to circa 300 μg kg -1. The method was considered to be suitable for use as a
highly sensitive presence/absence screen as the contaminant concentrations were determined against a solvent
standard calibration series, therefore matrix effects may still affect the quantitative performance.
*Concentration determined against a solvent calibration series.
Table 4. The measured concentrations for a range of mycotoxins identified using two MRM transitions in 12 different samples of animal feedingstuffs diluted 1:10 prior to analysis on the Xevo TQ-S.
MycotoxinLOD
(ng/g)
Measured concentration in animal feed extract diluted 1:10 (ng/g)*
Animal feed sample identity and type
U1 / cattle feed
U2 / pig feed
U3 / maize gluten
U4 / Diva L vital
pig feed
U5 /Alpha maximal pig feed
U6 / rye
U7 / barley
U8 / wheat
U9 / oats
U10 / maize
U11 / sunflower
oil
U12 / pig feed
15-acetyl-deoxynivalenol 0.50 nd nd 152.8 nd nd nd 13.2 33.4 nd nd nd nd
Aflatoxin B1 0.05 nd nd nd nd nd nd nd nd nd nd 0.2 nd
Aflatoxin B2 0.05 nd nd 0.8 nd nd nd nd nd nd nd 0.1 nd
Aflatoxin G1 0.05 nd nd nd nd nd nd nd nd nd nd 0.1 nd
Aflatoxin G2 0.05 0.3 nd nd nd nd nd nd nd nd nd nd nd
Alternariol 0.06 nd 3.2 nd nd nd 5.3 nd nd 7.6 2.6 10.0 nd
DON 0.13 nd 21.2 283.6 13.2 18.4 nd nd nd 4.8 nd 0.3 nd
Enniatin A 0.10 59.3 6.3 1.4 15.7 39.9 9.7 11.7 0.4 3.2 nd nd 50.5
Enniatin A1 0.10 148.6 17.1 3.2 40.1 19.0 14.2 34.1 0.5 4.9 nd nd 122.4
Enniatin B 0.10 125.2 43.3 5.8 65.3 53.3 92.8 52.9 0.4 9.0 nd nd 116.1
Enniatin B1 0.10 263.0 41.8 5.5 72.1 32.3 42.8 64.0 0.5 9.9 nd nd 238.2
Fumonisin B1 0.10 0.3 0.7 18.9 nd 4.0 nd nd nd 0.4 92.8 nd 1.7
Fumonisin B2 0.10 0.1 nd 3.1 nd 0.8 nd 0.2 nd nd 16.0 nd 0.3
HT-2 Toxin 0.25 nd nd nd nd nd nd nd nd 3.9 nd nd nd
Ochratoxin A 0.06 0.1 nd nd 0.1 nd 0.2 2.8 nd nd nd nd 0.1
Roquefortine 0.10 nd 0.3 0.3 0.2 0.1 nd nd nd nd nd nd nd
Sterigmatocystin 0.10 nd 0.1 0.4 0.2 nd 10.7 nd nd nd nd 0.1 0.2
Zearalenone 0.20 nd 1.6 84.0 nd 4.9 31.2 nd 6.1 nd nd nd nd
Number of mycotoxins found 8 10 12 8 9 8 7 6 8 3 6 8
8The Development of a Sensitive Multi-Residue LC-MS/MS Method for the Quantitative Determination
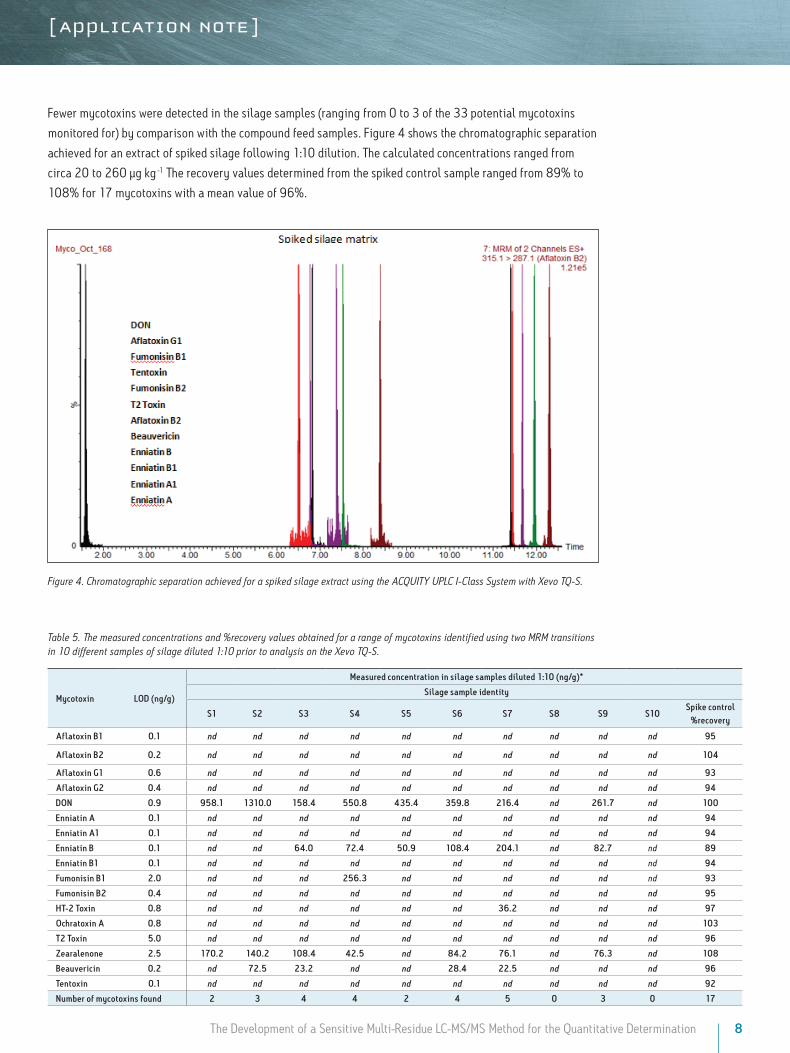
Fewer mycotoxins were detected in the silage samples (ranging from 0 to 3 of the 33 potential mycotoxins
monitored for) by comparison with the compound feed samples. Figure 4 shows the chromatographic separation
achieved for an extract of spiked silage following 1:10 dilution. The calculated concentrations ranged from
circa 20 to 260 μg kg -1 The recovery values determined from the spiked control sample ranged from 89% to
108% for 17 mycotoxins with a mean value of 96%.
Figure 4. Chromatographic separation achieved for a spiked silage extract using the ACQUITY UPLC I-Class System with Xevo TQ-S.
Table 5. The measured concentrations and %recovery values obtained for a range of mycotoxins identified using two MRM transitions in 10 different samples of silage diluted 1:10 prior to analysis on the Xevo TQ-S.
Mycotoxin LOD (ng/g)
Measured concentration in silage samples diluted 1:10 (ng/g)*
Silage sample identity
S1 S2 S3 S4 S5 S6 S7 S8 S9 S10Spike control
%recovery
Aflatoxin B1 0.1 nd nd nd nd nd nd nd nd nd nd 95
Aflatoxin B2 0.2 nd nd nd nd nd nd nd nd nd nd 104
Aflatoxin G1 0.6 nd nd nd nd nd nd nd nd nd nd 93
Aflatoxin G2 0.4 nd nd nd nd nd nd nd nd nd nd 94
DON 0.9 958.1 1310.0 158.4 550.8 435.4 359.8 216.4 nd 261.7 nd 100
Enniatin A 0.1 nd nd nd nd nd nd nd nd nd nd 94
Enniatin A1 0.1 nd nd nd nd nd nd nd nd nd nd 94
Enniatin B 0.1 nd nd 64.0 72.4 50.9 108.4 204.1 nd 82.7 nd 89
Enniatin B1 0.1 nd nd nd nd nd nd nd nd nd nd 94
Fumonisin B1 2.0 nd nd nd 256.3 nd nd nd nd nd nd 93
Fumonisin B2 0.4 nd nd nd nd nd nd nd nd nd nd 95
HT-2 Toxin 0.8 nd nd nd nd nd nd 36.2 nd nd nd 97
Ochratoxin A 0.8 nd nd nd nd nd nd nd nd nd nd 103
T2 Toxin 5.0 nd nd nd nd nd nd nd nd nd nd 96
Zearalenone 2.5 170.2 140.2 108.4 42.5 nd 84.2 76.1 nd 76.3 nd 108
Beauvericin 0.2 nd 72.5 23.2 nd nd 28.4 22.5 nd nd nd 96
Tentoxin 0.1 nd nd nd nd nd nd nd nd nd nd 92
Number of mycotoxins found 2 3 4 4 2 4 5 0 3 0 17
Waters Corporation 34 Maple Street Milford, MA 01757 U.S.A. T: 1 508 478 2000 F: 1 508 872 1990 www.waters.com
AcknowledgmentsRIKILT, Institute of Food Safety, Wagnenigen, The Netherlands and
the Ghent University, Ghent, Belgium for the provision of the animal
feed and silage extracts and analytical standards.
References
1. World-grain news website accessed on 29th October 2012: http://www.world-grain.com/News/News%20Home/Features/2011/6/Mycotoxins.aspx?cck=1
2. EC Commission Directive 2003/100/EC (2003) Official Journal of the European Union L285 33-37.
3. EC Commission Recommendation 2006/576/EC (2006) Official Journal of the European Union L229 7-9.
4. EFSA website accessed on 29th October 2012: http://www.efsa.europa.eu/en/topics/topic/mycotoxins.htm
5. FSA website accessed on 29th October 2012: http://www.food.gov.uk/policy-advice/mycotoxins/animalfeed/
6. G J Mol, P Plaza-Bolanos, P Zomer, T C de Rijk, A A M Stolker, and P Mulder. Anal Chem. 80: (24) 9450-9459, 2008.
CO N C LU S IO NS■■ A quantitative LC-MS/MS method applicable for the
simultaneous determination of 33 mycotoxins in animal
feedingstuffs and silage has been developed with the Waters
ACQUITY UPLC I-Class System coupled to the Xevo TQ-S using
the Quanpedia database.
■■ Due to the enhanced sensitivity of the TQ-S instrument it has
been possible to incorporate a simple extract dilution step prior
to analysis to reduce the complex matrix effects associated
with these challenging samples and achieve good method
repeatability and accuracy.
■■ The observed intra-day repeatability (%RSD) was found to be
≤22%, and the mean recovery for 17 mycotoxins in silage
was found to be 96%.
■■ The optimized method has been used to identify the presence
and determine the concentrations of a range of mycotoxins
present in a wide variety of samples.
Waters, ACQUITY UPLC, Xevo, UPLC, and T he Science of What’s Possible are registered trademarks of Waters Corporation. RADAR, TargetLynx, and Quanpedia are trademarks of Waters Corporation. All other trademarks are the property of their respective owners.
©2014 Waters Corporation. Produced in the U.S.A. March 2014 720004961EN AG-PDF