the development and pilot testing of a culturally
TRANSCRIPT

THE DEVELOPMENT AND PILOT TESTING OF A CULTURALLY APPROPRIATE DIETARY
ASSESSMENT TOOL FOR LATINO ADOLESCENTS
by
LESLIE M. RODRIGUEZ
(Under the Direction of Mark Wilson)
ABSTRACT
There have been very few dietary assessments that have been developed and tested specifically
for Latino adolescents, who have very different eating habits than White adults. This study
developed a modified picture sort food frequency questionnaire (P-S FFQ) for use with this
population and examined its validity by comparing mean values of nutrient intakes from the
questionnaire to three, 24-hour recalls and its test-retest reliability. Validity correlation
coefficients ranged from 0.206 for saturated fat to 0.459 for carbohydrates, with 3 statistically
significant values (P<.05). Following log transformation, reliability correlation coefficients
ranged from .478 for carbohydrates to .720 for cholesterol, and all values were statistically
significant (P<.01). The tool shows promise for assessing the diets of minority adolescents but
may require modifications, such as adapting it to a computer based program, in order to be most
effective.
INDEX WORDS: Latino adolescents, dietary assessment, test-retest reliability, validity, food
frequency questionnaire, twenty four hour recall, picture sort

THE DEVELOPMENT AND PILOT TESTING OF A CULTURALLY APPROPRIATE
DIETARY ASSESSMENT TOOL FOR LATINO ADOLESCENTS
by
LESLIE M. RODRIGUEZ
B.S., The University of Georgia, 1998
A Thesis Submitted to the Graduate Faculty of The University of Georgia in Partial Fulfillment
of the Requirements for the Degree
MASTER OF ARTS
ATHENS, GEORGIA
2004

© 2004
Leslie M. Rodriguez
All Rights Reserved

THE DEVELOPMENT AND PILOT TESTING OF A CULTURALLY APPROPRIATE
DIETARY ASSESSMENT TOOL FOR LATINO ADOLESCENTS
by
LESLIE M. RODRIGUEZ
Major Professor: Mark Wilson
Committee: Rebecca Mullis Pamela Orpinas
Electronic Version Approved: Maureen Grasso Dean of the Graduate School The University of Georgia December 2004

iv
DEDICATION
This thesis is dedicated to my mother, Rosa Castillo, who was the best and most
supportive mother that ever lived. The immense love that she showed me during her short life on
earth will be enough to last me a lifetime.

v
ACKNOWLEDGEMENTS
I would like to thank Dr. Rebecca Mullis and Dr. Marilyn Hughes who really pushed me
to go back to graduate school. Without their support and encouragement, this would have been a
much more difficult journey. I would also like to thank Dr. Mark Wilson, who must be as tired
of looking at this thesis as I will be by the time it is all over. Finally, thank you to the teachers
and students of Gainesville Middle School, who were always so helpful and patient.

vi
TABLE OF CONTENTS
Page
ACKNOWLEDGEMENTS.............................................................................................................v
LIST OF TABLES....................................................................................................................... viii
LIST OF FIGURES ........................................................................................................................ x
CHAPTER
CHAPTER
1 BACKGROUND ...........................................................................................................1
2 MATERIALS AND METHODS ...................................................................................4
Study Population .......................................................................................................4
Demographic Data and Anthropometrics..................................................................7
Picture Sort Food Frequency Questionnaires ............................................................7
24-Hour Recalls.........................................................................................................9
Statistics...................................................................................................................10
3 RESULTS ....................................................................................................................12
4 DISCUSSION..............................................................................................................18
5 SUMMARY AND FUTURE APPLICATIONS .........................................................25
REFERENCES ..............................................................................................................................27
APPENDICES ...............................................................................................................................29
A Human Subjects Form..................................................................................................29
B Consent Forms in Spanish and English .......................................................................32

vii
C List of all foods recalled in focus groups.....................................................................37
D Protocol for P-S FFQ administration ...........................................................................40
E Food Frequency Questionnaire ....................................................................................48
F Sample of a Picture Sort Card......................................................................................64
G Multiple Pass Approach to 24-hour recall ...................................................................66
H 24-hour recall form ......................................................................................................71
I BMI-for-age percentile for boys ..................................................................................73
J BMI-for-age percentile for girls...................................................................................75

viii
LIST OF TABLES
Page
Table 1: New foods placed on existing cards or in existing categories .........................................12
Table 2: Children’s anthropometric characteristics .......................................................................13
Table 3: Children’s acculturation characteristics...........................................................................13
Table 4: Daily total intake as assessed by the mean of three 24-hour recalls and one
administration of the P-S FFQ.......................................................................................14
Table 5: Pearson correlation coefficients between intakes from one administration of a P-S FFQ
and the mean of three, 24-hour recalls before and after loge transformation of nutrient
data. ...............................................................................................................................15
Table 6: Pearson correlation coefficients between BMI and intake from one administration of a
P-S FFQ and the mean of three 24-hour recalls before and after loge transformation of
nutrient data .................................................................................................................16
Table 7: Daily total intake as assessed by two administrations of the P-S FFQ............................16
Table 8: Pearson Correlation Coefficients between the first and second administration of a P-S
FFQ before and after loge transformation of data..........................................................17

ix
LIST OF FIGURES
Page
Figure 1: Overview of project phases ..............................................................................................6

1
CHAPTER 1
BACKGROUND
Diet researchers have designed and tested several dietary assessment methods, but each
method has unique advantages and disadvantages. Dietary research techniques need to be
improved and standardized (Guenther, 1994). Moreover, researchers need to ensure that dietary
assessment tools work well with diverse populations, minimize respondent burden, and yield
accurate results. Dietary interviews/questionnaires could be better suited for younger
populations, and better portion estimation methods would also be useful, because this concept is
often difficult for children. Finally, there is also a need to establish more long-term dietary
averages/usual intakes, rather than just using 24-hour recalls (Guenther, 1994).
An area that needs special attention is data collection methods that can be used with
minority children. Most dietary assessment tools have been developed and tested using White
adults as their study population. There have been very few dietary assessments that have been
developed and tested specifically for Latino adolescents, who may have very different eating
habits than White adults.
Collecting dietary data from culturally diverse populations needs further research because
of all the complex factors that shape individuals’ diets and the minimal amount of research to
date. For example, among Latino populations, the amount of time they have spent in the United
States (acculturation), present age and age when emigrated to United States, whether or not they
live in Latino neighborhoods, and presence of an individual who prepares food in the home in a
traditional (based on typical Latino diet) or non-traditional (more American style foods) manner

2
all play a tremendous role in shaping their eating habits (Molina, Zambrana, & Molina, 1994).
Latinos’ eating habits have some very distinct characteristics, such as high consumption of rice,
beans, fruits, and vegetables, but after spending an extended period of time in the United States,
Latinos’ diets may begin to change drastically, moving towards more traditional American fare
(Romero-Gwynn & Gwynn, 1997). Research techniques need to be improved and standardized
in order for them to work well in diverse populations. This issue is further compounded when
researchers take into account that Latino diets vary because of their ethnic backgrounds and
subgroups (Mexican, Colombian, Cuban, etc.), but also by their varying degrees of acculturation.
Obviously, culture dictates a great deal of individuals’ eating habits, but it is also the
medium by which people interpret the intent of all types of questions, including questions
regarding dietary intake. If the individuals who design questionnaires have the same background
as respondents, they will design it in a way that the respondents would be able to better interpret.
However, researchers of different backgrounds may possess a different cultural lens than the
study’s target group. The result may be an increase in miscommunications and decreased
validity of the data (Teufel, 1997).
The Food Frequency Questionnaires that are most commonly used are the Health Habits
and History Questionnaire and Harvard Diet Assessment Form and variations of each. Both of
these questionnaires were validated with groups of mostly Caucasian women in urban and
suburban areas of United States. Their cultural and ethnic backgrounds were often not reported.
Therefore, one cannot say if they are valid with culturally diverse/distinct populations (Teufel,
1997). In order to increase FFQs validity, it is essential to collect prior dietary data from a
sample of the study population before beginning dietary data collection. There is a great deal of
variability in the daily eating pattern of individuals and especially the pattern of individuals of

3
different ethnicities, and by testing a subgroup of the study population, more of the sample’s
typical foods and portion sizes can be incorporated into a FFQ (Hankin & Wilkens, 1994).
The dietary collection methods that may be best suited for minority populations with
distinct diets are 24-hour recalls and food records. These methods have a similar advantage:
respondents have the ability to describe their own diets without a pre-established list of foods
from which to choose. Therefore, they are able to include cultural foods as well as American
foods and indicate their typical portion sizes. All three methods also may use visual aids,
including posters measuring cups and spoons, and 3-D food models, to help estimate portion
sizes. Twenty four-hour recalls do, however, have an advantage over food records when used
with low-literate populations: the ability to use an interview format in place of a paper and pencil
version (Kumanyika, Shemanski, Tell, Martel, & Chincilli, 1997). However, there still remains
a need for dietary assessment methods that can be used with Hispanic children. The tool must be
age and culturally appropriate, include food indigenous to Latinos, and overcome language and
literacy barriers.
The purpose of this study was to develop and assess the validity and reliability of the
scores of a modified picture-sort food frequency questionnaire designed for bilingual Hispanic
middle school students. More specifically, the objectives were to: (1) examine the criterion
validity of the scores a modified Picture Sort Food Frequency Questionnaire among Latino
adolescents and (2) evaluate the test-retest reliability of the scores for two administrations of a
modified Picture-Sort Food Frequency Questionnaire for Latino adolescents, conducted two
weeks apart.

4
CHAPTER 2
MATERIALS AND METHODS
Study Population
After all procedures were approved by the Institutional Review Board for Human
Subjects at the University of Georgia (Appendix A), a total of 139 Hispanic/Latino middle
school students were recruited to participate in this two phase study. The convenience sample of
adolescents came mostly from Gainesville Middle School in Hall County, Georgia, which had an
enrollment of approximately 868 students, 39% of which were of Hispanic/Latin origin. In
addition, approximately 69% of the total students were eligible for free or reduced price lunch,
which indicated that a substantial portion of the population was low-income. The school had an
after school program that took place on campus, which had approximately 60 Latino participants.
This group was ideal for data collection because they were of Latino origin and were available
after school hours. Additionally, students were recruited from the school during their last period,
and some students were also recruited from other sources, such as other middle schools in the
area and the local Boys and Girls Club.
Project staff visited parents’ night at the school on two occasions to inform the group
about the study and get their permission to allow their children’s participation. For each parent
who signed a (bilingual) permission form (Appendix B), their child was also asked to sign an
assent form, and the children were paid upon completing the phase of the study for which they
were recruited.

5
Thirty-nine of the children participated in Phase I, Development, (Figure 1) which
included focus groups and 24-hour recalls that formulated the Picture Sort (P-S) tool and pilot
testing of the new tool. At this point, any necessary modifications were made to the tool. This
phase took place over a two month time period. Nineteen students participated in two focus
groups, and ten other students were interviewed to determine the foods/drinks that were most
commonly being consumed and recognizable brand names for these items among the
Hispanic/Latino students (Appendix C). Once the Picture Sort Food Frequency Questionnaire
(P-S FFQ) was developed from these data, the tool was pilot tested for feasibility among 10
children.
One hundred students participated in Phase II, P-S Tool Testing, which involved
administering 24 hour recalls and the newly developed P-S FFQ to students in order to test the
method for reliability and validity. Students also answered demographic questions and had their
height and weight measured. This phase was the main study, which involved a data collection
period that lasted approximately six months, where validity and reliability were evaluated
separately. Fifty students participated in validity testing (three 24-hour recalls and one
administration of the P-S FFQ) and an additional 50 students participated in reliability testing
(two administrations of the P-S FFQ). Separate samples for validity and reliability helped
minimize the overall number of dietary assessments per child, which lessened potential bias.
For validity, students completed three 24-hour recalls over a two week time period and a single
administration of the P-S FFQ at the end of the two weeks. The FFQ administration took place
after the recalls to provide overlapping time frames, which yielded a more appropriate
comparison. Upon the first meeting with students when the first recall was completed, they were
also asked a few basic demographic questions, including the amount of time they had lived in the

6
United States. They also had their heights and weights measured once. Of the 50 potential
informants, 9 (18%) were unavailable on the days when anthropometric assessments were
conducted and 1 (2%) did not answer how long he/she had lived in the United States.
For reliability, adolescents completed the first administration of the P-S FFQ and a brief
survey on demographic information, as well as had their heights and weights measured. Two
weeks later, they completed a second P-S FFQ. Of the potential 50 informants from this group, 1
(2%) student’s data set was not spaced out more than 2 weeks, 1 (2%) student did not report
length of time in the United States, and 10 (20%) were not available when height and weight
were measured.
Development of FFQ (from focus group and single, 24-
hour recall data)
Figure 1. Overview of project phases
Phase I: Development
Pilot Test P-S FFQ
Phase II: P-S Tool Testing
Validity of P-S FFQ Test retest reliability of P-S FFQ
1st 24-hour recall, demographic info, height and weight
1st P-S FFQ, demographic info, height and weight
2 additional 24 hour recalls
P-S FFQ administered two weeks after first
recall
2nd P-S FFQ 2 weeks later

7
Demographic Data and Anthropometrics
Children were also asked how long they had lived in the United States and the language
they spoke at home in order to establish some proxy measures for acculturation. Latinos who
prefer Spanish are thought to be less acculturated than Latinos who speak English. Language
based scales are used because linguistic factors account for more than 70% of the variance in
acculturation scores (Aguirre-Molina & Molina, 1994). Length of time in the U.S. (more
acculturation) has been linked to increasing rates of overweight and obesity in Hispanic
populations. Studies have indicated that this could be due in part to the deterioration of the
typical Hispanic diet (Romero-Gwynn & Gwynn, 1997).
In accordance with Lohman, Roche, and Martorell (1988), height was measured to the
nearest inch using a Seca-brand stadiometer and weight was measured to the nearest pound using
a calibrated standard scale. The inches and pounds were converted to Body Mass Index via the
following formula: (lbs/ (in2))*703. According to the National Health and Nutrition
Examination Survey data, BMI is gender and age specific, and therefore, values for children
should be plotted on the “Body mass index-for-age percentile” growth charts. Using this
methodology, overweight status for children ages 2-20 is defined as having a BMI greater than or
equal to the 85th percentile for age and sex.
Picture Sort Food Frequency Questionnaires
To begin the P-S FFQ administration procedure (Appendix D) with each student, a
trained interviewer read five summary questions and their corresponding multiple choice
responses from the original 1992 HHHQ aloud to the participant and recorded his/her responses
on the data collection sheet (Appendix E). These questions asked about dietary patterns of the
child, including fat most commonly used, low-fat foods regularly consumed, and fruit and

8
vegetable consumption. This information was used in the calculations of daily energy and
nutrient intakes. In addition, the children were asked about the frequency of consumption of fast
foods and other foods prepared outside the home.
Next, the adolescents sorted the food and drink cards (Appendix F), which was a two step
process. The first step involved the child working independently to place each of the cards into
different piles corresponding to his/her frequency of consumption over the previous two weeks.
The categories for foods were: never in 2 weeks, 1 time in 2 weeks, 2-3 times in 2 weeks, 4-5
times in 2 weeks, 6-8 times in 2 weeks, 10-12 times in 2 weeks, 12-14 times in 2 weeks
(approximately 1 per day), and 14+ times in 2 weeks. For drinks, the categories were as follows:
never in past 2 weeks, 1 time in 2 weeks, 2-3 in 2 weeks, 4-8 times in 2 weeks, 10-12 times in 2
weeks, 14 times in 2 weeks (1 per day), 2-3 per day in 2 weeks, 4-5 per day in 2 weeks , and 6+
per day in 2 weeks.
In the next step, the interviewer confirmed frequencies by going through each stack of
cards and reading back each food/drink to the child to verify they were in the correct pile and
moved cards to different stacks when necessary. At this time, the interviewer also reviewed each
of the multi-component cards (those with more than one food listed) in order to ensure that the
student had considered each of the foods and placed it in the correct frequency stack. While
confirming frequencies, the interviewer also obtained portion sizes for each food and drink.
Each card had a “medium” portion size of the corresponding food/drink depicted on the back,
which the interviewer revealed as he/she reviewed the cards with the student. Measuring cups
and other visual aids were used to further aid the participants with portion sizes for each item.
The interviewer asked the child if his/her portion of the food/drink consumed was “smaller,” “the
same size,” “a little larger,” or “a lot larger” than the medium portion depicted. Each frequency

9
category had 4 envelopes that corresponded to these portion sizes. The “never in 2 weeks” stack,
however, only had one envelope, since no portion sizes were needed. The interviewer placed the
card on the one envelope that corresponded to the portion size indicated. Cards were stored in
the envelopes corresponding to their frequency and portion size until they were coded.
24-hour Recalls
The 24-hour recalls were administered using Minnesota Nutrition Data System’s (NDS;
version 2.6, 1993, Food database version 8A, Nutrient database version 23; Nutrition
Coordinating Center, University of Minnesota, Minneapolis) multiple pass approach interview
methodology (Appendix G), in order to most accurately report foods eaten and corresponding
portion sizes. The format began with the interviewer gathering general information from the
respondent about the previous day’s meals and snacks. Then, more specific information, such as
brand names, preparation techniques, ingredients, and portion sizes were obtained. A food
portion visual poster depicting two dimensional food models drawn to scale had been developed
by NDS and was used to help the adolescents best determine portion sizes. Next, the interviewer
continued to probe for missing foods and drinks. Finally, the interviewer repeated back all foods
and drinks and corresponding portion sizes recalled by the subject to ensure there had been no
miscommunication or missing/forgotten foods/drinks. Paper and pencil versions of the 24 hour
recalls (Appendix H) were used for data collection, along with NDS prompts, which were later
inputted into the NDS system to be analyzed.
Recalls were randomly reviewed in order to ensure that the highest quality and most
detailed data available were being collected. If there was missing information from any
reviewed recall, the problem was immediately addressed and corrected. In addition, data
10
collection was observed on random occasions to ensure that the interviewers were following
protocol (using the multiple pass approach, not asking leading questions, etc.).
The students were not be notified in advance as to when recalls would be conducted. To
account for diversity in eating habits, researchers attempted to collect recalls for two weekdays
and one weekend for each child. However, researchers were not granted access to children on
Mondays at the school because of scheduling conflicts. Three, 24-hour recalls provided a more
stable estimate of the individual consumption pattern of the children and enabled an estimate of
the within subject variability of the 24-hour recalls for comparison among children. In order to
obtain the most accurate and precise data from the 24-hour recalls, food portion visuals, such as
NASCO food models and a poster picturing standardized portions supplied by NDS, were used.
Additionally, project staff collected school breakfast, lunch, and after-school snack menus to
help prompt children who could not recall the previous day’s consumption.
Statistics
Criterion validity was evaluated by comparing the mean daily energy (calories) and
nutrient intake values (macronutrients and micronutrients) from a P-S FFQ with those obtained
from the mean of the three 24-hour recalls. Descriptive analyses were conducted to assess the
basic characteristics of the data collected overall and within subgroups of age and gender. First,
the overall correlation between energy and nutrients from the P-S FFQ and mean of the three 24-
hour recalls were computed. The correlation coefficients were used because the average
number of kcal (energy) is heavily dependent on the length of the FFQ, with longer FFQ yielding
higher kcal estimations, because they provide a most extensive list of foods to choose from, as
opposed to using shorter FFQ, which can lead to underreporting. These correlation coefficients,
therefore, aided in determining if the questionnaire is invalid or if the technique itself is what

11
over or underestimated the selected values. If only differences between the means of the 24-hour
recalls and FFQs were examined, this specific information would not be obtained.
Next, for each of the students participating in the validity study, daily mean energy,
protein, carbohydrate, fat, percent energy from fat, saturated fat, and selected micronutrient
values from the one FFQ and the three 24-hour recalls was exported into SPSS. To test the
validity of the P-S FFQ, the above listed macro and micronutrients from the FFQ were compared
with the mean values from the recalls. After the data had been checked for outliers (defined as
daily intake of less than 500 or more than 10,000kcal/day), energy and nutrient values were
natural-log (loge) transformed to improve the normality of the data. In addition, nutrients from
the P-S FFQ and recalls were adjusted for total energy intake using the regression method of
Willett and Stampfer (1986).
Third, additional validity comparisons were conducted to assess the relationships
between intake and Body Mass Index (BMI). BMI for age was plotted for each student on
percentile charts for his/her respective gender (Appendices I & J). Past studies have found that
overweight subjects are more likely to underreport intake. However, from a construct validity
perspective, FFQs have been found to be related to BMIs (Yanek, Moy, & Becker, 2001).
Moreover, higher BMIs are expected to be associated with higher energy and fat intakes.
Lastly, for each of the students completing the reliability study, selected macro and
micro-nutrient values from the two P-S FFQs were exported into the SPSS database. These
values were compared. Then, the values were checked for outliers, energy and nutrient values
were natural-log transformed, and nutrients were energy-adjusted. This generated new
correlation coefficients between the two administrations of the FFQs.

12
CHAPTER 3
RESULTS
Following Phase I, the P-S FFQ was modified to capture missing foods/drinks most
commonly identified during focus groups and 24-hour recalls. The foods added to the FFQ were
indicated by more than 3 focus group participants and appeared on 2 or more recalls. In some
instances, there were existing cards that depicted foods similar to those mentioned, and in this
case, the additional food was simply added to the existing card (Table 1). In other cases, the new
food/drink was completely new and a unique card had to be developed. These foods and drinks
were placed into existing categories on the P-S FFQ (Table 1).
Table 1. New foods placed on existing cards or in existing categories New Food Foods on Existing Card or Category Meatballs and Picadillo (ground beef dish)
Hamburger, cheeseburger, meatloaf, sloppy joe
Ceviche (fish cooked in lime juice) Fish, broiled or baked Maruchan brand instant soup Ramen noodles Flour tortillas White bread, bagels, crackers, burger rolls, etc. Corn tortillas Corn bread, corn muffins Queso fresco (soft cheese) Block cheeses, cheese slices, and cheese spreads Tomatillos/green tomatoes Tomatoes, tomato juice Churros Doughnuts, cookies, cakes, pastry, etc. Mango, canned and fresh Fruits Fried plantains Fruits Refried beans made with lard Vegetables Mole Miscellaneous Mixed rice dishes with meat, such as rice and chicken, fried rice, etc.
Mixed Dishes
Tamales Mixed Dishes Tortas Mixed Dishes Other soups, such as menudo and pozole Soups Sweet bread Snacks, breads, and others Avocado/guacamole Vegetables Flan Sweets Rice Pudding Sweets

13
The ages of Phase II participants ranged from 11-17 years (mean=13 +1.1 years). BMI
values for the study participants ranged from 15.6 to 40.3 (mean=23.8+5.2), and when plotted on
the appropriate growth charts, 39 students (53%) were overweight (>85th percentile). The
children’s anthropometric characteristics are depicted in Table 2.
Table 2. Children’s anthropometric characteristics BMI for age Percentiles Gender Age
Mean + standard deviation
BMI Mean + standard deviation
>85th >50th and
<85th
<50th Male
Female
All (N=73)
13 + 1.1 23.8 + 5.2 39 (53%)
25 (34%)
9 (12%)
38 (52%)
35 (48%)
Validity Group (n=35)
12.7 + 1.0 24.0 + 6.2 19 (54%)
12 (34%)
4 (11%)
21 (60%)
14 (40%)
Reliability Group (n=38)
13.3 + 1.2 23.7 + 4.2 20 (53%)
13 (34%)
5 (14%)
17 (44%)
21 (55%)
Children were also asked how long they had lived in the United States and the language
they spoke at home in order to establish some proxy measures for acculturation. Of the 89
children who had responded to these questions, 37 (51%) had lived in the United States for one
year or less. The average number of years the children had lived in the United States was
4.02+4.83 (Table 3).
Table 3. Children’s acculturation characteristics Home Language Number of
Years in the US Mean + standard
deviation
English Number (Percent)
Spanish Number (Percent)
Both Number (Percent)
All participants (N=73) 4.02+4.83 0 61 (84%)
12 (16%)
Validity participants (n=35)
2.34+3.86 0 28 (80%)
7 (20%)
Reliability participants (n=38)
5.47+5.24 0 33 (87%)
5 (13%)

14
Only one of the 73 students who indicated a home language preference, none said that
English was spoken in his/her home. Sixty-one students (84%) spoke primarily Spanish at home
and the remaining 12 students (16%) responded that both Spanish and English were spoken in
their homes (Table 4).
Of the 35 students who completed all portion of the validity study (three 24-hour recalls,
one P-S FFQ, height and weight measurements, and demographic questionnaire), 7 students had
outlying values (>10,000 kcal) reported on their FFQ. Therefore, their data was eliminated
before correlation coefficients were established. When average daily intake was calculated using
the three recalls, students reported eating 1498.68 + 480.92 calories (kcal) per day (Table 4).
The P-S FFQ yielded higher reported intakes daily intakes (4412.56 + 2104.86 kcal).
When the mean values from the recalls were compared to those from the P-S FFQ using
Pearson Correlations, there were three significant correlations: calories, fat, and carbohydrates.
Other correlations were not statistically significant, ranging from .206 for saturated fat to .361
for protein (Table 5). In addition, data was natural log transformed to improve its normality,
since the nutrient values varied so greatly. Because the sample size was small, and there were
many very high numbers reported, the log transformation helped to account for and correct this
Table 4. Daily total intake as assessed by the mean of three 24-hour recalls and one administration of the P-S FFQ (n = 27)
24-hour Recalls Mean + standard deviation
P-S FFQ Mean + standard deviation
Energy (kcal) 1498.68 + 480.92 4412.56 + 2104.86 Carbohydrate (g) 200.12 + 63.77 489.89 + 244.46 Protein (g) 57.09 + 19.96 173.81 + 96.50 Fat (g) 53.80 + 20.84 193.72 + 95.84 Saturated Fat (g) 18.69 + 8.22 65.98 + 33.91 Cholesterol (mg) 173.52 + 107.06 690.84 + 460.12

15
problem. After loge transformation, protein was also shown to have a statistically significant
correlation coefficient (Table 5).
Table 5. Pearson correlation coefficients between intakes from one administration of a P-S FFQ and the mean of three, 24-hour recalls before and after loge transformation of data (n = 27)
Before loge transformation After loge transformation
Pearson Correlation
p-value Pearson Correlation
p-value
Energy (kcal) .448* .017 .429* .023 Carbohydrate (g) .459* .014 .406* .032 Protein (g) .361 .059 .393* .038 Fat (g) .413* .029 .398* .036 Saturated Fat (g) .206 .293 .225 .249 Cholesterol (mg) .303 .117 .308 .111 * p < .05 Additional analyses were conducted to determine the relationship between BMI and
intake. When Pearson correlation coefficients were determined between BMI and nutrient
intakes, BMI was significantly negatively correlated to mean calorie, protein, fat, saturated fat,
and cholesterol intake in the three 24-hour recalls (Table 6), but there were no significant
correlations between the BMI and the one administration of the FFQ (Table 6). Following loge
transformation of the data, BMI was significantly inversely correlated to five of the mean
nutrient values from the 24-hour recalls (Table 6). However, when the same transformed
correlations were examined between BMI and intake from the one P-S FFQ administration, there
were no significant correlations (Table 6).

16
Table 6. Pearson correlation coefficients between BMI and intake from one administration of a P-S FFQ and the mean of three 24-hour recalls before and after loge transformation of nutrient data (n = 27) Correlations between BMI and Intake
from 1 P-S FFQ Correlations between BMI and Intake from mean of 3, 24-hr recalls
Energy Intake
Pearson p value
Loge transformed
p value
Pearson p value
Loge transformed
p value
Energy (kcal) -.303 .124 -.250 .209 -.434* .024 -.457* .017 Carbohydrate (g)
-.348 .075 -.301 .127 -.348 .076 -.371 .057
Protein (g) -.168 .402 -.179 .370 -.502** .008 -.529** .005 Fat (g) -.271 .172 -.188 .348 -.413* .032 -.434* .024 Saturated Fat (g)
-.256 .198 -.256 .198 -.444* .020 -.477* .012
Cholesterol (mg)
-.167 .406 -.167 .406 -.401* .038 -.464* .015
* p<.05, **p<.01
Of the 38 reliability study students for whom researchers had complete data sets, several
reported very high daily energy intakes (Table 7). Six of the students reported values that were
considered outliers (>10,000 kcal/day), and their data was, therefore, eliminated before running
descriptive statistics and correlations.
Table 7. Daily total intake as assessed by two administrations of the P-S FFQ (n = 32) P-S FFQ1
Mean + standard deviation P-S FFQ2
Mean + standard deviation Energy (kcal) 4497.58 + 2234.42 3298.57 + 2140.19 Carbohydrate (g) 532.10 + 279.14 376.11 + 224.87 Protein (g) 193.35 + 124.04 140.49 + 98.92 Fat (g) 177.98 + 90.14 147.21 + 97.52 Saturated Fat (g) 60.63 + 31.35 51.13 + 38.66 Cholesterol (mg) 668.89 + 458.09 671.20 + 972.73
When the two administrations of the P-S FFQ were compared using Pearson
Correlations, most correlation coefficients were significant (p<.05). Correlation values ranged
from .318 for cholesterol to .477 for protein (Table 8). The macronutrient intakes were loge
transformed (Table 8), and the end result was stronger correlations between the two

17
administrations of the P-S FFQ. In fact, all nutrients showed significant correlations (p < .01)
following the loge transformation.
Table 8. Pearson Correlation Coefficients between the first and second administration of a P-S FFQ before and after loge transformation of data (n=32)
Before loge transformation After loge transformation Pearson Correlation
p-value Pearson Correlation
p-value
Energy (kcal) .399* .024 .553** p = .001 Carbohydrate (g) .377* .033 .478** p = .006 Protein (g) .477** .006 .656** p = .000 Fat (g) .427* .015 .674** p = .000 Saturated Fat (g) .362* .042 .637** p = .000 Cholesterol (mg) .318 .076 .720** p = .000 * p < .05, ** p < .01

18
CHAPTER 4
DISCUSSION
The children involved in the study were all in middle school, but there was one 17-year-
old 8th grader, because he had not received enough schooling in his native country to be placed in
high school. The overweight and obesity rates among the students were consistent with the rates
for Latinos in Georgia. The 2001 BRFSS (CDC) indicated that 52% of Georgia’s Latino
population is overweight or obese. Among Latino children nationwide, an estimated 30.4% were
overweight in 1998 (The National Longitudinal Study of Adolescent Health), and these numbers
have continued to rise.
Most of the children were also relatively new to the United States and spoke Spanish at
home. Language preference is often used as a proxy measure for acculturation level. Latinos
who prefer Spanish are thought to be less acculturated than Latinos who speak English.
Language based scales are used because linguistic factors account for more than 70% of the
variance in acculturation scores (Aguirre-Molina & Molina, 1994). The students’ recent
immigration status was the largest contributing factor to their traditional Latino dietary habits
and patterns. The Latino children in the study who had lived in the United States for several
years, had more “Americanized” eating habits, and of the 33 students who had been measured
for height and weight and lived in the U.S. for three years or more, 55% (18 of 33) were
overweight or obese. This high number of overweight children may indicate that as these
students have lived in the United States for an extended period of time, the result is a
deterioration in eating habits, leading to weight gain. Research is needed to determine how

19
quickly eating habits change and how to prevent Latino adolescents from acquiring unhealthy
eating patterns in the United States. After further modifying the P-S FFQ used in this study, the
tool could aide future studies seeking to develop nutrition interventions for this group.
Past studies that have compared FFQs to other dietary data collection methods, such as
food records, 24-hour recalls, and biochemical markers, have indicated correlation coefficients
for energy (calories) ranging from 0.46 (Treiber et al., 1990) to 0.61 (McPherson, Kohl, Garcia,
Zichaman, & Hanis, 1995). Generally, studies that have examined the eating habits of children
and adolescents using 24-hour recalls as the validation standard of choice have yielded higher
correlations than those using other dietary data collection methods, such as diet records.
The number of significant correlation coefficients for nutrients between the three recalls
and one P-S FFQ in this study indicate that this technique shows promise, but may require
further adjustments in order to accurately assess the diets of adolescent Latinos. One of the
adjustments may include eliminating some of the foods that most children reported not eating.
Past studies have shown that longer FFQ may lead to over-reporting (Yanek, 2001), and the
length of this P-S FFQ may have been a factor in the unusually large daily nutrient intake values
calculated for the adolescents in the study. Past studies have also shown that FFQs may
overestimate nutrient and energy intakes, when compared to the validation standards being used
(Jenner, Neylon, Crof, Beilin, & Vandongen, 1989; Arnold, Rohan, Howe, & LeBlanc, 1995). In
this study, the significant inverse correlations between BMI and intake (kcal, carbohydrates,
protein, fat, and saturated fat) for the mean of the 24-hour recalls indicated that those children
with higher BMIs are reporting lower levels of consumption of many nutrients. If children
underreported intake in their 24-hour recalls, and over-reported in their P-S FFQs, the end result
is low correlation coefficients.

20
Another factor that may have contributed to validity scores is that the 24 hour recalls that
were used to validate the P-S FFQ must represent usual intake, which may not have been the
case with this group. Recall data measures a short, time-specific intake, but FFQs assess usual
(long-term) intake (Zulkifli & Yu, 1992). Unfortunately, the children were not available for data
collection on Mondays, and therefore, there is available information about their weekend intake.
The children’s eating habits on the weekends could have varied substantially, since they did not
have school breakfast and lunch available. The P-S FFQ would have assessed their diets over an
entire two weeks, including weekends, but the 24-hour recalls had no way measure dietary intake
on Saturdays and Sundays.
Each dietary assessment tool has its pros and cons, and no one “gold standard” of diet
assessment exists. Therefore, in order to better assess the validity of the P-S FFQ with
adolescents, different validation techniques should be employed. The results of this study, along
with previous validation studies, suggest that using a combination of multiple food records to
validate new tools may be more appropriate than using a single validation standard (Zulkifli &
Yu, 1992).
The Pearson correlation coefficients for test-retest reliability of the P-S FFQ showed
significant correlation over the two week time period. However, there was a drop in the number
of calories reported from the first to the second administration. This drop may be attributed to
either actual differences in eating patterns and/or memory or motivation increasing or decreasing
from first to second recall. In this case, it is unlikely that the eating patterns varied extensively,
since low-income individuals typically lack dietary diversity because their diets rely heavily on a
small group of staple foods eaten repeatedly (McPherson et al., 1995). Therefore, the students
must have experienced a decrease in their memory and/or motivation from one recall to the next.

21
This decrease in reported nutrient intakes from one administration of a dietary assessment tool to
a second administration has occurred in other studies (Yaroch, 2000; Arnold et al., 1995). After
the first administration, the students knew how lengthy the P-S FFQ was, and they tried to rush
through the second administration. This hurried reporting may have lead to foods being
overlooked and under-reported at the second administration. On the flip side, however, the
students may have over-reported with their first P-S FFQ, because they were not familiar with
the process and may have misunderstood how to sort the cards. In order to address this decrease
in motivation, a more simplified and entertaining dietary assessment tool needs to be used with
adolescents. This tool should possess the ability to hold students’ attention through repeated
administrations.
Past studies examining the test-retest reliability of FFQs have shown that the tool
typically has adequate reliability (Zulkifli & Yu, 1992). In fact, reliability of FFQs has been
shown to be comparable to that of food records and higher than reliability measures for 24-hour
recalls (Treiber et al., 1990). However, because of their low validity scores, FFQs may be more
adept for monitoring dietary trends over time and identifying groups who have extreme (high and
low) dietary intakes than they are for estimating absolute nutrient amounts.
Another important point when studying the reliability data is that the students who
participated in this portion of the study had lived in the United States longer, on average, than the
students who participated in the validity testing (5.47 versus 2.34 years, respectively).
Therefore, it could be argued that the reliability group had already established their more
“Americanized” diets and experienced less fluctuation in their usual dietary intake than did the
students who were still acculturating, leading to better reliability. The validity group, on the
other hand, may be experiencing rapid dietary changes because of where they stand on the

22
acculturation continuum. The instability in dietary patterns could have affected the tool’s
validity scores.
This study had several limitations, which included those that could be attributed directly
to the methods used, such as the 24-hour recalls and the P-S FFQ, but also the small sample’s
size and demographic characteristics. First, 24-hour recalls are inherently time-consuming, the
participants need to have a good memory and be well-motivated, and the researchers collecting
data need to be well trained to collect the highest level of detail possible (Gibson, 1990). The
tools used are only as good as the informants from which data are collected, and if the informants
are young, as they were in this case, they often do not make their own meals and are unaware of
how their food is prepared by the adult in their households. Both the recalls and FFQ asked
about food preparation methods, and many times, students simply guessed what they thought
was correct.
Although the P-S FFQ used in this study was innovative and had several advantages,
there were disadvantages as well that may have contributed to the reliability and validity scores.
First, the process of sorting through the cards and completing the multiple passes was time-
consuming and boring for the students who had to complete the process twice (for test-retest
reliability). Towards the end of the picture sorting procedure, when the children were being
asked about portion sizes, they seemed to answer hurriedly, which may have either indicated that
they had caught on to the portion size measures and could quickly estimate the sizes of the foods
they had consumed, or that they were just guessing in order to complete the procedure more
quickly.
Additionally, many aspects of the P-S confused the children. Many stated that they could
not remember two weeks back and indicated that about a week was the maximum they could

23
recall, and even that was difficult to recall. Also, the multi-food cards (those that had similar
foods depicted on one card) were puzzling to many participants. When completing the multiple
passes, many cards had to be moved to different frequency piles because children would have
disregarded a card (placed it in the “never” stack) if they had not eaten every food depicted on it.
Moreover, they were often unsure where to place the card if they had eaten more than one food
on the card. Additionally, there was some duplication among the cards, which may have lead to
over-reporting. For example, there was a card for beef (steaks), roast, and beef ribs and a
separate card for beef stew or pot pie with carrots/vegetables. Children may have reported eating
the beef in the stew and then, reported eating the stew. If a child did this consistently with many
cards, it would result in high macro and micro nutrient levels. Over-reporting may also have
been the result of sorting the cards into incorrect piles. Some children had difficulty
understanding that, for example, the seventh stack of cards was not for foods eaten seven times
over the past two weeks, but instead for foods eaten one time per day because of the way the
cards had overlapping time frames. Finally, many of the pictures themselves were not clear to
the students. For example, the milk cards depicted whole milk with a red top, 2% milk with a
blue top, and skim milk with a purple top, but some of the students said that different grocery
stores and brands had colored tops that did not correspond to the ones on the cards. Therefore,
the children were unsure which milk to choose.
Another limitation involved the use of multiple methods and/or repeated assessments
(e.g. recalls and P-S FFQ or P-S FFQ twice), which may have resulted in an intervention effect
(Gibson, 1990). Participants may have paid more attention to what they were eating after dietary
data was first collected, and therefore, been better able to report intake and portion sizes on
subsequent assessments. Additionally, students often talked to each other after completing

24
assessments and made comments, such as “I can’t believe you ate that,” “that’s gross,” “that’s so
much food,” etc., and this may have led to participants learning not to report socially undesirable
foods and/or portion sizes.
Finally, because of the small sample size used in this study and the study group’s specific
characteristics (Latino, low-income, recent immigrants, cognitive abilities, etc.), the results
cannot be generalized to a larger population. The sample was made even smaller than originally
intended because of the transient status of many of the Latino families involved. Throughout the
course of the study of the study, children dropped out because their families moved to other
cities for better work opportunities and/or back to their native countries. This was a small-scale
pilot study which should be replicated with a larger national sample.

25
CHAPTER 5
SUMMARY AND FUTURE APPLICATIONS
Kohlmeier (1994) states that an ideal dietary assessment method would “provide an
adequate degree of accuracy about the foods or nutrient consumed by individuals to test the
hypothesis of interest in a powerful fashion.” Although the P-S FFQ developed in this study for
use among Latino adolescents showed evidence of reliability, clearly, by these standards, there is
a need to further refine the tool in order to establish it as an “ideal” method. However, in
addition to having high validity and reliability, there are logistical constraints involved in dietary
data collection that must also be considered. They include the need for a simple tool that can be
administered by untrained individuals to large groups of people and can easily and inexpensively
be coded and analyzed. Additionally, the tool should either not be so long that it burdens the
respondents or be entertaining enough that the subject does not mind taking the extra time to
complete it accurately (Kohlmeier, 1994). Although the P-S FFQ was not shown to have high
validity, the concept shows promise, since it overcomes many of these logistical constraints.
One way to improve the validity and reliability of the P-S FFQ might be by translating
the picture sort technique into a computer game. Technology has evolved a great deal over the
past 30 years, but unfortunately, researchers in dietary assessment have not taken full advantage
of the technology available in order to refine data collection techniques and tools. Computers,
for example, have been used a great deal for analyzing dietary data, but they also have great
potential for use as dietary assessment tools. Computer-based nutrition “games” could be used
to better assess the diet of adolescents (Kohlmeier, 1994). Young people tend to be very

26
technologically savvy, with more than 90% of children aged 11-14 reporting using a computer,
(U.S. Census Bureau, 2001), and most enjoy playing video and computer games.
The number of obese and overweight adolescents, and especially minority adolescents,
continues to rise, and nutrition interventions are constantly being developed for use among these
groups. The researchers who design and implement these interventions need dietary data
collection methods that accurately and consistently measure the nutrient intakes of their target
audiences. If they do not collect such data, they will not know if they are impacting the
children’s eating habits favorably. With further modification, the P-S FFQ tool may be useful to
these researchers.
27
REFERENCES
Aguirre-Molina, M. & Molina, C. (1994). Latino population: who are they? In C.W. Molina, & M.A. Molina (Eds.), Latino Health in the U.S.: A Growing Challenge (pp.3-23).
Washington, DC: American Public Health Association. Arnold, J.E., Rohan, T., Howe, G., & LeBlanc, M. (1995). Reproducibility and validity of a food frequency questionnaire designed for us in girls age 7 to 12 years. Annals in Epidemiology, 5, 369-377. Centers for Disease Control and Prevention (CDC). (2001). Behavioral Risk Factor Surveillance System (BRFSS). Retrieved May 12, 2004 from,
http://www.ph.dhr.state.ga.us/epi/brfss/weight.shtml. Gibson, R.S. (1990). Principles of Nutritional Assessment. New York: Oxford University Press. Guenther, P.M. (1994). Adjusting for intra-individual variability when estimating nutrient intakes. In: Hoover, L.W. & Perloff, B.P. (eds) 19th National Nutrient Databank Conference Proceedings, 59, 198S-200S. Hankin, J.H. & Wilkens, L.R. (1994). Development and validation of dietary assessment methods for culturally diverse populations. American Journal of Clinical Nutrition, 59, 198S-200S. Jenner, D.A., Neylon, K., Crof, S., Beilin, L.J., & Vandongen, R. (1989). A comparison of methods of dietary assessment in Australian children aged 11-12 years. European Journal of Clinical Nutrition, 43, 663-73. Kohlmeier, L. (1994). Gaps in dietary assessment methodology: meal- vs list-based methods. American Journal of Clinical Nutrition, 59, 175S-180S. Kumanyika, S.K, Tell, G.S., Shemanski, L., Martel, J., & Chincilli, V.M. (1997). Dietary assessment using a picture-sort approach. American Journal of Clinical Nutrition, 65, 1123S-9S. Lohman T., Roche A., & Martorell R. (1988). Anthropometric Standardization Reference Manual. Champaign, IL: Human Kinetics Books.
McPherson, R.S., Kohl, H.W., Garcia, G., Zichaman, M.Z., & Hanis, C.L. (1995). Food-frequency questionnaire validation among Mexican-Americans: Starr county, Texas. Annals in Epidemiology, 5, 378-385.

28
Molina, C., Zambrana, R.E., & Molina, M.A. (1994). The influence of culture, class, and environment on health care. In C.W. Molina, & M.A. Molina (Eds.), Latino Health in the U.S.: A Growing Challenge (pp.23-25).Washington, DC: American Public Health Association. Romero-Gwynn, E.R., & Gwynn, D. (1997). Dietary patterns and acculturation among Latinos of Mexican descent. East Lansing, MI: The Julian Samora Research Institute. Teufel, N.I. (1997). Development of culturally competent food-frequency questionnaires. American Journal of Clinical Nutrition, 65, 1173S-8S. Treiber, F.A, Leonard, S.B., Frank, G., Musante, L., Davis, H., Strong, W.B., & Levy, M. (1990). Dietary assessment instruments for preschool children: reliability of parental responses to the 24-hour recall and a food frequency questionnaire. Journal of the American Dietetic Association, 90, 814-820. United States Census Bureau (2001). The Hispanic population in the United States: population characteristics. Retrieved August 31, 2002, from http://www.census.gov. Willet, W. & Stampfer, M.J. (1989). Total energy intake: implications for epidemiologic analyses. American Journal of Epidemiology, 124, 17-27. Yanek, L.R, Moy, T.F, & Becker, D.M. (2001). Comparison of food frequency and dietary recall methods in African-American women. Journal of the American Dietetic Association, 101, 1361-1364. Zulkifli, S.N. & Yu, S.M. (1992). The food frequency method for dietary assessment. Journal of the American Dietetic Association, 92(6), 681-685.

29
Appendix A

30

31

32
Appendix B

33
La Evaluación Dietética de Adolescentes en Grupos Minoritarios Solicitud de Consenso del Padre del Participante
Doy mi permisión para que mi hijo / hija, ___________________participa en un estudio llamado, “La evaluación dietética de adolescentes en grupos minoritarios ” que esta siendo conducida por la Dra. Rebecca M. Mullis del Departamento de Alimentos y Nutrición en la Universidad de Georgia (1-88-700-0185). Yo no tengo que dejar que mi hijo / hija participa en el estudio si no quiero. Mi hijo / hija puede dejar de participar a cualquier minuto sin pena. Les puedo preguntar a los investigadores que me devuelvan la información acerca de mi hijo / hija, la destruyan, o que la quiten de los registros del estudio. El propósito de este estudio es desarrollar unas tarjetas con fotos de comidas, bocados, y fluidos que comen y toman a menudo los niños Hispanos que están asistiendo escuela para los niños de 9 a 13 años. Usando las tarjetas será una manera fácil y divertida para que los niños puedan identificar las comidas más comunes que consumen. • A la Dra. Mullis le gustaría entender mejor que les ayudaría a otros niños en mi comunidad como
pueden adquirir mejores hábitos dietarios. Los niños que participan en el estudio recibirán incentivos por cada actividad que completen (con el valor máximo de $100 por todas actividades completadas).
• Si dejo que mi hijo / hija participa en el estudio, él / ella tendrá que reunirse con miembros del equipo
de investigadores para:
� Llenar un formulario con su edad, grado en la escuela, su género y su etnia � Medirle la altura y el peso en privado � Participar en un grupo de foco con otros adolescentes de mi comunidad. Los investigadores les preguntaran cuales son los alimentos que comen mas a menudo y los fluidos que toman con frecuencia. También, les preguntaran cuales son sus marcas favoritas de estas comidas y líquidos. La discusión demorara mas o menos 90 minutos. Yo entiendo que la discusión será grabada y los investigadores tomaran apuntes de las respuestas de los niños. Las grabaciones serán destruidas 24 horas después de transcribidlas. (Los participantes del grupo recibirán 25 dólares en efectivo o en forma de cupón de regalo.)
� Recordar todas las comidas, los bocados, y los fluidos que ha consumido en las 24 horas antes de la entrevista. También necesitaran describir las porciones de los alimentos. Esta sesión demorara 20-30 minutos. (Los participantes del grupo recibirán 25 dólares en efectivo o en forma de cupón de regalo.)
� Asistir tres sesiones en dos semanas y recordar todas las comidas, los bocados, y los fluidos que ha consumido en las 24 horas antes de la entrevista. También necesitaran describir las porciones de los alimentos. Cada sesión demorara 20-30 minutos. (Los participantes de la entrevista recibirán 25 dólares en efectivo o en forma de cupón de regalo por cada sesión con un máximo valor de $75 por todas las sesiones.)
� Dos semanas después de recordando las comidas, el / ella tendrá que mirar varias tarjetas con fotos de alimentos y identificar cuales el / ella come, la frecuencia con que la come, y sus

34
porciones normales. (Los participantes de la sesión recibirán 25 dólares en efectivo o en forma de cupón de regalo. � Asistir dos sesiones que serán dos semanas apartes. En las sesiones, el / ella tendrá que mirar varias tarjetas con fotos de alimentos y identificar cuales el / ella come, la frecuencia con que la come, y sus porciones normales. (Los participantes del grupo recibirán 25 dólares en efectivo o en forma de cupón de regalo por cada sesión con un máximo valor de $50 por todas las sesiones.)
• Todas sesiones serán durante horas que su niño tiene libre para estudiar en la escuela o después de las
horas del colegio. El estudio no interferirá con las clases. Si no quiero que mi hijo/a participa en el estudio, él / ella estudiara como es normal.
• No hay riesgo o incomodidad asociada con contestando las preguntas. Mi hijo / hija puede dejar de participar en cualquier momento y sus notas no serán afectadas.
• La información que provea mi hijo / hija será guardada confidencialmente en la medida que es permitida por la ley y no será informada a otros aparte del proyecto de estudio en una manera que me identifica personalmente. La información que nos da usted será accesible a solamente los empleados del proyecto.
• Si tengo preguntas acerca del estudio, puedo contactar a la Dra. Mullis por teléfono: 1-888-700-0185. • He leído y entiendo las declaraciones más arribas. Me han dado las respuestas a mis preguntas y me
gustaría darle permisión a mi hijo / hija participar en el estudio. También, me han dado una copia de este papel.
________________________ _________________________ Firma del Investigador Fecha ________________________ __________________________ Firma del Padre o Guardián Fecha Para preguntas o problemas sobre los derechos de su niño como participante, por favor llame o escriba: Chris A. Joseph, PhD, Human Subjects Office, University of Georgia, 606A Boyd Graduate Studies Research Center, Athens, Georgia 30602-7411; Número de teléfono (706)542-3199; correo electrónico [email protected].

35
DIETARY ASSESSMENT IN MINORITY ADOLESCENTS PARENTAL CONSENT FORM
I agree to allow my child _____________________ to take part in a study titled, “Dietary Assessment in Minority Adolescents”, which is being conducted by Dr. Rebecca M. Mullis, from the Department of Foods and Nutrition at University of Georgia (1-888-700-0185). I do not have to allow my child to be in this study if I do not want to. My child can stop taking part at any time without giving any reason, and without penalty. I can ask to have the information related to my child returned to me, removed from the research records, or destroyed. The reason for the study is to develop a modified set of cards picturing foods, snacks, and drinks that Hispanic children in middle school commonly eat and drink. The cards will give children a fun, easy way to identify what foods and drinks they most often consume and how much they consume. • Dr. Mullis hopes to learn something that may help other youths in my community to
develop healthy eating habits. Youths who take part in this study will receive $25.00 in the form of cash or gift card for each session in which they participate (with a maximum of $100 value awarded to each student).
• If I allow my child to take part, my child will be asked to:
� Fill out a short form giving his/her age, school grade, gender (boy or girl), and racial/ethnic group with an investigator from UGA.
� Have his/her height and weight measured privately by an investigator from UGA
� Attend a focus group discussion session with other youths from the community. They
will be asked to name the foods, drinks, and snacks they commonly eat and rink and tell us their favorite brands of those items. The discussion session will last for about 90 minutes. I understand that the focus group will be audiotaped and that handwritten notes will be taken. I understand that the focus group audiotapes will be destroyed within 24 hours of transcription. (Compensated $25 for focus group participation.)
� Recall all the foods, snacks, and drinks they ate or drank during the previous 24 hours
and describe the portions sizes. The session will last for about 20-30 minutes. (Compensated $25 for food recall session.)
� Attend 3 sessions over a two-week period in which he/she will recall all the foods,
snacks, and drinks he/she ate or drank during the previous 24 hours and describe the portion sizes. The sessions will each last for about 20-30 minutes. (Compensated $25 per food recall session.)
� Two weeks after the first recall session, he/she will be asked to sort through a deck of
cards with food and drink pictures to identify how often those foods and drinks are consumed and describe the normal portion sizes. (Compensated $25 for food recall session.)
� Attend 2 sessions, two weeks apart, in which he/she will be asked to sort through a deck
of cards with food and drink pictures to identify how often those foods and drinks are

36
consumed ad describe the normal portion sizes. (Compensated $25 per picture identifying session.)
• All sessions will take place during free study time or outside school hours and will not
interfere with school lessons. If I do not want my child to take part then she/he will be allowed to study as usual.
• The research is not expected to cause any harm or discomfort. My child can quit at any
time. My child’s grade will not be affected if my child decides to stop taking part. • Any information collected about my child will be held confidential unless otherwise
required by law. My child’s identity will be coded, and all data will be kept in a secured location.
• Dr. Mullis will answer any questions about the research, now or during the course of the
project, and can be reached by telephone at: 1-888-700-0185. • I understand the study procedures described above. My questions have been answered to
my satisfaction, and I agree to allow my child to take part in this study. I have been given a copy of this form to keep.
______________________________________ Signature of Researcher Date _______________________________________ Signature of Parent or Guardian Date Questions or problems regarding your child’s rights as a participant should be addressed to Chris A. Joseph, Ph.D. Human Subjects Office, University of Georgia, 606A Boyd Graduate Studies Research Center, Athens, Georgia 30602-7411; Telephone (706) 542-3199; E-Mail Address [email protected]

37
Appendix C

38
List of all foods/drinks mentioned by focus group participants
Breakfast
Milk Bread Cupcakes/muffins Cereal (Fruit Loops, Cocoa Krispies, Crunch Berries, Frosted Flakes, Cheerios)
Biscuits Pizza
Cheese Eggs Chocolate milk shake Fruit Juice (apple, orange, banana,
mango, peach, pear, grape, pineapple)
Eggs with ham and/or sausage
Bread with honey Hot cakes Pan dulce (sweet bread) Toast with jelly Atole (thick drink made with
corn and water or milk) Rice pudding
Lunch
Hot dogs Hamburgers Chicken sandwiches Potatoes Fruit Fish Macaroni and cheese Chocolate milk Beans Soda Instant soup Menudo Pork Eggs Ground beef Spaghetti with meat sauce Vegetable soup Tortillas Peanut butter sandwiches Ribs Turkey Quesadillas Pizza (pepperoni, supreme,
cheese) Avocados
Dinner
Eggs with beans and cheese Tocino (meat dish) Tortas (sandwiches) Hot dogs Steak Meatballs Chinese food Tacos Spaghetti French fries Salad Crackers and milk Tamales Cereal Chicken soup Enchiladas Ranchero eggs Soda Meat with hot chiles Pork Rice and beans Beef stew Shrimp Ceviche Chicken Avocados Salad Posole Tortillas Instant soup (Maruchan brand) Mole Donuts and milk Pan Dulce Bread and milk

39
Snacks/Desserts/Drinks/Miscellaneous Oreo cookies Sandwiches Ice cream “Sabritas” brand snacks Doritos Corn Flakes Churros Chocolates Fruit “Dubalin” brand snacks Jello Danimals yogurt
Chips with hot sauces Crackers (Emperador, Marias, and Gamesa brands)
Tamarino brand juice
Sodas (coke, sprite, pepsi) Capri Sun Lemonade Fruit juices and nectars Valle brand juice Crackers and chocolate Pan dulce Cake Chiles rellens Flan Popsicles Coffee with milk (café con
leche)
Restaurants/Restaurant Foods Cici’s Pizza Burger King Pizza Hut McDonalds Ryans El Durango Los Aros El Sombrero Chinese Buffet Lunas Arby’s Krystal
Waffle House Sony’s Sonic La Parilla

40
Appendix D

41
Food Frequency Questionnaire (FFQ) Protocol
Equipment: 1. FFQ questionnaire 2. All other equipment necessary to run a single FFQ is contained in the plastic containers with blue lids (FFQ kit). The FFQ kit and all contents are labeled (set-up #1, set-up #2, etc) and should remain together. Each FFQ kit contains: 29 portion-size envelopes labeled F1 through F8,4 33 portion-size envelopes labeled B1 through B9,4 1 stack of 98 PicSort food cards 1 stack of 21 PicSort beverage cards 1 set of multicolored category cards labeled: F1 (never) to F8 (more than 14 times in 2 weeks) B1 (never) to B9 (6+ per day) FFQ checklist for items in the container 2 pages of laminated script and directions for your reference (attached) Calendar card (attached) Portion-size devices: 2 Styrofoam cups 6 oz and 8 oz) 1 rectangular piece of styrofoam/ lasagna 1 pie-shaped piece of styrofoam/ pie 1 plastic 4oz piece of meat/ hamburger 1 tennis ball 1 set of measuring spoons (tablespoon, teaspoon) 3 tupperwear containers with: ½ cup of beans 3/4 cup of beans 1 cup of beans 2 plastic butter patties 1 plastic margarine blob Staff and Time Requirement: One trained staff member for each respondent. One hour to complete the exercise with the respondent. An additional 30 minutes to code the responses after the FFQ has finished. 1. SET-UP

42
a. Secure an open space, of at least 8 x 3 feet, either on the floor or at a large table, where the respondent can work quietly and without disruption for an hour or more. Ensure that no other assessment activities take place in the room at the same time as the FFQ .
b. Lay-out the category cards and potion-size envelopes in order in a horizontal row: i. Beverages in the back row, placed in the following order from
left to right: (1) never (B1) (2) 1 time in two weeks (B2) (3) 2-3 times in two weeks (B3) (4) 4-8 times in two weeks (B4) (5) 10-12 times in two weeks (B5) (6) 1 per day (B6) (7) 2-3 per day (B7) (8) 4-5 per day (B8) (9) 6+ per day (B9)
ii. Foods in the front row, placed in the following order from left to right: (1) never (F1) (2) 1 time in two weeks (F2) (3) 2-3 times in two weeks (F3) (4) 4-5 times in two weeks (F4) (5) 6-8 times in two weeks (F5) (6) 10-12 times in two weeks (F6) (7) 1 per day (F7) (8) more than 14 times in 2 weeks (F8)
iii. Place the respective portion-size envelopes under each food and beverage category card: (1) The food and beverage category for ‘never’ has only 1
envelop (2) All other category cards have 4 respective envelopes,
representing less than a medium-sized serving (1), a medium-sized serving (2), a little more than a medium-sized serving (3) and a lot more than a medium-sized serving (4), respectively.
c. Lay out the sample foods and measurement devices to the left of the set-up
d. Separate the food and beverage PicSort cards into 2 piles. Make sure each pile of cards is in order according to the number on the front of
43
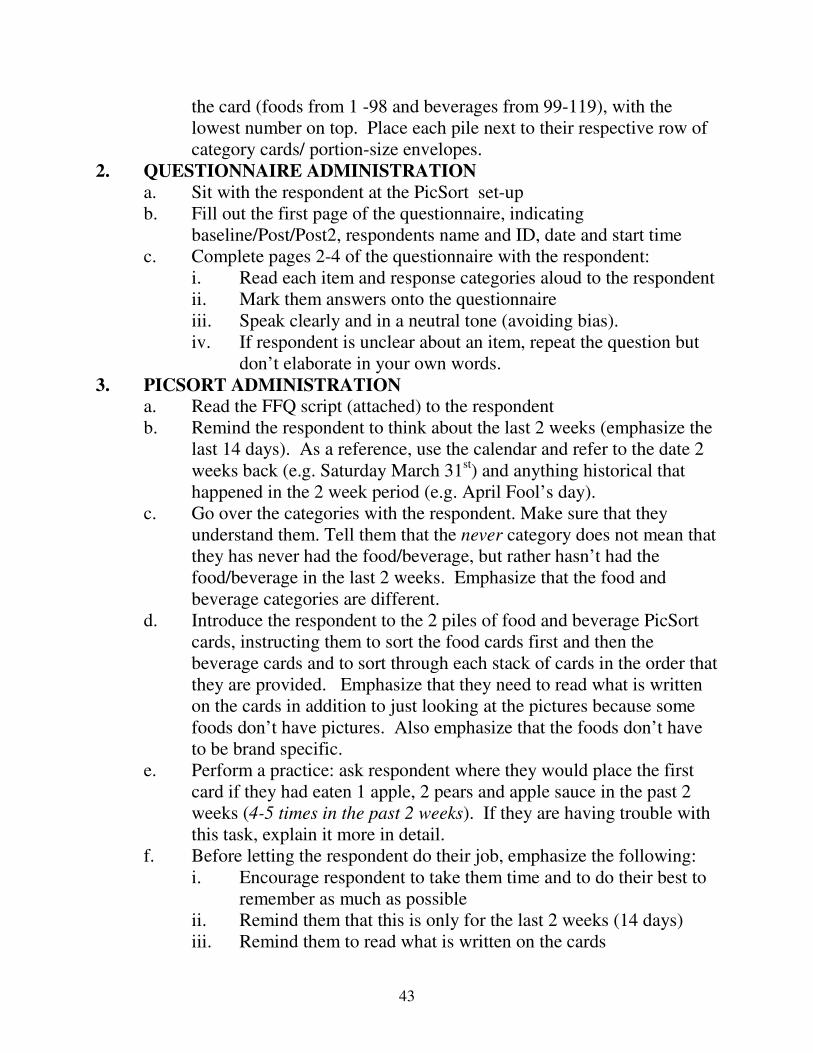
the card (foods from 1 -98 and beverages from 99-119), with the lowest number on top. Place each pile next to their respective row of category cards/ portion-size envelopes.
2. QUESTIONNAIRE ADMINISTRATION a. Sit with the respondent at the PicSort set-up b. Fill out the first page of the questionnaire, indicating
baseline/Post/Post2, respondents name and ID, date and start time c. Complete pages 2-4 of the questionnaire with the respondent:
i. Read each item and response categories aloud to the respondent ii. Mark them answers onto the questionnaire iii. Speak clearly and in a neutral tone (avoiding bias). iv. If respondent is unclear about an item, repeat the question but
don’t elaborate in your own words. 3. PICSORT ADMINISTRATION
a. Read the FFQ script (attached) to the respondent b. Remind the respondent to think about the last 2 weeks (emphasize the
last 14 days). As a reference, use the calendar and refer to the date 2 weeks back (e.g. Saturday March 31st) and anything historical that happened in the 2 week period (e.g. April Fool’s day).
c. Go over the categories with the respondent. Make sure that they understand them. Tell them that the never category does not mean that they has never had the food/beverage, but rather hasn’t had the food/beverage in the last 2 weeks. Emphasize that the food and beverage categories are different.
d. Introduce the respondent to the 2 piles of food and beverage PicSort cards, instructing them to sort the food cards first and then the beverage cards and to sort through each stack of cards in the order that they are provided. Emphasize that they need to read what is written on the cards in addition to just looking at the pictures because some foods don’t have pictures. Also emphasize that the foods don’t have to be brand specific.
e. Perform a practice: ask respondent where they would place the first card if they had eaten 1 apple, 2 pears and apple sauce in the past 2 weeks (4-5 times in the past 2 weeks). If they are having trouble with this task, explain it more in detail.
f. Before letting the respondent do their job, emphasize the following: i. Encourage respondent to take them time and to do their best to
remember as much as possible ii. Remind them that this is only for the last 2 weeks (14 days) iii. Remind them to read what is written on the cards

44
iv. Indicate that their responses are confidential and will not be shared with parents or anyone outside of the staff (because their are alcohol items among the cards)
g. Step away from the set-up and let respondent sort the cards. Do not interrupt until they is finished
4. PICSORT REVIEW AND PORTION SIZE a. Inform the respondent that you are going to review their responses
with them, plus talk about the portion-size of the foods/beverages they ate/drank. From there on out, it is important that you, the interviewer, don’t make any judgments or expressions about the foods/drinks consumed and portion size.
b. PicSort Review: emphasize that it is OK to move the cards from one category to another, if they recall having eaten/drank more or less of it.
c. Review each PicSort card with the respondent, sorting all food cards followed by the beverage cards. Ask verbatim:
In the past 2 weeks/14days (alternate these terms),
you had food/beverage item # times. Is that correct?
i. Make sure to probe, especially on items that are consumed in greater frequency and quantity (e.g., koolaid, ramen noodles, fried chicken/hot wings, chocolate candy, non-chocolate candy, chips and salty snacks).
ii. Break down categories that have more than 1 item written on it (e.g., fried chicken, hot wings, chicken nuggets, chicken patties). Ask them which of the items they ate (e.g., they might say “I had fried chicken, hot wings and chicken nuggets”. Then ask, How many times did you have the fried chicken? How many times did you have the hot wings? And how many times did you have chicken nuggets? Add up each of these items and move it to another category if it was coded wrong (e.g., they might have put it in 2 times in 2 weeks because they were only counting the fried chicken and not the other foods. If they had wings 3 times and chicken nuggets 2 times, then it really needs to go into the 6-8 times in 2 weeks category. (1) The cards that you need to be especially aware of are:
Regular salad dressing and mayonnaise..., Hamburger, cheeseburger...., Pork, including chops, roast and ribs, Ham, bologna, salami or other lunch meats, Salty snacks,

45
Other cheeses and cheese spreads, Doughnut, cookies, cake....,chocolate candy, other candy, etc...)
iii. Make sure to expand on necessary items: (this list is included in the FFQ kit for immediate reference during FFQ administration) (1) Koolaid: also includes any non-carbonated fruit drink
such as Hawaiian Punch, Rainbow, Capri Sun, lemonade from a mix, any fruit punch such as Minute Maid. Ask them which kinds of drinks like that have been drinking in the last 2 weeks and make sure that they are included.
(2) Cereal: Ask them which cereal they eat. They might say, “Well I eat Corn Pops but that wasn’t on the card so I put it in never”. ANY kind of sugary cereal should be included in the “other cold cereals, such as corn flakes...” category.
(3) Sugar on cereal: if they are adding sugar to other things (e.g., extra sugar in their koolaid), include it there.
(4) Sausage: Make sure to include Hot Links in addition to breakfast or other sausages.
(5) Other potatoes: Make sure to include mashed potatoes. (6) Ham, bologna, salami, or other lunch meats: Make sure
to remind them of any times in the last 2 weeks that they have eaten sandwiches.
(7) White bread: Hamburger/hot dog rolls and any kind of snack crackers fall under this category as well. Make sure that if they ate hamburgers or hot dogs, that they are counting the buns for these things in this category.
(8) Salty snacks: tell participants that this includes all kinds of salty snacks, cheetos, doritos, hot fries, etc. As confirmation, ask them which kind of snacks like that they eat and include them.
(9) Other cheeses and cheese spreads: make sure that they include all cheeses: on sandwiches, hamburgers, etc..
(10) Chocolate candy such as Snickers: tell participants that this includes all kinds of chocolate candy. As confirmation, ask them which kind of snacks like that they eat and include them.
(11) Other candy: tell participants that this includes ALL non-chocolate candy (but not bubble gum). Ask them what kind of candy they eat and include them. If they have

46
eaten pancakes/waffles, make sure that they counted syrup. Ask if they have had jelly on anything as well.
(12) Cola: this includes ANY kind of soda (Coke, Pepsi, Minute Maid, Sprite, Mountain Dew, Mr. Pibb, etc).
(13) Tea (hot or iced): make sure that they include any kind of iced or sweet tea
d. Portion size: Once the food/beverage category is made certain,
inquire into portion-size for each food/beverage: (1) Show the respondent the backside of the PicSort
food/beverage card. Inform them that this is a medium-size serving.
(2) Present the appropriate food model for each food, when applicable: (a) For cups: Take the lid is off of the top of the
container (½, 3/4, 1 cup). (b) For chicken, beef, pork, and seafood: Use the food
model (4 oz. of meat) (c) For butter: Model- 2 pats of butter (d) For margarine: Model-scoop of margarine. (e) For sugar: (ex. used on cereals)- Show teaspoon
and tablespoon (f) For lasagna: Use rectangle foam (g) For pie: Use triangle foam (h) For drinks: Cup examples: 6 or 8 oz. marked on
one cup (for water, milk, etc.) (i) For soda: can size (12 oz.).
(3) Ask verbatim: Was your usual portion size: less than this, like this, a little more than this, or a lot more than this amount?
(4) Do not interpret portion-size for your respondent. If they is unclear, ask them:
What do you think?
(5) Place each card into the appropriate potion-size envelope. (a) 1=less than a medium serving (b) 2= a medium serving (c) 3= a little more than a medium serving

47
(d) 4=a lot more than a medium serving e. Ask respondent if there is any food/beverage that they has
eaten/drank within the last two weeks that was not included on the cards, for example ethnic foods. Record any items on the front of the questionnaire
f. Record the end time on the front of the questionnaire 5. CODING THE FFQ QUESTIONNAIRE
a. Entering PicSort data onto the questionnaire can be done on-site, or the cards can be left in their envelopes and coding completed at a later point.
b. Coding of PicSort data onto the questionnaire: i. Each food and beverage card has a number from 1-93 (foods)
and 94-107 (beverage) ii. Indicate how often the respondent ate or drank each food (1-8)
and beverage (1-9) item iii. Indicate the portion size (1-4) (how much?) of each food and
beverage item consumed. 6. CLEAN-UP
a. Pick-up and order the category cards, portion size envelopes and food and beverage PicSort cards.
b. Return all of the equipment to the proper FFQ kit, including directions and food models. Check the FFQ checklist within the kit to ensure that all equipment has been returned.
c. ALWAYS ensure that the questionnaire (coded or un-coded) is returned to the proper location: this may be a designated person, or may be the FFQ kit itself.
7. ADDENDUM (To be conducted by an additional person)
a. Record food/beverage switching, from one category to another, when it occurs. i. If respondent switches down (after 2nd pass), immediately place
that card in the appropriate envelope with regards to serving size and frequency eaten in the last two weeks.
ii. If respondent switches up (in 2nd pass), wait to record those results after you reach that category in the second pass.
b. Food/beverage switching form (see appendix B)

48
Appendix E

49

50
1. Cuales clases de grasa usas tu, o el que cocina en tu casa, para cocinar (to stir-fry, or sauté)? Marque solamente una o dos opciones.
� Yo no se o no cocino � Manteca o manteca de cerdo
� Aceite en aerosol o no uso aceite
� Margarina � Mantequilla � Soft tub margarine � ½ matequilla, ½ margarina
� Margarina de baja caloria
� Crisco
� Aceite 2. What kinds of fat do you , or whoever cooks in your home, usually add to
vegetables, potatoes, etc.? Mark only one or two. � Don’t add fat � Lard, fatback, bacon
fat � Low calorie margarine
� Stick margarine � Soft tub margarine � ½ butter, ½ margarine � Butter � Whipped butter � Crisco 3. When you eat the following foods, how often do you eat a low-fat or non-fat
version of that food? (1) (2) (3)
QUESO � Siempre bajo en grasa
� A veces � Casi nunca bajo en grasa
HELADO/YOGUR
� Always low-fat � Sometimes � Rarely low-fat
ADEREZO PARA ENSALADAS
� Always low-fat � Sometimes � Rarely low-fat
4. a. How often do you add salt to your food? � Seldom/Never
(1) � Sometimes
(2) � Often/Always
(3) 4. b. How often do you add pepper to your food? � Seldom/Never
(1) � Sometimes
(2) � Often/Always
(3) 4. c. How often do you eat the skin on chicken? � Seldom/Never
(1) � Sometimes
(2) � Often/Always
(3)
4. d. How often do you eat the fat on meat? � Seldom/Never
(1) � Sometimes
(2) � Often/Always
(3)

51
5. How often do you eat the following foods from restaurants, buffets, cafeterias or fast food places? Any food prepared outside the home including take out eaten at home. Remember to think about all meals (breakfast, lunch, dinner or snacks).
Restaurant Food
(1) Never in the past year
(2) 1-4
times in the past year
(3) 5-11 times in the past year
(4) 1-3
times a month
(5) One
time a week
(6) 2-4
times a week
(7) Almost every day
Fried chicken (Church’s, Popeye’s & others)
Burgers (Burger King, McDonalds, Good Times, A&W, Carl’s Jr. & others)
Pizza (Pizza Hut, Papa John’s Dominos, Black Jack & others)
Chinese Food (China Buffet, at the mall, or out at other places)
Mexican Food (Taco Bell,

52
Pollo Loco, and other Mexican chains) Fried fish (Captain D’s, Long John Silver’s, Red Lobster, & others)
6. a. How often do you, or whoever cooks in your home, use fat or oil in
cooking? Less then once per
week (1)
1-2 per
week
(2)
3-4 per
week
(3)
5-6 per
week
(4)
1 per day
(5)
1.5 per day
(6)
2 per day
(7)
3 per day
(8)
4+ per day
(9)
6. b. About how many servings of vegetables do you eat, not counting salad or potatoes? Less then once per
week (1)
1-2 per
week
(2)
3-4 per
week
(3)
5-6 per
week
(4)
1 per day
(5)
1.5 per day
(6)
2 per day
(7)
3 per day
(8)
4+ per day
(9)
6. c. About how many servings of fruit do you eat, not counting juices? Less then once per
week (1)
1-2 per
week
(2)
3-4 per
week
(3)
5-6 per
week
(4)
1 per day
(5)
1.5 per day
(6)
2 per day
(7)
3 per day
(8)
4+ per day
(9)
6. d. About how many servings of cold cereal do you eat? Less then
1-2 per
3-4 per
5-6 per
1 per day
1.5 per
2 per day
3 per day
4+ per day

53
once per
week (1)
week
(2)
week
(3)
week
(4)
(5)
day
(6)
(7)
(8)
(9)
CODING SCEME: How often: How Much: 1 = Not at all in the last two weeks
6 = 10-12 in 2 weeks 1 = Small
2 = 1 in 2 weeks 7 = 12-14 in 2 weeks (1/day) 2 = Medium 3 = 2-3 in 2 weeks 8 = 14+ in 2 weeks (1+/day) 3 = Large 4 = 4-5 in 2 weeks M = Missing 4 = Extra
Large 5 = 6-8 in 2 weeks E = Error
FRUITS AND JUICES: How Often How Much � (1) Apples, applesauce, pears Manzanas, puré de manzana peras
1 2 3 4 5 6 7 8 1 2 3 4
� (2) Bananas Bananas 1 2 3 4 5 6 7 8 1 2 3 4
� (3) Peaches, apricots, nectarines (canned or fresh) Duraznos, Albaricoques, nectarinas (enlatados o frescos)
1 2 3 4 5 6 7 8 1 2 3 4
� (4)Cantaloupe, honeydew Melones tipo cantaloupe o honeydew
1 2 3 4 5 6 7 8 1 2 3 4
� (5) Watermelon Sandía (Patilla) 1 2 3 4 5 6 7 8 1 2 3 4
� (6) Strawberries Fresas 1 2 3 4 5 6 7 8 1 2 3 4
� (7) Oranges, tangerines Naranjas, Tangerinas (Mandarinas)
1 2 3 4 5 6 7 8 1 2 3 4
� (8) Grapefruit Toronja 1 2 3 4 5 6 7 8 1 2 3 4
� (9) Grapes Uvas 1 2 3 4 5 6 7 8 1 2 3 4
� (10) Fruit including berries, fruit cocktail, pineapple, kiwi Fruta incluyendo kiwi, frambuesas, zarzamoras, piña, y
1 2 3 4 5 6 7 8 1 2 3 4

54
coctel de fruta � (11) Mango, canned and fresh Mango, enlatado y fresco 1 2 3 4 5 6 7 8 1 2 3 4
� (12) Fried Plantains Plátanos fritos 1 2 3 4 5 6 7 8 1 2 3 4
BREAKFAST FOODS: How Often How Much � (13) Unsweetened high fiber cereals Cereales sin azúcar con mucha fibra
1 2 3 4 5 6 7 8 1 2 3 4
� (14) Unsweetened low to moderate fiber cereals Cereales sin azúcar con nivels bajos o moderados de fibra
1 2 3 4 5 6 7 8 1 2 3 4
� (15) Sweetened cereals, such as Corn Pops, Frosted Flakes, etc. Cereales con azúcar, como los Corn Pops, Frosted Flakes, etc.
1 2 3 4 5 6 7 8 1 2 3 4
� (16) Cooked cereal like oatmeal, Cream of Wheat, or grits Cereales calientes, como harina de avena o sémola de maíz
1 2 3 4 5 6 7 8 1 2 3 4
� (17) Milk on hot or cold cereal Leche añadida al cereal caliente o frio
1 2 3 4 5 6 7 8 1 2 3 4
� (18) Sugar added to hot or cold cereal Azúcar añadida al cereal caliente o frio
1 2 3 4 5 6 7 8 1 2 3 4
� (19) Eggs Huevos 1 2 3 4 5 6 7 8 1 2 3 4
� (20) Pork bacon Tocino 1 2 3 4 5 6 7 8 1 2 3 4
� (21) Pork sausage Butifarras, Salchícha de puerco, chorizo 1 2 3 4 5 6 7 8 1 2 3 4
� (22) Mustard greens, turnip greens, collards Hojas de mostaza, grelos/nabizas, berza
1 2 3 4 5 6 7 8 1 2 3 4
� (23) Toaster pastries, Pop Tarts Pastelillos para tostador, Pop Tarts 1 2 3 4 5 6 7 8 1 2 3 4
VEGETABLES: How Often How Much � (24) Pancake, waffles 1 2 3 4 5 6 7 8 1 2 3 4

55
Pancakes (Panquecas-Panqueques), waffles � (25) Chili Chili con frijoles 1 2 3 4 5 6 7 8 1 2 3 4
� (26) String beans, green beans Vainitas, habichuelas, ejotes 1 2 3 4 5 6 7 8 1 2 3 4
� (27) Peas Chícharos (Guisantes), gandules 1 2 3 4 5 6 7 8 1 2 3 4
� (28) Beans, such as baked beans, pintos, kidney beans Frijoles incluyendo los frijoles negros, blancos, colorados, pintos, y garbanzos
1 2 3 4 5 6 7 8 1 2 3 4
� (29) Refried beans made with lard Frijoles refritos hechos con manteca
1 2 3 4 5 6 7 8 1 2 3 4
� (30) Corn Maíz 1 2 3 4 5 6 7 8 1 2 3 4
� (31) Tomatoes, tomato juice Tomates, jugo de tomates 1 2 3 4 5 6 7 8 1 2 3 4
� (32) Red chili sauce, taco sauce, salsa picante Salsa
1 2 3 4 5 6 7 8 1 2 3 4
� (33) Squash Calabaza 1 2 3 4 5 6 7 8 1 2 3 4
� (34) Cauliflower or brussels sprouts Coliflor o Colecitas (repollitos) de bruselas
1 2 3 4 5 6 7 8 1 2 3 4
� (35) Spinach, cooked or raw Espinacas, cocinada o cruda 1 2 3 4 5 6 7 8 1 2 3 4
� (36) Broccoli Brócoli (Bróculi) 1 2 3 4 5 6 7 8 1 2 3 4
� (37) Okra Quimbombó/quingombó 1 2 3 4 5 6 7 8 1 2 3 4
� (38) Cole slaw, cabbage, sauerkraut Ensalada de col picada, col (repollo), chucrú (chucrut)
1 2 3 4 5 6 7 8 1 2 3 4
� (39) Carrots, or mixed vegetables containing carrots Zanahorias o vegetales/verduras mixtas conteniendo zanahorias
1 2 3 4 5 6 7 8 1 2 3 4
� (40) Green salad Ensalada verde 1 2 3 4 5 6 7 8 1 2 3 4

56
� (41) Avocado and guacamole Aguacate y guacamole 1 2 3 4 5 6 7 8 1 2 3 4
� (42) Olives, green and black Aceitunas, verdes y negras 1 2 3 4 5 6 7 8 1 2 3 4
� (43) Pickles Pepinillo encurtido 1 2 3 4 5 6 7 8 1 2 3 4
� (44) Salad dressing, mayonnaise, including that on sandwiches or on potato salad Aderezo para ensaladas, mayonesa, incluyendo la que le untas a los sandwiches, los bocadillos o ensalada de papas
1 2 3 4 5 6 7 8 1 2 3 4
� (45) Ketchup, Bar-be Q sauce Catsup (Salsa de tomate) 1 2 3 4 5 6 7 8 1 2 3 4
� (46) Mole 1 2 3 4 5 6 7 8 1 2 3 4 � (47) French fries and fried potatoes Papas fritas
1 2 3 4 5 6 7 8 1 2 3 4
� (48) Sweet potatoes, yams Ñame, batatas/camotes 1 2 3 4 5 6 7 8 1 2 3 4
� (49) Potatoes, boiled, bakes, mashed, potato salad Papas hervidas o cocidas al horno, en pure de papas o en ensalada de papas
1 2 3 4 5 6 7 8 1 2 3 4
� (50) Mixed rice dishes with meat, such as rice and chicken, fried rice, etc. Platos de arroz y carne como arroz con pollo, arroz con salchichas, arroz chino con jamon
1 2 3 4 5 6 7 8 1 2 3 4
� (51) Rice and rice mixes Arroz y platos de arroz sin carne como arroz amarillo, arroz silvestre (salvaje), arroz integral
1 2 3 4 5 6 7 8 1 2 3 4
� (52) Vegetable, cooked onions, peppers, asparagus Vegetales/verduras, cebollas pimientos rojos o verdes, espárragos cocidos
1 2 3 4 5 6 7 8 1 2 3 4
� (53) Butter, margarine, or other fat on vegetables, potatoes, etc. Mantequilla, margarina, o otra grasa untada a los
1 2 3 4 5 6 7 8 1 2 3 4

57
vegetales/verduras, papas, etc.
MEAT, FISH, POULTRY, LUNCH ITEMS: How Often How Much
� (54) Tamales Tamales 1 2 3 4 5 6 7 8 1 2 3 4
� (55) Hamburger, cheeseburger, meat loaf, sloppy joe Hamburguesa, rollo de carne picada, picadillo, carne molida, albóndiga, etc.
1 2 3 4 5 6 7 8 1 2 3 4
� (56) Burritos, tacos Burritos, tacos 1 2 3 4 5 6 7 8 1 2 3 4
� (57) Tortas Tortas 1 2 3 4 5 6 7 8 1 2 3 4
� (58) Beef (steaks), roast, beef ribs including sandwiches Carne de res, bistec, costilla de res, falda de res, incluyendo en los sandwiches y las fajitas
1 2 3 4 5 6 7 8 1 2 3 4
� (59) Beef stew or pot pie with carrots/vegetables Sopa o caldo de res con vegetales/verduras, mondongo
1 2 3 4 5 6 7 8 1 2 3 4
� (60) Pork, including chops, roast, ribs Puerco (cerdo), costillas de puerco, chuletas, etc.
1 2 3 4 5 6 7 8 1 2 3 4
� (61) Fried chicken, hot wings, chicken nuggets, chicken patties Pollo frito, croquetas de pollo, allas (de pollo) fritas
1 2 3 4 5 6 7 8 1 2 3 4
� (62) Chicken or turkey; roasted, stewed or boiled Pollo o pavo, hervido, asado, o guisado
1 2 3 4 5 6 7 8 1 2 3 4
� (63) Fried fish, fish sandwich, or shrimp Pescado (mojarra, bagre, etc) frito o camarones fritos, pescado frito en sandwiches
1 2 3 4 5 6 7 8 1 2 3 4
� (64) Tuna fish, tuna salad, tuna casserole Atún, ensalada de atún
1 2 3 4 5 6 7 8 1 2 3 4
� (65) Shell fish (shrimp, lobster, 1 2 3 4 5 6 7 8 1 2 3 4

58
crab) Camarón, langosta, cangrejo marisco, incluyendo en caldo/sopas � (66) Fish, broiled or baked Pescado, cocido en el horno o asado a la parrilla, o en caldos o ceviche
1 2 3 4 5 6 7 8 1 2 3 4
� (67) Spaghetti, lasagna, other pasta, with tomato sauce Espagueti, pasta con salsa de tomatoes, lasaña
1 2 3 4 5 6 7 8 1 2 3 4
� (68) Pizza Pizza 1 2 3 4 5 6 7 8 1 2 3 4
� (69) Mixed dishes with cheese, such as macaroni & cheese Platos hechos con queso como los macarrones y queso
1 2 3 4 5 6 7 8 1 2 3 4
� (70) Helper Dishes such as Hamburger Helper, Tuna Helper Platos tipos “helper” como el Tuna Helper, Hamburger Helper, etc.
1 2 3 4 5 6 7 8 1 2 3 4
� (71) Ham, bologna, salami, other lunch meats Jamón, bologna, fiambre/embutido, salami, otras carnes para hacer sandwiches
1 2 3 4 5 6 7 8 1 2 3 4
� (72) Hot dogs, Vienna sausages Hotdog (Salchicha de perro caliente), salchíchas tipas Vienas
1 2 3 4 5 6 7 8 1 2 3 4
� (73) Vegetable soup, vegetable beef, minestrone, tomato soup Sopas o caldos con vegetales/verduras o sopa de tomates
1 2 3 4 5 6 7 8 1 2 3 4
� (74) Soups not tomato base (chicken noodle, etc.) Sopas sin caldo de tomates como sopa de pollo con fideos
1 2 3 4 5 6 7 8 1 2 3 4
� (75) Other soups, such as menudo, pozole, etc. Sopas tipas Mejicanas como el menudo y el posole
1 2 3 4 5 6 7 8 1 2 3 4

59
BREADS, SNACKS, SPREADS: How Often How Much � (76) Ramen noodles Sopa de fideos Ramen 1 2 3 4 5 6 7 8 1 2 3 4
� (77) Biscuits, muffins (including fast foods) Biscocho (panecillo), panquecito/muffin
1 2 3 4 5 6 7 8 1 2 3 4
� (78) White bread, bagels, crackers, burger rolls, French or Italian bread, (including Sandwiches) Pan blanco como el bolillo, los bagels, las galletas saladas, el pan de hamburguesas, pan francés o italiano (incluyendo el pan que usas para hacer sandwiches)
1 2 3 4 5 6 7 8 1 2 3 4
� (79) Dark bread, including whole wheat, rye, pumpernickel, (including sandwiches and bagels) Pan oscuro como el pan integral, el pan de centeno, el pan negro, y el pan trigo (incluyendo el pan que usas para hacer sandwiches)
1 2 3 4 5 6 7 8 1 2 3 4
� (80) Corn bread, corn muffins, corn tortillas Pan de maíz, tortillas de maiz
1 2 3 4 5 6 7 8 1 2 3 4
� (81) Crackers like Ritz, Goldfish, Cheez-it, etc. Galletas tipas Ritz, Goldfish, Cheez-it, etc.
1 2 3 4 5 6 7 8 1 2 3 4
� (82) Salty snacks (such as Hot Cheetos, Hot Fries, pork rinds), Chips, popcorn Bocados salados como los Hot Chitos, Hot Fries, y chicarrones, paitas salads, tortilla chips, palomitas de maíz, etc.
1 2 3 4 5 6 7 8 1 2 3 4
� (83) Pretzels, Low-fat or fat-free potato chips pretzels, papitas con niveles bajas de grasa o sin grasa
1 2 3 4 5 6 7 8 1 2 3 4
� (84) Nachos with cheese 1 2 3 4 5 6 7 8 1 2 3 4

60
Nachos con queso � (85) Peanuts or peanut butter Maní o crema (mantequilla) de cacahuate/maní
1 2 3 4 5 6 7 8 1 2 3 4
� (86) Nuts and seeds, such as sunflower seeds, pecans, etc. Nueces y semillas como semillas de girasol, pecanas
1 2 3 4 5 6 7 8 1 2 3 4
� (87) Margarine on bread or rolls Margarina untada al pan 1 2 3 4 5 6 7 8 1 2 3 4
� (88) Butter on bread or rolls Mantequilla untada al pan 1 2 3 4 5 6 7 8 1 2 3 4
� (89) Gravies made with meat drippings or white sauce Salsa o jugo de carne
1 2 3 4 5 6 7 8 1 2 3 4
DAIRY PRODUCTS: How Often How Much � (90) Cottage cheese Requesó o queso tipo cottage 1 2 3 4 5 6 7 8 1 2 3 4
� (91) Block cheeses, cheese slices, and cheese spreads Queso (tipo mozzarella, cheddar, suizo, americano) y queso en lonchas
1 2 3 4 5 6 7 8 1 2 3 4
� (92) Flavored yogurt, frozen yogurt Yogur (con sabores de fruta) o yogur congelado
1 2 3 4 5 6 7 8 1 2 3 4
SWEETS: How Often How Much � (93) Ice cream & milkshakes Helado y batidos 1 2 3 4 5 6 7 8 1 2 3 4
� (94) Flan Flan 1 2 3 4 5 6 7 8 1 2 3 4
� (95) Rice Pudding Arroz con leche 1 2 3 4 5 6 7 8 1 2 3 4
� (96) Jell-O or sherbet Jello, gelatina, sorbete 1 2 3 4 5 6 7 8 1 2 3 4
� (97) Popsicle, ice pops Paletas congeladas 1 2 3 4 5 6 7 8 1 2 3 4
� (98) Doughnuts, cookies, cake, pastry, Little Debbie snacks, etc. Galletas dulces, donas, pastel/torta, etc.
1 2 3 4 5 6 7 8 1 2 3 4
� (99) Pumpkin pie. Sweet potato 1 2 3 4 5 6 7 8 1 2 3 4

61
pie Pay/Pastel de calabaza o de batatas/camotes � (100) Pies or cobblers other than sweet potato or pumpkin Pay/Pastel o tarta de fruta
1 2 3 4 5 6 7 8 1 2 3 4
� (101) Snack bars such as granola, Rice Krispie, Kool Stuf Bocados en forma de tabletas como las tabletas de granola, Rice Krispies, o Kool Stuf
1 2 3 4 5 6 7 8 1 2 3 4
� (102) Fruit snacks such as Roll-ups, Fruit Gushers, Scooby-Doo Bocados de fruta, como los Roll-ups, Fruit Gushers, y Scooby-Doo
1 2 3 4 5 6 7 8 1 2 3 4
� (103) Non-chocolate candy like Skittles, Starburst, Twizzlers, etc. Caramelos que no son hechos de chocolate, como los Skittles, Starburst, y Twizzlers
1 2 3 4 5 6 7 8 1 2 3 4
� (104) Chocolate candy such as Snickers, Kit Kat, M&Ms, Reese’s Peanut Butter cups, etc. Caramelos de chocolate como los Snickers, Kit Kats, M&Ms, Reese’s Peanut Butter cups, etc.
1 2 3 4 5 6 7 8 1 2 3 4
� (105) jelly, honey, brown sugar, syrup Mermeladas, conservas, miel de abeja, azúcar morena, jarabe de arce
1 2 3 4 5 6 7 8 1 2 3 4
CODING SCHEME:
How often: How Much: 1 = Not at all in the last two weeks
6 = 14 in 2 weeks (1/day) 1 = Small
2 = 1 in 2 weeks 7 = 28-42 in 2 weeks (2-3/day) 2 = Medium 3 = 2-3 in 2 weeks 8 = 14+ in 2 weeks (4-5/day) 3 = Large 4 = 4-8 in 2 weeks 9 = 84+ in 2 weeks (6+/day) 4 = Extra
Large 5 = 10-12 in 2 weeks

62
Beverages: How Often How Much � (106) 100% Orange juice or grapefruit juice Jugo de naranja o de toronja 100%
1 2 3 4 5 6 7 8 9 1 2 3 4
� (107) 100% Apple juice Jugo de manzana 100% 1 2 3 4 5 6 7 8 9 1 2 3 4
� (108) Fruit drinks with added Vitamin C Líquidos de fruta con vitamina C añadida
1 2 3 4 5 6 7 8 9 1 2 3 4
� (109) Fruit nectars (Jumex) Néctares de fruta, como Jumex 1 2 3 4 5 6 7 8 9 1 2 3 4
� (110) Whole mile and beverages made with whole mile, including café con leche (not including on cereal) Leche entera y bebidas hechas con leche entera incluyendo café con leche (no incluye la leche en el cereal)
1 2 3 4 5 6 7 8 9 1 2 3 4
� (111) 2% mile and beverages make with 2% milk (not on cereal) Leche del 2% y bebidas hechas con leche del 2% (no incluye en el cereal)
1 2 3 4 5 6 7 8 9 1 2 3 4
� (112) Skim milk, 1% or buttermilk (not on cereal) Leche semidescremada 1% o descremada (skim), o suero de leche (no incluye la leche en el cereal)
1 2 3 4 5 6 7 8 9 1 2 3 4
� (113) Chocolate milk Leche de chocolate 1 2 3 4 5 6 7 8 9 1 2 3 4
� (114) Regular soft drink such as Coke, Pepsi, Sprite, etc. Aguas gaseosas o sodas como la Coca-Cola, Sprite, y Pepsi
1 2 3 4 5 6 7 8 9 1 2 3 4
� (115) Sports drinks (Gatorade, Powerade, etc.) Líquidos deportivos como el Gatorade, Powerade, etc.
1 2 3 4 5 6 7 8 9 1 2 3 4
� (116) Coffee (regular of decaf) Café (con cafeína o sin cafeína)
1 2 3 4 5 6 7 8 9 1 2 3 4
� (117) Sweet tea (hot or iced) Té con azúcar (frio o caliente)
1 2 3 4 5 6 7 8 9 1 2 3 4

63
CODING SCEME: How often: How Much: 1 = Not at all in the last two weeks
6 = 10-12 in 2 weeks 1 = Small
2 = 1 in 2 weeks 7 = 12-14 in 2 weeks (1/day) 2 = Medium 3 = 2-3 in 2 weeks 8 = 14+ in 2 weeks (1+/day) 3 = Large 4 = 4-5 in 2 weeks M = Missing 4 = Extra
Large 5 = 6-8 in 2 weeks E = Error
Miscellaneous: How Often How Much 1 2 3 4 5 6 7 8 1 2 3 4 1 2 3 4 5 6 7 8 1 2 3 4 1 2 3 4 5 6 7 8 1 2 3 4 1 2 3 4 5 6 7 8 1 2 3 4 1 2 3 4 5 6 7 8 1 2 3 4

64
Appendix F

65
Front of P-S Card
Back of P-S Card

66
Appendix G

67
24-hour Multiple-pass Dietary Recalls - Protocol for Administration People needed: NDS Trained interviewer Equipment needed: 24-hour recall form NDS Prompt Quick-view Sheet (1 for each interviewer)* Food Visuals Poster (1 for each interviewer) Clipboard (1 for each interviewer and 1 for station spreadsheet) File folder (1 for each interviewer) Pencils * these forms are paper-clipped onto the insides of the file folder Station Spreadsheet $25 WalMart Gift Card Instructions: 1. The dietary recall is to be administered as a 1:1 interview. 2. Before you begin, explain to the child: I am interested in finding out what foods do kids your age eat. To do that, I am going to ask you about what you ate yesterday. 3. Start the First Pass – A quick list of all foods eaten, by asking the child: Think back to yesterday, what was the first time you had something to eat or drink? What did you have at that time? Did you have anything else at that time? 4. Keep repeating this until they say No, then ask: When was the next time you had something to eat or drink? What did you have at that time? Did you have anything else at that time? 5. Keep repeating #4 until they tell you they went to bed, then ask: After you went to bed, did you get back up and have a snack or a drink? 6. If the child says Yes, say: What did you have at that time? Did you have anything else at that time? 7. If the child says No, begin the Second Pass – Finding missed meals, snacks, and drinks, by
asking the child: Now we will review what we have so far. At _________, you had (read all foods). Can you think of anything else you had at that time?

68
8. Visualize what they wrote {did they name 3 meals, did they name any snacks, drinks} and say
these prompts to fill in foods/drinks they missed: Did you have something to drink with that meal? Did you have any snacks between meals? 9. If they say yes and name a food, then say to the child: � Did you have anything else at that time? 10. Repeat #8 and #9 until the child says No. 11. Begin the Third Pass - Asking about added foods, specific items, and portions
a) To do this, start back at breakfast and look at EVERY food and drink:
b) If they name a general item such as cereal, chips, or soda, ask: Do you know what brand (or flavor, or kind) it was? c) If it is a food that something might be added to and ask: Did you add anything to the ---------? (e.g. cereal)
d) On any mixed foods, ask: What was on (or in) your ----------? (e.g. sandwich/salad/pizza)
e) If it is a food that has different types (e.g. milk), ask: What kind of milk did you drink? What type of ---- did you eat? f) On each food and drink, ask:
How much did you eat or drink?
g) If the child names a specific amount (e.g. a bag of Doritos), ask: Did you finish it? Or Did you eat all of it? Note: For portions, refer to the Food Visual sheets using attached help sheet. 12. Once you have completed step #11 for all foods, say the following to the child: Now we will review what you have told me, Tell me if I have missed anything. At the end of each meal/snack ask: � Is this correct/right? 13. If the child says No, ask: What do I need to change? If the child says Yes, ask: Did you have anything else at that time? 14. Repeat #12 and #13 for all meals and snacks.

69
15. Ask the child: Is this was the same amount as they usually eat. If they say No, ask: Was it more or less than you usually eat? 16. Indicate whether or not you think the report was reliable. If you suspect the child did not
provide a reliable recall, provide comments as to why not. 17. When the child finishes, thank them for their participation 18. Place a sticker on the child’s card to show that they participated. 19. On the spreadsheet, find that child’s identification number/name; write the child’s name if
not already recorded beside the ID number. In the row with that child’s name and ID number, place a check mark, your initials and the date in the appropriate columns.
Food Visuals
Food:
Use this tool: Page Number: Write down:
Brownies Square cake, bars
Squares and Rectangles AND Thickness
1 4
SR #up #across SR 4up, 5across Thi # Thi 5
Pancake Fruit (how big around) Sausage
Circles 2 Cir ABCDE. Cir B
Pizza Pie Round cake slice
Wedges AND Thickness (unless flat)
3 4
We Letter, Number e.g. We D,3 Thi # Thi 10
Mayonnaise
Measuring Spoon 5 #, tsp or tbsp e.g. 1 tsp
Peanut butter
Eating Spoon 6 L or H, Tea or Tab L Tea
Drinks Milkshakes
Glasses 8 – 9 GL #,letter GL 1,B

70
Cereal Soup
Bowl 10-11 Bo #,letter Bo 3,D
Cooked Vegetables Ice Cream Rice Pasta/spaghetti/noodles
Mounds 12 – 13 M # M 5

71
Appendix H

72
Abbreviation Key Possible Meal Times: Br, Sn, Lu, Sn, Su, Sn Write the corresponding name of Food Portion Visual, and number along with what line child indicates. For example, Bowl A11 ½ way full of just cereal and added to full line with milk. First Pass = Quick List Second Pass = Missing meals/snacks/drinks Third Pass = Additions, Brands, Portions
������������������������������������������������������� ������ ��������������������������������������������������
� ��
��������� ������������������������������������
����������������������������������������������������
��������������������������
���
��� ������������������������ ��������������������
� ��������������������������������������������������
�������������������� ���� ��������������������� Place one food item per box.
�������� ����������������� ���� �!�
First Pass Items Times and Names of foods/drinks Notice when foods/drinks/snacks are skipped, then ask in 2nd pass.
Third Pass Info Additions, brands On/In Food, & Portions Ate all of it? Write: ALL
Second Pass Items Missed meals, snacks & drinks If no additional items were identified on 2nd pass, Write: N/A
Third Pass Info Additions, brands, On/In Food, & Portions Ate all? Write: ALL

73
Appendix I

74

75
Appendix J

76