the development and evaluation of a second-order factor ...vir die multifactor leadership...
TRANSCRIPT

The development and evaluation of a second-order factor structure for the
Leadership Behaviour Inventory (LBI)
Nikki Solomon
Thesis presented in partial fulfillment of the requirements for the degree of Master of Commerce at the
University of Stellenbosch
Supervisor
Prof CC Theron
December 2006

DECLARATION
I, the undersigned, hereby declare that the work contained in this thesis is my own original work and
that I have not previously in its entirety or in part submitted it at any university for a degree.
Signature: Date:
2
ABSTRACT The aim of this study is to derive a theoretically justifiable hypothesis on the second-order factor
structure of the Leadership Behaviour Inventory (LBI). The available empirical evidence on the
validity of the measurement and structural models underlying the Performance Index (PI) together with
the positive results on the LBI, allows the opportunity to proceed with the task of explicating and
evaluating a comprehensive leadership-organizational unit performance structural model. Before this
can be undertaken, however, a good fitting second-order factor structure for the LBI needs to be
developed. The second-order factor structure proposed by Avolio, Bass and Jung (1999) for the
Multifactor Leadership Questionnaire (MLQ) is adapted, applied to the LBI and tested empirically. The
results suggests a reasonable to mediocre fitting model that clearly outperforms the independence
model, however, fails to satisfactory capture the complexity of the processes which underlie the LBI.
3
OPSOMMING
Die doel van hierdie studie is om ‘n teoretiese geregverdigde hipotese ten opsigte van die tweede-orde
faktorstruktuur van die Leadership Behaviour Inventory (LBI) te ontwikkel. Die beskikbare empiriese
getuienis oor die geldigheid van die metings- en strukturele modelle onderliggend aan die Performance
Index (PI) tesame met die positiewe bevindinge oor die LBI, bied die geleentheid om met die
ontwikkeling van ‘n omvattende leierskap-organisatoriese eenheid prestasie strukturele model voort te
gaan. Alvorens dit gedoen kan word, moet ‘n goedpassende tweede-orde faktor-struktuur egter vir die
LBI gevind word. Die tweede-orde faktor-struktuur soos voorgestel deur Avolio, Bass and Jung (1999)
vir die Multifactor Leadership Questionnaire (MLQ), is aangepas, toegepas op die LBI en empiries
getoets. Die resultate dui op ’n redelike tot middelmatige passende model wat die onafhanklike model
oortuigend oortref maar wat nie werklik oortuigend daarin slaag om die kompleksiteit van die prosesse
onderliggend aan die LBI vas te vang nie.
4

ACKNOWLEDGEMENTS
The author wishes to thank Professor C. C. Theron for all his assistance, support and guidance for the
duration of this research project. All his assistance is much appreciated and valued.
5
TABLE OF CONTENTS
ACKNOWLEDGEMENTS...................................................................................................................... 5 LIST OF TABLES.................................................................................................................................... 7 LIST OF FIGURES .................................................................................................................................. 8 CHAPTER 1 ............................................................................................................................................. 9 INTRODUCTION, RESEARCH OBJECTIVES AND OVERVIEW OF THE STUDY........................ 9
1.1 INTRODUCTION .................................................................................................................... 9 CHAPTER 2 ........................................................................................................................................... 13 THE DEVELOPMENT OF A SECOND-ORDER LEADERSHIP MEASUREMENT MODEL FOR THE LEADERSHIP BEHAVIOUR INDEX (LBI) ............................................................................... 13
2.1 THE LEADERSHIP BEHAVIOUR INDEX (LBI) ............................................................... 13 2.2 THE NEOCHARISMATIC LEADERSHIP PARADIGM .................................................... 14 2.3 CHARISMATIC TRANSFORMATIONAL LEADERSHIP ................................................ 18 2.4 TRANSFORMATIONAL AND TRANSACTIONAL LEADERSHIP................................. 20
2.4.1 Burns’ theory of transforming leadership ....................................................................... 21 2.4.2 Bass’ theory of transformational leadership ................................................................... 22
2.5 TRANSFORMATIONAL LEADERSHIP FACTORS.......................................................... 25 2.6 TRANSACTIONAL LEADERSHIP FACTORS................................................................... 26 2.7 THE MULTIFACTOR LEADERSHIP QUESTIONNAIRE................................................. 27 2.8 THE FACTOR STRUCTURE OF THE MULTIFACTOR LEADERSHIP QUESTIONNAIRE ............................................................................................................................ 29 2.9 A SECOND-ORDER FACTOR STRUCTURE FOR THE LBI BASED ON THE MLQ SECOND-ORDER FACTORS........................................................................................................... 32
CHAPTER 3 ........................................................................................................................................... 37 RESEARCH METHODOLOGY AND PREPARATORY DATA ANALYSIS ................................... 37
3.1 RESEARCH HYPOTHESIS AND MEASUREMENT MODEL.......................................... 37 3.2 SAMPLE................................................................................................................................. 37 3.3 MISSING VALUES ............................................................................................................... 39 3.4 DIMENSIONALITY ANALYSIS ......................................................................................... 40 3.5 ITEM ANALYSIS .................................................................................................................. 41 3.6 VARIABLE TYPE ................................................................................................................. 42 3.7 UNIVARIATE AND MULTIVARIATE NORMALITY ...................................................... 43
CHAPTER 4 ........................................................................................................................................... 45 EVALUATION OF THE FIRST AND SECOND-ORDER MEASUREMENT MODEL FIT............. 45
4.1 EVALUATION OF THE PRIMARY MEASUREMENT MODEL...................................... 45 4.2 EVALUATION OF THE SECOND-ORDER MEASUREMENT MODEL ......................... 54
4.2.1 Model Identification........................................................................................................ 55 4.2.2 Assessing overall goodness-of-fit of the second-order measurement model.................. 56 4.2.3 Examination of residuals................................................................................................. 61 4.2.4 Model Modification indices ............................................................................................ 62 4.2.5 Assessment of the second-order factor model ................................................................ 65
4.3 COMPARISON OF LBI SECOND-ORDER FACTOR MODELS....................................... 67 CHAPTER 5 ........................................................................................................................................... 69 SUMMARY, CONCLUSIONS AND RECOMMENDATIONSS ........................................................ 69 REFERENCES........................................................................................................................................ 72
6
LIST OF TABLES
Table 1: First-order latent leadership dimensions measured by the LBI 16
Table 2: Full Range Leadership Model 25
Table 3: House’s (1995) dimensions of leadership and the corresponding LBI
Dimensions 34
Table 4: A second-order factor model based on Avolio et al. (1999) 36
Table 5: Principle component analyses of LBI sub-scale measures 40
Table 6: Reliability of LBI sub-scale measures 42
Table 7: Test of multivariate normality for continuous variables 43
Table 8: Test of multivariate normality for continuous variables 44
Table 9: Completely standardized loadings of the item parcels on the first-order
Leadership factors 48
Table 10: Statistical hypotheses on the Γ population matrix 55
Table 11: Goodness of fit statistics second-order measurement model 56
Table 12: Completely standardized gamma (Γ) matrix 65
Table 13: Squared multiple correlations for structural equations 67
Table 14: Completely standardized PSI (Ψ) matrix 67
7
LIST OF FIGURES
Figure 1: The proposed second-order factor structure for the LBI based on the
Avolio et al. (1999) best fitting second-order factor model 38
Figure 2: Stem-and-leaf plot of standardized residuals 61
Figure 3: Q-plot of standardized residuals 63
8
CHAPTER 1 INTRODUCTION, RESEARCH OBJECTIVES AND OVERVIEW OF THE STUDY
1.1 INTRODUCTION
Today, the work environment is characterized by quite high levels of turbulence, uncertainty,
discontinuous change and global competition. Most companies, whether they are large or small, have to
deal with competition for critical resources and market opportunities, not only from competitors in their
home market but also from other parts of the world. This has a huge impact on many organizations as
they would have to continually cope with new situations and challenges in order to survive and prosper
in today’s competitive environment (Lussier & Achua, 2004; Noe, Hollenbeck, Gerhart & Wright,
1997).
In recent years, many organizations around the world have been affected by a number of economic,
political and social upheavals that have gathered momentum in most parts of the globe. For example,
greater demographic diversity of workforces, a faster pace of environmental and technological change,
more frequent geopolitical shifts affecting borders and distribution of power among nation states, and
increased international competition (House, 1995). In most industries, there is unprecedented
unpredictability and uncertainty, that is, turbulence. The challenge facing these industries is how to
continually cope with new situations in order to survive and prosper (Day, Zaccaro & Halpin, 2004;
Lussier & Achua, 2004). This has serious implications for organizations but meeting these challenges
will be necessary to create value and to thrive in the marketplace (Noe et al., 1997).
Within South Africa, organizations are currently struggling to remain competitive in the face of all
these challenges and have to deal with increasing competition from foreign and domestic competitors
(Theron, Spangenberg & Henning, 2004). The work environment for South African business
organisations is fast-moving, extremely complex and is complicated by immense volatility, sensitivity
and international turmoil (Pretorius, 2001). In 1994, South African society became a democracy and as
a result this lead to the opening-up of commerce and industry to foreign competition and a major
transformation was required of public and private organizations (Spangenberg & Theron, 2002). South
Africa is experiencing a number of changes with this redirection of its society from the apartheid of the
past to a multi-racial society (Hayward, Davidson, Pascoe, Tasker, Amos & Pearse, no date). As a
9
result of this transformation, the capability to lead change becomes of utmost importance. The multi-
faceted changing landscape of South African society offers exciting opportunities and challenges to
organizational leaders (Cotter, 2002). To effectively meet this challenge leaders as well as managers
need to have the necessary skills and abilities required to lead others, drive transformation and
effectively manage performance of their work units (Spangenberg & Theron, 2002).
As organizations struggle to maintain their competitive market positions, the focus moves quite
strongly onto the leader’s role in the organization (Theron, Spangenberg & Henning, 2004). There
tends to be agreement in the literature (Bass, 1997; Maritz, 1995; Mullins, 1999; Wall, Solum & Sobol,
1992) that leadership plays an important role in the success or failure of an institution. There seems to
be a relationship between the characteristics and behaviour of a leader and the performance of the work
unit that he/she is accountable for. Organizational units therefore reflect, through the level of
performance that they achieve, the quality of their leadership. The leader’s effectiveness is therefore
reflected by the performance of his/her work unit. Leaders should make a difference in their followers’
performance and should also make a difference as to whether their organizations succeed or fail
(Hayward et al., no date; Robbins, 1996). Leaders responsible for a work unit are after all required to
achieve specific unit objectives through specific leadership outcomes (Theron, Spangenberg &
Henning, 2004). Consequently, interest centres on the leader’s role of influencing the performance of
his/her subordinates in the individual and work unit contexts.
As a result of the perceived pivotal role of leadership in an organizational unit’s performance, there has
been a focus on the competencies and competency potential (SHL, 2000; 2001) of successful or
effective leaders. Spangenberg and Theron (2002) developed a comprehensive leadership behaviour
index (LBI) to identify those latent leadership competency dimensions that a leader does not perform
well on and to be able to improve on those dimensions to enhance his/her effectiveness and in turn unit
performance. The LBI is a diagnostic tool that can assist in providing leaders with a comprehensive
insight into leadership behaviours, from environmental diagnosis, visioning, preparing the organization
for change and implementing the vision to effectively managing work unit performance. The main
objective is to be able to assess the range of capabilities which are needed by leaders and managers to
implement major change while sustaining unit performance in the South African context (Spangenberg
& Theron, 2002).
10
Spangenberg and Theron (2002) also developed a generic, standardized unit performance measure (PI)
that includes the unit performance dimensions for which the unit leader could be held responsible. They
identified eight unit performance dimensions for which a unit leader could be held responsible, namely:
production and efficiency; core people processes; work unit climate; employee satisfaction;
adaptability; capacity; market share/scope; future growth. When evaluating success of an
organizational unit, all eight aspects should be assessed (Spangenberg & Theron, 2002).
Performance on these dimensions by an organizational unit is not the outcome of a random event but
rather systematically determined by an intricate nomological network of latent variables. To be able to
rationally and purposefully improve the performance of an organizational unit those latent dimensions
must be known as well as how they combine to affect the various performance dimensions. Leadership
characteristics and behaviour will probably play an important role in determining organizational unit
performance. The effect of leadership variables on unit performance would probably not be direct but
would be mediated through a layer of leadership outcome latent variables. Situational variables could
also moderate the effect of leadership on unit performance (Bass, Avolio, Jung & Berson, 2003).
To purposefully and rationally affect improvement in organizational unit performance through
leadership development, the manner in which leadership competency potential, leadership
competencies and leadership outcomes combine to determine unit performance, needs to be accurately
understood. The manner in which leadership impacts on the performance of an organizational unit,
should therefore be captured in a comprehensive leadership-unit performance structural model that
would explain the way in which the various latent leadership dimensions affect the endogenous unit
performance latent variables. This is the intention of Spangenberg and Theron (2002). The evidence
reported in Theron, Spangenberg and Henning (2004) on the validity of the measurement and structural
models underlying the PI, together with the results on the LBI reported in Spangenberg and Theron
(2002), opens the way to proceed with the task of explicating and evaluating a comprehensive
leadership-unit performance structural model. However, to do so by linking all twenty-four first-order
leadership dimensions, right from the start, to the eight latent variables currently comprising the basic
unit performance structural model seems somewhat overly ambitious. Isolating a good fitting second-
order factor structure for the LBI would simplify model development considerably. Constructing and
motivating a leadership-unit performance structural model in terms of fewer but more extensive latent
leadership variables would be a much easier task. Once a basic leadership-unit performance structural
model has been explicated it will hopefully be easier to link the first-order leadership dimensions to the
11
latent variables, which comprise unit performance through elaboration of the basic model. Theron and
Spangenberg (2005) proposed a second-order factor structure for the LBI in terms of five oblique
second-order factors. They report reasonable to mediocre model fit for the five-factor model although
they concede (Theron & Spangenberg, 2005, p. 48) that the proposed model “fails to satisfactorily
capture the true complexity of the processes underlying the LBI.” Theron and Spangenberg (2005),
however, also proposed an alternative second-order factor structure for the LBI based on the factor
structure that Avolio, Bass and Jung (1999) proposed for the Multifactor Leadership Questionnaire
(MLQ). They, moreover, recommended (Theron & Spangenberg, 2005, p. 49) that this latter
hierarchical model “should also be evaluated empirically before proceeding to the actual development
and testing of a leadership-unit performance structural model.”
Therefore, it is the objective of this study to derive a theoretically justifiable hypothesis on the second-
order factor structure of the LBI based on the Avolio, Bass and Jung (1999) second-order factor
structure proposed for the MLQ and to empirically test the hypothesis by confronting the second-order
measurement model with data. In accordance with the suggestion made by Theron and Spangenberg
(2005) and with their permission granted to use such data, the empirical model fitting will be
performed on the same data set that had been used to evaluate the five-factor model so as to facilitate
the comparison of model fit across the two models.
The proposed second-order factor structure for the LBI is derived from the Avolio et al. (1999) second-
order factor structure proposed for the MLQ in chapter 2. The confirmatory factor analysis used to
empirically evaluate the proposed second-order factor structure is described in chapter 3. The results of
the analysis are presented and discussed in chapter 4. The conclusions of the study and
recommendations for future research are presented in chapter 5.
12

CHAPTER 2
THE DEVELOPMENT OF A SECOND-ORDER LEADERSHIP MEASUREMENT MODEL
FOR THE LEADERSHIP BEHAVIOUR INDEX (LBI)
2.1 THE LEADERSHIP BEHAVIOUR INDEX (LBI)
The LBI is founded on an extensive interpretation of the leadership construct, which encompasses
elements of leadership, management and supervision. The construct of leadership as measured by the
LBI is thus quite broad. When attempting to clarify the constitutive meaning of the leadership construct
as measured by the LBI the distinction between management, supervisory leadership and general
leadership needs to be taken into account. House (1995, p. 413) defines management as “behaviour of
a person in a position of formal authority that results in compliance of organizational members with
their normal role or position requirements”. Supervisory leadership is defined as (House, 1995, p. 413)
“behaviour intended to provide guidance, support, and corrective feedback for the day-to-day activities
of work unit members”. General leadership is (House, 1995, p. 413) “behaviour of individuals that
gives purpose, meaning, and guidance to collectivities by articulating a collective vision that appeals to
ideological values, motives, and self-perceptions of followers resulting in (1) the infusion of values into
organizations and work, (2) unusually levels of effort on the part of followers above and beyond their
normal role or position requirements, and (3) follower willingness to forgo self-interest and make
significant personal sacrifices in the interest of a collective vision.”
General leadership tends to fall quite strongly within the realm of charismatic or transformational
leadership. Behaviours that are included are visioning, providing meaning, inculcating values and
eliciting unusual levels of effort from employees who go beyond self-interest to achieve the vision.
Management and supervisory leadership is concerned with ensuring that employees achieve work/task
requirements, providing employees with support and providing the necessary feedback (Spangenberg &
Theron, 2002). Charismatic or transformational leadership (general leadership) comprises the core of
the leadership construct as interpreted by the LBI, while elements of management and supervisory
leadership also significantly contribute to the construct (Theron & Spangenberg, 2005).
13
2.2 THE NEOCHARISMATIC LEADERSHIP PARADIGM
Since the mid-1970s, there has been a substantial body of theoretical and empirical literature which
concerns the behaviours that constitutes outstanding leadership. A number of theories have attempted
to explain how leaders attain extraordinary accomplishments, such as, leading organizations
successfully through times of crisis, turning losing industrial firms into generating profit, revitalizing
stagnant and foundering organizations, or successfully reinventing organizations in response to
dramatic environmental changes. These theories have been supported by empirical investigation. These
theories are the 1976 theory of charismatic leadership (House, 1977), the attributional theory of
charisma (Conger & Kanungo, 1987), and the transformational (Bass, 1985; Burns, 1978) and
visionary theories of leadership (Bennis & Nanus, 1985; Saskin, 1988). This class of theory constitutes
a new paradigm as it emphasizes leader follower values, motives, and self-concepts. Leaders are likely
to articulate an ideological vision and emphasize the values inherent in the vision and attempt to
identify with the collective. This new genre of theory is referred as the neocharismatic paradigm. This
is because Weber’s (1947) conceptualization of charisma is either implicitly or explicitly a central
concept in all of these theories. The theories of the neocharismatic paradigm state that exceptionally
effective leaders are visionary, offer innovative solutions to major social problems, encourages radical
change, generally emerge as more effective under conditions of social stress and crisis, and induce
significant social and organizational changes (House, 1995).
All these theories share some common characteristics. These theories explain how leaders are able to
lead organizations to achieve outstanding accomplishments. They also explain how leaders are able to
achieve extraordinary levels of follower motivation, admiration, respect, trust, commitment, dedication,
loyalty, and performance. They also emphasize symbolic and emotionally appealing leader behaviours,
that is, visionary, frame alignment, empowerment, role-modeling, image-building, exceptional risk-
taking, supportive behaviours, and cognitively oriented behaviour – adapting, showing versatility and
environmental sensitivity, and intellectual stimulation. These theories specify the leader effects on
followers which include self-esteem, motive arousal and emotions, identification with leader’s values,
vision, and the collective, as well as follower satisfaction and performance. A number of studies
(House, Spangler & Woycke, 1991; Pillai & Meindl, 1991; Waldman, Ramirez & House, 1996;
Waldman, House & Ramirez, 1996) investigated the merits of these theories and concluded that this
genre of leadership results in high-level of follower motivation and commitment and well above
14

average organizational performance, especially under conditions of uncertainty or crises (House &
Aditya, 1997).
The challenges that South African organizations are facing and the number of important changes taking
place, imposes substantial new role demands on leaders. Leaders are required to cope with these
challenges and changes. To do so successfully will require not only management behaviours but also
general leadership behaviours. South African leaders therefore, must be able to lead change, drive
transformation and effectively manage the performance of their work units. Consequently, the
neocharismatic paradigm outlined above is particularly relevant to South Africa. The model that,
according to Spangenberg and Theron (2002), best captures the leadership competencies required by
the demands placed on South African leaders, is that of Conger and Kanungo (Conger & Kanungo,
1998).
Conger and Kanungo’s model of charismatic leadership (Conger & Kanungo, 1998) is a stage model
which involves a process of moving organizational members from an existing present state towards
some improved future state. During the initial stage, the leader critically evaluates the existing situation
or status quo and the inclinations, abilities, needs and level of satisfaction experienced by followers.
He/she must conduct an environmental assessment of what resources are available and what constraints
may stand in the way of achieving the envisaged future state. The second stage deals with the actual
formulation and conveyance of the envisaged future state. Thus, he /she formulates and articulates a
vision to followers. During the final stage the leader attempts to build trust in the vision, demonstrates
how the vision can be achieved and creates the conditions necessary to successfully implement a
vision-serving strategy (Conger & Kanungo, 1998). This model measures leadership and the change
process in three easily identified stages and is the base-line structure used to develop the LBI.
The LBI interprets leadership as a complex, continuous process expressing itself in an extensive array
of inter-dependent behavioural actions and driven by an intricate nomological network of situational
and person-centred latent variables. The process entails (a) the assessment of the internal and external
environment of the unit; (b) the development and selling of an environmentally appropriate yet
challenging vision for the unit; (c) the preparation of the unit for the implementation of the vision; and
finally (d) the bold yet honest implementation of the vision by the continually monitoring, revitalizing,
fine-tuning and orchestrating a multitude of prerequisites for unit success in terms of the vision
15

(Spangenberg & Theron, 2002). The LBI comprises four phases and twenty-four (first-order)
dimensions. The twenty-four LBI dimensions are listed in Table 1 below:
TABLE 1
FIRST-ORDER LATENT LEADERSHIP DIMENSIONS MEASURED BY THE LBI Assessment of the internal and external environment of the unit Awareness external environment (Awex)
Identifies and interprets external developments that may affect unit performance. Understands the business
and positioning of the organization
Awareness internal environment (Awin)
Interprets internal dynamics and identifies weaknesses that may affect unit performance
Development and selling of an environmentally appropriate yet challenging vision for the unit
Developing challenging vision (Visi)
Develops a vision that gives people a sense of purpose, is customer-focused and advances diversity of
people
Building trust (Trus)
Builds confidence in the unit and visibly supports the missions and values of the unit
Articulating vision and enlisting followers (Arti)
Articulates a vision for the future that provides direction, excites followers and that inspires commitment in
followers
Conceptualising strategy (Stra)
Builds strategies and plans based on thorough problem analysis and broad-based fact-finding. Considers
consequences of decisions.
Preparation of the unit for the implementation of the vision
Enabling the leader: personal growth (Risk)
Identifies challenging opportunities for self-development and is committed to continuous learning. Risks
new ways of doing things.
Enabling the leader: self-discovery and –management (Lead)
Has good insight into own capabilities, weaknesses and behaviour and manages him/herself well.
Empowering followers (Foll)
Facilitates the personal growth of followers and creates a “hassle” –free environment that provides
ownership for work.
Optimising structures and systems (Syst)
Adapts structures, processes and procedures to support implementation of strategy in a changing
environment.
Building culture (Cult)
Develops a culture of openness that facilitates employee diversity and participation and is directed at high
performance.
16
Implementation of the vision
Influencing the external environment (Infl)
Builds the image of the organization and practices good citizenship.
Honesty and integrity (Hono)
Considers ethical implications of decisions, assures agreed upon values are adhered to and deals honestly
with all stakeholders.
Decisiveness and hardiness (Deci)
Acts decisively and makes tough decisions. Performs effectively under stress and reacts positively to
change and uncertainty.
Challenging current reality (Valu)
Challenges current thinking, reconsiders current practices and improves work methods.
Facilitating learning (Lear)
Encourages followers to express their ideas and feelings and develops full understanding for their
problems. Promotes continuous learning.
Interpersonal skills (Mana)
Effectively handles interpersonal and group relations.
Showing concern for others (Trea)
Shows concern for the aspirations, needs and feelings of others.
Inspiring people (Insp)
Raises the aspirations, confidence and motivation of followers. Conveys the message convincingly.
Facilitating interdepartmental co-ordination (Coor)
Facilitates interdepartmental co-ordination and helps people to see the big picture.
Acting entrepreneurial (Acti)
Develops new ideas, seizes opportunities and initiates projects for the benefit of the unit.
Developing and implementing performance plans (Plan)
Ensures that employee and unit goals and plans support organizational strategy and that employees know
what is expected of them.
Reviewing performance (Revi)
Provides followers with feedback about unit performance as well as with specific feedback about their own
performance.
Rewarding performance (Rewa)
Acknowledges positive employee performance and behaviour; celebrates success.
(Theron & Spangenberg, 2005)
Spangenberg and Theron (2002) report in their initial study on the development of the LBI that
significant and high to extremely high correlations occur between the first-order latent leadership
dimensions depicted in Table 1. Theron and Spangenberg (2005) speculate on the possibility that these
17
correlations could in part be explained by a complex interchange that exists between the first-order
leadership factors. They conclude that this possibility should not be ruled out and that hypotheses on
the presumed nature of these structural relations should in future be tested. The correlations observed
between the twenty-four first-order latent leadership dimensions could, however, also be attributed to
the existence of one or more second-order leadership latent variables (Avolio, Bass and Jung, 1999;
Marsh and Hocevar, 1985).
These second-order leadership latent variables represent common themes shared by a number of first-
order latent leadership variables (Bollen, 1989). Second-order latent variables are broader, more
general constructs. Second-order latent variables do not, however, explain all the variance in the more
specific first-order latent variables. There is systematic variance, unique to the more specific first-order
latent variables, that is not related to the more general second-order factors (Hull, Tedlie & Lehn,
1995). Second-order leadership latent variables on the LBI should be interpreted as broad leadership
competencies. A second-order leadership latent variable thus should be interpreted as the abstract
common theme shared by the abstract common themes in a number of bundles of behaviour each of
which constitutes leadership success because they each serve individual and unit performance.
Theron and Spangenberg (2005) suggested that the second-order factor structure reported by Avolio,
Bass and Jung (1999) for the Multifactor Leadership Questionnaire (MLQ) could possibly be used (at
least in part) to develop a second-order factor structure for the LBI. Bass (1985) developed the MLQ
to measure transactional and transformational leader behaviour.
2.3 CHARISMATIC TRANSFORMATIONAL LEADERSHIP
Although many theorists recognized that leadership occurs at all levels of an organization and that the
impact of these leaders contributes to the overall performance of the organization, there has always
been a fascination with leaders who do more than the mundane, everyday activities (Chemers, 1997).
Following the major recession of the 1970s, Peters and Waterman (1982), conducted an analysis of
American ‘successful’ companies, in which they emphasized the role of the transforming leader. This
kind of leader was seen as being able to articulate a vision for the organization, communicating this
vision by his/her passion and charisma and defining a meaning for the organization and transforming
its culture (Warr, 2002). Bryman (1992) described the models that emerged from this analysis as the
‘new paradigm’. A number of models were identified as falling into this category, and included the
18

models of charismatic leadership of House (1977) and Conger (1989), Saskin’s (1988) notion of
visionary leadership and a number of transformational leadership models, of which Bass’s is the most
famous. Thus, Bryman states that this ‘new paradigm’ approach sees leaders as managers of meaning,
rather than in terms of their direct influence on the behaviour of subordinates (Warr, 2002). In the
1970s, behavioural theories of leadership effectiveness were quite dominant. Examples of these
theories include path-goal theory (House & Mitchell, 1974); LMX theory (Graen & Cashman, 1975)
and normative decision theory (Vroom & Yetton, 1973). Since the late 1980s, theories of
transformational and charismatic leadership have been on the increase (Yukl, 1999). This growth in
interest has coincided with significant geopolitical, social and economic changes. The charismatic and
transformational leader represents a new genre of leadership that may be capable of steering
organizations through the chaos of the twenty first century. According to this genre of leadership
theories, these leaders attempt to transform the needs, aspirations, and values of followers from a focus
on self-interests to a focus on the collective interests (Lussier & Achua, 2004). There have been a
number of versions of transformational leadership which have been proposed by several theorists,
including Bass (1985, 1996); Bennis and Nanus (1985); Burns (1978); Sashkin (1988); and Tichy and
Devanna (1986, 1990). Refined versions of charismatic leadership have been proposed by several
theorists, including Conger (1989); Conger and Kanungo (1987, 1998); House (1977); Shamir, House
and Arthur (1993) which were all based on the ideas of Max Weber (1947) (Yukl, 1999).
The roots of transformational leadership theory are to be found in the writings of German sociologist,
Max Weber (Yukl, 1999). He explained charisma as a form of influence on people’s perceptions and
belief that the leader possesses the gift of divine inspiration or supernatural qualities (Lussier & Achua,
2004; Northouse, 1997; Northouse 2004). Weber (1947) provided the most well-known definition of
charisma: “a distinct social relationship between the leader and follower, in which the leader presents a
revolutionary idea, a transcendent image or ideal which goes beyond the immediate…or the reasonable,
while the follower accepts this course of action not because of its rational likelihood of success…but
because of an effective belief in the extraordinary qualities of the leader” (Lussier & Achua, 2004, p.
341). He differentiated charismatic authority from the more traditional or legal/bureaucratic forms of
authority. According to Weber, the gift of divine inspiration is the driving force that allows the leader
to focus society’s attention on the crisis it faces as well as on his/her vision for a better future (Lussier
& Achua, 2004). Despite Weber’s emphasis on charisma as a personality characteristic, he also
recognized that followers played an important role in validating charisma in these leaders (Northouse,
1997).
19

The major application of charisma to the study of formal organizations can be found in House (1977).
In his theory of charismatic leadership House defined charisma as the extraordinary levels of devotion,
identification and emulation that are aroused in followers (Chemers, 1997). House developed a number
of testable hypotheses about the characteristics and behaviours of charismatic leaders, situational
factors and other issues. He also discussed a number of effects of charismatic leadership: followers
trust in the truthfulness of the leader’s beliefs, a degree of similarity of beliefs develops between the
leader and the followers, affection for and obedience given to the leader, a degree of emotional
involvement of the followers in the leader’s mission, improved follower performance in their tasks, and
a belief that the followers can contribute to the mission’s achievement. House also described the
characteristics of a charismatic leader. These include a high level of self-confidence, a tendency to
dominate, a need to influence others, and a strong conviction in the integrity of one’s own beliefs
(Bryman, 1992; Northouse, 2004). House provided a framework that many later scholars could build
on. His model was multi-dimensional including leader behaviours and dispositional variables, follower
effects and situational variables (Conger, 1999). Furthermore, House’s (1977) theory of charismatic
leadership laid the groundwork for moving the study of transformational leadership in a quantitative,
empirical direction. Many theorists following House continued to refine the psychological and
behavioural characteristics of transformational leadership. These theorists broadened the definition of
such leadership beyond charisma and brought its effects into the pragmatic domain of formal
organizations (Chemers, 1997).
2.4 TRANSFORMATIONAL AND TRANSACTIONAL LEADERSHIP
There has been a strong focus in leadership research since the early 1980s on transformational
leadership. According to Bryman (1992) transformational leadership forms part of “the New
Leadership” paradigm. Transformational leadership is a process that changes and transforms
individuals as well as involves assessing followers’ motives, satisfying their needs and treating them as
complete human beings. It is a process that subsumes charismatic and visionary leadership.
Transformational leadership tends to be an encompassing approach that can be used to describe a wide
range of leadership, from very specific attempts to influence followers on a one-to-one level, to very
broad attempts to influence whole organizations and even entire cultures (Northouse, 2004).
20
The term transformational leadership was first introduced by Downton (1973) and its emergence as an
important approach to leadership began with the work of the political sociologist James MacGregor
Burns (1978). House (1977) published his work regarding the theory of charismatic leadership at about
the same time Burn’s book was published. Charismatic leadership is often described in ways that
makes it similar to transformational leadership, if not at times even synonymous. House (1977)
suggested that charismatic leaders act in unique ways that have specific charismatic effects on their
followers. In the mid-1980s, Bass (1985) provided a more expanded and refined version of
transformational leadership that was based on, but not fully consistent with, the prior works of Burns
(1978) and House (1977) (Northouse, 2004).
2.4.1 Burns’ theory of transforming leadership
Burns (1978) described leadership as the way leaders induce their followers to strive for certain goals
that represent the values and the motivations, the wants and needs, the aspirations and expectations of
the leader and the follower. The interaction between the leader and follower is based on different levels
of motivation and power potential, including skill, which is in pursuit of a common or joint purpose.
This interaction takes two different forms, namely transactional and transforming leadership.
Transactional leadership occurs when an individual takes the initiative to make contact with others for
the purpose of an exchange of valued things. Beyond this the relationship does not go any further.
Transactional leadership is an exchange between a leader and follower. The relationship is merely
based on an exchange of valued things. The parties do not have an enduring purpose that holds them
together. Although a leadership act does take place, there is nothing that binds the leader and follower
together in a mutual and continuing pursuit of a higher purpose (Burns, 1978). Followers receive
certain outcomes (for example wages, prestige) when they act in accordance with their leader’s wishes
(Burns, 1978; Den Hartog, van Muijen & Koopman, 1997). Thus, the leader exchanges rewards
contingent upon a display of desired behaviours. The leader initiates contact with subordinates in an
effort to exchange something of value, such as rewards for performance, mutual support, or bilateral
disclosure (Lowe, Kroeck & Sivasubramaniam, 1996). The values inherent in the exchange process
include that of honesty, fairness, responsibility and reciprocity (Yukl, 1989).
Burns (1978) contrasted transactional leadership with transformational leadership. He thought of these
two types of leadership as being at opposite ends of a continuum. He, therefore, viewed
transformational leadership as being distinct from and an alternative to transactional leadership.
21
According to Burns, transformational leadership is a process in which leaders attempt to raise the
consciousness of followers by appealing to their higher ideals and moral values. He viewed the
transformational leader as one who engages with their followers and they raise one another to a higher
level of motivation and morality (Bass, 1999; Burns, 1978; Dvir, Eden, Avolio & Shamir, 2002; Lowe
et al., 1996). This type of leadership becomes moral in that it raises the level of human conduct and
ethical aspiration of both leader and follower and thus it has a transforming effect on both (Burns,
1978). Higher aspirations or goals of the group are expected to transcend the individual and result in
the achievement of significant change in work unit effectiveness. A transformational leader is someone
who articulates a vision of the future that can be shared by followers, intellectually stimulates them and
also takes into account individual differences among his/her followers (Lowe et al., 1996). In terms of
Maslow’s hierarchy of needs, transformational leaders attempts to satisfy the higher-order needs of
followers, that is, to satisfy self-actualization needs rather than the lower-order needs. For Burns
transformational leadership can be displayed by anyone in the organization in any type of position
(Dvir, Eden, Avolio & Shamir, 2002; Yukl, 1989).
2.4.2 Bass’ theory of transformational leadership
Bass and his colleagues contributed a great deal to the study of transformational leadership (Yukl,
1999). Their research programme helped to broaden the definition of charismatic or transformational
leadership by making it more appropriate to the setting of complex, formal organizations (Chemers,
1997). Bass (1985) extended Burns’ (1978) work by paying more attention to followers’ needs rather
than leaders’ needs. He also suggested that transformational leadership could apply to situations where
the outcomes were not positive, and by describing transformational and transactional leadership as two
inter-related but separate continua rather than a single continuum with two mutually exclusive poles.
Further, Bass (1985) also extended House’s (House, 1976) work by providing more attention to the
emotional elements and origins of charisma and by suggesting that charisma is necessary but it is not
sufficient for transformational leadership (Northouse, 2004).
Bass (1985) defined transformational leadership in terms of the leader’s effect on his/her followers.
The leader motivates followers to do more than they would be expected to do under normal
circumstances and as a result followers feel trust, admiration, loyalty and respect towards their leader.
The leader influences his/her followers by arousing strong emotions and they identify quite strongly
with the leader. As a result of such identification with the leader, the leader develops the ability to
22

transform followers. The transformational leader can transform followers by helping them become
more aware of the importance of task outcomes; inducing them to transcend their own individual
interest for the sake of the group or organization; activating their higher-order needs. Bass claimed that
charisma is an important ingredient of transformational leadership but is not the only factor to account
for the transformational process (Yukl, 1989). Transformational leaders tend to seek new ways of
working, seek opportunities in the face of risk, and are less likely to support the status quo. They do not
merely react to environmental circumstances, they attempt to shape and create them (Lowe et al.,
1996).
Bass (1985) described a transactional leader as likely to operate within the existing system, to have a
preference for risk avoidance, and to be attentive to time constraints and efficiency. This type of leader
is likely to be effective in stable, predictable environments. The relationship between a leader and
follower is characterized by an equitable leader-member exchange, where the leader fulfills the needs
of the followers in exchange for their performance meeting basic expectations. The transactional leader
does not individualise the needs of his/her followers and does not focus on their personal development.
They are usually influential as it would be in the best interests of the followers to do what the leader
wants (Bass, 1985; Lowe et al., 1996; Northouse, 2004). Transactional leadership is described as an
exchange that takes place among leaders, colleagues and followers. The leader discusses with his/her
subordinates what is required from them and explains the conditions and rewards they would receive if
they fulfill those requirements (Bass & Avolio, 1994; Lowe et al., 1996).
Bass (1985) viewed the transformational and transactional leadership paradigm as being
complementary rather than polar constructs although this stance is not always readily apparent in the
manner the two concepts are presented. Both leadership competencies are required for the achievement
of goals and objectives. The transformational leadership competency is complementary to the
transactional competency, in the sense that transformational leadership would be ineffective without a
transactional relationship between a leader and a subordinate. Therefore, a successful leader needs to be
both transformational and transactional. Thus, transformational leadership augments transactional
leadership to achieve higher levels of subordinate performance, the difference being in the process
through which the leader motivates subordinates and the type of goals that are set to be achieved (Lowe
et al., 1996).
23

The manner in which Bass (1985) and Burns (1978) conceptualize transformational leadership have a
number of aspects that are similar, however, there are also a number of differences. Burns (1978) limits
transformational leadership to enlightened leaders who appeal to positive moral values and higher-
order needs of followers. Bass (1985), in contrast, suggests that a transformational leader is one who
activates follower motivation and increases follower commitment, regardless of whether the effects
ultimately benefit followers. Both Bass (1985) and Burns (1978) view transactional leadership as an
exchange process of rewards for follower compliance. However, Bass (1985) defined transactional
leadership in broader terms than Burns (1978). The exchange process includes the use of incentives,
contingent rewards, influence motivation as well as clarification of the work required to obtain rewards.
Bass considered transactional and transformational leadership as distinct but not mutually exclusive
processes, and that the same leader may use both types of leadership at different times in different
situations (Yukl, 1989). Whereas Burns (1978) conceived the two types of leadership as opposite ends
of a continuum, Bass (1985) views them as separate dimensions. Therefore, according to Bass a leader
can be both transactional and transformational (Bryman, 1992). The LBI seems to hold the even
stronger opinion that to be effective a leader should be both transactional and transformational.
Further, Burns adopted more of a broad-brush account, whereas Bass seeks to outline the components
of the two types of leadership, and is concerned to specify their content more precisely (Bryman,
1992).
An explanation of the dynamics of the transformation process is provided in Bass’s model of
transformational and transactional leadership (Bass, 1985). This model incorporates seven different
factors and these factors are illustrated in the full range leadership model, which is depicted in Table 2
below. A discussion of these factors will be provided to help clarify Bass’s model. This discussion will
present transformational leadership, transactional leadership and laissez-faire leadership as distinct
higher-order leadership dimensions and will explicate the narrower first-order within each secondary
leadership factor. The components of the transformational leadership model have evolved somewhat
since Bass’s original 1985 publication, however, the changes have been relatively minor (Conger,
1999; Northouse, 2004).
24

TABLE 2
FULL RANGE LEADERSHIP MODEL Transformational leadership Transactional leadership Laissez-faire leadership
Factor 1:
Idealized influence
Charisma
Factor 5:
Contingent reward
Constructive transactions
Factor 7:
Laissez-faire
Non-transactional
Factor 2:
Inspirational Motivation
Factor 6:
Management-by-exception,
Active and passive
Corrective transactions
Factor 3:
Intellectual stimulation
Factor 4:
Individualized consideration
(Conger, 1999; Northouse, 2004)
2.5 TRANSFORMATIONAL LEADERSHIP FACTORS
2.5.1 Idealized Influence (also called charisma)
Bass (1985) described the leaders as behaving in ways that result in being seen as role models for their
followers. The leaders are admired, respected, and trusted. Followers generally identify quite strongly
with the leader and want to emulate them (Bass, Avolio, Jung & Berson, 2003). They provide a vision
and a sense of mission, which, when it is effectively articulated, instills pride, gains respect and trust
and increases optimism (Bryman, 1992; Den Hartog, van Muijen, Koopman, 1997; Lowe et al., 1996;
Northouse, 2004). These leaders usually have very high standards of moral and ethical conduct and are
consistent in conduct with underlying ethics, principles and values (Bass, Avolio, Jung & Berson,
2003; Northouse, 2004). Charisma is considered by many (Conger and Kanungo, 1988; Waldman,
Bass and Yammarino, 1990) as being the most critical behaviour in the transformational leadership
model (Humphreys, 2001).
25

2.5.2 Inspirational Motivation
Leaders behave in ways that motivate their subordinates by providing meaning and challenge to their
work. They usually communicate high expectations to their followers, inspiring them through
motivation to become committed to and be part of the vision. Bass (1985) sees inspiration as ‘a
subfactor within charismatic leadership.’ He suggests that charismatic leadership clearly inspires, in
that it arouses and incites, but that inspiration can occur without charismatic leadership (Bryman,
1992).
2.5.3 Intellectual stimulation
Leaders stimulate followers’ effort to be innovative and creative by questioning assumptions, by
approaching old situations in new ways, and rethinking of the ways in which things were done in the
past (Bass, Avolio, Jung & Berson, 2003; Den Hartog, van Muijen & Koopman, 1997; Northouse,
2004). The leader also provides followers with support as they test the new approaches (Humphreys,
2001; Northouse, 2004). They promote followers’ thinking things out on their own and engaging in
careful problem solving (Doherty, 1997; Northouse, 2004).
2.5.4 Individualised Consideration
Leaders provide a supportive climate by listening carefully to the individual needs of their followers
while acting as a coach or mentor (Bass, 1985; Den Hartog, van Muijen, Koopman, 1997; Humphreys,
2001; Northouse, 2004). New learning opportunities are created along with a supportive environment
in which followers can grow to their fullest potential (Bass, Avolio, Jung, Berson, 2003; Den Hartog,
van Muijen, Koopman, 1997) The leader may use delegation as opportunities for growth and to
stimulate learning experiences (Northouse, 2004).
2.6 TRANSACTIONAL LEADERSHIP FACTORS
2.6.1 Contingent reward
The leader clarifies expectations and offers recognition when goals are achieved (Bass, Avolio, Jung,
Berson, 2003; Den Hartog, van Muijen, Koopman, 1997). This refers to an exchange process between
26
leaders and followers in which effort by followers is exchanged for specified rewards (Northouse,
2004; Tejeda, Scandura, Pillai, 2001) Rewards are provided in exchange for follower compliance with
their leader demands. Thus, the rewards are conditional upon followers’ behaviour (Lowe et al., 1996;
Tejeda, Scandura, Pillai, 2001).
2.6.2 Management-by-exception
This refers to leadership that involves corrective criticism, negative feedback and negative
reinforcement. This usually takes two forms, namely, active management-by-exception and passive
management-by-exception (Northouse, 2004). During active management-by-exception the leader
closely monitors follower’s performance for mistakes or rule violations and then takes corrective action
if the follower fails to meet the necessary standards (Bass, Avolio, Jung & Berson, 2003; Den Hartog,
van Muijen & Koopman, 1997; Tejeda, Scandura, Pillai, 2001). A leader using passive management-
by-exception waits for problems to arise and only takes action when the necessary standards have not
been met. (Bass, Avolio, Jung & Berson, 2003; Northouse, 2004).
2.6.3 Laissez-faire leadership
This represents the absence of leadership, thus, it is the complete avoidance of leading. The leader
abdicates his/her responsibilities as a leader, does not make decisions, gives no feedback to
subordinates, and there is no attempt to help followers to grow (Northouse, 2004; Den Hartog, van
Muijen & Koopman, 1997; Humphreys, 2001).
2.7 THE MULTIFACTOR LEADERSHIP QUESTIONNAIRE
Bass (1985) developed an instrument to measure transactional and transformational leader behaviour.
This instrument would also be used to investigate the nature of the relationship between these leader
behaviours, and other relevant variables hypothesized to be affected by the quality of leadership like
work unit effectiveness and follower satisfaction. The instrument, named as the Multifactor Leadership
Questionnaire (MLQ) was conceptually developed and empirically validated to reflect the
complementary dimensions of transformational and transactional leadership with subscales to further
differentiate leader behaviour. Research on Multifactor Leadership Theory has been conducted using
the MLQ as the primary measurement tool (Lowe et al., 1996; Northouse, 2004; Yukl, 1999). Yukl
27
noted (1994, p. 353) “most of the research on the theory has involved the use of a questionnaire called
the Multifactor Leadership Questionnaire (MLQ) to measure various aspects of transformational and
transactional leadership.”
The conceptual basis for the original factor structure for the MLQ started with the description of
transforming leadership developed by Burns (1978). About 70 executives were interviewed by Bass
and his associates in South Africa. The executives were asked to think of leaders within their
experiences who had raised their awareness to broader goals, moved them to higher motives, or
inspired them to put others’ interests ahead of their own. The executives were then asked to describe
how these leaders behaved, thus what they did to effect change. Added to this were items from prior
literature on charisma. Based on these descriptions, Bass constructed the questions that made up the
MLQ. The original 142 items that were generated were sorted by 11 judges into transformational and
transactional contingent reward leadership categories. The final set of 73 items were administered to
176 senior US Army Officers who were asked to describe their superiors. Emerging from this analyses
were three transformational factors – charismatic leadership (including inspirational leadership),
individual consideration, and intellectual stimulation; and two transactional factors – contingent reward
and management-by-exception (Bass, 1985; Lowe et al., 1996; Northouse, 2004). In the early research
undertaken on the MLQ, inspirational leadership was subsumed under charismatic leadership as there
was difficulty disentangling it. Moreover, there was not a measure of laissez-faire leadership, no
distinction was made between contingent promises and rewards, as well as the active and passive forms
of management-by-exception were not distinguished (Bryman, 1992).
When reviewing the literature on the Multifactor Leadership Theory (MLT) it becomes clear that there
are quite a number of different measures of MLT constructs. Although most research has used the
MLQ, some of the studies have developed new measures, employed modifications of the MLQ, or used
various forms of the MLQ itself (Tejeda, Scandura & Pillai, 2001). The MLQ has undergone a number
of revisions and there are slightly different versions to reflect the special characteristics of the
organizations from which the various samples of leaders have been taken. It continues to be redefined
to strengthen its reliability and validity. The MLQ has since undergone quite a bit of research as the
primary quantitative instrument to measure the transformational leadership construct (Bryman, 1992;
Lowe et al., 1996; Northouse, 2004). Different behaviours are involved in transformational and
transactional leadership. The behaviours are measured with the MLQ, which is administered to
subordinates/followers that measure their perceptions of how frequently their leader uses each type of
28
behaviour. The MLQ is made up of a number of questions that measure followers’ perceptions of a
leader’s behaviour which is based on the seven factors in the transformational and transactional
leadership model as well as items that measure extra effort, effectiveness and satisfaction. The content
of the MLQ has varied somewhat over time and additional transformational and transactional
behaviours have been added to the recent versions (Northouse, 2004; Yukl, 1999). The following
transformational and transactional components have been identified by the MLQ: idealized influence,
inspirational motivation, intellectual stimulation, individualized consideration, contingent reward,
management-by-exception (active), management-by-exception (passive) as well as laissez-faire
(Northouse, 2004; Warr, 2002).
Most of the survey studies using the MLQ and similar questionnaires found that transformational
leadership is positively related to indicators of leadership effectiveness such as subordinate satisfaction,
motivation and performance. In a meta-analytical review of 39 studies which used the MLQ, Lowe,
Kroeck and Sivasubramaniam (1996) found that key elements of transformational leadership correlated
positively with subordinate satisfaction and performance. Contingent reward, which is a transactional
behaviour also correlated positively with the criteria, although the results were weaker and less
consistent. Transformational leadership was found to be effective in a variety of different situations
using descriptive studies based on interviews and observations (Yukl, 1999).
Most factor analytical studies have supported the distinction between transformational and
transactional behaviour, however, a number of discrepancies have been found. Certain studies have
found that positive reward behaviour loads on the transformational factor instead of the transactional
factor. Some studies also found that laissez-faire leadership and passive management-by-exception
actually form a separate factor rather than loading on transactional leadership (Yukl, 1999).
2.8 THE FACTOR STRUCTURE OF THE MULTIFACTOR LEADERSHIP
QUESTIONNAIRE
The factor structure of a 24-item (reduced) version of Bass and Avolio’s (1990) 72-item MLQ was
examined by Tepper and Percy (1994). They employed confirmatory factor analysis (CFA) to examine
the hypothesized structure of the MLQ using a reduced set of items from the MLQ Form X. Tepper and
Percy found that none of the hypothesized models could be confirmed. In subsequent exploratory
analyses, they found that the charismatic and inspirational leadership scales converged to a single
29
construct and that the management-by-exception scales may require improvement or reinterpretation as
a result of their relationship to the contingent reward scale.
Bycio, Hackett and Allen (1995) conducted confirmatory factor analysis using the original five-factor
model hypothesized by Bass (1985). This study used all the transformational and transactional MLQ
items. They used the earliest available version of the MLQ with only transformational and transactional
items and an earlier version of the Multifactor Leadership theory. Support was found for the basic
hypotheses of Multifactor Leadership theory, however, there were high proportions of error variance in
the transactional scales and high intercorrelations among the transformational scales. Bycio et al.
(1995) raised the issue that there remains unresolved psychometric issues with the MLQ, specifically
the first-order factor structure.
A study done by Tejeda, Scandura and Pillai (2001) hypothesesed that there would be high
intercorrelations among the subscales of the MLQ (Form 5X) and that confirmatory factor analysis
would reveal poor model fit for the first-order hypothesized structure. This was supported and this has
significant implications for the MLQ. Their study does not lend support to the continued use of the full-
item MLQ. They, therefore, proposed a 27-item reduced version of the MLQ. Tejeda et al. (2001) was
able to demonstrate in independent data sets that the transformational and transactional scales of the
27-item version were internally consistent in all their samples. The proposed 27-item reduced version
of the MLQ seems to be a reasonable representation of Bass and Avolio (1993) first- and second-order
structures of the full-item set of the MLQ.
During the past fifteen years, there have been many leadership studies that have used some form of the
MLQ. However, the validity of the MLQ has not been fully established. In certain versions of the
MLQ, the four factors of transformational leadership (idealized influence, inspirational motivation,
intellectual stimulation and individualized consideration) have been found to correlate very high with
each other, which suggest that they are not distinct factors. Further, some of the transformational
factors also correlate with the transactional and laissez-faire factors, which suggest that they are not
unique to the transformational model. As a result of these findings serious questions are raised of the
MLQ and about the clarity of the transformational leadership model. However, the new, improved 27-
item version of the MLQ that has been developed holds promise for validating the legitimacy of the
theory (Northouse, 2004).
30
After Bass’s (1985,1988) proposal of a six-factor model of transactional and transformational
leadership, many theorists (Bass, 1985, 1990); Bass & Avolio, 1990, 1993, 1994; Bryman, 1992;
Bycio, Hackett & Allen, 1995; Den Hartog, Van Muijen & Koopman, 1997; House & Podsakoff, 1994;
Hunt, 1991; Waldman, Bass & Einstein, 1987; Yammarino & Bass, 1990; Yukl, 1994) have offered
recommendations, analyses, reviews and critiques to modify the components in this model. These
modifications arose because many theorists could not replicate the six-factor model that was introduced
by Bass (1985). Consequently, recommendations were made to collapse certain of the original
leadership factors into higher-order factors such as transformational leadership.
Subsequent to the six-factor model reported by Bass (1985), a number of analyses looking at the
various forms of the MLQ appeared in the literature. Many authors raised concerns about whether the
components of transformational leadership should be considered independent of contingent reward
leadership, and/or whether contingent reward leadership should be seen as a separate factor. Further,
many authors highlighted that the components of transformational leadership could not be
distinguished empirically. Hater and Bass (1988) indicated that management-by-exception could be
divided into two sub-factors, that is, active versus passive. However, recent results indicated that
passive management-by-exception and laissez-faire leadership should be formed into a single higher-
order factor. Den Hartog et al. (1997) indicated that there was a correlation between ratings of laissez-
faire leadership and passive management-by-exception, and that these scales correlated negatively with
all the other scales in the MLQ.
Avolio, Bass and Jung (1999) set out to test the six-factor model of Bass (1985) in a broader and more
diverse sample of respondents. They aimed to examine whether a revised version of the MLQ (Form
5X) would produce a more stable and replicable factor structure. The Form 5X version of the MLQ was
designed to address certain of the limitations of the earlier versions of the MLQ. The six first-order
factors measured by the MLQ (Form 5X) are: charisma/inspirational, intellectual stimulation,
individualized consideration, contingent reward, active management-by-exception, passive-avoidant
leadership.
In the above study the authors constructed a passive-avoidant leadership factor which contains both sets
of items from the laissez-faire and passive management-by-exception scale. Avolio et al. (1999) used
as its primary base target the six-factor model proposed by Bass (1985) to test eight alternative first-
31

order measurement models. The best model fit was the original six-factor model which held up with
relatively little shrinkage in terms of its fit when tested against the competing measurement models.
In an effort to address the problem of a lack of discriminant validity among the six first-order scales as
indicated by high correlations amongst the scales, Avolio et al. (1999) tested three hierarchical models.
The models are as follows:
• Model one: In addition to the six first-order factors were two uncorrelated second-order factors,
including, active constructive (charisma/inspirational, intellectual stimulation, individualized
consideration and contingent reward) and passive corrective (management-by-exception and
laissez-faire) leadership.
• Model two: This model included three uncorrelated second-order factors, including,
transformational (charismatic/inspirational and intellectual stimulation),
developmental/transactional (individualized consideration and contingent reward) and passive
corrective (management-by-exception and laissez-faire) leadership.
• Model three: This model contained two correlated second-order factors, including
transformational leadership (charismatic/inspiration, intellectual stimulation),
developmental/transactional (individualized consideration and contingent reward) and a third
uncorrelated corrective avoidant factor (management-by-exception and laissez-faire) leadership.
The model found to fit the best was model three which contained two correlated second-order factors
and a third uncorrelated factor to the six first-order factors.
2.9 A SECOND-ORDER FACTOR STRUCTURE FOR THE LBI BASED ON THE MLQ
SECOND-ORDER FACTORS
The results of the Avolio et al. (1999) research study indicated that the factor structure for the MLQ
survey was best represented by six first-order factors and three correlated second-order factors. By
including two second-order factors to represent the transformational and transactional leadership
factors, Avolio et al. (1999) was able to reduce the latent correlations and enhance the discriminant
validity between the transformational second-order factor containing charisma, inspirational and
intellectual stimulating leadership and the transactional second-order factor containing individualized
consideration and contingent reward. Could the second-order structure isolated by Avolio et al. (1999)
be adapted to explain the correlations observed between the first-order factors of the LBI?
32
An inspection of the latent correlations indicated there was a distinct second-order transformational
factor that correlated with a developmental/transactional factor. The results further indicated that a
passive corrective second-order factor was clearly distinguishable from the other two second-order
factors. The intercorrelations among each of the second-order factors also provided further evidence for
discriminant validity (Avolio et al., 1999).
The positive correlations between the transformational and transactional leadership scales can be
expected for a number of reasons. Firstly, both transformational and transactional leadership represent
active and constructive forms of leadership. Secondly, effective leaders would display varying amounts
of both transactional and transformational leadership (Avolio & Bass, 1995; Bass & Avolio, 1993,
1994). Thirdly, by consistently fulfilling agreements, it provides conditions for building trust and
dependability which could contribute to the high levels of trust and respect associated with
transformational leadership (Shamir, 1995). Therefore, although conceptually unique it is reasonable to
obtain a positive correlation among these factors. Active management-by-exception also positively
correlated with passive management-by-exception and passive avoidance, which is consistent with
previous studies (Bass & Avolio, 1990, 1993) using earlier forms of the MLQ. Lastly, the passive-
avoidance factor correlated negatively with the transformational and transactional leadership scales.
By using the transformational and transactional leadership factors proposed by Avolio et al. (1999) as a
second-order factor structure it could assist in explaining the correlations between the first-order LBI
latent leadership variables. However, the corrective avoidant factor seems unlikely to constitute a
common theme shared by a number of first-order latent leadership variables (Theron & Spangenberg,
2005).
As indicated earlier, House (1995) provided a description of leadership which comprised three
elements, namely, general leadership, which entails providing purpose, meaning and guidance to
followers, articulating and implementing a compelling vision; management, which implies a position of
formal authority that results in compliance of organizational members; supervisory leadership entails
giving guidance, support and corrective feedback to followers on a day-to-day basis. The LBI
encompasses elements of all three definitions and the various first-order dimensions could
meaningfully be categorized under House’s (1995) description of leadership (Theron & Spangenberg,
2005). Table 3 depicts the manner in which Theron and Spangenberg (2005) proposed that the twenty-
33

four first-order LBI leadership dimensions should load on the leadership factors distinguished by
House (1995). By proposing this linkage between the first-order LBI dimensions and House’s (1995)
three elements of leadership, Theron and Spangenberg (2005) thereby also provided a useful
framework that can assist when constructing a second-order factor structure based on the Avolio et al.
(1999) best fitting second-order factor model. This seems a reasonable contention because it does not
seem unreasonable to argue that House’s (1995) dimensions of general leadership, management and
supervisory leadership can be conceptually linked to transformational and transactional leadership.
General leadership falls within the realm of charismatic or transformational leadership, and
management and supervisory leadership ensure that employees meet work requirements, and provide
support and work-related feedback which can be linked to transactional leadership (Theron &
Spangenberg, 2005).
TABLE 3
HOUSE’S (1995) DIMENSIONS OF LEADERSHIP AND THE CORRESPONDING LBI DIMENSIONS
General Leadership Supervisory Leadership Management Behaviours
These leader behaviours
theoretically influence the
values, motives and self-concepts
of followers. House (1995) listed
these behaviours as there is
substantial evidence of their
effectiveness from empirical
research or historical sources.
Developing challenging
vision (Visi)
Building trust (Trus)
Empowering followers (Foll)
Honesty & integrity (Hono)
Decisiveness & hardiness
(Deci)
Inspiring people (Insp)
Acting entrepreneurial (Acti)
Articulating vision &
enlisting followers (Arti)
Enabling the leader: personal
growth (Risk)
Enabling the leader: self-
These behaviours involve monitoring,
guiding and providing corrective
feedback to followers on a day-to-day
basis.
Empowering followers (Foll)
Building culture (Cult)
Interpersonal skills (Mana)
Showing concern for others (Trea)
Inspiring people (Insp)
Developing & implementing
performance plans (Plan)
Rewarding performance (Rewa)
Facilitating learning (Lear)
Facilitating interdepartmental co-
ordination (Coor)
These behaviours are rational-
analytic and are concerned with the
developmental and implementation of
organizational strategies, tactics, and
policies. Examples include planning,
organizing and establishing
administrative systems.
Awareness external environment
(Awex)
Awareness internal environment
(Awin)
Conceptualising strategy (Stra)
Optimising structures & systems
(Syst)
Challenging current reality (Valu)
Developing & implementing
performance plans (Plan)
Reviewing performance (Revi)
Rewarding performance (Rewa)
34
discovery & -management
(Lead)
Influencing the external
environment (Infl)
In terms of the foregoing argument it seems reasonable to contend that all the first-order LBI factors
loading on the management and supervisory leadership factors in Table 3 could be combined under the
transactional leadership factor. The general leadership factor could in turn be equated to the
transformational second-order factor (Theron & Spangenberg, 2005).
A concern raised by Theron and Spangenberg (2005) regarding a possible second-order structure based
on the House (1995) conceptualization of leadership is that a number of LBI first-order factors could
load on more than one second-order factor. It could be argued, for example, that the first-order factors
of empowerment of followers and inspiring others should load both on supervisory leadership and
general leadership. This implies that there are complex primary factors which load on more than one
second-order factor. This could possibly be an unavoidable expression of the complex, intricate nature
of leadership behaviour (Theron & Spangenberg, 2005). In the second-order factor model based on
House (1995) this is, however, also partly due to the conceptual overlap between general and
supervisory leadership. However, the second-order factor structure based on Avolio et al. (1999) and
depicted in Table 4 seems to reduce the likelihood of cross loadings somewhat because of the more
mutually exclusive conceptual interpretation of the two second-order factors. Despite being
conceptually distinct it nonetheless seems reasonable to postulate a moderate correlation between the
two second-order factors. Moreover, the second-order factor structure depicted in Table 4 seems to be
sufficiently plausible to justify its empirical evaluation.
35
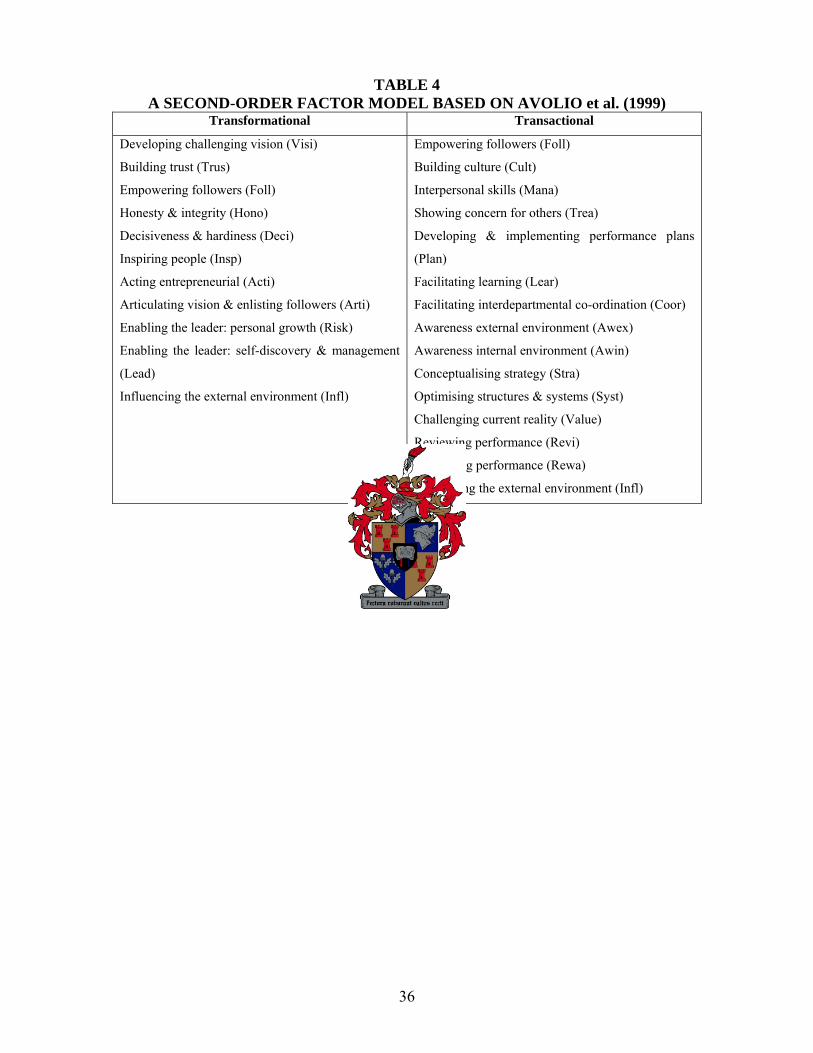
TABLE 4 A SECOND-ORDER FACTOR MODEL BASED ON AVOLIO et al. (1999)
Transformational Transactional
Developing challenging vision (Visi)
Building trust (Trus)
Empowering followers (Foll)
Honesty & integrity (Hono)
Decisiveness & hardiness (Deci)
Inspiring people (Insp)
Acting entrepreneurial (Acti)
Articulating vision & enlisting followers (Arti)
Enabling the leader: personal growth (Risk)
Enabling the leader: self-discovery & management
(Lead)
Influencing the external environment (Infl)
Empowering followers (Foll)
Building culture (Cult)
Interpersonal skills (Mana)
Showing concern for others (Trea)
Developing & implementing performance plans
(Plan)
Facilitating learning (Lear)
Facilitating interdepartmental co-ordination (Coor)
Awareness external environment (Awex)
Awareness internal environment (Awin)
Conceptualising strategy (Stra)
Optimising structures & systems (Syst)
Challenging current reality (Value)
Reviewing performance (Revi)
Rewarding performance (Rewa)
Influencing the external environment (Infl)
36

CHAPTER 3
RESEARCH METHODOLOGY AND PREPARATORY DATA ANALYSIS
3.1 RESEARCH HYPOTHESIS AND MEASUREMENT MODEL
The second-order factor structure based on the Avolio et al. (1999) best fitting second-order factor
model will be examined as it seems to offer a plausible explanation for the covariance observed
between the LBI first-order factors. This model seems to offer a convincing explanation for the
correlations existing between the LBI primary factors and therefore it warrants an empirical evaluation.
The substantive research hypothesis is therefore that the proposed second-order measurement model
closely fits the data and that all freed parameters in the model are non-redundant. The proposed second-
order measurement model is illustrated in Figure 1.
3.2 SAMPLE
The data utilized in this study was obtained from the previous study done by Theron and Spangenberg
(2005). They acquired the data from the LBI database of the Centre of Leadership Studies of the
Graduate School of Business of the University of Stellenbosch. This database resulted from a number
of non-probability samples of unit managers that were selected from various organizations in the
financial sector.
According to Theron and Spangenberg (2005) unit leaders were rated by their superiors, peers and
subordinates. At the time of the analysis, 1838 completed LBI questionnaires were available. Initially,
their objective was to obtain ratings from two subordinates, two peers, and a single superior, however,
the need for a large sample size, together with the difficulties encountered when attempting to apply a
questionnaire of the LBI’s length to respondents on such a high level, necessitated a deviation from
their objective in a number of cases.
37

FIGURE 1. THE PROPOSED SECOND-ORDER FACTOR STRUCTURE FOR THE LBI
BASED ON THE AVOLIO ET AL. (1999) BEST FITTING SECOND-ORDER FACTOR
MODEL
38

3.3 MISSING VALUES
Theron and Spangenberg (2005) had to deal with the problem of missing values before the analysis
could proceed. They evaluated a number of different alternatives to deal with this problem and finally
identified which alternative would be best suited.
An alternative that was considered by Theron and Spangenberg (2005) was list-wise deletion of cases.
The list-wise method is useful if the proportion of missing data is not too great. A drawback is that it
may seriously reduce sample size (Hair, Anderson, Tatham & Black, 1998). This alternative was thus
eliminated by Theron and Spangenberg (2005), as it would have dramatically reduced the sample size
to 969. This was a result of the extent of the problem and the length of the questionnaire. They
concluded that by using this alternative half the sample would had to have been sacrificed, which could
have introduced sampling bias. Replacing the missing values with items means was another alternative
that was explored. Theron and Spangenberg (2005) claimed that this approach would wash out most of
the structure that existed in the data and was thus not advisable to use. Another solution that would
have been less that ideal was pair-wise deleting of cases. This approach could introduce irregularities
into the data matrix that later could cause serious problems in the estimation process (Hair et al., 1998).
It would have resulted in a correlation matrix with extreme variation in N-values (a maximum of 1822
and a minimum of 1439 in this particular case). Theron and Spangenberg (2005) concluded that the
best alternative would be the use of multiple imputation procedure. Their argument was that the
advantage of both the two multiple imputation procedures available in LISREL 8.54 is that estimates of
missing values are derived for all the cases in the initial sample, that is, no cases with missing values
are deleted. Further, the item and dimensionality analyses and the formation of item parcels are
available. The multiple imputation procedures available in LISREL 8.54, however, assume that the
values are missing at random and that the observed variables are continuous and follow a multivariate
normal distribution. The individual LBI items, on the other hand, should be viewed as ordinal in nature
due to the five point Likert scale on which responses were indicated and would probably violate the
multivariate normality assumption. Consequently Theron and Spangenberg (2005) considered it more
prudent not to use the multiple imputation option but rather settle for a more conservative imputation
by matching procedure.
Imputation by matching is a process of substituting real values for missing values (Jöreskog and
Sörbom, 1996b). The substitute values are obtained from one or more other cases that have a similar
39

response pattern over a set of matching variables. The items least plagued by missing values were
firstly identified. A set of 10 variables with 30 or less missing values per variable was subsequently
defined to serve as matching variables. Theron and Spangenberg (2005) used the PRELIS programme
(Jöreskog & Sörbom, 1996b) to impute the missing values. The cases with missing values after
imputation are eliminated. Once imputation was completed 1586 cases with observations on all 96
items remained in the sample (Theron & Spangenberg, 2005).
3.4 DIMENSIONALITY ANALYSIS
According to Theron and Spangenberg (2005) the structure of the LBI reflects the intention to construct
essentially one-dimensional set of items to reflect variance in each of the 24 latent variables
collectively comprising the leadership domain. The items of the LBI are meant to function as
homogeneous stimulus sets to which raters respond with behaviour that is primarily a relatively
uncontaminated expression of a specific single underlying latent variable.
Dimensionality analysis was explored as the unidimensionality of the sub-scales had to be confirmed so
as to justify the calculation of item parcels. Unidimensionality analysis is necessary as it allows us the
opportunity to determine if the items are strongly associated with each other and represent a single
concept as the developers of the instrument intended (Hair, Anderson, Tatham & Black, 1998).
Further, by using dimensionality analysis it would enable the identification and removal of items with
inadequate factor loadings and/or the splitting of heterogeneous sub-scales into two or more
homogenous subsets of items if that is necessary.
Principal component analysis with Varimax rotation was performed on each of the 24 LBI subscales.
The eigenvalue-greater-than unity rule of thumb was used to determine the number of factors to extract.
All 24 subscales passed the uni-dimensionality test. The results of the dimensionality analyses are
summarized in Table 5.
TABLE 5 PRINCIPLE COMPONENT ANALYSES OF LBI SUB-SCALE MEASURES
Scale KMO % Variance Explained Max λ Min λ Residual r > 0.05
Awex 0,75 62,32 0,802 0,767 66
Awin 0,79 62,86 0,833 0,750 100
40

Visi 0,80 64,44 0,848 0,769 100
Trus 0,81 66,15 0,836 0,777 100
Arti 0,82 71,31 0,880 0,812 83
Stra 0,79 63,42 0,818 0,778 100
Risk 0,75 58,39 0,794 0,704 100
Lead 0,76 57,79 0,815 0,625 100
Foll 0,79 62,15 0,812 0,741 100
Syst 0,79 63,91 0,816 0,785 100
Cult 0,78 61,11 0,828 0,742 100
Infl 0,75 60,56 0,838 0,710 83
Hono 0,79 61,24 0,803 0,766 100
Deci 0,78 63,36 0,819 0,747 100
Valu 0,74 55,83 0,822 0,700 100
Lear 0,79 62,12 0,829 0,755 100
Mana 0,79 66,49 0,846 0,791 83
Trea 0,81 67,89 0,849 0,803 100
Insp 0,82 71,56 0,880 0,782 83
Coor 0,81 67,39 0,837 0,803 100
Acti 0,76 59,76 0,840 0,678 100
Plan 0,81 67,87 0,848 0,751 100
Revi 0,82 70,51 0,880 0,808 100
Rewa 0,82 72,87 0,890 0,804 100
3.5 ITEM ANALYSIS
Each of the 24 LBI sub-scales were item analysed through the SPSS Reliability Procedure (SPSS,
1990). The aim of this was to identify and eliminate items not contributing to an internally consistent
description of the leadership facet in question. The summary results of the item analysis are shown in
Table 6. Ten of the subscales in the analysis had Cronbach alpha values less than 0,80 but greater than
0,74. The degree of item homogeneity found for each of the subscales, which are indicated by the
Cronbach values in Table 6 are acceptable but not altogether satisfactory. The results of the
dimensionality and item analyses did indicate that the items that comprise the various scales reflects a
similar underlying construct. Therefore, it can be tentatively assumed that the various scales reflect the
intended latent variables. To generate stronger support for this claim would require expanding the
respective measurement models into fully fledged theory driven structural models and confronting
41

these with the current dataset via a series of confirmatory model fitting analyses using LISREL (Theron
& Spangenberg, 2005).
TABLE 6 RELIABILITY OF LBI SUB-SCALE MEASURES
Sample after imputation (n=1586)
Scale Alpha Mean Variance Awex 0,794 16,24 7,41
Awin 0,801 15,77 7,21
Visi 0,815 15,79 8,08
Trus 0,828 16,42 8,01
Arti 0,865 15,54 9,26
Stra 0,806 15,98 7,49
Risk 0,757 16,13 7,52
Lead 0,751 16,03 7,57
Foll 0,796 15,51 7,72
Syst 0,811 15,73 7,58
Cult 0,786 16,51 7,38
Infl 0,781 16,70 6,64
Hono 0,788 16,44 6,65
Deci 0,806 16,43 7,73
Valu 0,745 16,06 6,59
Lear 0,795 15,69 7,90
Mana 0,832 15,61 8,93
Trea 0,842 16,07 8,17
Insp 0,867 15,75 8,84
Coor 0,838 15,89 9,17
Acti 0,766 15,94 7,38
Plan 0,840 16,36 7,39
Revi 0,860 15,93 9,19
Rewa 0,875 16,08 9,75
3.6 VARIABLE TYPE
Theron and Spangenberg (2005) suggested that because the LBI uses a five-point Likert scale to
capture responses, the individual LBI items should be treated as ordinal variables. According to them
structural equation modeling on the LBI in which each individual item serves as a manifest or indicator
42
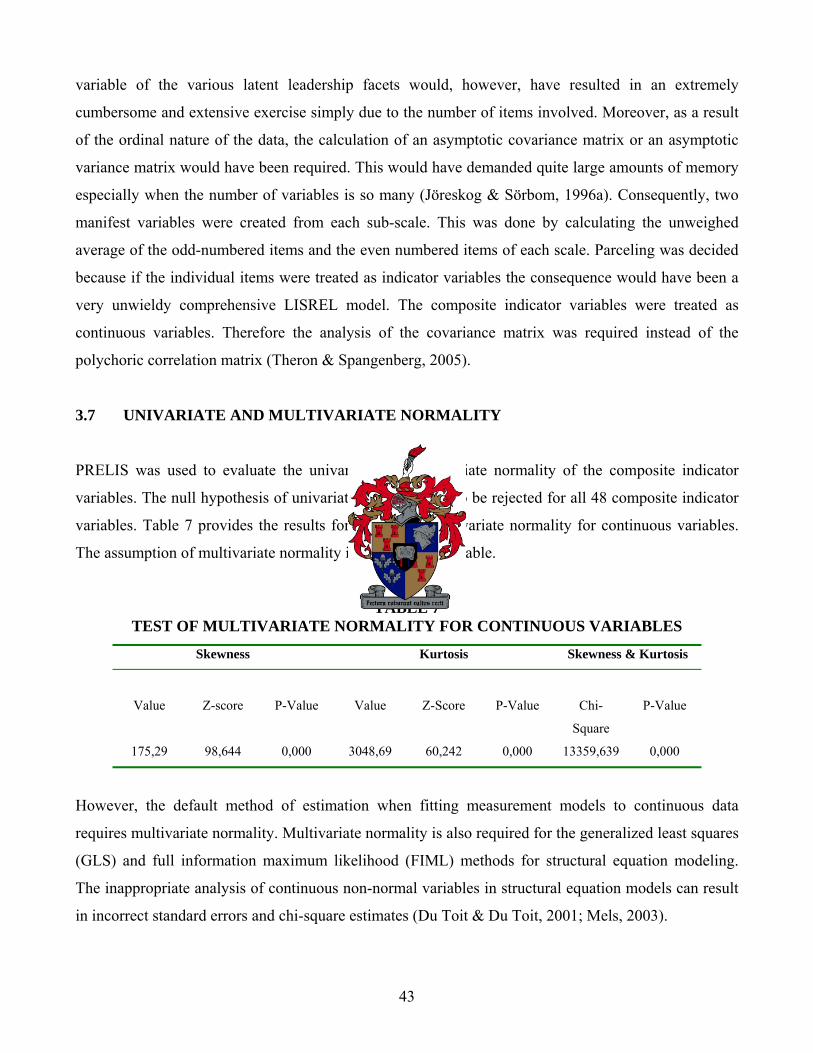
variable of the various latent leadership facets would, however, have resulted in an extremely
cumbersome and extensive exercise simply due to the number of items involved. Moreover, as a result
of the ordinal nature of the data, the calculation of an asymptotic covariance matrix or an asymptotic
variance matrix would have been required. This would have demanded quite large amounts of memory
especially when the number of variables is so many (Jöreskog & Sörbom, 1996a). Consequently, two
manifest variables were created from each sub-scale. This was done by calculating the unweighed
average of the odd-numbered items and the even numbered items of each scale. Parceling was decided
because if the individual items were treated as indicator variables the consequence would have been a
very unwieldy comprehensive LISREL model. The composite indicator variables were treated as
continuous variables. Therefore the analysis of the covariance matrix was required instead of the
polychoric correlation matrix (Theron & Spangenberg, 2005).
3.7 UNIVARIATE AND MULTIVARIATE NORMALITY
PRELIS was used to evaluate the univariate and multivariate normality of the composite indicator
variables. The null hypothesis of univariate normality had to be rejected for all 48 composite indicator
variables. Table 7 provides the results for the test of multivariate normality for continuous variables.
The assumption of multivariate normality is therefore not tenable.
TABLE 7 TEST OF MULTIVARIATE NORMALITY FOR CONTINUOUS VARIABLES
Skewness Kurtosis Skewness & Kurtosis
Value Z-score P-Value Value Z-Score P-Value Chi-
Square P-Value
175,29 98,644 0,000 3048,69 60,242 0,000 13359,639 0,000
However, the default method of estimation when fitting measurement models to continuous data
requires multivariate normality. Multivariate normality is also required for the generalized least squares
(GLS) and full information maximum likelihood (FIML) methods for structural equation modeling.
The inappropriate analysis of continuous non-normal variables in structural equation models can result
in incorrect standard errors and chi-square estimates (Du Toit & Du Toit, 2001; Mels, 2003).
43

Two solutions to deal with this lack of normality were investigated by Theron and Spangenberg (2005).
The first solution investigated attempted to normalize the composite indicator variables. The PRELIS
normalization resulted in improving the symmetry and kurtosis of the individual indicator variable
distributions, however, the null hypothesis of multivariate normality had to be rejected again. Table 8
provides a summary of the results. The failure of the normalization to salvage the lack of multivariate
normality is due to the fact that normalizing occurs for each variable separately.
TABLE 8
TEST OF MULTIVARIATE NORMALITY FOR CONTINUOUS VARIABLES Skewness Kurtosis Skewness & Kurtosis
Value Z-score P-Value Value Z-Score P-Value Chi-
Square P-Value
120,74 52,416 0,000 2768,965 47,226 0,000 4977,740 0,000
An alternative method of estimation was thus considered since the normalization option did not have
the desired effect. An approach was considered that would be more suited to data not following a
multivariate normal distribution. This approach has the advantage over the use of normal scores that the
solution need not be interpreted in terms of transformed scores. Weighted least squares (WLS),
diagonally weighed squares (DWLS) and robust maximum likelihood (RML) are suggested to fit
structural equation models to non-normal data (Du Toit & Du Toit, 2001; Jöreskog, Sörbom, Du Toit &
Du Toit, 2000; Mels, 2003). Mels (2003) recommends the use of robust maximum likelihood
estimation if the assumption of a multivariate normal distribution does not hold.
44
CHAPTER 4 EVALUATION OF THE FIRST AND SECOND-ORDER MEASUREMENT MODEL FIT
4.1 EVALUATION OF THE PRIMARY MEASUREMENT MODEL
Theron and Spangenberg (2005) had to make a decision whether to use a confirmatory (or possibly
more appropriately termed, restricted) or an exploratory (or unrestricted) factor analytic approach,
when evaluating whether the set of parceled LBI items represent the leadership latent variables. They
decided to use a hypothesis testing, restricted, confirmatory factor analytic approach. The reasons they
decided to adopt this approach are supported by the following argument. The LBI was developed to
measure a specific multifaceted construct to which a specific constitutive meaning has been attached
(which is based on the attributed internal structure of the construct and the manner in which it is
assumed to be embedded in the nomological network of latent variables) as information on the defined
construct is desired for decision-making. The information on the construct is useful for decision-
making as it has been shown (or it is assumed) that this construct, with this specific constitutive
definition, is related to some criterion considered relevant to the decision problem (Theron &
Spangenberg, 2005). The constitutive meaning of the construct is thus not arbitrary and something that
can be adapted to fit a specific collection of items compiled to measure the construct. Rather the
constitutive meaning is fixed by the manner in which the construct is used in explanatory theoretical
arguments explaining variance in the criterion variable of interest and the challenge is to create a set of
items that will reflect the construct as constitutively defined.
Operational denotations are explicitly and intentionally identified that reflect specific facets of the
construct. Utilizing such leadership denotations specific LBI items were written to function as
homogenous stimulus sets to which raters would respond with behaviour which would be relatively
uncontaminated behavioural expressions of specific latent leadership dimensions. Therefore, what
needs to be made clear is to what extent this premeditated operational design did succeed in providing a
comprehensive and uncontaminated empirical grasp of the construct with its predetermined constitutive
definition. Theron and Spangenberg (2005) thus argued that to use a structure generating, unrestricted,
exploratory approach in the evaluation of a measuring instrument born out of the foregoing argument
would seem to be a logical contradiction and a denial of the underlying design intentions. Given the
intention of the LBI to measure specific, a priori defined leadership competencies by means of a
45
specific operational architecture, they moreover argued that a hypothesis testing, restricted,
confirmatory approach should rather be used. Theron and Spangenberg (2005) consequently made
specific structural assumptions with regard to the number of latent variables underlying the LBI, the
relations among the latent variables and the specific pattern of loadings of indicator variables on these
latent variables. If a measurement model reflecting these assumptions would fit the data obtained on
the LBI poorly, Theron and Spangenberg (2005) acknowledged that they would have to revise the LBI
rather than adapt the leadership construct to fit the current set of items.
Structural equation modeling (SEM) was used to perform a confirmatory first-order factor analysis on
the dataset after imputation by matching of the missing values. As argued above the design and
structure of the LBI implies a specific factor structure or measurement model. Two manifest variables
were created from each of the twenty-four sub-scales by calculating the unweighted average of the odd
numbered items and the even numbered items of each scale. The (first-order) measurement model
underlying the LBI can therefore be expressed as equation 1.
X = ΛXξ + δ -----------------------------------------------------------------------------------------1
where:
X is a 48x1 column vector of observable indicator variables, ΛX is a 48x24 matrix of factor loadings, ξ
is a 24x1 column vector of first-order latent leadership facets, and δ is a 48x1 column vector of
unique/measurement error components comprising the combined effect on X of systematic non-
relevant influences and random measurement error (Jöreskog & Sörbom, 1993).
The measurement model implies two additional matrices. A symmetric 24x24 covariance/correlation
matrix Φ contains the correlations between the latent leadership competencies. All elements in the phi
matrix were set free to be estimated thus expressing the constitutive conviction that the twenty-four
latent leadership dimensions are correlated, albeit to varying degrees, amongst themselves. A diagonal
48x48 matrix θδ depicts the variance in the error terms associated with the indicator variables. The
diagonal nature of the θδ matrix implies that the error terms δ are assumed to be uncorrelated across the
indicator variables (Theron & Spangenberg, 2005). To assume correlated measurement error terms
would imply common systematic error components amongst the error terms and/or causal effects
between the systematic error terms. No theoretical justification exists for either assumption.
46
Lisrel 8.54 (Du Toit & Du Toit, 2001; Jöreskog et al., 2000) was used to perform a confirmatory first-
order factor analysis on the LBI to determine the fit of the model expressed as equation 1. The imputed
data was first read into PRELIS (Jöreskog and Sörbom, 1996b) to compute covariance and asymptotic
covariance matrices to serve as input for the LISREL analysis. The model fit was evaluated through an
analysis of a covariance matrix due to the assumed continuous nature of item parcels. As a result of the
lack of multivariate normality in the data robust maximum likelihood estimation was used to estimate
the parameters set free in the model. The latent variables contained in the model have no inherent scale
as well as neither are the values expressed in a meaningful unit of measurement. In specifying the
model the scales of measurement of the latent variables were not specified by setting the factor
loadings on the first observed variable to unity. The latent variables were standardized rather than
defining the origin and unit of the latent variable scales in terms of observable reference variables.
Thus, the unit of measurement becomes the standard deviation. This option is preferable since the scale
and origin of the observed variables are essentially arbitrary in any case, especially when dealing with
ordinally scaled observed variables. All factor loadings of each latent leadership variable were set free
to be estimated, but only with regard to its designated observed variables (Theron & Spangenberg,
2005). All remaining elements of ΛX were fixed at zero loadings to reflect the assumed factorial
simplicity of the LBI items (Tabachnick & Fidell, 1989). All the elements of Φ and the main diagonal
of θδ were treated by default as free.
An admissible final solution of parameter estimates for the LBI first-order measurement model was
obtained after 11 iterations. The Satorra-Bentler Scaled Chi-Square is 3750,57 which is significant
(p<0,01). Therefore the null hypothesis of exact model fit was rejected. Nonetheless the remainder of
the results indicated reasonably good model fit. The normed chi square χ²/df (which equals 4,665) for
the first-order measurement model suggest that the model fits the data reasonably well. The root mean
square error of approximation (RMSEA) equals 0,048, which falls below the benchmark value of 0,05.
The 90 percent confidence interval for RMSEA spans the interval 0,047; 0,050 which includes the
critical cut-off value of 0,05. H0: RMSEA ≤ 0,05 could not be rejected given that the p-value for the
test of close fit (RMSEA < 0,05) equals 0,98. The root mean square residual (RMR) equals 0,018 and
the standardized RMR 0,030 confirmed the foregoing interpretation. A standardized RMR of 0,05 and
less is regarded as indicative of good fit (Diamantopoulos & Sigauw, 2000).
47

All indicator variables load significantly (p< 0,05) on the latent variables. The completely standardized
loadings of the item parcels on the first-order leadership factors are shown in Table 9 below.
TABLE 9 COMPLETELY STANDARDIZED LOADINGS OF THE ITEM PARCELS ON THE FIRST-
ORDER LEADERSHIP FACTORS AWEX AWIN VISI TRUS ARTI STRA AWEX1 0,83 - - - - - - - - - - (0,01) 42,08 AWEX2 0,85 - - - - - - - - - - (0,01) 42,49 AWIN1 - - 0,81 - - - - - - - - (0,01) 38,93 AWIN2 - - 0,84 - - - - - - - - (0,01) 42,62 VISI1 - - - - 0,84 - - - - - - (0,02) 43,85 VISI2 - - - - 0,82 - - - - - - (0,02) 40,46 TRUS1 - - - - - - 0,84 - - - - (0,02) 43,31 TRUS2 - - - - - - 0,82 - - - - (0,01) 41,48 ARTI1 - - - - - - - - 0,87 - - (0,02) 46,19 ARTI2 - - - - - - - - 0,89 - - (0,01) 47,97 STRA1 - - - - - - - - - - 0,83 (0,02) 41,60 STRA2 - - - - - - - - - - 0,84 (0,01) 41,94 RISK1 - - - - - - - - - - - - RISK2 - - - - - - - - - - - - LEAD1 - - - - - - - - - - - - LEAD2 - - - - - - - - - - - - FOLL1 - - - - - - - - - - - - FOLL2 - - - - - - - - - - - - SYST1 - - - - - - - - - - - - SYST2 - - - - - - - - - - - - CULT1 - - - - - - - - - - - - CULT2 - - - - - - - - - - - - INFL1 - - - - - - - - - - - - INFL2 - - - - - - - - - - - - HONO1 - - - - - - - - - - - - HONO2 - - - - - - - - - - - - DECI1 - - - - - - - - - - - - DECI2 - - - - - - - - - - - - VALU1 - - - - - - - - - - - - VALU2 - - - - - - - - - - - - LEAR1 - - - - - - - - - - - - LEAR2 - - - - - - - - - - - - MANA1 - - - - - - - - - - - - MANA2 - - - - - - - - - - - - TREA1 - - - - - - - - - - - - TREA2 - - - - - - - - - - - - INSP1 - - - - - - - - - - - - INSP2 - - - - - - - - - - - -
48

COOR1 - - - - - - - - - - - - COOR2 - - - - - - - - - - - - ACTI1 - - - - - - - - - - - - ACTI2 - - - - - - - - - - - - PLAN1 - - - - - - - - - - - - PLAN2 - - - - - - - - - - - - REVI1 - - - - - - - - - - - - REVI2 - - - - - - - - - - - - REWA1 - - - - - - - - - - - - REWA2 - - - - - - - - - - - - RISK LEAD FOLL SYST CULT INFL AWEX1 - - - - - - - - - - - - AWEX2 - - - - - - - - - - - - AWIN1 - - - - - - - - - - - - AWIN2 - - - - - - - - - - - - VISI1 - - - - - - - - - - - - VISI2 - - - - - - - - - - - - TRUS1 - - - - - - - - - - - - TRUS2 - - - - - - - - - - - - ARTI1 - - - - - - - - - - - - ARTI2 - - - - - - - - - - - - STRA1 - - - - - - - - - - - - STRA2 - - - - - - - - - - - - RISK1 0,68 - - - - - - - - - - (0,02) 30,45 RISK2 0,82 - - - - - - - - - - (0,02) 37,73 LEAD1 - - 0,75 - - - - - - - - (0,02) 33,86 LEAD2 - - 0,79 - - - - - - - - (0,02) 35,91 FOLL1 - - - - 0,84 - - - - - - (0,02) 42,88 FOLL2 - - - - 0,79 - - - - - - (0,02) 37,07 SYST1 - - - - - - 0,83 - - - - (0,01) 41,75 SYST2 - - - - - - 0,84 - - - - (0,01) 43,17 CULT1 - - - - - - - - 0,80 - - (0,01) 40,38 CULT2 - - - - - - - - 0,81 - - (0,02) 40,48 INFL1 - - - - - - - - - - 0,82 (0,01) 41,10 INFL2 - - - - - - - - - - 0,81 (0,01) 40,28 HONO1 - - - - - - - - - - - - HONO2 - - - - - - - - - - - - DECI1 - - - - - - - - - - - - DECI2 - - - - - - - - - - - - VALU1 - - - - - - - - - - - - VALU2 - - - - - - - - - - - - LEAR1 - - - - - - - - - - - - LEAR2 - - - - - - - - - - - - MANA1 - - - - - - - - - - - - MANA2 - - - - - - - - - - - - TREA1 - - - - - - - - - - - - TREA2 - - - - - - - - - - - - INSP1 - - - - - - - - - - - - INSP2 - - - - - - - - - - - - COOR1 - - - - - - - - - - - - COOR2 - - - - - - - - - - - -
49
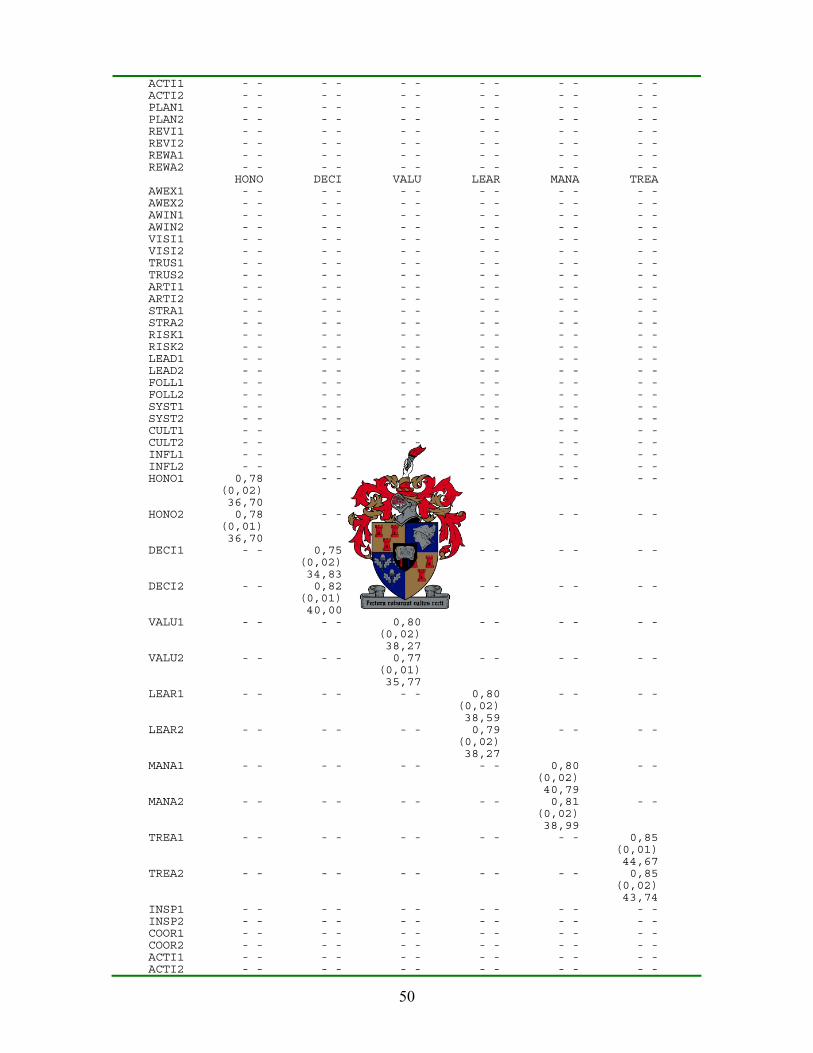
ACTI1 - - - - - - - - - - - - ACTI2 - - - - - - - - - - - - PLAN1 - - - - - - - - - - - - PLAN2 - - - - - - - - - - - - REVI1 - - - - - - - - - - - - REVI2 - - - - - - - - - - - - REWA1 - - - - - - - - - - - - REWA2 - - - - - - - - - - - - HONO DECI VALU LEAR MANA TREA AWEX1 - - - - - - - - - - - - AWEX2 - - - - - - - - - - - - AWIN1 - - - - - - - - - - - - AWIN2 - - - - - - - - - - - - VISI1 - - - - - - - - - - - - VISI2 - - - - - - - - - - - - TRUS1 - - - - - - - - - - - - TRUS2 - - - - - - - - - - - - ARTI1 - - - - - - - - - - - - ARTI2 - - - - - - - - - - - - STRA1 - - - - - - - - - - - - STRA2 - - - - - - - - - - - - RISK1 - - - - - - - - - - - - RISK2 - - - - - - - - - - - - LEAD1 - - - - - - - - - - - - LEAD2 - - - - - - - - - - - - FOLL1 - - - - - - - - - - - - FOLL2 - - - - - - - - - - - - SYST1 - - - - - - - - - - - - SYST2 - - - - - - - - - - - - CULT1 - - - - - - - - - - - - CULT2 - - - - - - - - - - - - INFL1 - - - - - - - - - - - - INFL2 - - - - - - - - - - - - HONO1 0,78 - - - - - - - - - - (0,02) 36,70 HONO2 0,78 - - - - - - - - - - (0,01) 36,70 DECI1 - - 0,75 - - - - - - - - (0,02) 34,83 DECI2 - - 0,82 - - - - - - - - (0,01) 40,00 VALU1 - - - - 0,80 - - - - - - (0,02) 38,27 VALU2 - - - - 0,77 - - - - - - (0,01) 35,77 LEAR1 - - - - - - 0,80 - - - - (0,02) 38,59 LEAR2 - - - - - - 0,79 - - - - (0,02) 38,27 MANA1 - - - - - - - - 0,80 - - (0,02) 40,79 MANA2 - - - - - - - - 0,81 - - (0,02) 38,99 TREA1 - - - - - - - - - - 0,85 (0,01) 44,67 TREA2 - - - - - - - - - - 0,85 (0,02) 43,74 INSP1 - - - - - - - - - - - - INSP2 - - - - - - - - - - - - COOR1 - - - - - - - - - - - - COOR2 - - - - - - - - - - - - ACTI1 - - - - - - - - - - - - ACTI2 - - - - - - - - - - - -
50

PLAN1 - - - - - - - - - - - - PLAN2 - - - - - - - - - - - - REVI1 - - - - - - - - - - - - REVI2 - - - - - - - - - - - - REWA1 - - - - - - - - - - - - REWA2 - - - - - - - - - - - - INSP COOR ACTI PLAN REVI REWA -------- -------- -------- -------- -------- -------- AWEX1 - - - - - - - - - - - - AWEX2 - - - - - - - - - - - - AWIN1 - - - - - - - - - - - - AWIN2 - - - - - - - - - - - - VISI1 - - - - - - - - - - - - VISI2 - - - - - - - - - - - - TRUS1 - - - - - - - - - - - - TRUS2 - - - - - - - - - - - - ARTI1 - - - - - - - - - - - - ARTI2 - - - - - - - - - - - - STRA1 - - - - - - - - - - - - STRA2 - - - - - - - - - - - - RISK1 - - - - - - - - - - - - RISK2 - - - - - - - - - - - - LEAD1 - - - - - - - - - - - - LEAD2 - - - - - - - - - - - - FOLL1 - - - - - - - - - - - - FOLL2 - - - - - - - - - - - - SYST1 - - - - - - - - - - - - SYST2 - - - - - - - - - - - - CULT1 - - - - - - - - - - - - CULT2 - - - - - - - - - - - - INFL1 - - - - - - - - - - - - INFL2 - - - - - - - - - - - - HONO1 - - - - - - - - - - - - HONO2 - - - - - - - - - - - - DECI1 - - - - - - - - - - - - DECI2 - - - - - - - - - - - - VALU1 - - - - - - - - - - - - VALU2 - - - - - - - - - - - - LEAR1 - - - - - - - - - - - - LEAR2 - - - - - - - - - - - - MANA1 - - - - - - - - - - - - MANA2 - - - - - - - - - - - - TREA1 - - - - - - - - - - - - TREA2 - - - - - - - - - - - - INSP1 0,89 - - - - - - - - - - (0,01) 48,54 INSP2 0,88 - - - - - - - - - - (0,01) 47,02 COOR1 - - 0,84 - - - - - - - - (0,02) 43,53 COOR2 - - 0,87 - - - - - - - - (0,01) 46,70 ACTI1 - - - - 0,73 - - - - - - (0,02) 32,55 ACTI2 - - - - 0,81 - - - - - - (0,02) 40,93 PLAN1 - - - - - - 0,85 - - - - (0,01) 44,97 PLAN2 - - - - - - 0,83 - - - - (0,01) 42,11 REVI1 - - - - - - - - 0,89 - - (0,01) 47,86 REVI2 - - - - - - - - 0,85 - - (0,02) 46,55 REWA1 - - - - - - - - - - 0,86
51
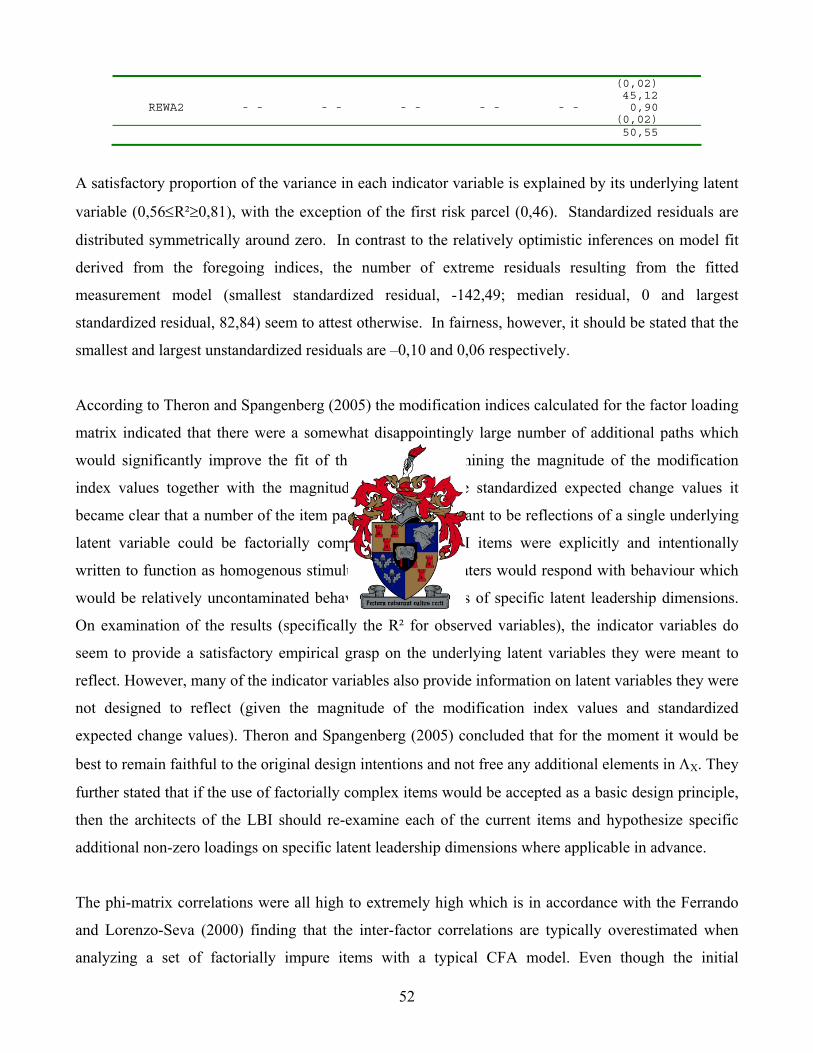
(0,02) 45,12 REWA2 - - - - - - - - - - 0,90 (0,02) 50,55
A satisfactory proportion of the variance in each indicator variable is explained by its underlying latent
variable (0,56≤R²≥0,81), with the exception of the first risk parcel (0,46). Standardized residuals are
distributed symmetrically around zero. In contrast to the relatively optimistic inferences on model fit
derived from the foregoing indices, the number of extreme residuals resulting from the fitted
measurement model (smallest standardized residual, -142,49; median residual, 0 and largest
standardized residual, 82,84) seem to attest otherwise. In fairness, however, it should be stated that the
smallest and largest unstandardized residuals are –0,10 and 0,06 respectively.
According to Theron and Spangenberg (2005) the modification indices calculated for the factor loading
matrix indicated that there were a somewhat disappointingly large number of additional paths which
would significantly improve the fit of the model. By examining the magnitude of the modification
index values together with the magnitude and sign of the standardized expected change values it
became clear that a number of the item parcels that were meant to be reflections of a single underlying
latent variable could be factorially complex. Specific LBI items were explicitly and intentionally
written to function as homogenous stimulus sets to which raters would respond with behaviour which
would be relatively uncontaminated behavioural expressions of specific latent leadership dimensions.
On examination of the results (specifically the R² for observed variables), the indicator variables do
seem to provide a satisfactory empirical grasp on the underlying latent variables they were meant to
reflect. However, many of the indicator variables also provide information on latent variables they were
not designed to reflect (given the magnitude of the modification index values and standardized
expected change values). Theron and Spangenberg (2005) concluded that for the moment it would be
best to remain faithful to the original design intentions and not free any additional elements in ΛX. They
further stated that if the use of factorially complex items would be accepted as a basic design principle,
then the architects of the LBI should re-examine each of the current items and hypothesize specific
additional non-zero loadings on specific latent leadership dimensions where applicable in advance.
The phi-matrix correlations were all high to extremely high which is in accordance with the Ferrando
and Lorenzo-Seva (2000) finding that the inter-factor correlations are typically overestimated when
analyzing a set of factorially impure items with a typical CFA model. Even though the initial
52

admissibility test was passed, the Φ matrix was not positive definite with off-diagonal entries
exceeding unity. As a result, this diminishes confidence in the quality of the obtained solution.
However, this further supports the need to investigate a higher-order factor structure of the LBI
(Theron & Spangenberg, 2005).
53
4.2 EVALUATION OF THE SECOND-ORDER MEASUREMENT MODEL
Equation 1 that expresses the observed scores achieved on the composite LBI indicator variables as a
function of the underlying first-order latent variables and measurement error can be rewritten as an
endogenous model:
Y = Λyη + ε-------------------------------------------------------------------------------------------2
Variance in the first-order endogenous latent leadership competencies (η) can, however, in turn be
assumed to be expressions of a smaller set of two second-order latent leadership variables (ξ) and
specification error, so that:
η = Γξ + ζ---------------------------------------------------------------------------------------------3
where:
η is a 24x1 column vector of first-order latent leadership competencies, Γ is a 24x2 matrix of second-
order factor loadings, ξ is a 2x1 column vector of second-order latent leadership competencies; and ζ is
a 24x1 column vector of structural disturbance terms.
Combining equations 2 and 3 results in equation 4:
Y = Λy(Γξ + ζ) + ε-----------------------------------------------------------------------------------4
The assumption that the first-order latent leadership competencies do not affect each other is reflected
by the absence of any reference to a Β matrix in equations 3 and 4. Whether this assumption is justified
must be carefully considered and evaluated. Theron and Spangenberg (2005) provided an explanation
that challenging this assumption seems to go contrary to the traditional views on higher-order factor
structures. However, the viewpoint that first-order latent leadership competencies exerting influence on
each other is not something that should be completely dismissed. The measurement model depicted in
Figure 1 will be fitted in which it is assumed that all the elements of B are zero and therefore can be left
out of equations 3 and 4. According to equation 4 the items from any LBI subscale correlate high
amongst each other as they all measure the same, relatively narrow underlying (first-order) latent
variable. These first-order latent leadership competencies on the other hand correlate with each other as
54

they are expressions of one or more, more general (second-order) latent variables. Although the more
general latent variables explains a significant proportion of the variance in the first-order latent
variables, a substantial proportion of the variance in the first-order latent variables could also be
attributed to the systematic influence of other unspecified latent variables (Hull et al., 1995).
Equations 3 and 4, in conjunction with Figure 1, imply the statistical hypotheses presented in Table 10
on the Γ population matrix.
TABLE 10 STATISTICAL HYPOTHESES ON THE Γ POPULATION MATRIX
Hypothesis 1: H01: γ1,1 = 0 Ha1: γ1,1 > 0
Hypothesis 6: H06: γ6,1 = 0 Ha6: γ6,1 > 0
Hypothesis 11: H011: γ10,1 = 0 Ha11: γ10,1 >0
Hypothesis 16: H016: γ14,2 = 0 Ha16: γ14,2 > 0
Hypothesis 21: H021: γ19,2 = 0 Ha21: γ19,2 > 0
Hypothesis 26: H026: γ24,1 = 0 Ha26: γ24,1 > 0
Hypothesis 2: H02: γ2,1 = 0 Ha2: γ2,1 > 0
Hypothesis 7: H07: γ7,2 = 0 Ha7: γ7,2 > 0
Hypothesis 12: H012: γ11,1 = 0 Ha12: γ11,1 > 0
Hypothesis 17: H017: γ15,1 = 0 Ha17: γ15,1 > 0
Hypothesis 22: H022: γ20,1 = 0 Ha22: γ20,1 > 0
Hypothesis 3: H03: γ3,2 = 0 Ha3: γ3,2 > 0
Hypothesis 8 H08: γ8,2 = 0 Ha8: β8,2 > 0
Hypothesis 13: H013: γ12,1 = 0 Ha13: γ12,1 > 0
Hypothesis 18: H018: γ16,1 = 0 Ha18: γ16,1 > 0
Hypothesis 23: H023: γ21,2 = 0 Ha23: γ21,2 > 0
Hypothesis 4: H04: γ4,2 = 0 Ha4: γ4,2 > 0
Hypothesis 9: H09: γ9,1 = 0 Ha9: β9,1 > 0
Hypothesis 14: H014: γ12,2 = 0 Ha14: γ12,2 > 0
Hypothesis 19: H019: γ17,1 = 0 Ha19: γ171 > 0
Hypothesis 24: H024: γ22,1 = 0 Ha24: γ22,1 > 0
Hypothesis 5: H05: γ5,2 = 0 Ha5: γ5,2 > 0
Hypothesis 10: H010: γ9,2 = 0 Ha10: γ9,2 > 0
Hypothesis 15: H04: γ13,2 = 0 Ha4: γ13,2 > 0
Hypothesis 20: H020: γ18,1 = 0 Ha20: γ18,1 > 0
Hypothesis 25: H025: γ23,1 = 0 Ha25: γ23,1 > 0
Confirmatory second-order factor analysis was performed using LISREL 8.54 (Du Toit & Du Toit,
2001) on the LBI to determine the fit of the model expressed as equation 4 and depicted as Figure 1.
The imputed item parcel data was first read into PRELIS (Jöreskog & Sörbom, 1996b) to compute
covariance and asymptotic covariance matrices to serve as input for the LISREL analysis. The model
fit was evaluated through an analysis of a covariance matrix due to the assumed continuous nature of
the item parcels. As a result of the lack of multivariate normality in the data robust maximum
likelihood estimation was used to estimate the parameters set free in the model. The asymptotic
covariance matrix was thus also calculated.
4.2.1 Model Identification
Before confronting the model with data, model identification needs to be examined. It is important to
determine whether the nature of the model and data would allow the determination of unique estimates
for the freed parameters in the model. This would be possible if for each free parameter there would
55
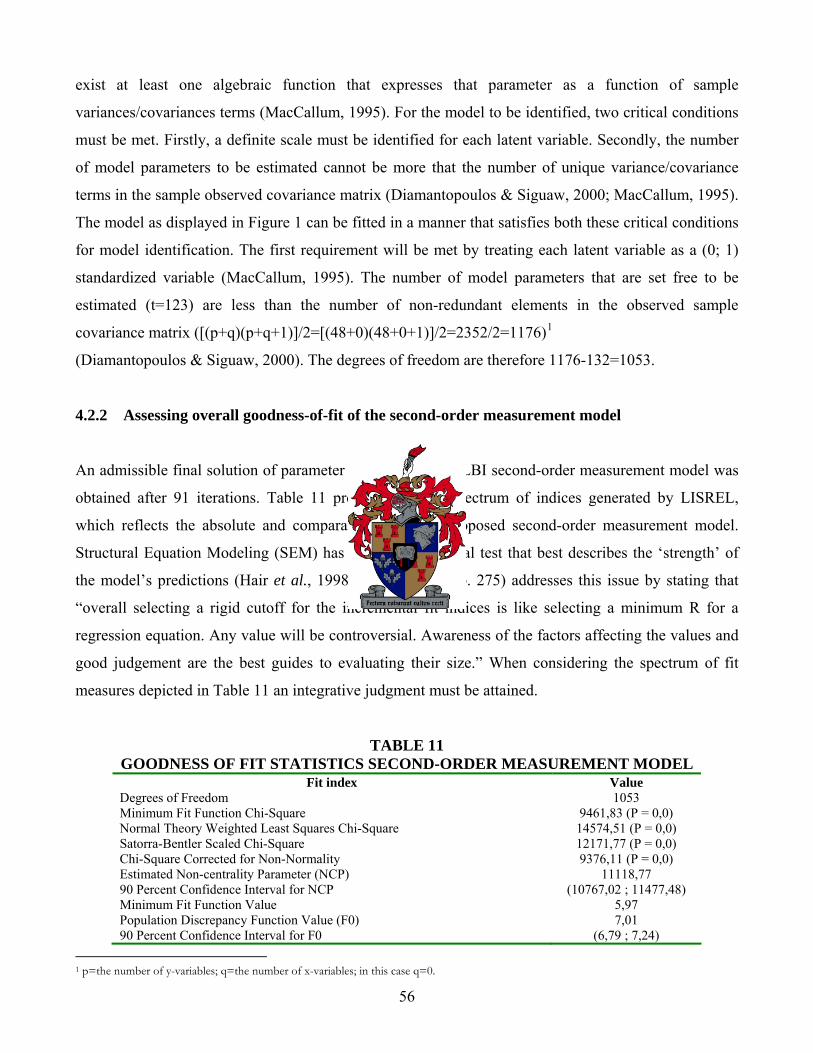
exist at least one algebraic function that expresses that parameter as a function of sample
variances/covariances terms (MacCallum, 1995). For the model to be identified, two critical conditions
must be met. Firstly, a definite scale must be identified for each latent variable. Secondly, the number
of model parameters to be estimated cannot be more that the number of unique variance/covariance
terms in the sample observed covariance matrix (Diamantopoulos & Siguaw, 2000; MacCallum, 1995).
The model as displayed in Figure 1 can be fitted in a manner that satisfies both these critical conditions
for model identification. The first requirement will be met by treating each latent variable as a (0; 1)
standardized variable (MacCallum, 1995). The number of model parameters that are set free to be
estimated (t=123) are less than the number of non-redundant elements in the observed sample
covariance matrix ([(p+q)(p+q+1)]/2=[(48+0)(48+0+1)]/2=2352/2=1176)1
(Diamantopoulos & Siguaw, 2000). The degrees of freedom are therefore 1176-132=1053.
4.2.2 Assessing overall goodness-of-fit of the second-order measurement model
An admissible final solution of parameter estimates for the LBI second-order measurement model was
obtained after 91 iterations. Table 11 provides the full spectrum of indices generated by LISREL,
which reflects the absolute and comparative fit of the proposed second-order measurement model.
Structural Equation Modeling (SEM) has no single statistical test that best describes the ‘strength’ of
the model’s predictions (Hair et al., 1998). Bollen (1989, p. 275) addresses this issue by stating that
“overall selecting a rigid cutoff for the incremental fit indices is like selecting a minimum R for a
regression equation. Any value will be controversial. Awareness of the factors affecting the values and
good judgement are the best guides to evaluating their size.” When considering the spectrum of fit
measures depicted in Table 11 an integrative judgment must be attained.
TABLE 11 GOODNESS OF FIT STATISTICS SECOND-ORDER MEASUREMENT MODEL
Fit index Value Degrees of Freedom 1053 Minimum Fit Function Chi-Square 9461,83 (P = 0,0) Normal Theory Weighted Least Squares Chi-Square 14574,51 (P = 0,0) Satorra-Bentler Scaled Chi-Square 12171,77 (P = 0,0) Chi-Square Corrected for Non-Normality 9376,11 (P = 0,0) Estimated Non-centrality Parameter (NCP) 11118,77 90 Percent Confidence Interval for NCP (10767,02 ; 11477,48) Minimum Fit Function Value 5,97 Population Discrepancy Function Value (F0) 7,01 90 Percent Confidence Interval for F0 (6,79 ; 7,24)
1 p=the number of y-variables; q=the number of x-variables; in this case q=0.
56

Root Mean Square Error of Approximation (RMSEA) 0,082 90 Percent Confidence Interval for RMSEA (0,080 ; 0,083) P-Value for Test of Close Fit (RMSEA < 0.05) 0,00 Expected Cross-Validation Index (ECVI) 7,83 90 Percent Confidence Interval for ECVI (7,61 ; 8,06) ECVI for Saturated Model 1,48 ECVI for Independence Model 397,54 Chi-Square for Independence Model with 1128 Degrees of Freedom 630009,86 Independence AIC 630105,86 Model AIC 12417,77 Saturated AIC 2352,00 Independence CAIC 630411,57 Model CAIC 13201,15 Saturated CAIC 9841,91 Normed Fit Index (NFI) 0,98 Non-Normed Fit Index (NNFI) 0,99 Parsimony Normed Fit Index (PNFI) 0,92 Comparative Fit Index (CFI) 0,99 Incremental Fit Index (IFI) 0,99 Relative Fit Index (RFI) 0,98 Critical N (CN) 195,77 Root Mean Square Residual (RMR) 0,026 Standardized RMR 0,043 Goodness of Fit Index (GFI 0,72 Adjusted Goodness of Fit Index (AGFI) 0,69 Parsimony Goodness of Fit Index (PGFI 0,65
According to Table 11 the Satorra-Bentler χ² test statistic is 12171,77. This value is significant
(p<0,01) and as a result indicates a rejection of the null hypothesis of exact model fit (H0: Σ=Σ(θ)).
Consequently, the second-order measurement model is not able to reproduce the observed covariance
matrix to a degree of accuracy that could be explained in terms of sampling error only. By expressing
χ² in terms of degrees of freedom (χ2/df = 11,55913) provides an indication that the second-order
measurement model shows poor fit when evaluated from the perspective of exact population fit
(Schumacker & Lomax, 1996). However, Kelloway (1998) explained that the values traditionally used
to indicate good fit (ratios between 2 and 5) do not have a rigorous theoretical basis and rely on little
more than the researcher’s personal modeling experience. Therefore, the normed chi square statistic
should be used with caution.
The Estimated Non-centrality Parameter (NCP) provides an indication of the estimated discrepancy
between the observed (Σ0) and estimated population covariance (Σ~ 0) matrices (Diamantopoulos &
Siguaw, 2000). By examining Table 11 the NCP value is 11118,77. The second-order measurement
model was fitted by minimizing a fit function that compares the sample observed covariance matrix (s)
to a reproduced sample covariance matrix ( Σ̂) derived from the model parameter estimates (Jöreskog &
57

Sörbom, 1993). The minimum fit function value (5,97) provides an indication of model fit. The closer
the value approaches zero the better the indication of model fit.
The Population Discrepancy Function Value (F0) explains the degree to which the observed population
covariance matrix (Σ0) is estimated to differ from the reproduced population covariance matrix (Σ~ 0)
resulting from the model parameters minimizing the selected discrepancy function when fitting the
model on (Σ0) (Browne & Cudeck, 1993). The (F0) value is 7,01 with confidence limits of 7,61 and
8,06. If (F0) had been zero perfect exact fit would have been achieved as Σ0 would have been equal to
Σ~ 0.
The Root Mean Square Error of Approximation (RMSEA) is representative of the goodness-of-fit that
could be expected if the model were estimated in the population, and not only from the sample drawn
for the estimation. Values ranging from 0,05 to 0,08 are deemed acceptable (Hair et al., 1998) but with
a RMSEA equal to 0,08 already indicating mediocre fit. The RMSEA expresses the error due to
approximation per degree of freedom of the model. The RMSEA value of 0,082 thus indicates a
slightly poorer than mediocre fit.
A test of close fit (in contrast to exact fit) is performed by LISREL by testing H0: RMSEA ≤ 0,05
against Ha: RMSEA > 0,05. The RMSEA value of 0,082 is significantly greater than the target value of
0,05 (that is H0 is rejected; p < 0,05). As the confidence interval (0,080 – 0,083) does not include the
target value of 0,05, a good fit has not been achieved.
The expected cross-validation index (ECVI) is an approximation of the goodness-of-fit the estimated
model would achieve in another sample of the same size (Hair et al., 1998). This index provides an
indication of the difference between the reproduced sample covariance matrix (Σ). This is derived from
fitting the model on the sample at hand and the expected covariance matrix that would be obtained in
another sample of the same size and from the same population (Byrne, 1998; Diamantapolous &
Siguaw, 2000). It therefore focuses on the difference between
ˆ
Σ̂ and Σ. The ECVI is smaller that the
value obtained for the independence model however, it is larger than the value obtained for the
saturated model. Therefore, a model which more closely resembles the saturated model would probably
have a better chance of being replicated in a cross-validation sample rather than the fitted model.
58
Parsimonious fit measures relates to the goodness-of-fit of the model to the number of estimated
coefficients required to achieve this level of fit. According to Hair et al. (1998) the basic objective of
parsimonious fit measures is to diagnose whether model fit has been achieved by ‘overfitting’ the data
with too many coefficients. Model fit can be improved by adding more paths to the model and
estimating more parameters until perfect fit is achieved in the form of a saturated or just-identified
model with no degrees of freedom (Kelloway, 1998). The aim in model building is to achieve
satisfactory fit with as few model parameters as possible (Jöreskog & Sörbom, 1993). The objective is
to find the most parsimonious model. Indices of parsimonious fit relate the benefit that accrues in terms
of improved fit to the cost incurred (in terms of degrees of freedom lost) to affect the improvement in
fit (Hair et al., 1998; Jöreskog & Sörbom, 1993). The parsimonious normed fit index (PNFI = 0,92)
and the parsimonious goodness-of-fit index (PGFI = 0,65) as displayed in Table 11 looks at model fit
from this perspective. These results necessitates a second, explicitly formulated and fitted model that
contains a number of additional paths that can be theoretically justified so that the initial model is
nested within the more elaborate model. In this situation an alternative model does not exist (Theron
and Spangenberg, 2005).
Values for the Akaike Information Criterion (AIC) that are closer to zero indicate better fit and greater
parsimony. This provides an indication of good fit of observed versus predicted covariances or
correlations but also a model not prone to ‘overfitting’ (Hair et al., 1998). The values for the Akaike
Information Criterion (AIC = 12417,77) and the Consistent Akaike Information Criterion (CAIC =
13201,15) are shown in Table 11. The results provide an indication that the fitted structural model
provides a more parsimonious fit than the independent/null model but not the saturated model since
smaller values on these indices indicate a more parsimonious model (Kelloway, 1998). These results
taken together with the ECVI results seem to suggest that the model lacks a number of influential paths.
Theron and Spangenberg (2005) reached a similar conclusion in regarding the fit of their five second-
order measurement model. According to Theron and Spangenberg (2005) the current model could be
deficient in as far as it fails to represent the influences between specific first-order leadership
competencies.
The incremental fit measure compares the current model (a baseline model) to a specified null model to
determine the degree of improvement over the null model (Hair et al., 1998). According to Theron and
Spangenberg (2005) indices of comparative fit that use as a baseline an independence or null model,
contrast the ability of the model to reproduce the observed covariance matrix with that of a model
59

known as a priori to fit the data poorly, namely one that postulates no paths between the variables in the
model. The indices of comparative fit are shown in Table 11. The results seem to indicate good model
fit relative to that of the independence model. These indices all can assume values between 0 and 1
with 0,90 generally considered indicative of a well-fitting model (Bentler, 1990; Bentler & Bonett,
1980; Hair et al., 1995; Kelloway, 1998). The values of the aforementioned indices all exceed the
critical value of 0,90. This indicates a good comparative fit relative to the independence model.
The critical sample size statistic (CN) provides an indication of the sample size that would have made
the obtained minimum fit function χ² statistic significant at the 0,05 significance level. The Critical N
value is 195,77 which falls short of the recommended threshold value of 200 which is indicative of the
model providing an adequate representation of the data (Diamantopoulos & Siguaw, 2000). However,
according to Hu and Bentler (1995) this proposed threshold should be used with caution.
The Root Mean Square Residual (RMSR) is 0,026 and the standardized root mean square is 0,043
which indicate acceptable fit. Values that are less than 0,05 on the standardized root mean square
residual indicates that the model fits the data well (Kelloway, 1998).
The goodness-of-fit index (GFI), the adjusted goodness-of-fit index (AGFI) and the parsimony
goodness-of-fit index (PGFI) provide an indication of the success with which the reproduced sample
covariance matrix recovered the observed sample covariance matrix (Diamantopoulos & Siguaw, 2000;
Schamacker & Lomax, 1996). The goodness-of-fit index represents the overall degree of fit, however,
it is not adjusted for the degrees of freedom. The adjusted goodness-of-fit index is an extension of the
GFI which is adjusted by the ration of degrees of freedom for the proposed model to the degrees of
freedom for the null model (Hair et al., 1998). These two indexes should be between zero and unity
with values exceeding 0,90 indicating good fit to the data (Jöreskog and Sörbom, 1993; Kelloway,
1998). The goodness-of-fit index is 0,72 and the adjusted goodness-of-fit index is 0,69. This indicates
that the model does not fit the data well. According to Kelloway (1998) the guidelines used for the
interpretation of GFI and AGFI are grounded in experience, are somewhat arbitrary and as a result
should be used with caution. Where the AGFI’s adjustment of the GFI was based on the degrees of
freedom in the estimated and null models the parsimonious goodness-of-fit index is based on the
parsimony of the estimated model. The PGFI is 0,65. Values vary between zero and 1,0 with higher
values indicating greater model parsimony (Hair et al., 1998). By collectively evaluating the results for
model fit it becomes clear that the measures suggest a reasonable to mediocre fitting model that
60
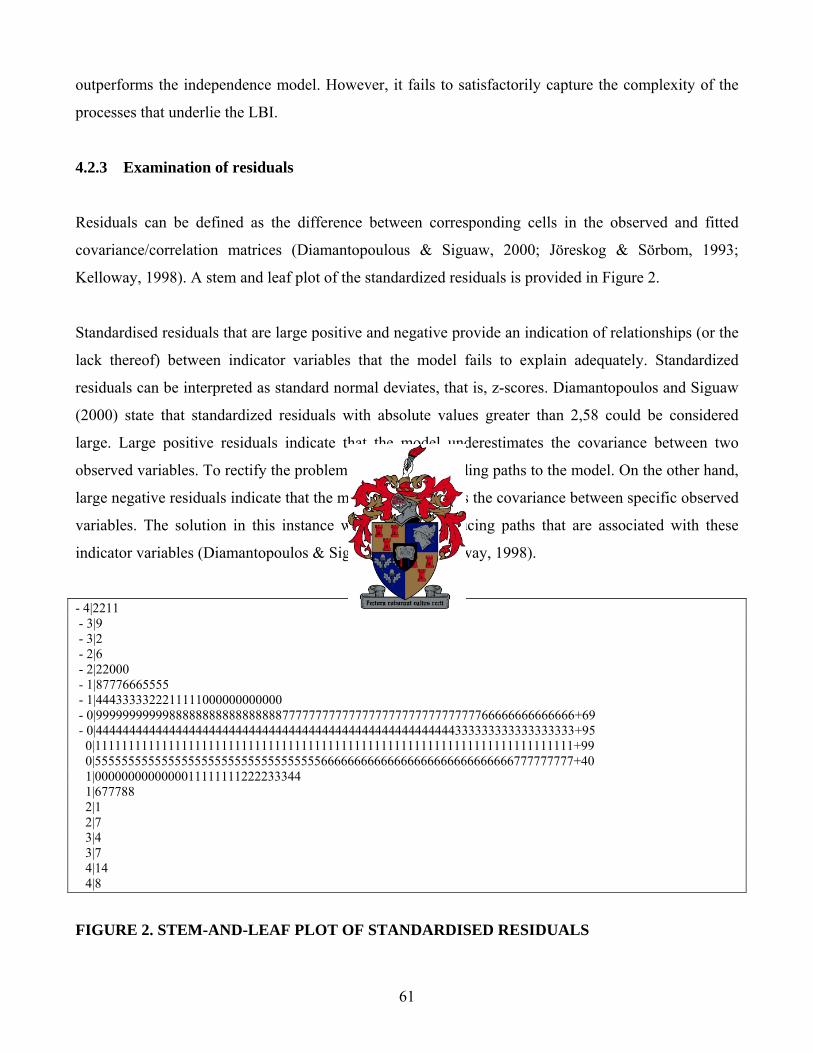
outperforms the independence model. However, it fails to satisfactorily capture the complexity of the
processes that underlie the LBI.
4.2.3 Examination of residuals
Residuals can be defined as the difference between corresponding cells in the observed and fitted
covariance/correlation matrices (Diamantopoulous & Siguaw, 2000; Jöreskog & Sörbom, 1993;
Kelloway, 1998). A stem and leaf plot of the standardized residuals is provided in Figure 2.
Standardised residuals that are large positive and negative provide an indication of relationships (or the
lack thereof) between indicator variables that the model fails to explain adequately. Standardized
residuals can be interpreted as standard normal deviates, that is, z-scores. Diamantopoulos and Siguaw
(2000) state that standardized residuals with absolute values greater than 2,58 could be considered
large. Large positive residuals indicate that the model underestimates the covariance between two
observed variables. To rectify the problem would require adding paths to the model. On the other hand,
large negative residuals indicate that the model overestimates the covariance between specific observed
variables. The solution in this instance would require reducing paths that are associated with these
indicator variables (Diamantopoulos & Siguaw, 2000; Kelloway, 1998).
- 4|2211 - 3|9 - 3|2 - 2|6 - 2|22000 - 1|87776665555 - 1|4443333322211111000000000000 - 0|999999999998888888888888888877777777777777777777777777777766666666666666+69 - 0|444444444444444444444444444444444444444444444444444444333333333333333333+95 0|111111111111111111111111111111111111111111111111111111111111111111111111+99 0|555555555555555555555555555555555566666666666666666666666666666777777777+40 1|0000000000000011111111222233344 1|677788 2|1 2|7 3|4 3|7 4|14 4|8
FIGURE 2. STEM-AND-LEAF PLOT OF STANDARDISED RESIDUALS
61
The standardized residual plot depicted in Figure 2 confirms the conclusion reached from the spectrum
of fit indices depicted in Table 11 that only reasonable to mediocre model fit had been achieved. The
standardised residuals vary between -42,26 and 48,02 with a median standardised residual of 0,00. An
alarming 305 of the 1176 residual covariance terms are smaller than -2,58 while an equally disturbing
269 of the 1176 residual covariance terms are larger than 2,58. The distribution of standardized
residuals is symmetrical around zero. The unstandardised covariance residuals, however, vary between
-0,08 and 0,18 with a median fitted residual of 0,00.
Good model fit would further have been indicated if the standardized residuals for all pairs of observed
variables had fallen approximately on a 45° reference line in the Q-plot. The Q-plot of standardized
residuals is shown in Figure 3.
The rather marked angular deviation of the standardized residuals for all pairs of observed variables
from the 45° -reference line in the Q-plot both in the upper and lower regions of the X-axis indicated
unsatisfactory model fit.
4.2.4 Model Modification indices
Modifications to the model should be made only after deliberate consideration. Modifications must be
made with care and only after obtaining theoretical justification for what is empirically deemed
significant. If modifications are made, the model should be cross-validated before the modified model
can be accepted. Although modification indices can be useful in assessing the impact of theoretically
based model modifications, model changes should never be made solely on modification indices (Hair
et al., 1998). By examining the standardized residuals, it becomes clear that the addition of one or more
paths would probably improve the fit of the model. The next step would be to determine which paths
when added to the model would significantly improve the parsimonious fit of the model.
The modification indices calculated by LISREL show the decrease in the χ² statistic if currently fixed
parameters are set free and the model re-estimated. Large modification index values (>6,6349) indicate
parameters that, if set free, would improve the fit of the model significantly (p<0,01) (Diamantopoulos
& Siguaw, 2000). By examining the modification indices for ΛY matrix it becomes clear that there are a
large number of modification index values larger than 6,64. Consequently, this suggests that there are
62
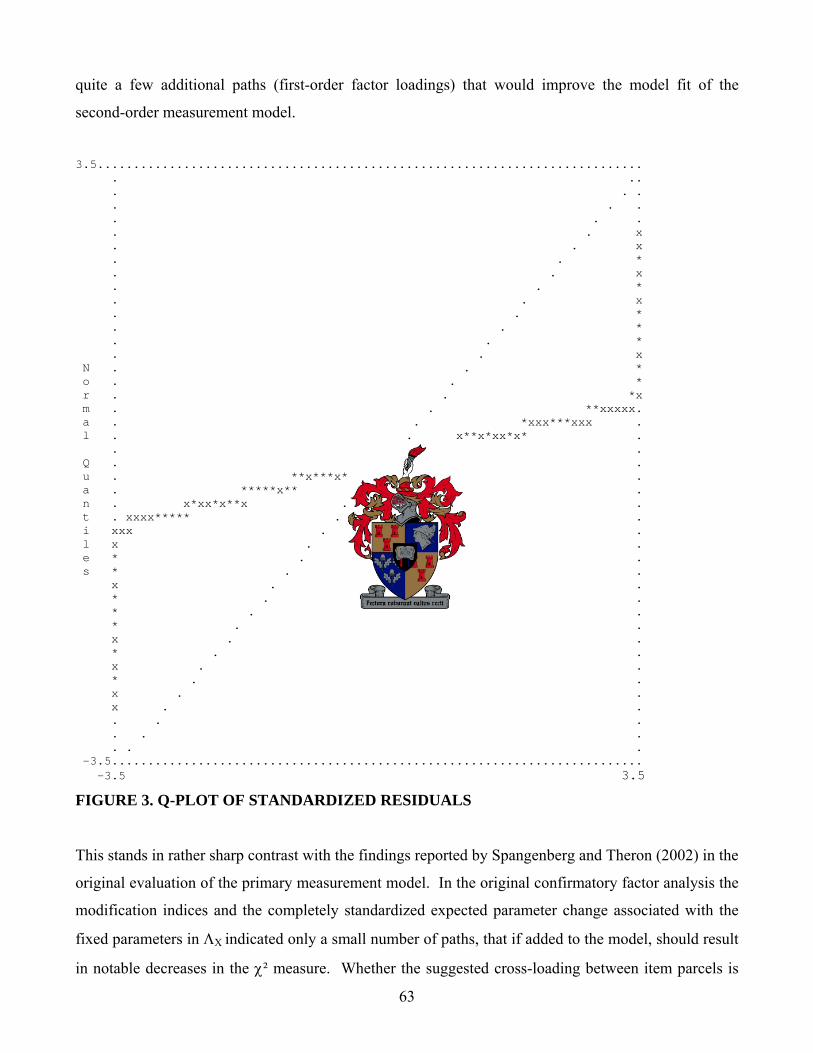
quite a few additional paths (first-order factor loadings) that would improve the model fit of the
second-order measurement model.
3.5............................................................................ . .. . . . . . . . . . . . x . . x . . * . . x . . * . . x . . * . . * . . * . . x N . . * o . . * r . . *x m . . **xxxxx. a . . *xxx***xxx . l . . x**x*xx*x* . . . **x** . Q . xxxx*x**x . u . **x***x*** . . a . *****x** . . n . x*xx*x**x . . t . xxxx***** . . i xxx . . l x . . e * . . s * . . x . . * . . * . . * . . x . . * . . x . . * . . x . . x . . . . . . . . . . . -3.5.......................................................................... -3.5 3.5
FIGURE 3. Q-PLOT OF STANDARDIZED RESIDUALS
This stands in rather sharp contrast with the findings reported by Spangenberg and Theron (2002) in the
original evaluation of the primary measurement model. In the original confirmatory factor analysis the
modification indices and the completely standardized expected parameter change associated with the
fixed parameters in ΛX indicated only a small number of paths, that if added to the model, should result
in notable decreases in the χ² measure. Whether the suggested cross-loading between item parcels is
63
solely because of the difficulty of isolating factorially pure leadership denotations or also in part
attributable to causal influences existing between the latent first-order leadership dimensions is a
debatable point. The most prudent approach for the moment probably would be not to pursue the
possibility of item parcels loading on more than one primary factor until such time that this practice
will be reflected in the scoring key of the LBI.
The modification indices for the B matrix reflect a large number of additional paths that would improve
the fit of the second-order measurement model. Theron and Spangenberg (2005) obtained a similar
result for their proposed five second-order factor measurement model. Theron and Spangenberg (2005)
interpreted the large number of large modification indices in the B matrix as providing support for the
assumption that it might be necessary to make provision for causal influences among the first-order
leadership competencies. They further argued that it would probably be best to keep the initially
proposed second-order hypothesis for the moment and not free any elements in the B matrix. They did,
however, recommend that the second-order hypothesis should in future be re-examined by adding
theoretically justifiable causal linkages between the first-order leadership competencies. They
moreover argued that theoretically justifiable causal linkages should dictate the elements of the B
matrix to be freed rather than the empirically derived modification indices (Theron & Spangenberg,
2005). The same argument also seems to apply to the current analysis.
By examining the modification indices and the completely standardized parameter change with the
fixed parameters in the Θε matrix indicates that if the covariance terms are set free there would be
significant (p< 0,01) decreases in the χ² measure. However, the expected magnitude of the completely
standardized covariate estimates does not justify setting these parameters free (Theron & Spangenberg,
2005). The modification indices for the variance-covariance matrix Ψ suggest that by allowing for
correlations amongst the residual error terms ζ would result in a significant model fit improvement. As
there is not a convincing theoretical argument to do so it would not be advisable to free the off-diagonal
elements in the Ψ matrix.
The modification indices calculated for the Γ-matrix indicate that freeing any of the currently fixed
elements of the second-order factor matrix would not produce a significant improvement in model fit.
64
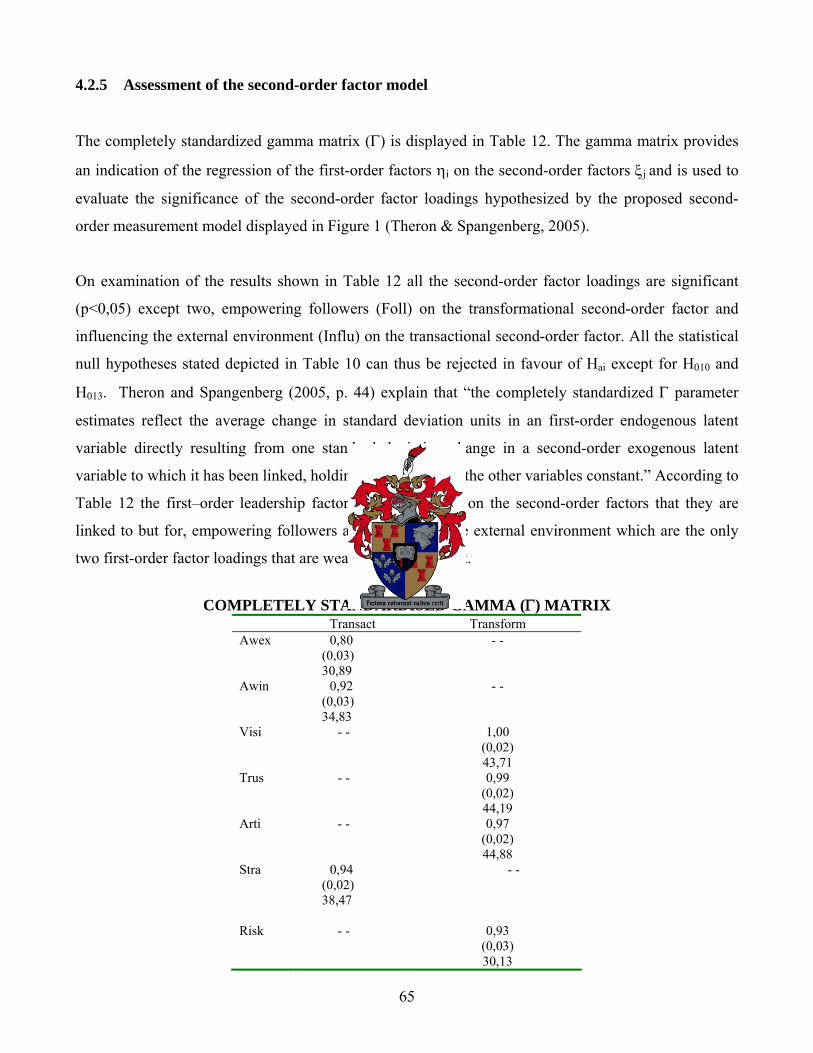
4.2.5 Assessment of the second-order factor model
The completely standardized gamma matrix (Γ) is displayed in Table 12. The gamma matrix provides
an indication of the regression of the first-order factors ηi on the second-order factors ξj and is used to
evaluate the significance of the second-order factor loadings hypothesized by the proposed second-
order measurement model displayed in Figure 1 (Theron & Spangenberg, 2005).
On examination of the results shown in Table 12 all the second-order factor loadings are significant
(p<0,05) except two, empowering followers (Foll) on the transformational second-order factor and
influencing the external environment (Influ) on the transactional second-order factor. All the statistical
null hypotheses stated depicted in Table 10 can thus be rejected in favour of Hai except for H010 and
H013. Theron and Spangenberg (2005, p. 44) explain that “the completely standardized Γ parameter
estimates reflect the average change in standard deviation units in an first-order endogenous latent
variable directly resulting from one standard deviation change in a second-order exogenous latent
variable to which it has been linked, holding the effect of all the other variables constant.” According to
Table 12 the first–order leadership factors load quite high on the second-order factors that they are
linked to but for, empowering followers and influencing the external environment which are the only
two first-order factor loadings that are weak and insignificant.
TABLE 12 COMPLETELY STANDARDISED GAMMA (Γ) MATRIX
Transact Transform Awex 0,80 - - (0,03) 30,89 Awin 0,92 - - (0,03) 34,83 Visi - - 1,00 (0,02) 43,71 Trus - - 0,99 (0,02) 44,19 Arti - - 0,97 (0,02) 44,88 Stra 0,94 - - (0,02) 38,47 Risk - - 0,93 (0,03) 30,13
65

Lead - - 0,90 (0,03) 31,00 Foll 1,11 -0,12 (0,15) (0,15) 7,52 -0,85 Syst 0,95 - - (0,02) 39,60 Cult 0,99 - - (0,02) 43,10 Infl -0,11 1,03 (0,17) (0,17) -0,62 6,01 Hono - - 0,95 (0,03) 37,31 Deci - - 0,97 (0,03) 34,53 Valu 0,96 - - (0,03) 37,75 Lear 0,97 - - (0,03) 34,60 Mana 0,93 - - (0,03) 32,41 Trea 0,85 - - (0,02) 34,56 Insp - - 0,96 (0,02) 45,86 Coor 0,94 - - (0,02) 41,07 Acti - - 0,97 (0,03) 32,18 Plan 0,96 - - (0,02) 44,53 Revi 0,91 - - (0,02) 44,24 Rewa 0,81 - - (0,02) 34,21
*t-values > indicate significant path coefficients; values in brackets represent standard error estimates
Refitting the second-order factor model with the two insignificant second-order factor loadings
removed resulted in no appreciable improvement in model fit. Although the decrease in the Satorra-
66
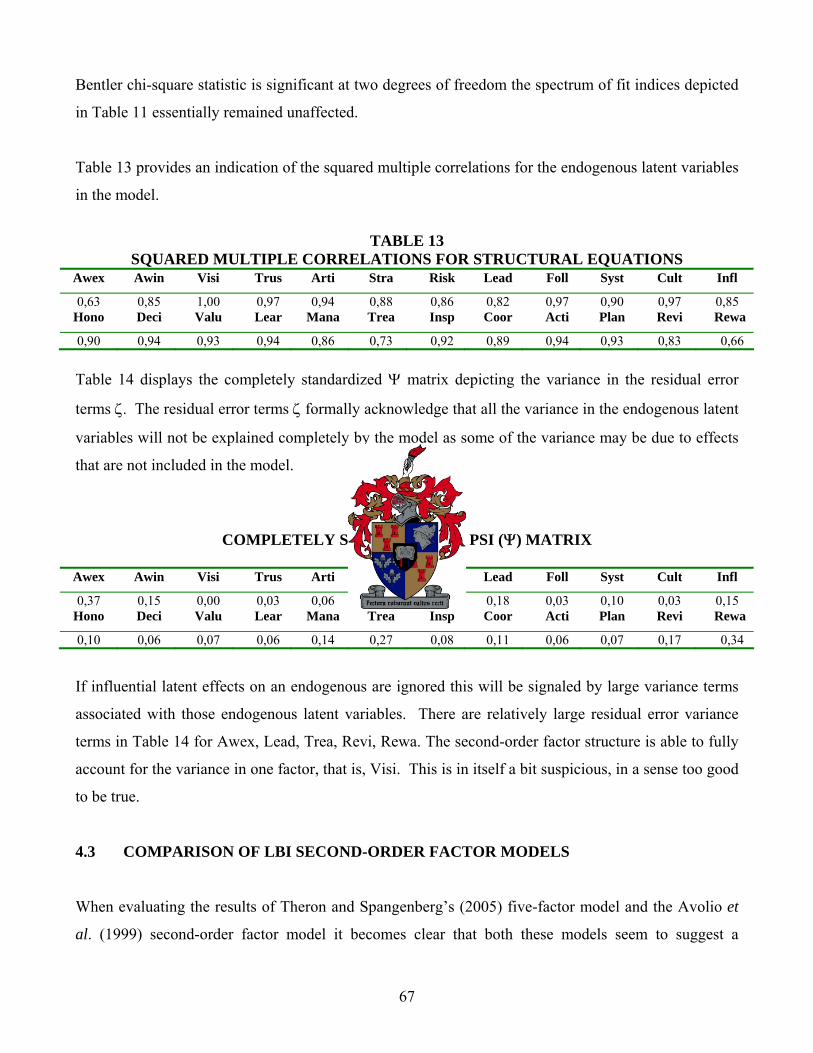
Bentler chi-square statistic is significant at two degrees of freedom the spectrum of fit indices depicted
in Table 11 essentially remained unaffected.
Table 13 provides an indication of the squared multiple correlations for the endogenous latent variables
in the model.
TABLE 13
SQUARED MULTIPLE CORRELATIONS FOR STRUCTURAL EQUATIONS Awex Awin Visi Trus Arti Stra Risk Lead Foll Syst Cult Infl
0,63 0,85 1,00 0,97 0,94 0,88 0,86 0,82 0,97 0,90 0,97 0,85 Hono Deci Valu Lear Mana Trea Insp Coor Acti Plan Revi Rewa
0,90 0,94 0,93 0,94 0,86 0,73 0,92 0,89 0,94 0,93 0,83 0,66 Table 14 displays the completely standardized Ψ matrix depicting the variance in the residual error
terms ζ. The residual error terms ζ formally acknowledge that all the variance in the endogenous latent
variables will not be explained completely by the model as some of the variance may be due to effects
that are not included in the model.
TABLE 14 COMPLETELY STANDARDISED PSI (Ψ) MATRIX
Awex Awin Visi Trus Arti Stra Risk Lead Foll Syst Cult Infl
0,37 0,15 0,00 0,03 0,06 0,12 0,14 0,18 0,03 0,10 0,03 0,15 Hono Deci Valu Lear Mana Trea Insp Coor Acti Plan Revi Rewa
0,10 0,06 0,07 0,06 0,14 0,27 0,08 0,11 0,06 0,07 0,17 0,34
If influential latent effects on an endogenous are ignored this will be signaled by large variance terms
associated with those endogenous latent variables. There are relatively large residual error variance
terms in Table 14 for Awex, Lead, Trea, Revi, Rewa. The second-order factor structure is able to fully
account for the variance in one factor, that is, Visi. This is in itself a bit suspicious, in a sense too good
to be true.
4.3 COMPARISON OF LBI SECOND-ORDER FACTOR MODELS
When evaluating the results of Theron and Spangenberg’s (2005) five-factor model and the Avolio et
al. (1999) second-order factor model it becomes clear that both these models seem to suggest a
67

reasonable to mediocre fitting model that outperforms the independence model. However, both these
models fail to satisfactorily capture the complexity of the processes which underlie the LBI.
By examining the standardized residuals it becomes clear that the addition of one or more paths would
probably improve the fit of both the models. According to Theron and Spangenberg (2005) in future
the second-order hypothesis should be re-examined with the aim of adding theoretically justifiable
causal linkages between the primary leadership competencies. This would also apply to the Avolio et al
(1999) second-order factor model as there are quite a few additional paths that would improve the
model fit of the second-order measurement model.
On examination of the results of the Theron and Spangenberg (2005) five–factor model the first-order
leadership factors generally load quite high on the second-order factors to which they have been linked.
The only insignificant loadings are of Plan on Indivrat and of Revi on Unitrat. On the Avolio et al.
(1999) second-order factor model the first-order leadership factors generally also load quite highly
except for empowering followers and influencing the external environment that are insignificant.
The five-factor second-order factor structure is able to fully explain the variance in two of the primary
leadership factors, namely, Lear and Acti, however, for Awex, Lead, Infl, Trea, Revi and Rewa the
model achieves relatively less success in accounting for the variance in these primary leadership
dimensions. According to the Avolio et al. (1999) second-order factor model there is relatively large
residual error variance for Awex, Lead, Trea, Revi and Rewa. The second-order factor structure is able
to fully account for the variance in one factor, that is, Visi.
68
CHAPTER 5 SUMMARY, CONCLUSIONS AND RECOMMENDATIONSS
The leader’s role has a pivotal role to play in the performance of a work unit and ultimately the success
or failure of an institution. There is most probably a relationship between leadership characteristics and
behaviour and the performance of a work unit. The performance of a work unit is not the outcome of a
random event but rather systematically determined by an intricate nomological network of latent
variables. According to Theron and Spangenberg (2005) to purposefully improve the performance of a
work unit the identity of the latent variables comprising this nomological network must be known in
combination with how they combine to affect the different performance dimensions. The manner in
which leadership impacts on the performance of an organizational unit should be captured in a
comprehensive leadership-unit performance structural model that would explain the way in which the
various latent leadership dimensions affect the endogenous unit performance latent variables. To do so
would be significantly simplified if initially leadership could be summarized in terms of a limited
number of broader higher-order leadership factors.
The objective of this study is to derive a theoretically justifiable hypothesis on the second-order factor
structure of the Leadership Behaviour Inventory (LBI) based on the Avolio, Bass and Jung (1999)
second-order factor structure proposed for the MLQ and to empirically test the hypothesis by
confronting the second-order measurement model with data.
Henning, Theron and Spangenberg (2004) reported on the validity of the measurement and structural
models which underlie the Performance Index (PI). This together with the results on the Leadership
Behaviour Inventory (LBI) reported in Spangenberg and Theron (2002) paved the way with the
challenging task of explicating and evaluating a comprehensive leadership-unit performance structural
model. By undertaking this task it would hopefully be easier to link the first-order leadership
dimensions to the latent variables that comprise unit performance through elaboration of the basic
model.
Theron and Spangenberg (2005) proposed a five-factor model as this seemed to offer a convincing
theoretical account for the correlations existing between the primary factors. They reported reasonable
to mediocre model fit and explained that the model did not satisfactory capture the true complexity of
69
the processes underlying the LBI. An alternative second-order factor structure was proposed by Theron
and Spangenberg (2005). The factor model for the MLQ by Avolio, Bass and Jung (1999) was
suggested to be evaluated empirically. The current study performed the empirical model fitting on the
same data set that was used to evaluate the five-factor model of Theron and Spangenberg (2005).
The first-order measurement model fits the data very well, however, there are indications that many of
the indicator variables also provide information on latent variables they were not designed to reflect.
By evaluating the results for the second-order measurement model fit it becomes clear that the fit
measures suggest a reasonable to mediocre fitting model that outperforms the independence model. It
nonetheless fails to satisfactory capture the complexity of the processes which underlie the LBI. In
future the second-order hypothesis should be re-examined by adding theoretically justifiable causal
linkages between the first-order leadership competencies. The theoretically justifiable causal linkages
should dictate the elements of the B matrix to be freed rather than the empirically derived modification
indices.
Henning et al. (2004) identified core people processes, adaptability and capacity as possible vital
portals through which unit leadership could affect organizational unit performance. These three
performance dimensions could be linked to the second-order factor model. The LBI transactional
leadership factor could affect capacity and adaptability and the LBI transformational leadership factor
could affect core people processes. However, there are a number of factors that load on the
transactional leadership factor that could also affect core people processes. This also applies to the
transformational leadership factor that could also affect capacity and adaptability. This could possibly
be an unavoidable expression of the complex, intricate nature of leadership behaviour.
According to Theron et al. (2004) a number of latent variables like leader-follower trust, acceptance of
the leader’s influence (and possibly buy-in into the leader’s vision) and procedural and distributive
justice must be incorporated into a comprehensive leadership-unit performance structural model to
meditate the effect of the leadership variables on unit performance.
In the future, before the development and testing of a leadership-unit performance structural model can
be undertaken, the possibility that the covariance observed between the LBI first-order factors could be
due to specific causal effects operating between the primary LBI leadership competencies should be
70

evaluated empirically. Preferably, the analyses should be done on the same data set, which will
facilitate the comparison of model fit.
71

REFERENCES
Avolio, B. J. & Bass, B. M. (1995). Individual consideration viewed at multiple levels of analysis: A
multi-level framework for examining the diffusion of transformational leadership. Leadership
Quarterly, 6,199-218.
Avolio, B. J., Bass, B. M. & Jung, D. I. (1999). Re-examining the components of transformational and
transactional leadership using the Multifactor Leadership Questionnaire. Journal of
Occupational and Organisational Psychology, 72, 441-462.
Bass, B. M. (1985). Leadership and Performance beyond expectations. New York: The Free Press.
Bass, B. M. (1988). The inspirational process of leadership. Journal of Management Development, 7,
21-31.
Bass, B. M. (1990). Bass and Stogdill’s Handbook of Leadership Theory, Research and Managerial
Implications. (3rd ed.). New York: Free Press.
Bass, B. M. & Avolio, B. (1990). Transformational Leadership Development Manual for the
Multifactor Leadership Questionnaire. Palo Alta, CA: Consulting Psychologist Press.
Bass, B. M & Avolio, B. J. (1993). Transformational Leadership: A response to critiques. In M.
Chemmers and R. Ayman (Eds). Leadership theory and research perspectives and directions.
San Diego, CA: Academic Press.
Bass, B. M. & Avolio, B. J. (1994). Improving organizational effectiveness through transformational
leadership. Thousand Oaks, CA: Sage.
Bass, B. M. (1996). A new paradigm of leadership: An inquiry into transformational leadership.
Alexandria, VA: U. S. Army Research Institute for the Behavioural and Social Sciences.
Bass, B. M. (1997). Concepts of Leadership. In Vecchio R. P. (ed.). Leadership: Understanding the
Dynamics of Power and Influence in Organisations. Notre Dame: University of Notre Dame Press.
Bass, B. M. (1999). Two decades of research and development in transformational leadership.
European Journal of Work and Organisational Psychology, 8(1), 9-32.
Bass, B. M., Avolio, B. J., Jung, D. I & Berson, Y. (2003). Predicting unit performance by assessing
transformational and transactional leadership. Journal of Applied Psychology, 88(2), 207-218.
Bennis, W. & Nanus, B. (1985). Leaders: The strategies for taking change. New York: Harper.
Bentler, P.M. & Bonett, D.G. (1980). Significance tests and goodness of fit in the analysis of covariance
structures. Psychological Bulletin, (88)3, 588 - 606.
Bentler, P.M. (1990). Comparative fit indexes in structural models. Psychological Bulletin, (107)2, 238 -
246.
72
Bollen, K.A. (1989). Structural equations with latent variables. New York: John Wiley and Sons.
Browne, M.W. & Cudeck, R. 1993. Alternative ways of assessing model fit. In K.A. Bollen and J.S. Long
(Eds.). Testing Structural Equation Models. Newbury Park: Sage Publications.
Bryman, A. (1992). Charisma and Leadership in Organisations. London: Sage Publications Ltd.
Bycio, P., Hackett, R. D. & Allen, J. S. (1995). Further assessments of the Bass (1985)
conceptualization of transactional and transformational leadership. Journal of Applied
Psychology, 80, 468-478.
Byrne, B.M. (1998). Structural equation modelling with LISREL, PRELIS, and SIMPLIS: basic
concepts, applications and programming. Mahwah, New Jersey: Lawrence Erlbaum Associates.
Burns, J. M. (1978). Leadership. New York: Harper & Row, Publishers.
Chemers, M. M. (1997). An integrative theory of leadership. Mahwah, New Jersey: Lawrence Erlbaum
Associates, Publishers.
Conger, J. A. & Kanungo, R. N. (1987). Toward a Behavioural Theory of Charismatic Leadership in
Organisational Settings. Academy of Management Review, 12, 637-647.
Conger, J. A. & Kanungo, R. N. (1988). Charismatic Leadership: The elusive factor in organizational
effectiveness. San Francisco, CA: Jossey Bass Publishers.
Conger, J. A. (1989). The Charismatic Leader. San Francisco: Jossey Bass.
Conger, J. A. & Kanungo, R. N. (1998). Charismatic Leadership in Organisations. Thousand Oaks,
California: Sage Publications, Inc.
Conger, J. A. (1999). Charismatic and Transformational Leadership in Organisations: An insider’s
perspective on these developing streams of research. Leadership Quarterly, 10(2), 145-179.
Cotter, C. (2002). Re-engineering South African Leadership: Awakening the leadership genius within
yourself and your followers. Retrieved April 04, 2005, from the World Wide Web:
http://www.workinfo.com/free/Downloads/83.htm.
Day, D. V., Zaccaro, S. J. & Halpin, S. M. (2004). Leader development for transforming organizations:
Growing leaders for tomorrow. Mahwah, New Jersey: Lawrence Erlbaum Associates,
Publishers.
Den Hartog, D. N., Van Muijen, J. J. & Koopman, P. L. (1997). Transactional versus Transformational
Leadership: An analysis of the MLQ. Journal of Occupational and Organisational Psychology,
70, 19-34.
Diamantopoulos, A. & Siguaw, J.A. (2000). Introducing LISREL. London, New Delhi: Sage
Publications.
73

Doherty, A. J. (1997). The Effect of Leader Characteristics on the Perceived
Transformational/Transactional Leadership and Impact of Interuniversity Athletic
Administrators. Journal of Sport Management, 11, 275-285.
Downton, J. V. (1973). Rebel Leadership: Commitment and Charisma in a Revolutionary Process.
New York: Free Press.
Du Toit, M. & Du Toit, S.H.C. (2001). Interactive LISREL: user’s guide. Lincolnwood, IL: Scientific
Software International.
Dvir, T., Eden, D., Avolio, B. J. & Shamir, B. (2002). Impact of Transformational Leadership of
Follower Development and Performance: A Field Experiment. Academy of Management
Journal, 45, 735-744.
Ferrando, P.J. & Lorenzo-Seva, U. (2000). Unrestricted versus restricted factor analysis of
multidimensional test items: some aspects of the problem and some suggestions. Psicológica,
21, 301-323.
Filley, A. C., House, R. J. & Kerr, S. (1976). Managerial process and organizational behaviour. (2nd.
Ed.). Glenview, III: Scott, Foresman.
Graen, G. & Cashman, J. F. (1975). A role-making model of leadership in formal organizations: A
developmental approach. In J. G. Hunt and L. L. Larson (Eds). Leadership Frontiers. Kent, OH:
Kent State University Press.
Hair, J. F., Anderson, R. E., Tatham, R. L. & Black, W. C. (1998). Multivariate Data Analysis. (5th
ed.). Upper Saddle River, New Jersey: Prentice Hall, Inc.
Hater, J. J. & Bass, B. M. (1988). Supervisors’ evaluations and subordinates’ perceptions of
transformational and transactional leadership. Journal of Applied Psychology, 73, 695-702.
Hayward, B. A., Davidson, A. J., Pascoe, J. B., Tasker, M. L., Amos, T. L. & Pearse, N. J. No Date.
The relationship between leadership and employee performance in a South African
Pharmaceutical Company. Retrieved April 12, 2005, from the World Wide Web:
http://www.siopsa.org.za/conference/papers03.
Henning, R., Theron, C.C. & Spangenberg, H. H. (2004). The internal structure of the unit performance
construct as measured by the Performance Index (PI). South African Journal of Industrial
Psychology, 30(2), 26-36.
House, R. J. & Mitchell, T. R. (1974). Path-goal theory of Leadership. Journal of Contemporary Business,
3, 81-97.
House, R. J. (1977). A 1976 theory of charismatic leadership. In J. G. Hunt and L. L. Larson (editors).
Leadership: The Cutting Edge. Carbondale: Southern Illinois University Press.
74

House, R. J., Spangler, D. & Woycke, J. (1991). Personality and charisma in the US Presidency: A
psychological theory of leadership effectiveness. Administrative Science Quarterly, 36, 364-
396.
House, R. J. & Podsakoff, P. M. (1994). Leadership effectiveness and future research direction. In G.
Greenberg (ed.). Organisational Behaviour: The state of the science. Hillsdale, New Jersey: L.
Erlbaum Associates.
House, R.J. (1995). Leadership in the twenty-first century. In A. Howard. (Ed). The changing nature of
work, pp. 411-450. San Francisco: Jossey-Bass
House, R. J. & Aditya, R. N. (1997). The Social Scientific Study of Leadership: Quo Vadis? Journal of
Management, 23(3), 409-473.
Hu, L.T. & Bentler, P.M. (1995). Evaluating model fit. In R.C. Hoyle (Ed.). Structural equation
modelling; concepts, issues and applications. Thousand Oaks: Sage Publications.
Hull, J.G., Tedlie, J.C. & Lehn, D.A. (1995). Modeling the relation of personality variables to symptom
complaints; the unique role of negative affectivety. In R.C. Hoyle (Ed.). Structural equation
modelling; concepts, issues and applications. Thousand Oaks: Sage Publications.
Humphreys, J. H. (2001). Transformational and Transactional Leader Behaviour: The relationship with
support for E-Commerce and emerging technology. Journal of Management Research, 1(3),
149-159.
Hunt, J. (1991). Leadership: A new synthesis. Thousand Oaks, CA: Sage.
Hunt, J. G. (1999). Transformational/charismatic leadership’s transformation of the field. An historical
essay. Leadership Quarterly, 10, 129-144.
Jöreskog, K.G. & Sörbom, D. (1993). LISREL 8: Structural equation modeling with SIMPLIS
command language. Chicago: Scientific Software International.
Jöreskog, K.G. & Sörbom, D. (1996a). LISREL 8: User’s reference guide. Chicago: Scientific Software
International.
Jöreskog, K.G. & Sörbom, D. (1996b). PRELIS 2: User’s reference guide. Chicago: Scientific
Software International.
Jöreskog, K.G., Sörbom, D., Du Toit, S. & Du Toit, M. (2000). LISREL 8: New statistical features.
Chicago: Scientific Software International.
Kelloway, E.K. (1998). Using LISREL for structural equation modelling; a researcher’s guide. Thousand
Oaks: Sage Publications.
75

Lowe, K. B., Kroeck, K. G. & Sivasubramaniam, N. (1996). Effectiveness correlates of
transformational and transactional leadership: A meta-analytic review of the MLQ literature.
Leadership Quarterly, 7(3), 385-425.
Lussier, R. N. & Achua, C. F. (2004). Leadership: Theory, Application, Skill Development. (2nd ed.).
Eagen, Min.: Thomsen South-Western.
MacCallum, R.C. (1995). Model specification: procedures, strategies and related issues. In R.H. Hoyle
(Ed.). Structural equation modelling; concepts, issues and applications. Thousand Oaks,
California: Sage Publications.
Maritz, D. 1995. Leadership and mobilizing potential. Human Resource Management, October, 8-16.
Marsh, H. W. & Hocevar, D. (1985). Application of confirmatory factor analysis to the study of self-
concept: First and higher-order factor models and their invariance across groups. Psychological
Bulletin, 97, 562-582.
Mels, G. (2003). A workshop on structural equation modeling with LISREL 8.54 for Windows.
Chicago: Scientific Software International.
Mullins, L. (1999). Management and Organisational Behaviour. London: Pitman Publishing.
Noe, R. A., Hollenbeck, J. R. Gerhart, B. & Wright, P. M. (1997). Human Resource Management:
Gaining a competitive advantage. (2nd ed.). Chicago: The McGraw-Hill Companies, Inc.
Northouse, P. G. (1997). Leadership: Theory & Practice. Thousand Oaks, California: Sage
Publications, Inc.
Northouse, P. G. (2004). Leadership: Theory & Practice. (3rd ed.). Thousand Oaks, California: Sage
Publications, Inc.
Peters, T. & Waterman, R. (1982). In Search of Excellence. London: Harper Row.
Pillai, R. & Meindl, J. R. (1991). The effects of a crisis on the emergence of charismatic leadership: A
laboratory study. Best Paper Proceedings, Annual Meeting of the Academy of Management,
Miami, Fl, 420-425.
Pretorius, B. (2001). Effective Leadership. Retrived March 03, 2006, from the World Wide Web:
http://www.managementtoday.co.za.
Robbins, S. P. (1996). Organizational Behavior: Concepts, Controversies, Applications. (7th ed.).
Englewood Cliffs, New Jersey: Prentice-Hall International, Inc.
Saskin, M. (1988). The Visionary Leader. In J. A. Conger and R. A. Kanungo (editors). Charismatic
Leadership: The elusive factor in organizational effectiveness. San Francisco: Jossey-Bass.
Schumacker, R.E. & Lomax, R.G. (1996). A beginner’s guide to structural equation modeling. Mahaw,
New Jersey: Lawrence Erlbaum Associates, Publishers.
76

Shamir, B., House, R. J. & Arthur, M. B. (1993). The Motivational Effects of Charismatic Leadership:
A Self-Concept Based Theory. Organisation Science, 4(4), 577-594.
Shamir, B. (1995). Social distance and charisma: Theoretical notes and an exploratory study.
Leadership Quarterly, 6(1), 19-47.
SHL. (2000). Competency design; towards an integrated human resource management system. SHL
Newsline, March, 7-8.
SHL. (2001). Competencies and performance@work, SHL Newsline, May, 6.
Spangenberg, H. H. & Theron, C. C. (2002). Development of a uniquely South African Leadership
Questionnaire. South African Journal of Psychology, 32(2), 9-25.
SPSS. (1990). SPSS reference guide. Chicago, Illinois: SPSS International.
Tabachnick, B.G. & Fidell, L.S. (1989). Using multivariate statistics (Second edition). New York:
Harper Collins Publishers.
Tejeda, M. J., Scandura, T. A. & Pillai, R. (2001). The MLQ revisited: Psychometrics properties and
recommendations. The Leadership Quarterly, 12, 31-52.
Tepper, B. J. & Percy, P. M. (1994). Structural validity of the multifactor leadership questionnaire.
Educational and Psychological Measurement, 54, 734-744.
Theron, C. C., Spangenberg, H. H. & Henning, R. (2004). An elaboration of the internal structure of
the unit performance construct as measured by the Performance Index (PI). Management
Dynamics, 13(2), 35-52.
Theron, C.C. & Spangenberg, H.H. (2005). Towards a comprehensive leadership - unit performance
structural model: the development of second-order factors for the leadership behaviour
inventory (LBI). Management Dynamics.,14(1), 35-50.
Tichy, N. M. & Devanna, M. A. (1986). The transformational leader. New York: John Wiley and
Sons, Inc.
Tichy, N. M. & Devanna, M. A. (1990). The transformational leader. (2nd ed.). New York: Wiley.
Vroom, V, H. & Yetton, P. W. (1973). Leadership and decision-making. Pittsburgh, PA: University of
Pittsburgh Press.
Waldman, D., House, R. J. & Ramirez, G. (1996). The efficacy of distributed leadership in implementing
change. Unpublished paper, Australian Graduate School of Management, University of New South
Wales.
Waldman, D., Ramirez, G. & House, R. J. (1996). The effects of US CEO leader behaviour on firm
profits under conditions of environmental certainty and uncertainty: A longitudinal
77

investigation. Working Paper, Regional Jones Centre for Strategic Management, Wharton
School of Management.
Waldman, D. A., Bass, B. M. & Einstein, W. O. (1987). Effort, performance and transformational
leadership in industrial and military service. Journal of Occupational Psychology, 60, 1-10.
Waldman, D. A., Bass, B. M. & Yammarino, F. J. (1990). Adding to Contingent Reward Behaviour:
The Augmenting Effect of Charismatic Leadership. Group and Organisation Studies, 15(4),
381-394.
Wall, B., Solum, R. S. & Sobol, M. R. (1992). The Visionary Leader. Rocklin, California: Prima
Publishing.
Warr, P. (Ed.). (2002). Psychology at Work. (5th ed.). England: Penguin group.
Weber, M. (1947). The theory of social and economic organization. (A. M. Henderson & and T. Parsons,
Trans.). New York: Free Press. (Original work published in 1924).
Yammarino, F. J. & Bass, B. M. (1990). Long-term forecasting of transformational leadership and its
effects among naval officers. In K. E. Clark and M. B. Clark (editors). Measures of leadership.
West Orange, NJ: Leadership Library of America.
Yukl, G. A. (1989). Leadership in Organisations. (2nd ed.). Englewood Cliffs, New Jersey: Prentice
Hall.
Yukl, G. (1994). Leadership in Organisations. (3rd ed.). Englewood Cliffs, New Jersey: Prentice Hall
International, Inc.
Yukl, G. (1999). An evaluation of conceptual weaknesses in transformational and charismatic leadership
theories. Leadership Quarterly, 10, 285-305.
78

79