the determinants of commercial bank profitability in · pdf filethe determinants of commercial...
TRANSCRIPT

WP/09/15
The Determinants of Commercial Bank Profitability in Sub-Saharan Africa
Valentina Flamini, Calvin McDonald,
and Liliana Schumacher


© 2009 International Monetary Fund WP/09/15 IMF Working Paper African Department
The Determinants of Commercial Bank Profitability in Sub-Saharan Africa
Prepared by Valentina Flamini, Calvin McDonald, and Liliana Schumacher1
January 2009
Abstract
This Working Paper should not be reported as representing the views of the IMF. The views expressed in this Working Paper are those of the authors and do not necessarily represent those of the IMF or IMF policy. Working Papers describe research in progress by the authors and are published to elicit comments and to further debate.
Bank profits are high in Sub-Saharan Africa (SSA) compared to other regions. This
paper uses a sample of 389 banks in 41 SSA countries to study the determinants of bank profitability. We find that apart from credit risk, higher returns on assets are associated with larger bank size, activity diversification, and private ownership. Bank returns are affected by macroeconomic variables, suggesting that macroeconomic policies that promote low inflation and stable output growth does boost credit expansion. The results also indicate moderate persistence in profitability. Causation in the Granger sense from returns on assets to capital occurs with a considerable lag, implying that high returns are not immediately retained in the form of equity increases. Thus, the paper gives some support to a policy of imposing higher capital requirements in the region in order to strengthen financial stability.
JEL Classification Numbers: E44, G21, L8. Keywords: Banks, credit risk, market structure. Authors’ E-Mail [email protected]; [email protected]; Addresses: [email protected]
1 Valentina Flamini was an intern in the African Department when this paper was drafted. The paper benefited from comments received during an African Department seminar, and also from comments from the Offices of Executive Directors of Mr. Itam and Mr. Rutayisire.

2
Contents Page
I. Introduction ............................................................................................................................3
II. Literature Review..................................................................................................................4
III. Data and Methodology.........................................................................................................5
IV. Empirical Results...............................................................................................................11
V. Concluding Remarks and Some Implications for Policymakers ........................................15 Figures Figure 1. Time Series of Sub-Saharan African Countries’ Return on Assets..........................17 Figure 2. Average Return on Assets by Income Group (2006) ...............................................17 Figure 3. Sub-Saharan Africa Return on Assets by Country (2006) .......................................18 Figure 4. Distribution of Sub-Saharan Africa Return on Assets (2006)..................................18 Figure 5. Time Series of Sub-Saharan Africa’s Return on Assets by Income Group .............19 Figure 6. Time Series of Sub-Saharan Africa’s Net Interest Margins .....................................19 Figure 7. Average Net Interest Margins by Income Group (2006)..........................................20 Tables Table 1. Account Decomposition of Banks by Income Group................................................21 Table 2. Account Decomposition of Sub-Saharan African Banks ..........................................22 Table 3. Variable Definition and Notation ..............................................................................23 Table 4. Descriptive Statistics..................................................................................................24 Table 5. Estimation Results .....................................................................................................25 Table 6. Sargan Test for Alternative Model with All Variables Strictly Exogenous ..............26 Table 7. Granger-Causality Test Between Return on Asset and Capital Without ..................26 Control Variables Table 8. Granger-Causality Test Between Return on Asset and Capital with.........................27 Control Variables Table 9. Estimation Results Using Random Effects................................................................28 References................................................................................................................................29

3
I. INTRODUCTION
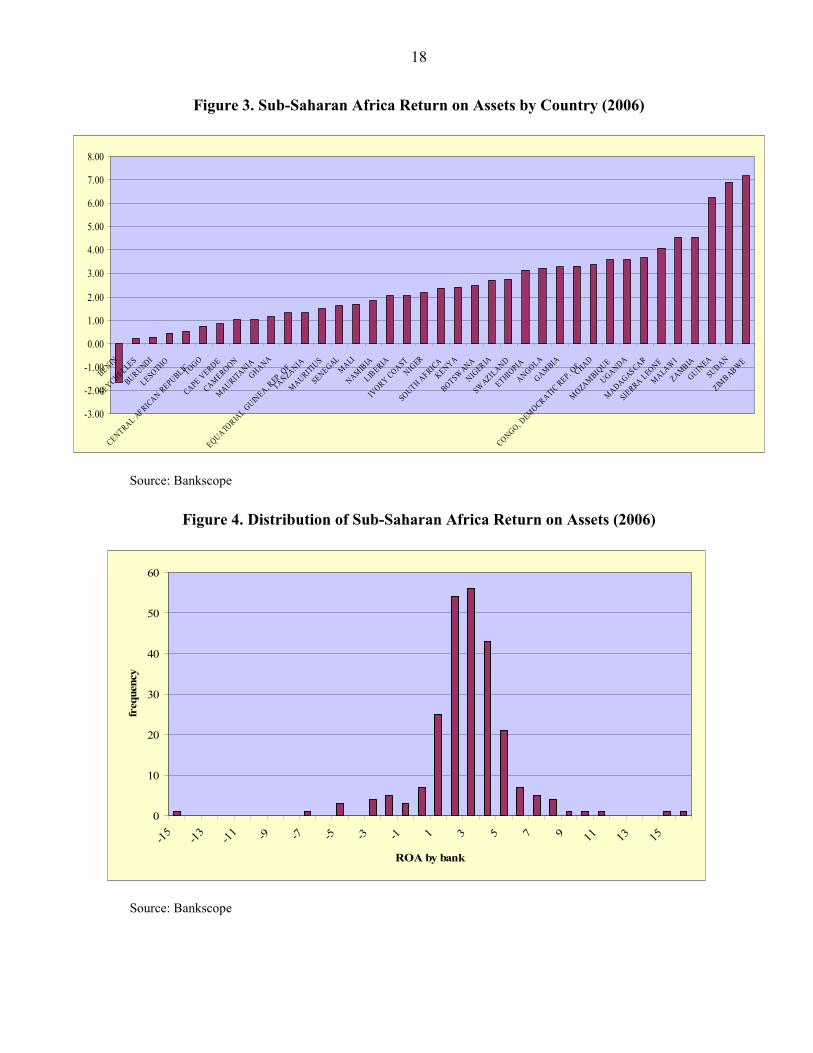
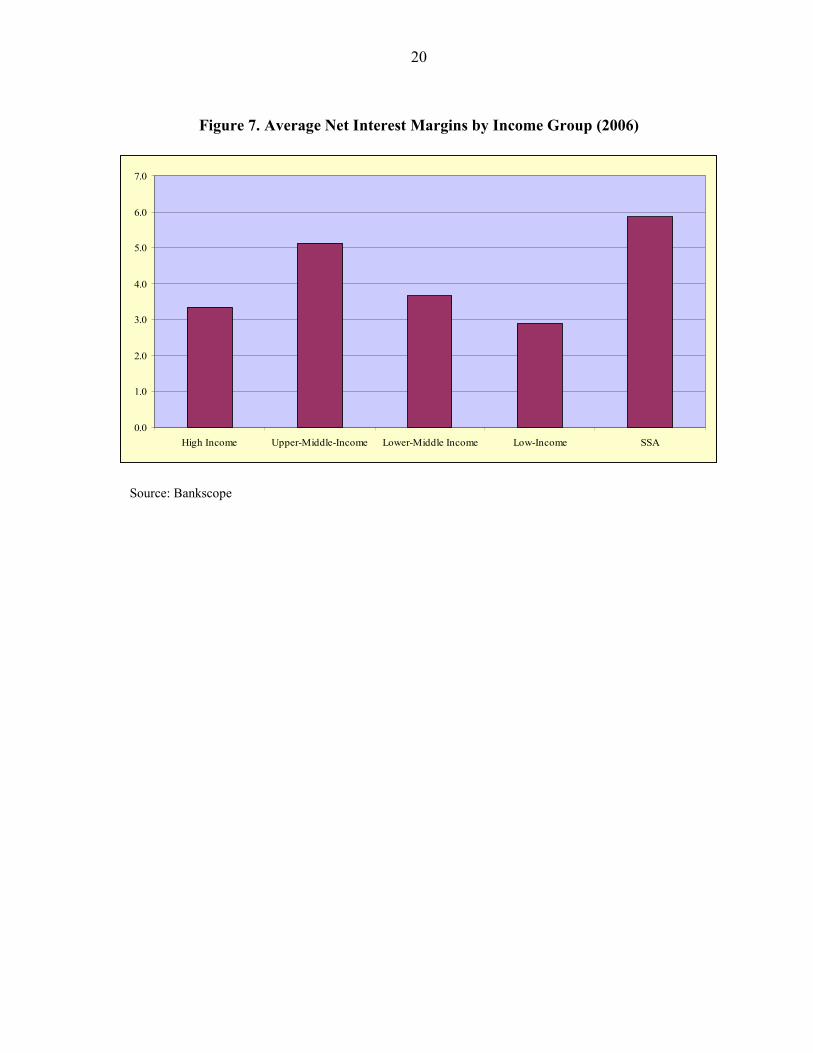
Commercial banks appear very profitable in Sub-Saharan Africa (SSA). Average returns on assets were about 2 percent over the last 10 years, significantly higher than bank returns in other parts of the world. This picture holds true whether returns on assets are assessed by country, by country income group, or by individual banks (Figures 1–5). An alternative measure of profitability, net interest margins, provide a similar picture (Figures 6 and 7).
Why are banks so profitable in Africa? Standard asset pricing models imply that arbitrage should ensure that riskier assets are remunerated with higher returns. Bank profitability should then reflect bank-specific risk, as well as risks associated with the macroeconomic environment (non-diversifiable, systemic risk). Progress has been achieved by many SSA countries in banking, supervisory and regulatory reforms, as well as in the implementation of structural reforms to reduce financial risks and promote financial development. However, banks in most SSA countries still operate in risky financial environments, which include weak legal institutions and loose enforcement of creditor rights. Hence, risk appears a good explanation for high returns. Weak economic performance also expose banks to risk as low economic growth promotes the deterioration of credit quality, and increases the probability of loan defaults.
Other factors can have an impact on bank returns. For example, market power and regulations can prevent arbitrage, and, consequently keep returns high. While in most SSA countries, there are few barriers to bank entry, aversion to a high risk environment is likely to impose a natural barrier to foreign bank entry.
Should high bank returns be seen as a negative feature for financial intermediation in SSA countries? This could be the case if high returns imply high interest rates on loans. Moreover, if high returns are the consequence of market power, this would imply some degree of inefficiency in the provision of financial services. In this regard, high returns could be a negative outcome that should prompt policymakers to introduce measures to lower risk, remove bank entry barriers if they exist, as well as other obstacles to competition, and reexamine regulatory costs. But bank profits are also an important source for equity. If bank profits are reinvested, this should lead to safer banks, and, consequently high profits could promote financial stability.
This paper seeks to understand the determinants of high bank profits in SSA and explores the relationship between profits and equity in the region’s commercial banking sector. The analysis is based on a sample of 389 banks, operating in 41 countries2 from 1998 through 2006. We follow an extensive literature that focuses on bank-specific risk, market power, and regulations as the main determinants of bank returns. However, bank risk is a forward looking concept, and, as such, it is difficult to find comprehensive risk measures. 2 Due to data unavailability, banks in the Comoros, Guinea Bissau, and São Tomé and Principe were not included.

4
Consequently, following the recent literature that emphasizes the impact of macroeconomic factors on bank risk, we have also included in our regressions a set of macroeconomic variables in order to capture this forward-looking aspect. Our main conclusion is that bank- specific, and macroeconomic risk factors are the most important explanations for banks’ high returns. We do not obtain conclusive results as to whether market power influences bank returns. We do find evidence that profits are reinvested, although with a lag.
Section 2 is a (not exhaustive) review of the literature on bank profits, including in SSA countries. Section 3 presents the data and the methodology. Section 4 describes the main results, and Section 5 provides some concluding remarks.
II. LITERATURE REVIEW
Research on the determinants of bank profitability has focused on both the returns on bank assets and equity, and net interest rate margins. It has traditionally explored the impact on bank performance of bank-specific factors, such as risk, market power, and regulatory costs. More recently, research has focused on the impact of macroeconomic factors on bank performance.
Using accounting decompositions, as well as panel regressions, Al-Haschimi (2007) studies the determinants of bank net interest rate margins in 10 SSA countries. He finds that credit risk and operating inefficiencies3 (which signal market power) explain most of the variation in net interest margins across the region. Macroeconomic risk has only limited effects on net interest margins in the study.
Using bank level data for 80 countries in the 1988–95 period, Demirgüç-Kunt and Huizinga (1998) analyze how bank characteristics and the overall banking environment affect both interest rate margins and bank returns. In considering both measures, this study provides a decomposition of the income effects of a number of determinants that affect depositor and borrower behavior, as opposed to that of shareholders. Results suggest that macroeconomic and regulatory conditions have a pronounced impact on margins and profitability. Lower market concentration ratios lead to lower margins and profits, while the effect of foreign ownership varies between industrialized and developing countries. In particular, foreign banks have higher margins and profits compared to domestic banks in developing countries, while the opposite holds in developed countries.
Gelos (2006) studies the determinants of bank interest margins in Latin America using bank and country level data. He finds that spreads are large because of relatively high interest rates (which in the study is a proxy for high macroeconomic risk, including from inflation), less efficient banks, and higher reserve requirements.
3 Although Al-Hashimi (2007) does not test explicitly for market power, the large association he finds between high operating costs and net interest margins could be evidence of market power.
5
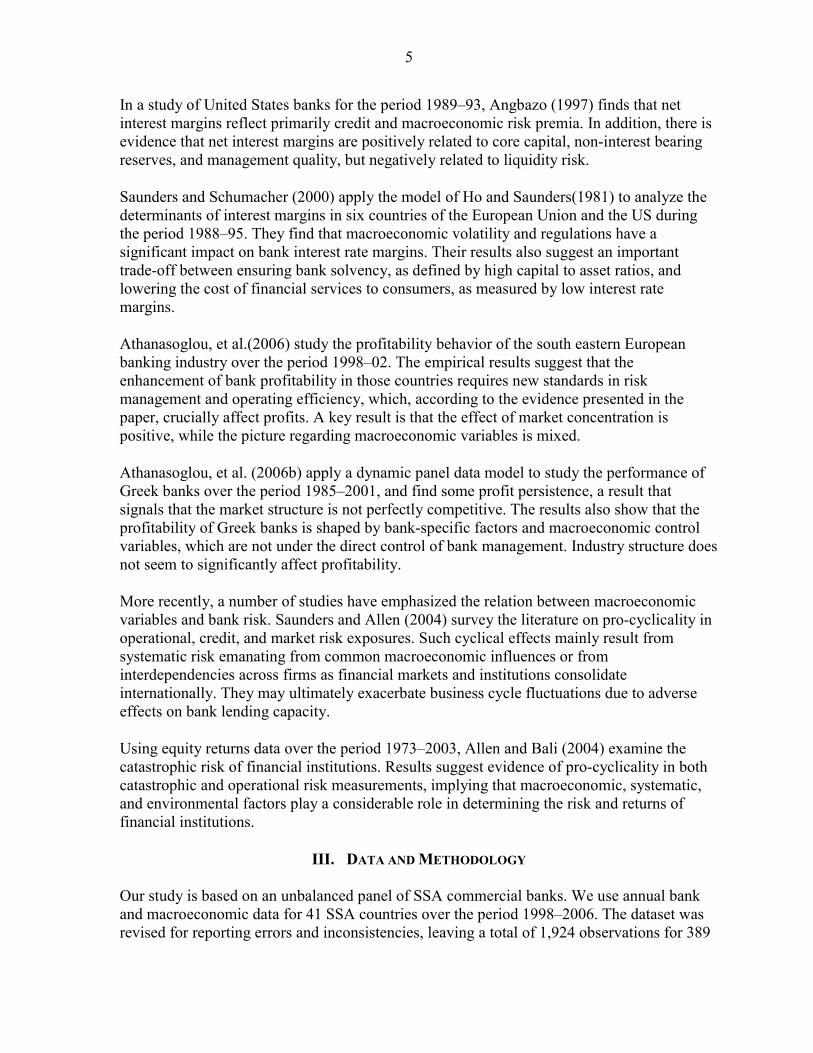
In a study of United States banks for the period 1989–93, Angbazo (1997) finds that net interest margins reflect primarily credit and macroeconomic risk premia. In addition, there is evidence that net interest margins are positively related to core capital, non-interest bearing reserves, and management quality, but negatively related to liquidity risk.
Saunders and Schumacher (2000) apply the model of Ho and Saunders(1981) to analyze the determinants of interest margins in six countries of the European Union and the US during the period 1988–95. They find that macroeconomic volatility and regulations have a significant impact on bank interest rate margins. Their results also suggest an important trade-off between ensuring bank solvency, as defined by high capital to asset ratios, and lowering the cost of financial services to consumers, as measured by low interest rate margins.
Athanasoglou, et al.(2006) study the profitability behavior of the south eastern European banking industry over the period 1998–02. The empirical results suggest that the enhancement of bank profitability in those countries requires new standards in risk management and operating efficiency, which, according to the evidence presented in the paper, crucially affect profits. A key result is that the effect of market concentration is positive, while the picture regarding macroeconomic variables is mixed.
Athanasoglou, et al. (2006b) apply a dynamic panel data model to study the performance of Greek banks over the period 1985–2001, and find some profit persistence, a result that signals that the market structure is not perfectly competitive. The results also show that the profitability of Greek banks is shaped by bank-specific factors and macroeconomic control variables, which are not under the direct control of bank management. Industry structure does not seem to significantly affect profitability.
More recently, a number of studies have emphasized the relation between macroeconomic variables and bank risk. Saunders and Allen (2004) survey the literature on pro-cyclicality in operational, credit, and market risk exposures. Such cyclical effects mainly result from systematic risk emanating from common macroeconomic influences or from interdependencies across firms as financial markets and institutions consolidate internationally. They may ultimately exacerbate business cycle fluctuations due to adverse effects on bank lending capacity.
Using equity returns data over the period 1973–2003, Allen and Bali (2004) examine the catastrophic risk of financial institutions. Results suggest evidence of pro-cyclicality in both catastrophic and operational risk measurements, implying that macroeconomic, systematic, and environmental factors play a considerable role in determining the risk and returns of financial institutions.
III. DATA AND METHODOLOGY
Our study is based on an unbalanced panel of SSA commercial banks. We use annual bank and macroeconomic data for 41 SSA countries over the period 1998–2006. The dataset was revised for reporting errors and inconsistencies, leaving a total of 1,924 observations for 389

6
banks. Balance sheet and income statement information were obtained from the Bankscope database, while we used the IMF’s International Financial Statistics (IFS) and Global Data Source dataset (GDS), along with the World Bank database for the macroeconomic variables. An aggregate presentation of balance sheet and income statements is included in Table 2.
For estimation purposes, we propose the following general linear model:
j m nic,t ic,t c,t n t i,t
j m n
ROA = + X + X Xj mα β β β ν+ +∑ ∑ ∑ (1)
where ROAict is the return on assets of bank i in country c for period t; α is the regression constant; Xj
ict and Xmct denote vectors of bank-specific and country-specific determinants,
respectively; Xnt refers to factors common to the SSA region; and νit= υi+ εit is the
disturbance, with υi the unobserved bank-specific effect, and εit the idiosyncratic error.
To capture the tendency of profits to be persistent over time (due to market structure imperfections or high sensitivity to autocorrelated regional or macroeconomic factors), we adopt a dynamic specification of the model, with a lagged dependent variable among the regressors. This yields the following model specification:
j m nic,t ic,t-1 ic,t c,t t i,t
j m n
ROA = + ROA + X + X Xj m nα γ β β β ν+ +∑ ∑ ∑ (2)
where ROAict-1 is the one period lagged profitability and γ measures the speed of mean reversion. A value of delta between 0 and 1 indicates that profits are persistent, but they will eventually return to the equilibrium level. Specifically, values close to 0 denote a high speed of adjustment and imply relatively competitive market structure, while a value closer to 1 implies slower mean reversion, and, therefore, less competitive markets.
As a measure of bank profitability we use the return on assets (ROA) defined as the banks’ after tax profit over total assets. Since profits are a flow variable generated over the year, as opposed to the stock of total assets, we measure this ratio as a running year average, with the average value of assets of two consecutive years as a denominator. We choose ROA as the key proxy for bank profitability, instead of the alternative return on equity (ROE), because an analysis of ROE disregards financial leverage and the risks associated with it. ROA, on the other hand, may be biased due to off-balance-sheet activities, but we believe such activities are negligible in SSA banks, while the risk associated with leverage is likely to be substantial despite the institutional innovations that these financial institutions incorporate in order to compensate for informational asymmetries.
Table 3 lists the full set of control variables used in the estimation, classified as bank-specific and macroeconomic determinants of bank profitability, and Table 4 presents the main descriptive statistics.

7
Bank-specific determinants
The main source of bank-specific risk in SSA is credit risk. Poor enforcement of creditor rights, weak legal environment, and insufficient information on borrowers expose banks to high credit risk. At the macroeconomic level, weak economic growth adds to risk as it promotes the deterioration of credit quality, and increases the probability of loan defaults.
We measure credit risk using the ratio of loans to deposits and short-term funding4 since this provide a forward-looking measure of bank exposure to default and asset quality deterioration. Given that the portfolio of outstanding loans is nontradable, credit risk is modeled as a predetermined variable in our specification. Based on standard asset pricing arguments, we expect a positive association between profits and bank risk.5
The bank activity mix is also an important proxy for the overall level of risk undertaken by banks to the extent that different sources of income are characterized by different credit risk and volatility. We control for the activity mix with the ratio of net interest revenues over other operating income. Interest earning activities are generally regarded as riskier than fee-based activities, which would need to be rewarded by higher returns. Demirgüç-Kunt and Huizinga (1998) in their study of banks in 80 countries found that those with relatively high non-interest earning assets are, in general, less profitable. Banks that rely on deposits for their funding are also less profitable, possibly due to the required extensive branch network, and other expenses that are incurred in administering deposit accounts.
Capital should be an important variable in determining bank profitability, although in the presence of capital requirements, it may proxy risk and also regulatory costs.6 In imperfect capital markets, well-capitalized banks need to borrow less in order to support a given level of assets, and tend to face lower cost of funding due to lower prospective bankruptcy costs. Also, in the presence of asymmetric information, a well-capitalized bank could provide a signal to the market that a better-than-average performance should be expected (Athanasoglou et al., 2005 and Berger, 1995). Well-capitalized banks are, in this regard, less risky and profits should be lower because they are perceived to be safer. In this case, we would expect to observe a negative association between capital and profits. However, if 4 Some researchers have used loan loss provisions to measure credit risk. We opted not to follow this approach as loan loss provisions are part of the accounting breakdown of the revenue itself, which would, a priori, induce a significant negative correlation between the two variables. Loan loss provisions are also likely to account for realized losses rather risk. On the other hand, we are aware that the same loan-to-deposit ratio may imply significantly different levels of credit risk across countries if the respective practices on income verification and collaterals are different. However, the available data does not allow us to control for these effects.
5 Al-Haschimi (2007) finds a positive effect of credit risk on Sub-Saharan African net interest margins.
6 With perfect capital markets and no bankruptcy costs, the capital structure (i.e., how assets are financed) does not matter, and value can only be generated by the assets. However, with asymmetric information and bankruptcy costs, the specific way in which assets are funded could create value.

8
regulatory capital represents a binding restriction on banks, and is perceived as a cost, we would expect a positive relationship to the extent that banks try to pass some of the regulatory cost to their customers. Profits may also lead to higher capital, if the profits earned are fully or partially reinvested. In this case, we would expect a positive causation from profits to capital. We proxy for capital with the ratio of equity to total assets, and, based on the above considerations, we model it as a predetermined rather than strictly exogenous variable. Athanasoglou, et al. (2005b) find a positive and significant effect of capital on bank profitability, reflecting the sound financial condition of Greek banks. Likewise, Berger (2005) finds positive causation in both direction between capital and profitability.
Size signals specific bank risk, although the expected sign is ambiguous. To the extent that governments are less likely to allow big banks to fail, a risk approach to size would predict that bigger banks would require lower profits (e.g. through lower interest rates charged to borrowers). However, if larger banks have a greater proportion of the domestic market, and operate in a non-competitive environment, lending rates may remain high (while deposit rates for larger banks are lower because they are perceived to be safer) and consequently larger banks may enjoy higher profits. Moreover, modern intermediation theory predicts efficiency gains related to bank size, owing to economies of scale. This would imply lower costs for larger banks that they may retain as higher profits if they do not operate in very competitive environments.7 To capture the relationship between size and bank profitability, while also accounting for such potential nonlinearities, we proxy bank size by using the logarithm of total assets and their square.
The results obtained by the literature for the relationship between size and profits are diverse. Using market data (stock prices) instead of accounting measures of profitability, Boyd and Runkle (1993) find a significant inverse relationship between size and rate of return on assets in U.S. banks from 1971 to 1990, and a positive relationship between financial leverage and size. They do not provide, however, any theoretical model to rationalize this evidence. Berger, et al. (1987) develop a set of scale and product mix measures for evaluating the competitive viability of firms, and apply it to 1983 data. Their results show that as product mix and scale increases, banks experience some diseconomies, implying a negative relation between size and returns. Goddard, et al. (2004) use panel and cross-sectional regressions to estimate growth and profit equations for a sample of banks for five European countries over the 1990s. The growth regressions suggest that, as banks become larger in relative terms, their growth performance tends to increase further, with little or no sign of mean reversion in growth.
Apart from capital requirements, a major regulatory issue is state-ownership of commercial banks. Privately owned banks may be more profitable than state-owned due to imperfectly designed incentives or because public banks may have objectives other than profit or value
7 While there seems to be consensus in the literature that there are significant scale economies for small- and medium-size banks, there is disagreement with respect to large banks. A number of studies claim some economies of scale, while others find evidence of only limited cost saving and slight diseconomies in large banks. Clark (1988) and Humphrey (1990) provide useful reviews of this literature.

9
maximization. In this regard, we included a dummy for ownership. Moreover, in developing countries, foreign banks are likely to have technological and efficiency advantages. If these advantages offset the informational disadvantage that foreign banks face compared to domestic banks, we expect to observe higher profitability in foreign banks, in particular if they do not operate in a competitive environment and are able to translate these advantages into profits. Moreover, as a matter of fact, nearly all foreign banks in SSA focus their activities on the service sector, leaving the financing of riskier activities, such as agriculture, mining or infrastructure, to the publicly owned or private local banks. Also, the terms of their loans are generally short, not more than six months, and more often less than one year. By limiting the exposure of foreign banks to risk of default payment, this prudent approach might increase foreign banks’ chances of making profits.
Market power is expected to be a major determinant of profits. This is because banks in more concentrated markets should be capable of adjusting spreads in response to unfavorable changes in the macroeconomic environment to leave returns unaffected. We test for the existence of market power in different ways: (i) market concentration, measured by the ratio of each bank’s total outstanding loans to the net domestic credit of the country;8 (ii) the impact of managerial inefficiency (proxied by the log of overheads costs). Operating costs are indeed high in SSA, which indicates a lack of competitive pressure. In addition, we expect high operating expenses to erode profits unless banks manage to pass on their costs to depositors and lenders; and (iii) the coefficient of the squared size variable. This coefficient controls for non-linearities in the size-profitability relationship, owing to possible diseconomies of scale as banks become too big. If such a coefficient turns out to be negative but statistically non-significant, this would provide evidence that banks in SSA enjoy enough market power to be able to pass costs on to costumers.
Al-Haschimi (2007) finds that operating inefficiencies appear to be the main determinants of high bank spreads in SSA economies. Brock and Rojas Suarez (2000) also show that administrative and other operating costs contribute to the prevalence of high spreads in Latin American countries. On the other hand, Bourke (1989), and Molyneux and Thornton (1992)
8 We opted to avoid other measures of concentration that are standard in the industrial organization literature, such as the Herfindahl-Hirschman index (HHI) or the three-firm-concentration ratio, because these measures require complete information about all banks and can be misleading. Even after correcting our sample for errors and inconsistencies, we are not able to verify the comprehensiveness of the Bankscope database given the lack of financial deepening in SSA. Moreover, a common finding in the banking literature is that these measures of concentration have only a weak relationship with profitability when market share of the firm is included in the regression equation. On the other hand, non-structural measures of concentration, such as the Rosse-Panzar, or the Lerner indices, have been shown to be poorly correlated with competition and to present major limitations when included in profitability relations. We cannot be sure that our concentration ratio effectively reflects the degree of competition in the market; however, we believe it to be less sensitive to possible omissions in the database and we are not aware of major limitations in reference to its use in profitability regressions. Hence, with the necessary caveats and without denying the possible limitations of the approach, our model specification uses the above ratio as a control for banks’ market power.

10
find a positive relationship between better quality management and profitability in European banks.
Heggestad (1977) studies the interaction of market structure, profitability and risk, and argues that banks with monopoly power systematically reduce the risk they take at the expense of greater profitability. Given the importance of bank credit as a factor of production for almost all firms, this effect may plausibly affect market concentration in other sectors of the economy by making the expansion of smaller firms more difficult.
Macroeconomic determinants
Bank performance is expected to be sensitive to macroeconomic control variables. The impact of macroeconomic variables on bank risk has recently been highlighted in the literature. We use GDP growth as a control for cyclical output effects, which we expect to have a positive influence on bank profitability. As GDP growth slows down, and, in particular, during recessions, credit quality deteriorates, and defaults increase, thus reducing bank returns.
Demirgüç-Kunt and Huizinga (1998), and Bikker and Hu (2002) find a positive correlation between bank profitability and the business cycle. By employing a direct measure of business cycle, Athanasoglou, et al. (2005) find a positive, albeit asymmetric, effect on bank profitability in the Greek banking industry, with the cyclical output being significant only in the upper phase of the cycle. The macroeconomic environment has only limited effect on net interest margins in SSA countries according to Al-Haschimi (2007). This evidence is consistent with the results of other country-specific studies (see for example Chirwa and Mlachila (2004) for Malawi, and Beck and Hesse (2006) for Uganda) .
We also account for macroeconomic risk by controlling for inflation, as measured by the current period CPI growth rate, the price of fuel and the price of a commodity index that excludes fuel. The last two indicators are introduced in the estimation to account for the fact that SSA economies are in large measure commodity exporters. While we expect a positive effect of commodity prices on bank profitability, the extent to which inflation affects bank profitability depends on whether future movements in inflation are fully anticipated, which, in turn, depend on the ability of firms to accurately forecast future movements in the relevant control variables. An inflation rate that is fully anticipated raises profits as banks can appropriately adjust interest rates in order to increase revenues, while an unexpected change could raise costs due to imperfect interest rate adjustment. Other studies, for example, Bourke (1989), Molyneux and Thornton (1992), Demirgüç-Kunt and Huizinga (1998), have found a positive relation between inflation and long term interest rates with bank performance.
We use the log of GDP per capita to control for different levels of economic development in each country and year. To control for the quality of the institutional environment in which banks operate, we use the Ease-of-Doing-Business Index as compiled by the

11
World Bank.9 Finally, we introduce in the estimation a full set of year dummy variables to control for macroeconomic effects and other idiosyncrasies that are not already captured by other variables.
IV. EMPIRICAL RESULTS
Model (2) forms the basis of our estimations. The dynamic nature of the model prevents us from using standard Ordinary Least Squares (OLS) estimators, which will be biased and inconsistent due to the correlation between the unobserved panel-level effects and the lagged dependent variable. We therefore use the Arellano-Bond (1991) two-step General Method of Moments (GMM) approach to solve the errors and biases. With many panels and few periods, and under the assumption of no correlation in the idiosyncratic errors, this estimator removes the panel-specific heterogeneity by first differencing the regression equation. It then uses lagged levels of the endogenous variables as well as first differences of the exogenous variables as instruments. As specified above, we treat both equity and credit risk as predetermined variables, and we test in the next section the validity of this assumption.
First differencing removes any time invariant explanatory variable along with the panel level effect, which prevent us from introducing in our main estimation the control variables for corruption and ownership. The same effect would occur by estimating a linear model with fixed effects (FE). We therefore re-estimate the model in a linear fashion by assuming random effects (RE) to study the effect of ownership and the quality of the regulatory environment on bank returns. We also perform additional estimations to study the causal relation between capital and profitability.
Table 5 reports the results from our basic specification (2).10 The estimated model fit the panel data reasonably well, as indicated by the Wald test statistic, which rejects the null hypothesis of joint insignificance of parameters. The Sargan test also presents evidence that the underlying over identifying restrictions are valid and the Arellano-Bond test for serial correlation in the first-differenced residuals presents no evidence of model misspecification. Note that when the idiosyncratic errors are independently and identically distributed, the first-differenced errors are first-order serially correlated, and the test rejects the null of zero autocorrelation in the first differenced errors at order one. The value test for the second order autocorrelation, however, implies that the moment conditions of the model are valid.
9 The index ranks economies on their ease of doing business. A high ranking on the index means the regulatory environment is favorable to the operation of business. This index averages the country's percentile rankings on 10 topics, made up of a variety of indicators, giving equal weight to each topic. Due to the unavailability of data for all countries in the panel over the whole estimation period, we use the index as a qualitative feature and only consider the rankings from the Doing Business 2008 report, covering the period April 2006 to June 2007. We acknowledge that this choice might not be optimal as many countries in SSA are implementing reforms to combat corruption, so that we would expect corruption levels to go down over time. However, we preferred this solution to the alternative of drastically reducing the time span or the number of countries included in the analysis.
10 The output presented uses the Windmejier (2005) bias-corrected robust variance estimator.

12
As previously pointed out, the model is estimated by treating capital and credit risk as predetermined variables. We test the suitability of this assumption by rerunning the model with all the variables strictly exogenous. The Sargan test for over-identifying restrictions, presented in Table 6, confirms that our specification is well modeled, with a significantly higher p–value for the hypothesis when the variables are predetermined.
The magnitude and significance of the coefficient on the lagged ROA confirm the dynamic nature of the model, and show a moderate persistence in return. The coefficient estimate of 0.21 suggests the existence of market power in the SSA banking sector, but indicates that the departure from perfect competition is marginal, and profits tend to adjust fairly fast to their average level. This result is consistent with those reported in Athanasoglou, et al. (2005) and Gibson (2005) for Greek commercial banks, while weaker evidence for profit persistence is found in European banks by Goddard, et al. (2004).
The coefficient of equity is positive and highly significant, meaning that well-capitalized banks experience higher returns. As pointed out in Athanasoglou, et al. (2005) and comprehensively explained in Berger (1995), this result suggests that the model of one-period perfect capital market with symmetric information does not apply to the SSA banking sector. In particular, relaxation of the one-period assumption allows an increase in earnings to raise capital, provided that marginal earnings are not fully distributed in dividends. Relaxation of the perfect capital markets assumption allows an increase in capital to raise expected earnings by reducing the expected cost of bankruptcy and financial distress in general. Finally, relaxation of the symmetric information assumption allows for a signaling equilibrium in which banks that expect to have better performance, credibly transmit this information to the market through a higher capital ratio.
In order to get a deeper understanding of the relationship between capital and profits, we use Granger causality tests to see how each variable affects future changes in the other variable. As a necessary caveat, Granger-causation only reflects historical correlations and does not necessarily imply economic causation. However, we believe that this can be a practical tool to better study the connection between capital and earnings. Table 7 reports results from a simple Granger causality exercise where each factor is regressed on a constant and three annual lags of itself and the other factor. The first four columns summarize the results of the regression with ROA as the dependent variable.
The lag coefficient on the one-year lagged ROA is positive and highly significant, which confirms the positive conditional serial correlation in returns that we found in our main model. The coefficient on the first lag of equity is negative and significant, meaning that stronger capitalization help predict a lower future ROA. This result confirms the evidence derived from our contemporaneous regression, and reflects the different timing of adjustment in the prices of deposit and loans following a capital increase. In an imperfect capital market, a higher capital ratio tends to lower the equilibrium deposit rate required by depositors as well as the equilibrium expected return on assets required by shareholders. Due to the short- term characterization of deposits, however, deposit rates adjust quickly, thus instantly increasing banks’ expected earnings. This explains the positive contemporaneous correlation between equity and returns. If loans take longer to reprice, this will create a negative

13
causation between past equity and current returns. The results in Table 7 also show that the whole adjustment occurs in one period, the coefficients on successive lags of equity being statistically non-significant.
Results from the regression with equity as the dependent variable are depicted in Table 7, columns 5–8. Capital also displays positive and significant conditional serial correlation at first lag, while there is no evidence of causation in the Granger sense from ROA to capital until the third lag which shows a positive and significant coefficient. This suggests the abnormal returns earned by SSA banks are not immediately reinvested in the system to increase capital ratios and financial stability, and if any reinvestment occurs, this only happens with a substantial lag.
To make sure that the relation we are capturing is not spurious, we rerun the test with the complete set of controls incorporated in our main model, including dummies for every time period. Results in Table 8 again indicate that capital Granger-causes returns with negative coefficient, while the causation from earnings to capital only occurs at the third lag with positive sign. These findings indicate that the negative causation running from capital to earnings and the delayed positive response of capital to past returns are indeed robust and does not capture spurious effects.
We find that credit risk has a positive and significant effect on profitability. This suggests that risk-averse shareholders target risk adjusted returns and seek larger earnings to compensate higher credit risk.
The positive and significant coefficient of the size variable gives support to the economies of scale market-power hypothesis. Larger banks make efficiency gains that can be captured as higher earnings due to the fact that they do not operate in very competitive markets. The negative coefficient of size, significant at the 10 percent level, indicates that this relation might be non-linear due to possible bureaucratic bottlenecks and managerial inefficiencies suffered by banks as they become “too large.” The marginal statistical significance of the regression coefficient, on the other hand, adds further evidence to the hypothesis that, thanks to some degree of market power, banks manage to pass on to depositors and borrowers potential inefficiencies without affecting profits in an important way.
Market concentration has no direct effect on bank profitability in our estimation. As previously stated, however, we are aware of the limits of our measure of market concentration as a proxy for market power. Nonetheless, results show a positive, but insignificant effect of overhead costs on bank profitability. Since overhead costs are high in SSA, we would expect this variable to enter the regression significantly and with a negative sign. The positive and insignificant coefficient in our results, instead, suggest that banks are able to pass on most of the high overhead costs to customers through higher spreads in order to keep profits unaffected. To the extent that banks’ ability to overcharge is a function of their market power, this outcome presents evidence of market power incidence in the banking sector.

14
The ratio of net interest revenues to other operating income enters the regression with a negative, highly significant coefficient. This indicates that greater bank activity diversification, as implied by higher shares of services in the bank activity mix, positively influence returns. This effect, which is likely due to the fact that, in terms of realized profits and losses, fees represent a more stable source of income than loans. We interpret this variable as a control for differences in the business portfolios managed by banks.
Macroeconomic variables significantly affect bank profitability in Africa. In particular, inflation has a positive effect on bank profits, which suggest that banks forecast future changes in inflation correctly and promptly enough to adjust interest rates and margins. This outcome, however, also has a mathematical explanation. Denoting by rL and rD the real interest rate on loans and deposits, respectively, and assuming that the Fisher equation holds, bank spreads can be written in nominal terms as:
(1 )(1 ) (1 )(1 )L Dr rπ π+ + − + +
which, after some algebra gives:
( )(1 )L Dr r π− +
where π denotes the inflation rate.
In other words, the effect of inflation on the nominal interest rates on loans and deposits does not cancel out due to the cross product term, implying a positive effect of inflation on interest rate spreads. Assuming that net interest margins (NIM) are major components of bank returns, this translates into a positive effect of inflation on bank returns, absent any attempt by banks to adjust interest rates in response to inflation shocks. Our model specification does not allow a distinction between the above two effects, given the development stage of the SSA banking sector. However, we are confident that an important piece of the evidence stems from the second effect.
As expected, output growth has a positive impact on bank profitability, significant at the 10 percent level, while GDP per capita does not seem to significantly affect bank returns. Higher prices of commodities, excluding fuel, also boost bank returns, whereas fuel prices depress profits. While the former result is widely expected given that SSA countries are essentially commodity exporters, the negative effect of fuel prices is likely due to the fact that the majority of countries in our sample are oil-importing countries.11 In particular, our panel counts 1,416 observations for banks operating in oil-importing countries versus only 510 observations for oil-exporting ones, which explains the negative net effect of fuel price on the profitability of banks in the region as a whole. Also, the evidence that bank returns are positively influenced by nonfuel commodity prices while being unaffected by the level of
11 Oil-exporting countries comprise Angola, Cameroon, Chad, Republic of Congo, Cote d’Ivoire, Equatorial Guinea, Gabon, and Nigeria.

15
wealth is explained by the fact that the bulk of lending activity in SSA is directed to exporting firms as opposed to households. Note that commodity prices are factors common to the whole SSA region. The fact that some of the year dummy variables are also highly significant suggests that there are additional aggregate macroeconomic effects influencing bank returns other that those explicitly controlled for in the estimation.
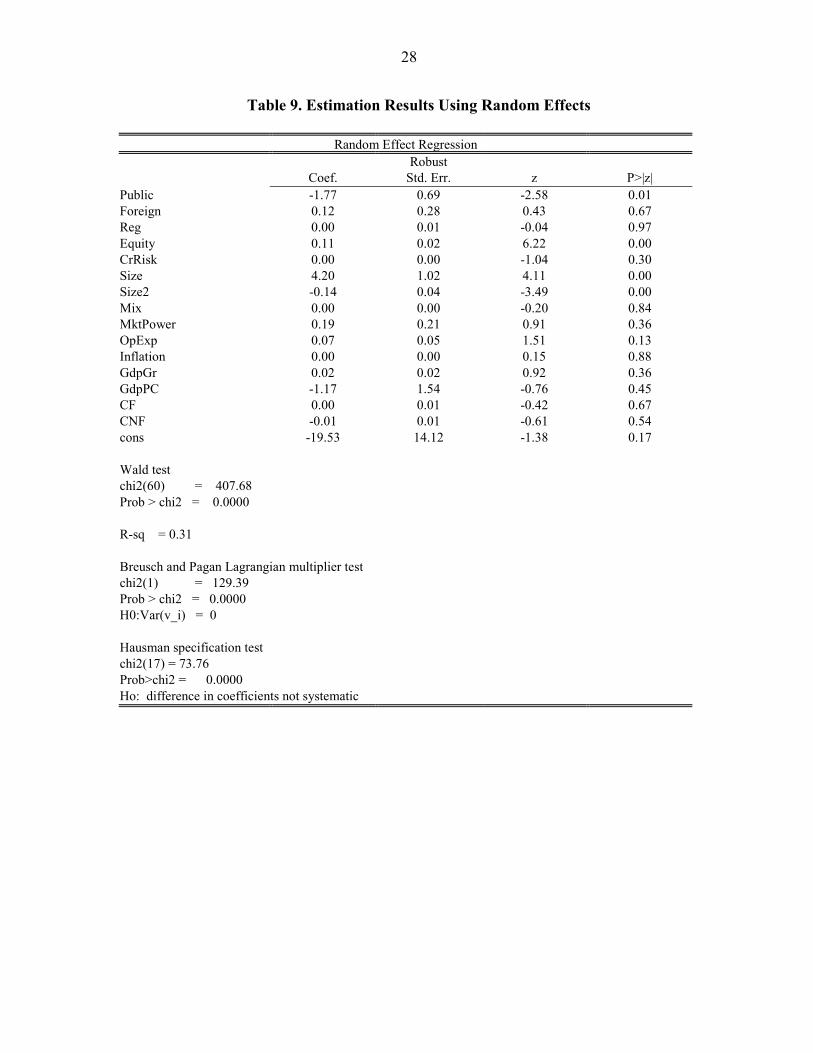
To assess the impact of time invariant factors on bank profitability, we re-estimate the model assuming random effects. While the presence of unobserved panel effects correlated with the explanatory variables in the regression might bias the result, we try to mitigate this bias by including a full set of country dummies.
As shown in Table 9, we find evidence in support of a significant impact of ownership on returns. Public ownership have a significantly negative effect on profitability, while foreign ownership does not significantly affect earnings. In other words, publicly owned firms seem to suffer from managerial inefficiencies and imperfectly designed incentives compared to privately owned ones. The effects of technical and managerial advantages due to foreign ownership appear to be offset by informational disadvantages faced by foreign banks, while limited exposure to risk of default payment does not seem to significantly increase returns. Finally, and quite surprisingly, the institutional environment does not appear to have any explanatory power for bank profitability. A possible justification for this result is that the Ease-of-Doing-Business index essentially accounts for credit risk, which is already highly significant in the regression. To the extent that other variables included in the regression may partially account for credit risk, this explains the failure of our measure of the legal environment to significantly affect bank returns.12
As can be seen from the table, the Breusch and Pagan (1980) Lagrangian Multiplier (LM) test confirms the presence of individual effects in the data, while, with no surprise, the Hausman (1978) specification test rejects the null hypothesis that the coefficients between RE and FE are not systematic, providing evidence in favor of the FE model.
V. CONCLUDING REMARKS AND SOME IMPLICATIONS FOR POLICYMAKERS
While the usual caveats about drawing strong policy conclusions from cross-country analysis applies, the findings of this study do have implications for policymakers. Bank profits are high in SSA compared to other regions. This picture holds true whether profitability is measured as returns on assets, returns on equity, or net interest margins. High bank profitability can reduce financial intermediation if the high returns imply that interest rates on loans—for the same maturity—are higher than in other parts of the world. Moreover, if high returns are the consequence of market power, this would imply some degree of inefficiency in the provision of financial services. In this regard, unusually high returns should prompt
12 As a robustness check, we rerun the regressions by using the Corruption Perception Index compiled by Transparency International, as a measure of the legal environment, with no improvements in statistical significance. This is also consistent with the results in Al-Haschimi (2007), which finds this variable to be insignificant in determining net interest margins in SSA banks.

16
policymakers to introduce measures to lower risk, remove bank entry barriers if they exist as well as other obstacles to competition, and lower regulatory costs.
But bank profits are also an important source of equity. If bank profits are reinvested, this should lead to safer banks, and, consequently, high profits could promote financial stability. Our main conclusion in this study is that bank-specific and macroeconomic risk factors are the most important explanations for banks’ high returns in SSA. We do not obtain conclusive results as to whether market power influences bank returns. We do find evidence that profits are reinvested, but with a significant lag. The evidence that returns are reinvested in capital with a significant lag gives some support to a policy of imposing higher capital requirements to strengthen financial stability in SSA.
Since privately owned banks earn higher returns compared to publicly owned ones, privatization could be encouraged, but only to the extent that reinvestment of the profits can be effectively encouraged. However, and perhaps somewhat controversial, while foreign-owned banks may provide for technology transfers, and indeed may be more efficient, there is little evidence that it would necessarily improve bank profitability. This could, perhaps, be because foreign-owned banks face the same local conditions as local banks with regard to risk and the performance of the domestic economy. Public policy to encourage the presence of foreign banks may, therefore, not yield any advantage in terms of bank profitability. There is clear evidence that credit risk can be lowered through the increase of credit information sharing. This would lower net interest margins, thus boosting credit expansion and financial intermediation.
Macroeconomic policies are important. Inflation reduces credit expansion by contributing to higher net interest margins. Therefore, policies aimed at controlling inflation should be given priority in fostering financial intermediation. Since the output cycle matters for bank profits, fiscal and monetary policies that are designed to promote output stability and sustainable growth are good for financial intermediation.
This work is a first attempt to study the profitability of the banking sectors in SSA countries. Given the key role that the financial sector plays in the expansion of the private productive sector, future research should focus on country-specific studies that would provide country-level policy conclusions. Other issues that could be covered in future research include whether banks effectively intermediate savings for the provision of credit to the private sector, or whether they allocate resources and manage risks efficiently. These are important considerations for financial development in SSA.

17
Figure 1. Time Series of Sub-Saharan African Countries’ Return on Assets
Source: Bankscope
Figure 2. Average Return on Assets by Income Group (2006)
Source: Bankscope
0
0.5
1
1.5
2
2.5
3
1995 1996 1997 1998 1999 2000 2001 2002 2003 2004 2005 2006
0.0
0.5
1.0
1.5
2.0
2.5
High Income Upper-Middle-Income Lower-Middle Income Low-Income SSA
18
Figure 3. Sub-Saharan Africa Return on Assets by Country (2006)
Source: Bankscope
Figure 4. Distribution of Sub-Saharan Africa Return on Assets (2006)
Source: Bankscope
-3.00
-2.00
-1.00
0.00
1.00
2.00
3.00
4.00
5.00
6.00
7.00
8.00
BENIN
SEYCHELLES
BURUNDI
LESOTHO
CENTRAL AFRICAN REPUBLICTOGO
CAPE VERDE
CAMEROON
MAURITANIAGHANA
EQUATORIAL GUINEA, REP . O
F
TANZANIA
MAURITIUS
SENEGALMALI
NAMIBIA
LIBERIA
IVORY COAST
NIGER
SOUTH AFRICAKENYA
BOTSWANA
NIGERIA
SWAZILAND
ETHIOPIA
ANGOLA
GAMBIA
CONGO, DEMOCRATIC REP. O
FCHAD
MOZAMBIQUE
UGANDA
MADAGASCAR
SIERRA LEONE
MALAWI
ZAMBIA
GUINEA
SUDAN
ZIMBABWE
0
10
20
30
40
50
60
-15 -13 -11 -9 -7 -5 -3 -1 1 3 5 7 9 11 13 15
ROA by bank
freq
uenc
y

19
Figure 5. Time Series of Sub-Saharan Africa’s Return on Assets by Income Group
Note: Middle-income countries include Angola, Botswana, Cameroon, Cape Verde, Republic of Congo, Equatorial Guinea, Gabon, Lesotho, Mauritius, Namibia, Seychelles, and South America.
Source: Bankscope
Figure 6. Time Series of Sub-Saharan Africa’s Net Interest Margins
Source: Bankscope
0
0.5
1
1.5
2
2.5
3
1998 1999 2000 2001 2002 2003 2004 2005 2006
Low incomeMiddle income
5.2
5.4
5.6
5.8
6.0
6.2
6.4
6.6
6.8
7.0
1998 1999 2000 2001 2002 2003 2004 2005 2006
20
Figure 7. Average Net Interest Margins by Income Group (2006)
Source: Bankscope
0.0
1.0
2.0
3.0
4.0
5.0
6.0
7.0
High Income Upper-Middle-Income Lower-Middle Income Low-Income SSA

21
Table 1. Account Decomposition of Banks by Income Group
Balance Sheet of Banks by Country Group (2006) (in percent of total assets)
High Income Upper-Middle-Income Lower-Middle Income Low-Income SSAAssets Total earning assets 91.5 85.8 87.0 86.7 84.0 Loans 61.3 51.1 54.7 54.1 46.3 Other earnings 30.5 35.0 32.8 32.7 38.1 Fixed assets 1.93 3.4 3.3 1.9 3.6 Non-earning assets 6.6 10.9 9.7 11.5 12.4 Liabilities Deposits and short-term funding 81.6 63.7 80.8 82.1 78.4 Other funding 4.0 12.8 7.2 4.4 5.3 Other (non-Interest bearing) 0.4 3.0 15.4 3.0 -0.1 Loan loss reserves 0.5 … 0.0 … 1.1 Other reserves 0.7 1.0 1.2 1.0 2.0 Equity 12.9 19.6 -4.5 9.6 13.3
Profit and Loss Account of Banks by Country Group (2006)(in percent of total assets)
High Income Upper-Middle-Income Lower-Middle Income Low-Income SSA NIM (1) 3.4 5.1 3.7 2.9 5.9 Other operating income (2)_ 2.4 5.7 2.1 1.8 3.5 Overheads (3) 4.0 7.1 4.3 2.6 5.4 Loan loss provisions (4) 0.2 0.9 0.7 0.6 0.8 Other (5) 0.0 -0.7 0.7 0.0 -0.0 Before tax ROA (6) (1+2-3-4+5) 1.5 2.3 1.4 1.5 3.0 Tax (7) 0.4 0.8 0.5 0.5 0.9 After tax ROA (6-7) 1.1 1.5 0.9 1.0 2.3
Source: Bankscope

22
Table 2. Account Decomposition of Sub-Saharan African Banks
Balance Sheet of Sub-Saharan African Banks (in percent of total assets)
1998 1999 2000 2001 2002 2003 2004 2005 2006Assets Total earning assets 81.5 81.3 79.6 80.6 81.1 82.3 82.9 83.2 84.0 Loans 44.5 42.0 43.1 41.7 40.0 43.0 44.3 45.4 46.3 Other earning assets 37.7 40.2 36.9 39.6 41.7 39.9 39.3 38.3 38.1 Fixed assets 5.1 5.3 5.3 5.0 4.8 4.2 4.0 3.9 3.6 Non-earning assets 13.5 13.5 15.1 14.4 14.3 13.6 13.2 13.0 12.5 Liabilities Deposits and short-term funding 74.5 73.0 74.2 73.1 73.8 75.2 77.1 76.7 78.4 Other funding 3.0 3.5 3.8 3.5 3.6 3.02 3.7 4.9 5.3 Other (non-interest bearing)* 6.8 6.5 4.6 3.6 4.3 5.53 0.9 -1.4 -0.1 Loan loss reserves 1.0 0.7 1.4 1.3 1.0 1.1 1.3 1.2 1.1 Other reserves 1.6 1.9 3.5 4.2 3.1 1.5 3.3 4.5 2.0 Equity 13.2 14.5 12.5 14.3 14.4 13.8 13.8 14.2 13.3 Profit and Loss Account of Sub-Saharan African Banks (in percent of total assets**)
1998 1999 2000 2001 2002 2003 2004 2005 2006 NIM (1) 6.3 6.2 6.2 6.8 6.4 6.3 6.4 6.0 5.9 Other operating income (2) 5.1 4.5 4.7 4.8 4.6 4.7 4.0 3.77 3.5 Overheads (3) 6.5 6.4 6.6 7.0 6.9 6.6 6.5 6.0 5.4 Loan loss provisions (4) 1.6 1.8 1.8 1.8 1.3 1.4 1.1 1.0 0.8 Other (5) 0.2 -0.0 0.3 0.7 -0.0 -0.2 0.1 -0.3 0.0 Before Tax ROA (6) (1+2-3-4+5) 3.1 2.4 2.5 3.1 2.6 2.9 2.8 2.5 3.0 Tax (7) 1.0 0.9 0.8 1.0 0.9 0.9 1.0 0.9 0.9 After tax ROA (6-7) 2.1 1.6 1.7 2.1 1.8 2.1 1.9 1.7 2.3 *Includes errors and omissions due to grouping single institutions into the aggregate. ** Partials may not add to the total because the values reported are averages of individual banks.
Source: Bankscope

23
Table 3. Variable Definition and Notation Variable Description Notation
Dep
ende
nt
varia
ble
Profitability Profits after taxes/total assets ROA
Size Ln(total assets) Size Ln(total assets)2 Size2 Capital Equity/total assets Equity Credit risk Loans/deposits and short-term funding CrRisk Cost management Ln(Overheads) OpExp Activity mix Net interest revenues/other operating income Mix Market power Individual bank’s loans/country’s domestic credit MktPower Ownership Dummy variable equal to one for privately owned banks Private B
ank-
spec
ific
dete
rmin
ants
Dummy variable equal to one for foreign-owned banks Foreign Wealth Ln(Gdp per capita) GdpPC
Cyclical output Gdp growth rate GdpGr
Inflation CPI growth rate Inflation
Fuel price Commodity price: petroleum CF
Nonfuel commodity price Commodity price: nonfuel primary commodities, index CNF Mac
roec
onom
ic
dete
rmin
ants
Regulatory environment Ease-of-doing-business index Reg Sources: Bank-specific data are from Bankscope. Macro variables are from the IMF, International Financial Statistics (IFS) and the World Bank Group database. Commodity and fuel Prices are from the Global Data Source (GDS). The Ease-of-Doing-Business index is from the World Bank website.

24
Table 4. Descriptive Statistics
Variable Mean Std. Dev. Min MaxROA 2.35 3.00 -11.57 16.03 Equity 12.55 7.08 -17.69 44.17 CrRisk 57.40 26.80 0.00 249.48 Size 11.70 1.28 7.77 15.86 Size2 138.48 30.26 60.44 251.40 Mix 4.29 43.01 -315.35 1258.50 MktPower 0.05 0.15 -1.76 1.34 OpExp 8.67 1.24 4.79 12.22 Inflation 14.48 36.26 -8.24 365.00 GdpGr 4.32 4.02 -13.12 33.63 GdpPC 6.08 0.88 4.41 8.83 CF 63.43 27.62 26.96 119.24 CNF 88.04 14.37 75.83 123.24

25
Table 5. Estimation Results WC-Robust Coef. Std. Err. z P>|z| ROA(-1) 0.21 0.07 2.85 0.00 Equity 0.11 0.04 2.68 0.01 CrRisk 0.03 0.01 2.08 0.04 Size 5.96 2.84 2.10 0.04 Size2 -0.21 0.12 -1.69 0.09 Mix 0.00 0.00 -3.51 0.00 MktPower 0.19 0.25 0.75 0.45 OpExp 0.05 0.04 1.40 0.16 Inflation 0.02 0.01 2.25 0.03 GdpGr 0.03 0.02 1.81 0.07 GdpPC -2.17 2.82 -0.77 0.44 CF -0.03 0.01 -2.45 0.01 CNF 0.02 0.01 2.18 0.03 dum2000 0.73 0.21 3.51 0.00 dum2001 0.22 0.20 1.14 0.26 dum2002 -0.27 0.23 -1.17 0.24 dum2003 -0.32 0.22 -1.44 0.15 dum2004 -0.40 0.19 -2.06 0.04 Wald test chi2(18) = 104.25 Prob > chi2 = 0.0000 Arellano-Bond test for zero autocorrelation in first-differenced errors Order z Prob > z 1 -3.02 0.00 2 0.30 0.76 H0: no autocorrelation Sargan test of over identifying restrictions chi2(95) = 100.08 Prob > chi2 = 0.34 H0: over identifying restrictions are valid

26
Table 6. Sargan Test for Alternative Model with All Variables Strictly Exogenous
Sargan test of over identifying restrictions chi2(95) 39.126 Prob > chi2 0.062 Ho: over identifying restrictions are valid
Table 7. Granger-Causality Test Between Return on Asset and Capital Without Control Variables
ROA Equity WC-Robust WC-Robust Coef. Std. Err. z P>|z| Coef. Std. Err. z P>|z| ROA(-1) 0.36 0.13 2.76 0.01 0.03 0.10 0.32 0.75 ROA(-2) 0.07 0.09 0.72 0.47 -0.14 0.11 -1.27 0.21 ROA(-3) 0.09 0.05 1.63 0.10 0.17 0.07 2.26 0.02 Equity(-1) -0.17 0.06 -2.79 0.01 0.31 0.25 1.24 0.22 Equity(-2) -0.01 0.03 -0.36 0.72 0.01 0.05 0.14 0.89 Equity(-3) -0.03 0.02 -1.50 0.13 -0.03 0.05 -0.63 0.53 cons 3.61 0.94 3.86 0.00 8.28 2.96 2.80 0.01 Wald test chi2(6) = 16.53 chi2(6) = 12.34 Prob > chi2 = 0.0112 Prob > chi2 = 0.0549 Arellano-Bond test for zero autocorrelation in first-differenced errors Order z Prob > z Order z Prob > z 1 -1.97 0.05 1 -1.76 0.08 2 1.03 0.30 2 0.00 1.00 H0: no autocorrelation

27
Table 8. Granger-Causality Test Between Return on Asset and Capital with Control Variables
ROA Equity WC-Robust WC-Robust Coef. Std. Err. z P>|z| Coef. Std. Err. z P>|z|
ROA(-1) 0.30 0.09 3.19 0.00 -0.02 0.08 -0.28 0.78 ROA(-2) 0.02 0.07 0.26 0.80 -0.20 0.10 -1.98 0.05 ROA(-3) 0.03 0.04 0.79 0.43 0.15 0.07 2.12 0.03 Equity(-1) -0.17 0.05 -3.29 0.00 0.41 0.11 3.61 0.00 Equity(-2) -0.01 0.03 -0.43 0.66 0.03 0.05 0.57 0.57 Equity(-3) -0.03 0.02 -1.47 0.14 -0.05 0.05 -1.05 0.29 CrRisk 0.02 0.01 1.98 0.05 0.06 0.02 3.96 0.00 Size -2.50 2.31 -1.08 0.28 -24.50 6.98 -3.51 0.00 Size2 0.15 0.09 1.54 0.12 0.96 0.28 3.43 0.00 Mix 0.00 0.00 0.54 0.59 0.00 0.01 0.26 0.79 Conc 0.58 0.36 1.60 0.11 -0.22 0.29 -0.76 0.45 OpExp -0.05 0.05 -0.84 0.40 0.05 0.10 0.54 0.59 Inflation 0.02 0.01 2.10 0.04 0.00 0.01 0.16 0.87 GdpGr 0.06 0.02 2.65 0.01 -0.01 0.03 -0.48 0.63 GdpPC -4.20 5.32 -0.79 0.43 -5.50 3.98 -1.38 0.17 CF -0.02 0.02 -1.57 0.12 0.02 0.01 1.74 0.08 CNF 0.02 0.01 1.94 0.05 -0.02 0.02 -0.84 0.40 dum2001 0.46 0.22 2.09 0.04 -0.53 0.35 -1.54 0.12 dum2003 -0.18 0.23 -0.78 0.44 -0.15 0.23 -0.66 0.51 dum2004 -0.34 0.19 -1.78 0.08 0.14 0.32 0.44 0.66 Wald test chi2(20) = 65.92 chi2(20) = 81.26 Prob > chi2 = 0.0000 Prob > chi2 = 0.0000 Arellano-Bond test for zero autocorrelation in first-differenced errors Order z Prob > z Order z Prob > z 1 -2.03 0.04 1 -3.44 0.00 2 1.05 0.30 2 0.14 0.89 H0: no autocorrelation Sargan test of over identifying restrictions chi2(22) 20.99 chi2(22) 28.18 Prob > chi2 0.52 Prob > chi2 0.17 H0: over identifying restrictions are valid
28
Table 9. Estimation Results Using Random Effects
Random Effect Regression Robust Coef. Std. Err. z P>|z| Public -1.77 0.69 -2.58 0.01 Foreign 0.12 0.28 0.43 0.67 Reg 0.00 0.01 -0.04 0.97 Equity 0.11 0.02 6.22 0.00 CrRisk 0.00 0.00 -1.04 0.30 Size 4.20 1.02 4.11 0.00 Size2 -0.14 0.04 -3.49 0.00 Mix 0.00 0.00 -0.20 0.84 MktPower 0.19 0.21 0.91 0.36 OpExp 0.07 0.05 1.51 0.13 Inflation 0.00 0.00 0.15 0.88 GdpGr 0.02 0.02 0.92 0.36 GdpPC -1.17 1.54 -0.76 0.45 CF 0.00 0.01 -0.42 0.67 CNF -0.01 0.01 -0.61 0.54 cons -19.53 14.12 -1.38 0.17 Wald test chi2(60) = 407.68 Prob > chi2 = 0.0000 R-sq = 0.31 Breusch and Pagan Lagrangian multiplier test chi2(1) = 129.39 Prob > chi2 = 0.0000 H0:Var(v_i) = 0 Hausman specification test chi2(17) = 73.76 Prob>chi2 = 0.0000 Ho: difference in coefficients not systematic

29
References Arellano, M. and S.R. Bond (1991). “Some Tests of Specification for Panel Data. Monte arlo
Evidence and an Application to Employment Equations,” Review of Economic Studies 58, 277-297.
Al-Hashimi, A. (2007). “Determinants of Bank Spreads in Sub-Saharan Africa,” draft. Allen, L. and T.G. Bali (2004). “Cyclicality in Catastrophic and Operational Risk
Measurements,” Working Paper. Allen, L. and A. Saunders (2004). “Incorporating Systemic Influences Into Risk
Measurements: A Survey of the Literature,” Journal of Financial Services Research 26, 161-191.
Angbazo, L. (1997). “Commercial Banks, Net Interest Margins, Default Risk, Interest Rate
Risk and Off-Balance Sheet Banking,” Journal of banking and Finance 21, 55-87. Athanasoglou P., Delis M. and C. Staikouras (2006). “Determinants of Banking Profitability
in the South Eastern European Region,” Bank of Greece Working Paper 06/47. Beck, T. and H. Hesse (2006). “Foreign Bank Entry, Market Structure and Bank Efficiency
in Uganda,” World Bank Policy Research Working Paper 4027, October. Berger, A. (1995a). “The Profit-Structure Relationship in Banking: Test of Market-Power
and Efficient-Structure Hypotheses,” Journal of Money, Credit and Banking 27, 404-431. Berger, A. (1995b). “The Relationship Between Capital and Earnings in Banking,” Journal
of Money, Credit and Banking 27, 432-456. Berger, A., Hanweck, G. and D. Humphrey (1987). “Competitive Viability in Banking:
Scale, Scope and Product Mix Economies,” Journal of Monetary Economics 20, 501-520. Bikker, J. and H. Hu (2002). “Cyclical Patterns in Profits, Provisioning and Lending of
Banks and Procyclicality of the New Basel Capital Requirements,” BNL Quarterly Review 221, 143-175.
Bourke, P. (1989). “Concentration and Other Determinants of Bank Profitability in Europe,
North America and Australia,” Journal of Banking and Finance 13, 65-79. Boyd, J.H. and D.E. Runkle (1993). “Size and Performance of Banking Firms. Testing the
Predictions of Theory,” Journal of Monetary Economics 31, 47-67. Brock, P. and L. Rojas Suarez (2000). “Understanding the Behavior of Bank Spreads in Latin
America,” Journal of development Economics 63, 113-134.

30
Clark, J. (1988), “Economies of Scale and Scope at Depository Financial Institutions: A Review of the Literature,” Federal Reserve Bank of Kansas City Economic Review 73, 16-33.
Chirwa, E. and M. Mlachila (2004). “Financial Reforms and Interest Rate Spreads in the
Commercial Banking System in Malawi,” IMF Staff Papers 51(1), 96-122. Demirgüç-Kunt, A. and A. Huizinga (1998). “Determinants of Commercial Bank Interest
Margins and Profitability: Some International Evidence,” World Bank Economic Review 13, 379-408.
Gelos, G. (2006). “Banking Spreads in Latin America,” IMF Working Paper 06/44. Gibson, H.D. (2005). “Developments in the Profitability of Greek Banks,” Bank of Greece
Economic Bulletin 24, 7-28. Goddard, J., Molyneux, P. and J.O.S. Wilson (2004). “Dynamics of Growth and Profitability
in Banking,” Journal of Money, Credit and Banking 36, 1069-1090. Heggestad A. (1977). “Market Structure, Risk and Profitability in Commercial Banking,”
The Journal of Finance 32, 1207-1216. Humphrey, D. (1990). “Why Do Estimates of Bank Scale Economies Differ?” Federal
Reserve Bank of Richmond Economic Review 76, 38-50. Moulyneux, P. and J. Thornton (1992). “Determinants of European Bank Profitability: A
Note,” Journal of Banking and Finance 16, 1173-1178. Saunders, A. and L. Schumacher (2000). “The Determinants of Bank Interest Rate Margins:
An International Study,” Journal of International Money and Finance 19, 813-832.